the secret to trading the perfect pair two...
TRANSCRIPT

SMAR T OPTIONS FOR TODAY’S INVESTOR
SUMMER 2009
14/ THE SECRET TO TRADING THE PERFECT PAIR
18/ TWO STRATEGIES FOR SLEEPY MARKETS24/ CURRENCY OPTIONS:
A FRESH ALTERNATIVE TO STOCKS> >
BERNIE SCHAEFFER’S
SIR02_cover_062909.layout.pdf:pages.layout 6/30/09 2:45 PM Page 1

Try MetaStock® or MetaStock Pro®
including data FREE for 30 Days*
800-587-8023(promo code P-SENT) or visit www.metastock.com/p-sent
At MetaStock, we know you can do
better than “just survive.”
Times are tough. Period. All the more reason to have a cool head, a good investment plan, and the right tools to take advantage of this volatile market. That’s where MetaStock Software comes in. We have hundreds of built-in systems, endless customization possibilities, back testing for multiple securities on multiple systems, powerful scanning, lightning fast real-time data and news, and more. With MetaStock, you can do better than survive in this volatile market, you can thrive!
science for traders
*Exchange fees not included. This is neither a solicitation to buy or sell any type of fi nancial instruments, nor intended as investment recommendations. All investment trading involves multiple substantial risks of monetary loss. Don’t trade with money you can’t afford to lose. Trading is not suitable for everyone. Past performance, whether indicated by actual or hypothetical results or testimonials are no guarantee of future performance or success. NO REPRESENTATION IS BEING MADE THAT ANY ACCOUNT WILL OR IS LIKELY TO ACHIEVE PROFITS OR LOSSES SIMILAR TO THOSE SHOWN. IN FACT, THERE ARE FREQUENTLY SHARP DIFFERENCES BETWEEN HYPOTHETICAL PERFORMANCE RESULTS OR TESTIMONIALS AND THE ACTUAL RESULTS SUBSEQUENTLY ACHIEVED BY ANY PARTICULAR TRADING PROGRAM. Furthermore, all internal and external computer and software systems are not fail-safe. Have contingency plans in place for such occasions. Equis International and Thomson Reuters assume no responsibility for errors, inaccuracies, or omissions in these materials, nor shall it be liable for any special, indirect, incidental, or consequential damages, including without limitation losses, lost revenue, or lost profi ts, that may result from reliance upon the information presented.
MetaStockWinner 1993 - 2004
Standalone Analytical Software
$200-$499
MetaStockWinner 2005 - 2009
Standalone Analytical Software
$500 to $1000
MetaStock ProWinner 2006 - 2009
Standalone Analytical Software
$1000 and More
Winner 17 years running
SENTiMENT_contents_062909.layout:pages.layout 6/30/09 2:34 PM Page 2

14Hunting for HedgesWhen you’re bullish on a stock but the market seemsto be running on fumes, perhaps it’s time to consideryour options—pairs trading with options, that is.And the best part? What you can make when you’revery wrong. /
18Fortified with Iron Who says you can’t make money when the marketsare standing still? With iron spreads, not only canyou beat a market’s moody blues and pack a punch,but you can put a directional spin on them as well. /
24Currency Options: Trading anOld Friend in a New WorldConsidering today’s global economic and politicallandscape, volatility in the foreign exchange markets can spell opportunity—especially for optiontraders. And now equity option traders have good reason to venture into the world offorex—without leaving their broker.
6The Sentiment ReportEarly 2009 may havebeen weak for the bulls,but is there a silver lining as investors startfeeling the panic? /
10Making News, Etc.A serving of highs, lows,and relevant news foroption traders. /
13Ask BernieGot a question aboutoptions and contrarianthought? Ask the manwith the answers. /
29Back to BasicsWhen traders want tomeasure levels of fearand greed in the market,they turn to the VIX.For stocks, they look toour SVI./
30Idea LabWhen searching forclues to market rever-sals, our research teamtakes a short- and long-term approach. See howan early rise in put buy-ing gave the markets areason to be giddy again. /
Photographed by Fredrik Brodén /
4At the OpenA few poignant wordsfrom our founder, BernieSchaeffer./
32.COMWhere to go and whatto see right now at SchaeffersResearch.com /
0 (34)Page ZeroPRO PEARLS: Goldaficionado Thom Calan-dra reveals his favoritesentiment indicators fortrading in and out of theprecious metal. /
SMAR T OPTIONS FOR TODAY’S INVESTOR
SUMMER 2009
14/ THE SECRET TO TRADING THE PERFECT PAIR
18/ TWO STRATEGIES FOR SLEEPY MARKETS24/ CURRENCY OPTIONS:
A FRESH ALTERNATIVE TO STOCKS> >
BERNIE SCHAEFFER’S
FEATURES COLUMNS
COVER
REGULARS
PUBLISHERT3 Publishing LLCEMAIL: [email protected]
ADVERTISING CONTACTSadia Ashraf 513.589.3800 [email protected]
Schaeffer’s Investment ResearchMAIN OFFICE: 513.589.3800MAIN FAX: 513.589.3810CUSTOMER SERVICE:800.327.8833 prompt #2E-MAIL: [email protected]: 800.448.2080 prompt #4
5151 Pfeiffer Road, Suite 250Cincinnati, OH 45242www.SchaeffersResearch.com
SENTIMENT is published quarterly.
If you prefer not to receive this publication, please call 800.327.8833.
To view SENTIMENT online, go to schaeffersresearch.com/sentiment
Please send your comments and questionsto the editor at [email protected]
BERNIE SCHAEFFER’S
SENTIMENT
EDITORIAL DIRECTORKevin Lund
CONTRIBUTING WRITERSTodd Salamone, Bob Kraft, NickPerry, Rocky White
ART DIRECTORTom Brown, TBA+D
ASSISTANT EDITORJennifer Agee
DESIGNERJennifer Roberts
CHIEF PHOTOGRAPHERFredrik Brodén
CONTRIBUTING ILLUSTRATORJoe Morse
www.schaeffersresearch.com ISSUE No.2 Contents 3
SENTiMENT_contents_062909.layout:pages.layout 6/30/09 2:34 PM Page 3
Phot
ogra
ph b
y FR
ED
RIK
BR
OD
ÉN
; Illu
stra
tions
by
JOE
MO
RSE
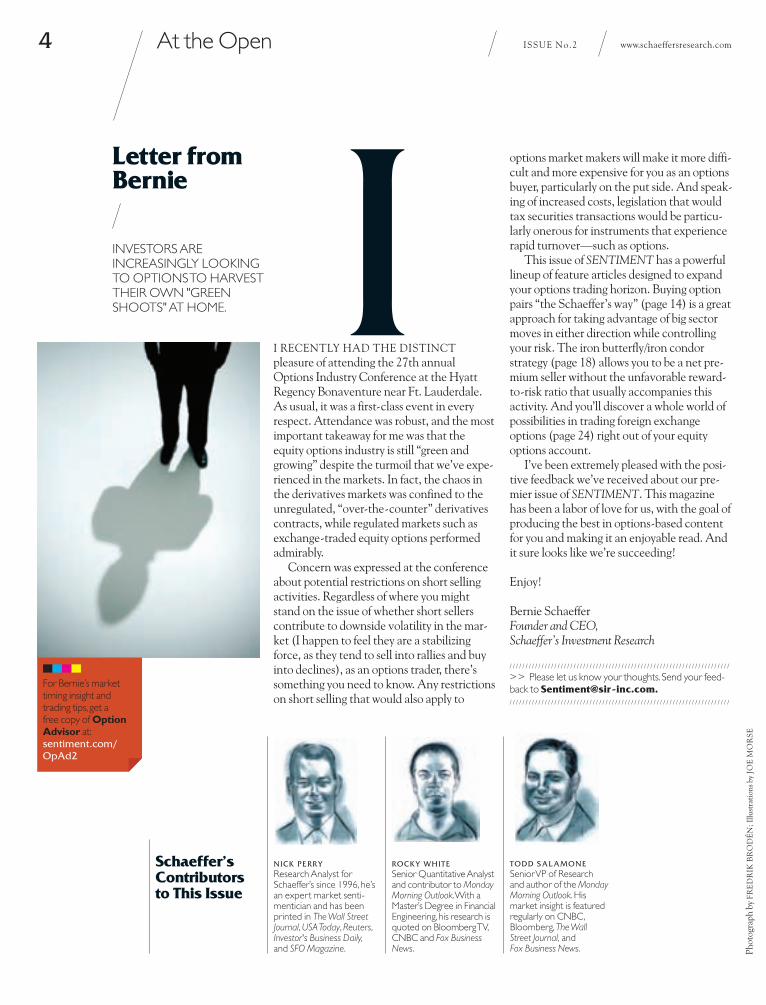
I RECENTLY HAD THE DISTINCT pleasure of attending the 27th annualOptions Industry Conference at the HyattRegency Bonaventure near Ft. Lauderdale.As usual, it was a first-class event in everyrespect. Attendance was robust, and the mostimportant takeaway for me was that theequity options industry is still “green andgrowing” despite the turmoil that we’ve expe-rienced in the markets. In fact, the chaos inthe derivatives markets was confined to theunregulated, “over-the-counter” derivativescontracts, while regulated markets such asexchange-traded equity options performedadmirably.
Concern was expressed at the conferenceabout potential restrictions on short sellingactivities. Regardless of where you mightstand on the issue of whether short sellerscontribute to downside volatility in the mar-ket (I happen to feel they are a stabilizingforce, as they tend to sell into rallies and buyinto declines), as an options trader, there’ssomething you need to know. Any restrictionson short selling that would also apply to
options market makers will make it more diffi-cult and more expensive for you as an optionsbuyer, particularly on the put side. And speak-ing of increased costs, legislation that wouldtax securities transactions would be particu-larly onerous for instruments that experiencerapid turnover—such as options.
This issue of SENTIMENT has a powerfullineup of feature articles designed to expandyour options trading horizon. Buying optionpairs “the Schaeffer’s way” (page 14) is a greatapproach for taking advantage of big sectormoves in either direction while controllingyour risk. The iron butterfly/iron condorstrategy (page 18) allows you to be a net pre-mium seller without the unfavorable reward-to-risk ratio that usually accompanies thisactivity. And you’ll discover a whole world ofpossibilities in trading foreign exchangeoptions (page 24) right out of your equityoptions account.
I’ve been extremely pleased with the posi-tive feedback we’ve received about our pre-mier issue of SENTIMENT. This magazinehas been a labor of love for us, with the goal ofproducing the best in options-based contentfor you and making it an enjoyable read. Andit sure looks like we’re succeeding!
Enjoy!
Bernie SchaefferFounder and CEO, Schaeffer’s Investment Research
/ / / / / / / / / / / / / / / / / / / / / / / / / / / / / / / / / / / / / / / / / / / / / / / / / / / / / / / / / / / / / / / / / / / / /
>> Please let us know your thoughts. Send your feed-back to [email protected]./ / / / / / / / / / / / / / / / / / / / / / / / / / / / / / / / / / / / / / / / / / / / / / / / / / / / / / / / / / / / / / / / / / / / /
Letter fromBernie
INVESTORS ARE INCREASINGLY LOOKINGTO OPTIONS TO HARVESTTHEIR OWN "GREENSHOOTS" AT HOME.
NICK PERRYResearch Analyst for Schaeffer’s since 1996, he’san expert market senti-mentician and has beenprinted in The Wall StreetJournal, USA Today, Reuters,Investor's Business Daily,and SFO Magazine.
ROCKY WHITE Senior Quantitative Analystand contributor to MondayMorning Outlook. With aMaster’s Degree in FinancialEngineering, his research isquoted on Bloomberg TV,CNBC and Fox BusinessNews.
Schaeffer’sContributorsto This Issue
TODD SALAMONESenior VP of Research and author of the MondayMorning Outlook. His market insight is featuredregularly on CNBC,Bloomberg, The Wall Street Journal, and Fox Business News.
At the Open4 www.schaeffersresearch.comISSUE No.2
IFor Bernie’s markettiming insight and trading tips, get a free copy of OptionAdvisor at: sentiment.com/OpAd2
SENTiMENT_ed.letter_062909.layout:pages.layout 6/30/09 2:35 PM Page 4

gp
y
SENTiMENT_ed.letter_062909.layout:pages.layout 6/30/09 2:35 PM Page 5

The Sentiment Report6 www.schaeffersresearch.comISSUE No.2
INVESTORS FLIPPED THE LIGHT SWITCH“on” and stocks got “turned off”; then theyflipped the light switch “off” and the marketgot “turned on.” The light switch representsthe mood of investors, who have proven to bevery wrong at key turning points this year. Inthe inaugural issue of SENTIMENT lastspring, our “Sentiment Report” discussed thewidespread hope among investors as wemoved into 2009. These high expectationsled to a series of disappointments, which cul-minated in a first-quarter decline in the S&P500 Index (SPX). But market participantsthen became pessimistic and flipped theirmarket outlook “off” ahead of the secondquarter– just in time for a big rally by mid-June. Investors had braced for the worst, butprofits came in better than expected; majoradditional stimulus plans were announced;and reports seemed to indicate the economywas no longer spiraling out of control.
Lights OutIt appears the second-quarter “fear unwind”that supported stocks was driven primarily byprofessionals, who had become very riskaverse and were either short the market orunder invested on the long side. Financialstocks won a respite after the shorts backedoff, creating a much–needed tailwind for thisgroup. Risk-averse hedge funds moved back
into risk-taking mode, bidding technologyand commodity stocks higher—favoritehunting grounds for this group.
With commodity, financial, and technol-ogy stocks leading the way, the technicalbackdrop of the SPX vastly improved (seeFigure 1, next page). The index jumpedabove its 80-day moving average in earlyApril, a trend line that had acted as resist-ance since June 2008. At the end of April, along-term buy signal was generated when theSPX’s 14-month Relative Strength Index(RSI)—an oscillator that measures over-
bought and oversold condi-tions—moved back above 30,a confirmation that stocks hadmoved out of their longer-term oversold condition. Andin early June, the SPXachieved another milestonewhen it crossed above its 200-day moving average for thefirst time since December2007.
Lights On?So, was the move above thewidely publicized 200-daymoving average a breakout orfakeout? We will find outsoon enough, but our bestadvice is to be positioned foreither scenario. Why?
TECHNICAL OUTLOOKFirst, as the SPX approachedits 200-day moving average, itwas apparent that a lot of mar-ket participants had this trend-line on their radar. A questionwe asked internally was, “Willthe move above this level pull
in the last of the buyers?” As it turns out, themarket has had difficulty making a firm breakabove its January 2009 highs, located justabove the 200-day moving average. Shouldthe SPX comfortably take out these 2009highs, the next potential resistance area couldbe 1,000 on the SPX, marking a 50% rally offthe March lows at 666. Should the 200-daybreakout prove to be a fakeout, a pullback tothe site of the 2002–2003 and November2008 troughs in the 750–800 area is possible.
Moreover, some of the sentiment-basedindicators we use to quantify the mood of
I Leave the Lights On
AS OUR SENTIMENT INDICATORS REACH CRITICAL LEVELS, THE MARKETS TEETER ONWHAT COULD BE ANOTHER BIG MOVE. >> Todd Salamone / PHOTOGRAPH BY FREDRIK BRODÉN
SENTiMENT_sentimentreport_062909.layout:pages.layout 6/30/09 2:39 PM Page 6
SENTiMENT_sentimentreport_062909.layout:pages.layout 6/30/09 2:39 PM Page 7
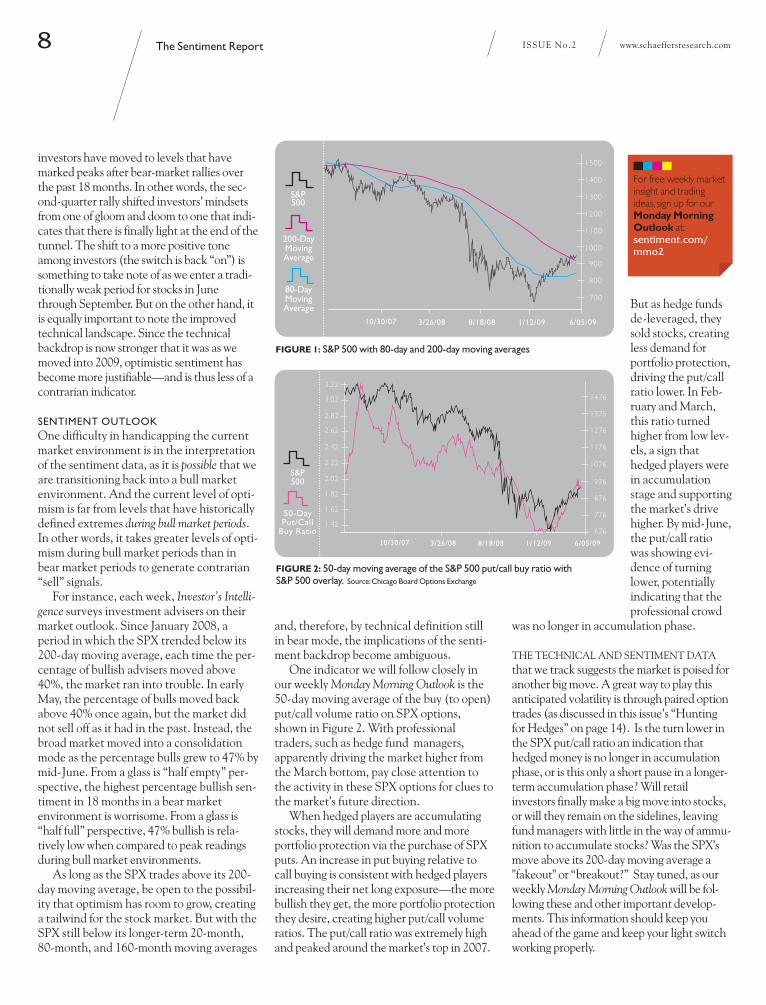
and, therefore, by technical definition stillin bear mode, the implications of the senti-ment backdrop become ambiguous.
One indicator we will follow closely inour weekly Monday Morning Outlook is the50-day moving average of the buy (to open)put/call volume ratio on SPX options,shown in Figure 2. With professionaltraders, such as hedge fund managers,apparently driving the market higher fromthe March bottom, pay close attention tothe activity in these SPX options for clues tothe market’s future direction.
When hedged players are accumulatingstocks, they will demand more and moreportfolio protection via the purchase of SPXputs. An increase in put buying relative tocall buying is consistent with hedged playersincreasing their net long exposure—the morebullish they get, the more portfolio protectionthey desire, creating higher put/call volumeratios. The put/call ratio was extremely highand peaked around the market’s top in 2007.
But as hedge fundsde-leveraged, theysold stocks, creatingless demand forportfolio protection,driving the put/callratio lower. In Feb-ruary and March,this ratio turnedhigher from low lev-els, a sign thathedged players werein accumulationstage and supportingthe market’s drivehigher. By mid-June,the put/call ratiowas showing evi-dence of turninglower, potentiallyindicating that theprofessional crowd
was no longer in accumulation phase.
THE TECHNICAL AND SENTIMENT DATAthat we track suggests the market is poised foranother big move. A great way to play thisanticipated volatility is through paired optiontrades (as discussed in this issue’s “Huntingfor Hedges” on page 14). Is the turn lower inthe SPX put/call ratio an indication thathedged money is no longer in accumulationphase, or is this only a short pause in a longer-term accumulation phase? Will retailinvestors finally make a big move into stocks,or will they remain on the sidelines, leavingfund managers with little in the way of ammu-nition to accumulate stocks? Was the SPX'smove above its 200-day moving average a"fakeout" or “breakout?” Stay tuned, as ourweekly Monday Morning Outlook will be fol-lowing these and other important develop-ments. This information should keep youahead of the game and keep your light switchworking properly.
investors have moved to levels that havemarked peaks after bear-market rallies overthe past 18 months. In other words, the sec-ond-quarter rally shifted investors’ mindsetsfrom one of gloom and doom to one that indi-cates that there is finally light at the end of thetunnel. The shift to a more positive toneamong investors (the switch is back “on”) issomething to take note of as we enter a tradi-tionally weak period for stocks in Junethrough September. But on the other hand, itis equally important to note the improvedtechnical landscape. Since the technicalbackdrop is now stronger that it was as wemoved into 2009, optimistic sentiment hasbecome more justifiable—and is thus less of acontrarian indicator.
SENTIMENT OUTLOOKOne difficulty in handicapping the currentmarket environment is in the interpretationof the sentiment data, as it is possible that weare transitioning back into a bull marketenvironment. And the current level of opti-mism is far from levels that have historicallydefined extremes during bull market periods.In other words, it takes greater levels of opti-mism during bull market periods than inbear market periods to generate contrarian“sell” signals.
For instance, each week, Investor’s Intelli-gence surveys investment advisers on theirmarket outlook. Since January 2008, aperiod in which the SPX trended below its200-day moving average, each time the per-centage of bullish advisers moved above40%, the market ran into trouble. In earlyMay, the percentage of bulls moved backabove 40% once again, but the market didnot sell off as it had in the past. Instead, thebroad market moved into a consolidationmode as the percentage bulls grew to 47% bymid-June. From a glass is “half empty” per-spective, the highest percentage bullish sen-timent in 18 months in a bear marketenvironment is worrisome. From a glass is“half full” perspective, 47% bullish is rela-tively low when compared to peak readingsduring bull market environments.
As long as the SPX trades above its 200-day moving average, be open to the possibil-ity that optimism has room to grow, creatinga tailwind for the stock market. But with theSPX still below its longer-term 20-month,80-month, and 160-month moving averages
The Sentiment Report8 www.schaeffersresearch.comISSUE No.2
For free weekly marketinsight and tradingideas, sign up for ourMonday Morning Outlook at: sentiment.com/ mmo2
FIGURE 1: S&P 500 with 80-day and 200-day moving averages
200-DayMoving Average
80-DayMoving Average
10/30/07 3/26/08 8/18/08 1/12/09 6/05/09
1500
1400
1300
1200
1100
1000
900
800
700
S&P500
S&P500
50-DayPut/Call
Buy Ratio10/30/07 3/26/08
1476
1375
1276
1176
1076
976
876
776
676
8/18/08 1/12/09 6/05/09
3.22
3.02
2.82
2.62
2.42
2.22
2.02
1.82
1.62
1.42
FIGURE 2: 50-day moving average of the S&P 500 put/call buy ratio with S&P 500 overlay. Source: Chicago Board Options Exchange
SENTiMENT_sentimentreport_062909.layout:pages.layout 6/30/09 2:39 PM Page 8

SENTiMENT_sentimentreport_062909.layout:pages.layout 6/30/09 2:39 PM Page 9
MakingNews, Etc.1 0 www.schaeffersresearch.comISSUE No.2
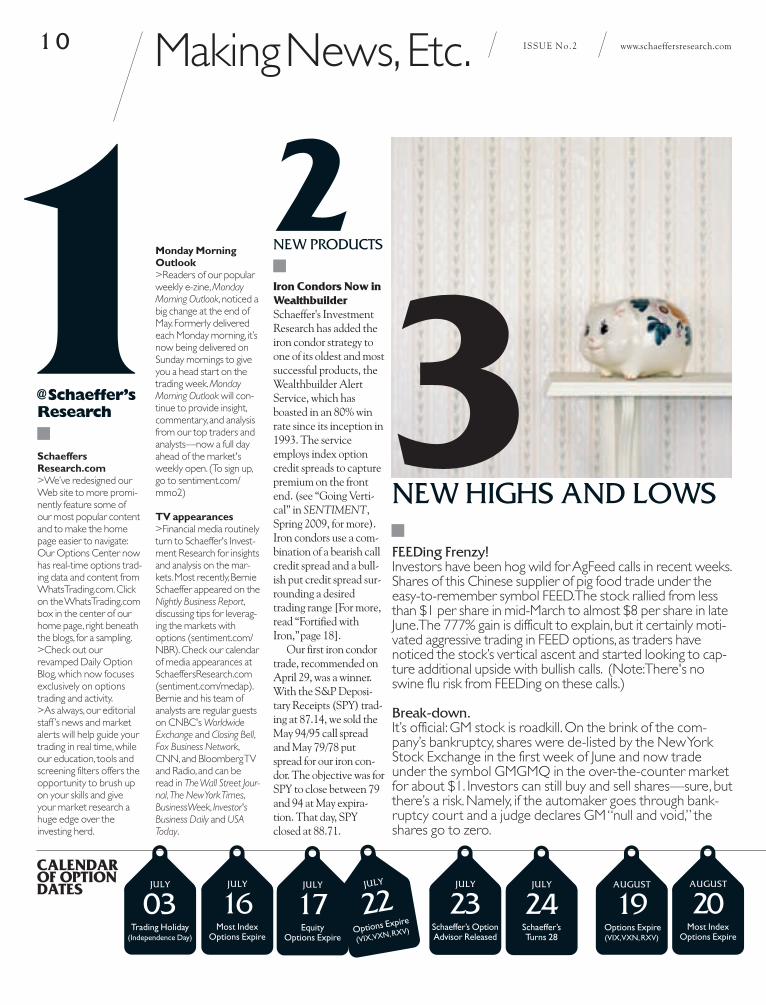
FEEDing Frenzy!Investors have been hog wild for AgFeed calls in recent weeks.Shares of this Chinese supplier of pig food trade under theeasy-to-remember symbol FEED. The stock rallied from lessthan $1 per share in mid-March to almost $8 per share in lateJune. The 777% gain is difficult to explain, but it certainly moti-vated aggressive trading in FEED options, as traders havenoticed the stock’s vertical ascent and started looking to cap-ture additional upside with bullish calls. (Note: There's noswine flu risk from FEEDing on these calls.)
Break-down.It’s official: GM stock is roadkill. On the brink of the com-pany’s bankruptcy, shares were de-listed by the New YorkStock Exchange in the first week of June and now tradeunder the symbol GMGMQ in the over-the-counter marketfor about $1. Investors can still buy and sell shares—sure, butthere’s a risk. Namely, if the automaker goes through bank-ruptcy court and a judge declares GM “null and void,” theshares go to zero.
CALENDAROF OPTIONDATES
1@Schaeffer’sResearch
NEW HIGHS AND LOWS
Monday MorningOutlook >Readers of our popularweekly e-zine, MondayMorning Outlook, noticed abig change at the end ofMay. Formerly deliveredeach Monday morning, it’snow being delivered onSunday mornings to giveyou a head start on thetrading week. MondayMorning Outlook will con-tinue to provide insight,commentary, and analysisfrom our top traders andanalysts—now a full dayahead of the market'sweekly open. (To sign up,go to sentiment.com/mmo2)
TV appearances >Financial media routinelyturn to Schaeffer's Invest-ment Research for insightsand analysis on the mar-kets. Most recently, BernieSchaeffer appeared on theNightly Business Report,discussing tips for leverag-ing the markets withoptions (sentiment.com/NBR). Check our calendarof media appearances atSchaeffersResearch.com(sentiment.com/medap).Bernie and his team ofanalysts are regular guestson CNBC's WorldwideExchange and Closing Bell,Fox Business Network,CNN, and Bloomberg TVand Radio, and can beread in The Wall Street Jour-nal, The New York Times,BusinessWeek, Investor'sBusiness Daily and USAToday.
SchaeffersResearch.com>We’ve redesigned ourWeb site to more promi-nently feature some ofour most popular contentand to make the homepage easier to navigate:Our Options Center nowhas real-time options trad-ing data and content fromWhatsTrading.com. Clickon the WhatsTrading.combox in the center of ourhome page, right beneaththe blogs, for a sampling. >Check out ourrevamped Daily OptionBlog, which now focusesexclusively on optionstrading and activity. >As always, our editorialstaff ’s news and marketalerts will help guide yourtrading in real time, whileour education, tools andscreening filters offers theopportunity to brush upon your skills and giveyour market research ahuge edge over theinvesting herd.
JULY
17Equity
Options Expire
AUGUST
20Most Index
Options Expire
AUGUST
19Options Expire(VIX,VXN, RXV)
JULY
03Trading Holiday
(Independence Day)
JULY
24Schaeffer’s Turns 28
JULY
23Schaeffer’s OptionAdvisor Released
JULY
16Most Index
Options Expire
Iron Condors Now inWealthbuilderSchaeffer's InvestmentResearch has added theiron condor strategy toone of its oldest and mostsuccessful products, theWealthbuilder AlertService, which hasboasted in an 80% winrate since its inception in1993. The serviceemploys index optioncredit spreads to capturepremium on the frontend. (see “Going Verti-cal” in SENTIMENT,Spring 2009, for more).Iron condors use a com-bination of a bearish callcredit spread and a bull-ish put credit spread sur-rounding a desiredtrading range [For more,read “Fortified withIron,”page 18].
Our first iron condortrade, recommended onApril 29, was a winner.With the S&P Deposi-tary Receipts (SPY) trad-ing at 87.14, we sold theMay 94/95 call spreadand May 79/78 putspread for our iron con-dor. The objective was forSPY to close between 79and 94 at May expira-tion. That day, SPYclosed at 88.71.
JULY
22Options Expire
(VIX,VXN, RXV)
32NEW PRODUCTS
SENTiMENT_makingnews_062909.layout:pages.layout 6/30/09 2:58 PM Page 10

www.schaeffersresearch.com ISSUE No.2 Making News, Etc. 11
Short This. There was a time when short selling wasconsidered “Un-American”—begging the question,how can you bet against America’s best companies?Not any more. Thanks to the development of lever-aged exchange-traded funds (ETFs), investors are bet-ting against the market more than ever.
Not only have fund companies like ProShares andDirexion created a number of different “short” ETFs,but going one step further, they’ve juiced them up intoleveraged funds designed to move two and even threetimes as fast as the market.
An example is Direxion’s Daily Financial Bear 3XFund, which trades under the ticker symbol FAZ. TheETF gained popularity in late 2007 and early 2008because FAZ is designed to move, not just opposite tothe financial sector (the Russell 1000 Financial Serv-ices Index), but three times (300%) the inverse.Therefore, if the financials falter, as they did in 2007and early 2008, FAZ moves up fast! If that’s still notenough leverage, traders can also buy FAZ calls,because options are listed on this leveraged fund.Buyer beware, however: It’s best not to leave positionsin leveraged ETF’s open beyond a few days, becausedue to the mathematics of how such funds react todaily market movement they can seriously under per-form their benchmarks beyond very short time frames.
Trader Twits. Are you tweeting youroptions trades? Manytraders are. In fact, notonly are optionstraders connecting onTwitter.com, optionsexchanges like theCBOE, brokeragefirms, options advisors,and even optionscolumnists like BillLuby (@VIXand-More) and Barron’sSteve Sears(@smsearsBarrons)are tweeting as well.By the way, check ourtweets— @Schaeffers.
Best May Ever.The Chicago BoardOptions Exchange[CBOE] and Interna-tional SecuritiesExchange [ISE]remain monsters inthe options market,and business is good.In fact, according to aJune 1 press release bythe CBOE, dailyturnover on theexchange averaged 5million contracts, up22% from a year agoand the most activemonth of May ever.The ISE reported aneven larger percentagegain in May—up23.7% from a year ago.
Ready to BuySome Fear?The iPath S&P 500VIX Short-TermFutures ETN tradesunder the ticker sym-bol VXX and offers away for investors toplay the widelywatched CBOE Volatil-ity Index (VIX). Cre-ated by Barclay’s Bank,this debt security isdesigned to track VIXshort-term futures.Since VIX measuresthe expected volatilityof the S&P 500 (pricedin S&P 500 indexoptions), the volatilityindex tends to movehigher in times of panicand mayhem. For thatreason, VIX is oftencalled the “fear gauge,”and VXX rallies duringtimes of uncertainty.
4 5MARKETTRIVIA
Dissecting the Dow.Out with the old, inwith the new, as theysay. GM and Citi (C)were both ousted fromthe Dow Jones Indus-trial Average on June 1and replaced by CiscoSystems (CSCO) andTraveler’s (TRV). Ofthe 30 stocks in theDow, 3 are now NAS-DAQ-listed stocks(Microsoft and Intel arethe others). Need a littlemore Dow trivia?1) Only one Dow stock,General Electric (GE),is an original member ofthe Dow Jones Indus-trial Average, which wascreated in 1896 byCharles Dow.2) The Dow JonesIndustrial Average isnot the oldest stockmarket average. Thathonor goes to the DowJones TransportationAverage, which CharlesDow created as the DowJones Railroad Averagein 1884—12 yearsbefore the more widelywatched Dow JonesIndustrial Average.
//////////////////////////////////////////////////////For Bernie Schaeffer’s bend on therecent reshuffling of the Dow 30,go to www.sentiment.com/Dow
Option News
SEPTEMBER
17Most Index
Options Expire
SEPTEMBER
18Equity
Options ExpireAUGUST27Schaeffer’s Option
Advisor Released
SEPTEMBER
24Schaeffer’s OptionAdvisor Released
OCTOBER
22Schaeffer’s OptionAdvisor Released
SEPTEMBER
07Trading Holiday
(Labor Day)
SEPTEMBER
16Options Expire
(VIX,VXN, RXV)
SEPTEMBER
30Quarterly Options Expire
AUGUST
21Equity
Options Expire
SENTiMENT_makingnews_062909.layout:pages.layout 6/30/09 2:58 PM Page 11

Analysis & Trading Software
®
Successful option traders need an edge.
6Analysis & Trading Software
Since 1982, thousands of professional traders and individual investors have looked to OptionVue Systems to help them capture that edge. OptionVue System's world-class team of software and options experts developed OptionVue 6, the industry's most powerful options analysis software, to help you make better trading decisions.
By accurately graphing your potential profit and loss at any date, price and volatility, only OptionVue 6 shows your proposed or existing trade's true risk.
OptionVue 6 can help you:> Select higher probability opening trades> Keep you out of low probability trades> Identify the best strategies to use> Make adjustments and manage risk> Test strategies before you trade
> Track your entire portfolio's risk
Request a FREE Test Drive of the powerful new OptionVue 6 -
call 1-800-733-6610 or visit:http://www.optionvue.com/view/Sentiment.html
Phh
bÉ
llb
SENTiMENT_AskBernie_062909.layout:pages.layout 6/30/09 2:30 PM Page 12

Is there more to an option’s “time pre-mium” than just time? – MattBERNIE: Learning to trade options would beso much easier if we only had to worry abouttime to expiration. But of course it’s not thatsimple. There are, in fact, several componentsof an option’s time value (extrinsic value); thethree most influential are time to expiration,volatility, and stock price (relative to thestrike). To a lesser extent, particularly withshort-term options, dividends of the underly-ing stock and interest rates play a role as well.
The volatility component is actuallyimplied volatility, which is essentially the priceof risk. In other words, this is the variable that,when plugged into an option pricing formula,will inflate or deflate the time premiumaccording to the market’s expectation as tohow much the stock will fluctuate going for-ward. Notice I didn’t say how much it willmove up—or down—but rather the breadthof its swings. A stock that is expected to makelarge moves will have more expensive optionsdue to the increased volatility. Likewise, astock that is expected to make small moves
will have less expensive options.Imagine two different stocks, priced at $50,
and suppose you’re looking at the 90-day, 50strike call options. The first option is quotedat $5, while the second option is $4. What’sthe difference? In a word, volatility. The stockof the $5 option is clearly more volatile, andthus, its option prices reflect the additional“volatility premium.”
Stock price relative to strike price, or“moneyness” (for lack of a better term), is asignificant factor on time premium as well—with the at-the-money options carrying thehighest time premium. While in-the-moneyand out-of-the-money options most oftenexhibit higher levels of implied volatility thanat-the-money options, in pure dollars, the lat-ter contains more time premium than anyother option in the chain.
The time premium can have a significantimpact on long option positions, so it’s impor-tant to check volatility levels before enteringtrades. Options with greater amounts ofvolatility premium built into them may bemore suitable for selling strategies such asshort naked puts or short vertical spreads. Butbe careful in such situations, as elevated pre-miums could be a sign of an impending eventthat could blindside premium sellers.
Q: What are the best ways to utilize theSchaeffer’s Volatility Index to improve mytrading results? –Steve BERNIE: As the old saying goes, knowledge ispower. The Schaeffer’s Volatility Index(SVI) gives you an edge in terms of knowing
whether option prices for a stock have beenrising or falling. Traditionally, implied volatil-ity is measured against historical volatility togauge whether an option is cheap or expen-sive. The SVI gives you another perspectiveby measuring implied volatility relative toitself and plotting this over time. This can beuseful for identifying trends in the impliedvolatility.
For example, a quick spike in the SVIwhile the stock’s price action is calm suggestsoption players are suddenly pricing in thepotential for a big move. To put this anotherway, it gives you an insight into what optionplayers are bracing for.
Checking the SVI before making a tradecan tell you whether the implieds have beenrising, falling, or just holding steady. If theimplied volatility has run up, there could be arisk of a volatility implosion. Option buyersshould view this as a potential risk, while pre-mium sellers might welcome that scenario. A low SVI suggests option buyers may be get-ting a relative deal, while premium sellersmay want to look for other opportunities.
More to Time ThanMeets the Eye
WITH VOLATILITY INCREASINGLY INTHE NEWS, TRADERS ARE BEGINNINGTO ASK ALL THE RIGHT QUESTIONS.>> By Bernie Schaeffer
Bernie Schaeffer isfounder and CEO ofSchaeffer's InvestmentResearch, Inc., a leadingprovider of research andanalysis on the stock andoptions market. Hereceived the Best of the
Best Award from theMarket Technicians Asso-ciation for his ground-breaking work onsentiment analysis, andhis award-winning SchaeffersResearch.comsite is consistently ranked
#1 in the options cate-gory by Alexa.com. Heappears frequently onCNBC and The NightlyBusiness Report and is reg-ularly quoted in the WallStreet Journal, Business-Week, and USA Today.
10 days to success-ful options trading. Visit sentiment.com/learn
Q:
The Man withthe Answers:Bernie Schaeffer
www.schaeffersresearch.com ISSUE No.2 Ask Bernie 13Ph
otog
raph
by
FRE
DR
IK B
RO
DÉ
N; I
llus
trat
ion
byJO
E M
OR
SE
/ / / / / / / / / / / / / / / / / / / / / / / / / / / / / / / / / / / / / / / / / / / / / / / / / / / / / / / / / / / / / / / / / / / / /
>> Got a question for Bernie? Send it [email protected]./ / / / / / / / / / / / / / / / / / / / / / / / / / / / / / / / / / / / / / / / / / / / / / / / / / / / / / / / / / / / / / / / / / / / /
SENTiMENT_AskBernie_062909.layout:pages.layout 6/30/09 2:31 PM Page 13

Option Pairs14 www.schaeffersresearch.comISSUE No.2
BULLISH ON A STOCK, BUT NERVOUS ON THE SECTOR? TRADING PAIRS CAN BE AN EFFECTIVE WAY TO HAVE
YOUR CAKE AND EAT IT, TOO. TRADING OPTIONS ON PAIRS—EVEN BETTER.
Hunting for
DE
H
G
E
SBy Bernie Schaeffer and Todd SalamonePHOTOGRAPHS BY FREDRIK BRODÉN
SENTiMENT.cover_feat_hunting_062909.layout:pages.layout 6/30/09 3:00 PM Page 14

SENTiMENT.cover_feat_hunting_062909.layout:pages.layout 6/30/09 3:00 PM Page 15
16 www.schaeffersresearch.com
options traders, the option pairs tradingapproach can improve your option-buyingwin percentage and reduce your average lossby positioning you to better withstand—oreven profit from—unexpected sector ormarket moves.
Utilizing the option pairs trading strategywill help you sleep better at night because(1) you can profit from big moves in eitherdirection; (2) you are using options as aleveraged vehicle, with significantly lessmoney at risk compared to trading stocks;and (3) your risk is better defined (the mostyou can lose is the smaller premiums paid forthe options versus outright stock pairstrades).
There are three ways for you to profitfrom this option pairs trading strategy:
First, if the underlying stock on whichyou buy the call (primary stock) outperformsthe underlying stock on which you purchasethe put, regardless of market or sector direc-tion. In this scenario, it’s possible that bothstocks will move in the same direction ordiverge.
Second, if there is a huge upside or down-side move in the sector or in the market,causing one of the two options in the putand call pair to more than double in price.This guarantees you a profit on the optionspair trade.
Third, if the underlying stocks of eachposition in the put and call pair move in thedirection you anticipated, allowing you toprofit from both options.
Let’s break down each of the three sce-narios with a hypothetical example.
Primary Stock Outperforms HedgeBOTH STOCKS GO DOWNAs an example of profit scenario number one,assume you are bullish on Juniper Networks(JNPR) and buy JNPR call options. Since youare uncertain where technology stocks areheaded, instead of putting all your eggs in theJNPR call basket, you hedge your call expo-sure by purchasing put options on the Nasdaq100 Trust (QQQQ). Assume you put equaldollars into these put and call positions andthe options you purchase give you leverage ofabout five to one, which means the percentagegains and losses on the options are about fivetimes the percentage moves of JNPR andQQQQ shares.
To calculate the leverage of an option relative to its underlying, you simply use theformula:
(Stock price X Option delta) ÷ Option price
For example, if JNPR is trading at $24, and anat-the-money call (typically .50 delta) is $2.40,then [(24 X .50) ÷ 2.40] = 5.
During your holding period, JNPR declines by7%, while the QQQQ experiences a 14% set-back. While you take a loss on the JNPR callof roughly 35% (5 times 7%), your gain on theQQQQ put option is about 70% (5 times14%). Your net profit on this pairs trade,assuming equal dollars in the call and the put,is 17.5%. Note that had you purchased onlyJNPR calls, you would have lost 35%. But withthe purchase of QQQQ puts to create a pair,you profited, since JNPR outperformed theQQQQ. The profit from the put optionexceeded the loss from the call option.
To recap this pairs trade:JNPR call -35%QQQQ put +70%Net profit +17.5%
PRIMARY STOCK GOES UP, HEDGESTOCK GOES DOWNNow let’s suppose you are correct about JNPR,and the shares advance by 15% as the QQQQdrifts higher by 5%. Once again assuming five-
TABLE 1: Option pairstrades are a great way toleverage less capital andearn bigger gains from anumber of scenarios, partic-ularly in uncertain markets.
Option Pairs
CAN YOU PICTURE YOURSELF INthe following situation? Suppose you love thepotential upside on a certain stock, and you’reconfident about its ability to outperform.However, you are unsure about the directionof the next big move in the industry sector—or, for that matter, in the broader market.Should you leave money on the table and shyaway from what may prove to be a profitabletrade? Or should you take the trade and riskbeing blindsided by an unpredictable eventthat could have an extremely adverse effect onyour stock or option position?
The most successful professional tradersare open to the fact that both possibilitiesexist, and they take action to both manage riskand profit from the opportunities that theyidentify. So, how can you seize opportunitieswhile managing your risk in these uncertaintimes?
The answer may lie in a strategy that we atSchaeffer’s have found extremely powerful(and profitable) over the past few years knownas option pairs trading. With this strategy, youbuy a call option on astock you like andhedge that call posi-tion by simultane-ously buying a putoption on a differentstock within thesame sector.
The appeal of theoption pairs tradingstrategy—comparedto stock trading—isthat you can commitsignificantly lessmoney to the mar-ket but still retain astrong profit poten-tial in both up anddown markets. For
ISSUE No.2
Long/Short:Buy JNPR
sharesShort QQQQ
JNPR long=+50%
QQQQ short=-30%
+10%JNPR long=
-40%QQQQ short=
+30%
-5%
STRATEGY PROFIT/LOSS
PROFIT/LOSS
Option pair:Buy JNPR
calls Buy QQQQ
puts
JNPR call=+250%
QQQQ put=-100%
+75%JNPR call=
-100%QQQQ put=
+150%
+25%
SCENARIO A
JNPR rallieson explosive
move higher intech group;
JNPRoutperforms
QQQQ
SCENARIO B
JNPR and tech group
unexpectedlyplunge: JNPR
underperformsQQQQ
SENTiMENT.cover_feat_hunting_062909.layout:pages.layout 6/30/09 3:00 PM Page 16
to-one leverage on the options you purchased,your JNPR call is up 75%, the QQQQ put is inthe red by 25%, and you have a net profit of25%. While you didn’t make as much moneyin this situation as with simply purchasing theJNPR call, you took on less risk to achieve theprofit. In other words, you profited from yourbullish view on JNPR regardless of the direc-tion technology stocks took during your hold-ing period.
To recap this pairs trade:JNPR call +75%QQQQ put -25%Net profit +25%
Powerful Move in the SectorLet’s move on to profit scenario number two,which involves an explosive move (higher orlower) in the sector you are trading. We havecertainly seen explosive moves in recentmonths, from the broader market down to sec-tors such as the financial and retail groups.This profit scenario is particularly interestingin trading option pairs, since you can be wrongabout the direction of a stock or about theequity’s performance relative to anotherequity or index, but still make money. In suchmarket environments, trading option pairsgives you a clear advantage over stock tradersemploying a long/short strategy. This isbecause options buyers can take advantage ofa concept called convexity, which means theprofit potential of a long option position is amultiple of the maximum risk.
Table 1 illustrates the advantage of theoption pairs strategy relative to the long/shortstock strategy. Again, the investor is bullish onJNPR, but is uncertain as to the direction ofthe technology sector. The options pair traderbuys JNPR calls and hedges by buying QQQQputs. The long/short player buys shares ofJNPR and shorts QQQQ shares.
In scenario A, technology stocks and JNPRexplode higher. The takeaway here is thathuge profits are possible, since options allowyou to make many times your capital commit-ment—and the most you can lose is what’sinvested in the option. The 75% profit on theoptions pair is huge relative to the 10% gain inthe long/short strategy.
In scenario B, technology stocks take a bigtumble. Note here that with an options pairtrade, you can be wrong about your stock priceforecast, but still make money if volatility ishigh. The 40% plunge in JNPR shares amid a
Minor Caveats As with any investingstrategy, you willhave losing tradesusing option pairs.The put underlyingmay outperform thecall underlying, orboth positions mightmove against you.However, in mostcases the losses willtend to be small,since you are hedgingyour directional view.
The advantagesclearly outweigh thedisadvantages inoption pairs trading.The advantagesinclude profitingfrom relativestrength trendswithin sectors; profit-ing from surges involatility; the possi-bility of profiting onboth the put and thecall; and sleepingbetter at night, with
less worry about unexpected market scenarios.The major disadvantage of option pairs trad-ing is that you are "double long" option pre-mium, and thus your position has heightenedvulnerability to time decay. Should the com-ponent stocks underlying your pair remainflat, your option pair trade will experiencetime decay loss.
Note that the option pairs strategy initself will not make you money. You have tobe equipped to identify stocks that can out-perform or underperform and have the skillsto find potentially volatile situations. Weinvite you to view our accompanying videoon this topic, as we’ll give you some tips thatcan increase your chances of profiting withthis approach. And remember, “good thingscome in pairs!”
30% decline in the QQQQ resulted in a net25% profit in the options pair because risk tothe option buyer is truncated, while potentialprofits are not. Note that the long/short stockplayer lost money in this situation. What isthere not to like about this type of profit possi-bility? Call it the “oops, but I made money any-way!” profit. You were wrong on direction, butright on volatility. And one of the few waysyou can profit in such situations is by tradingoption pairs.
Primary Stock Goes Up, Hedge StockGoes Down—the Best of Both Worlds.The third and final profit scenario occurs whenyou profit from both your call and your putpositions. In other words, the underlying stockon which you purchased the put moves suffi-ciently lower, while the underlying stock onwhich you bought the call moves sufficientlyhigher. Using our JNPR call/QQQQ put exam-ple, the JNPR call would be profitable and theQQQQ put would be profitable, as JNPR ral-lies amid broader technology weakness. In thisscenario, your stock forecast was perfect andyou are rewarded accordingly.
www.schaeffersresearch.com ISSUE No.2 17
Learn more abouttrading option pairswith our HedgeHunter service at:sentiment.com/HedgeHunter
For an extendeddiscussion on optionpairs trading,go to:sentiment.com/pairs
SENTiMENT.cover_feat_hunting_062909.layout:pages.layout 6/30/09 3:00 PM Page 17

Strategy Showcase18 www.schaeffersresearch.comISSUE No.2
MARKETS CAN SPEND AS MUCH OR MORE OF THEIR TIME TRADING SIDEWAYS AS
THEY DO UP AND DOWN. FOR THE SAVVY OPTIONS TRADER, IRON
BUTTERFLIES AND CONDORS PROVIDEA UNIQUE OPPORTUNITY
TO PROFIT FROM ALL THREE SITUATIONS.
Fortified with
By Kevin LundPHOTOGRAPHS BY FREDRIK BRODÉN
SENTiMENT.strategy_feat_062909.layout:pages.layout 6/30/09 2:44 PM Page 18

SENTiMENT.strategy_feat_062909.layout:pages.layout 6/30/09 2:44 PM Page 19

of the beautiful things about trading optionsis the ability to construct an abundance ofdifferent strategies to take advantage of amultitude of market conditions. For example,if you’re very bullish, you could simply buycalls. But if market volatility is high andoption premiums are too rich for long pur-chases, you could sell puts that profit fromrapid time decay. And if you fear a marketcollapse will sink your bullish stock, youcould always hedge that short put with a longput, further out-of-the-money, to create ashort put vertical spread.
Short verticals are a great way to trade up,down, and sideways markets (see “Going Ver-tical” in SENTIMENT, Spring 2009). Butonce you’ve grasped the basic concepts of ver-ticals, in many situations, with just one extrastep, you can get a lot more bang for yourbuck with something even better—iron but-terflies and condors. Iron spreads such asthese are ideal for stocks that are trading in ashort-term range, typically during periods inwhich stocks are taking a breather and soak-ing up the gains from a large run-up in price,or basing after a sell-off. Since they’re shortstrategies, they benefit from the stock notreally doing anything. And if the stock is notexpected to do much other than trade in arange, how about placing two verticals for lessthan the price of one? This is exactly whatwe’re doing with an iron butterfly or condor.
Though selling iron but-terflies and condors ismost commonly associ-ated with a neutral stockview, these strategies canalso be employed whenyou have a directionalbias—and consequently a
price target that coin-cides with out-of-the-money option strikes.This approach becomesespecially attractivewhen you’re looking forfavorable reward to risk,where a long option
Schaeffer’sTake: TradingDirectionallywith IronSpreads
strategy may not per-form as well when premi-ums are relatively high.It’s important to notethat there is a bit of atrade-off in that yourprobability of profitdeclines when the “sweet
spot” profit levelsincrease.The highestprobability prices for anyequity on option expira-tion day are in the imme-diate vicinity of today’sprice, and these probabili-ties decline as your
Strategy Showcase20 www.schaeffersresearch.comISSUE No.2
ONE
SENTiMENT.strategy_feat_062909.layout:pages.layout 6/30/09 2:44 PM Page 20

A QUICK WORD ABOUT TIMEThere aren’t many guarantees that traderscan count on, but one absolute is that timewill pass. This works to the benefit of theoption seller, because with each passing day,time decay erodes an option’s extrinsic (time)value, which is any of the premium that is notconsidered “in-the-money” (its intrinsicvalue). Though there are several other inputsthat make up time value (see “Ask Bernie,”page 13), what’s important to understand isthat all things being equal, the option you buytoday will be cheaper tomorrow. Short strate-gies that benefit from this phenomenon, suchas the iron butterfly and condor, are said tohave positive time decay. That basicallymeans that time passing produces a profit forthe option seller and a loss for the buyer.
GETTING YOUR IRON FIXDespite their exotic-sounding names, the ironbutterfly and condor are simply combinationsof two short vertical spreads—one short putvertical and one short call vertical— stackedon top of one another. To recap, a short verti-cal is a defined-risk strategy composed of anequal number of short options at one strike,and cheaper, long options at a different strikewith the same expiration, as a hedge (thestrikes are usually adjacent to one another).The result is a net credit to the trader’saccount at the onset of the trade, and it’sprofitable when the entire spread can bebought back for a debit that is smaller thanthe initial credit taken.
If the concept of short spread trading isforeign to you, what’s important to under-stand is that eventually, all time premiumdecays to zero—at expiration. Options withgreater time value will decay faster thanthose with a lesser time value of the samematurity, such as those farther out-of-the-money. This is the case with the short verti-cals within the iron spreads. The short optionthat you sell with greater time premiumdecays more quickly than the time premium
verticals within the iron spreads give thesestrategies a double whammy.
The difference between the iron butterflyand condor has to do with the positioning ofthe short strikes. The iron butterfly sharesthe same short strikes, while the short strikesof the iron condor are different (usually adja-cent). While there are several reasons youmay wish to choose one over the other, some-thing to consider is that while the iron but-terfly has a better reward-to-risk ratio, theiron condor has a higher probability of suc-cess due to the fact that it will profit over agreater range of stock prices. It’s a trade-off ofprobability versus profit. You decide.
CREATING THE IRON SPREADLet’s look at constructing both an iron but-terfly and condor trade around the hypothet-ical example XYZ at $50.
THE IRON BUTTERFLYSuppose the stock has just come off of a deepsell-off in the last two months, and after somewild swings, has been forming a base, tradingin a range between $47 and $53 for the betterpart of two weeks on declining volume.
With XYZ at $50, an iron butterfly can beconstructed by simultaneously shorting the45/50 put vertical for $2 and the 50/55 callvertical for $1.75 (see Figure 1), entered as asingle spread for a net credit of $3.75. Sincethere is $5 between strikes for each of theverticals, and the stock can’t finish in twoplaces at once, your risk is only the distancebetween the strikes of one of the verticalsminus the total credit received for both, or$1.25 ($5 – $3.75).
Essentially, the two verticals share thesame strike because you sell the “body” of thebutterfly at the 50 strike (short 50 put/ short50 call) and buy the “wings” at the two ends(buy 45 put/ buy 55 call). When the two ver-ticals are stacked on top of one another, yourrisk curve of the 45/50/55 iron butterfly lookslike Figure 1.
in the cheaper, long option. The result is thatas time marches on, the spread at some pointbecomes cheaper, thus rendering a profitsince you are a net seller of premium. It’sessentially turning the concept of “buy low,sell high” upside down by selling high first,then buying back low later. The compounded
expiration day strikeprice target diverges fromthe current share price.
At Schaeffer’s, inorder to increase theprobabilities back in ourfavor, we use a combina-tion of technical analysis
and analysis of the openinterest at various keyoption strike prices todetermine the strikes atwhich a stock might“land” at option expira-tion. For example, onMarch 24 auto-parts
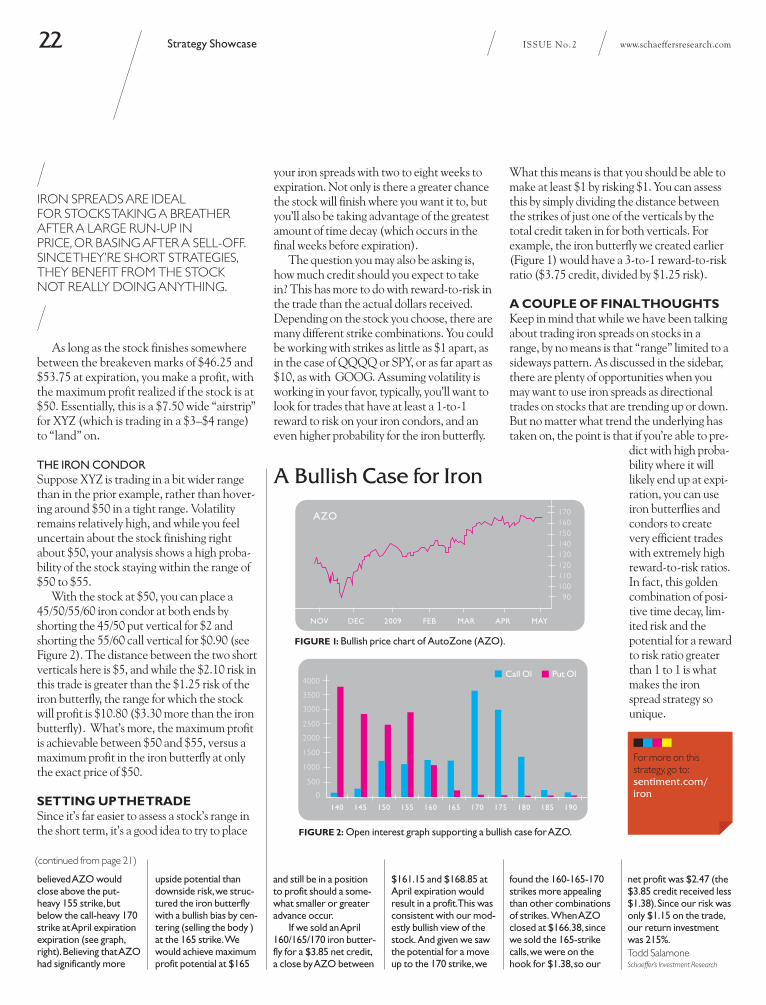
retailer AutoZone(AZO), in the midst of astrong uptrend, was trad-ing at $158.05 (see chart,page 22). Option specula-tors and short sellerswere betting against thestock, and we believed an
unwinding of this pes-simism could help pushthe shares higher. At thesame time, there wasn’t avisible catalyst on theimmediate horizon todrive the shares substan-tially higher, and we saw
the potential for resist-ance around $170, whichwas double the Novem-ber low of $85 and thesite of heavy call openinterest.
We’ve found thatheavy call open interest
tends to act as resistancefor stock prices, whileheavy put open interestat a strike can be sup-portive. Based on AZO’sopen interest at variouskey April strikes, we (continued next page)
www.schaeffersresearch.com ISSUE No.2 Strategy Showcase 21
FIGURE 1(top):You make a profit on this iron but-terfly so long as stock XYZ finishes between $46.25and $53.75 at expiration, providing a $7.50 wide“airstrip” for XYZ to “land” on. Maximum profit isachieved at $50.
FIGURE 2 (bottom): The airstrip for which you canmake a profit on this iron condor is $10.80—between$47.10 and $57.90. Even better, instead of a singlepoint in the stock's price, the maximum profit isreached between $50 and $55. Less risk equals lessreward: the maximum profit of the iron condor is$2.90 versus $3.75 for the iron butterfly.
45 50
Loss
Profit
Stock Price
Breakeven
( + )
( - )
Long Put
Strike
ShortPut & CallStrike
55
Loss
Long CallStrike
46.25 53.75
Iron Butterfly
45 50
Loss
Profit
Stock Price
Breakeven
( + )
( - )
Long Put
Strike
ShortPut
Strike
60
Loss
Long CallStrike
47.10 57.90
Iron Condor
55
ShortCallStrike
SENTiMENT.strategy_feat_062909.layout:pages.layout 6/30/09 2:44 PM Page 21
Strategy Showcase22 www.schaeffersresearch.comISSUE No.2
As long as the stock finishes somewherebetween the breakeven marks of $46.25 and$53.75 at expiration, you make a profit, withthe maximum profit realized if the stock is at$50. Essentially, this is a $7.50 wide “airstrip”for XYZ (which is trading in a $3–$4 range)to “land” on.
THE IRON CONDORSuppose XYZ is trading in a bit wider rangethan in the prior example, rather than hover-ing around $50 in a tight range. Volatilityremains relatively high, and while you feeluncertain about the stock finishing rightabout $50, your analysis shows a high proba-bility of the stock staying within the range of$50 to $55.
With the stock at $50, you can place a45/50/55/60 iron condor at both ends byshorting the 45/50 put vertical for $2 andshorting the 55/60 call vertical for $0.90 (seeFigure 2). The distance between the two shortverticals here is $5, and while the $2.10 risk inthis trade is greater than the $1.25 risk of theiron butterfly, the range for which the stockwill profit is $10.80 ($3.30 more than the ironbutterfly). What’s more, the maximum profitis achievable between $50 and $55, versus amaximum profit in the iron butterfly at onlythe exact price of $50.
SETTING UP THE TRADESince it’s far easier to assess a stock’s range inthe short term, it’s a good idea to try to place
your iron spreads with two to eight weeks toexpiration. Not only is there a greater chancethe stock will finish where you want it to, butyou’ll also be taking advantage of the greatestamount of time decay (which occurs in thefinal weeks before expiration).
The question you may also be asking is,how much credit should you expect to takein? This has more to do with reward-to-risk inthe trade than the actual dollars received.Depending on the stock you choose, there aremany different strike combinations. You couldbe working with strikes as little as $1 apart, asin the case of QQQQ or SPY, or as far apart as$10, as with GOOG. Assuming volatility isworking in your favor, typically, you’ll want tolook for trades that have at least a 1-to-1reward to risk on your iron condors, and aneven higher probability for the iron butterfly.
What this means is that you should be able tomake at least $1 by risking $1. You can assessthis by simply dividing the distance betweenthe strikes of just one of the verticals by thetotal credit taken in for both verticals. Forexample, the iron butterfly we created earlier(Figure 1) would have a 3-to-1 reward-to-riskratio ($3.75 credit, divided by $1.25 risk).
A COUPLE OF FINAL THOUGHTSKeep in mind that while we have been talkingabout trading iron spreads on stocks in arange, by no means is that “range” limited to asideways pattern. As discussed in the sidebar,there are plenty of opportunities when youmay want to use iron spreads as directionaltrades on stocks that are trending up or down.But no matter what trend the underlying hastaken on, the point is that if you’re able to pre-
dict with high proba-bility where it willlikely end up at expi-ration, you can useiron butterflies andcondors to createvery efficient tradeswith extremely highreward-to-risk ratios.In fact, this goldencombination of posi-tive time decay, lim-ited risk and thepotential for a rewardto risk ratio greaterthan 1 to 1 is whatmakes the ironspread strategy sounique.
and still be in a positionto profit should a some-what smaller or greateradvance occur.
If we sold an April160/165/170 iron butter-fly for a $3.85 net credit,a close by AZO between
$161.15 and $168.85 atApril expiration wouldresult in a profit. This wasconsistent with our mod-estly bullish view of thestock.And given we sawthe potential for a moveup to the 170 strike, we
believed AZO wouldclose above the put-heavy 155 strike, butbelow the call-heavy 170strike at April expirationexpiration (see graph,right). Believing that AZOhad significantly more
upside potential thandownside risk, we struc-tured the iron butterflywith a bullish bias by cen-tering (selling the body )at the 165 strike.Wewould achieve maximumprofit potential at $165
found the 160-165-170strikes more appealingthan other combinationsof strikes. When AZOclosed at $166.38, sincewe sold the 165-strikecalls, we were on thehook for $1.38, so our
net profit was $2.47 (the$3.85 credit received less$1.38). Since our risk wasonly $1.15 on the trade,our return investmentwas 215%.Todd SalamoneSchaeffer’s Investment Research
IRON SPREADS ARE IDEAL FOR STOCKS TAKING A BREATHERAFTER A LARGE RUN-UP IN PRICE, OR BASING AFTER A SELL-OFF.SINCE THEY’RE SHORT STRATEGIES,THEY BENEFIT FROM THE STOCK NOT REALLY DOING ANYTHING.
For more on this strategy, go to:sentiment.com/iron
A Bullish Case for Iron
NOV DEC 2009 FEB MAR APR MAY
17016015014013012011010090
4000
3500
3000
2500
2000
1500
1000
500
0
140 145 150 155 160 165 170 175 180 185 190
Call Ol Put Ol
AZO
FIGURE 1: Bullish price chart of AutoZone (AZO).
FIGURE 2: Open interest graph supporting a bullish case for AZO.
(continued from page 21)
SENTiMENT.strategy_feat_062909.layout:pages.layout 6/30/09 2:44 PM Page 22

Discover what
YOU’VE BEEN MISSING!SFO MAGAZINE!GET A FREE SUBSCRIPTION TODAY AND DISCOVER:
• Tools to become a better investor
• Industry updates that impact your trading
• Expert interviews on FOREX, options, trading systems
and more!
www.sfomag.com/FreeSub
SFO WEBINARS!
• Systems Trading
• Fundamental Analysis
www.sfomag.com/webinars
• Technical Analysis
• Options
These SFO webinars are FREE – Register Today!
Ask questions and get in-depth viewpoints from
trading experts – topics covered include:FREE!
NEW W&A PUBLISHING TITLES!
KEN “Woodie” WOOD
Trade the
PATTERNSThe Revolutionary Way of
Trading the CCI
Trade the PatternsThe Revolutionary Way of Trading the CCI
Personal Investor Series:
Introduction By
Russell R. Wasendorf, Jr.
E D I T E D B Y L A U R A S E T H E R
FOREX TRADING
FOREX
TRA
DIN
G
SFOPERSONALINVESTORSERIES:Forex Trading
Charles Dow’s Original Editorials & Their Relevance Today
Theoryplugged:
With Contributions fromRichard Russell, Charles Carlson & Paul Shread
Edited by Laura Sether
DOW THEORYUNPLUGGEDCharles Dow’s Original Editorials &Their Relevance Today
$54.95 $19.95 $39.95
Visit w-apublishing.com/NewTitles for these and more great titles from W&A Publishing!
NEW! NEW! NEW!
T h e O f f i c i a l A d v o c a t e f o r P e r s o n a l I n v e s t i n g
WWW.SFOMAG.COM
WASHINGTON GOES TO WALL ST.Ideas abound to prevent a repeat of the last two years. p. 24
SCANNING STOCK SECTORSSector winners and losers in the wake of the Obama budget. p. 50
THE FED & ECBDiffering views from opposite sides of the Atlantic. p. 60
Feature Interview with IAN BREMMER, PH.D., President of Eurasia Group
GRAVEof Politics and Finance
NEW WORLD
FREE!
Archived webinars are also available on demand.
SENTiMENT.strategy_feat_062909.layout:pages.layout 6/30/09 2:44 PM Page 23

Forex Options24 www.schaeffersresearch.comISSUE No.2
IN LIGHT OF THE WILD SWINGS WE’VE SEEN IN THE LAST TWO YEARS, EQUITY TRADERS HAVEBEEN LOOKING TO TAKE THEIR TECHNICAL
SKILLS AND EXPLORE NEW FRONTIERS. NOT ONLY MIGHT FOREIGN CURRENCY OPTIONS
BE JUST THE TICKET, BUT PERHAPS THEY'RE NOT AS “FOREIGN” AS YOU THINK.
Currency Options:Trading an Old Friend in a New World
By Steve Meizinger
he currency markets have experienced significant move-ment recently. Why should equity optionsinvestors pay attention? The foreign exchange(FX) market is one of the largest and most liq-uid financial markets in the world. Whetheryou’re running an import/export business,traveling the globe, or you're just an investorlooking to profit from currency fluctuations,everyone is affected by foreign exchange.Though historically dominated by largefinancial institutions, the FX market hasevolved into a much more dynamic andtransparent structure that provides retailinvestors with direct access through a varietyof trading venues. Individual investors arecontinuing to flock to the currency markets totake advantage of opportunities in marketvolatility, as well as alternatives for diversifyingtheir portfolios.
The importance of the currency marketcannot be overstated. The relative value of acurrency determines our actual buying power.This is something that we deal with on a dailybasis, whether we’re conscious of it or not. Forinstance, how much does a gallon of gas cost inthe United States? As a commodity, the cost ofoil is priced in U.S. dollars (USD) and is basedon global supply and demand. In addition tosupply and demand, the relative value of theUSD also plays a critical role in the price of oil,
ILLUSTRATIONS BY JOE MORSE
SENTiMENT.forexOptions_feat._062909.layout:pages.layout 6/30/09 2:42 PM Page 24

SENTiMENT.forexOptions_feat._062909.layout:pages.layout 6/30/09 2:42 PM Page 25
U.S. dollar/Canadian dollar (USD/CAD)quote of 1.16, which means every $1 USDconverts to $1.16 CAD. This is termed USDrelative—the value of the USD relative to theCAD. Figure 1 summarizes the rate modifierfor each available pair.
So, what is a dollar really worth? It’s impor-tant to understand the underlying tradinginstrument prior to implementing any optionstransaction. The trading convention (cur-rency pair) was created to allow investors tointuitively implement their view of the U.S.dollar (USD). The pair values are multipliedby 100 to create ISE pair values; the oneexception is the USD/JPY pair value, which isnot modified at all. Given a USD/CAD (ISEsymbol: CDD) quote of 1.16, ISE would dis-seminate option quotations based on a 116CDD value.
The best way to understand ISE FX Optionsis to view them as a U.S. dollar index product.The structure of these products is based on U.S.dollar strength. Option investors can employthe same core trading and hedging strategiesused with stocks, exchange-traded funds(ETFs), and indexes with ISE FX Options. So,you can trade calls or puts in a very similar fash-ion to IBM, or any other equity option that isavailable for trading at the ISE. For example, ifyou are bullish on the USD, you could buy callson any one of the six pairs available. Likewise, ifyou’re bearish on the USD, you could simplybuy puts. And unlike spot currency or currencyfutures markets, ISE FX Options trades can beentered directly from your existing equityoptions account.
and, ultimately, how much you pay for a gal-lon of gas.
How does the FX market structure differfrom the equities market? Investors often con-sider relative performance between their port-folio and a given index benchmark, such asthe S&P 500, but the FX market is based onrelative performance between the buyingpower for goods and services created by eachcurrency. As such, the FX market is taskedwith quantifying this relative value in eachlocal currency.
Why FX Options?ISE FX Options® were launched in April 2007by the International Securities Exchange, anSEC-regulated exchange, to provide investorswith a low-risk alternative to hedging or spec-ulating on currency moves. Just as with equityoptions, these exchange-listed securities arecentrally cleared by the Options ClearingCorporation (OCC), which offers increasedtransparency and accessibility for investors.ISE FX Options are also cash-settled in USD,allowing investors to trade these options with-out having to hold the underlying currency orneeding to take delivery of another currencyat expiration. Whether you want to trade aview on the U.S. dollar or you are looking tohedge against currency exposure, ISE FXOptions provide a unique way to meet yourfinancial objectives without the open-endedrisk normally associated with trading spot orfutures markets.
ISE FX Options are very similar to equityoptions, with just a few subtle differences.Let’s look at how the ISE FX Options marketworks and how ISE FX Options can comple-ment your equity options portfolio.
What’s a Dollar Worth?Unlike equities, FX is traded in currency pairs.These pair values are created to facilitate theexchange of one currency for another acrossthe globe. For example, if you were travelingfrom the U.S. to Canada, you would need toexchange your U.S. dollars for Canadian dol-lars in order to purchase goods or services in
Canada. ISE FX Options are constructed tohave the USD as the base (or relative) cur-rency for all six currency options pairs that arecurrently available. Spot prices are based onexchange rates reported by Reuters. Each cur-rency pair uses a standardized quoting con-vention of rates with USD as the basecurrency (for example, USD/Canadian dol-lar). The rates are modified, as shown in Fig-ure 1, so the underlying value reflects a pricelevel similar to that of a stock or index. Sincethe currencies trade in pairs, you might view a
In late May, internationalinvestment guru MarcFaber told BloombergTelevision in Hong Kong:“The U.S. economy willenter ‘hyperinflation’approaching the levels inZimbabwe because the
Schaeffer’sTake: The Perfect Pair
WHILE GLOBALIZATION HAS CREATED SOME AMAZING OPPORTUNITIES FOR U.S. INVESTORS,IT HAS ALSO CREATED SOME CHALLENGES. INVESTORS SHOULD LOOK TO THE CURRENCY MARKETS TO HELP PROTECT AND DIVERSIFY THEIR PORTFOLIOS.
Forex Options26 www.schaeffersresearch.comISSUE No.2
Federal Reserve will bereluctant to raise interestrates.” And according tothe London-based DailyMail: “Zimbabwe's dollarhas been renderedalmost completelyworthless after years ofrecord-breaking hyperin-flation. In February thegovernment started pay-ing soldiers and othergovernment workers inU.S. dollars after inflationhit more than 10 billiontrillion percent.”
If Faber’s predictionsfor U.S. inflation turn outto be anywhere close toaccurate, the implicationsfor the U.S. dollar willalmost certainly be dire.And if you agree with
Faber’s view, you mightconsider taking a bearishU.S. dollar position, eitheras a hedge to preserveyour capital or as specu-lation. Foreign currency(or foreign exchange)options are a viable toolfor implementing such astrategy.And if you’re atrader with a fundedequity options account,you can trade ISE FXOptions directly out ofthat account.
Another attractivefeature of FX Options forequity options traders isthe modest volatility ofthe underlying currencypairs, which providesopportunities forenhanced profits for
SENTiMENT.forexOptions_feat._062909.layout:pages.layout 6/30/09 2:43 PM Page 26

Going Global to Diversify Your PortfolioSo why should investors look to the currencymarkets to help protect and diversify theirportfolios? As the trading world has becomemore global, the financial markets are adapt-ing to these trends. Globalization has createdsome amazing opportunities for U.S.investors, but it has also created some chal-lenges. As U.S. investors continue to investin overseas markets, the relative value of theforeign exchange market is becomingincreasingly important. Why? Anytime youinvest in foreign markets, you are actuallyexchanging USD for another currency. If youchoose to sell that foreign investment, youwill likely repatriate the money back toUSD—another foreign exchange transaction(a reversal of the initial FX transaction). Inessence, as trading opportunities becomemore global, foreign exchange tradingbecomes more important for investors whowant to monitor their foreign exchange risks.
ISE FX Options are an excellent way totrade the currency markets without having tohold the actual currencies or get involvedwith the leverage required to trade the FXspot market. ISE FX Options provideinvestors with tremendous versatility interms of strike prices, expiration months, andcountless trading strategies to choose from.Not only can equity options traders use theirexisting brokerage accounts to implementtheir FX Options forecasts, but also, an exist-ing familiarity with options will make a newmedium like foreign exchange feel less, well,foreign.
Finally, ISE FX Options help protect yourportfolio from correlation risk. So whetheryou have a compelling analysis of the U.S.dollar you’d like to try, or you are simply look-ing to hedge your currency exposure, ISE FXOptions can provide you with a unique wayto meet your financial objectives.
/ / / / / / / / / / / / / / / / / / / / / / / / / / / / / / / / / / / / / / / / / / / / / / / / / / / / / / / / / / / / / / / / / / / / /
>> Steve Meizinger is Director of Education at theInternational Securities Exchange (ISE) and a leadingexpert in forex, equity, and index options trading./ / / / / / / / / / / / / / / / / / / / / / / / / / / / / / / / / / / / / / / / / / / / / / / / / / / / / / / / / / / / / / / / / / / / /
A Free Lunch? Reducing Your Correlation RiskAll options are based on the concept of prob-abilities and risk versus reward. Trading FXOptions is no different. You might be won-dering how the ISE FX pairs move in relationto the S&P 500, your favorite ETF, or spe-cific equities. The answer to your question iscalled correlation, or how one asset classmoves in relation to another. High correla-tion means a high-percentage movementfrom one asset class to another. Negativecorrelation is the reverse percentage move-ment from one asset class to another. Forexample, if you own all airline stocks or alloil stocks, you are subjecting your portfolioto additional industry-specific risk, therebyincreasing correlation risk. ISE FX Optionpairs have historically lower correlations tothe S&P 500. Some ISE FX pairs even offernegative correlations, which many investorsare currently seeking to hedge their overallportfolios. The theory of portfolio diversifi-cation states that in addition to assets thatseem attractively priced, investors mightwant to consider assets that do not increaseoverall correlation risk. Diversificationreduces the risk that an entire portfolio willbe diminished by a single investment’s loss.It is popularly referred to as the “only freelunch in finance.”
How are FX Options Exercised?ISE FX Options are European style, meaningthat you cannot exercise the options prior toexpiration. This does not mean that you musthold them until expiration, however. As withany other option, you can close out of yourposition anytime the ISE market is open. If aninvestor chooses to hold an option to expira-tion instead of closing it out, the option will beUSD cash-settled. For example, assuming theUSD/CAD closes at 116, the expiring CDD115 calls (the right to buy USD/CAD) wouldsettle at $1.00 (116–115), or $100 per CDDcall contract. Using CDD puts as an exampleof settlement, the 122 puts (the right to sellUSD/CAD) would settle at $6 (122–116) or$600 per CDD put contract. Of course, not alloptions will settle into cash. Those that areout-of-the-money will expire worthless.
option buyers. For exam-ple, the ISE Euro FX (EUI)underlying has been trad-ing at about half thevolatility of the S&P 500,which means that EUIoptions are about half asexpensive as those onthe S&P. Assuming youbuy at-the-money S&Poptions with five-to-oneleverage and you cor-rectly identify a 10%move in the S&P in theproper time frame, yourprofit on an S&P optionstrade would be about50%. But a 10% move inISE Euro FX could yield a100% gain for you incomparably situated EUIoptions.
While lower historical
volatility can often meanthat opportunities torealize big moves in theunderlying are limited,consider that the ISEEuro FX recentlydeclined by 10% in lessthan six weeks—fromApril 20 to June 4, 2009.Put another way, the U.S.dollar declined by 10%compared to the euroover this relatively shorttime frame. Price trendsin the currencies can bepersistent and powerful,while the pricing of cur-rency options tends to bewell below that of equi-ties. That’s quite a power-ful “pair”!Bernie SchaefferSchaeffer’s Investment Research
FIGURE 1: ISE FX Options are offered on six major currency pairs. The underlying rate of each = Rate x Ratemodifier.
www.schaeffersresearch.com ISSUE No.2 Forex Options 27
USD/AUD Australian Dollar AUX 100 131.80 (1.3180 x 100)
USD/GBD British Pound BPX 100 66.15 (0.6615 x 100)
USD/CAD Canadian Dollar CDD 100 116.70 (1.1670 x 100)
USD/EUR Euro EUI 100 73.62 (0.7362 x 100)
USD/CHF Swiss Franc SFC 100 110.95 (1.1095x100)
USD/JPY Japanese Yen YUK 1 97.48 (97.48 x 1)
Currency Pair(Convention)
Description ISE FXSymbol
Rate Modifier ISE Underlying Price Examples
For more forex optionsinsights from SteveMeizinger go to:sentiment.com/fx
SENTiMENT.forexOptions_feat._062909.layout:pages.layout 6/30/09 2:43 PM Page 27

THE RISK OF TRADING FUTURES, OPTIONS AND FOREIGN EXCHANGE CAN BE SUBSTANTIAL. EACH INVESTOR MUST CONSIDER WHETHER THIS IS A SUITABLE INVESTMENT.
FREE 30-DAY BESTTEST SIMULATED TRADING ACCOUNT
This is an outstanding opportunity for you to test before you trade!
Practice your skills with a mock $50,000 simulated account before
taking the plunge with a live account.
E-GUIDE TO FUTURES TRADING
Learn what futures trading is all about. PFGBEST’s E-Guide to Futures
Trading CD will help increase your knowledge of futures trading to more
profitably compete in this fast-paced arena.
FUTURES OR FUTURES OPTIONS BOOKLET
This is the essential primer for those who are just getting involved
in futures or options, or for those who need to brush up on the
essentials.
MANAGED FUTURES INVESTMENT KIT
Leave the research up to the professionals. Includes Top Trading Systems
e-newsletter and a trio of e-brochures geared to answer any questions you
have regarding managed futures.
PFGBEST WEBINARS
Whether you’re new to futures, forex and options trading or an old hand, every-
one can benefit from attending one of PFGBEST’s webinars. Just taking away
one key concept or strategy could lead you to a better trading experience.
FOREX BASIC BROCHURE
Foreign exchange is the largest market in the world, with volume that far
exceeds commodities, financial futures and stocks. The Forex Basic Brochure
is a great introduction to this exciting market!
THE NEW & IMPROVED INVESTOR’S TOOLKIT
To sign-up for your free Investor’s Toolkit, logon to pfgbest.com/musthavekit
Check out our ongoing trader’s webinars and archives at pfgbest.com/tw
SENTiMENT_BackToBasics_062909.layout:pages.layout 6/30/09 2:32 PM Page 28

NE OF THE MOST commonly used sentiment indicators, byequity and option traders alike, is the CBOEVolatility Index (VIX). More fondly referredto as the market’s "fear gauge", it is somewhatakin to a mood ring for the market. It can notonly help traders develop preliminary conclu-sions about market sentiment overall, butalso assist them in determining what kind ofstrategy to use—whether a hedge or simply aspeculative trade.
There is an old adage among traders:“When the VIX is high, it’s time to buy. Whenthe VIX is low, it’s time to go.” The easiest wayto view the VIX is to look at it as a numberthat represents the overall expected volatilityof the S&P 500 index. When the VIX meas-ures high readings (and “high” is very rela-tive), it indicates overall fear in the marketduring bearish and turbulent times. Lowerreadings indicate investor complacency—oreven apathy, to some degree—when marketsare bullish.
Without getting deep into complex formu-las, essentially, the VIX derives its value bylooking at the implied volatilities of near-termoptions on the S&P 500 for the two closestmaturities (with at least one week to expira-tion). This volatility depends on the volumeof activity in the options on the S&P 500 astraders increase or unwind their hedges.
There are a couple of things to take note ofwhen studying VIX readings. First, when theVIX trades at extremes relative to the market,it becomes a contrarian indicator of sorts thatcan give you clues to the market’s next move.For example, take the market we saw between2004 and 2007. Like clockwork, it seemed
www.schaeffersresearch.com ISSUE No. 2 Back to Basics 29
O
SENTIMENT
Looking for a VIX-likereading on your favoritestock? Type a ticker sym-bol in the “get quote”section at the top ofwww.SchaeffersResearch.com and sixcharts will appear. Oneof these charts displaysthe historical readings ofthe Schaeffer’s VolatilityIndex (SVI) for the stockbeing queried. By averag-ing the implied volatili-ties of short-termoptions whose strikesimmediately surroundthe stock price, the SVI
indicates the level ofshort-term volatility thatthe market is expectingfor that stock—just asthe VIX reflects thisvolatility level for theS&P 500. This volatilityexpectation is a majorcomponent of optionspricing. A rising SVImeans option tradersare raising their expecta-tions for volatility in thenear term for that stock,which results in higher
option premiums.Youcan utilize the SVI graphsto determine if theoptions on a particularstock are relativelyexpensive or cheap,using past data points fora reference. Moreexpensive optionsrequire a bigger move inthe stock to attain youroption profit objectives,so this should be a factorin your options tradingdecision process.
FIGURE 1: Between 2004 and 2007, the VIX spikingnear 20 meant a market rally was imminent. Readingsof 10 meant a sell-off was near.Source: Schaeffer’s Investment Research
Schaeffer’sTake
The VIX
OPTION TRADERS LOOK TO THIS MARKET “FEAR GAUGE” IN HOPES OF GLEANING CLUES ABOUT THE FUTURE.>> PHOTOGRAPH BY FREDRIK BRODÉN
that whenever the VIX wouldspike to levels near 20, we saw ral-lies ensue soon afterward (see Fig-ure 1). Likewise, when the VIXtouched readings of 10, small sell-offs would occur (even if only fora short while).
As market fundamentalsbegan to shift in early 2007, andthe global credit crisis surfaced,the S&P 500 continued to rise–but interestingly, so did the VIX.When the VIX pierced through20 in mid-2007, it was an earlyclue that the market didn’t likewhat it was seeing. While themarkets continued to hold upthrough most of the year, traderswere increasing their hedgesgoing into 2008, and VIX read-ings continued to rise well above20—on up into the 30s. We allknow what happened next.
Aside from mere sentiment, a high VIXtranslates into a higher “fear premium” forother equity options in general—which canbe helpful in assessing what type of optionstrategy to put on. During periods when theVIX is trending higher, you might considerswitching from buying strategies to sellingstrategies that take advantage of the higherfear premiums priced into options—shortvertical spreads, short naked puts, coveredcalls, and so on.
Once you’ve determined the overall mar-ket volatility per the VIX, it would behooveyou to determine the volatility of the individ-ual stocks you’re considering trades on. Usethe Schaeffer Volatility Index (see “Schaef-fer’s Take,” sidebar below) to help you decideyour next move.
1600
1400
1300
1200
1100
APR JUL OCT APR JUL OCT APR JUL OCT APR JUL OCT APR JUL
2004
2005
2006
2007
2008
S&P 500VIX
35
30
25
20
15
10
SENTiMENT_BackToBasics_062909.layout:pages.layout 6/30/09 2:32 PM Page 29
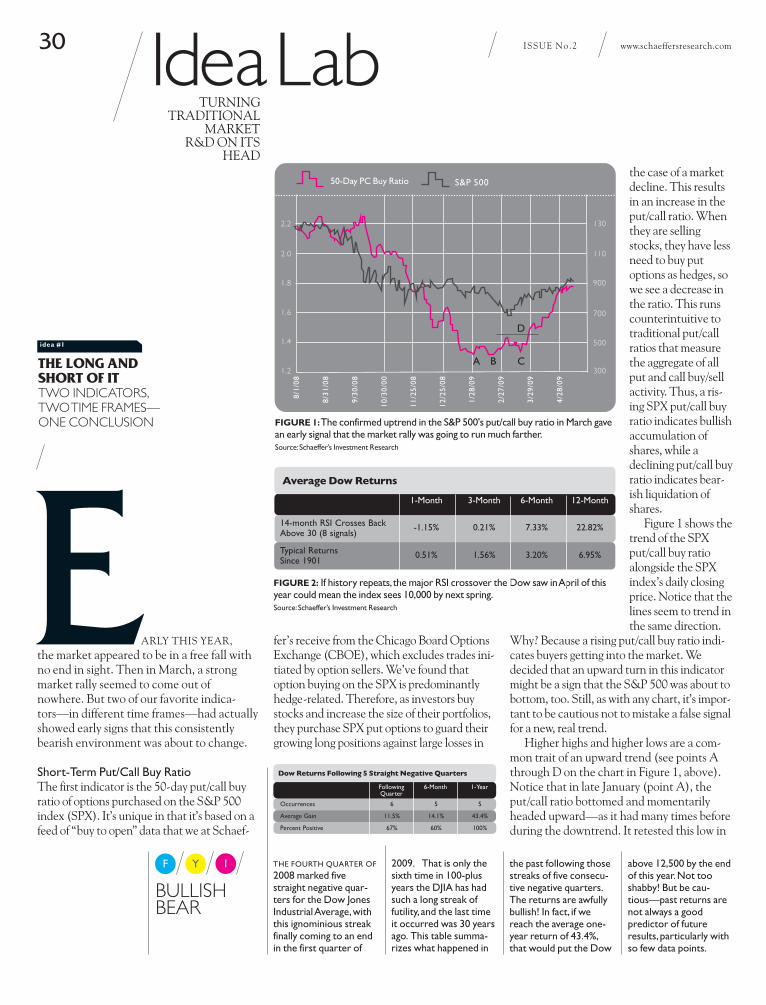
THE FOURTH QUARTER OF
2008 marked fivestraight negative quar-ters for the Dow JonesIndustrial Average, withthis ignominious streakfinally coming to an endin the first quarter of
2009. That is only thesixth time in 100-plusyears the DJIA has hadsuch a long streak offutility, and the last timeit occurred was 30 yearsago. This table summa-rizes what happened in
the past following thosestreaks of five consecu-tive negative quarters.The returns are awfullybullish! In fact, if wereach the average one-year return of 43.4%,that would put the Dow
IdeaLab30 www.schaeffersresearch.comISSUE No.2
ARLY THIS YEAR, the market appeared to be in a free fall withno end in sight. Then in March, a strongmarket rally seemed to come out ofnowhere. But two of our favorite indica-tors—in different time frames—had actuallyshowed early signs that this consistentlybearish environment was about to change.
Short-Term Put/Call Buy RatioThe first indicator is the 50-day put/call buyratio of options purchased on the S&P 500index (SPX). It’s unique in that it’s based on afeed of “buy to open” data that we at Schaef-
fer’s receive from the Chicago Board OptionsExchange (CBOE), which excludes trades ini-tiated by option sellers. We’ve found thatoption buying on the SPX is predominantlyhedge-related. Therefore, as investors buystocks and increase the size of their portfolios,they purchase SPX put options to guard theirgrowing long positions against large losses in
the case of a marketdecline. This resultsin an increase in theput/call ratio. Whenthey are sellingstocks, they have lessneed to buy putoptions as hedges, sowe see a decrease inthe ratio. This runscounterintuitive totraditional put/callratios that measurethe aggregate of allput and call buy/sellactivity. Thus, a ris-ing SPX put/call buyratio indicates bullishaccumulation ofshares, while adeclining put/call buyratio indicates bear-ish liquidation ofshares.
Figure 1 shows thetrend of the SPXput/call buy ratioalongside the SPXindex’s daily closingprice. Notice that thelines seem to trend inthe same direction.
Why? Because a rising put/call buy ratio indi-cates buyers getting into the market. Wedecided that an upward turn in this indicatormight be a sign that the S&P 500 was about tobottom, too. Still, as with any chart, it’s impor-tant to be cautious not to mistake a false signalfor a new, real trend.
Higher highs and higher lows are a com-mon trait of an upward trend (see points Athrough D on the chart in Figure 1, above).Notice that in late January (point A), theput/call ratio bottomed and momentarilyheaded upward—as it had many times beforeduring the downtrend. It retested this low in
E
TURNING TRADITIONAL
MARKET R&D ON ITS
HEAD
FIGURE 1:The confirmed uptrend in the S&P 500's put/call buy ratio in March gavean early signal that the market rally was going to run much farther. Source: Schaeffer’s Investment Research
BULLISHBEAR
THE LONG ANDSHORT OF ITTWO INDICATORS,TWO TIME FRAMES—ONE CONCLUSION
idea #1
F Y I
FIGURE 2: If history repeats, the major RSI crossover the Dow saw in April of thisyear could mean the index sees 10,000 by next spring. Source: Schaeffer’s Investment Research
above 12,500 by the endof this year. Not tooshabby! But be cau-tious—past returns arenot always a good predictor of futureresults, particularly withso few data points.
1-Month 3-Month 6-Month 12-Month
14-month RSI Crosses Back Above 30 (8 signals)
-1.15% 0.21% 7.33% 22.82%
Typical Returns Since 1901
0.51% 1.56% 3.20% 6.95%
Average Dow Returns
Dow Returns Following 5 Straight Negative Quarters
Occurrences 6 5 5
Average Gain 11.5% 14.1% 43.4%
Percent Positive 67% 60% 100%
FollowingQuarter
6-Month 1-Year
130
110
900
700
500
300
2.2
2.0
1.8
1.6
1.4
1.2
8/1/
08
8/31
/08
9/30
/08
10/3
0/00
11/2
5/08
12/2
5/08
1/28
/09
2/27
/09
3/29
/09
4/28
/09
S&P 500 50-Day PC Buy Ratio
A B C
D
SENTiMENT_idealab_062909.layout:pages.layout 6/30/09 2:36 PM Page 30

www.schaeffersresearch.com ISSUE No.2 Idea Lab 31
mid-February (point B), but this time it onceagain turned upward. This was the first signwe had seen that the put/call ratio was stabi-lizing, indicating a respite in the selling pres-sure. We watched closely as the ratio toppedout again and fell to point C in mid-March.When it turned up from that point (which isabove point B), we had a higher low. Line Don the chart marks the previous high. Oncethe put/call ratio rose above this point, wehad our higher high. This confirmation of theput/call ratio’s new uptrend marked a greatbuy signal relatively early in the ensuingstrong market rally.
Long Term RSIAnother indicator flashed a buy signal, butthis one had longer-term implications. At theend of April, Wilder’s Relative Strength Index(RSI) on a monthly chart for the Dow gave abuy signal that has been very accurate in thepast at calling long-term bull markets. TheRSI is a technical analysis tool that considersindex gains and losses over the last 14 months;it is an overbought/oversold oscillator thatranges between zero and 100. Oversold mar-kets can be ripe for a major rebound, as theyare often accompanied by an exhaustion ofselling pressure.
When the RSI dips below 30, then themarket is considered oversold. We’ve seenthat an oversold market can stay that way for along time, so we wait for the RSI to rise backabove the 30 mark before we call it an officialbuy signal.
Buy signals from this indicator are rare. Thelast signal was in 1974, and before that, 1942.There have only been eight signals for theDow since 1900. Figure 2 shows the Dowreturns following a signal; for comparison, italso shows typical Dow returns. The RSIcrossing above 30 does not show impressivereturns in the short term. However, the longeryou go out in time, the more impressive thereturns become. Twelve months following asignal, seven out of eight times the market waspositive and the average return was 22.82%. Ifthat average return is realized again, it wouldmean the Dow will be over 10,000 in April ofnext year.
/ / / / / / / / / / / / / / / / / / / / / / / / / / / / / / / / / / / / / / / / / / / / / / / / / / / / / / / / / / / / / / / / / / / / /
>> Rocky White Senior Quantitative Analyst, Schaef-fer's Investment Research/ / / / / / / / / / / / / / / / / / / / / / / / / / / / / / / / / / / / / / / / / / / / / / / / / / / / / / / / / / / / / / / / / / / / /
O YOU KNOW when one of your stock holdings is seeing a sudden influx of call buy-ing that warns the enthusiasm is getting overdone? Do you know which options are seeing unusu-ally heavy volume, suggesting some traders think a large move is coming? Do you know how thebig-money players are positioning themselves?
If you answered "no" to any of these questions, stop whatever you are doing and visit ournewly redesigned Options Center at SchaeffersResearch.com.Your portfolio will thank you for it.
Options data can be sliced up many different ways, but it takes tremendous resources toorganize and analyze the onslaught of data. That's why we designed our improved OptionsCenter to help you get the most out of the information that is constantly streaming in from theoptions market. And we’ve teamed up with WhatsTrading.com to provide you with additionalfresh intraday data and commentary. This adds to the existing tools and commentary on ourwebsite that tens of thousands of traders have utilized over the years.
Consider the Option Flow table. Updated throughout the day, this filter shows the percent-age of option volume crossing at the ask price, which suggests the trades may be purchases.The data is broken down by calls and puts, so you can quickly see how the crowd is betting.
Need trading ideas? Check out the Schaeffer's Daily Option Blog.This is where our team ofanalysts scours the market for the most noteworthy option activity. Like you, the big players onthe Street know that options offer not only leverage, but also a way to tailor risk. In-depthtracking of the option market can reveal the tell-tale paper trail. Every day our analysts are fol-lowing this trail and marrying the activity to the big picture for you.
For example, a recent blog entry noted a particular put strike had traded more than 3,000contracts on open interest of only 442 contracts. This indicated that the bulk of activity repre-sented new positions. Furthermore, it was pointed out that the preference for puts rancounter to the stock's recent trend. In this case, skepticism was building even though the stockwas moving higher. This is a bullish indicator to us contrarians.
Of course, this is just a sampling of what you will find in our Options Center—data, com-mentary, tools, filters, and education. It's all in one place at SchaeffersResearch.com. You canaccess all of this simply by clicking on the Options Flow Recap box located front and center onour homepage, or by clicking the Options Center tab under the Market Centers tab in themain navigation.
FIGURE 1: Our newly improved Options Center is designed to give you greateraccess to real time market information, with better tools for measuring true senti-ment directly from the option markets.
THE OPTIONSCENTERGET YOURACTIONABLEOPTION IDEAS INREAL TIME—STRAIGHT UP,WITH A TWIST.
idea #2
D
SENTiMENT_idealab_062909.layout:pages.layout 6/30/09 2:36 PM Page 31

Use the SOIR changes filter to keep an eyeon open interest levels for calls and puts,and it’s easy to see exactly which directionoptions players are moving on a particularequity. For example, a large increase in callopen interest relative to put open interestcould push a SOIR sharply lower. Thatcould indicate that expectations are high onthe equity, since investors are speculating
(via call options) that the stock will make a large advance.Conversely, a sizable increase in put open interest relativeto call open interest could send a SOIR suddenly higher,suggesting skepticism as investors speculate (via putoptions) that the stock will post a significant decline.For more on this tool, visit Joseph Hargett’s 6/4/09 column, “Schaeffer’s Tool Box.” For the tool itself, go to: sentiment.com/tools
DAILY Q&A: WHAT IS IMPLIEDVOLATILITY?What does the mar-ket think your stockwill do? The action inthe options market isas close to a crystalball as you’ll get. Pay-ing attention to thisnumber could speakvolumes aboutfuture moves, big orsmall.
—TEN DAYS TO SUC-CESSFUL OPTIONSTRADINGLearn the funda-mentals of tradingoptions and divedeeper into theconcepts that couldmake all the differ-ence—from the“moneyness” ofoptions, to specialorder types, to the importance of allocation.—To view these videosand more, go to sentiment.com/videos
MONDAY MORNING OUT-LOOK: “WAS LAST WEEK THE CALMBEFORE THE STORM AS WE ENTERTRIPLE-WITCHING JUNE EXPIRATIONWEEK? THE SPX'S LACK OF HEADWAYSINCE THE CROSS BACK ABOVE ITS200-DAY MOVING AVERAGE DOESN'TCOME AS A HUGE SURPRISE, GIVENTHE STUDY I SHARED WITH YOU LASTWEEK. OUR RESEARCH INDICATESTHAT THE AVERAGE MOVE AFTER ANSPX CROSS ABOVE ITS 200-DAY MOV-ING AVERAGE IS ONLY 0.23% DURINGTHE TWO WEEKS FOLLOWING THISSIGNAL, AND ONLY 0.25% ONEMONTH AFTER THE CROSS.”Listen to the “Monday Morning Outlook” podcast orsubscribe free at www.sentiment.com/mmo
> THE OPTION COACH:Protective Puts If driv-ing with insurance is sen-sible, investing withoutinsurance is senseless.Learn how to properlyassess the put protectionyou need to insure yourstock or portfolio.
> OPTIONS 101: The Significance ofTime Decay Have youever bought a call option,only to watch your stockgo up over time while thecall declines in value? Tobeat the clock, it’s criticalto understand time decay.
> SO YOU WANT TOTRADE OPTIONS?:Options 5 WaysWithvolatility here to stay,traders are flocking tooptions. Learn how tospeculate on markets,insure your portfolio, orsimply “rent” your stocks.
Blogs from the Pros
.COM32 www.schaeffersresearch.comISSUE No.2
Nic
k Pe
rry
Illus
trat
ion
by T
BA
+D
MUSTKNOWEDUCATIONA sampling of our best option content thatyou’ll find at SchaeffersResearch.com
commentary
A DAY IN THE LIFE: Headlines from a typical day on the Trading Floor Blog
> A 107-Point Loss for the Dow Jones Industrial Average> Advanced Micro Devices Call Volume Escalates Despite a
Breakdown in Technical Support> Call Traders Prefer Out-of-the-Money Strikes on DryShips Inc.> Put Traders Jump on Matrixx Initiatives Inc After Plunge,
FDA Letter> Midday Market Check—The Dow Jones Industrial Average
Drops 75 Points
To visit the Trading Floor, go to: sentiment.com/blog
/ / / / / / / / / / / / / / / / / / / / / / / / / / / / / / / / / / / / / / / / / / / / / / / / / / / / / / / / / / / / / / / / / / / / /
/ / / / / / / / / / / / / / / / / / / / / / / / / / / / / / / / / / / / / / / / / / / / / / / / / / / / / / / / / / / / / / / / / / / / /
/ / / / / / / / / / / / / / / / / / / / / / / / / / / / / / / / / / / / / / / / / / / / / / / / / / / / / / / / / / / / / / / / / / / / / / / / / / / / / / / / / / / / / / / / / / / / / / / / / / / / / / / / / / / / / / / / / / / / / / / / / / / / / / / / / / / / / / / / / / / / / / / / / / / / / / / / / / / / / / / / / / / / / / / / / / / / / / / / / / / / / / / / / / / / / / / / / / / / / / / / / / / / / / / / / / / / / / / / / /
/ / / / / / / / / / / / / / / / / / / / / / / / / / / / / / / / / / / / / / / / / / / / / / / / / / / / / / / / / / / / / / / / / / / / / / / / / / / / / / / / / / / / / / / / / / / / / / / / / / / / / / / / / / / / / / / / / / / / / / / / / / / / / / / / / / / / / / / / / / / / / / / / / / / / / / / / / / / / / / / / / / / / / / / / / / / / / / / / / / / / / /
Must HearPodcast
MUST SEEVIDEOCAST
MUST USE TOOL
Schaeffer’sOpenInterestRatioChangesFilter
To find articles and com-mentary at Schaeffer’s,use our Google-pow-ered “KEYWORD” search,located at the top of any page at:www.schaeffersresearch.com
/ / / / / / / / / / / / / / / / / / / / / / / / / / / / / / / / /
/ / / / / / / / / / / / / / / / / / / / / / / / / / / / / / / / /
/ / / / / / / / / / / / / / / / / / / / / / / / / / / / / / / / / / / / / / / / / / / / / / / / / / / / / / / / / / / / / / / / / / / / / / / / / / / / / / / / / / / / / / / / / / / / / / / / / / / / / /
/ / / / / / / / / / / / / / / / / / / / / / / / / / / / / / / / / / / / / / / / / / / / / / / / / / / / / / / / / / / / / / / / / / / / / / / / / / / / / / / / / / / / / / / / / / / / / / / / / / / / / /
Nick PerryThe Trading Floor Real-time tips that put you ahead of the curve
SENTiMENT_.COM_062909.layout:pages.layout 6/30/09 2:28 PM Page 32

yy
SENTiMENT_.COM_062909.layout:pages.layout 6/30/09 2:28 PM Page 33

Page Zero0 www.schaeffersresearch.comISSUE No.2
A wise Yogi once said,“When you get to thefork in the road, take it.”
Now that exchange-traded funds (ETFs) rep-resent everything underthe sun, paper tradersare donning their com-modities caps: gold, silver,energy—even platinumin Europe. I am way longon all of them.
Still, with hard assets,debate rages on abouthow to own ’em. Emper-ors and Hong Kongtycoons favor platinumwristbands. The Japaneseaccumulate gold andplatinum bars.A friendone town over has abasement full of silvercoins and 1,000-ouncesilver bars.
Here’s the curveball:as commodities of allstripes shrink in supply,exploratory miners anddrillers are starting tolook golden.Aside fromoptions and futures, min-ing stocks offer life-alter-ing returns—for goodand bad.
Actual bullion versusbullion miners? In trou-bling times, owning “thephysical” and miningstocks is what an invest-ment yogi might advise.At Mr. Berra’s fork in theroad, I present my per-sonal sentiment indica-tors.
How high or low?Premiums levied onrecently minted goldcoins are icing on thecake. More than 6% indi-cates brisk retaildemand. More than 10 to12%: bubble-trouble. SeeKitco.com, Monex.com, andGoldMoney.com
Electronic demand.Central Fund of Canada(CEF in USA and CEF.Ain Canada) is a 48-year-old repository for goldand silver. The shares area $2.2 billion closed-endfund with a premiumabove the net asset valueof its vaulted-bullion.At11% in late May, the pre-mium has gone as high as32%. See www.centralfund.com/Nav%20Form.htm
Bernie (Schaeffer)sees an Armageddontrade—absolutely not apositive sentiment sign.Investors, he says, are tooeager to pay thick premi-ums for call options onthe leading gold ETF(GLD on NYSE). Plus,folks are opening way,way out-of-the-moneycall options on January2010 GLD contracts(strike price $150). Seewww.sentiment.com/Interview.
Market Vane.The 45-year-old servicerounds up experts’ senti-ment on investmentclasses, including goldfutures. Charting afi-cionado Ian McAvity ofDeliberations newslettertells me he worries whenthe bullish consensusfrom Market Vanereaches 90%. It was about76% of surveyed goldfutures traders in May.See www.MarketVane.net
Alerts.Set a Google searchengine alert for terms“gold standard” and
Pro Pearls
THOM CALANDRA MUSES ON PRECIOUSMETALS, MINING SHARES, AND SENTIMENT
Phot
ogra
ph b
y FR
ED
RIK
BR
OD
ÉN
Schaeffer’s Investment ResearchMAIN OFFICE: 513.589.3800MAIN FAX: 513.589.3810CUSTOMER SERVICE:800.327.8833 prompt #2E-MAIL: [email protected]: 800.448.2080 prompt #4
5151 Pfeif fer Road, Suite 250Cincinnati, OH 45242www.SchaeffersResearch.com
SENTIMENT is published quarterly by Schaeffer’s Investment Research, Inc. (SIR). SIR is not a registered investment adviser. SIR relies upon the publishers exclusion from the definition of investment adviser under Section202(a)(11) of the Investment Advisers Act of 1940 and corresponding state securities laws. As such, SIR does not offer or provide personalized advice. We publish information about companies in which we believe ourreaders may be interested and this information reflects our sincere opinions. The information that we provide is not intended to be, and should not be construed in any manner whatsoever as, personalized advice. Also, theinformation provided by us should not be construed by any reader as SIR’s solicitation to effect, or attempt to effect, any transaction in a security. The information contained in SENTIMENT is not intended to be investmentadvice and is for illustrative purposes only.The investment strategies or the securities may not be suitable for you. The information provided herein has been obtained from sources believed to be reliable, but there is noguarantee of accuracy. Some of the articles and material in SENTIMENT have been written by third party authors. In such cases, their views are those of the author, but are not necessarily the views of SIR. The risk of loss intrading securities, options, futures, and forex can be substantial. Readers should consider all relevant risk factors, including their own personal financial situation, before trading. Options involve risk and are not suitable forall investors. Readers should restrict commitments to funds that can be lost without undue financial hardship. Prior to buying or selling an option, an investor should read and understand the booklet “Characteristics andRisks of Standardized Options.” You can access and download a copy of the booklet on The Options Clearing Corporations (OCC) website at www.theocc.com/publications/risks/riskchap1.jsp. This link reference is pro-vided as a courtesy and does not imply that the OCC is endorsing SIR or its products. This booklet is also available for free from your broker or from any of the U.S. options exchanges, or you can call SIR toll-free at 1-800-327-8833 and we will send one to you. Prior to buying or selling a future, an investor should read and understand the booklet “Security Futures: An Introduction to Their Use and Risks.” You can access and download a copyof the booklet at the National Futures Association website at www.nfa.futures.org/investor/security_futures/security_futures.pdf. This link reference is provided as a courtesy and does not imply that the National FuturesAssociation is endorsing SIR or its products. This booklet is also available from your broker or from any of the U.S. Futures Exchanges, or you can call SIR toll-free at 1-800-327-8833 and we will send one to you. The secu-rity portfolio of our employees, officers, affiliated companies, and third-party writers may, in some instances, include securities mentioned in this issue. No part of this material may be reproduced in whole or in part withoutexplicit permission from a duly authorized officer of SIR, except by established news media that wish to quote brief passages for purpose of review. Copyright 2009, Schaeffer’s Investment Research, Inc.
“Nixon.” Besides learn-ing about currencies,gold, and how PresidentNixon abolished thegold-dollar link, you willdiscover what econo-mists and governmentpolicy makers reallythink about currencyissuance and gold. Seewww.google.com/alerts
Stockhouse.comfeatures discussions fromCanada, a country thathosts thousands of smalland large mining compa-nies and more geologistsand mineralogists percapita than any earthnation.
SentimentMining companies gothrough more moneythan perhaps any indus-try but life sciences. Thus,they issue shares when-
ever there is bullish sen-timent. Mr. McAvity, aCanadian, has beenwarning me of “this orgyof paper issuance” sinceat least late 2003. Sincethen, physical gold hasoutpaced gains in manymining stocks. Dozens of social media outletstrack share placementsamong miners. Let yoursearch engine run free.
/
Thom Calandraof www.tickertrax.com helps his audience find valuein a haystack of investmentchoices. Thom co-foundedCBS MarketWatch and MarketWatch.com. As thevoice of Thom Calandra'sStockWatch and The Calandra Report, Thompegged $260-ounce gold as a cheap investment in 1999.
SENTiMENT_pagezero_062909.layout:pages.layout 6/30/09 2:38 PM Page 34

THE VECTORVEST APPROACH TO INVESTING.
The high profit, safety-oriented, investment tool that gives clear Buy, Sell and
Hold recommendations on more than 13,500 stocks every day. Try it for yourself.
A five week trial is just $9.95. 1-888-658-7638 www.vectorvest.com/Sentiment
VectorVest®
BEFORE YOU INVEST, CHECK VECTORVEST.
SENTiMENT_pagezero_062909.layout:pages.layout 6/30/09 2:38 PM Page 35

FX OPTIONS TRADE ALERTSGet Complimentary Options Trading Ideas on the Major Currencies
USD/EUR EUIUSD/JPY YUKUSD/GBP BPXUSD/CHF SFCUSD/CAD CDDUSD/AUD AUX
Convention ISE Symbol
Learn more about FX Options. View exchange rates, options
quotes, educational articles, and weekly webinars and podcasts.
www.ise.com/fx-sentiment ISE FX OptionsTM, Trade SmarterTM, the ISE globe logo, International Securities Exchange® and ISE are trademarks of the International Securities Exchange, LLC. Options involve risk and are not
suitable for all investors. Prior to buying or selling an option, a person must receive a copy of Characteristics and Risk of Standardized Options. Copies of the document may be obtained
from your broker or from the International Securities Exchange by calling (212) 943-2400 or by writing the Exchange at 60 Broad Street, New York, NY 10004. © 2009, International Securities
Exchange, LLC. All rights reserved.
We proudly print this magazine entirely on Forest Stewardship Council certified paper, which contains fiber from well-managed and responsibly harvested forests that meet strict environmental and socioeconomic standards.
PRSRT STDUS Postage PaidPermit #799Bolingbrook, IL
Schaeffer’s Investment ResearchMAIN OFFICE: 513.589.3800MAIN FAX: 513.589.3810CUSTOMER SERVICE: 800.327.8833 prompt #2E-MAIL: [email protected]: 800.448.2080 prompt #4
5151 Pfeiffer Road, Suite 250Cincinnati, OH 45242www.SchaeffersResearch.com
SENTIMENT.BackCover.layout:pages.layout 6/30/09 2:57 PM Page 36