the semass shred-and-burn technology: a well proven ... · the semass shred-and-burn technology: a...
TRANSCRIPT

National Waste Processing Conference Proceedings ASME 1994
THE SEMASS SHRED-AND-BURN TECHNOLOGY: A WELL PROVEN RESOURCE RECOVERY SYSTEM
ABSTRACT
JEHANGIR ZAKARIA SEMASS Partnership
Rochester, Massachusetts
The SEMASS Facility serving southeastern Massachusetts, receives municipal solid waste (MSW) by truck and by rail, and employs Shred-and-Burn technology with magnetic ferrous separation. The Facility's first two boiler lines initiated commercial operation in February 1989, processed 2000 tons per day (TPD) of MSW, and generated 52 megawatts (MW) of electricity. A third boiler line was added in 1993 to increase its capacity to 3000 TPD of MSW, generating over 80 MW of electricity. The bottom ash residues are removed from the boilers without quenching, processed in a dry state, recovering post-combustion ferrous and nonferrous metals and a Boiler Aggregate ™ product. The Aggregate is used as construction substitute material on-site and as landfill cover, while off-site beneficial use permitting activities proceed. Fly ash is conditioned and landfilled. Automobile shredder residue (ASR) and other special fuels are routinely burned. Dry, air cooled steam condensers eliminate need for cooling water; the Facility has no water discharges. The features of Shred-and-Burn concept are presented, the Facility is described, plant capacity factors and reasons for lost operating time are detailed. Design modifications implemented in the third boiler line based on the operational experience of the first two boilers are stated. Stack testing data showing performance of the spray drier absorbers with electrostatic precipitators in the first two boiler lines and with the baghouse in the new boiler are presented. The new line employs urea injection for NOx control in spite of the inherently low NOx emissions.
293
GORDON SUTIN Energy Answers Corporation
Albany, New York
INTRODUCTION
The SEMASS Project consists of the Resource Recovery Facility, two transfer stations and a landfill. The subject of this paper is the Resource Recovery Facility itself with particular reference to the Shred-and-Burn technology used. An aerial view is presented in Figure 1.
The project is owned, financed, constructed and operated privately. There are no government funds involved (except, of course, fees paid by municipalities for disposal services). The project is owned by the SEMASS Partnership of which SEMASS Corporation, a subsidiary of Energy Answers Corporation of Albany (EAC), New York is the Managing General Partner and hence manages all aspects of the project. SEMASS was developed by EAC and the construction of the first two boiler lines, called the base plant, was begun in April, 1986; commercial operation began in February, 1989. In 1991, the construction of the third boiler line, called the expansion, began and was placed in commercial operation in October, 1993.
The Resource Recovery Facility was designed and constructed by Bechtel Power of Gaithersburg, Maryland with certain additional design functions being provided by Smith and Mahoney, Consulting Engineers of Albany, New York. The facilities include several patented devices which are proprietary to EAC.
Including certain ancillary facilities such as the ash processing plant and the vehicle maintenance shop, the capital costs for the base plant were $ 150 million. The expansion capital costs were $100 million. Financing is by means of a combination of tax free Industrial Development Bonds
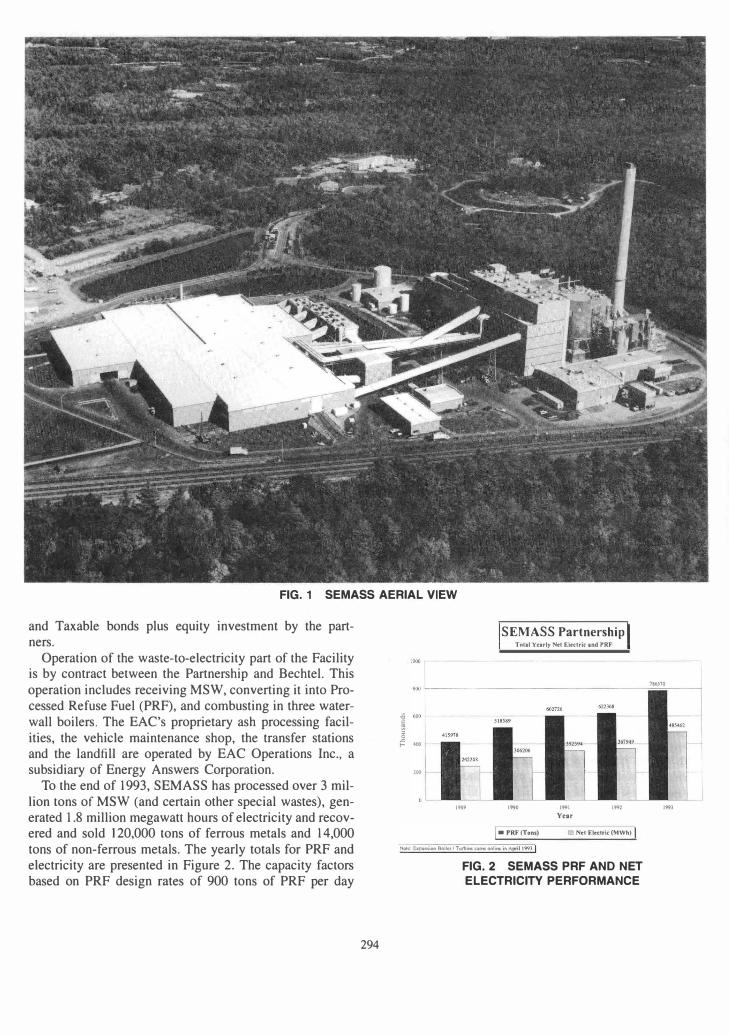
FIG. 1 SEMASS AERIAL VIEW
and Taxable bonds plus equity investment by the partners.
SEMASS Partnership Tolal Yearly Net EI�ctric: and PRF
Operation of the waste-to-electricity part of the Facility is by contract between the Partnership and Bechtel. This operation includes receiving MSW, converting it into Processed Refuse Fuel (PRF), and combusting in three waterwall boilers. The EAC's proprietary ash processing facilities, the vehicle maintenance shop, the transfer stations and the landfill are operated by EAC Operations Inc., a subsidiary of Energy Answers Corporation.
' � rl -------- ------ --------------------�
To the end of 1993, SEMASS has processed over 3 million tons of MSW (and certain other special wastes), generated 1.8 million megawatt hours of electricity and recovered and sold 120,000 tons of ferrous metals and 14,000 tons of non-ferrous metals. The yearly totals for PRF and electricity are presented in Figure 2. The capacity factors based on PRF design rates of 900 tons of PRF per day
294
,OO�
-g 600 f--� I ,g ... .00
100
1989 '990 ,,., Year
".,
• PRF(Tons) Cl Net Electric (MWh)
NOlI:.. ExpanllOfl 80lkrI Tlirtoll'oC came: onlmc In .... prlll99).1 FIG. 2 SEMASS PRF AND NET ELECTRICITY PERFORMANCE
786570
'09)
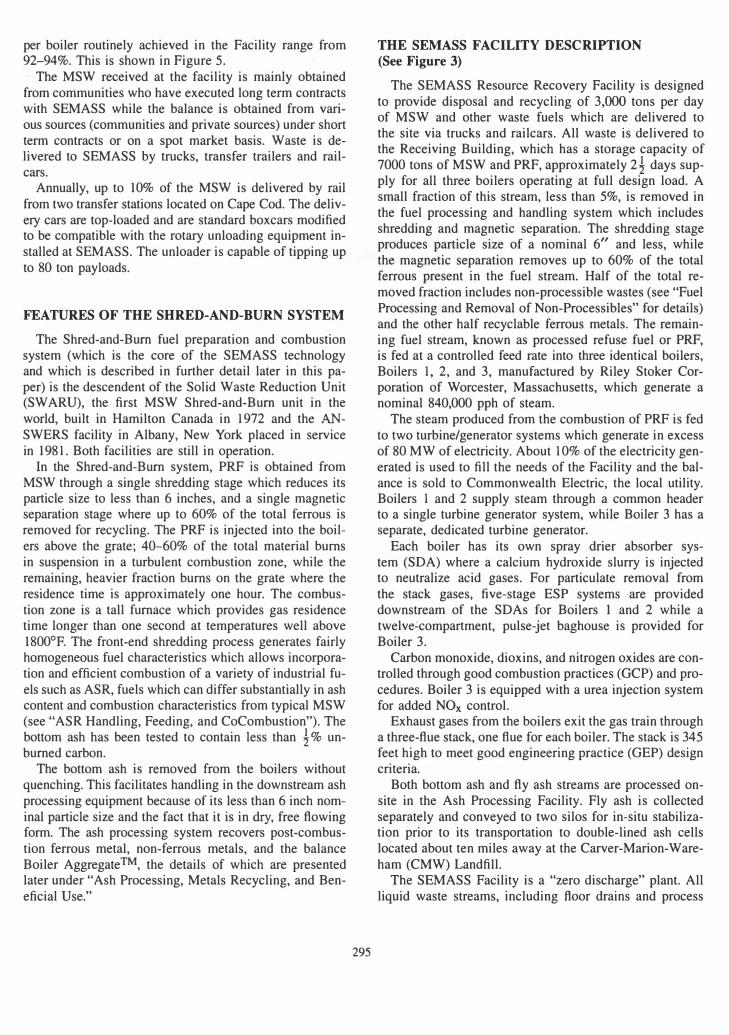
per boiler routinely achieved in the Facility range from 92-94%. This is shown in Figure 5.
The MSW received at the facility is mainly obtained from communities who have executed long term contracts with SEMASS while the balance is obtained from various sources (communities and private sources) under short term contracts or on a spot market basis. Waste is delivered to SEMASS by trucks, transfer trailers and railcars.
Annually, up to 10% of the MSW is delivered by rail from two transfer stations located on Cape Cod. The delivery cars are top-loaded and are standard boxcars modified to be compatible with the rotary unloading equipment installed at SEMASS. The unloader is capable of tipping up to 80 ton payloads.
FEATURES OF THE SHRED-AND-BURN SYSTEM
The Shred-and-Burn fuel preparation and combustion system (which is the core of the SEMASS technology and which is described in further detail later in this paper) is the descendent of the Solid Waste Reduction Unit (SWARU), the first MSW Shred-and-Burn unit in the world, built in Hamilton Canada in 1972 and the ANSWERS facility in Albany, New York placed in service in 1981. Both facilities are still in operation.
In the Shred-and-Burn system, PRF is obtained from MSW through a single shredding stage which reduces its particle size to less than 6 inches, and a single magnetic separation stage where up to 60% of the total ferrous is removed for recycling. The PRF is injected into the boilers above the grate; 40-60% of the total material bums in suspension in a turbulent combustion zone, while the remaining, heavier fraction bums on the grate where the residence time is approximately one hour. The combustion zone is a tall furnace which provides gas residence time longer than one second at temperatures well above 1800°F. The front-end shredding process generates fairly homogeneous fuel characteristics which allows incorporation and efficient combustion of a variety of industrial fuels such as ASR, fuels which can differ substantially in ash content and combustion characteristics from typical MSW (see "ASR Handling, Feeding, and CoCombustion"). The bottom ash has been tested to contain less than i % unburned carbon.
The bottom ash is removed from the boilers without quenching. This facilitates handling in the downstream ash processing equipment because of its less than 6 inch nominal particle size and the fact that it is in dry, free flowing form. The ash processing system recovers post-combustion ferrous metal, non-ferrous metals, and the balance Boiler Aggregate™, the details of which are presented later under "Ash Processing, Metals Recycling, and Beneficial Use."
295
THE SEMASS FACILITY DESCRIPTION (See Figure 3)
The SEMASS Resource Recovery Facility is designed to provide disposal and recycling of 3,000 tons per day of MSW and other waste fuels which are delivered to the site via trucks and railcars. All waste is delivered to the Rece.iving Building, which has a storage capacity of 7000 tons of MSW and PRF, approximately 2i days supply for all three boilers operating at full design load. A small fraction of this stream, less than 5%, is removed in the fuel processing and handling system which includes shredding and magnetic separation. The shredding stage produces particle size of a nominal 6" and less, while the magnetic separation removes up to 60% of the total ferrous present in the fuel stream. Half of the total removed fraction includes non-processible wastes (see "Fuel Processing and Removal of Non-Processibles" for details) and the other half recyclable ferrous metals. The remaining fuel stream, known as processed refuse fuel or PRF, is fed at a controlled feed rate into three identical boilers, Boilers 1, 2, and 3, manufactured by Riley Stoker Corporation of Worcester, Massachusetts, which generate a nominal 840,000 pph of steam.
The steam produced from the combustion of PRF is fed to two turbine/generator systems which generate in excess of 80 MW of electricity. About 10% of the electricity generated is used to fill the needs of the Facility and the balance is sold to Commonwealth Electric, the local utility. Boilers 1 and 2 supply steam through a common header to a single turbine generator system, while Boiler 3 has a separate, dedicated turbine generator.
Each boiler has its own spray drier absorber system (SDA) where a calcium hydroxide slurry is injected to neutralize acid gases. For particulate removal from the stack gases, five-stage ESP systems are provided downstream of the SDAs for Boilers 1 and 2 while a twelve-compartment, pulse-jet baghouse is provided for Boiler 3.
Carbon monoxide, dioxins, and nitrogen oxides are controlled through good combustion practices (GCP) and procedures. Boiler 3 is equipped with a urea injection system for added NOx control.
Exhaust gases from the boilers exit the gas train through a three-flue stack, one flue for each boiler. The stack is 345 feet high to meet good engineering practice (GEP) design criteria.
Both bottom ash and fly ash streams are processed onsite in the Ash Processing Facility. Fly ash is collected separately and conveyed to two silos for in-situ stabilization prior to its transportation to double-lined ash cells located about ten miles away at the Carver-Marion-Wareham (CMW) Landfill.
The SEMASS Facility is a "zero discharge" plant. All liquid waste streams, including floor drains and process

[1. � "
6.:!��I�=��h.,�a turbine. which driYeS the ,enenlor for production of electricity. The llr cooled condenser converts the steam back into water for re·use in the boilers .
1. �e�i::::lb��:I1��
en
iS
truw, transfer tra.llersand raJl can to the tippin, noor. Here, the wute is Insptded and bulky and rec}'CLl.ble materials an: removed.
2. ��f:t��� f=�:! �to
conveyors which feed hammtrmill shredders. Waste is shredded to 6 inches or less. then passed under magnets which remove about two-thirds of ferrous (iron bearing) metals for· recycling.
• Boiler #J is providC'd with a B .. ghousC' for particulatC' control.
4. �I�-d�!:; �!�rs. Light materials bum in suspen· sion. while heavy portions of the fuel are burned on a trn· eling grate below. Excess PRf is returned to the tipping tloor for bier use.
3. ��a����:��d
p:::S,!:� Refuse Fuel (PRF). A ton of PRF has a heating value equal to 72 gallons of fuel oil or about one·third ton of (oal.
BOTTOM ASH
5. :����� li�eb
��:�� ��=����: � theash processlllgf�cililywhere it is ............. I proces�d into three components: ferrous
__ ' (iron bt:�ring) nldals. non·fen-ous md�1s (aluminum. copptr. brass. elc.). and a • gravel. like material known a.s Boiler
, Aggregate TIl, TIre met�Js ue recycled , r . through scrap culers. while the Boiler
• . .� • .;.... . . � """: Aggregate'" is llsable as fill material or a light·weight agl�regate for concrete and �sphalt produch.
FIG. 3 PROCESS SCHEMATIC
blowdowns, are channelled to a central Waste Water Treatment Plant where the water is treated and stored for recycling into the process and for fire fighting. The plant includes dry air-cooled-condenser (ACC) systems which not only save in excess of 1,500,000 GPO of water resources, but also eliminate environmental plume impacts associated with wet, evaporative type cooling towers.
�:':_Ib'a '.0(1'·." .. l.oau,o ••
Facility odor emissions are minimized by withdrawing the combustion air for the three boilers from the Receiving Building where the waste fuel is received and stored. The air system is designed to create a negative draft in the building, thereby minimizing the release of odors into the atmosphere.
..-17"::--""'"
7 Combustion g.u.es are • pused through a dry
CLE-'N EMISSIONS scrubber where they are sprayed with a lime reagent 10 remoYe acid·g.u constituents. Casel art thtn pused through electTosu.tic precipit�lors to capture particulate..Contin· UOUI emiuions monitorin., in the ltack records levels of regulated compounds in the flue gas.
8 Fly ash, which is made up • of the fine plrticies reo
moved by the sophistic.alt:d air pollution (onlrol sYSIt:m. is collected seplrately from the bottom ash, subiliud and landtilled. Exptrimental work is in progress to develop a use for this m�teriaJ as well.
·"".lb.�.""""_I._ .... .. _.II •. ea4,,",,"""_._"""I_.
FIG. 4 FUEL PROCESSING AND FEED SCHEMATIC MSW PROCESSING; MAKING PRF (See Figure 4)
The following describes the procedures used for the receipt of waste:
Truck traffic is directed to a suitable location on the tipping floor inside the Receiving Building by the assigned utility operators. Front-end loaders are used to move the waste piles on the floor and for feeding into the four processing lines.
During the waste unloading from the trucks or railcars, the utility operators and the loader operators visually inspect the loads. Identified non-processible materials are segregated either manually or by the loader operator. The
296
segregated material piles are periodically loaded into trailers for off-site transportation.
Hand-held combustible gas detectors are used to identify and remove potentially explosive items. Hand-held radiation detectors are used to identify and remove radioactive material.
A more rigorous inspection is conducted at the Inspection Stations provided at each of the four process feed lines consisting of apron pan type of conveyors on which

the waste burden depth is low and lends itself to better scrutiny. Two utility operators assigned at each inspection station remove non-processibles from the waste stream and load the materials into parked trailers.
The non-processibles include construction and demolition, large bulky items, extremely odorous material, lead acid batteries, white goods, yard waste, and hazardous waste.
Each processing conveyor line is followed by a singlestage horizontal hammermill type shredder. Of these, three of the shredders, Shredder A, B, and C, discharge onto a common belt-type conveyor (Conveyor 12A) which transports the shredded material to a two-stage overhead electromagnet for pre-combustion ferrous removal (Magnet A). A standby magnet is provided (Magnet B). The fourth shredder, Shredder D, discharges material onto a separate belt conveyor (Conveyor 12B) which transports shredded fuel to another magnet (Magnet C or standby Magnet D) which is also a two-stage electromagnet. The processing system design includes the capability of Shredder C to discharge onto conveyor 12B if necessary. Each shredder is designed to process up to 110 TPH of waste. At full load, each boiler consumes 35 to 42 tons of PRF per hour.
Prepared fuel from the Magnets A or B is transported by a belt conveyor directly to the Boilers 1 and 2 feed system located adjacent to the boilers (Boiler 3 feeding is described later). This system is designed to draw the desired feed rate of PRF from the main stream as dictated by the steam load set-point. The feed system is always overfed with PRF so that ample fuel surge inventory is available adjacent to the boilers to minimize time lags in feed rate control. Typically, Boilers 1 and 2 are overfed by 50%, and with the boilers operating at full load, about 40 TPH PRF overflows in the feed system (details are presented later), and is returned by belt conveyors to a dedicated PRF storage area in the Receiving Building. When sufficient PRF inventory is accumulated in the storage area or when the processing lines (shredders and/or magnets) are not available or when all the available MSW has been processed into PRF, the PRF is then fed directly to Boilers 1 and 2 on a system which bypasses the shredding and the magnetic separation stages.
The feeding schematic for Boiler 3 is slightly different. The prepared fuel from Magnets C or D is delivered directly into the PRF storage area. From here it is fed through a series of conveyors to the Boiler 3 feed system which is similar to Boilers 1 and 2. The surplus PRF is returned to the PRF storage area along with the return from Boilers I and 2.
Normally, two shredders are operated on an average of 12-14 hours per day to sustain three boilers for a 24 hour period. One shredder is kept on standby while the fourth is scheduled for maintenance such as hammer rotation, liner replacement, etc.
The processing line redundancies described above en-
297
TABLE I PLANT AVAILABILITIES Boilers #1 & #2 Lost Boiler Hours 1991, 1992, & 1993
1991 Lost: Time Distribution 1992 Loa 11m. DiItribWoa 1991 lois Tau Diltributloa CIIe:orv DllcriDtlon "oun S .... _ " ..... ......... H .... -
Schtduled InconcVUT/Othtr )15.0 IlUI 507.1 1315.3 111.0 .... 0 Weekly Mlintenance 25).0 52.4% 1'0.0 6U% '41.0 51.9% BolierWuh 349.11 SIU 44),' Yearly Maintenance 31$.0 226.0 136.5
Forced FeedSYSltm 121.7 829.9 40.9 621.9 13.0 603.7 0 ... , 24 •. 1 )H)% 216.0 29.!i% ]07.7 39.)% _Loak 369.6 329.5 IllI MlscelJaneow Trip. 8...0 )$.S 19.2 Bonom Ash System '.S '.0 0.0
EquipmentIFuci BlCli:Preslutt 93.1 250.1 n.7 112.6 S .• 24Ji Opacity 32.6 10.6% 16.3 5.l% '.2 L6" Wet Fuel '.0 12.6 ... Fuel Supply 121.4 45.0 , ..
Fon:eMajeure StonnRelated .7.0 4'.0 '.0 ..• 2.0 �. 2.'" 0.'" 0,1"
T .... 2)69 .• 2369.' 2129.' 2119 .• IUU 15}4.l p"""" 100.0% 100.0% 100.0%
YwEndin Dec.)1 '''' "" '''' SeptcmberJO.I99)
PRF cap.city Lost 1.)% U% 7.7% Boile:rAvailabilty 90.31% 19.57% 90.21% FeedSyste:mAv.ilabilty 97.16% 91.97% 98.21% PwnAvailabiity 17.90% lum 11.41%
NOles: Boiler availability is based on scheduled lost hours due to Inconel, boiler wash, and yearly maintenance, and forced lost hours due to grate, tube leaks, and bottom ash conveyor problems. Feed system availability is calculated using the combined lost hours of preventive maintenance and feed system problems. Plant availability includes force majeure in addition to the hours assigned to the boiler and feed systems.
sure 98-99% availability of the fuel processing system, see Table I.
At SEMASS, considerable emphasis is placed upon floor waste inventory management. The "waste dynamics" on the floor are monitored to shred all of the incoming raw waste within a day from arrival to minimize odors because after shredding, MSW loses its strong odor. PRF smells more like wet leaves. Monday mornings are targeted to end up with little or no fuel inventories on the floor.
ASR HANDLING, FEEDING, AND CO-COMBUSTION
Currently the Facility is permitted for co-combustion up to 10% by weight ASR. This limitation is based on the availability of ASR at the time the permitting tests were conducted. Based on the current agreements in place ASR comprises 2-5%, or 60 to ISO TPD, of the waste stream arriving at SEMASS. After the completion of the testing and permitting processes, regular disposal of ASR at SEMASS was initiated in July 1991.
ASR is received at the Facility in dedicated trucks along with the other truck deliveries. ASR and MSW piles are stored in segregated piles on the tipping floor of the Receiving Building. Batches of mixed MSW/ASR piles are prepared by loader operators using loader buckets to gage the materials in approximate weight fractions of less than 10% ASR. The fuel preparation system effectively generates a homogeneous fuel blend containing ASR with particle sizes of less than 6 inches. The resulting fuel is compatible with the waste handling and feeding equipment.
SEMASS experienced bridging and plugging problems in the conveying systems during the initial phases of the testing with ASR when ASR weights higher than about 40% were fed. These problems occurred at the transfer
chutes and in the feed system but the bridging in the feed system was more severe. However, at lower weight fractions the mechanical action of the system resulted in enhancing the mixing.
Large clinkers can form on the boiler grates even without ASR but this is more likely to happen when ASR mixing in the front end processing system is inadequate. Large clinkers can jam the bottom ash removal system and cause damage to conveying belts. The combustion air controls allow the operators to adjust the stoker air in case a clinker starts to form on the grate. Under these circumstances increasing the stoker air slightly, along with close attention to front end mixing, solves the problem.
ASR has been obtained at SEMASS from three Massachusetts and one Rhode Island generator under short term agreements. Most generators employ shredding, metals recovery, air classification, and screening equipment, with the lighter, metals free residue constituting ASR. Contaminants in the generators' ASR such as large chunks of metal are not acceptable at SEMASS. Efforts are made to segregate these before processing.
To the end of 1993, SEMASS has processed 40,000 tons of ASR. To date the effect of firing ASR on equipment erosion/corrosion, stack emissions, and ash compositions has not been discernable. The results of stack emissions and bottom and fly ash compositions in comparison to the baseline data, i.e., prior to the ASR co-combustion periods, will be presented elsewhere [1].
Studies to evaluate long term implications of ASR fuel blends are on-going at SEMASS.
BOILER FEED SYSTEM
PRF from the fuel preparation and handling system is conveyed to a vibrating surge bin which gravity-feeds the charge onto a vibrating feeder. Two surge bins are provided for each vibrating feeder for redundancy. One surge bin is operational at a time, see Figure lO. Five such feeders (two surge bins, one vibrating feeder, one feed chute) are provided in parallel in each boiler, all feeding through the front wall of the boiler and at the same elevation.
The vibrating feeder serves as the final PRF feed rate control element.
Each feeder discharges the material into a gravity-feed chute which introduces the fuel into the boilers at an elevation approximately 7 feet above the grate. At the interface of the feed chutes and the boiler wall distribution air is introduced to uniformly distribute the fuel in the combustion zone and across the grate.
COMBUSTION AIR SYSTEM
Combustion air is supplied through a forced draft (FD) fan provided for each boiler. This air is drawn from the Re-
298
ceiving Building through a ducting system for controlling odor emissions from that building. Combustion air exiting the air pre-heater is introduced into the boilers through the stoker and through two levels of over-fire air ports located in the front and rear walls of the boiler. The over-fire air is injected at high velocities to create turbulence through the provision of an over-fire air fan which operates in series with the FD fan. The air distribution is controlled through the provision of control dampers on each of the four overfire air headers.
The boilers are typically operated at 80-90% excess air rates.
TRAVELING GRATE STOKER
The traveling grate is a moving chain/grate surface assembly supported by a framework of steel side frames and structural steel cross members (see Figure 11).
A uniform, 6" to 8" ash bed depth is maintained on the grate by adjusting the distribution air noted above, the grate speed, and the boiler PRF feeder rates by biasing some feeders over the others. Uniform bed of ash is very important because it ensures uniform distribution of stoker air across the grate which enhances combustion.
NOxCONTROL
Boiler 3 is provided with a urea-based NOx control system or SNCR. The base line NOx produced in the SEMASS boilers is low, at about 200 ppm corrected, therefore low urea flow rates, only 10-20 GPH, are required to maintain emissions below the permitted 180 ppm levels. A total of four urea injection headers are provided with each header consisting of four air-atomized injection nozzles. The headers are stationed at two different elevations which were previously determined through tests, in the front and rear walls of the boiler. This versatility allows adjustments in urea injection levels which may be required as a result of varying furnace temperature profiles for optimal NOx control. These studies are on-going at SEMASS.
CONTINUOUS EMISSION MONITORING SYSTEM (CEMs)
Boilers 1 and 2 are provided with a dilution-probe system which draws a 50: 1 dilution sample for the on-line analysis in the plant CEMs. Dedicated S02 monitors for controlling acid gases are provided for each boiler in the stack. Single CO and NOx monitors are provided which are used on a time-shared basis for both the boilers. Each boiler has it's own opacity monitor. Time-shared C02 monitors are provided to obtain dry corrected ppm values at 12% C02.
Boiler 3 is provided with a separate CEMs which uti-

MSW, PRF & Net Electric Capacity Factors Boilers /'1 Ind N2
110%
100''''
t-I.l'H. 9).1'10� 9U%� 91.)�'L.�
:--·i Q. ".. U o 11.1"
, ... ,,7'.'"
,........ � &o-AI 0.
70''''
(j)"'6)J� 604N
60" - - '--1989 1990
I_MSW
I--
I--
'-- '--1991
Year
o PRF
I-- -;. - I--
f-- I--
'-- � '--1992
_NelElectric I MSW -Net MSW I (l6S DayllYtv' 1100 Ton�ay • tOOl WIlSk: Removed Allowance)
PRY-Net PRF I (36S Day.rYear· 1800 TOMfDay). Net Electric-Net MWhI()6S 1) tal' ]026 MWhID.y)
FIG.5 PLANT CAPACITY FACTORS
'--199'
.. '" ,---
l-
� I
I-
LJ
lizes a direct-extraction gas sample. Because this boiler is equipped with a urea injection system for added NOx control, stack NH3 monitoring is performed to minimize NH3 slip. The CEMs readings are reduced on a 7% 02 correction basis on this boiler.
PLANT CAPACITY FACTORS
Figure 5 shows annual capacity factors for MSW (which includes ASR and other special fuels), PRF and net electrical generation. The numbers are presented for Boilers 1 and 2 only, because a complete year of normal commercial operation of Boiler 3 has not been achieved at the time of this writing.
The MSW capacity factor is based on converting 28 17 TPD of MSW into 2700 TPD of PRF at the Facility. At this annual average rate the capacity factor for both MSW and PRF will be 100%.
The MSW capacity factors for 1992 and 1993 were 94 and 92% respectively. The difference is attributable to variations in forced outages which were incurred at a slightly higher rate in 1993. The PRF capacity factors for 1992 and 1993 were 95 and 93%.
The capacity factors for electricity are based on 64. 125 MW of net electricity as 100%. This is derived from the original design basis of 570 kWhr of net electricity per ton of PRF burned in the boilers. Because of the builtin conservative design margins, net kWhr/ton numbers of 580 were realized in the first year of operation of the plant, in 1989. Later, efforts in plant performance improvements resulted in increasing kWhr/ton to 620 on a yearly average basis. That is why the electricity capacity factors as seen in Figure 5 are generally higher than the PRF factors. The electrical factor has reached the 100% mark in 1993. The plant performance improvements mainly included lowering of the excess air rates and locating and minimizing air in-leakages which improved the boiler thermal efficien-
299
cies, and increasing the power cycle efficiency by increasing the ACC capacity and employing ACC wash techniques (see also "Causes of Lost Capacity - Back Pressure") .
CAUSES OF LOST CAPACITY
Table I presents a summary of the lost boiler availability for the last three years of plant operation. The data from this table is plotted in a pie chart form for the latest year 1993 in Figures 6 and 7.
The overall lost time is divided into four major categories. A helpful, brief description of these in terms of their associated sub-categories follows.
Scheduled
Inconel/UT/Other. "Inconel" represents outages for inconel weld overlaying on thinning water wall tubes for corrosion protection. "UT" (ultrasonic thickness) outages are scheduled for waterwall thickness measurements which are then used for the determination of the Inconel scope. The "Other" category includes work performed in parallel with the Inconel outage such as boiler wash and SDA repairs.
Weekly Maintenance. Includes routine maintenance tasks such as major conveyor, SDA and stoker system inspections and cleaning. This function is generally scheduled at four to six hours every other week.
Boiler Wash. A boiler wash is typically scheduled once every three months with an average wash duration of 72 hours. A wash is required when the pressure drop across the steam generating bank resulting from excessive ash build-up exceeds a prescribed limit. Various studies and tests are on-going to increase the duration between boiler washes.
Yearly Maintenance. This primarily consists of major turbine/generator and other major electrical equipment related outages.
Forced
Feed System. Represents jams in the feed system due to bridging or plug formation resulting from stringy material present in the feed. It also includes mechanical failure of drag chains which are a component of the feed system. This category contributes about 5%, to the overall lost boiler hours.
Grate. One of the major contributors to forced outages mainly represents mechanical failures of the chain system which is subjected to excessive stresses when molten

FACTORS CONTRIBUTING TO 7.7% CAPACITY LOSS 1993 Through September 30, 1993
Notes:
Scheduled downtime includes yearly and weekly maintenance, Inconel, and boiler wash outages. Forced includes grate, tube leaks, reed system, and miscellaneous trips. EquipmenrlFuel includes back pressure and opacity related capacity limitations.
FIG. 6 BOILERS 1 AND 2 DOWNTIME DISTRIBUTION FOR MAJOR CATEGORIES
FACTORS CONTRIBUTING TO 7.7% CAPACITY LOSS For 1993 Base Plant Through September 30, 1993
( 1 1 9"A» Inco�VUTlOlher
Notes:
InconeVUTIOther includes substantial miscellaneous boiler, SDA, conveyor, and Expansion tie ill work. Yearly Maintenance includes one turbine outage and one boiler wash.
FIG. 7 BOILERS 1 AND 2 DOWNTIME DISTRIBUTION FOR SUB-CATEGORIES
metal freezes and becomes caught between the chain links and the sprockets.
Thbe Leaks. Past tube failures have typically occurred in the steam generating bank primarily because of erosion attributed to the soot blower steam jets. Numerous measures to reduce these failures have resulted in decreased downtimes for this category in 1993 as compared to the previous years. These measures include installation of tube shields, modification to "indexing type" soot blowers whereby the steam jets do not always impact the same area of the tube, and adjustment of soot blower steam pressures.
300
Miscellaneous Trips. These include boiler drum level trips which could result from excessive feed related transients, and turbine/generator protective relay related trips.
Bottom Ash System. Lost time resulting from jams in the bottom ash removal system, usually due to large clinker formation. Time loss related to this category is insignificant.
Equipment/Fuel
Back Pressure. Back pressure refers to the turbine back pressure which increases above the design 3.5" of mercury as the ambient temperatures rise above the ACC system reference design temperature of 60°F in the summer season. This is accompanied by a loss in power generation for a given throttle steam flow rate. At temperatures above about 85°F the PRF feed rate must manually be reduced, in accordance with the standard operating procedures (SOPs), to prevent the turbines from tripping at high back pressures approaching 10". The corresponding loss in PRF throughput is estimated, with 40 tons representing one boiler hour. Improvements in condenser cooling capacities have resulted in substantially lower lost hours for this category in 1993 compared to the previous years. These included the employment of a high pressure water wash rig to minimize fouling through washes performed at least once a year, increasing the fan speeds by utilizing the built-in capacity margin of the fan motors, and performing fan blade re-pitching to obtain optimum power consumption vs. air flow duty.
Opacity. The boiler loads are manually reduced, in accordance with the SOPs, whenever the stack opacities increase above a prescribed limit continuously for a certain period of time.
Wet Fuel. Excessively wet fuel received at the Facility following heavy rains can sometimes cause jams in the feed system resulting in lost boiler hours.
Force Majeure
Storm Related. Includes outages caused by hurricanes and lightning which could result in ground faults at either on-site or off-site locations. The turbine/generator protective relay scheme and its integration with the remote utility's circuit is continuously being upgraded to minimize this category. The noticeable lost hours of 1991 were due to the hurricane Bob in August of that year.
Table I also presents availabilities for the following categories: Boiler, Feed System, and the overall Plant. These availabilities are calculated from the data of the Table with a suitable allocation of the lost boiler hours to these categories.

In summary, the most time consuming causes of scheduled boiler downtime are washes, inconel installation, yearly maintenance procedures and weekly maintenance procedures.
The most common forced outages are due to tube leaks and grate failures.
Concerted efforts are made by the plant operators to continuously maximize capacity factors by closely monitoring the downtime causes, and implementing appropriate preventative and predictive maintenance programs.
DESIGN MODIFICATIONS INCORPORATED IN THE THIRD BOILER LINE
Numerous design modifications were incorporated in the third boiler line based on lessons learned from the first two. Some of the changes had been implemented and improvised on the base units. Changes worth noting are stated below.
Stoker System
Grate seals that minimize stoker air bypass were upgraded to a new design to obtain better seals and better air distribution to reduce CO emissions and increase combustion efficiency.
Zone dampers which allow air to be preferentially distributed in the front and rear sections of the stoker were eliminated because these were causing grate jams because of the specific design employed at SEMASS.
Added doors to facilitate accessibility for maintenance. Braced stoker frame to prevent bowing. Installed removable wear plates in the PRF feed chutes.
Thbe Walls
Increased the tube thickness from 165 mils to 180 mils to provide higher corrosion allowance.
Eliminated refractory filling around the over-fire air ports to prevent slag formation resembling "stalactites" which could fall in large chunks on the grate causing damage and system jams.
Generating Bank
The clearance between the front (hot side) five rows of tubes was increased from 1.75 to 2.5 inches to reduce plugging.
Soot blowers inside the generating bank were changed from rotary types in which the lance jets impacted the same tube areas causing tube failures to "indexing," retracting-type blowers. The indexing feature allows the steam jets to be staggered each time the blower operates.
301
Furnace
Corner view ports at two different elevations were added to provide a wide angle visual understanding of the flame zone, fuel distribution and carryover.
Combustion Air
Remotely operated over-fire air dampers were provided to allow operators to have better control of combustion, especially when fuels such as ASR are fired.
Steam-coil air-preheaters were eliminated because it was envisioned that dusty air drawn from the Receiving Building for odor control could cause system fouling and plugging.
Electrical
An electrical cross-connect between the base and the expansion generator circuit has been designed and is awaiting installation. This feature will allow one system to be started from the other without incurring expensive "demand charges" which are applicable to the Facility.
Air Cooled Condenser
Economic feasibility analyses were performed and sufficient design margin was provided in the new ACC to minimize ambient temperature-related limitations to power generation.
ST ACK EMISSION RESULTS
The initial stack compliance tests were conducted on both Boilers 1 and 2 in March/April of 1989. Thereafter, every nine months stack tests on one of these two Boilers (alternating each time) are conducted in accordance with the Massachusetts General Laws, Chapter 21H, Section 5. To date, six such nine monthly tests have been conducted, three on each boiler. The results for these tests are presented in Table II. The data units and the permit limits appearing in second and third columns are as they appear in the applicable Air Quality Permit, Massachusetts Conditional Approval dated June 21, 1990, pursuant to 310 CMR 7.02.
For Boiler 3 the initial compliance tests were conducted in October 1993. The results are presented in Table III. The permit limits presented are the most stringent of the NSPS (40CFR 60 Subpart Ea) and the Massachusetts Conditional Approval referenced above.
At the risk that only one data point for Boiler 3 emissions is available at this time, a comparison of the permitted emissions from this boiler with the arithmetic average of the available data points presented in Table II for Boil-

TABLE II SEMASS STACK COMPLIANCE TEST RESULTS (BOILERS 1 AND 2)
NOIflI:
The 2,3,7,1 TCOO Iqul¥alenll. c"cul.�1n accadanci 'II'Ith!tle M.....ch ..... n.gukHIllne •• d ... dS.ptltmblrZO, 1915. andrnlMd Mwe/'l2e, 'HI,
The d60a1n ambient Impect II C*,",I •• d on 1M baM of !IIt .. t Ime-kJn1 from both 1M bohn..
The me. PCOOIPCOf lor Bot. 2, M.ch ''',.'' obIaln,d by _.gIng two of 11'1. th'N ..... COI'IOUcttd. The �d ... � of 1M nglctlctn " .. contld«"ltd .... outlier and OCCUtllKl dUllng planl upMI condlllona.
T .... pet'mllllm"* WId 1M co" .. pondlngunlll .... OO1IIMdfl'om 1hti SEMASSNr Qullllty Permlnt, ..... -=tIuM. Concllllon.rAppnwe!, dlledJuM2t, 19tO, purauMtkJ 310CMR 1.012.
Notes:
TABLE III SEMASS STACK COMPLIANCE TEST RESULTS (BOILER 3)
PARAMETEA
The 2.3.7,8 reDO equivalent is calculated in accordance with the Masssachusetts gutdelines dated September 20. 1985. and revised March 29. 1989.
The dioxin ambient impact is calculated on the basis of latest emissions from the three boilers.
The permit limits and the corresponding units are represent the most stringent of the SEMASS Air Quality Permit, Conditional Approval. dated June 21. 1990. pursuantlo 310 CMA 7.02, and the NSPS. pursuant to 40 CFA 60. Subpan Ea.
ers 1 and 2 will be interesting. Note that Boilers 1 and 2 are provided with ESP systems and no SNCR for NOx while Boiler 3 has a baghouse instead of the ESPs plus a urea based SNCR. This comparison is presented in Table IV. Consistent units were obtained for this table through conversions using standard procedures.
302
. � If.,no
"OIdI
Rec:eM •• 9"Udl".
. I .... p«doa
StadoD.
Sbreddlill .
IMapede: Sep.,.do.
... U .. DD "' ..
=-c....-�. :�u;�e" �:;":" .... .. DO I'f.I,,-, ,"4'"
'.,.DI'alor IOu.n. ••• n lIubt!fto atr.,..I •• ed..., S""o_. oI •• a'orlodtn 'l,n6n. na.lUllMi'awlUa....,.&M ......... =o'!!:��lJu,J,wtok .. c ....... u.... .. "'rUl .. J,
1.1 Cec_.-t .... D .. fCXD) ... _ .. ...,· ..... _ofr-.cateM .. ....,..
FIG. 8 PLANT MATERIAL BALANCE
... '"
ASH PROCESSING, METALS RECYCLING, AND BENEFICIAL USE
The processing schemes for fly ash and bottom ash are described below while the corresponding material balance along with the pertinent pre-combustion operational data is presented in Figure 8.
Fly Ash Stabilization
The SEMASS's proprietary fly ash stabilization process [2] locks up heavy metals in the processed stream such that the Toxicity Characteristics Leaching Procedure (TCLPs) results for all heavy metals present in ash are well below the regulatory limits (CFR Vol. 5, No. 126, June 29, 1990), including metals that are critical in Municipal Waste Combustor (MWC) ash such as lead and
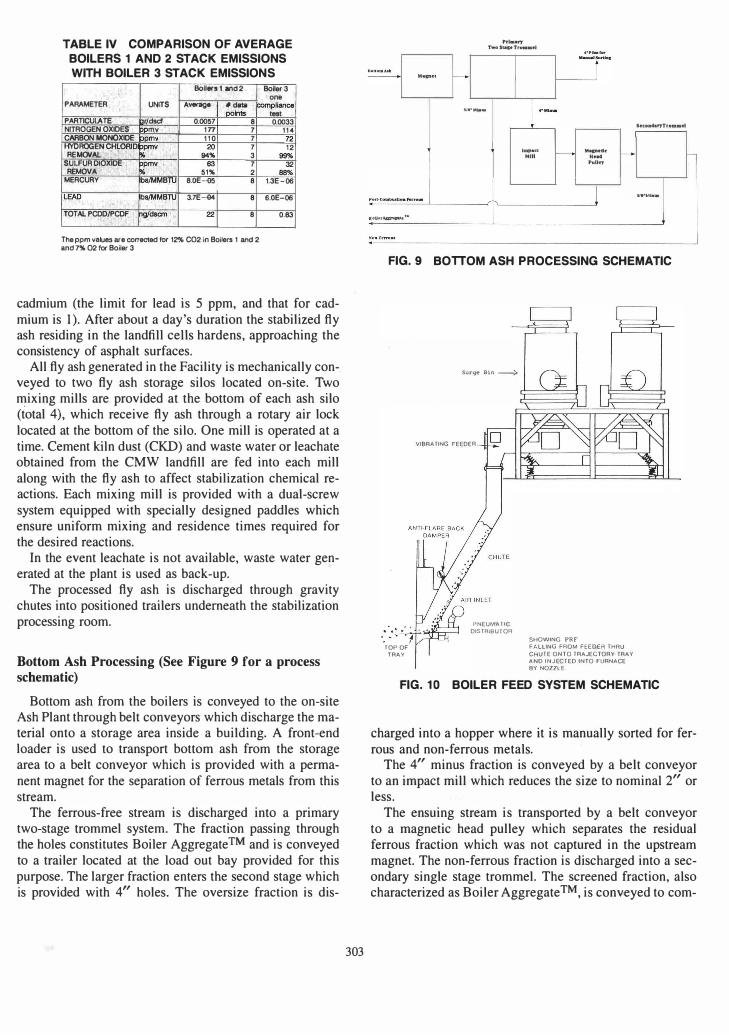
TABLE IV COMPARISON OF AVERAGE BOILERS 1 AND 2 STACK EMISSIONS WITH BOILER 3 STACK EMISSIONS
Boilers 1 and 2 Boiler 3 one
PARAMETER UNITS A __ # da1a �pllance Dolnts
PARTICUlATE r dscl 0.0057 a NITROGEN OXiOES mv 1 77 7 CARBON MONOXIDE pmv 1 1 0 7 �.;g;!N CHLORII) �mv 20 7
84% 3 SULFUR DIOXIDE �mv 63 7
REMOVAL 51% 2 MERCURY "s/MMBTU a.OE 05 a
LEAD "S/MMBTU 3.7E 04 a
TOTAL PCDD/PCDF g!dscm 22 a
The ppm velu .. are corrected for 12% C02 in Boilers 1 and 2 and 7% 02 for Boiler 3
test 0.0033
1 1 4 72 1 2
99% 32
88% 1.3E 06
6.0E-06
0.83
cadmium (the limit for lead is 5 ppm, and that for cadmium is 1). After about a day's duration the stabilized fly ash residing in the landfill cells hardens, approaching the consistency of asphalt surfaces.
All fly ash generated in the Facility is mechanically conveyed to two fly ash storage silos located on-site. Two mixing mills are provided at the bottom of each ash silo (total 4), which receive fly ash through a rotary air lock located at the bottom of the silo. One mill is operated at a time. Cement kiln dust (CKD) and waste water or leachate obtained from the CMW landfill are fed into each mill along with the fly ash to affect stabilization chemical reactions. Each mixing mill is provided with a dual-screw system equipped with specially designed paddles which ensure uniform mixing and residence times required for the desired reactions.
In the event leachate is not available, waste water generated at the plant is used as back-up.
The processed fly ash is discharged through gravity chutes into positioned trailers underneath the stabilization processing room.
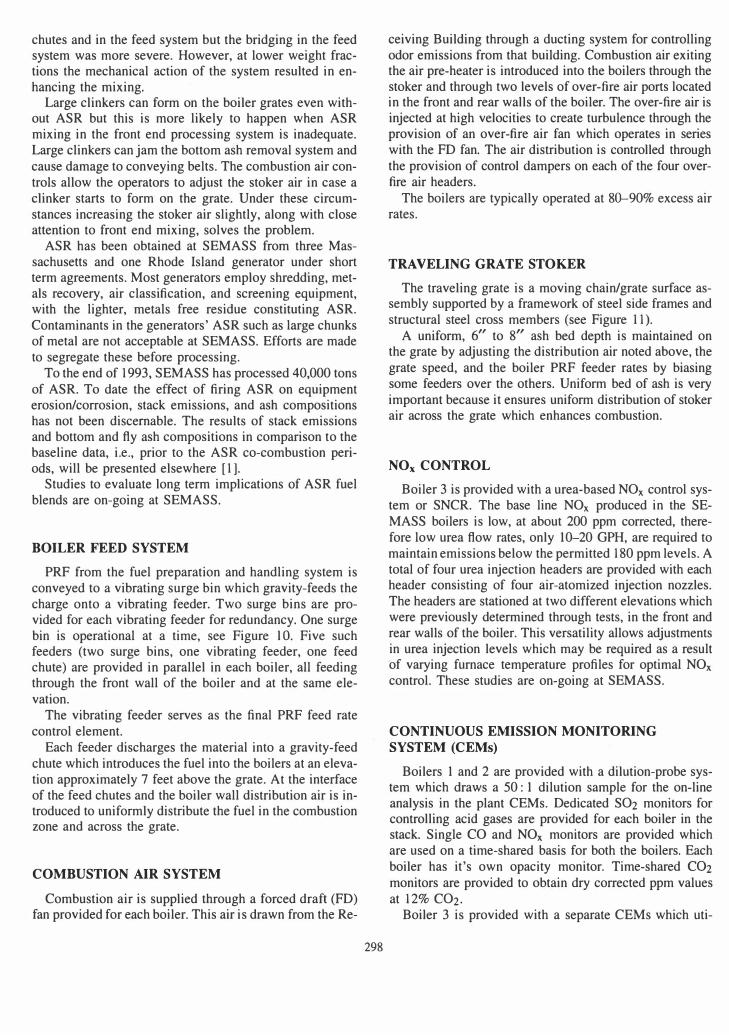
Bottom Ash Processing (See Figure 9 for a process schematic)
Bottom ash from the boilers is conveyed to the on-site Ash Plant through belt conveyors which discharge the material onto a storage area inside a building. A front-end loader is used to transport bottom ash from the storage area to a belt conveyor which is provided with a permanent magnet for the separation of ferrous metals from this stream.
The ferrous-free stream is discharged into a primary two-stage trommel system. The fraction passing through the holes constitutes Boiler Aggregate TM and is conveyed to a trailer located at the load out bay provided for this purpose. The larger fraction enters the second stage which is provided with 4" holes. The oversize fraction is dis-
303
Prim..,. Two SUice Trommel
.""_ 1..-
� Mapel 1--. ··-r-
'''' Mill_ l ···�-Sec:ond • ..,Trolllmel
Impaec � Mapedc I-Mill He.d PuUIIl'
I 1 I I I
_· c." .. b...tlo. FftTe_ l ,,. ....... OUUAClnlIt ....
FIG. 9 BOTTOM ASH PROCESSING SCHEMATIC
TOP OF
TRAY
Surge Bin �
VIBRATING FEEDEA
PNEUMATIC
DISTRIBUTOR
SHOWING PRF FALLING FROM FEEDER THAU
CHUTE ONTO TRAJECTORY TRAY
AND I N J ECTED INTO FURNACE
BY NOZZLE.
FIG. 10 BOILER FEED SYSTEM SCHEMATIC
l
charged into a hopper where it is manually sorted for ferrous and non-ferrous metals.
The 4" minus fraction is conveyed by a belt conveyor to an impact mill which reduces the size to nominal 2" or less.
The ensuing stream is transported by a belt conveyor to a magnetic head pulley which separates the residual ferrous fraction which was not captured in the upstream magnet. The non-ferrous fraction is discharged into a secondary single stage trommel. The screened fraction, also characterized as Boiler Aggregate™, is conveyed to com-

� IDLER SHAF'
ACCESS �OOR
��':m , I DLEA END
ANCHOR BLOCK WITH BOLT I
, ; < - , ? ? ! : THER.� EXPANSION
FIG. 11 TYPICAL STOKER ARRANGEMENT
bine with the Aggregate fraction separated in the primary trommel.
The oversize stream from the secondary trommel is essentially comprised of the mixed non-ferrous fraction output of the process. This stream is conveyed to a load-out bay and discharged into dedicated containers.
All pre-combustion ferrous material recovered in the front end, the post combustion ferrous and the non-ferrous recovered in the bottom ash processing are sold to outside markets for recycling.
Boiler Aggregate ™ is either used on-site as a substitute construction material, in accordance with the environmental permits in place, or is transported to the CMW cells for potential later retrieval for use as construction material. SEMASS also uses the Aggregate as a daily cover material in the CMW landfill. Off-site beneficial use permits are presently being pursued so that this important resource can be utilized and the impact on landfills minimized.
SUMMARY
The Shred-and-Burn concept in conjunction with a tall furnace design and the associated environmental controls allow SEMASS to operate well within the permitted emission levels and accept fuels having a wide variety of characteristics such as automobile shredder residue (ASR).
The ash processing system recovers valuable resources for recycling and beneficial uses. About 30% of the total bottom ash is recovered as postcombustion ferrous and non-ferrous and is sold to the recycling markets. The re-
304
maining 70% is used either on-site as a substitute construction material or is used as daily cover material at the landfill, in accordance with the permits in place. Permitting activities for other off-site uses are in progress.
By closely monitoring plant downtimes and the associated causes, the operators are able to sustain high plant availabilities and capacity factors through GEP and the associated maintenance measures. Performance monitoring and improvements have resulted in up to 30 kWhr/ton of additional electrical output.
The Facility's "zero discharge" feature minimizes impact on the local water resources through water conservation and eliminating waste water discharge into the ground.
REFERENCES
[ I ] 1. Zakaria, G. L. Sutin, and P. 1. McBath, "Auto Shredder Residue Experience (ASR) at the SEMASS Resource Recovery Facility," Paper submitted for the 87th Annual Meeting and Exhibition of the Air & Waste Management Association, to be held in Cincinnati, Ohio, June 19-24, 1994.
[2] David L. Hansen, "Ash Stabilization: A Case Study," Proceedings of National Research & Development Conference on the Control of Hazardous Materials, Anaheim, California, February 20-22, 199 1 .
ABBREVIATIONS
ACC ASR CEMs CKD CMW ESP FD GCP GEP kWhr MSW MW MWC NSPS PRF SDA SNCR SOP TCLP TPD TPH UT
air cooled condenser automobile shredder residue continuous emissions monitoring system cement kiln dust Carver-Marion-Wareham landfill electrostatic precipitator forced draft good combustion practices good engineering practices kilowatt hour municipal solid waste, includes all wastes megawatts electricity municipal waste combustor new source performance standards processed or prepared refuse fuel spray drier absorber foracid gas cleanup selective non-catalytic reduction standard operating procedure toxicity characteristics leaching procedure tons per day tons per hour ultrasonic thickness measurements for boiler
tube walls