the sensitivity of the greenland–scotland ridge overflow to
TRANSCRIPT

NOVEMBER 2003 2307B I A S T O C H E T A L .
q 2003 American Meteorological Society
The Sensitivity of the Greenland–Scotland Ridge Overflow to Forcing Changes
ARNE BIASTOCH*
Scripps Institution of Oceanography, La Jolla, California
ROLF H. KASE
Institut fur Meereskunde, Kiel, Germany
DETLEF B. STAMMER
Scripps Institution of Oceanography, La Jolla, California
(Manuscript received 11 February 2002, in final form 7 April 2003)
ABSTRACT
Processes that influence the volume and heat transport across the Greenland–Scotland Ridge system areinvestigated in a numerical model with 1⁄8 horizontal resolution. The focus is on the sensitivity of cross-ridgetransports and the reaction of the subpolar North Atlantic Ocean circulation to changes in wind stress andbuoyancy forcing on seasonal to interannual timescales. A general relation between changes in wind stress orcross-ridge density contrasts and the overturning transport of Greenland–Iceland–Norwegian Seas source wateris established from a series of idealized experiments. The relation is used subsequently to interpret changes inan experiment over the years 1992–97 with realistic forcing. On seasonal and interannual timescales there is aclear correlation between heat flux and wind stress curl variability. The realistic model suggests a steady decreasein the strength of the cyclonic subpolar gyre of the North Atlantic with a corresponding decrease in heat transportduring the 1990s.
1. Introduction
The role of the Greenland–Iceland–Norwegian (GIN)Seas in North Atlantic Deep Water (NADW) formationand in determining our present and future climate seemsto be widely accepted (Dickson and Brown 1994). How-ever, a detailed understanding of adjustment processesof the flow over the Greenland–Scotland Ridge (GSR)to changing forcing conditions over the GIN Seas andits impact on the Atlantic Ocean and global circulationstill has to be established. In particular, the interactionbetween the changing GIN Seas and the North Atlanticflow fields has to be understood. This includes an un-derstanding of the relative importance of wind forcingas compared with buoyancy fluxes and the relative im-portance of atmospheric fluctuations poleward or equa-torward of the GSR.
The areas of the subpolar North Atlantic are exposedto high surface winds. Wind stress curls calculated fromsatellite data reveal very high values west of Greenland
* Current affiliation: Institut fur Meereskunde, Kiel, Germany.
Corresponding author address: Dr. Arne Biastoch, Institut furMeereskunde, Dusternbrooker Weg 20, 24105 Kiel, Germany.E-mail: [email protected]
(Milliff and Morzel 2001), driving a cyclonic barotropiccirculation around Iceland that links the GIN Seas andthe subpolar North Atlantic. Such extreme values thatare also seen in the climatology used here (Stammer etal. 2004, manuscript submitted to J. Climate) are notconstant in time but vary on seasonal, interannual, andlonger timescales (see also Fig. 11). Late winter valuesare 2 times those in the summer and interannual vari-ations are of similar amplitudes.
Especially the upper layer in the Norwegian Sea hasbeen attributed to variations in the surface pressure fieldof the North Atlantic (Blindheim et al. 2000). The cur-rent transporting these anomalies [e.g., of North AtlanticOscillation (NAO) type] is the Norwegian Atlantic Cur-rent entering across the eastern part of the GSR.
From numerical simulations it has emerged that theoverflow of dense GIN Seas water over the GSR has asignificant effect on the meridional overturning circu-lation (MOC) of the North Atlantic (Willebrand et al.2001). However, the timescales of overflow changes arenot well established, nor are those of the reaction of theflow field. Recent measurements (Girton et al. 2001) inthe northern branch of the overflow through the Den-mark Strait revealed no significant change in transportsas compared with measurements from more than a de-cade ago (Ross 1984). On the other hand, there are

2308 VOLUME 33J O U R N A L O F P H Y S I C A L O C E A N O G R A P H Y
indications that the southern branch through the FaeroeBank Channel (FBC) decreased in its strength over thelast 50 yr (Hansen et al. 2001). The authors interpretrecent direct current measurements in terms of hydrauliccontrol theory. Applying those relations to historic dataof the reservoir height of GIN Seas water the authorsinferred that the long-term throughflow is subject to asignificant trend to lower overflow volumes.
Similar long term transport estimates do not exist forthe Denmark Strait. However, the importance of a hy-draulic control mechanism in the Denmark Strait hasbeen established in numerical simulations (Kase andOschlies 2000) and measurements (Kase et al. 2003).However, in contrast to the FBC, the Denmark Straitcan be considered to be a ‘‘wide channel’’ (i.e., a widthmuch larger than the Rossby radius), and therefore dif-ferent hydraulic laws apply. Jonsson (1999) suggeststhat the main contribution to the Denmark Strait Over-flow Water (DSOW) comes from the Iceland Sea witha persistent direct path to the Denmark Strait bypassingthe East Greenland Current. This is supported by long-term measurements north of Iceland and leaves littleroom for strong variability in this component of theDSOW. It is therefore more likely that variations in andfarther downstream of the sill are related to mixing withEast Greenland Current and Irminger Sea water.
In a recent paper (Kase et al. 2001) we have shownthat a regional model of the North Atlantic subpolargyre is able to simulate realistic circulation patterns thatare connected to the GSR overflow on timescales up toseveral years. The simple model accounts for the meandensity difference between the two basins north andsouth of the GSR and surface forcing and simulatedpredominant pathways of water masses and heat. It isthe purpose of this paper to investigate the sensitivityof mass and heat transports in such a model to changesin wind stress and cross-ridge buoyancy contrasts.
From the idealized setup we can expect responses ontwo different timescales: First, a fast response on chang-es in the surface forcing; and second, a slower one onchanges of properties in the reservoir north of the sills.While the response of the flow field to changing res-ervoir properties has a timescale of several years todecades, the response of the flow field to changing windsand density contrasts is relatively fast. Therefore, in-stead of driving a model to near equilibrium over manydecades to changes in surface heat and wind changes,we take advantage of the fact that the spinup time inthe subpolar gyre is rather short. The barotropic natureand the fast propagation of anomalies along the topog-raphy leads to statistically stationary mass and heattransports across the GSR in our model after a fewmonths. We therefore can determine dependencies be-tween wind forcing and flow response with relativelylow computational costs. (In contrast, the subtropicalgyre spinup time is significantly longer and is deter-mined by the propagation time of baroclinic Rossbywaves across the whole basin.)
In the following, we will first describe the idealizedmodel setup used in this sensitivity study (section 2).Section 3 describes these results and establishes a re-lationship between total Denmark Strait throughflowand heat transport across the GSR. This relationship istested against the results from a more realistic setup insection 4 and is discussed in the conclusions.
2. The model
Our numerical experiments are based on the Mas-sachusetts Institute of Technology (MIT) ocean model(Marshall et al. 1997a,b), which is a primitive equationmodel with z coordinates in the vertical. The modeldomain covers the subpolar North Atlantic and parts ofthe GIN Seas between 408 and 758N and between 708Wand 58E. Our setup has a horizontal resolution of 1⁄8 31⁄8, which over the Denmark Strait results in grid sizesof 9.5 km 3 18 km in zonal and meridional direction,respectively. In the vertical, the model has 30 levelswith a resolution ranging from Dz 5 10 m near thesurface to 875 m close to 5000-m depth. Because alllateral boundaries are closed (no normal flow), the large-scale overturning due to the North Atlantic Current(NAC) warm branch (that in reality enters the domainfrom the south) and its regional impact is absent in oursimulation.
The model topography was obtained on the modelgrid from the National Geophysical Data Center(NGDC) 5 arc-min dataset through bilinear interpolationwith no extra smoothing applied (Fig. 1a). Some ad-ditional tuning was required to assure that importantislands are represented (e.g., Jan Mayen). In contrast tothe traditional vertical discretization of z-level models,the MIT model allows partially filled cells, thus pro-viding a more realistic representation of the bottom to-pography and bottom slopes (Adcroft et al. 1997). Kaseet al. (2001) have demonstrated that the correct repre-sentation of topographic slopes is fundamental for arealistic simulation of the flow field and its variationsin the subpolar North Atlantic.
A series of idealized model runs was performed thatdiffer only in terms of wind forcing and initial buoyancycontrast (Table 1). The standard wind forcing consistsof a 7-yr time mean that was estimated through a globalocean state estimation procedure for the years 1992–97.As described by Stammer et al. (2002, 2003), the es-timated fluxes (later referred to as ECCO forcing) arethose that are consistent with this model (on a 28 globalgrid) and with a variety of ocean data. To account fora typical range of wind stress variability for this area(e.g., Spall and Pickart 2003), these wind fields weremultiplied by a factor of 2–4 (expts 2 3 WIND and 43 WIND). While doubling the strength of the windforcing is consistent with observed wind variation, afactor of 4 can be considered to be an extreme case thatis used here only to illustrate a clear scaling relationbetween wind forcing and transports.

NOVEMBER 2003 2309B I A S T O C H E T A L .
FIG. 1. (a) Topography of the subpolar model. Pixels indicate horizontal resolution, and the discretization of thedepth axis (m) is shown by the grayscale. The hatching represents the GIN Seas. Special topographic features that arereferenced in the text are also shown: Flemish Cap (FC), Denmark Strait (DKS), Faeroe Bank Channel (FBC), andFaeroe–Shetland Channel (FSC). The box indicates the area of Figs. 2 and 9. The diagonal line indicates the sectionshown in Fig. 5. (b) Initial temperature profiles of the idealized model versions: GIN Seas (gray) and subpolar NorthAtlantic (black).
TABLE 1. Summary of idealized experiments.
Forcing Ititialization
Wind WINDNOWIND2 3 WIND4 3 WIND
WindNoDoubled windQuadrupled wind
Two profilesTwo profilesTwo profilesTwo profiles
Temperature 1.5 3 TEMP
2 3 TEMP
Wind
Wind
Two profilesSubpolar profile 3 1.5Two profilesSubpolar profile 3 2
The initial stratification was determined by averagingthe annual mean Levitus and Boyer (1994) potentialtemperature u field horizontally over the two basinsnorth and south of the GSR (Fig. 1b). The contrastacross the GSR was modified in some experiments bymultiplying the southern profile by a factor of 1.5 (expt1.5 3 TEMP) or 2 (expt 2 3 TEMP). This range islarger than can be inferred from observations but is usedto demonstrate the insensitivity of the barotropic trans-port through the Denmark Strait to density forcing.
In all of our idealized runs, density was calculatedfrom temperature alone using a least squares–fitted tem-perature–density relation (based on observations) of s5 27.95 2 0.09u. This enabled us to use salinity as anindependent ‘‘GIN Seas tracer’’ for water originallydenser than s 5 28.0 to trace the spreading of coldoverflow water into the subpolar gyre. The GIN Seastracer was initialized by a value of 1 north of the sillsand below 100 m. No relaxation toward a climatologywas accomplished along the artificially closed bound-aries to allow closing the heat budget in the model do-main.
Horizontal subgrid-scale physics were parameterizedby a biharmonic operator with values scaled by cos3(w)(where w is the geographical latitude). At 608N thiscorresponds to 6.25 3 109 m4 s21 for viscosity and 1.253 109 m4 s21 for diffusion. In the vertical, a constantLaplacian is used with a value of 1 3 1024 m2 s21 forthe viscosity and 3 3 1025 m2 s21 for the diffusion.Gravitational instabilities are removed by an implicittreatment of the vertical mixing where high mixing val-ues are used for unstable stratified water columns. Toensure a positive definite advection of tracers, a flux-corrected third-order scheme was used.
3. Result of the sensitivity experiments
a. Testing results
The WIND experiment will be used as a referencecase for pathways of the warm water and deep waterflows. Hansen and Østerhus (2000) showed in their Fig.5 that the warm water path into the northern basin con-sists of two branches, the Faeroe Current west and the

2310 VOLUME 33J O U R N A L O F P H Y S I C A L O C E A N O G R A P H Y
FIG. 2. (a) Vertically integrated transport (in meters squared per second of water s # 27.5, averaged over months9–12, in the region of the Greenland–Scotland Ridge (GSR) system in expt WIND. Schematically overlayed arecirculation features as indicated by Hansen and Østerhus (2000, their Figs. 5 and 6). In the vicinity of the GSR,every second vector has been drawn in longitudinal direction, elsewhere every fourth (second) in longitudinal(latitudinal) direction. Shaded by light gray is the topography shallower than 500 m. (b) Bottom velocities in theoverflow plume (marked in gray) defined by thicknesses greater than 50 m, in longitudinal direction only everysecond vector is shown. The initial front is indicated by the black line.
Shetland Current east of the Faeroe Islands. Bothbranches are well represented in our reference run (exptWIND; Fig. 2a). However, in contrast to the observa-tions, the supply of warm water is mainly from theinterior Iceland Basin and not by the NAC since thelatter is not part of our model setup. West of Icelandthe northward flow is restricted to a region south of thesill, except for a narrow northward band on the westIcelandic shelf break. However, the main portion of thewater recirculates along both shelf breaks. The presenceof an ‘‘East Greenland Current’’ can also be seen.
The cold water path (Fig. 2b) consists of outflows
through the FBC and west of Faeroe Islands. As inHansen and Østerhus (2000, their Fig. 6) it flows south-ward along the Reykjanes Ridge and the central IcelandBasin, although the latter is only marginally represented.The path through the Denmark Strait is strongest alongthe Greenland continental slope but also has a contri-bution on the shelf.
To demonstrate the ability of the model to capture thebasic stratification resulting from the overflow underwind forcing, a section through the Irminger Basin at648N is shown and contrasted to observations (Fig. 3).Starting from a horizontally uniform stratification (Fig.

NOVEMBER 2003 2311B I A S T O C H E T A L .
FIG. 3. Density section (in sigma units) at 648N for expt WIND at (a) t 5 0, (c) averaged over three consecutivesnapshots between 9 and 19 Jul (shaded by light gray are GIN Seas tracer concentrations above 0.05.), and objectivelymapped from cruises with F/S Poseidon over a similar time range: (b) original vertical resolution and (d) interpolatedonto model grid.
3a), it takes only about 200 days to reach a realisticdensity distribution: the s 5 27.8 isopycnal [usually con-sidered to be the upper boundary of the overflow (Dick-son and Brown 1994; Girton et al. 2001)] slopes thenupward by more than 1200 m (Fig. 3c), which is in goodagreement with observations (Fig. 3b). The presence ofdenser bottom water in the observations can be explainedto some degree by the coarse vertical model resolutionand the absence of a model bottom boundary layer; av-eraging the observations over model levels reduces thenear-bottom model–data discrepancy (Fig. 3d).
Overall the model has, attributed to its finite numer-ical resolution in the vertical, the ability to reproduce avertical stratification that is comparable to observationsin its basic features. This ability is notable since theinitial stratification is a horizontal homogeneous one onboth sides of the GSR.
The main difference in the observed density structureis seen at the right side of the section where sloping ofthe isopycnals represent the northward flowing IrmingerCurrent, which is not present in our idealized model.
b. Sensitivity of volume transport
The sensitivity of the amount of GIN Seas water over-flow to changes in wind forcing can best be illustratedusing a vertical integral of the GIN Seas tracer. For allexperiments this quantity is displayed in Fig. 4 togetherwith the integrated tracer transport of DSOW and southof Iceland of Iceland–Scotland Overflow Water (ISOW).In the reference run with standard wind forcing, a totalvolume transport of 4.9 Sv (1 Sv [ 106 m3 s21) is sim-ulated that is distributed almost equally (up to a 20%difference) between both sides of Iceland. Without windforcing (NOWIND) the DSOW is only 1 Sv, that is, only40% of the transport of ISOW. In contrast, with enhancedwind forcing (2 3 WIND) the amount of DSOW in-creases substantially and for 4 3 WIND represents almostthe entire GIN Seas outflow of 6 Sv. An enhanced DSOWoverflow is also expressed by the faster propagation ofthe outflow plume along the continental slope past Green-land and into the Labrador Sea. The plume reaches Flem-ish Cap for 4 3 WIND in less than 200 days, indicating
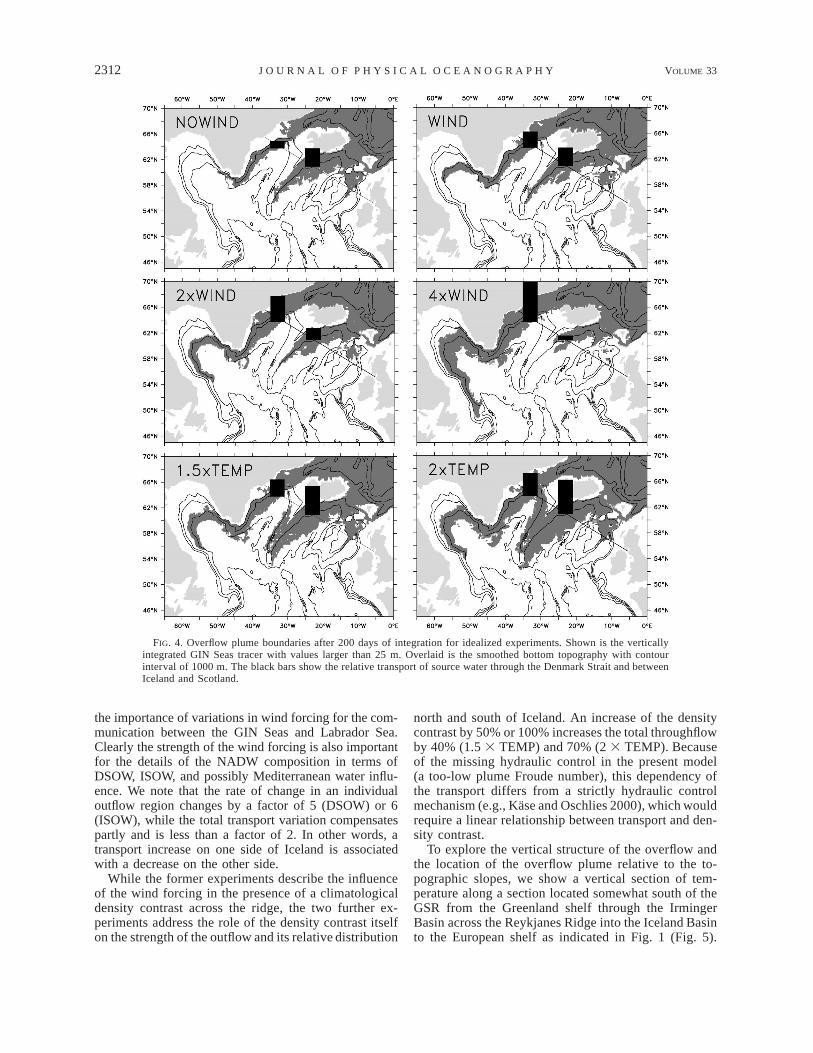
2312 VOLUME 33J O U R N A L O F P H Y S I C A L O C E A N O G R A P H Y
FIG. 4. Overflow plume boundaries after 200 days of integration for idealized experiments. Shown is the verticallyintegrated GIN Seas tracer with values larger than 25 m. Overlaid is the smoothed bottom topography with contourinterval of 1000 m. The black bars show the relative transport of source water through the Denmark Strait and betweenIceland and Scotland.
the importance of variations in wind forcing for the com-munication between the GIN Seas and Labrador Sea.Clearly the strength of the wind forcing is also importantfor the details of the NADW composition in terms ofDSOW, ISOW, and possibly Mediterranean water influ-ence. We note that the rate of change in an individualoutflow region changes by a factor of 5 (DSOW) or 6(ISOW), while the total transport variation compensatespartly and is less than a factor of 2. In other words, atransport increase on one side of Iceland is associatedwith a decrease on the other side.
While the former experiments describe the influenceof the wind forcing in the presence of a climatologicaldensity contrast across the ridge, the two further ex-periments address the role of the density contrast itselfon the strength of the outflow and its relative distribution
north and south of Iceland. An increase of the densitycontrast by 50% or 100% increases the total throughflowby 40% (1.5 3 TEMP) and 70% (2 3 TEMP). Becauseof the missing hydraulic control in the present model(a too-low plume Froude number), this dependency ofthe transport differs from a strictly hydraulic controlmechanism (e.g., Kase and Oschlies 2000), which wouldrequire a linear relationship between transport and den-sity contrast.
To explore the vertical structure of the overflow andthe location of the overflow plume relative to the to-pographic slopes, we show a vertical section of tem-perature along a section located somewhat south of theGSR from the Greenland shelf through the IrmingerBasin across the Reykjanes Ridge into the Iceland Basinto the European shelf as indicated in Fig. 1 (Fig. 5).

NOVEMBER 2003 2313B I A S T O C H E T A L .
FIG. 5. Temperature field along a vertical section south of the GSR as indicated by the (short) line in Fig. 1 withthe section pointing toward northwest at the right side. The field is an average as in Fig. 3c. Superimposed are theconcentrations of the GIN Seas tracer. Shown on top of each panel is the sea surface height anomaly along the samesection. Labels GS, RR, and RP stand for Greenland shelf, Reykjanes Ridge, and Rockall Plateau, respectively. Thesection is shown for the wind experiments.
The distribution of the GIN Seas tracer is superimposedfor all four wind cases. It follows that the plume ofoverflow water is mostly located at the right downstreamflank of the respective passages. In the left part of thesections, the ISOW plume indicated by 95% of the di-luted GIN Seas tracer spans the whole depth range from1000 m to the slope of the Reykjanes Ridge with amaximum thickness of 800 m. The bottom concentrationof the GIN Seas tracer reaches up to 50%. With in-creasing wind, the extent of the plume as well as thebottom concentration is substantially reduced. In con-trast, the DSOW plume is significantly enhanced notonly in its bottom tracer concentration, but also in itsvertical extent. As a result the tracer concentration isdramatically increased over the shelf for increased windconditions, suggesting that not only the deep passage,
but especially the regions over the shallow shelf becomeof fundamental importance for monitoring an enhancedwater mass exchange between the GIN Seas and thesubpolar North Atlantic under stronger wind conditions.The necessity of including shelf contributions to theNADW formation has recently been stressed by Rudelset al. (1999) who found a significant flow of Polar In-termediate Water possibly merging with the outflowplume more than 100 km downstream of the DenmarkStrait sill. As will become clear below, this situation isrelevant not only for a seasonal cycle in the cross-ridgeheat and volume transport, but also for interannual var-iations, and thus poses stringent constraints on obser-vational designs.
Shown in the figure are also the respective sea surfaceheight (SSH) anomalies along the section. The maxi-

2314 VOLUME 33J O U R N A L O F P H Y S I C A L O C E A N O G R A P H Y
FIG. 6. Total GIN Seas tracer content (1012 m3) south of the rotatedsection (full diagonal line in Fig. 1) as function of time for individualexperiments. FIG. 7. Histogram of cumulative transport through the Denmark
Strait (Sv), split into temperature classes, for the cases NOWIND(gray), WIND (black), 2 3 WIND (dark gray), and 4 3 WIND (lightgray). Shown are mean values over the full range of integration.mum SSH slope and thus maximum downstream ve-
locity are located near the Greenland shelf for enhancedwind conditions and appear to be related to the DSOWoverflow plume. Note also the opposite sense in slopeat the other side of the Denmark Strait indicating north-eastward flow there. In contrast, for experiment NOW-IND, the velocity is strongest south of the ReykjanesRidge while over the Denmark Strait the flow is gen-erally directed toward the northeast.
The main point that emerges from the sensitivity stud-ies is the shift in southward dense water transport fromISOW to DSOW with increasing wind forcing but anessentially constant sum of both parts. The total over-flow can be changed only by altering the cross-ridgedensity contrast between the two basins. The corollaryis that wind changes on seasonal to interannual perioddo not lead to changes in net volume transports, whichhave to happen on longer timescales and are related tochanges in watermass properties.
c. Tracer and heat transport
We determined the outflow rate of GIN Seas waterfrom the idealized runs by calculating the time rate ofchange of the total, vertically and horizontally integratedtracer content in the receiving basin, that is, the subpolarNorth Atlantic in our model domain. Note that this quan-tity is independent of entrainment and mixing. The con-tribution of horizontal tracer diffusion across the sectionis small, and thus the rate of change south of a givensection is equal to the tracer flux across the section itself.
From Fig. 6, which shows the time series of respectivetracer content south of the previous section parallelingthe GSR, it follows that a constant rate of tracer overflowfrom all six experiments is reached after about 4 months,and the subsequent steady flow of source water acrossthe section was determined by fitting a line to the last2 months of the curves. Transports result in 4.6, 5.4,5.4, and 7.3 Sv for the four wind cases (from NOWIND
to 4 3 WIND), respectively. The two cases with en-hanced cross-ridge stratification result in 7.9 (1.5 3TEMP) and 8.9 Sv (2 3 TEMP), respectively. Note thatthe two different calculations of source water (Fig. 4and Fig. 6) differ only because of diffusion across thesection.
The outflow of DSOW and ISOW is usually asso-ciated with transports below a certain temperature (e.g.,Dickson and Brown 1994; Girton et al. 2001). The max-imum temperature of the DSOW can be inferred fromFig. 7, which shows the total DSOW transport as acumulative histogram for temperature classes. Integrat-ing from the coldest water upward is equivalent to in-tegrating from the bottom up and where the respectivecumulative numbers reach a stationary value, no furthercontribution from warmer water masses to the DSOWis obtained. This situation is reached for the standardexperiment (WIND) above 28C, so that all outflows hap-pen below that temperature. For the extreme case of 43 WIND, the outflow water also includes water between28 and 48C. The increased outflow temperature resultsfrom a significant dilution of the source water temper-ature through Atlantic inflow water. This inflow is es-pecially pronounced in the strong wind forcing case, butultimately it effects all of our experiments.
The dependence of the Denmark Strait outflow is onlymarginally affected by the initial cross-basin densitystratification but is primarily a function of wind stresscurl. Yet, the heat transport across the GSR does showa significant sensitivity to the latter changes (Fig. 8a):For the wind experiments we find a linear relationshipbetween the strength of the gyre (i.e., the strength ofthe wind forcing) and the heat transport amplitude (thesensitivity is 7.5 TW Sv21). In contrast, the large var-iations in heat transport for the temperature experimentshappen at virtually the same strength of the gyre.

NOVEMBER 2003 2315B I A S T O C H E T A L .
FIG. 8. (a) Heat transport across the sills vs barotropic transportthrough the Denmark Strait for the different idealized experiments atfive daily snapshots in the period 1 May–15 Jul. (b) As in (a) butstrength of overturning reduced to 100% GIN Seas tracer across thesection vs heat transport. The individual points represent the averagesof the clusters of (a). Shown is also a quadratic fit between the in-dividual points.
The idealized model setup allows one to determinethe transport of original source water transport acrossthe sills by analyzing the increase in total tracer volumein the receiving basin. This quantity is independent ofdownstream mixing processes and determines the totaloverturning of source water across the ridge system (Fig.8b). The most striking difference to Fig. 8a is the col-lapse of the orthogonal dependencies between the windand temperature experiments. There is essentially a qua-dratic dependency of the heat transport to the ‘‘source’’overturning, resulting in a stronger sensitivity at largeroverturning rates. In comparing Fig. 8a and Fig. 8b itfollows that the large barotropic circulation changes re-sult in small changes of the overturning strength andthe heat transport (7.5 TW Sv21). In contrast, the heattransport is sensitivity to changes in the overturningacross the ridge (47 TW Sv21). We note that the DY-NAMO Experiments (DYNAMO Group 1997) estab-lished a relationship between overturning and meridi-
onal heat transport at 248N of 50 TW Sv21 that is similarto our findings. As one reviewer pointed out, the ratioof both is very close to the intuitively expected scaling(TS 2 TB)/(TE 2 TW), where TS is the surface temper-ature, TB is the bottom temperature, and TE and TW aredepth-averaged temperatures of the ridge system eastand west of Iceland, and under the assumption that theratio of barotropic to overturning transport is of O(1).This ratio is 6.6 as compared with 47/7.5 5 6.3.
4. Realistic model simulation
The previous process studies are interesting in theirown right, but they are primarily intended to help inunderstanding real changes of the subpolar North At-lantic circulation. For that reason the findings of theidealized model runs were tested against a more realisticsimulation of the subpolar North Atlantic during the1990s. The model domain for the realistic run and itshorizontal and vertical resolution are identical to theidealized model runs. However, the model was initial-ized from Levitus December temperature and salinityfields. For the simulation of the surface mixed layer ak-profile parameterization (Large et al. 1994) was used.The model was driven by daily wind thermohaline forc-ing over the 6-yr period 1992–97, which was estimatedas part of the ECCO ocean state estimation procedure(for details see Stammer et al. 2002). Because the modeldomain is still limited by closed boundaries to the northand south and thus excludes the interaction with thelarge-scale flow field, the integration included a 1-yrspinup period. We also note that a second-order advec-tion scheme was used now in this realistic run for tracersand somewhat higher values for viscosity and diffusionwere used (both 25 3 109 m4 s21 at 608N) than in theidealized runs. However, it was tested in the idealizedconfiguration that these changes do not alter the con-clusions described below.
Kase et al. (2001) provided a detailed analysis of thecirculation resulting from the realistic model simulationand document that in the Labrador Sea this model isable to simulate the recirculations of the western bound-ary current regime as it was observed by Lavender etal. (2000) when a partial cell formulation (Adcroft etal. 1997) is being implemented instead of the traditionalfull cell approach.
In the vicinity of the GSR circulation patterns (Fig.9) are similar to those obtained in the idealized exper-iments but the circulation of light water is improvedsignificantly in the Irminger Sea with an improved cy-clonic path of the Irminger Current west of the Reyk-janes Ridge and an improved East Greenland Current(cf. Fig. 2a). Examining the additional effect of usingsalinity we compared the development of the full densityas compared with the linearized one used for the ide-alized experiments. For the overflow region both curvesare highly correlated but with a reduced variance in the

2316 VOLUME 33J O U R N A L O F P H Y S I C A L O C E A N O G R A P H Y
FIG. 9. Warm water transport as in Fig. 2a but mean of year 1992 in the realistic subpolar model.
FIG. 10. Heat transport across the GSR system (PW; thick blackcurve), sum of the former and integrated surface heat flux in the GINSeas (thin black, positive into the ocean), and rate of heat storagechange in the GIN Seas (dashed).
complete density equation. Therefore, salinity is damp-ing the variability in the realistic model.
A significant limitation of our model setup in simu-lating realistic conditions is the fact that the closedboundaries prevent the interaction of our model domainwith the basinwide circulation. This has consequencesfor a run with real surface wind and heat fluxes. TheECCO average heat loss over the model domain is 16.7W m22, which under normal conditions is balanced bythe horizontal transport divergence in the model domain.However, because the inflow of warm water due to theGulf Stream/North Atlantic Current is excluded, we can-not reach a stationary model state that is in balance withthe realistic surface forcing. Fortunately, the adjustmentto the surface heat imbalance is on timescales longerthan those of primary interest here. Distributing this heat
loss equally over the whole water column would resultin a basinwide temperature decrease of 0.118C yr21.
Figure 10 shows the dominant term for the GIN Seastemperature balance—that is, the change in verticallyintegrated heat storage, the advection across the ridge,and the surface heat flux—over the 6-yr period. Theseasonal cycle in the heat storage is typically 0.4 PWand is dominated by the similar signal in the surfaceheat flux. Note also the variation in heat content changeson a monthly timescale that seem to be highly correlatedwith local surface forcing. In contrast to the surfaceforcing, the horizontal heat advection into the GIN Seasacross the ridge is about one order of magnitude smaller.It shows a pronounced decrease from about 0.2 PWduring 1992 to less than 0.1 PW after 1993. This de-crease is associated with the initial adjustment of thesystem to the surface boundary condition and a relatedsignificant decrease in cross-ridge temperature gradientthat is equivalent to a transition from the 1.5 3 TEMPexperiment to the standard run in the previous section.In later years the heat transport still decreases. However,this decrease is then due to variations of the wind fieldand shows amplitudes of the associated heat flux vari-ations similar to those found from the idealized windexperiments (see Fig. 8a).
To illustrate in more detail the relation between theseasonal variations in horizontal heat flux and changesin the wind stress forcing, we show in Fig. 11 thesmoothed barotropic transport through the DenmarkStrait together with the wind stress curl maximum inthe region 628–708N, 358W–58E. Also shown are thechanges in heat transport across the whole GSR. A low-pass filter was applied to all three time series to focuson seasonal and longer timescales. Quite clearly, allquantities have a pronounced and highly correlated (e.g.,r 5 0.56 for heat transport and wind stress) relationship

NOVEMBER 2003 2317B I A S T O C H E T A L .
FIG. 11. Barotropic southward transport through the Denmark Straitat 668N (solid thick, Sv) and heat transport across the GSR (dashed,TW). Shown also are maximum wind stress curl in the region 628–708N, 358W–58E (solid thin, 1027 N m23). All data are smoothedover 1 yr.
FIG. 12. Heat transport across the sills vs barotropic transportthrough the Denmark Strait for the different idealized experimentsand for the different years of the realistic model. The lines show fitsfor the wind cases (WIND, 2 3 WIND, 4 3 WIND, solid line), thetemperature cases (WIND, 1.5 3 TEMP, 2 3 TEMP, dashed) and theyears 1993–97 of the realistic experiment (dotted line). The dash–dotted line is the fit where years 1993–97 are successively correctedby the reduced temperature contrast between GIN Seas and subpolarNorth Atlantic according to the idealized temperature experiments.
with most of the correlation resulting from the seasonalcycle with typical amplitudes in barotropic transportchanges of about 2 Sv and 2.2 3 1027 N m23 in thewind stress curl. As indicated by Fig. 11, an almostexact relation holds for the trend.
Using the results of the idealized experiments weshould be able to predict the increase in heat and bar-otropic transports across the ridge that would result fromthe observed 40% variations in wind stress forcing. Ac-cording to Fig. 8 this would result in an increase in heattransport of 10 TW, which is only slightly larger thanthe heat transport seasonal cycle actually simulated inthe realistic experiment (7.5 TW). The seasonal cycleof the barotropic transport predicted from a 40% windincrease would result in 2.4 Sv.
In summary, both heat and barotropic transports arepredicted to be too high by about 25% in comparisonwith the realistic experiment, which implies that someadditional processes must be involved in their seasonalvariations. Yet the wind effect seems to dominate therealistic model transport variability and is of the sameorder as predicted by the idealized runs.
A pronounced trend is underlying the seasonal cyclein all time series and illustrates the significant decreaseof the wind forcing over the subpolar North Atlanticduring the 1990s associated with variations in the NAO.From Fig. 11 it can be concluded that the barotropictransport between the subpolar North Atlantic and theGIN Seas decreases simultaneously with the wind stress.Quite strikingly, the heat transport shows the same in-terannual decrease, indicating that those changes arelikely wind induced and in fact could describe changesin the heat exchange across the GSR due to variationsof the wind over the GIN Seas on NAO timescales. Wenote however, that the heat transport trend shows a largerdrop in 1992/93, which as discussed before, is relatedto the initial model adjustments and associated changes
in the cross-ridge temperature contrast. A similar butsmaller decrease in heat transport occurred also in 1996/97. Those events could describe effects that we wouldexpect to happen on longer timescales because of chang-es in buoyancy fluxes over the subpolar oceans and theresulting temperature contrast across the ridge that arenot properly represented in our model.
5. Discussion
The long-term goal of our work is to understand thesensitivity of transport variations between the subpolarNorth Atlantic and the GIN Seas to variation in atmo-spheric forcing over both basins and to simulate andexplain the variations that took place over the northernNorth Atlantic during the 1990s or before. The limited-domain model setup precludes an interpretation of long-term changes. However, the presence of the idealizedmodel sensitivity runs together with the simulation ofthe period 1992–97 does provide insight into the mech-anisms that dominated the realistic simulation and po-tentially the real ocean during this 6-yr period.
A summary of all our model runs is presented in Fig.12. This figure shows the time averages of the barotropictransports together with the cross-ridge heat transportfrom the idealized experiments and corresponding an-nual mean values from the realistic model run. Valuessummarizing the idealized runs are identical to arith-metic means of respective point clusters shown in Fig.8a. Based on those results, the behavior in the realisticmodel can be summarized as follows.
With relatively strong wind forcing in the beginning,the model shows a heat transport that corresponds to

2318 VOLUME 33J O U R N A L O F P H Y S I C A L O C E A N O G R A P H Y
about 2 times a normal condition (i.e., 2 3 WIND).Because of initial model adjustment, the interbasin tem-perature contrast decreases. This leads to a drop in heattransport as it would correspond to a decrease by 30%from 1.5 3 TEMP to normal conditions consistent witha rapid drop in heat transport. At the same time a sig-nificant reduction in wind forcing led to a reduction inthe barotropic circulation from 9 to 6.5 Sv between years1992 and 1993. However, after this adjustment, all sub-sequent years show heat transport variations that arecompatible in their relation to barotropic transport var-iations with those predicted by the idealized model runs.They correspond to wind changes of 650% around nor-mal conditions and show a gradual decrease in baro-tropic transport from about 6 Sv in 1993 to 3 Sv in1997. Using the results of the idealized model, we haveestimated the change in heat transport that is caused bythis artificial reduction from the idealized runs and usedit subsequently to correct the relation between baro-tropic transport and heat transport for the years after1992. The resulting line collapses onto the trend thatdescribes the wind dependence in the idealized modelruns over the full 6-yr period 1992–97.
The implications of Figs. 11 and 12 are as interestingas they are encouraging. The former figure shows thatthe realistic wind changes over the northern North At-lantic are on the order of 1–2 times normal conditionsand thus consistent with the range covered by our sen-sitivity studies as simulated. Moreover, the figure in-dicates that those changes took place with roughly thesame amplitude on annual periods and over several yearsassociated with cycles of the NAO. Figure 12 thenshows that the response of the full system is identicalto that of the idealized experiments on interannual time-scales. Not shown in the figure is the seasonal cyclethat would lead to an oscillatory behavior along theregression line from high values in 1992 down to lowvalues in 1997. Accordingly the heat and volume ex-change between the North Atlantic and GIN Seas systemto observed changes in wind forcing can now be pre-dicted from the idealized runs.
We recall that our model shows a sensitivity to windchanges that is similar to what was found for the DY-NAMO model, suggesting that results shown here aregeneric and not specific to our model setup and reso-lution. To the extent that we simulate realistic condi-tions, our results suggest that one ought to be able topredict interbasin exchanges of volume and heat fromobserved or predicted wind stress changes on seasonal,interannual, or even longer timescales.
One important aspect remains to be discussed: ob-servations suggested no seasonal cycle in DSOW trans-port (Jonsson 1999), while we do show significant var-iations in volume and heat transport. This contradictionmight be resolved by noting that, while the deep flowfield in the Denmark Strait remains unchanged, the shal-lower part at the shelf break varies and contributes asignificant portion to the overflow (Girton et al. 2001).
This fact, which has been overlooked until now, callsfor a dedicated observing campaign and might clarifythe role of the shallow shelf region off Greenland. Firstattempts to obtain longer-term measurements in that areaare under way within the framework of the Germanproject SFB 460 and comprise current meter measure-ments with trawl-protected equipment in regions thatwere formerly unaccessible because of heavy fishery(Macrander et al. 2002).
Acknowledgments. The computational support fromthe National Center for Atmospheric Research andthrough an NCAR grant from the National Partnershipfor Computational Infrastructure (NPACI) is acknowl-edged. Supported in part through NASA Grant NAG5-8623 and an ONR (NOPP) Grant N00014-99-1-1049,RHK was additionally supported through the GermanResearch Society (SFB-460). This is a contribution ofthe Consortium for Estimating the Circulation and Cli-mate of the Ocean (ECCO) funded by the NationalOceanographic Partnership Program. We thank theanonymous reviewers for their constructive criticismthat helped to improve the manuscript.
REFERENCES
Adcroft, A., C. Hill, and J. Marshall, 1997: Representation of to-pography by shaved cells in a height coordinate ocean model.Mon. Wea. Rev., 125, 2293–2315.
Blindheim, J., V. Borovkov, B. Hansen, S.-A. Malmberg, W. R. Tur-rell, and S. Østerhus, 2000: Upper layer cooling and fresheningin the Norwegean Sea in relation to atmospheric forcing. Deep-Sea Res., 47, 655–680.
Dickson, R. R., and J. Brown, 1994: The production of North AtlanticDeep Water: Sources, rates and pathways. J. Geophys. Res., 99,12 319–12 341.
DYNAMO Group, 1997: DYNAMO, Dynamics of North AtlanticModels: Simulation and assimilation with high resolution mod-els. Berichte aus dem Institut fur Meereskunde Kiel No. 294,334 pp.
Girton, J. B., T. B. Sanford, and R. H. Kase, 2001: Synoptic sectionsof the Denmark Strait Overflow. Geophys. Res. Lett., 28, 1619–1622.
Hansen, B., and S. Østerhus, 2000: North Atlantic–Nordic Seas ex-changes. Progress in Oceanography, Vol. 45, Pergamon, 109–208.
——, W. R. Turrell, and S. Østerhus, 2001: Decreasing overflow fromthe Nordic Seas into the Atlantic Ocean through the Faroe Bankchannel since 1950. Nature, 411, 927–930.
Jonsson, S., 1999: The circulation in the northern part of the DenmarkStrait and its variability. ICES Tech. Rep. 1999/L, 6, 9 pp.
Kase, R. H., and A. Oschlies, 2000: Flow through Denmark Strait.J. Geophys. Res., 105, 28 527–28 546.
——, A. Biastoch, and D. B. Stammer, 2001: On the mid-depth cir-culation in the Labrador and Irminger Seas. Geophys. Res. Lett.,28, 3433–3436.
——, J. B. Girton, and T. B. Sanford, 2003: Structure and variabilityof the Denmark Strait Overflow: Model and observations. J.Geophys. Res., 108, 3181, doi:10.1029/2002JC001548.
Large, W. G., J. C. McWillimas, and S. C. Doney, 1994: Oceanicvertical mixing: A review and a model with a nonlocal boundarylayer parameterization. Rev. Geophys., 32, 363–403.
Lavender, K. L., R. E. Davis, and W. B. Owens, 2000: Mid-depthrecirculation observed on the interior Labrador and IrmingerSeas by direct velocity measurements. Nature, 407, 66–69.

NOVEMBER 2003 2319B I A S T O C H E T A L .
Levitus, S., and T. Boyer, 1994: Temperature. Vol. 4, World OceanAtlas 1994, NOAA Atlas NESDIS 4, 117 pp.
Macrander, A., R. H. Kase, U. Send, H. Valdimarsson, and S. Jonsson,2002: Sustained measurements of the Denmark Strait Overflow.Proc. Second Meeting on the Physical Oceanography of SeaStraits, Villefranche, France, ONR, 165–167.
Marshall, J., A. Adcroft, C. Hill, L. Perelman, and C. Heisey, 1997a:A finite-volume, incompressible Navier Stokes model for studiesof the ocean on parallel computers. J. Geophys. Res., 102, 5753–5766.
——, C. Hill, L. Perelman, and A. Adcroft, 1997b: Hydrostatic, quasi-hydrostatic, and nonhydrostatic ocean modeling. J. Geophys.Res., 102, 5733–5752.
Milliff, R. F., and J. Morzel, 2001: The global distribution of thetime-averaged wind stress curl from NSCAT. J. Atmos. Sci., 58,109–131.
Ross, C. K., 1984: Temperature-salinity characteristics of the ‘‘over-flow’’ water in Denmark Strait during ‘‘OVERFLOW ’73,’’Rapp. P. V. Reun. Cons. Int. Explor. Mer, 185, 111–119.
Rudels, B., P. Eriksson, H. Gronval, R. Hietala, and J. Launiainen,1999: Hydrographic observations in Denmark Strait in fall 1997,and their implications for the entrainment into the overflowplume. Geophys. Res. Lett., 26, 1325–1328.
Spall, M. A., and R. S. Pickart, 2003: Wind-driven recirculations andexchange in the Labrador and Irminger Seas. J. Phys. Oceanogr.,33, 1829–1845.
Stammer, D., and Coauthors, 2002: The global ocean circulation dur-ing 1992–1997, estimated from ocean observations and a generalcirculation model. J. Geophys. Res., 107, 3118, doi:10.1029/2001JC000888.
——, and Coauthors, 2003: Volume, heat, and freshwater transportsof the global ocean circulation 1993–2000, estimated from ageneral circulation model constrained by World Ocean Circu-lation Experiment (WOCE) data. J. Geophys. Res., 108, 3007,doi:10.1029/2001JC001115.
Willebrand, J., and Coauthors, 2001: Circulation characteristics inthree eddy-permitting models of the North Atlantic. Progress inOceanography, Vol. 48, Pergamon, 123–161.