the service cost - unit value retail continuum and the
TRANSCRIPT

Centre for International Business History
Discussion Paper Number: IBH-2014-02
Discussion Paper
The Service Cost – Unit Value Retail Continuum and the Demise of the American ‘Five and Dime’ Variety Store, 1914–1941
November 2014
Peter Scott Henley Business School, University of Reading
James Walker Henley Business School, University of Reading

ii © Scott and Walker, November 2014
The aim of this discussion paper series is to disseminate new research of academic distinction. Papers are preliminary drafts, circulated to stimulate discussion and critical comment. Henley Business School is triple accredited and home to over 100 academic faculty who undertake research in a wide range of fields from ethics and finance to international business and marketing.
www.henley.ac.uk/research/research-centres/the-centre-for-international-business-history
© Scott and Walker, November 2014
Henley Discussion Paper Series
© Scott and Walker, November 2014 1
The Service Cost – Unit Value Retail Continuum and the
Demise of the American ‘Five and Dime’ Variety Store,
1914–1941
Abstract
We examine a classic ‘wheel of retailing’ episode – the abandonment of the five and dime pricing
formula by American variety chains. Variety stores moved from a conventional product lifecycle,
focusing on cost reduction through standardisation, to an inverse movement up the ‘service cost
- unit value’ continuum. We show that, rather than reflecting deteriorating managerial acumen,
this was a response to market saturation in their low price niche. However, rapid changes in
retailing methods entailed significant risks, while - even where these were successfully
negotiated - higher sales came at the cost of lower margins and an erosion of competitive
advantage.
Keywords
retailing, business models, marketing, pricing
JEL Classifications
L81, M3, D49
Contacts

Centre for International Business History
2 © Scott and Walker, November 2014
Introduction
For more than half a century, work on long-term retail change has discussed the ‘wheel of
retailing’ hypothesis. This argues that new retail modes frequently emerge at the bottom end of
the price and service spectrum, using low-cost, low margin, ‘no-frills’ formats to undercut
established competitors. However, once well-established, such retailers typically up-grade
services and facilities, thus raising costs and prices and leaving themselves vulnerable to a new
wave of low-cost entrants.
The wheel of retailing is more properly characterised as a hypothesis than a theory. It was first
proposed by Malcolm McNair (who undertook extensive research on chain and department
store retailers), as early as 1931, though it was not until he re-stated and elaborated the model
in 1958 that it began to attract widespread attention.1 McNair suggested that new types of
retailer usually enter the market with an innovation that reduces operating costs, thus enabling
them to cut margins. However, over time they up-grade their business model, with consequent
increases in expense ratios. This process culminates in their entering a ‘mature’ phase as higher-
cost, higher-service retailers; creating space for new retail formats to emerge at the bottom of
the market. The enduring appeal of this ‘theory’ is that it describes a frequently (though not
universally) observed phenomenon in retail change.2 Formats said to be characterised by this
process include variety and other chain stores, supermarkets, discount stores, catalogue
showrooms, warehouse clubs, home-shopping networks, and on-line auctions.3
Conversely, critics have highlighted the lack of any obvious motive for retailers to abandon a
profitable business niche in favour of higher-price markets, where they would typically face
greater competition from established retail formats. A review of early studies by Stanley
Hollander identified various explanations, including the deterioration of managerial acumen and
development of a lax attitude towards cost control as retailers acquire status and wealth (the
explanation originally proposed by McNair); market imperfections such as resale price
maintenance, restrictive trade associations, and an aversion to price wars (leading to growing
emphasis on non-price competition through services); and improvements in living standards
which transform an initially large ‘no frills’ retail segment into a progressively smaller one (but
still sufficient to attract further new entrants).4 Stephen Brown, writing over 30 years later, noted
that very few additions to Hollander’s original inventory of proposed causes had been added by
subsequent research.5 One of the most interesting further contributions was to conceptualise
the wheel process as a lifecycle phenomenon, akin to the product lifecycle. However the
maturity phase was still explained in terms of the dissipation of managerial vitality, or the

Henley Discussion Paper Series
© Scott and Walker, November 2014 3
extension of the business beyond the capabilities of its managerial team.6 The wheel model still
lacks any over-riding explanatory framework and has thus been criticised for being deterministic,
inflexible, pattern- rather than process-orientated, and for portraying management as essentially
powerless in moderating this process.7
This study assesses the reasons underpinning one classic example of the wheel phenomenon,
the abandonment of the five and dime format by American variety stores. Five and dime chains
experienced very rapid growth over the four decades to the end of the First World War.
However, by the 1920s most had overridden their 10c price limits (with the notable exception
of Woolworths) and by the late 1930s virtually all had raised their price limits to a dollar or
more, or had no price limit. Using the archives of the two largest chains, Woolworths and S.S.
Kresge, together with the archival and published papers of the Harvard Bureau of Business
Research (HBBR) variety chain store surveys, we examine the causes of this transition.
Most classic explanations of why firms might abandon a profitable business niche in favour of
higher-price markets posited by the literature can be easily dismissed for the variety store sector.
Five and dime chains had a vigorous profit-driven management remuneration and promotion
culture, making it an unlikely candidate for managerial inertia or a lax attitude towards costs.
Resale price maintenance was also unimportant in this sector – as retailers sought to take
control over their supply chains wherever possible – often dictating product specifications, and
sometimes even production methods, to manufacturers. For example, over half of W.T. Grant’s
merchandise was produced to its own specifications and a large proportion was sold under its
own brands.8 Furthermore, rather than facing declining consumer demand, low price ceiling
variety stores are shown not only to have remained viable in the 1930s, but to have consistently
produced higher profit margins than those chains which adopted higher limits. Moves to higher
price ceilings were largely a response to market saturation – though the hypothesis of an
aversion to price wars is shown to be relevant, there being a general belief among variety chains
that competing with retailers of higher ticket items – such as department stores and line-
specialised multiples - would be easier than head-on competition with other the five and dime
operators.
As such the variety chain lifecycle (and, by extension, the lifecycle of other low-price retail
formats), can be seen as being broadly inverse to the product life cycle (PLC). A key feature of the
PLC model is that as markets mature, products become increasingly standardised, offering
reductions in production costs for large firms, able to magnify the benefits of cost-reducing
process innovations through economies of scale. While the PLC hypothesis leads to a movement
from complexity to cost reduction and standardisation, the opposite is the case under the wheel
Centre for International Business History
4 © Scott and Walker, November 2014
of retailing, where mature firms move from extreme standardisation of products and price
points to increasingly complex product categories – requiring a growing element of customer
service. This transition is problematic, as shifting into more complex products requires a
different business model, characterised by growing managerial complexity, uncertainty (given
their lack of experience of the new market and of knowledge regarding the competitive reaction
of incumbents) and adverse impacts on their established product lines.
A model of retail change – the service cost - unit value
continuum
A strategy of up-grading products and associated services is not without risk, as suggested by the
broader literature on product range extension and corporate performance.9 Change is a process
that requires substantial managerial time and resources, making established capabilities less
relevant and disrupting organisational routines.10 The literature predicts that firms which expand
their product scope too dramatically may run into rigidities in existing resources and
capabilities, hampering effective change due to imperfect learning and/or impediments on
resource reconfiguration.11 Over-ambitious extensions of product/service offerings may also
produce disproportionate increases in their cost base and even reduce revenue in extreme
cases.12 Moreover, firms may not always have the managerial capabilities or appropriate
organizational structures to efficiently absorb such changes without inefficient and costly
adjustment and coordination problems.13
As this study shows, attempts by variety chains to move up the retailing wheel entailed
embracing fashion merchandise, that required a significant degree of personal selling - thus
raising unit labour (and, indirectly, other) costs. Five and dime goods in turn came to be seen as
a wasteful employment for highly-trained salespeople, leading to the progressive
marginalisation of low-price lines and thus undermining their established competitive
advantage. The potential for cost inflation is also influenced by the degree of competition faced
by firms as they shift to higher market segments. Variety stores had carefully avoided
competition between each other by segmenting the market geographically. However, by
moving into higher end merchandise, they brought themselves into direct competition with
department and speciality stores. One way to avoid this was to move into communities too
small to support department stores. However, these were often smaller than even the variety
chains had hitherto considered suitable and the new, smaller, stores proved less efficient,
eroding overall profit margins. An alternative strategy of expanding existing stores thus looked
Henley Discussion Paper Series
© Scott and Walker, November 2014 5
increasingly attractive. Yet many were already as large as was justified by the local market for
10c, or even 25c, merchandise.
The traditional variety store business model was based on high throughput of low unit value
goods – at the base of the service cost - unit value retail continuum. By the 1930s variety store
business models had fanned out over a broader range of this spectrum. A contemporary survey
classified them into three groups: Class A - price range 5c - 25c, low average sale; B - up to $1,
low average sale; and C - up to $1, high average sale.14 The upper bounds of groups B and C
increasingly overlapped with ‘junior department stores’ – small department stores selling a
limited range of goods at relatively low prices – exemplified by J.C. Penney. They also increasingly
competed with lower-end line specialised multiples, drug stores, and with the staple
merchandise of down-market mainstream department stores.
[Figure 1 near here]
Figure 1 shows the relationship between unit costs and services provision in different types of
store, for retailers with a broad product mix of mainly non-food items. In practice, given their
broad product selection, both unit prices and associated services varied substantially within
each store. However, the classification is important, as it determined the level of human and
physical capital required to sustain the format, with major implications for costs and price mark-
ups. In terms of market segmentation, variety stores were strongly segmented by price and
services, yet attracted customers across a broad social spectrum. High grade department stores
were strongly segmented by both price and the class of customer served. Meanwhile retail
formats in the middle of the spectrum sold products encompassing a wide price range to a
broad section of the population and thus enjoyed the largest markets –constituting a
particularly attractive target for variety stores that perceived themselves to have achieved
market saturation within their price class.
The rise of the five and dime format
The five and dime store was not the first fixed price retail format to emerge in the USA. The early
1870s witnessed the spread of ‘99c stores’, which were hugely successful for several years.
However, by the 1880s their popularity had started to wane, as they began selling goods at
higher price points (usually multiples of 99c), some eventually developing into regular
department stores.15 The origin of the five and dime format can be traced to around 1877, when
a drummer for the New York jobbers Spellman is said to have established a ‘5c counter’ in a
Michigan store, which proved very successful.16 F.W. Woolworth’s employer, Moore & Smith,

Centre for International Business History
6 © Scott and Walker, November 2014
copied this format from September 1878. Later corporate histories claim that Woolworth was
put in charge of the counter, though a first-hand account by Woolworth merely states that he
was ‘watching this counter very carefully’.17 Woolworth also noted that by January 1879, when
he approached Mr Moore with the proposition that he should open a 5c store, these were
already being successfully developed in New York state. Thus Woolworth was an early pioneer of
the five and dime format, but not the originator.18
Woolworth developed the classic five and dime retail model, selling a wide selection of
merchandise at low, fixed, clearly-marked prices, in large open stores, where customers were
free to browse. Profit was based on sales volumes rather than high margins, store managers were
paid by results, and business was conducted on a cash-only basis.19 Woolworths eschewed press
advertising, relying on price appeal, strong retail branding (including extensive window display),
and word of mouth advertising.20 This required locations with high footfall; it was said that the
high proportional tenancy costs of five and dime chains incorporated an element of advertising
expense.21
Woolworths believed that under their sales formula goods sold themselves, the sales clerks’
duties being limited to wrapping purchases, making change, and keeping counters orderly
stocked and price tagged. As a result they generally employed young girls, living with their
parents, who were paid relatively low wages. In his annual letter of 1892 Woolworth noted that,
‘We must have cheap help or we cannot sell cheap goods. When a sales clerk gets so good she
can get better wages elsewhere, let her go – for it does not require skilled and experienced
salesladies to sell our goods.’22 His views had moderated slightly by 1899, acknowledging that
there might be a case for paying slightly more to retain good staff.23 Yet even in 1933 the
average age of Woolworths’ sales girls was only 21 and their duties had changed little.24
While the sales clerk’s job was simpler than in most stores, the manager’s task was more
challenging.25 In addition to the usual store management tasks (some of which, such as
deterring shop-lifting, were accentuated by open display), they needed to ensure that only the
fastest-selling lines were stocked, as rapid turnover was crucial to operating profitably at low
price points. Successful recruitment and supervision of store managers proved a key challenge
for the new five and dime chains.26 Woolworth adopted a system of management remuneration
based on a percentage of the store’s annual profit, plus a drawing account of $10 a week,
deducted from this commission.
Woolworths (and the other variety chains) also employed senior buyers and other executives on
a profit-sharing basis; making managerial positions very lucrative. Again, there was a clear
Henley Discussion Paper Series
© Scott and Walker, November 2014 7
business rationale. The onus on rapid stock-turn involved heavy reliance on successful buyers,
whose skill and effort played an important role in the overall success of the chain.27 Coordinating
the operations of their mushrooming branch networks and optimising stock-turn by weeding-
out all but the fastest-selling lines also entailed significant management skill - to collate and
interpret the mass of data flowing from the stores to divisional and head office. For example,
when Charlie Griswold became Woolworths’ General Manager in 1915, he felt it necessary to
divide each store into 32 merchandise departments, with weekly and sometimes daily reports
required for each.28
By the turn of the century a number of other major variety store chains had emerged, generally
founded by ‘old-stock’ protestants from rural areas and small towns in the north eastern United
States.29 For example, Sebastian Spering Kresge, founder of America’s second-largest five and
dime chain, was a former tinware and hardware salesman of Pennsylvania Dutch heritage.30 In
the course of this work be became personally acquainted with F.W. Woolworth and another five
and dime pioneer, J.G. McCrory (for whom he managed a store in Memphis Tennessee, owning a
half interest, as well as a half interest in a store later opened in Detroit in 1899). Later that year
he parted company with McCrory, taking full ownership in the Detroit store in exchange for his
half share of the Memphis store.31
By 1914 five chains dominated the US variety store sector: Woolworths (737 stores,
$69,619,669 sales); S.S. Kresge (118 stores, $16,097,393 sales); S.H. Kress (118 stores;
$11,897,989 sales); J.G. McCrory (116 stores, $5,224,692 sales); and W.T. Grant (16 stores,
£2,000,908 sales).32 These had so far largely avoided significant direct competition. For example,
despite operating some 238 U.S. stores, in 24 states plus Washington DC by the end of 1909
(prior to the 1911 merger with five affiliated chains), Woolworths only faced direct competition
at 52 locations, including Kresge at 18 points and McCrory at 10.33 This reflected policies aimed
at avoiding head-on competition. For example, Samuel H. Kress, who opened his first store, in
Memphis Tennessee, in 1896, chose to focus on the south because that region had no five and
ten’s.34 At an early stage he made a deal with Sebastian S. Kresge to avoid each other’s territories
(said to be at least partly on account of potential customer confusion, given their similar names
and signage). Subsequently, no Kress and Kresge stores ever appeared on the same main
street.35

Centre for International Business History
8 © Scott and Walker, November 2014
Pressures for higher price points
F.W. Woolworth was aware of the demise of the 99c stores and was keen to avoid the same fate.
In a General Letter of October 1910 he warned of the danger of drifting into higher price points,
reminding his staff of this earlier episode.36 Conversely, W.T. Grant had operated with a 25c price
limit from the start, while in 1901 Kress raised his maximum price point from 10 to 25c.37
Inflation during the First World War (with retail prices rising by almost 80 per cent over 1914-
19) produced a general trend towards higher price ceilings; Woolworths was the only large US
variety chain which retained its 10c price limit.38 However, despite a substantial long-term
decline in retail prices over the 1920s and 1930s, variety stores continued to raise their price
ceilings; by 1927 most had a maximum price of $1 or more.39 Maximum price ceiling policies
were also coming under pressure; by 1922 Kresge were selling special millinery at up to $5 in
their 25c - $1 stores, while their range of over-a-dollar merchandise subsequently expanded.40
Rising price limits were largely a response to the onset of market saturation for the five and dime
retail format. Even the largest chain, Woolworths, was only active in 37 states at the beginning of
1912. Yet by 1920 there was no town of over 8,000 people in the USA without a Woolworths.41
Their policy was to avoid smaller communities; though pressures for expansion led to a
relaxation of this restriction during the 1930s.42 Other variety chains also moved into smaller
towns. Fifteen identical chains, which provided data annually to the Harvard Bureau of Business
Research over 1932-39, increased their number of outlets in towns of under 10,000 population
by 23.71 per cent during this period, compared to an increase in total store numbers of only
8.32 per cent.43 Geographical expansion via smaller units raised aggregate sales, but at the cost
of reducing average sales per store and, therefore, productivity. Meanwhile gross margins
decreased slightly, while tenancy costs proved difficult to squeeze, substantially raising rents as a
proportion of overall costs, and of sales. This led to a sharp fall in net profit, despite a fall in
payroll costs.44
Variety chains thus increasingly looked towards an alternative policy of expanding existing stores
– a strategy facilitated by higher maximum price points. For example, the G.C. Murphy chain
rejected developing smaller stores in favour of expanding existing stores and broadening their
merchandise selection. This policy assisted them in achieving average sales per store in 1936
above those for Woolworth, Newberry, and McLellan and not far short of Grant, McCrory, and
Kresge (all of which they were to overtake, on this measure, by 1940), despite a focus on
relatively small towns. A key element of Murphy’s strategy was the use of higher price points to
expand lines such as clothing, which became an increasingly important part of their overall

Henley Discussion Paper Series
© Scott and Walker, November 2014 9
business. This enabled them to act as de facto department stores in many small communities, a
strategy which had long been successfully pursued by the J.C. Penney chain.45
Market saturation also limited the prospects of managerial recruits.46 Kresge responded by
changing their recruitment policy. An October 1935 letter to stores noted that while they had
previously discouraged the employment of men aged under 21 on account of the rapidity of
promotions, the increased ‘training’ period that managers now faced removed any objection to
recruiting outstanding men from age 18.47 Despite such initiatives, as promotion was based on
rising through the ranks, from trainees to managers at small, then progressively larger, stores,
before possible promotion to regional or head office, slower growth weakened incentives for
bright, ambitious, recruits.
Although variety stores fared the depression much better than the department stores with
whom they were increasingly competing, they nevertheless witnessed a pronounced dip in
profits. Fifteen identical variety chains analysed by the HBBR annually over 1929-1940 saw their
aggregate net operating profits fall from 5.93 per cent of net sales in 1929 to only 0.31 per cent
in 1932 and an annual average of 3.88 per cent over 1933-1940.48 The three largest variety
chains, Woolworth, Kresge, and Kress, witnessed a fall in their collective market share of the top
ten chains from over 70 per cent in 1929 to just over 61 per cent in 1940.49 Some chains fared
much worse; in 1933 both McCrory and McLellan Stores Co. (which had been the fifth and sixth
largest variety store chains respectively in 1929), fell into receivership, both being subsequently
recapitalised under new managements.50
Even Woolworths, which dominated variety store retailing, accounting for over a third of variety
store chain units, and 37.2 per cent of sales in 1929, eventually abandoned its 10c price ceiling
(or 15c for stores west of the Missouri or in Canada, which faced additional transport or tax
costs). Merchandise priced at 20c was successfully tested in 77 stores from March 1932 and
generally adopted three months later. Then, in the face of rising expenses, and the general trend
towards higher price points, a Board meeting of 13th November 1935 abandoned any fixed
price limit.51 Thus, by the end of the depression, the era of the five and dime store was effectively
over.
The impacts of higher price ceilings
Introducing $1 or higher price ceilings had profound impacts on the nature of variety store
merchandise. As the 1936 HBBR variety chain survey noted, ‘The very nature of the limited price
variety chain business makes it inevitable that price policies are also merchandise policies.
Centre for International Business History
10 © Scott and Walker, November 2014
Chains which place their reliance chiefly on nickel and dime business obviously cannot handle so
large a proportion of... apparel and dry goods as do companies with price limits running to $1 or
beyond’.52
At least some chains were aware that higher-priced lines might impact on their brand image and
selling methods in ways detrimental to five and dime trade. Kresge initially dealt with this by
opening a second chain of ‘Green Front’ stores in 1920, with goods priced from 25c to $1, in
addition to their ‘Red Front’ nickel and dime stores.53 These parallel chains (often located side by
side) were controlled jointly from their Detroit head office and came under the same real estate
management. However, they had different sets of buyers and personnel managers, reflecting
their different labor and merchandise requirements.54 Murphy’s introduction of a dollar price
limit in around 1923 was accompanied by a vertical, rather than horizontal, outlet segmentation
strategy, with their 25c - $1 and 5 & 10c lines being split between separate floors of the same
buildings. Each floor had its own staff, store number, and external signage, to prevent damage to
Murphy’s brand image as a five and dime retailer. However, this policy entailed splitting related
items in the same product class, a problem that led to the integration of all their stores by
1928.55
Kresge’s difficulties during the depression (accentuated by a strong presence in large auto, steel,
and other heavy industry towns) eventually forced it to also abandon a two chain policy. Kresge’s
“Green Front” stores were particularly hard-hit, as depression intensified competition with
department and speciality stores. Their share price fell from $57.50 to a low of $5.50 and Kresge
responded by broadening its stock, their Green Front stores raising their price ceiling to $3.56
Then, during the mid-1930s, they began combining the Green and Red Fronts into
“combination” stores. In 1940 the buying divisions for the two store groups were also
integrated.57
The down-side of this policy was that five and dime sales could not operate efficiently alongside
higher value merchandise. Five and ten lines came to be seen as loss-leaders to pull in
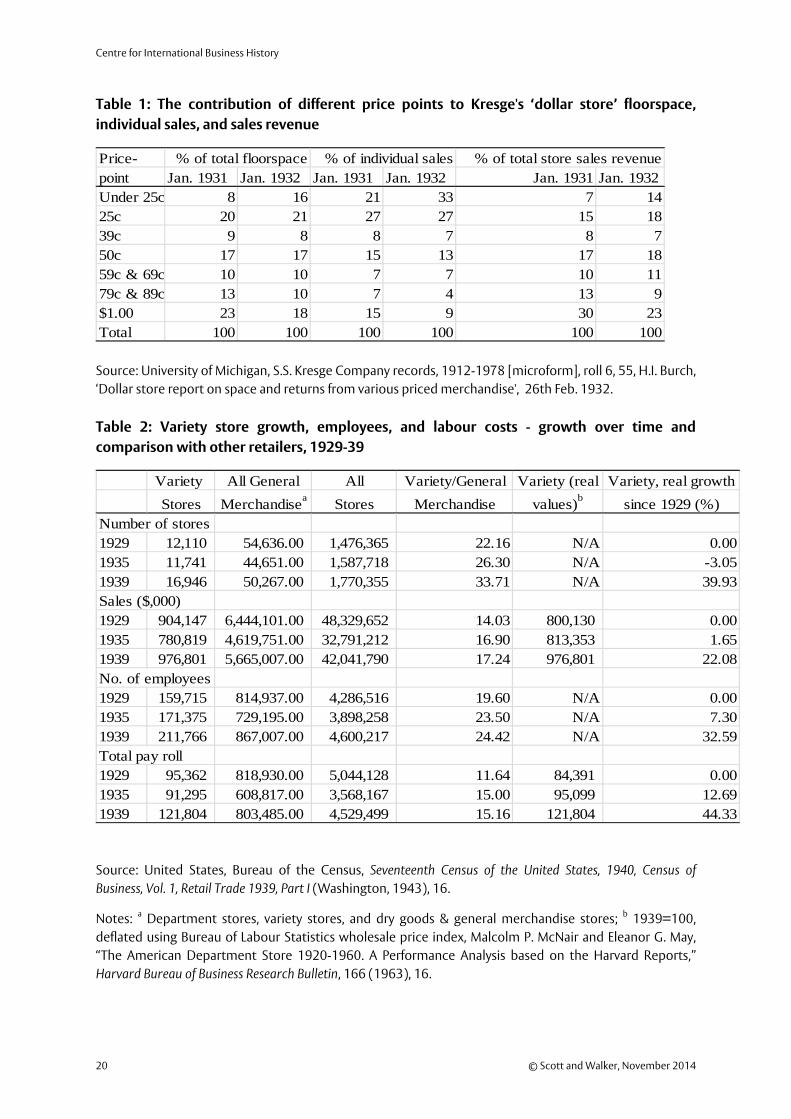
customers, rather than important earners in their own right. Table 1 shows the results of a 1932
Kresge audit of their 25c to $1.00 stores, recording the relationship between their various price
points, the amount of space given to each, and their sales. While only 20 per cent of customers
bought items priced above 50c, these accounted for 43 per cent of sales revenue, while the
goods took up only 38 per cent of counter space. Conversely, merchandise sold for 25c or less
took up 37 per cent of floorspace and accounted for 60 per cent of individual transactions, but
contributed only 32 per cent to total revenue. A clear trend towards a lower average sale than in
the previous year was identified, with 80 per cent of customers buying merchandise priced at
Henley Discussion Paper Series
© Scott and Walker, November 2014 11
50c or less. Yet, rather than wishing to further boost sales in this price range, staff were urged, ‘to
realize the importance of increasing the number of sales on higher priced items. The customers
have shown that they favour low prices, and we propose to feature and show low prices to get
them into the store, but we can increase the number of sales on higher priced items by sale
suggestion and good salesmanship.’58
The memorandum went on to note that, ‘Right now we have a great many outstanding $1 items,
but with Department Stores and direct competitors playing up low prices, we cannot feature the
$1 price. Our opportunity lies in bringing customers into the store with low priced items and
then showing and selling higher priced merchandise’.59 In other words, Kresge were advocating a
strategy similar to that employed by many down-market department stores.
[Table 1 near here]
Higher price limits opened up a much larger, but increasingly crowded, market. In addition to
well-entrenched competition from a ‘mature’ department store sector, many of their new lines
were facing rising competition from speciality chains in menswear, women’s apparel, millinery,
footwear, and hosiery. Moreover, drug stores were also extending their range of merchandise.60
Nevertheless, variety chains appear to have preferred taking on such competition (where they
still enjoyed some cost advantage over established retailers, who typically had grander premises
and more elaborate services), to head-on battles against other variety stores. Five and dime
merchandise required high margins to justify high handling costs per dollar of sales and, given
that variety stores mainly competed on price, intense direct competition might reduce these to
unprofitable levels. Moreover, given that much consumer expenditure occurred at prices over
25c, these appeared to offer greater prospects for long-term growth.
Indeed this strategy proved successful in increasing variety stores’ share of general merchandise
trade from 14.03 per cent in 1929 to 17.24 per cent in 1939, as shown in Table 2. This was
achieved at the cost of a much larger proportional rise in the number of retail units – partly
owing to the expansion into smaller communities, discussed earlier. Ominously, the 22.08 per
cent increase in real variety store sales over this period occurred at the cost of a 44.33 per cent
rise in pay-roll expenses and a 32.59 per cent rise in their number of employees; implying
negative labour productivity.
[Table 2 near here]
Competition in the over 25c market proved more difficult than the variety stores had
anticipated. Even the department stores, which had the highest advertising and service costs of

Centre for International Business History
12 © Scott and Walker, November 2014
any large-scale retail format, managed to increase their share of total retail sales slightly above
1929 levels during the mid and late 1930s. Given their high sunk costs of expensive premises
and accumulated good-will, most remained in operation even if they failed to cover total costs,
while some were prepared to hold on even when revenue did not meet variable costs, in the
hope of a return to better times. Department stores collectively generated a positive operating
profit for only three years over 1930-39, yet they increased their market share through sale
promotions and aggressive price competition to boost turnover and thus offset heavy fixed
costs, even where this entailed unattractive margins.61
During the 1930s variety stores increasingly found themselves moving into items with a fashion
element and thus began to encounter some of the merchandising problems of department
stores. Style goods typically had high original mark-ups, heavy mark-downs, and high selling
expenses.62 Five and dime trade was labour-intensive in that it entailed a great number of
repetitive, low-skilled, transactions - wrapping goods and giving change for large volumes of low-
value items.63 Higher-value goods were labour-intensive in a different sense; the number of
transactions was lower, but each took longer, as staff were expected to offer both assistance and
advice regarding intended purchases and suggestions regarding complementary items. By 1932
Kresge were strongly advocating a policy of pushing high gross margin items (compared to the
average for each department) in their dollar stores, using ‘suggestive selling’. This entailed
adopting elements of the skilled, personal, selling approach that had traditionally sharply
demarcated the department and variety store business models.64 High margin items were
indicated by the presence of one or more ‘Red Stars’ on counters, so that the saleswomen knew
which to push.65 Recommending complementary items required significant sales knowledge
and training. As a 1935 note to all managers argued:
Knowledge of merchandise… is the first essential to successful salesmanship. You
should possess this information in order to properly train your salesgirls in the art of
increasing each sale. Of equal importance is a thorough understanding of the best
methods for presenting your merchandise to the customer in such a manner that
interest is aroused and the salesgirls’ service appreciated... Verbal suggestions must be
followed up by intelligent comment... Few salesgirls are instinctively able to do this. It
is your duty to outline to them the various means of making suggestions effective...
and training them to use the right approach for making each suggestion “strike
home”.66
A further, June 1936, Kresge letter to stores noted that: ‘Whether or not we are realizing the
most from this demand for style items depends to a considerable degree upon how well “style”
minded our salesforce has become.’67 Sales staff were expected to keep themselves informed
Henley Discussion Paper Series
© Scott and Walker, November 2014 13
regarding the latest styles by studying fashion magazines. Kresge stores ran contests between
groups of salesgirls in a bid to increase their enthusiasm for direct selling.68 G.C. Murphy was also
urging its sales clerks to use ‘related item suggestion’, by 1929, assisted by systematic staff
training.69 W.T. Grant preferred sales staff to physically show customers additional merchandise -
‘additional showing’.70
Pushing high gross items via suggestive selling left variety chains vulnerable to opportunistic
behaviour by store managers who – in an effort to boost their profit-based commission - raised
margins to levels that negated their price advantage. As an October 1936 Kresge note to stores
warned: ‘Profiteering is an open invitation to every little store in town to step in and compete
with and undersell Kresge’s... the truly efficient manager… can be glad he is not in the shoes of
the profiteer when the truth is uncovered...’71 A 1935 investigation of 17 stores had revealed that
margins were typically higher than specified by head office. In one case a manager had requested
to raise prices:
to those of the independent hardware dealer, yet the items mentioned figured 41%
gross. He wanted 54%... A manufacturer writes in that his item is being sold at a higher
price than agreed on in all stores visited. What a reputation the Kresge organization
has with this man, and the others that have the experience of seeing their
merchandise being sold at a price where they know the most sales resistance lies!72
In the 1936 HBBR variety chain survey, McNair expressed pessimism regarding the move away
from the five and dime model. He noted that this entailed foregoing the strong promotional
appeal of low fixed price limits and brought with it different managerial problems of buying,
merchandising and sales promotion. Even if these challenges were overcome, he predicted a
decline in gross margins – owing to the increased likelihood of mark-downs for fashion items
and competitive pressures from long-established competitors in these lines. Firms might gain
some reduction in selling costs, which were strongly linked to the number of transactions,
though only if this was not offset by the need for more active and knowledgeable
salesmanship.73
Variety stores also began to adopt some of the promotional practices of the department store
sector, such as advertising and cut-price sales events.74 By the late 1930s Grant launched big
sales two or three times a year, supported by full-page ads, heavy with prices.75 Overall, McNair
predicted that decreased selling expenses would be insufficient to counteract lower gross
margins, thus reducing net margins. Stores would therefore only increase profits if they
produced sufficient extra sales volume to more than compensate for this.76 J.K. Winkler
concluded his 1940 biography of F.W. Woolworth on a similar note:

Centre for International Business History
14 © Scott and Walker, November 2014
The new prices bring Woolworth into keener competition with important department
stores. Also, the larger and bulkier goods handled require more space... Indeed, when
entering the streamlined, chromiumed emporiums on fashionable metropolitan
thoroughfares, the shopper may wonder whether he and his dime have not strayed
into the wrong place.77
Quantitative analysis of relationships between price
ceilings, costs, and revenue
The systematic compilation and analysis of variety chain cost data by the HBBR enables us to
examine relationships between merchandise policy, sales growth, costs, and net margins. HBBR
had undertaken annual surveys of department store operating costs since 1920/21, enabling
contributing firms to evaluate their performance relative to the sector as a whole.78 They later
extended this research to chain stores. The first HBBR variety chain store survey, for 1931 (with a
comparison for 1929), encompassed 33 chains operating some 2,565 stores. Conversely, the
1932 survey covered 29 chains, but – following the inclusion of Woolworths - around twice as
many stores, including practically all the large firms. From that date onward the surveys,
conducted annually, were broadly representative of the sector. It was estimated that during the
mid-late 1930s they captured over 90 per cent of total variety chain volume.79 The Harvard
studies included the Canadian stores of US variety chains, as well as several chains operating
entirely in Canada.80 The HBBR definition of a variety store was almost identical to that of the
Census Bureau, only one large national chain included in the HBBR sample not being so classified
by the Census Bureau in 1933.81 Most were local or regional chains. Of the 30 chains reporting in
1934, only seven were ‘national’ in scope, though most of these were not represented in all
states.82
The reports did not make reassuring reading. The first survey year, 1929, could be expected to
have been atypically bad for the 1920s, as the Christmas period (when variety stores generally
enjoyed heavy seasonal trade), was overshadowed by the Wall Street crash. Nevertheless, the
sector failed to equal its 1929 net profit rate83 of 5.93 percept at any point during the 1930s. As
Figure 2 shows, gross margins dipped during the depression, but then rose substantially in 1933
and remained significantly above 1929 levels for the rest of the decade. Total expenses generally
moved inversely with the economic cycle (a pattern also evident for department stores,
reflecting variations in consumer spending),84 but again remained substantially higher than in
1929, even at the peak of the upswing in 1936. Pay roll rose consistently after 1932; as Table 2

Henley Discussion Paper Series
© Scott and Walker, November 2014 15
showed, this mainly reflected a rise in the number of employees, which grew faster than either
real sales or total payroll expenses.
[Figure 2 near here]
A number of factors underpinning differences between the performance of variety chains were
identified. As might be expect, larger chains were found to reap managerial economies of scale
for those activities conducted centrally.85 Their greater purchasing power would also contribute
to lower purchase prices, providing higher gross margins at each price point. Average store size
was also identified as an important differentiator. Chains of small stores were found to suffer
from low stock-turn (a result also identified for other types of retailer); higher proportional
utility costs (reflecting lower sales per square foot and discounts sometimes offered for higher
consumption); higher labour costs; and lower labour productivity. This was partly offset by lower
tenancy costs, reflecting the limited purchasing power of small communities.86
Stores which retained a 25c limit (with an average sale of 17.5 cents in 1935) were found to have
markedly higher gross margins than ‘to a dollar’ stores, reflecting the higher handling cost to
price ratios for low unit value merchandise, together with their lower rates of mark-downs and
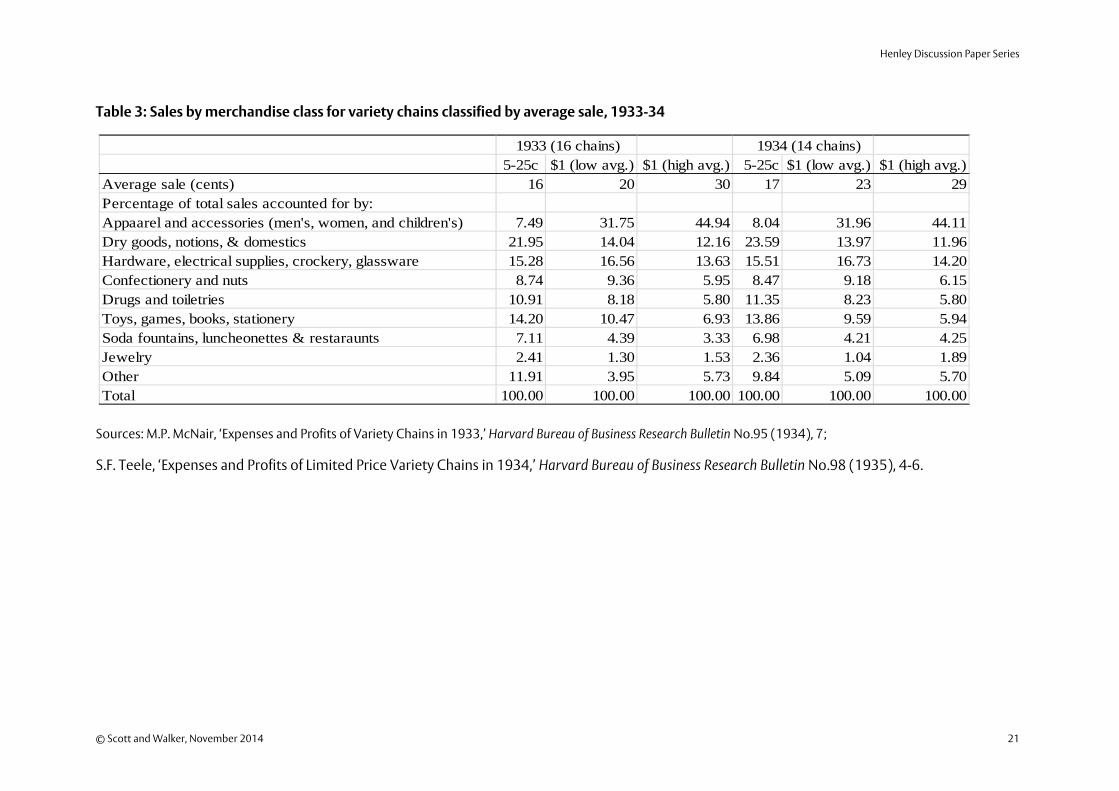
shortages.87 To a dollar stores had much higher proportionate apparel and accessories sales
(which were particularly prone to mark-downs and shortages, in common with other fashion-
related goods), as shown in Table 3. These accounted for only 7.49 per cent of sales for stores
with price limits of 25c or less in 1933, but 31.75 per cent of sales for dollar stores with a low
average sale and 44.94 per cent for dollar stores with a high average sale. However, HBBR found
that differences in the performance of variety chains could not be explained simply in terms of
variations in the proportion of apparel and accessory merchandise, which traditionally had
higher price mark-ups than goods of equivalent value, to compensate for mark-downs and
shortage losses.88 Pricing policies appear to have a broader impact, not confined to any
particular class of merchandise.
[Table 3 near here]
Cross-sectional aggregate evidence from the surveys suggests that 5-25c stores significantly out-
performed those with higher price limits. Table 4 shows operating results over 1933-35, for 5-
25c stores and $1 (or more) stores, the latter being disaggregated into those with low and high
average sales. Stores with lower price limits or average sales were found to have substantially
higher gross margins.89 Pay-roll costs were also shown to be higher for such stores which, like
gross margins, reflected the higher handling costs of small transactions. Tenancy costs were also
Centre for International Business History
16 © Scott and Walker, November 2014
higher; possibly due to the fact that five and dime stores required prime sites and passing trade,
whereas people were prepared to go out of their way for higher-value purchases.
[Table 4 near here]
Overall, despite lower costs in areas such as advertising, 25c stores were found to have slightly
higher expenses than $1 stores, while low average sale dollar stores had higher costs than high
average sale dollar stores. Yet the reduced costs were insufficient to offset the lower margins on
higher ticket goods, resulting in markedly lower trading profits, and total net gain as a
proportion of net sales, for stores with higher average unit prices. Dollar stores’ performance was
much better when measured using net gain as a proportion of net worth (invested capital).
However this was noted to be a problematic indicator, substantially influenced by the
proportion of stores the firm owned, rather than rented.90 Meanwhile net gain/sales ratios
corroborated the findings for net margins, that low price ceilings produced higher profit rates.
While the table suggests that stores with higher price limits, and average sales, had lower net
margins and net gains, relative to sales, the aggregate data do not provide conclusive evidence.
5-25c stores differed significantly from their higher-price counterparts in terms of average sales
per firm and per store – two factors which the surveys showed to have important impacts on
profitability. To disentangle the influence of average sale, firm size, and store size, analysis is
necessary at the level of the individual firm. While no original returns to these surveys have
survived, the HBBR archives, at Harvard's Baker Library, include worksheets providing some firm-
level data for 1929 and 1931-34. Table 5 shows available data for all national chains for 1933 and
1934 (other than McCrory and McLellan, for which no usable data are available, presumably
owing to the fact that they were in receivership).
As suggested above, W.T. Grant (the only chain shown with a high price limit and high average
sale policy) had a lower gross margin than the others, which was not compensated for by its
expense ratio, thus producing the lowest net margin among the five chains. However, in terms of
aggregate profits growth, it was more successful than its 25c price limit competitors – as this
margin was combined with a 20 per cent increase in dollar sales over 1929, while Woolworths,
Kresge, and Kress had all experienced falling sales. G.C. Murphy (essentially a large regional
chain) also had a higher price limit policy than Woolworths, Kresge, or Kress, but with a lower
average sale than Grant. Murphy’s achievement of both an attractive margin and rapid growth
reflected its strong focus on small towns with no department or variety stores (as reflected in its
low average sales per store). In these it developed a profitable local niche spanning both variety
and department store lines, in a similar manner to J.C. Penney.

Henley Discussion Paper Series
© Scott and Walker, November 2014 17
Grant’s success at applying the variety store formula to high ticket lines (many with a
considerable fashion element) entailed skilled management, reflected in its high stock turn - to
avoid heavy mark-downs. The risks associated with dependence on rapid stock turn of fashion
goods are illustrated by the example of McLellan, America’s sixth largest variety store chain in
1929. Their high unit price policy provided a 1932 gross margin of only 26.86 per cent, some
7.04 percentage points below their total expenses, forcing it into receivership. McNair’s
concerns regarding the risks of lower gross margins leading to declining (and potentially
negative) net profits in the absence of sufficient extra sales volume thus appear to have been
well-founded.
To generalise the results we utilise the HBBR archival data to examine the extent that firms with
higher price limits and average transactions sacrificed net margin for growth; and, therefore,
headline profits. The data cover three price ranges – Class A (5c to 25c price range, low average
transaction value); Class B (dollar price limit, low average transaction); Class C (dollar price limit,
high average transaction). The data enable us to control for firm level purchasing and
administrative scale economies from high aggregate sales, and for store-level technical scale
economies, proxied by average sales per store. The descriptive statistics relating to the sample of
sixteen firms are found in Table 6.
[Tables 6 and 7 near here]
Table 7 provides ordinary least squares estimates of firm net margins. These include a full set of
fixed effects, which may also indirectly capture firm and store level factors and other
unobservable elements. We also include year effects to capture economy-wide exogenous
impacts specific to any given year. In specification 1 the price bands are analysed using the
lowest price band, Class A, as the reference group. The results indicate that - relative to this class
- there are lower profits, of 6.0% and 6.8%, for Class B and Class C respectively. Our findings thus
suggest that moving to dollar price limits did indeed sacrifice net margin for growth; and,
therefore, headline profits.
These results are sustained, albeit with higher coefficients, when we incorporate payroll
expenditure in specification 2. In specification 3 we also control for firm level economies
through total sales volumes, and for store level economies - via average sales per store. We find
that net margins are positively associated with net sales per store, suggesting that technical scale
economies are important. However, we do not find that total sales volumes are important;
though this may reflect our relatively small sample and the fact that we are already capturing
firm-specific fixed-effects.
Centre for International Business History
18 © Scott and Walker, November 2014
Conclusions
Five and dime chains emerged by undercutting existing retailers on low-value items, using a
combination of bulk purchase and substituting skilled personal selling with open display and
fixed price points. Rapid expansion generated further possibilities for lowering costs and prices
through sourcing standardised, mass-produced, goods, in a process akin to the product life cycle
(PLC). However, by the 1920s the largest chains were reaching the limits of growth using this
formula. Most responded by departing from the business model that had established them as
household names. Instead, they sought to apply some elements of their traditional model -
bulk-purchase and stocking only fast-selling lines - to under-cut department stores and line-
specialised multiples. This shift in format entailed embracing fashion items - an area outside
their established capabilities, which required a different type of selling to that for five and dime
lines. The greater skill required to merchandise higher ticket goods, and the consequent
increase in payroll costs, undermined the attractiveness of five and dime business, which would
under-utilise the skills of the fashion-knowledgeable, active-selling, sales clerk that the new lines
required. This transition risked falling, and – in cases where the new stock was not turned over
fast enough to avoid heavy depreciation – even negative, margins, as evidenced by two major
chains which ended up in receivership.
Changes in the pricing and merchandise models of the five and dime chains are thus shown to
be a response to retail format saturation. The variety chain lifecycle (and, by extension, the
lifecycle of other low-price retail formats), can be seen as being broadly inverse to the PLC. A key
feature of the PLC model is that as markets mature, products become increasingly standardised,
offering reductions in production costs for large firms, able to magnify the benefits of cost-
reducing process innovations through economies of scale. We provide a behavioural
explanation for the wheel of retailing phenomenon, which we characterise as the service cost -
unit value continuum. Rather than being driven by a sclerosis of managerial acumen and
responsiveness, as suggested by McNair,91 or other popular explanations, we show the
phenomena was an inevitable response to retail format saturation.
Given the importance of growth in sales volume to aggregate profits growth, and thereby
meeting the expectations of share-holders and sales-incentivised executives,92 variety stores
were compelled to move outside their five and dime niche once this market had become
saturated. Indeed this policy was often successful in increasing aggregate profits over the
medium term (at the cost of lower net margins), as shown by the example of A.T.K. Grant. Yet –
given the higher costs and services required for this merchandising model - its adoption

Henley Discussion Paper Series
© Scott and Walker, November 2014 19
inevitably left space at the bottom of the market for another turn of the retail wheel, by new
retail formats at the start of their lifecycle.
Centre for International Business History
20 © Scott and Walker, November 2014
Table 1: The contribution of different price points to Kresge's ‘dollar store’ floorspace,
individual sales, and sales revenue
Source: University of Michigan, S.S. Kresge Company records, 1912-1978 [microform], roll 6, 55, H.I. Burch,
‘Dollar store report on space and returns from various priced merchandise', 26th Feb. 1932.
Table 2: Variety store growth, employees, and labour costs - growth over time and
comparison with other retailers, 1929-39
Variety All General All Variety/General Variety (real Variety, real growth
Stores Merchandisea
Stores Merchandise values)b
since 1929 (%)Number of stores1929 12,110 54,636.00 1,476,365 22.16 N/A 0.001935 11,741 44,651.00 1,587,718 26.30 N/A -3.051939 16,946 50,267.00 1,770,355 33.71 N/A 39.93Sales ($,000)1929 904,147 6,444,101.00 48,329,652 14.03 800,130 0.001935 780,819 4,619,751.00 32,791,212 16.90 813,353 1.651939 976,801 5,665,007.00 42,041,790 17.24 976,801 22.08No. of employees1929 159,715 814,937.00 4,286,516 19.60 N/A 0.001935 171,375 729,195.00 3,898,258 23.50 N/A 7.301939 211,766 867,007.00 4,600,217 24.42 N/A 32.59Total pay roll1929 95,362 818,930.00 5,044,128 11.64 84,391 0.001935 91,295 608,817.00 3,568,167 15.00 95,099 12.691939 121,804 803,485.00 4,529,499 15.16 121,804 44.33
Source: United States, Bureau of the Census, Seventeenth Census of the United States, 1940, Census of
Business, Vol. 1, Retail Trade 1939, Part I (Washington, 1943), 16.
Notes: a Department stores, variety stores, and dry goods & general merchandise stores; b 1939=100,
deflated using Bureau of Labour Statistics wholesale price index, Malcolm P. McNair and Eleanor G. May,
“The American Department Store 1920-1960. A Performance Analysis based on the Harvard Reports,”
Harvard Bureau of Business Research Bulletin, 166 (1963), 16.
Price- % of total floorspace % of individual sales % of total store sales revenuepoint Jan. 1931 Jan. 1932 Jan. 1931 Jan. 1932 Jan. 1931 Jan. 1932Under 25c 8 16 21 33 7 1425c 20 21 27 27 15 1839c 9 8 8 7 8 750c 17 17 15 13 17 1859c & 69c 10 10 7 7 10 1179c & 89c 13 10 7 4 13 9$1.00 23 18 15 9 30 23Total 100 100 100 100 100 100
Henley Discussion Paper Series
© Scott and Walker, November 2014 21
Table 3: Sales by merchandise class for variety chains classified by average sale, 1933-34
Sources: M.P. McNair, ‘Expenses and Profits of Variety Chains in 1933,’ Harvard Bureau of Business Research Bulletin No.95 (1934), 7;
S.F. Teele, ‘Expenses and Profits of Limited Price Variety Chains in 1934,’ Harvard Bureau of Business Research Bulletin No.98 (1935), 4-6.
1933 (16 chains) 1934 (14 chains)5-25c $1 (low avg.) $1 (high avg.) 5-25c $1 (low avg.) $1 (high avg.)
Average sale (cents) 16 20 30 17 23 29Percentage of total sales accounted for by:Appaarel and accessories (men's, women, and children's) 7.49 31.75 44.94 8.04 31.96 44.11Dry goods, notions, & domestics 21.95 14.04 12.16 23.59 13.97 11.96Hardware, electrical supplies, crockery, glassware 15.28 16.56 13.63 15.51 16.73 14.20Confectionery and nuts 8.74 9.36 5.95 8.47 9.18 6.15Drugs and toiletries 10.91 8.18 5.80 11.35 8.23 5.80Toys, games, books, stationery 14.20 10.47 6.93 13.86 9.59 5.94Soda fountains, luncheonettes & restaraunts 7.11 4.39 3.33 6.98 4.21 4.25Jewelry 2.41 1.30 1.53 2.36 1.04 1.89Other 11.91 3.95 5.73 9.84 5.09 5.70Total 100.00 100.00 100.00 100.00 100.00 100.00

Centre for International Business History
22 © Scott and Walker, November 2014
Table 4: Operating results for variety chains classified by average sale, 1933-35.
Sources: McNair, “Expenses and Profits of Variety Chains in 1933,” 19-20; Teele, ‘Expenses and Profits of Limited Price Variety Chains in 1934,” 32-3; S.F. Teele,
‘Expenses and profits of limited price variety chains in 1935,’ Harvard Bureau of Business Research Bulletin. 103 (1936), 15-16.
Notes: All cost and margin data are shown as a percentage of net sales. a Figures on this item were not reported by all firms in all years; b Net of cost of merchandise,
plus freight, express, postage and truckage; c On fixtures and equipment; d Insurance (except on real estate); taxes (except on real estate or income); travelling; and
miscellaneous; e Because of inadequate balance sheet data for a few chains, the net gain figure for 5-25c retailers is not comprehensive.
1933 1934 1935Items 5-25c $1 (low avg.) $1 (high avg.) 5-25c $1 (low avg.) $1 (high avg.) 5-25c $1 (low avg.) $1 (high avg.)Average sale (cents) 16 20 30 17 23 29 17.5 24 30No. of chains 5 5 11 5 8 10 4 6 11Net sales ($,000) 441,502 39,458 167,433 483,051 50,786 186,573 484,332 56,396 198,770
Average sales per store ($)a
149,156 115,711 116,929 162,316 117,018 130,506 161,443 129,647 136,706
Gross marginb
38.78 36.59 33.99 38.33 36.47 32.81 37.97 35.83 32.22Salaries and wages 15.47 14.68 13.48 15.98 15.43 13.73 16.00 15.05 13.50 Tenancy costs 11.63 10.38 9.67 10.81 8.56 8.84 10.88 8.26 8.47Light, water, power 0.98 1.07 1.18 0.91 0.94 1.12 0.95 0.94 1.11
Depreciationc
0.81 0.76 0.85 0.72 0.68 0.74 0.63 0.64 0.75Supplies 1.13 1.23 0.93 1.07 0.90 0.98 1.14 0.81 1.03Advertising 0.01 0.19 0.59 0.00 0.35 0.56 0.00 0.46 0.58
Other expensesd
1.39 2.84 2.54 1.38 2.53 2.45 1.37 2.57 2.38Total expenses before interest 31.42 31.15 29.24 30.87 29.39 28.42 30.97 28.73 27.82Total expense including interest 33.39 33.02 30.78 32.76 31.11 29.91 32.92 30.40 29.30Net profit/loss 5.39 3.57 3.21 5.57 5.36 2.90 5.05 5.43 2.92Total net other income 4.05 2.28 1.91 3.47 1.90 2.11 3.64 1.90 2.26Net gain before income taxes: Percentage of net sales 9.44 5.85 5.12 9.04 7.26 5.01 8.69 7.33 5.18
Percentage of net worthe
14.64 17.75 15.06 14.69 22.96 15.58 13.73 22.49 15.81

Henley Discussion Paper Series
© Scott and Walker, November 2014 23
Table 5: Operating results for the five main variety store chains, 1933 and 1934
Sources: Baker Library, Harvard, Harvard Bureau of Business Research, , Arch E75.A15, Case 2, Variety chain studies, 1933 and 1934 files, undated worksheets.
Notes: Class A = price range 5c - 25c, low average sale; B = up to $1, low average sale; C = up to $1, high average sale. Kresge was presumably classified in Class A
owing to the dominance of its 25c stores in its overall business at that time.
Name Class Average transaction ($)
Gross Margin
Pay Roll Rent Total Expenses
Net Margin
Stock Turn
Net sales ($) Sales growth from 1929 (%)
Net sales per store ($)
1933Woolworths A 16.0 40.30 16.43 12.78 33.51 6.79 4.74 251,163,459 ‐17.3 129,399 S.S. Kresge A 18.0 38.82 14.91 11.85 34.21 4.61 4.99 125,973,000 ‐18.8 178,612 W.T. Grant C n.a. 32.96 12.18 9.91 29.59 3.37 6.10 79,073,136 20.0 173,406 Kress A 17.0 33.05 12.63 7.07 27.67 5.38 3.95 65,018,000 ‐5.0 282,687 G.C. Murphy B 20.0 37.12 15.43 9.40 32.45 4.67 21,844,872 38.9 122,724
1934Woolworths A 16.5 39.98 16.96 11.85 33.92 6.06 250,517,000 ‐10.7 128,536 S.S. Kresge A 19.0 38.49 15.44 10.89 33.77 4.72 4.48 131,682,376 ‐15.1 193,651 W.T. Grant C n.a. n.a. n.a. n.a. n.a. n.a. 5.89 85,069,612 29.1 184,934 Kress A 16.6 32.24 13.17 6.45 26.57 5.67 4.05 75,152,677 9.8 325,336 G.C. Murphy B 23.0 36.08 15.70 7.73 30.29 5.79 4.21 27,955,481 77.8 153,602

Centre for International Business History
24 © Scott and Walker, November 2014
Table 6: Variety Store Net Margins, Price Bands, Average Store Size, and Net Sales (N=16)
Notes: Table shows full period means.
Table 7: Determinants of Variety Store Net Margins (N=61)
Notes: 1. Class A relates to variety stores in the 5c to 25c price range (with a low average sale price); Class
B equates to the price range below $1 (with a low average sale price); Class C equates to the price range
below $1 (with a high average sale price); 2. Robust t-statistics reported.
Harvard id Store Name City State Net margin Price Net Sales Store size(Head Quarters) (Head Quarters) (%) Class (mns) (000s)
3 M H King Co. Burley Idaho 2.10 B 0.22 35.066 Perry Bros. Inc. Howell Michigan 0.63 B 1.60 27.58
13 Rose's 5c-10c-25c Stores Henerson North Carolina 2.38 A 2.10 36.6816 Scott Stores Chicago Illinois ‐8.46 A 4.30 53.1118 S.H. Kress & Co New York New York 4.74 A 68.00 315.8122 Autenreith's Dollar Stores Pittsburgh Pensylvania 1.41 C 1.20 56.0627 G.C. Murphy Co. McKeesport Pensylvania 3.50 B 21.00 121.2634 Schulte United, Inc. Chicago Illinois 2.04 B 0.91 25.1642 People's 5-10-15c to $1 Stores, Ltd Montreal Quebec ‐0.44 C 1.70 60.1545 Neisner Bros. Inc. Rochester New York 2.23 B 15.00 220.8646 McLellan Store Co. New York New York 0.88 C 21.00 83.4656 M.H. Fishman Co. Inc. New York New York 4.62 C 2.70 95.6959 Walbert Stores Co. Ltd. Oklahoma City Oklahoma ‐15.85 B 0.10 16.1066 S.S. Kresge Co. Detroit Michigan 3.95 A 140.00 209.6769 W.T. Grant New York New York 2.53 C 76.00 200.8479 F.W. Woolworth Co New York New York 6.29 A 250.00 129.43
Average 0.78 37.86 105.43
Coefficent t‐stat Coefficent t‐stat Coefficent t‐stat
Price bands Class B ‐6.02 (2.81) *** ‐9.71 (3.10) *** ‐8.02 (1.90) *(Ref. Class A) Class C ‐6.79 (2.70) *** ‐14.04 (4.40) *** ‐12.85 (4.90) ***
Services Costs % of Payroll ‐1.81 (2.41) ** ‐1.84 (2.65) ***Firm & Store Sales per Store (000s) 0.04 (2.77) **Level Economies Net Sales (millions) ‐0.04 (0.73)
Controls Firm Effects YES YES YESYear Effects YES YES YES

Henley Discussion Paper Series
© Scott and Walker, November 2014 25
Figure 1: The service cost - unit value continuum for multi-product retailers with a broad
product range in the 1930s
Notes: For a discussion of low, medium, and high grade department stores, see Peter Scott and James
Walker, “Sales and advertising expenditure for interwar American department stores,” Journal of Economic
History, 71 (2011), 32-60.

Centre for International Business History
26 © Scott and Walker, November 2014
Figure 2, average gross margins, total expenses, and pay-roll costs for 15 identical variety
store chains, 1929 and 1931-40 (per cent of net sales)
Source: S. F. Teele, ‘Expenses and Profits of Limited Price Variety Chains in 1938', Harvard Bureau of Business
Research Bulletin, 110 (1939), 5 & 8; E. A. Burnham, ‘Expenses and Profits of Limited Price Variety Chains in
1942,' Harvard Bureau of Business Research Bulletin, 118 (1943), 32-33.
Notes: *Sales minus purchase costs and costs of freight, express, postage, and truckage.
1 M.P. McNair, ‘Trends in Large-scale Retailing, Harvard Business Review, 10 (1931), 30-39; M.P. McNair,
‘Significant Trends and Developments in the Postwar Period,’ 1-25 in A.B. Smith (ed), Competitive
Distribution in a Free, High-level Economy and its Implications for the University (Pittsburgh, 1958), 17-18.
2 Stephen Brown, ‘The Wheel of Retailing: Past and Future,’ Journal of Retailing, 66 (1990), 143-9, pp. 144-
6.
3 Stephen Brown, ‘Variations on a Marketing Enigma: the Wheel of Retailing Rheory,’ Journal of Marketing
Management, 7 (1991), 131-55, p. 134, briefly reviews this literature. See also Victor J. Massad, Mary Beth
Nein, and Joanne M. Tucker, ‘The Wheel of Retailing Revisited: Toward a “Wheel of E-tailing?”’, Journal of
Management and Marketing Research, 8 (2011), 1-11.
4 Stanley C. Hollander, “The Wheel of Retailing,” Journal of Marketing, 24 (July 1960), 37-42, p. 38; McNair,
“Trends in Large-scale Retailing,” 39.
5 Brown, “Variations on a Marketing Enigma,” 144.
12.00
13.00
14.00
15.00
16.00
17.00
18.00
19.00
24.00
26.00
28.00
30.00
32.00
34.00
36.00
1929 1931 1932 1933 1934 1935 1936 1937 1938 1939 1940Gross margin*Total expenses before interestSalaries & wages (Right hand scale)

Henley Discussion Paper Series
© Scott and Walker, November 2014 27
6 William R. Davidson, Albert D. Bates, and Stephen J. Bass, “The Retail Lifecycle,” Harvard Business Review,
54 (1976): 89-96.
7 Brown, “Variations on a Marketing Enigma,” 137.
8 W.D. Darby, Story of the Chain Store (New York, 1928), 129.
9 Moshe Farjoun, “Beyond dualism: Stability and change as a duality,”Academy of Management Review, 35
(2010), 202–22; Patricia Klarner and Sebastian Raisch, “Move to the Beat - Rhythms of Change and Firm
Performance,” Academy of Management Journal, 56, (2013), 160-184.
10 Ingemar Dierickx and Karel Cool, “Asset Stock Accumulation and Sustainability of Competitive
Advantage,” Management Science, 35 (1989) 1504–1511; Edith T. Penrose, The Theory of the Growth of the
Firm (New York, 1959).
11 Dorothy Leonard-Barton, “Core Capabilities and Core Rigidities: a Paradox in Managing New Product
Development,” Strategic Management Journal, 13 (1992), 111–125; David J. Teece, Gary Pisano, and Amy
Shuen, “Dynamic Capabilities and Strategic Management’. Strategic Management Journal, 18 (1997), 509-
533.
12 Michael E. Porter, The Competitive Advantage of Nations (New York, 1985).
13 Niron Hashai, “Within-industry Diversification and Firm Performance-An S-shaped Hypothesis,” Strategic
Management Journal, forthcoming; Evan Rawley, “Diversification, Coordination Costs and Organizational
Rigidity: Evidence from Microdata,” Strategic Management Journal, 31 (2010), 873–891; Tom Cottrell and
Barry R. Nault, “Product Variety and Firm Survival in the Microcomputer Software Industry,” Strategic
Management Journal, 25 (2004), 1005-1025; Olav Sorenson, “Letting the Market Work for You: An
Evolutionary Perspective on Product Strategy,” Strategic Management Journal, 21 (2000), 577-592; Yue M.
Zhou, “Synergy, Coordination Costs and Diversification Choices.’ Strategic Management Journal, 32
(2011), 624–639; J.P. Eggers, “All Experience is not Created Equal: Learning, Adapting, and Focusing in
Product Portfolio Management,” Strategic Management Journal, 33, (2012), 315–335.
14 See Table 4.
15 University of Massachusetts Dartmouth Library Archives, Earle P. Charlton family papers, [hereafter
Charlton Papers], MC31/1/14-24, John D. Nichols, ‘Milestones of Woolworth’ typescript, 1948, Part 1, 2;
National Building Museum, Washington, Woolworths Archive, [hereafter Woolworth Archive], Business
Box 8, F.W. Woolworth, memorandum to officers, office managers, buyers, inspectors & store managers of
F.W. Woolworth Co. on history of 5 and 10c stores, 27 Feb. 1912, 2.
16 Charlton papers, John D. Nichols, ‘Milestones of Woolworth’ typescript, 1948, Part 1, 3-7.
17 Woolworths Archive, Business Box 8, F.W. Woolworth, memorandum to officers, office managers,
buyers, inspectors & store managers of F.W. Woolworth Co. on history of 5 and 10c stores, 27 Feb. 1912, 4-
5.
18 Woolworths Archive, Business Box 8, F.W. Woolworth, memorandum to officers, office managers,
buyers, inspectors & store managers of F.W. Woolworth Co. on history of 5 and 10c stores, 27 Feb. 1912, 5.
19 Mark G. Dixon, “Stephenson, William Laurence (1880-1963), Chain Store Chairman,” in David Jeremy
(ed), Dictionary of Business Biography, Volume 5 (London, 1986), 303-8, p. 303.

Centre for International Business History
28 © Scott and Walker, November 2014
20 Charles F. Phillips, “A History of the F.W. Woolworth Company,” Harvard Business Review, 13 (1935), 225-
36, p. 235.
21 S. F. Teele, “Expenses and Profits of Limited Price Variety Chains in 1937', Harvard Bureau of Business
Research Bulletin, 107 (1938), 9.
22 F.W. Woolworth, quoted in John K. Winkler, Five and Ten. The Fabulous Life of F.W. Woolworth (New York,
1940), 109-10.
23 Winkler, Five and Ten, 124.
24 Charlton papers, MC31/1/14-24, John D. Nichols, “Milestones of Woolworth,” typescript, 1948, Part 15,
2-4.
25 Alan R. Raucher, ‘Dime Store Chains: the Making or Organization Men, 1880-1940,” Business History
Review, 65 (1991), 130-063, p. 140.
26 Raucher, “Dime Store Chains,” 131.
27 Charlton papers, MC31/1/14-24, John D. Nichols, ‘Milestones of Woolworth’ typescript, 1948, Part 3, 23.
28 Winkler, Five and Ten, 213.
29 Raucher, “Dime Store Chains,” 136-7.
30 Stanley S. Kresge and Steve Spilos, The S.S. Kresge Story (Racine, Wisconsin, 1979), 52-3.
31 Kresge Archive, roll 1,101-4, “Kresge’s Golden Anniversary Year 1899-1949,” privately published booklet,
1939; “Kresge Achievement 1899-1949,” Chain Store Age (June 1949), 5-19, pp. 7-8; Kresge and Spilos, The
S.S. Kresge Story, 3-5.
32 Raucher, “Dime store chains 133-4; Kresge Archives, Roll 1, 110-133, “Record of the 5 and 10 Stores'
growth,” unsigned statistical sheets, January 1949.
33 Charlton papers, MC31/1/14-24, John D. Nichols, “Milestones of Woolworth” typescript, 1948, Part 2,
33-4.
34B. L. Thomas, America’s 5 & 10 Cent Stores. The Kress Legacy (New York, 1997), 4-5.
35 Thomas, America’s 5 & 10 Cent Stores, 7.
36 Charlton papers, MC31/1/14-24, John D. Nichols, ‘Milestones of Woolworth’ typescript, 1948, Part 2, 36.
37 Thomas, America’s 5 & 10 Cent Stores, 5.
38 Mary Elizabeth Pigeon, “Women in 5- and 10-cent Stores and Limited-price Chain Department Stores,”
Bulletin of the Women’s Bureau, 76 (1930), 2.
39 W.S. Hayward and P. White, Chain Stores: Their Management and Operation, 3rd edn. (New York, 1928),
530.
40 Kresge archives, Roll 2, 22, copy of .S. Kresge, “What Kept our Business Growing Through 1921,” System,
XLI, 4 (1922), 55’ Anderson, Morrell Associates, “The Variety Chains Store Group,” industry review and
forecast, 12 May 1937.

Henley Discussion Paper Series
© Scott and Walker, November 2014 29
41 Charlton papers, MC31/1/14-24, John D. Nichols, ‘Milestones of Woolworth’ typescript, 1948, Part 11, 1.
42 Phillips, “History of the F.W. Woolworth Company,” 232.
43 E. A. Burnham, “Expenses and Profits of Limited Price Variety Chains in 1939,” Harvard Bureau of Business
Research Bulletin, 112 (June 1940), 6.
44 M.P. McNair, “Expenses and Profits of Variety Chains in 1932,” Harvard Bureau of Business Research
Bulletin, 93 (1934), 14-18.
45 Jason Togyer, For the Love of Murphy’s. The Behind-the-Counter Story of a Great American Retailer
(University Park, Penn., 2008), 28-33.
46 Raucher, “Dime Store Chains,” 147.
47 Kresge Archive, roll 6, 1935 letters, 122, “Non-prospects”, letter to all stores by R. G. Forsheee, 22nd
October 1935.
48 S. F. Teele, “Expenses and Profits of Limited Price Variety Chains in 1938,” Harvard Bureau of Business
Research Bulletin,110 (1939), 5 & 8; Burnham, “Expenses and profits of limited price variety chains in
1942,” 32-33. Net operating profit is calculated before income from real estate operations, interest on net
worth, and other non-trading revenue.
49 Raucher, “Dime Store Chains,” 148.
50 Raucher, “Dime Store Chains,” 147; Merrill Lynch & Co., Chain Store Statistics (June 1939), 17-18.
51 Charlton papers, MC31/1/14-24, John D. Nichols, ‘Milestones of Woolworth’ typescript, 1948, Part 13, 2-
5; Phillips, “History of the F.W. Woolworth Company,” 225.
52 Malcolm P. McNair, “Expenses and Profits of Limited Price Variety Chains in 1936,’ Harvard Bureau of
Business Research Bulletin, 105 (1937), 24.
53 Gillian Wolf, “Kmart Corporation,” 110-12 in Adele Hast et. al. International Directory of Company
Histories (Detroit: St. James Press, 1992), Vol. 5, 110.
54 Kresge Archives, Roll 2, p. 55, Anderson Morrell Associates, “The Variety Chains Store Group,” industry
review and forecast, 12 May 1937.
55 Togyer, For the Love of Murphy’s, 29-33.
56 Wolf, “Kmart Corporation,” 110.
57 Kresge Archive, roll 1, 101-4, “Kresge’s Golden Anniversary Year 1899-1949’, privately published
booklet, 1939; “Kresge Achievement 1899-1949”, Chain Store Age (June 1949), 5-19, pp. 9-10.
58 Kresge Archive, roll 6, 77, H. I. Burch, “Salesmanship. Needed to Sell Higher Priced Merchandise,” note
to 25c to $.1.00 stores (29 Feb. 1932), (emphasis in original).
59 Ibid.
60 Darby, Story of the Chain Store, 23-4; McNair and May, “American Department Store,” 8.
61 Peter Scott and James Walker, “Sales and Advertising Expenditure for Interwar American Department
Stores,” Journal of Economic History, 71 (2011), 40-69, pp. 50-51; idem, “The British ‘failure’ that never was?
Centre for International Business History
30 © Scott and Walker, November 2014
The Anglo-American “productivity gap” in large scale interwar retailing – evidence from the department
store sector,’ Economic History Review, 65 (2012), 277-303, p. 294.
62 McNair, ‘Expenses and Profits of Variety Chains in 1932,” 1-7.
63 S.F. Teele, “Expenses and Profits of Limited Price Variety Chains in 1934,” Harvard Bureau of Business
Research Bulletin No.98 (1935), 34.
64 For department stores’ use of personal selling see S.P. Benson, Counter Cultures. Saleswomen, managers,
and customers in American department stores, 1890-1940 (Urbana, Ill., 1988), 286-7; Sarah Elvins, Sales and
Celebrations. Retailing and Regional Identity in western New York State, 1920-1940(Athens, O., 2004), 25-6.
65Kresge Archive, roll 6, 239, report of superintendents’ convention, Chicago District Office, 28-29 1932,
by C. E. Holzworth.
66 Kresge Archive, roll 6, 106, “Increases by Suggestive Selling,” note to managers by R. G. Forshee, 12 sept.
1935.
67 Kresge Archive, roll 6, 1936 letters, 63, “Knowing the Fashions,” letter by R.G. Forshee to all ten cent
stores, 4 June 1936.
68 Kresge Archive, roll 6, 112, ‘Increase Sales by Suggestion’, note to all stores by W.F. Johnson, n.d., c. Sept.
1935.
69 G.C. Murphy Co., Suggestive Selling, booklet, 1929, cited in Togyer, For the Love of Murphy’s, 68; Togyer,
For the Love of Murphy’s, 54-5.
70 W.T. Grant Co., Manual For Saleswomen (W.T. Grant, privately published, 1934), 11.
71 Kresge Archive, roll 6, 1936 letters, 154, “Whispering Campaign’, general letter to all stores by C.E.
Holzworth, 20 October 1936.
72 Kresge Archive, Roll 6, 49-50, ‘Sales Resistance’, general letter to all 5-10-25 cent stores by J.L. Pickering,
21 May 1935.
73 McNair, “Expenses and Profits of Limited Price Variety Chains in 1936,” 5.
74 Teele, “Expenses and Profits of Limited Price Variety Chains in 1937,” 9-10.
75 John Guernsey, Retailing Tomorrow (New York, 1929), 56.
76 McNair, “Expenses and Profits of Limited Price Variety Chains in 1936,” 5.
77 Winkler, Five and Ten, 240.
78 See Scott and Walker, “British ‘failure’,” 281.
79 ‘M.P. McNair, “Expenses and Profits of Variety Chains in 1932,” 2-6; Burnham, “Expenses and Profits of
Limited Price Variety Chains in 1939,” 13; McNair, “Expenses and Profits of Limited Price Variety Chains in
1936,” 1.
80 McNair, “Expenses and Profits of Limited Price Variety Chains in 1936,” 6.
81 S.F. Teele, “Expenses and Profits of Limited Price Variety Chains in 1935,” Harvard Bureau of Business
Research Bulletin 103 (1936), 5.

Henley Discussion Paper Series
© Scott and Walker, November 2014 31
82 Teele, “Expenses and Profits of Limited Price Variety Chains in 1934,” 7.
83 Excluding income from real estate operations, interest on net worth, and other non-trading revenue.
84 Scott and Walker, “British ‘failure’,” 286-7.
85 Teele, “Expenses and Profits of Limited Price Variety Chains in 1934,” 28.
86 E. A. Burnham, “Expenses and Profits of Limited Price Variety Chains in 1940,” Harvard Bureau of Business
Research Bulletin, 114 (June 1941), 10; Teele, “Expenses and Profits of Limited Price Variety Chains in
1938,” 15-16 & 25. Where properties were owned by the chain, the rental element of tenancy costs was
based on an estimated market rental.
87 Teele, “Expenses and Profits of Limited Price Variety Chains in 1935,” 15.
88 Teele, “Expenses and Profits of Limited Price Variety Chains in 1938,” 16; E. A. Burnham, ‘Expenses and
profits of limited price variety chains in 1940,’ Harvard Bureau of Business Research Bulletin No. 114 (June
1941), p. 19.
89 The surveys’ definition of gross margin involved subtracting cash and other discounts from merchandise
costs – thus increasing the gross margin by the amount of the discounts. Meanwhile inward transportation
costs were added to the net cost of merchandise sold (thus reducing gross margins by at least 2.5
percentage points). This procedure ensured comparability with the HBBR surveys for other types of
retailer. S.F. Teele, ‘Expenses and profits of limited price variety chains in 1934,’ Harvard Bureau of Business
Research Bulletin No.98 (1935), p. 9.
90 Burnham, “Expenses and Profits of Limited Price Variety Chains in 1940,” 33-4.
91 McNair, “Trends in Large-scale Retailing,” 39.
92 For discussions of the importance of aggregate sales growth as a key goal for chain stores, see Darby,
Story of the Chain Store, 125; G.C. Murphy Co., Merchandising. The G.C. Murphy Company’s Policies and
Practices (privately published, 1929), 47.