the shallow magmatic system of kïlauea volcano - …. geological survey professional paper 1676 149...
TRANSCRIPT

149U.S. Geological Survey Professional Paper 1676
Abstract
The shallow magmatic system of Kïlauea Volcano current-ly consists of two distinct summit magma reservoirs, a vent at Pu‘u ‘Ö‘ö, and a conduit connecting that vent to the shal-lower of the two summit reservoirs. Global Positioning System (GPS) measurements and leveling surveys record long-term subsidence over a magma reservoir near the southeast border of the summit caldera, centered no deeper than about 3.5 km below ground level (2.5 km below sea level). The yearly vol-ume loss from this source is, at most, 2.5 million m3, approxi-mately 2 percent of the annual eruption output from Pu‘u ‘Ö‘ö. Electronic borehole tiltmeters image another, much shallower magma reservoir about 0.5 km east of Halemaumau at a depth of 500 to 700 m above sea level (500 to 700 m below ground level). The deformation from this shallow reservoir is episodic and short-lived, each event persisting for only a few days. Fourof these deformation events, which occurred from 2000 to 2002,are highly self-similar and appear to reflect a brief interruption of magma supply. We conclude, from the style of deformation and from the timing of seismicity during these events, that the conduit from the summit to Pu‘u ‘Ö‘ö leaves from the shal-lower reservoir. From there it runs horizontally along the rift zone until it intersects the surface topography at Pu‘u ‘Ö‘ö. We estimate the radius of this cylindrical conduit at about 2.75 m.
Introduction
In this chapter, we infer the structure of the shallow mag-matic system beneath Kïlauea summit, as well as the location and dimensions of the feeder conduit to Pu‘u ‘Ö‘ö. Toward this end, we use various data sets, including continuous Global Positioning System (GPS) and borehole tilt, leveling cam-paigns, seismic measurements, and estimates of lava flux and gas effusion. All of these data lead to a fundamental obser-vation about the magma system—there exists a quasisteady long-term mode of deformation interrupted by occasional short-lived episodes of deformation both at Kïlauea’s sum-mit and at Pu‘u ‘Ö‘ö. Many of these episodes share striking similarities that suggest a corresponding similarity of process, which, if understood, could provide clues about the structure of Kïlauea’s shallow magmatic system.
Over the course of the current Pu‘u ‘Ö‘ö eruption, the de-formation observed at Kïlauea has been characterized by high
rates of south-flank motion (max 8 cm/yr) and summit subsid-ence (max 11 cm/yr), punctuated by episodes of faster motion associated with earthquakes and intrusions (Delaney and oth-ers, 1993). Delaney and others (1993, 1998) and Owen and others (2000), who summarized the data up to 1996, modeledthe sources of deformation as consisting of slip along low-angle south-flank faults, deep rift-zone opening, and deflation in the summit caldera. We interpret deformation measurements between 1996 and the present but do not attempt to model all the sources contributing to the deformation patterns observed on Kïlauea. Instead, we concentrate on the summit area be-cause it gives the most information about the structure of the shallow magmatic system.
Long-term summit deformation during the current erup-tion is primarily vertical, consisting of persistent subsidence in the southern part of Kïlauea’s caldera. Numerous workers have attributed similar patterns of subsidence in the past to a deflating magma reservoir at about 3- to 5-km depth (Mogi, 1958; Fiske and Kinoshita, 1969; Tilling and Dvorak, 1993). Delaney and others (1993) and Owen and others (2000) de-termined that most of the current subsidence is attributable to this deflating reservoir but that rifting of the summit area is re-quired by the horizontal data. Rifting, in fact, may cause about 35 percent of the subsidence. Recent data, primarily leveling and GPS, collected since 1996 clearly image the deflating magma reservoir in the southern caldera, although we do not model the contribution from rifting.
Superimposed on the long-term subsidence are self-simi-lar deformation events, which image a shallow magma reser-voir slightly east of Halemaumau (fig. 1). These episodes, and what they imply about the shallow magmatic system beneath Kïlauea, are the primary focus of this chapter.
DataContinuous GPS
The U.S. Geological Survey’s Hawaiian Volcano Obser-vatory (HVO), Stanford University, and the University of Hawai‘i operate a network of continuously recording dual-frequency GPS receivers on Kïlauea (fig. 1). Data from these receivers are processed in daily batches with the Gipsy/Oasis II software package (Lichten and Border, 1987). Time series
The Shallow Magmatic System of Kïlauea Volcano
By Peter F. Cervelli and Asta Miklius

Figure 1. Kïlauea Volcano, Island of Hawai‘i, showing locations of stations in electronic-tilt, leveling, and continuous Global Positioning System (GPS) networks and seismic stations mentioned in text. Digital elevation model used to construct figure is not recent enough to include Pu‘u ‘Ö‘ö and effects of its eruption. Tiltmeter at station POC is located on northwest flank of Pu‘u ‘Ö‘ö. Contour interval, 500 ft.
150 The Pu‘u ‘Ö‘ö-Küpaianaha Eruption of Kïlauea Volcano, Hawai‘i: The First 20 Years 151The Shallow Magmatic System of Kïlauea Volcano
from two selected summit stations (UWEV, AHUP) are shown in figure 2. We filtered all the time series to mini-mize the effect of reference-frame errors and to calculate long-term station velocities (Cervelli and others, 2002a). This procedure allows geologic offsets, such as earthquakes and intrusions, to exist in the time series without biasing estimates of the long-term deformation rates. The horizontal velocities of the Kïlauea continuous GPS stations, after sub-tracting the velocity of a continuous station on Mauna Kea (approx 50 km north of Kïlauea’s caldera), are mapped in figure 3. No evidence exists for active deformation at Mauna Kea; and so its station velocity serves as a proxy for the velocity of the Pacific Plate.
The predominant horizontal signal in the GPS data is a persistent southeastward migration of Kïlauea’s south flank (fig. 3). Maximum rates of about 8 cm/yr are observed at station KAEP on the south coast (fig. 1). Station UWEV, north of the topographic caldera but within the structural caldera, and station AHUP, south of the caldera, both show southeastward motion of about 2.5 cm/yr. Station AHUP is moving slightly faster than station UWEV, leading to a
small (0.5 cm/yr) extension across the caldera. The rate at station KOSM, in the southwest rift zone, is nearly 5 cm/yr and is directed much more easterly than at the other summit stations.
Since 1996, many geologic events, including two east-rift-zone intrusions and several earthquakes, have affected the GPS time series. The long-term deformation pattern, however, seems unperturbed by these events. Indeed, even the largest event, the January 1997 Näpau Crater eruption, introduced only a transient signal into the time series.
Apart from horizontal motion, the continuous GPS net-work is also sensitive to long-term vertical signals. The GPS data show uplift along the coast of about 3 cm/yr and sub-sidence in the south caldera of more than 4 cm/yr. The sign change between subsidence and uplift runs between the Koa‘e and Hilina fault systems (fig. 3).
In the modeling and discussion that follows, we consider only the four GPS stations located around Kïlauea’s summit: AHUP, KOSM, MANE, and UWEV (fig. 1). This subset of stations is sufficient to address the question of magma-system structure that is the primary focus of this chapter.

Figure 3. Kïlauea Volcano showing vectors of horizontal Global Positioning System (GPS) velocity from 1996 to 2002 with respect to a fixed Pacific Plate. Error ellipses at 95-percent-confidence level are scaled by repeat-ability about constant-velocity model. Major signal depicted is southeastward displace-ment of south flank, which reaches a maximum at coast and decays northward.
Figure 2. Time series from two summit Global Positioning System (GPS) stations with respect to a fixed Pacific Plate. Station AHUP is south of Kïlauea’s summit caldera; station UWEV is just northwest of topographic caldera (fig. 1). Striking departure from long-term trend in early 1997 is effect of Näpau Crater eruption (eruptive episode 54). Note long-term subsidence at station AHUP that exceeds 5 cm/yr. Effect of episodic events discussed in text is too short-lived to appear on these time series.
-0.040
0.04
1996 1997 1998 1999 2000 2001 2002-0.2-0.10
0.1
-0.040
0.040.08
-0.040
0.04
-0.2-0.10
0.1
-0.040
0.040.08
EAST
NORTH
UP
EAST
NORTH
UP
1996 1997 1998 1999 2000 2001 2002
RELATIVEPO
SITION,INMETERS
TIMETIME
AHUPUWEV
150 The Pu‘u ‘Ö‘ö-Küpaianaha Eruption of Kïlauea Volcano, Hawai‘i: The First 20 Years 151The Shallow Magmatic System of Kïlauea Volcano
Leveling
A leveling traverse crossing Kïlauea’s summit and up-per rift zones (fig. 1) is measured nearly annually. Leveling surveys are conducted to first-order, second-class standards (Federal Geodetic Control Committee, 1984) and have an expected error propagation of 2 mm/km1/2. Loop closures in the network permit us to empirically calibrate the expected error; on Kïlauea’s summit, we achieve about 2.2 mm/km1/2.
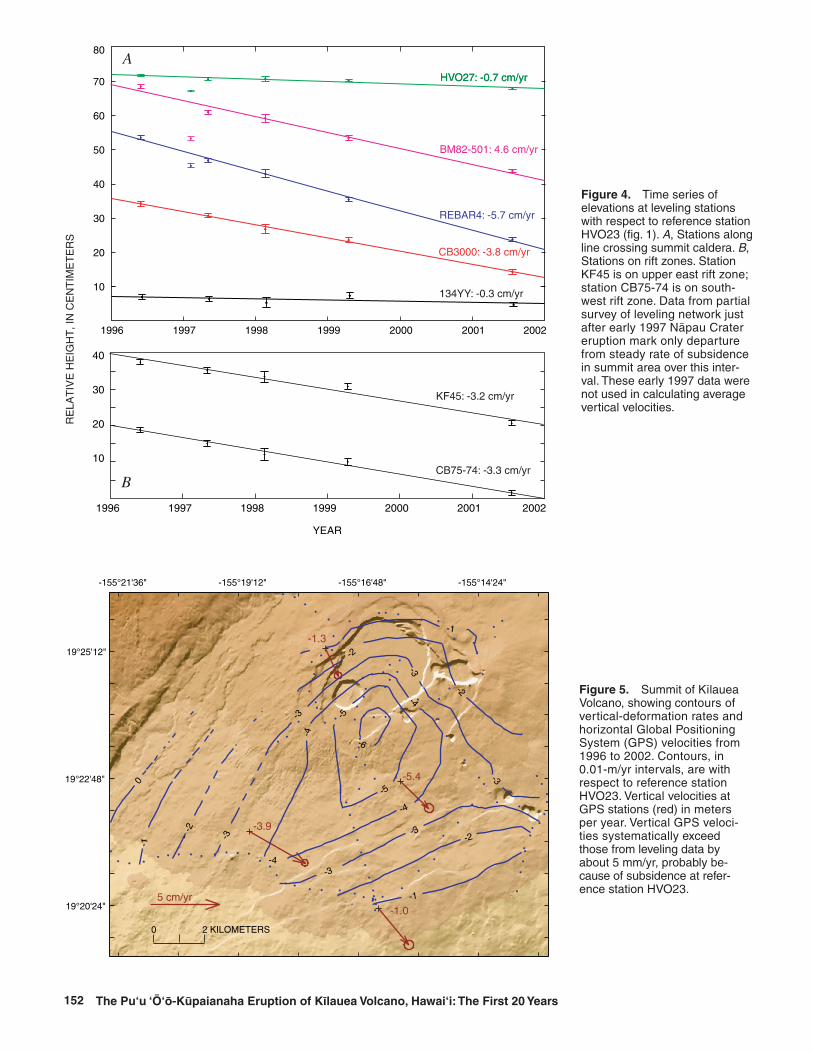
Selected time series of elevations relative to a reference station, HV023, northwest of Kïlauea’s caldera (fig. 1) show a steady rate of subsidence from 1996 through 2002 (fig. 4),
with a transient perturbation resulting from the January 1997 Näpau Crater eruption. Contours of average rates of eleva-tion change across the summit (fig. 5) show broad, asym-metric subsidence, with the locus of maximum subsidence in the southern caldera. The maximum subsidence rate is about 6 cm/yr, slightly lower than the 8 cm/yr measured during the early part of the Pu‘u ‘Ö‘ö eruption from 1983 to 1990 (Del-aney and others, 1998). The rate of vertical motion at station HVO23 over this time period is unknown. The vertical GPS data seem to systematically exceed the rates implied by the leveling data at the GPS stations by about 5 mm/yr. This small discrepancy likely reflects slow subsidence at leveling reference station, HVO23.
152 The Pu‘u ‘Ö‘ö-Küpaianaha Eruption of Kïlauea Volcano, Hawai‘i: The First 20 Years 153The Shallow Magmatic System of Kïlauea Volcano
Figure 4. Time series of elevations at leveling stations with respect to reference station HVO23 (fig. 1). A, Stations along line crossing summit caldera. B, Stations on rift zones. Station KF45 is on upper east rift zone; station CB75-74 is on south-west rift zone. Data from partial survey of leveling network just after early 1997 Näpau Crater eruption mark only departure from steady rate of subsidence in summit area over this inter-val. These early 1997 data were not used in calculating average vertical velocities.
Figure 5. Summit of Kïlauea Volcano, showing contours of vertical-deformation rates and horizontal Global Positioning System (GPS) velocities from 1996 to 2002. Contours, in 0.01-m/yr intervals, are with respect to reference station HVO23. Vertical velocities at GPS stations (red) in meters per year. Vertical GPS veloci-ties systematically exceed those from leveling data by about 5 mm/yr, probably be-cause of subsidence at refer-ence station HVO23.

Figure 6A. Time series of tilt from borehole tiltmeter stations at summit and Pu‘u ‘Ö‘ö (POC) (fig. 1) for September 24–26, 2000. We plot component of tilt radial to source, that is, tilt in the direction that, on average, maximizes magnitude of sig-nal. Inset map shows tilt vectors (in black) at summit for hour-long inflation. In white are tilts predicted by model for inflating point source at location shown by red circle. At Pu‘u ‘Ö‘ö, maximum tilt points away from cone’s summit crater area.
0 2 4 6 8 10 12 14 16 18 20 22 24 26 28 30 32 34 36 38 40 42 44 46 480
1
2
3
4
5
6
7
DURATION, IN HOURS
RA
DIA
L T
ILT
, IN
MIC
RO
RA
DIA
NS
UWE N46°WSDH S38°WIKI N97°EPOC N38°W
2 µrad
UWE
SDH
IKI
EXPLANATION
152 The Pu‘u ‘Ö‘ö-Küpaianaha Eruption of Kïlauea Volcano, Hawai‘i: The First 20 Years 153The Shallow Magmatic System of Kïlauea Volcano
Electronic Tilt
HVO operates a network of 12 electronic tiltmeters, each set into a borehole ranging in depth from 5 to 40 m. The loca-tions of the six tiltmeters that monitor Kïlauea’s summit and Pu‘u ‘Ö‘ö are shown in figure 1. Data from the tiltmeters are logged on site at a 1-minute sampling rate and telemetered back to the observatory every 10 minutes. The first electronic borehole tiltmeter (sta. UWE, fig. 1) was installed in 1998.
The tiltmeter located on Pu‘u ‘Ö‘ö (sta. POC, fig. 1), just northwest of its rim, was installed in early 2000. Since then, it has recorded about 10 tilt events that started at Kïlauea’s summit and propagated toward the vent, indicating a change in pressure over the entire shallow magmatic system. Four of these events are highly self-similar. At both the summit and at Pu‘u ‘Ö‘ö, these 2- to 3-day-long events are characterized by a period of slow deflation, then rapid inflation, followed by another period of slow deflation, bringing the final tilt close to the pre-event level. Three of these events were associated with a surge in the effusion rate at Pu‘u ‘Ö‘ö, the one exception be-ing the December 2001 event.
The three stages of the surge-type tilt events start at the summit and propagate to Pu‘u ‘Ö‘ö (figs. 6A–6C). The initial deflation of 1 to 3 microradians at stations UWE and POC (fig. 1) takes 8 to 20 hours. The time between the onset of the tilt change at station UWE and the onset at station POC ranges from 1.5 to 2.5 hours. The inflationary stage is very rapid, with station UWE gaining 6 to 10 µrad in 1 hour. Station POC starts inflating 20 to 30 minutes later and takes from 5 to 14 hours to gain 4 to 6 µrad. The final deflation, its rate de-caying exponentially, takes from 8 to more than 20 hours.
At the summit, an intense burst of seismic energy pre-cedes the rapid inflation by a few minutes. Seismicity ceases
just before the inflation begins, and resumes again as the inflation reaches its peak (figs. 6B–6D). At the vent, seismic energy seems to decrease with the initial inflation and then increases as the inflation continues. Low-frequency seismicity remains relatively high as the tilt slowly decays to the pre-event level.
At Pu‘u ‘Ö‘ö, the April 2002 deformation event (fig. 6D) differed from previous events in several ways. The initial de-flation there was much greater than at station UWE (fig. 1), and the final deflation included numerous small tilt oscil-lations. During the deflationary periods of the oscillations, markedly increased seismic activity was observed. This oscil-latory behavior may be related to increased pressure in Pu‘u ‘Ö‘ö’s shallow magmatic system during this time and does not necessarily imply a different process from the other events.
Tilt vectors at the summit clearly point to a source of deflation and inflation slightly east of Halemaumau (fig. 6). At Pu‘u ‘Ö‘ö, tilt directions vary slightly more but generally point toward and away from the crater. Of the four deforma-tion events described above, three were associated with erup-tive surges, but the December 2001 event had no discernible effect on the eruption. The first signs of increased lava flux at the eruption site were generally observed shortly after Pu‘u ‘Ö‘ö started inflating.
Model
Clearly, the deformation field from the long-term source at the summit is qualitatively different from the deformation field associated with the episodic events, both in terms of their time scales and their spatial patterns. For this reason, we model the two modes of deformation separately. The long-
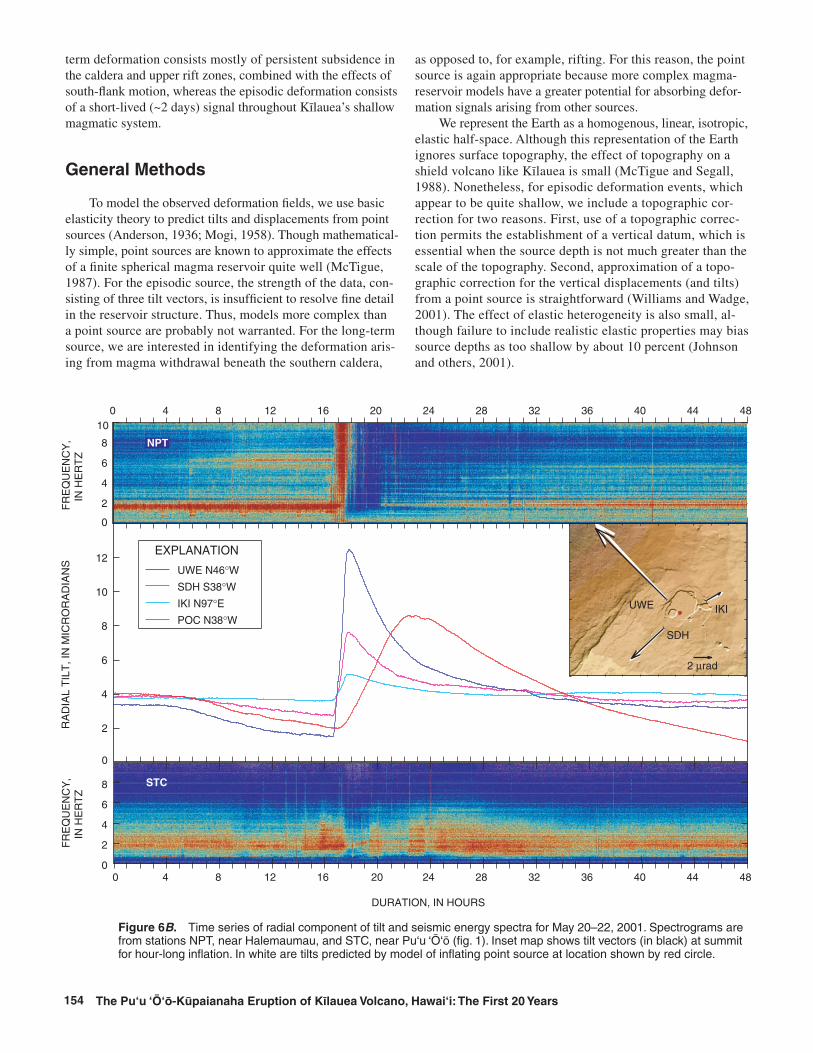
Figure 6B. Time series of radial component of tilt and seismic energy spectra for May 20–22, 2001. Spectrograms are from stations NPT, near Halemaumau, and STC, near Pu‘u ‘Ö‘ö (fig. 1). Inset map shows tilt vectors (in black) at summit for hour-long inflation. In white are tilts predicted by model of inflating point source at location shown by red circle.
2 µrad
UWE
SDH
IKI
FR
EQ
UE
NC
Y,
IN H
ER
TZ
F
RE
QU
EN
CY
, IN
HE
RT
Z
0 4 8 12 16 20 24 28 32 36 40 44 48
0
2
4
6
8
10
0
2
4
6
8
10
12
DURATION, IN HOURS
RA
DIA
L T
ILT
, IN
MIC
RO
RA
DIA
NS
0 4 8 12 16 20 24 28 32 36 40 44 480
2
4
6
8
NPT
STC
UWE N46°WSDH S38°WIKI N97°EPOC N38°W
EXPLANATION
NPT
154 The Pu‘u ‘Ö‘ö-Küpaianaha Eruption of Kïlauea Volcano, Hawai‘i: The First 20 Years 155The Shallow Magmatic System of Kïlauea Volcano
term deformation consists mostly of persistent subsidence in the caldera and upper rift zones, combined with the effects of south-flank motion, whereas the episodic deformation consists of a short-lived (~2 days) signal throughout Kïlauea’s shallow magmatic system.
General Methods
To model the observed deformation fields, we use basic elasticity theory to predict tilts and displacements from point sources (Anderson, 1936; Mogi, 1958). Though mathematical-ly simple, point sources are known to approximate the effects of a finite spherical magma reservoir quite well (McTigue, 1987). For the episodic source, the strength of the data, con-sisting of three tilt vectors, is insufficient to resolve fine detail in the reservoir structure. Thus, models more complex than a point source are probably not warranted. For the long-term source, we are interested in identifying the deformation aris-ing from magma withdrawal beneath the southern caldera,
as opposed to, for example, rifting. For this reason, the point source is again appropriate because more complex magma-reservoir models have a greater potential for absorbing defor-mation signals arising from other sources.
We represent the Earth as a homogenous, linear, isotropic, elastic half-space. Although this representation of the Earth ignores surface topography, the effect of topography on a shield volcano like Kïlauea is small (McTigue and Segall, 1988). Nonetheless, for episodic deformation events, which appear to be quite shallow, we include a topographic cor-rection for two reasons. First, use of a topographic correc-tion permits the establishment of a vertical datum, which is essential when the source depth is not much greater than the scale of the topography. Second, approximation of a topo-graphic correction for the vertical displacements (and tilts) from a point source is straightforward (Williams and Wadge, 2001). The effect of elastic heterogeneity is also small, al-though failure to include realistic elastic properties may bias source depths as too shallow by about 10 percent (Johnson and others, 2001).

Figure 6C. Time series of radial component of tilt and seismic energy spectra for December 8–11, 2001. Inset map shows tilt vectors (in black) at summit for hour-long inflation. In white are tilts predicted by model of inflating point source at location shown by red circle.
154 The Pu‘u ‘Ö‘ö-Küpaianaha Eruption of Kïlauea Volcano, Hawai‘i: The First 20 Years 155The Shallow Magmatic System of Kïlauea Volcano
To invert the deformation fields for source location and strength, we cast the inversion problem as a nonlinear opti-mization (Cervelli and others, 2001). Specifically, we seek a source model that minimizes the difference between model predictions and observations. For the optimization, the quan-tity to be minimized is the mean square error, defined as
MSE = rT Σ−1 r / ν,where r is the residual vector (difference between observation and prediction), Σ is the data-covariance matrix, and ν is the number of degrees of freedom (the number of data points mi-nus the number of model parameters). A χ2 test can be applied to the MSE to check whether the data have been fitted within errors at some confidence level. To be meaningful, however, the χ2 test requires that the data covariance be well known. For the tilt data, the covariance is poorly known, because we have not accounted for uncertainties in tiltmeter azimuth, the scale factor from millivolts to microradians, and other factors. In the case of the leveling and GPS data, the data covariance is better known but still may be off by a scale factor. Moreover, the χ2 test strictly applies only when a linear relation exists between model parameters and data. For a point source, only the vol-
ume change is linear. Therefore, even though we use the MSE as a quantitative representation of the misfit, we do so only as a matter of convenience and not because of the statistical prop-erties of the MSE under the circumstances described above.
Long-Term Deformation
The long-term pattern of deformation evident at Kïlauea’s summit, well characterized by the continuous GPS and level-ing data, is quite complex. This observation is not surprising because at least three separate geologic processes lead to significant deformation signals in this region: (1) motion of Kïlauea’s south flank, (2) deflation in the summit magmatic system, and (3) rifting in the rift zones. Although south-flank motion and rifting introduce potentially large deformation signals in the summit region, we can partially separate them from magmatic deflation, the primary concern of this chapter. This separation is possible because the patterns of deformation from the two other sources differ considerably from the radial symmetry of a deflating magma reservoir. We are mindful,
UWE
SDH
IKI
2 µrad
0
2
4
6
8
DURATION, IN HOURS
0 8 16 24 32 40 48 56 64 72
0
2
4
6
8 STC
RA
DIA
L T
ILT
, IN
MIC
RO
RA
DIA
NS
FR
EQ
UE
NC
Y,
IN H
ER
TZ
0 8 16 24 32 40 48 56 64 72
0
2
4
6
8
10
FR
EQ
UE
NC
Y,
IN H
ER
TZ
UWE N46°WSDH S38°WIKI N97°EPOC N38°W
EXPLANATION
NPT

Figure 6D. Time series of radial component of tilt and seismic energy spectra for April 4–7, 2002. Inset map shows tilt vectors (in black) at summit for hour-long inflation. In white are tilts predicted by model of inflating point source at location shown by red circle.
0
2
4
6
8
10
12
2 µrad
UWE
SDH
IKI
0 8 16 24 32 40 48 56 64 72
0
2
4
6
8
10
FR
EQ
UE
NC
Y,
IN H
ER
TZ
DURATION, IN HOURS
0 8 16 24 32 40 48 56 64 720
2
4
6
8
10
STC
FR
EQ
UE
NC
Y,
IN H
ER
TZ
R
AD
IAL
TIL
T, I
N M
ICR
OR
AD
IAN
S UWE N46°WSDH S38°WIKI N97°EPOC N38°W
EXPLANATION
STC
NPT
156 The Pu‘u ‘Ö‘ö-Küpaianaha Eruption of Kïlauea Volcano, Hawai‘i: The First 20 Years 157The Shallow Magmatic System of Kïlauea Volcano
however, as discussed in detail below, that a point source may absorb signals from other deformation sources.
We use the full covariance of the leveling data (Árnadóttir and others, 1992), which accounts for the correlations among these data introduced by summing the section-height differ-ences. The covariances from both the GPS and leveling data are scaled by their repeatability about a constant velocity. Inverting these two data sets for a single point source results in a model located in the southern caldera (figs. 7A–7B) at 2.5 km below sea level and deflating at about 2.5 million km3/yr. Henceforward, we refer to this deformation source as the “south-caldera magma reservoir.”
The residual (fig. 7C) between model predictions (fig. 7B) and observations (fig. 7A) shows that, although most of the subsidence is attributable to a point source, significant defor-mation remains unexplained by the simple point-source model. This result is consistent with our expectation. The horizontal component of the GPS data shows a clear southeastward dis-placement, almost certainly related to south-flank deforma-tion, that cannot be explained by a symmetrical deflation. The long-wavelength signal in the vertical residual suggests an
extensional process coincident with the rift zones. The closed contours of the residual near the center of the caldera may re-sult from minor deflation at the more shallow episodic source discussed in detail below.
We expect that modeling all of the summit deformation with only a point source of deflation will somewhat bias our estimate of the point source’s strength and location. Specifi-cally, we expect that our depth and volume-change estimates will be biased on the high side, because deepening and strengthening the source will widen the wavelength of the pre-dicted data, enabling the single point source to soak up some of the signal from the other deformation sources. To estimate how large this bias might be, we conducted an experiment, using the deformation model of Owen and others (2000). This model is complete in the sense that it contains deformation sources corresponding to each of the structures thought to con-tribute to summit deformation—a slipping décollement, open-ing rift zones, and a deflating magma chamber.
We began our experiment by calculating the deformation predicted by the model at each of the leveling benchmarks and GPS stations. Then we inverted this synthetic data set as
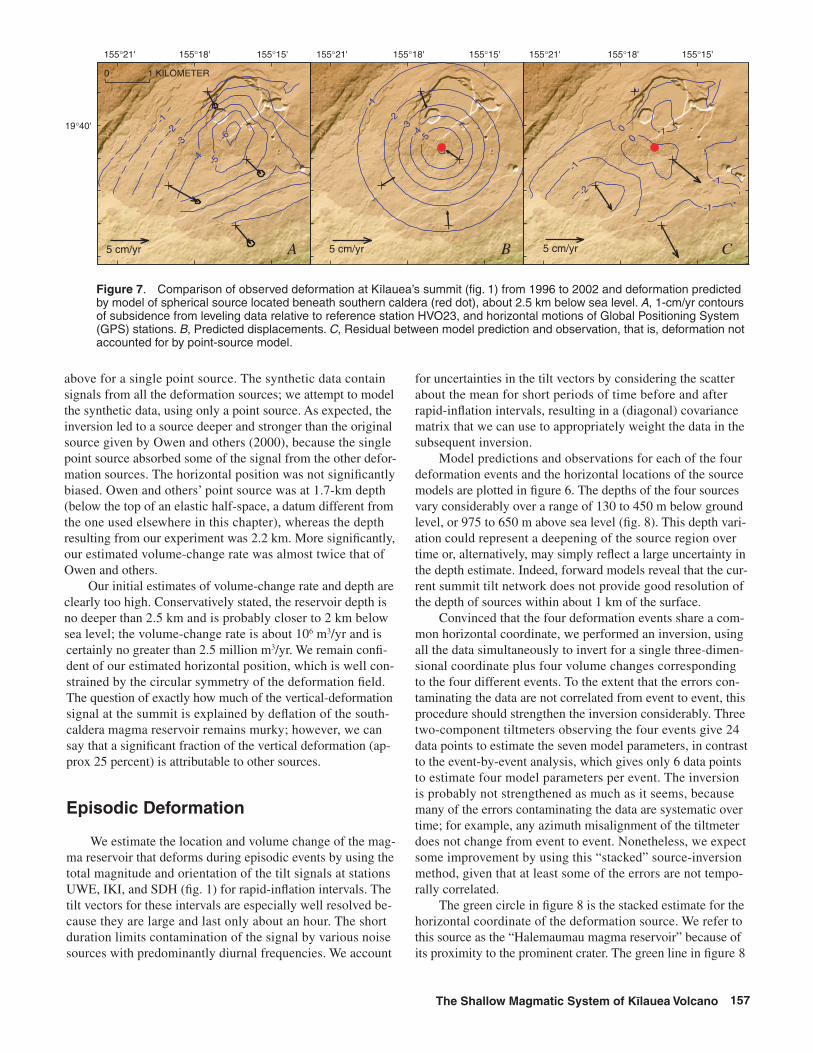
Figure 7. Comparison of observed deformation at Kïlauea’s summit (fig. 1) from 1996 to 2002 and deformation predicted by model of spherical source located beneath southern caldera (red dot), about 2.5 km below sea level. A, 1-cm/yr contours of subsidence from leveling data relative to reference station HVO23, and horizontal motions of Global Positioning System (GPS) stations. B, Predicted displacements. C, Residual between model prediction and observation, that is, deformation not accounted for by point-source model.
155°21' 155°15'155°18' 155°18' 155°18'155°21' 155°15' 155°21' 155°15'
19°40' -1-2
-3
-4 -5-6
-1
-2-3
-4-5
0 0
-1-2
-1
-1
-1
5 cm/yr5 cm/yr
0 1 KILOMETER
5 cm/yr A B C
156 The Pu‘u ‘Ö‘ö-Küpaianaha Eruption of Kïlauea Volcano, Hawai‘i: The First 20 Years 157The Shallow Magmatic System of Kïlauea Volcano
above for a single point source. The synthetic data contain signals from all the deformation sources; we attempt to model the synthetic data, using only a point source. As expected, the inversion led to a source deeper and stronger than the original source given by Owen and others (2000), because the single point source absorbed some of the signal from the other defor-mation sources. The horizontal position was not significantly biased. Owen and others’ point source was at 1.7-km depth (below the top of an elastic half-space, a datum different from the one used elsewhere in this chapter), whereas the depth resulting from our experiment was 2.2 km. More significantly, our estimated volume-change rate was almost twice that of Owen and others.
Our initial estimates of volume-change rate and depth are clearly too high. Conservatively stated, the reservoir depth is no deeper than 2.5 km and is probably closer to 2 km below sea level; the volume-change rate is about 106 m3/yr and is certainly no greater than 2.5 million m3/yr. We remain confi-dent of our estimated horizontal position, which is well con-strained by the circular symmetry of the deformation field. The question of exactly how much of the vertical-deformation signal at the summit is explained by deflation of the south-caldera magma reservoir remains murky; however, we can say that a significant fraction of the vertical deformation (ap-prox 25 percent) is attributable to other sources.
Episodic Deformation
We estimate the location and volume change of the mag-ma reservoir that deforms during episodic events by using the total magnitude and orientation of the tilt signals at stations UWE, IKI, and SDH (fig. 1) for rapid-inflation intervals. The tilt vectors for these intervals are especially well resolved be-cause they are large and last only about an hour. The short duration limits contamination of the signal by various noise sources with predominantly diurnal frequencies. We account
for uncertainties in the tilt vectors by considering the scatter about the mean for short periods of time before and after rapid-inflation intervals, resulting in a (diagonal) covariance matrix that we can use to appropriately weight the data in the subsequent inversion.
Model predictions and observations for each of the four deformation events and the horizontal locations of the source models are plotted in figure 6. The depths of the four sources vary considerably over a range of 130 to 450 m below ground level, or 975 to 650 m above sea level (fig. 8). This depth vari-ation could represent a deepening of the source region over time or, alternatively, may simply reflect a large uncertainty in the depth estimate. Indeed, forward models reveal that the cur-rent summit tilt network does not provide good resolution of the depth of sources within about 1 km of the surface.
Convinced that the four deformation events share a com-mon horizontal coordinate, we performed an inversion, using all the data simultaneously to invert for a single three-dimen-sional coordinate plus four volume changes corresponding to the four different events. To the extent that the errors con-taminating the data are not correlated from event to event, this procedure should strengthen the inversion considerably. Three two-component tiltmeters observing the four events give 24 data points to estimate the seven model parameters, in contrast to the event-by-event analysis, which gives only 6 data points to estimate four model parameters per event. The inversion is probably not strengthened as much as it seems, because many of the errors contaminating the data are systematic over time; for example, any azimuth misalignment of the tiltmeter does not change from event to event. Nonetheless, we expect some improvement by using this “stacked” source-inversion method, given that at least some of the errors are not tempo-rally correlated.
The green circle in figure 8 is the stacked estimate for the horizontal coordinate of the deformation source. We refer to this source as the “Halemaumau magma reservoir” because of its proximity to the prominent crater. The green line in figure 8

Figure 8. Depth of modeled Halemaumau magma reservoir versus time for four short-lived tilt events. Horizontal line indi-cates depth estimated with “stacked” model, which com-bines data from all four events into a single inversion. Inset map shows narrow range of horizontal locations of each modeled source.
���������� ���������� ���������� �������������
���
���
���
���
���
���
����
����
��������������������������������
���
��������������������������
���������
������
���
���
�������������
������
� � ���������
����� ������� �������� �������� �����������
�����������
158 The Pu‘u ‘Ö‘ö-Küpaianaha Eruption of Kïlauea Volcano, Hawai‘i: The First 20 Years 159The Shallow Magmatic System of Kïlauea Volcano
shows the stacked estimate of the depth—about 850 m above sea level (350 m below ground level). Our estimated location of the Halemaumau magma reservoir agrees closely with that inferred from broadband seismic data (Ohminato and others, 1998). However, our estimate of the reservoir depth is some-what shallower; Ohminato and others imaged a finite spheri-cal source centered about 200 m above sea level (950 m be-low ground level), with a radius of about 0.5 km. As discussed below, we do not believe that this discrepancy is statistically significant at the 95-percent-confidence level.
Another advantage of stacking the data over time is that we then have enough data points to estimate uncertainties in the model parameters by using the bootstrap method (Efron and Tibshirani, 1993). Briefly, this method involves randomly resampling the data vector (with replacement) numerous timesand then estimating a new optimal source model for each resample. The empirical probability distribution of the model parameters is given by the parameter distribution resulting from the bootstrap. Histograms for the three model coor-dinates show that the horizontal coordinates are well con-strained, but the depth shows a more asymmetric, long-tailed range of possibilities (fig. 9). Also shown in figure 9 is a scatter plot of depth versus volume change for the largest de-formation event (May 2001). The clear correlation between these two model parameters implies that the parameters are not separable, given the current spatial distribution of data. Qualitatively, this result means that increased volume change can compensate for deeper sources, but only up to a point; the data do constrain the depth to be shallower than about sea level at a high confidence level.
In the following discussion, we use the volume changes from four episodic deformation events to estimate magma-supply rates. The geometry of the current tilt network results in poor source-depth resolution and a high correlation between depth and volume change. To obtain unbiased estimates of
volume change, we decided to fix the source depth to 700 m above sea level (450 m below ground surface). This depth is not completely arbitrary because it lies well within the 95-percent-confidence level estimated by the bootstrap method, although it is not the most probable depth. Inversions in a homogeneous source tend to bias source depths as too shal-low, but this bias is probably only about 50 m. Our primary reason for choosing the 700-m depth is that this depth agrees well with the depth estimates from other geophysical methods (Ohminato and others, 1998) and, moreover, does not contra-dict the tilt data. As of this writing, we are installing a new tiltmeter north of Halemaumau that should help resolve the source-depth question.
Discussion
We interpret these tilt events as resulting from an inter-ruption or blockage in magma supply that affects both the Halemaumau magma reservoir and the conduit to Pu‘u ‘Ö‘ö. At the onset of the interruption, deflation begins at the summit (and slightly later at Pu‘u ‘Ö‘ö) as lava continues to exit the system through flank vents on Pu‘u ‘Ö‘ö. This deflation is the result of continued withdrawal at a time of interrupted sup-ply. When the interruption ends, rapid inflation ensues as the accumulated and overpressurized magma below the locus of interruption rushes up into the shallow magma system. We do not speculate here about the cause of the interruption, except to note that there are several possible explanations.
If this “blocked pipe” model is correct, then the magni-tude of the inflation should scale with the duration of the deflation times the magma-supply rate times an efficiency factor that measures what percentage of the magma supply is blocked. Assuming complete blockage, the magma-supply rate

Table 1. Characteristics of four self-similar tilt events.
[Parameters are duration of deflationary stage, estimated volume change during infla-tion, and corresponding magma-supply rate, assuming a blocked-pipe model.]
Figure 9. Probability distribution of model parameters (lati-tude, longitude, depth), estimated with bootstrap method. Plot of depth versus volume change (for May 2000 event) shows close correlation between these parameters. All depths below sea level; ground surface is about 1,100 m above sea level.
LATITUDE W.
-155°16'44" -155°16'30" -155°16'16" 0
200
400
600
800
1000
1200
100
DEPTH, IN METERS
NU
MB
ER
OF
SA
MP
LE
S
200 300 400 500 600 700 800 900 10000
0.5
1.0
1.5
2.0
2.5
3.0
VO
LU
ME
CH
AN
GE
, IN
MIL
LIO
NS
OF
CU
BIC
ME
TE
RS
0
200
400
600
800
1000
1200
100 200 300 400 500 600 700 800 9001000
NU
MB
ER
OF
SA
MP
LE
S
19°24'7" 19°24'22" 19°24'36"0
200
400
600
800
1000
1200
LATITUDE N.
DEPTH, IN METERS
NU
MB
ER
OF
SA
MP
LE
S
158 The Pu‘u ‘Ö‘ö-Küpaianaha Eruption of Kïlauea Volcano, Hawai‘i: The First 20 Years 159The Shallow Magmatic System of Kïlauea Volcano
can be estimated directly. The duration of deflation, magnitude of inflation, and estimated magma-supply rates for the four events are listed in table 1.
Other estimates of magma-supply rates come from very low frequency (VLF) measurements across lava tubes leading from Pu‘u ‘Ö‘ö (Kauahikaua and others, 1996) and from SO2 emission measurements from the eruption site (Sutton and others, 2001). The VLF data estimate just the rate of lava leaving Pu‘u ‘Ö‘ö; they are insensitive to the volume of magma being stored or emplaced elsewhere. Thus, the VLF measurements represent a minimum magma-supply rate into Kïlauea’s magmatic system. Eruption-site SO2 emissions also represent a minimum estimate for similar reasons. As expected, the magma-supply rates implied by the blocked-pipe model are systematically larger than those estimated by these two methods (fig. 10). The relative magnitudes of observed magma-supply rates seem to agree well with those predicted from the blocked-pipe model. Moreover, the exceptionally high rate we estimated during the May 2001 event corresponds to a large spike in SO2 emissions, although curiously this spike is absent in the VLF data. However, because VLF measurements give only the cross-sectional area of the flowing lava, the conversion to lava flux rate requires a velocity estimate. Therefore, if a direct measurement of flow velocity is unavailable, VLF measurements can miss a flux spike, provided the cross-sectional area of the flowing lava (the tube) does not increase.
The tilt records give unambiguous estimates of the time lag between the onset of inflation at Kïlauea’s summit and at Pu‘u ‘Ö‘ö. Using a nominal distance of 20 km from the sum-mit to Pu‘u ‘Ö‘ö, we can estimate a propagation velocity. The tilt records also provide a direct estimate of the instantaneous flux rate into the shallow magmatic system during the inflation-ary stage. The propagation velocity is probably a reasonable proxy for the flow velocity through the conduit from the sum-mit to Pu‘u ‘Ö‘ö, because, owing to the blockage, the conduit

Figure 10. Comparison of magma-supply rates estimated from blocked-pipe model with (1) estimates of lava-effusion rates derived from SO2 emissions from the eruption site, and (2) estimates of lava flux from Pu‘u ‘Ö‘ö based on very low frequency (VLF) measurements across lava tubes.
���������
����������
����������
����������
����������
��������
�����
����
����
����
����
�����
������
���
���
���
���
�������
���
���
���
���
���
���� ����
���
���
�
���
���
���
���
���
���
����
������������
���
�������������������
������������
�
���
���
�����
�����������
Table 2. Estimates of conduit radius based on inferred magma-supply rate and velocity for four self-similar tilt events discussed in text.
160 The Pu‘u ‘Ö‘ö-Küpaianaha Eruption of Kïlauea Volcano, Hawai‘i: The First 20 Years 161The Shallow Magmatic System of Kïlauea Volcano
was in a state of low pressure before the onset of inflation. Moreover, if the propagation were really a pressure pulse, we would expect the velocity of the pulse to approximate the P-wave velocity of the magma, more than 1,000 m/s (Murase and McBirney, 1973).
If we assume that the flux rate through the conduit were the same as that measured at the summit, then we can estimate the radius of the conduit. Of course, this estimate assumes a cylindrical conduit, but this geometry seems likely for thermal and mechanical reasons. After the initial dike intrusion, we suggest that magma flow quickly centralized into a cylindri-cal conduit, much as a fissure eruption rapidly evolves into a single circular vent.
Poiseuille flow, frequently used to model the flow of vis-cous fluid through a pipe, gives the following relation:
r = (2 Q / π u)1/2,
where r is the conduit radius, Q is the flux rate, and u is the flow velocity. Because the radius is a function of the square root of the ratio of flux to velocity, it is fairly well constrained, even given large uncertainties in Q and u. We estimate a mean
conduit radius of 2.75±0.5 m (table 2). A radius of this size, in combination with the maximum flow velocities and a typi-cal viscosity for basaltic magma (100 Pa·s), leads to Reynolds numbers averaging about 1,750. This result implies laminar flow, possibly explaining why the conduit can survive the high flow velocities associated with these deformation events. Laminar, rather than turbulent, flow may also explain the observed absence of volcanic tremor along the inferred (see below) path of the conduit.

Figure 11. Detail of station NPT (fig. 1) spectrogram and station UWE radial tilt from April 5, 2002, tilt event. Note burst of seismic energy preceding inflation, followed by marked pause in seismicity until well after inflationary stage is underway.
���� ���� ���� ���� ���� ���� ���� ���� ���� ���� ���� ���� ����
�
�
���
���
���
����
����
�
�
�
�
�
�
�
�
�
��
����
�������������������������
�����������������
160 The Pu‘u ‘Ö‘ö-Küpaianaha Eruption of Kïlauea Volcano, Hawai‘i: The First 20 Years 161The Shallow Magmatic System of Kïlauea Volcano
Neither the episodic events nor the long-term deformation gives any direct indication of the depth of the conduit from Kïlauea’s summit to Pu‘u ‘Ö‘ö. We consider two possible scenarios. First, the conduit could leave the Halemaumau magma reservoir and run subhorizontally until it intersects the surface topography at Pu‘u ‘Ö‘ö. Second, the conduit could leave from the deeper south-caldera reservoir and run obliquely upward to the vent. Both the summit and Pu‘u ‘Ö‘ö deflated more or less concurrently during the first phase of each deformation event, and so the interruption must have occurred below both the conduit and the Halemaumau magma reservoir. Although this information is insufficient to decide between these two possible scenarios, the fact that the inter-ruption affected the whole shallow magmatic system leads to several interesting observations.
A closeup of the spectrogram from a seismometer located at station NPT, just north of Halemaumau (fig. 1), during the April 2002 deformation event is shown in the upper part of figure 11, and the radial tilt at station UWE in the lower part. Note that an intense burst of seismic energy begins about 19 minutes before inflation is first recorded by the tiltmeter, and then ends abruptly about 15 minutes after it began and 4 minutes before inflation. We interpret this burst of seismic energy as volcanic tremor resulting from magma flow at or
near the point of interruption as the blockage is breached. Another burst of seismic energy appears on the spectrogram about 4 minutes into the inflation at the summit and lasts for another 45 minutes, ending approximately simultaneously with the inflation. This second burst of seismic energy could have resulted from tremor associated with flow out of the Halemaumau magma reservoir into the conduit toward Pu‘u ‘Ö‘ö. Other equally plausible hypotheses remain because the nature of tremor is not well understood and the locus of tremor is extremely difficult to determine. For example, the second burst of seismic energy could be a combination of numerous small summit earthquakes, triggered by the sudden inflation, and tremor from flow into a conduit toward Pu‘u ‘Ö‘ö situated well below the Halemaumau magma reservoir. Indeed, since the location of the blockage is unknown, the conduit to Pu‘u ‘Ö‘ö could originate from the south-caldera reservoir and still not contradict the data.
The connection between the south caldera reservoir, the Halemaumau magma reservoir, and Pu‘u ‘Ö‘ö can be represen-ted by two simple models: (1) a Y-shaped model with two branches from the south-caldera reservoir, one to the Hale-maumau magma reservoir, the other to Pu‘u ‘Ö‘ö; and (2) a Γ-shaped model characterized by a single “vertical” conduit from the south-caldera reservoir to the Halemaumau magma
162 The Pu‘u ‘Ö‘ö-Küpaianaha Eruption of Kïlauea Volcano, Hawai‘i: The First 20 Years 163The Shallow Magmatic System of Kïlauea Volcano
reservoir and a single “horizontal” conduit from the Hale-maumau magma reservoir to Pu‘u ‘Ö‘ö. We favor the Γ-shaped model, for the following reasons.
First, a shallow conduit is more likely than a deep conduit to remain open during the frequent pauses that have character-ized many intervals of this eruption (see Heliker and Mattox, this volume), because a deep conduit would undergo signifi-cantly higher lithostatic pressures. During a pause, magma pressure within the conduit is presumed to drop; without high magma pressure, it is difficult to see how a deep conduit could remain open. Yet, after every pause to date, the eruption at Pu‘u ‘Ö‘ö has resumed.
Second, because the Halemaumau magma reservoir shows marked inflation during episodic deformation events and then deflates back to pre-event levels, the question arises of where the excess magma goes during deflation. A Y-shaped system implies that the magma drains back down, because there is no place else for it to go. In contrast, in a Γ-shaped system, the excess magma simply makes its way to Pu‘u ‘Ö‘ö and erupts onto the surface. It is difficult to understand why the Halemaumau magma reservoir would remain a persis-tently active part of the magmatic system under the Y-shaped scenario.
Finally, shallow intrusions into the upper east rift zone are known to affect both the Halemaumau magma reservoir and Pu‘u ‘Ö‘ö (Cervelli and others, 2002b). These dikes are prob-ably too shallow to intersect a deep conduit to Pu‘u ‘Ö‘ö, sug-gesting that a Γ-shaped system is more plausible.
Conclusions
The shallow magma system of Kïlauea consists of two distinct magma reservoirs: the Halemaumau reservoir at a depth of about 700 m above sea level, and the south-caldera reservoir at a depth of about 2,500 m below sea level. The south-caldera reservoir is slowly deflating at a rate of no more than about 2.5×10⁶ m3 per year, which is about 2 percent of the total volume of lava erupted from Pu‘u ‘Ö‘ö each year.
The Halemaumau magma reservoir undergoes charac-teristic, episodic deflation-inflation events that we interpret as resulting from an interruption in magma supply from depth. These events occur with no obvious periodicity. The dura-tion of the deflation and the magnitude of the inflation permit estimates of the total flux through the shallow magma system. Our flux estimates show a good qualitative agreement with other flux estimates inferred from VLF and SO2-emission measurements.
The location of the conduit from Kïlauea’s summit to Pu‘u ‘Ö‘ö is not well resolved by the available geodetic data. We argue, however, that the conduit probably emanates from the Halemaumau magma reservoir at a depth of about 700 m below the surface, with an inferred radius of about 2.75 m.
Acknowledgments
We thank Rick Hoblitt for detailed early discussions about the blocked-pipe interpretation of the episodic tilt events. The manuscript could not even have been started without the efforts of Mike Lisowski, who built the current electronic borehole tiltmeter network on Kïlauea and was also instrumental in building the continuous GPS network. Mike had help; Maurice Sako and Fran Coloma contributed espe-cially long hours of labor and planning. Maurice also led the small army of people needed to conduct the annual leveling surveys, and we thank all of them. Paul Okubo and Jean Battag-lia provided us with spectrograms and helped us understand how to interpret them. Jim Kauahikaua and Jeff Sutton gave us the measurements we needed to compare our predicted flux estimates with some realistic benchmark. Thanks to Paul Segall and Susan Owen for their contributions to the Stanford/-HVO GPS network. Michael Bevis and James Foster kindly provided data from the University of Hawai‘i’s Kïlauea GPS network. Sigurjon Jonsson and Jim Kauahikaua gave quick and thorough reviews; their comments greatly improved the manuscript. Finally, we thank the editors, Christina Heliker, Don Swanson, and Jane Takahashi, for taking on the task of organizing this volume and bringing it to completion.
References Cited
Anderson, E.M., 1936, Dynamics of the formation of cone-sheets, ring-dykes, and cauldron-subsidences: Royal Society of Edinburgh Proceedings, v. 56, p. 128–157.
Árnadóttir, Thóra, Segall, Paul, and Matthews, M.V., 1992, Resol-ving the discrepancy between geodetic and seismic fault models for the 1989 Loma Prieta, California, earthquake: Seismological Society of America Bulletin, v. 82, no. 5, p. 2248–2255.
Cervelli, P.F., Murray, Michael, Segall, Paul, Aoki, Yosuke, and Kato, Teruyuki, 2001, Estimating source parameters from deformation data, with an application to the March 1997 earthquake swarm off the Izu Peninsula, Japan: Journal of Geophysical Research, v. 106, no. B6, p. 11217–11238.
Cervelli, P.F., Segall, Paul, Amelung, Falk, Garbeil, Harold, Meertens, C.M., Owen, S.E., Miklius, Asta, and Lisowski, Michael, 2002, The 12 September 1999 Upper East Rift Zone dike intrusion at Kilauea Volcano, Hawaii: Journal of Geo-physical Research, v. 107, no. B7, p. ECV 3–1 – ECV 3–13.
Cervelli, P.F., Segall, Paul, Johnson, K.M., Lisowski, Michael, and Miklius, Asta, 2002, Sudden aseismic fault slip on the south flank of Kilauea volcano: Nature, v. 415, no. 6875, p. 1014–1018.
Delaney, P.T., Miklius, Asta, Árnadóttir, Thóra, Okamura, A.T., and Sako, M.K., 1993, Motion of Kilauea Volcano during sustained eruption from the Puu Oo and Kupaianaha vents, 1983–1991: Journal of Geophysical Research, v. 98, no. B10, p. 17801–17820.

162 The Pu‘u ‘Ö‘ö-Küpaianaha Eruption of Kïlauea Volcano, Hawai‘i: The First 20 Years 163The Shallow Magmatic System of Kïlauea Volcano
Efron, Bradley, and Tibshirani, R.J., 1993, An introduction to the bootstrap (Monographs on Statistics and Applied Probability, no. 57): New York, Chapman & Hall/CRC, 436 p.
Fiske, R.S., and Kinoshita, W.T., 1969, Inflation of Kilauea Vol-cano prior to its 1967–1968 eruption: Science, v. 165, no. 3891, p. 341–349.
Johnson, K.M., Segall, Paul, and Cervelli, P.F., 2001, Analytical methods for including vertical and lateral heterogeneity of elastic properties in dislocation models and applications to two coseismic GPS data sets [abs.]: Eos (American Geophysical Union Transactions), v. 82, no. 47, supp., p. F296–F297.
Kauahikaua, J.P., Mangan, M.T., Heliker, C.C., and Mattox, T.N., 1996, A quantitative look at the demise of a basaltic vent; the death of Kupaianaha, Kilauea Volcano, Hawai‘i: Bulletin of Volcanology, v. 57, no. 8, p. 641–648.
Lichten, S.M., 1990, Estimation and filtering for high-precision GPS positioning applications: Manuscripta Geodetica, v. 15, p. 159–176.
Lichten, S.M., and Border, J.S., 1987, Strategies for high-precision global positioning system orbit determination: Journal of Geophysical Research, v. 92, no. B12, p. 12751–12762.
McTigue, D.F., 1987, Elastic stress and deformation near a finite spherical magma body; resolution of the point source para-dox: Journal of Geophysical Research, v. 92, no. B12, p. 12931–12940.
McTigue, D.F., and Segall, Paul, 1988, Displacements and tilts from dip-slip faults and magma chamber beneath irregular surface topography: Geophysical Research Letters, v. 15, no. 6, p. 601–604.
Mogi, Kiyoo, 1958, Relations between the eruptions of various volcanoes and the deformation of the ground surfaces above them: University of Tokyo, Earthquake Research Institute Bulletin, v. 36, no. 2, p. 99–134.
Murase, Tsutomu, and McBirney, A.R., 1973, Properties of some common igneous rocks and their melts at high temperatures: Geological Society of America, v. 84, no. 11, p. 3563–3592.
Ohminato, Takao, Chouet, B.A., Dawson, P.B., and Kedar, Sharon, 1998, Waveform inversion of very long period impulsive signals associated with magmatic injection beneath Kilauea Volcano, Hawaii: Journal of Geophysical Research, v. 103, no. B10, p. 23839–23862.
Okada, Yoshimitsu, 1985, Surface deformation due to shear and ten-sile faults in a half-space: Seismological Society of America Bulletin, v. 75, no. 4, p. 1135–1154.
Owen, S.E., Segall, Paul, Lisowski, Michael, Miklius, Asta, Denlinger, R.P., and Sako, M.K., 2000, Rapid deformation of Kilauea Volcano; global positioning system measurements between 1990 and 1996: Journal of Geophysical Research, v. 105, no. B8, p. 18983–18998.
Segall, Paul, Cervelli, P.F., Owen, S.E., Lisowski, Michael, and Miklius, Asta, 2001, Constraints on dike propagation from continuous GPS measurements: Journal of Geophysical Research, v. 106, no. B9, p. 19301–19317.
Sutton, A.J., Elias, Tamar, Gerlach, T.M., and Stokes, J.B., 2001, Implications for eruptive processes as indicated by sulfur dioxide emissions from Kïlauea Volcano, Hawai‘i, 1979–1997: Journal of Volcanology and Geothermal Research, v. 108, no. 1–4, p. 283–302.
Tilling, R.I., and Dvorak, J.J., 1993, Anatomy of a basaltic volcano: Nature, v. 363, no. 6425, p. 125–133.
Williams, C.A., and Wadge, Geoffrey, 2000, An accurate and efficient method for including the effects of topography in three-dimensional elastic models of ground deformation with applications to radar interferometry: Journal of Geophysical Research, v. 105, no. B4, p. 8103–8120.

164 The Pu‘u ‘Ö‘ö-Küpaianaha Eruption of Kïlauea Volcano, Hawai‘i: The First 20 Years