the shape of a free trade agreement … shape of a free trade agreement between switzerland and the...
TRANSCRIPT

Draft, September 27, 2005
THE SHAPE OF A FREE TRADE AGREEMENT BETWEEN SWITZERLAND AND THE UNITED STATES
A Report by the Institute for International Economics Washington DC
Gary Clyde Hufbauer and Richard Baldwin Assisted by
Agustin Cornejo, Victoria Courmes, Dean DeRosa, John Gilbert, Claire Owen and Yee Wong
1

TABLE OF CONTENTS
I. INTRODUCTION 1. Answers to Skeptical Questions: The FTA Case
a. Is the Geographic and Political Distance Too Great? b. Are there Real Benefits to an FTA? c. Is the Timing Wrong? d. Will the Agreement Comport with GATT Article 24?
2. Switzerland’s Place in the Queue a. Quantitative Indicators b. Qualitative Indicators
3. Plan of the Report II. AGRICULTURAL MARKET ACCESS
1. United States: Barriers to Agricultural Trade a. Tariffs & Tariff-Rate Quotas
Tariffs Tariff-Rate Quotas
b. Safeguards, Antidumping Measures, and Countervailing Duties Safeguard Measures Antidumping and Countervailing Duties
c. Other Measures Domestic Support Export Subsidies Customs Procedures
2. Switzerland: Barriers to Agricultural Trade a. Tariffs & Tariff-Rate Quotas
Tariffs Tariff-Rate Quotas
b. Safeguards, Antidumping Measures, and Countervailing Duties c. Other Barriers
Domestic Support Measures Price Controls, Export Refunds, and Export Subsidies Import Prohibitions
3. Phase-out Schedules for Agricultural Barriers in US FTAs a. NAFTA
US-Mexico US- Canada
b. US-Australia c. US-Chile d. US-Morocco e. CAFTA-DR
4. Phase-outs Schedules for Agricultural Barriers in Swiss FTAs a. Overview
2
b. Swiss-EU Agricultural Agreement Cheese and Dairy Plants and Flowers Fruits and Vegetables Dried Meat Other Products
5. Recommendations on Agricultural Market Access Barriers
III. ISSUES LINKED TO AGRICULTURE
1. Sanitary and Phyto-Sanitary Measures a. SPS Measures in US Trade Agreements b. SPS Measures in Swiss Trade Agreements c. Outstanding SPS Issues on the Bilateral Swiss-US Agenda d. Labeling and Equivalent Standards e. Recommendations for SPS and Related Issues
2. Geographic Indications a. Geographic Indications in the United States b. Geographic Indications in Switzerland c. US and Swiss Views of GI Protection in the TRIPS Agreement d. Recommendations for GI Issues
IV. MANUFACTURES TRADE
1. Tariffs and Tariff-Rate Quotas 2. Safeguards, Antidumping and Countervailing Duties
a. Safeguards b. Antidumping and Countervailing Duties
3. Standards, Technical Barriers, and Conformity Assessment a. Standards and Technical Regulations United States Switzerland b. Conformity Assessment United States Switzerland c. Mutual Recognition United States Switzerland
4. Tariff Phase-outs in US and Swiss FTA Agreements a. Selected US FTAs US-Singapore FTA US-Australia FTA US-Chile FTA b. Selected Swiss FTAs
5. Rules of Origin a. Overview
3
Cumulation Remanufactures Certification Substantial Transformation b. US Bilateral FTAs
Substantial Transformation Special Textile and Clothing Rules
c. Swiss Agreements 6. Recommendations for Manufactures Trade
V. SERVICES TRADE
1. Barriers to Trade in Services: The United States a. Financial Services
Banking Insurance
Commercial Presence Cross Border Supply Movement of Natural Persons
Securities b. Telecommunications Services c. Professional Services
Legal Services Accounting and Auditing Services Engineering Services
2. Barriers to Trade in Services: Switzerland a. Switzerland’s Competition Law b. Financial Services
Banking Services Insurance Services
c. Network Industries Electricity Natural Gas Telecommunications Postal Services
d. Audiovisual Services e. Professional Services
Accounting and Auditing Legal Services Architecture and Engineering Other Service Sectors
f. Recent Developments 3. Services Trade Negotiations in Selected US Bilateral FTAs
a. The United States and Australia Broadcasting and Audiovisual Services
4
Financial Services Insurance Express Delivery Services Telecommunications Professional Services
b. The United States and Singapore Banking Services Insurance Securities Telecommunications Professional Services Express Delivery Audiovisual Services Comparing US-Singapore with EFTA-Singapore
4. Recommendations for Services Trade
VI. GOVERNMENT PROCUREMENT 1. Government Procurement: The United States
a. Regulatory Environment The Buy America Act The Balance of Payment Program The Trade Agreements Act of 1979 Exemptions and Waivers
b. The WTO GPA and US Bilateral Agreements c. Effect of Restrictions
Public Transportation Highway Construction Airport Construction Food Assistance Small Business Set-Asides Defense Procurement State and Local Government Procurement Sub-Federal Selective Purchasing Laws Services
d. Recent Developments 2. Government Procurement: Switzerland
a. Regulatory Environment b. Swiss Reservations Under the WTO GPA c. Bilateral Agreements d. Effect of Restrictions e. Recent Developments
3. Recommendations for Government Procurement a. Recommendations for the United States b. Recommendations for Switzerland
5

VII. DIRECT AND PORTFOLIO INVESTMENT
1. Foreign Direct Investment in Perspective a. Trans Atlantic Overview b. The Swiss-US FDI Relation
Total FDI Positions Industry Breakdown of FDI
c. FDI Income Flows d. The Connection Between FTAs, FDI, and Exports
2. Leading Companies in the Bilateral Relation a. Swiss Companies in the United States b. US Companies in Switzerland
3. FDI Related to Capital Formation and GDP 4. FDI Friction
a. Impediments to FDI in Switzerland General Background Temporary Skilled Worker Visas
b. Impediments to FDI in the United States Overview The Exon-Florio Amendment Foreign Ownership Restrictions Tax Discrimination International Disputes
5. Portfolio Investment a. Overview b. Equity Investment c. Debt Securities d. Portfolio Income Flows e. Portfolio Investment Issues
6. Recommendations for Investment
VIII. ESTIMATES FROM GRAVITY AND CGE MODELS 1. Gravity Model: Construction and Results
a. Description of the Gravity Model b. Swiss-US FTA Analytical Framework c. Results from the Gravity Model
2. CGE Model: Construction and Results a. Description of the CGE Model b. Experimental Design c. Results from the CGE Model
3. Summing Up
IX. SWISS RELATIONS WITH THE EUROPEAN UNION 1. Historical Perspective
6

a. First Reaction: EFTA and the EEC b. Second Reaction: Swiss-EU FTA c. Third Reaction: the EEA and Bilateral Accords
2. From Reactive to Proactive 3. Would the EU Object to a Swiss-US FTA?
Indirect Effects on Political Forces
X. CONCLUSIONS 1. Strong Links, Similar Values, Large Benefits 2. Answering the Skeptics 3. Managing Agriculture 4. Expanding Trade in Manufactures 5. Services: The Future of International Trade 6. Government Procurement 7. Investment 8. Swiss-EU Relations 9. Wrapping Up
APPENDIX A Phase-outs Schedules for Agricultural Barriers in US FTAs Beef Corn and Corn Products Raw Cotton Dairy Distilled Spirits Fruits, Vegetables, and Nuts Other Grains Other Processed Foods Peanuts and Peanut Products Poultry and Other Meats Soybeans, Soybean Meal and Soybean Oil Sugar Tobacco Wheat Wine APPENDIX B SPS Measures in US and Swiss Trade Agreements
a. SPS Measures in US Trade Agreements NAFTA US-Australia FTA US-Chile FTA US-Central America and Dominican Republic FTA (CAFTA-DR)
7
US-Morocco FTA US-EU Veterinary Agreement SPS Matters in Memorandums of Understanding (MOUs)
b. SPS Measures in Swiss Trade Agreements SPS Issues in the Swiss-EU Agricultural Agreement SPS Issues and Recent Swiss/EFTA’s Bilateral FTAs
APPENDIX C GI Provisions in US and Swiss Trade Agreements a. GI Provisions in Selected US FTAs
US-Australia FTA US-Chile FTA CAFTA-DR US-European Community Distilled Spirits and Spirit Drink Agreement
b. GI Provisions in Selected Swiss FTA EFTA-Israel EFTA-Bulgaria EFTA-Mexico Swiss-EU Agricultural Agreement EFTA-Singapore EFTA-Chile EFTA-Lebanon
APPENDIX D Preferential Trade Agreements and Foreign Direct Investment: Selected
Literature. a. Studies Covering All Countries b. Studies Covering NAFTA Partners c. Exports and FDI: Complements not Substitutes
APPENDIX E Technical Aspects of the Gravity and CGE Models
a. Aspects of the Gravity Model Data Set Construction Estimating Techniques Reservations About the APC Results
b. Aspects of the Computable General Equilibrium Model Overview Base Data Aggregating Strategy Data Adjustments
8
LIST OF TABLES Table 1.1 Foreign Direct Investment Stocks Table 1.2 US Merchandise Trade Table 1.3 US Trade in Services Table 1.4 Average MFN Tariff Rates Table 1.5 Corruption and Economic Freedom Table 1.6 Environmental Standards Table 1.7 Labor Standards Table 2.1 Agriculture in US-Swiss Bilateral Trade Table 2.2 Swiss Imports of Agricultural Products Table 2.3 US Applied MFN Tariffs for Agricultural Products Table 2.4 US Tariff Peaks in Agriculture Table 2.5 US Tariff Rate Quotas Table 2.6 US MFN and Preferential Tariffs by Partner Country or Group Table 2.7 US Barriers on the Top 30 Swiss Agricultural Exports Table 2.8 Swiss Agricultural Exports that Fare Poorly in the US Market Table 2.9 Swiss Agricultural Production Table 2.10 Summary Analysis of Swiss MFN Tariffs Table 2.11 Swiss Applied MFN Tariffs for Agriculture Table 2.12 Swiss Tariff Peaks in Agriculture Table 2.13 Swiss Over-Quota Tariff Rates for TRQ Imports Table 2.14 Swiss Preferential Tariffs by Country Table 2.15 Swiss Barriers on the Top 30 US Agricultural Exports Table 2.16 US Agricultural Exports that Fare Poorly in the Swiss Market Table 2.17 Swiss Consumer Prices of Selected Agricultural Products Table 2.18 Production, Consumption and Support of the Agricultural Sector Table 2.19 Producer Support Estimates (PSE), Top 10 Products Table 2.20 Composition of Producer Support Estimates Table 4.1 Manufactured Goods in US-Swiss Bilateral Trade Table 4.2 Manufactured Exports in Leading 2-digit HS Chapters Table 4.3 Top Swiss Exports of Manufactures to the United States Table 4.4 Top US Exports of Manufactures to Switzerland Table 4.5 Trade-Weighted Tariffs on Bilateral Trade Table 4.6 Selected US Ad Valorem Tariff Peaks Table 4.7 High US Tariffs on Selected Swiss Manufactured Exports
9

Table 4.8 Selected Swiss Ad Valorem Tariff Peaks Table 4.9 Phase-outs for Tariffs on Manufactured Goods, US-Singapore FTA Table 4.10 Phase-outs for Tariffs on Manufactured Goods, US-Australia FTA Table 5.1 Cross-Border Services Trade Between the United States and Switzerland Table 5.2 US-Swiss Trade in Services by Industry Table 5.3 Restrictions on Banking Table 5.4 Restrictiveness Index for Telecommunications Services Table 5.5 Foreign Restrictiveness Index for Professional Services Table 5.6 Selected General Provisions in Services Table 6.1 Swiss Reservations in the Government Procurement Agreement Table 6.2 Threshold Values in the WTO GPA and US Bilateral FTAs Table 6.3 Services Covered by the United States in the GPA and Bilateral FTAs Table 7.1 US Foreign Direct Investment Stock Abroad by Industry Table 7.2 Foreign Direct Investment Stock in the United States by Industry Table 7.3 Foreign Direct Investment Stock in Switzerland Table 7.4 Swiss Direct Investment Stock Abroad Table 7.5 Top 15 Companies in the Bilateral Relationship Table 7.6 FDI Flows as Share of Gross Fixed Capital Formation Table 7.7 FDI Stock as Share of GDP Table 7.8 US Holdings of Portfolio Securities, by Partner and Type Table 7.9 Swiss Holdings of Portfolio Securities, World Totals Table 7.10 US Income Flows from FDI and Portfolio Investment Table 7.11 FDI Stock and Exports, Selected Sectors Table 8.1 Gravity Model Estimates for Total Trade Table 8.2 Gravity Model Estimates by Major Commodity Categories Table 8.3 CGE Changes in Key Variables, Swiss-US FTA Table 8.4 CGE Changes in Net Welfare by Region, Swiss-US FTA Table 8.5 CGE Changes in the Regional Pattern of Exports, Swiss-US FTA Table 8.6 CGE Changes in the Sectoral Pattern of Exports, Swiss-US FTA Table 8.7 CGE Changes in the Sectoral Pattern of Production, Swiss-US FTA Table 8.8 CGE Changes in Returns to Factors of Production, Swiss-US FTA Table 8.9 CGE Changes for Key Variables, all US FTAs Table 8.10 CGE Changes in the Regional Pattern of Exports, all US FTAs Table 8.11 CGE Changes in the Sectoral Pattern of Exports, all US FTAs Table 8.12 CGE Changes in the Sectoral Pattern of Production, all US FTAs Table 8.13 CGE Changes in Returns to Factors of Production, all US FTAs Table A.1 FTA Phase-Out Terms for Selected Agricultural Products
Table D.1 Relationship Between PTAs, FDI, and Exports Table E.1 Gravity Model Regression Variables, 1962-69
Table E.2 Aggregation Scheme for GTAP6 Database Table E.3 High Swiss Tariffs on Selected US Manufactured Exports
10
THE SHAPE OF A FREE TRADE AGREEMENT BETWEEN SWITZERLAND AND THE UNITED STATES
Chapter 1
INTRODUCTION
At first sight, a free trade agreement between Switzerland and the United States seems
implausible. Despite centuries of friendship, the countries are not political or military
allies, for the simple reason that Switzerland above all prizes its neutrality between the
great powers. Switzerland and the United States do not share a common border or even
the same continent. Nor do they share the same language: while English is widely
spoken in Switzerland, it is not among the four official languages. While both countries
are rich and mature, subscribe to market capitalism, and are relatively open to the world
economy (measured by the average height of tariff barriers), these similarities can be read
as a reason not to enter a free trade agreement. After all, what’s the purpose of an FTA
between two rich countries that embrace similar economic constitutions and are already
quite open to each other’s exports? Won’t another FTA just add to the “spaghetti bowl”
of confusion that threatens to undermine the world trading system?1 Finally, in the
closing months of the WTO Doha Development Round,2 does it make sense to distract
diplomatic and legislative energy from the overarching goal of global trade
liberalization?
1 The virtues and vices of bilateral free trade agreements have been widely debated. For a critical view, see WTO (2005); for a sympathetic exposition, see Schott (2004). 2 The Doha Development Round must conclude no later than early 2007 if the terms are to be ratified by the US Congress before US Trade Promotion Authority definitely expires on June 30, 2007.
2
Some observers, both in Switzerland and the United States, will find in these queries their
definitive answer: A bilateral FTA makes no sense. Others will be less critical but
question the timing: Why not wait until after the Doha Round is concluded and until the
EU-25 gets a better sense of its direction? Still others will argue that each skeptical
question can be turned into an argument for a bilateral FTA. This study will be of most
interest to those in the second and third camps, in other words observers who do not
foreclose the possibility or desirability of a Swiss-US FTA. Before launching into the
chapters, issue-by-issue, it’s worth seeing how the broad skeptical questions can be
turned.
1.1 Answers to Skeptical Questions: The FTA Case
A. Is the Geographic and Political Distance too Great?
To start, can support for FTA gain traction – given the certainty of economic hurdles – if
the partners are not political or military allies, are separated by thousands of miles, and
do not even speak the same language? Prior to the mid-1990s, free trade agreements and
customs unions were, to be sure, dominated by pacts between countries that were already,
or in the process of becoming, political allies – the European Common Market and then
the European Union, the Association of Southeast Asian Nations, the Australia-New
Zealand Closer Economic Relations pact, the North American Free Trade Area, and the
Mercosur. The European Free Trade Area (with Switzerland as a founding member) was,
from its inception, a purely economic venture without the overlay of a political alliance.
But in a way EFTA seemed the exception that proved the rule, as several members peeled

3
off to join the European Union. In short, experience up to the mid-1990s, led many
commentators to forecast a three-bloc world: contiguous customs unions and free trade
agreement organized around the European Union, the United States, and Asian powers
(China and/or Japan). FTAs came to be seen as building blocks for the sort of economic
and political integration that characterizes modern geographically-contiguous nations.
Hence these economic blocs might fortify internal political alliances, exacerbating
political tensions and erecting walls that divide the global economy.
Simply put, this dark vision proved wrong, even though FTAs have flourished. By one
count, some 176 new trade agreements have been notified since the birth of the WTO in
January 1995, and the total number threatens to exceed 300 (WTO 2005). Yet many of
the post-1995 FTAs are “out of area” and draw no inspiration from existing or anticipated
political alliances: US FTAs with Chile and Singapore; the same is true of EU FTAs with
Mexico and Chile; Japan’s FTA with Singapore; and Switzerland’s FTAs (under EFTA
auspices) with Chile, Singapore and South Korea.3 Even China’s menu of prospective
FTA partners seems devoid of political alliances (Hufbauer and Wong 2005). The
partners are often separated by thousands of miles and may not speak a common
language (US FTAs with Jordan, Morocco and Bahrain illustrate the disparities). Rather
than forming tightly knit geographic units, centered on a major power, FTAs are creating
criss-cross networks spanning the globe, where there is no clear separation between
“hubs” and “spokes”. Compared with recent experience, rather than dark visions of the
past, a Swiss-US FTA is perfectly compatible with the FTA movement.
3 The EFTA-South Korea FTA should be signed by the end of 2005.

4
B. Are There Real Benefits to an FTA?
What about the argument that, since both Switzerland the United States are rich,
subscribe to market capitalism and practice open economic policies, there is no real point
in a FTA? At bottom, this argument echoes the textbooks of an earlier day to the effect
that additional trade and consequent economic gains are greatest when two highly
dissimilar countries open commerce with one another. According to the “classic”
textbook exposition, large national differences portend sharp comparative advantages and
disadvantages, and hence big static gains from free trade. In a world of fixed
technological attributes, no economies of scale or scope, exchange limited to final goods
and services, complete factor immobility, perfect competition, and only static gains from
trade, the classic thesis is still a good thesis. But these were never accurate descriptors
for the world economy.
Recent econometric research demonstrates how misleadingly small are the projected
volumes of new trade and size of economic gains when models are confined to the classic
assumptions.4 When the realities of modern economic systems are given room to play –
learning from new competition and new markets, significant economies of scale and
scope, huge trade in intermediate goods and services that play an economic role similar to
basic factors of production, international investment, and erosion of monopolistic
margins – the models and experience reveal that similar countries can gain enormously
from free trade and investment, even when they already practice open economy policies.
4 For a short survey of the econometric methods for sizing up the gains from freer trade and investment, see Bradford, Grieco and Hufbauer (2005).

5
In the context of Swiss-US relations, it is simply wrong to assert that little or nothing
remains to be gained from bilateral free trade and investment. As described in the
chapters that follow, even though both countries are relatively open, they both have
significant barriers. Many of their important barriers are behind the border – non-tariff
barriers. Agriculture, selected manufactures, some services, and government
procurement are far from the ideal of free trade and investment. Moreover, even when
overall barriers are small or insignificant, recent econometric research (using the “gravity
model”) 5 reveals that an “announcement” or “lock-in” effect appears to augment
commerce between FTA partners.6
To preview our own econometric research, presented in Chapters 7 and 8, elimination of
all bilateral barriers between Switzerland and the United States might double two-way
merchandise trade. US foreign direct investment (FDI) in Switzerland – which is already
5 Chapter 8, authored by Dean DeRosa and John Gilbert, summarizes the gravity model technique. While the technique has been well known since Linnemann (1966), it has been applied to assess the effect of FTAs only since the work of Frankel (1997) and Rose (2000). Most gravity model estimates of the FTA trade-creation effect substantially exceed the forecasts made by basic computable general equilibrium models (DeRosa and Gilbert 2005). Various explanations can be adduced for the difference, but “announcement” and “lock-in” effects are commonly cited. We note however that authors at the Australian Productivity Commission (Adams et al. 2003) use a “dynamic” gravity model to support the claim that only 12 out of 16 recent FTAs created more trade than they diverted. For reasons noted in Chapter 8, we disagree with this claim. 6 The “announcement” effect presumably reflects the wake-up call that an FTA conveys to potential investors, exporters and imports. This could be important for US firms deciding on a headquarters location for their European operations. The “lock-in” effect reflects the greater certainty that firms can place in a country’s trade and investment policies once barriers are capped in an FTA. In the context of NAFTA, the lock-in effect was an important driver of new investment in Mexico. However, in the context of a Swiss-US FTA, the lock-in effect would probably be modest, since neither country is prone to abrupt protectionist or anti-foreign policies that affect the other (US antidumping duties play little or no role in bilateral trade – see Chapter 4).
6
substantial – might increase by as much as 40 percent. Deeper trade and investment links
would erode the power of oligopolies in both economies, spur the exchange of
technology and skilled personnel, and enhance economic efficiency.
C. Is the Timing Wrong?
Perhaps the strongest argument against a Swiss-US FTA is the matter of timing. Why
distract attention from the final push to complete the Doha Development Round? For
both countries, the political and economic payoff from a successful WTO negotiation far
exceeds whatever achievements can be realized on a bilateral basis. As a related point, it
should be added that the US Congressional battle over the Central America-Dominican
Republic Free Trade Agreement (CAFTA-DR) was prolonged and bruising. Admittedly,
CAFTA-DR narrowly won approval from the US House of Representatives on June 28,
2005, by a tight 217 to 215 vote. Nonetheless, in the aftermath of the prolonged CAFTA-
DR polemic, there is a certain amount of “trade fatigue” among business and legislative
proponents of greater liberalization. A case can be made that these stalwarts need time to
“rest up” before they take on the “big battle” -- Congressional ratification of the WTO
Doha Development Round package.7 Similarly, within Switzerland, a free trade
agreement with the United States will inspire a wide-ranging debate over Swiss relations
with the European Union and Switzerland’s historic protection of agriculture. The Swiss-
US FTA may in the end be voted up or down in a popular, and hotly contested,
7 To be sure, US ratification of the CAFTA-DR pact has already freed up US negotiating expertise to focus more attention to the sluggish WTO negotiations. However, the scarcest resource in US trade negotiations is not bureaucratic talent but rather Congressional time and energy.

7
referendum. Again, the argument can be made that this debate should be put off until the
WTO Doha Round has been ratified.
The timing arguments would be persuasive, if the Swiss-US FTA and the WTO Doha
Round were alternatives. But the two agreements are complements, not substitutes. Over
the next year, the central focus of the Swiss-US FTA should be negotiation, not
ratification, either by the US Congress of the Swiss confederation. The ratification
process should either be merged with approval of the Doha package (possibly the best
timing in the United States) or initiated after the Doha package is approved (possibly the
best timing in Switzerland).
Moreover, as a negotiated text, the Swiss-US FTA can liberalize trade in goods and
services to a far greater extent than the Doha Round. At best, within the WTO, modest
progress seems possible on agricultural market access barriers, although cuts may be
agreed in farm subsidies.8 The service negotiations have made so little headway that a
crisis has been declared.9 WTO members are dickering over tariff-cutting formulas to
improve non-agricultural market access (the NAMA group), but the foreseeable outcome
is far from zero tariffs on manufactured goods. By contrast, in all these areas and others
(e.g., government procurement, geographic indications, sanitary and phyto-sanitary
barriers), the Swiss-US FTA should go far beyond what can be achieved in the WTO. In
8 See Hathaway and Josling (2004), “This Far and No Farther? Nudging Agricultural Reform Forward,” Institute for International Economics Policy Brief. 9 The Global Services Coalition, a group of Australian, Chilean, European, NASSCOM, Japan, and US providers, met with WTO officials in Geneva on June 24, 2005, and circulated an alert titled “WTO Services Negotiations in Crisis; Political Will Must be Mobilized Urgently”.
8
fact, the starting point for Swiss-US FTA liberalization should be well ahead of the
ending point for the Doha Round. Seen in this light, the Swiss-US FTA can join the
array of “gold standard” agreements that serve as templates for the next WTO Round,
post-Doha.
D. Will the Agreement Comport with GATT Article 24?
Both the United States and Switzerland have entered into numerous free trade
agreements. Apart from NAFTA, the United States has FTAs with Israel, Jordan, Chile,
Singapore, Australia, Morocco, CAFTA-DR, and Bahrain. Several more are in various
stages of discussion and negotiation (see table 1.1). In the past (apart from its special
agreements with the European Union), Switzerland has negotiated all its FTAs in
conjunction with the EFTA group. EFTA has agreements with Bulgaria, Chile, Croatia,
Israel, Jordan, Lebanon, Macedonia, Mexico, Morocco, the Palestinian Authority,
Romania, Singapore, Tunisia and Turkey – and others are pending.10 From a Swiss
standpoint, the exceptional feature of a Swiss-US FTA, apart from the size of its
prospective American partner, is that the pact would be the first FTA negotiated separate
from EFTA (leaving aside Swiss agreements with the European Union).
None of the US or EFTA free trade pacts have been found in violation of GATT Article
24 – perhaps for the simple reason that Article 24 reviews invariably either say nothing or
10 As a stepping stone towards the negotiation of additional free trade agreements, EFTA also has Joint Declarations whereby parties pledge to examine "concrete ways and means of expanding and liberalising their trade relations" with Albania, Algeria, Egypt, the Gulf Cooperation Council, MERCOSUR, Serbia and Montenegro, and Ukraine.

9
convey only bland misgivings (Schott 2004). Indeed, only one review group (for the
Czech-Slovak pact) reached an affirmative consensus (Sutherland 2004).11 Nevertheless,
it is fair to say that US FTAs generally come close to the Article 24 ideal – eliminating
barriers on substantially all the merchandise trade of the partners. Their major
shortcoming is the near exclusion of agriculture (as in the Canada-US FTA signed in
1989), or very long phase-outs for the sensitive agricultural products (a conspicuous fault
of the US-Australia FTA, at US insistence). The free trade pacts negotiated by the EFTA
group fall somewhat shorter of the Article 24 ideal, in that they achieve only a very
limited degree of liberalization in agriculture. Set against their agricultural shortcomings,
the FTAs agreed both by the United States and EFTA liberalize services and investment,
areas that the GATT barely touches.
If Switzerland and the United States reach a free trade agreement, it should come as close
to the Article 24 ideal as any prior agreements of either party. Long phase-outs and
special safeguards will be necessary on both sides for sensitive agricultural products.
Otherwise, the coverage should be comprehensive, and the elimination of barriers should
be rapid.
1.2 Switzerland’s Place in the Queue12
11 An agreement can be fully consistent with Article 24, yet one or both parties may owe compensation to other WTO members for trade diversion. Usually such claims are settled in the context of larger trade negotiation, such as the Tokyo Round or the Uruguay Round. 12 Victoria Courmes authored this section.
10
As mentioned, the United States is engaged in free trade talks with many potential
partners, mostly developing countries, although three of the potential partners belong to
the OECD (Switzerland, New Zealand and South Korea). Given the relatively long list of
potential FTA partners, the US Trade Representative, Ambassador Portman, will
inevitably establish priorities. Priorities will depend of a variety of considerations,
among them political alliances, prospective economic payoff, speed and ease of
negotiation, quality of results. Most of these considerations can not be quantified, but
available data does shed light on the strength of trade and investment ties between the
United States and its prospective partners, the height of protective barriers, and the
degree of social similarity, measured by corruption, economic freedom, and labor and
environmental standards.
Before turning to quantitative comparisons, we must emphasize an important aspect of
post-September 11th FTA diplomacy. The Bush Administration places a very high
priority on economic diplomacy that buttresses US national interests in Muslim countries
generally and the Middle and Near East specifically. The Administration believes that
growing market-oriented economies, run on democratic principles, are far less likely to
breed terrorists and far more likely to contribute to world peace and prosperity. That
vision stands at the apex of policy, and accordingly the Administration favors new free
trade agreements with countries in the Middle and Near East. Morocco was first on the
list and Bahrain is second. Egypt, Pakistan and Indonesia are all prospects. Among this
cluster of countries, FTAs are valued by the United States for the role they can play in
promoting broad economic reform. Obviously, on a national security scale, Switzerland
11
ranks near the bottom of the FTA queue, both because Switzerland already ranks among
the safest and most stable countries in the world, and because Switzerland’s diplomacy is
founded on the principle of neutrality between the great powers.
That said, we turn to an array of quantitative and qualitative indicators that enable a
comparison of Switzerland and other present and prospective US FTA partners.
Quantitative indicators consist of inward and outward foreign direct investment (FDI)
stocks, two-way US merchandise trade, two-way US services trade, and the average
MFN tariff rates for agricultural and non-agricultural products. Qualitative indicators
include a corruption index, two economic freedom indexes, and indexes for labor and
environmental standards.
Based on these indicators, tables 1.1 through 1.7 compare Switzerland to current and
potential US FTA partners. The current FTA partners include Israel (1986), Canada
(1989), Mexico (1993), Jordan (2001), Chile (2003), Singapore (2004), Australia (2004)
and Morocco (2004). Prospective US FTA partners are divided into three different
groups:
• Partners for whom an FTA has been negotiated but not yet ratified: Bahrain,
Dominican Republic, and CAFTA (the CAFTA-DR pact still awaits ratification in
Costa Rica, Nicaragua, and the Dominican Republic).
• Partners in the process of negotiation: Colombia, Ecuador Panama, Peru,
Thailand, and SACU countries.
12
• Partners under consideration: Switzerland, Qatar, Oman, Egypt, United Arab
Emirates, Taiwan, South Korea, Malaysia, Indonesia, Philippines, New Zealand,
Bolivia, CARICOM, Pakistan and Bangladesh.
A. Quantitative Indicators
Table 1.1 shows that Switzerland’s two-way FDI stocks with the United States exceed the
FDI stocks of other countries seeking FTAs with the United States. The logic for this
indicator is that, when two countries have an important base of two-way FDI stocks, the
prospect of an FTA will enlist considerable enthusiasm in the business community.
Moreover, once an FTA is concluded, firms will take a more favorable view towards
expanding their stakes in the partner country, creating a follow-on push for trade.
As one would expect, the two NAFTA partners, Canada and Mexico, rank high in terms
of two-way FDI stocks. However, with a two-way FDI stock of $199 billion, Switzerland
ranks second, only behind Canada ($298 billion) and well ahead of Mexico ($68 billion).
Table 1.1 also shows that outward FDI from the United States to its NAFTA partners
accounts for most of the total two-way FDI stocks. By comparison, Switzerland is a net
exporter of FDI to the United States. In fact, along with Bahrain, Switzerland is the only
country in the list to invest more in the United States than vice versa. The high ranking
of Switzerland suggests both business support for an FTA, and the prospect of substantial
additional investment, in both directions, if an FTA is concluded.
Table 1.2 presents US two-way merchandise trade with its current and potential FTA
partners. The logic for this indicator follows the logic of two-way FDI stocks. When two

13
countries have an important base of merchandise trade, not only do firms have a tangible
reason to support the FTA but also the prospects are excellent for a substantial dollar
increase in bilateral trade. Switzerland ranks 11th among current and prospective US
partners with a two-way merchandise trade of $21 billion. This figure is obviously far
behind NAFTA partners (Mexico and Canada, totaling $356 billion of two-way trade
with the United States), but it is only moderately behind CAFTA, Israel, Australia, and
most East Asian countries (Singapore, Malaysia, Taiwan, Thailand, and South Korea).
Moreover, Switzerland’s two-way trade with the United States easily exceeds the two-
way trade of three current partners (Chile, Jordan, Morocco) and twenty potential
partners (situated in South America, the Middle East, and South Africa). Based on its
merchandise trade with the United States, Switzerland occupies a solid upper-middle
position relative to other current and prospective partners.
Table 1.3 presents US two-way trade in services with its current and potential FTA
partners. The logic of this indicator parallels the previous two. While data on services
trade often does not exist for many countries, and is missing for several current and
prospective FTA partners, certain conclusion can be drawn from the available figures.
Based on available data, Switzerland ranks third in two-way trade in services, just behind
Canada and Mexico, and ahead of other current and prospective FTA partners. The high
ranking of Switzerland reflects substantial flows of interest, dividends and royalties, as
well as business services in both directions. In fact, two-way trade in services, around
$16 billion annually, is almost as large as two-way trade in manufactured goods, around
$17 billion annually.
14
Table 1.4 presents recent most favored nations (MFN) tariff rates for current and
prospective FTA partners. The MFN figures are applied rates averages, respectively, for
agricultural and non-agricultural products. The main rational for this indicator is that it
suggests whether commercial negotiations will be more or less difficult. An FTA, by
definition, aims at eliminating tariffs and quotas, and this goal will be easier if the partner
country already has low applied MFN tariff rates.
On this indicator, Switzerland’s position is sharply split. Switzerland has one of the
lowest MFN average rates for non-agricultural products. At an MFN rate of 2.3%,
Switzerland ranks second, just behind Singapore. However, Switzerland has one of the
highest applied average MFN rates for agricultural products. On this indicator,
Switzerland ranks 29 out of 31 current and prospective partners. Switzerland’s wall of
agricultural protection implies, on that count, difficult FTA negotiations. Looking on the
bright side, the fact of high agricultural tariffs and restrictive quotas means that the
potential benefit to both countries of an FTA are substantial (as discussed in Chapter 2).
By the same token, freer trade between the United States and Switzerland could divert
Swiss agricultural purchases from the European Union, which already enjoys significant
preferences in the Swiss market. The possibility of “preference erosion” is discussed
more fully in Chapters 8 and 9.
The United States has concluded FTAs with countries that had both high and low applied
MFN tariffs. Canada, Singapore, Australia, and Chile, had relatively low applied MFN
15
tariff rates both on agricultural and non-agricultural products.13 By contrast, Mexico,
Jordan, Morocco, and Israel have much higher MFN rates. From this spectrum, one might
conclude that the United States is indifferent to the level of MFN barriers when it selects
FTA partners. But that conclusion ignores the fact that US FTAs with Middle Eastern
countries were primarily motivated by geopolitical alliances. A Swiss-US FTA needs to
be inspired by economic as much as geopolitical forces.
B. Qualitative Indicators
Table 1.5 presents a comparative perspective of the degree of corruption among current
and prospective FTA partners. The logic of this indicator is two-fold. First, less
corruption probably means less political influence of vested interests that can be used to
preserve the economic rents that are generated by trade and investment barriers. Second,
less corruption means a more desirable environment for expanding trade and investment
relations.
Switzerland ranks third best on the corruption index scale, just behind New Zealand and
Singapore. Apart from Morocco, Mexico, and Jordan, the current US FTA partners have
low levels of corruption. By contrast, several of the prospective partners have somewhat
higher levels. Other things being equal, the United States prefers FTA partners that score
well in terms of honest government.
13 While the figures in table 1.4 refer to the situation in 2004, at the time the FTAs were negotiated, all these partners had comparatively low average MFN tariffs.

16
Table 1.5 also presents two different indexes of economic freedom (Heritage Foundation
and the Fraser Institute). These indexes cover trade policy, fiscal burdens, government
intervention in the economy, monetary policies, capital flows and FDI, wages and prices,
banking and finance, property rights, and overt and informal market regulation. The
indexes suggest that Switzerland and New Zealand offer the most attractive business
environments compared to other current and prospective partners. Switzerland’s honest
governance and moderate regulatory environment give the country a very favorable
position in the US FTA queue.
Table 1.6 presents the Environmental Sustainability Index (ESI) for all current and
prospective partners. The Environment Sustainability Index reflects water and air
pollution, protected areas, and environmental regulations and enforcement. Switzerland
ranks second (behind Canada and ahead of Australia) and seems to hold an advantageous
position compared with other prospective partners. Also, Switzerland’s environmental
standards exceed those of the United States.14 Hence, it is unlikely that a trade agreement
between the United States and Switzerland would run into environmental objections in
the US Congress. Switzerland clearly will not face the onerous criticism that Central
American countries faced over CAFTA.
Table 1.7 gives a comparison of labor standards for current and prospective partners. A
labor standard index is constructed based on five different indicators: the right of
association (i.e. the right to form unions), bargain and strike; forced labor; child labor;
14 With an ESI score of 52.9, the US would rank 10th in the ESI ranking of table 6.

17
working conditions; and the number of international labor treaties that have been ratified.
The labor index for each country reflects whether labor standards are high, medium/high,
medium, medium/low, or low for each of these five categories.15 The labor index shows
that Switzerland’s labor standards surpass those of all current and potential US FTA
partners. Standards are high for each of the five indicators and are aligned with US labor
standards. Clearly, labor standards would not be a negative dimension of a US-Swiss
FTA and might instead be a positive feature.
1.3 Plan of the Report
Two-way trade in agricultural goods and foodstuffs represents only 2 percent of
merchandise trade between Switzerland and the United States. Yet two chapters of the
report are devoted to agriculture and related subjects, sanitary and phyto-sanitary
standards (SPS) and geographic indications (GI). The reason is that the attention in the
report is roughly scaled to the magnitude of barriers, rather than the volume of trade.
Agriculture and foodstuffs are extremely highly protected in Switzerland, and highly
protected in the United States. Chapter 2 depicts the barriers and outlines
recommendations for their gradual phase-out in the context of a bilateral FTA. Chapter 3
addresses SPS and GI issues, both centered on agriculture and foodstuffs, and again
offers recommendations for avoiding unintended SPS barriers and improving the
protection of intellectual property inherent in GI rights. The recommendations in both
Chapters 2 and 3 are strongly influenced by US and Swiss approaches in prior FTAs and
other bilateral agreements.
15 For a review of the detailed methodology for constructing labor indicators see Appendix A.
18
Chapter 4 turns to commerce in manufactured goods. By far, manufactures are the
dominant component of bilateral merchandise trade, amounting to about $17 billion
annually. Fortunately, most of this commerce is free of tariff or non-tariff barriers.16 The
Swiss MFN rate on manufactured imports is only 2.3 percent, and the US MFN rate is
only 4.2 percent. Nestled within these low averages, however, are fairly high rates on
specific tariff lines. These products attract most of our attention, and the chapter
concludes with recommendations for eliminating low tariffs immediately and phasing-out
high tariffs over a short period
Chapter 5 takes up services. Two-way trade in private services, amounting to about $16
billion annually, puts this sector on par with manufactured goods. Tariffs and quotas
usually do not obstruct two-way trade in services. Instead the most important barriers are
behind the border, such as licensing requirements and public and private monopolies.
Chapter 5 concentrates on four service sectors, financial services, network industries
(such as electricity and telecommunications), audiovisual services, and professional
services. After reviewing US and Swiss barriers, and solutions devised in prior FTAs,
Chapter 5 offers recommendations for the Swiss-US FTA.
Chapter 6 reviews government procurement, an area that has proven highly resistant to
liberalization in the WTO, and an area that evokes political sensitivities both in the states
16 The most important non-tariff barriers involve different technical standards and different systems for ensuring that products conform to the announced standards. Chapter 4 offers recommendations for more closely aligning US and Swiss systems.
19
and the cantons. The United States and Switzerland have opened up their markets on
reciprocal basis for selected entities and that concluded a 1996 bilateral agreement that
was later incorporated in the GPA. Both countries have extended concessions to other
GPA partners, and to partners in their respective free trade agreements. Chapter 6
recommends that Switzerland and the United States extend each other the best
government procurement terms offered to any other country, either through the GPA or in
bilateral FTAs (an unconditional MFN approach).
Direct and portfolio investment links between Switzerland and the United States are
substantial, as shown in Chapter 7. Among current and prospective FTA partners, Swiss-
US links are second only to US investment links with Canada. Bilateral investment
frictions are scarce, but still an FTA could eliminate minor barriers and provide a
framework for resolving future disputes. The recommendations offered in Chapter 7 are
intended to expand already robust bilateral investment ties. Moreover, rough calculations
suggest that, additional investment could boost two-way trade in manufactured goods,
perhaps by a quarter. As well, additional investment would foster the movement of
skilled personnel, synergies in science and technology, and the creation of intellectual
property embodied in patents, copyrights, and trademarks.
Chapter 8 summarizes estimates based on computable general equilibrium (CGE) and
gravity models. The models attempt to forecast the effect of a bilateral FTA on the
volume of trade created between Switzerland and the United States, the volume of trade
diverted from third countries, and economic gains in the two partners. The calculations

20
suggest that additional two-way trade in agricultural and manufactured goods would
certainly be substantial, perhaps doubling the level that would otherwise be reached.17
Economic gains would be significant, especially for Switzerland.
Chapter 9 explores the consequences of a Swiss-US FTA for Switzerland’s relations with
the European Union. Geographically, Switzerland sits in the center of the European
Union; economically the preponderance of Switzerland’s commerce is with Europe. In
fact, Switzerland has more than 100 commercial treaties with the European Union
(Hewitt Associates, 2002). Accordingly, Switzerland must anticipate the effects of a
Swiss-US FTA on its relations with the European Union. The Swiss-EU Bilateral
Agricultural Agreement contains an “Evolutionary clause” that commits the two parties
to regularly review their agricultural trade.18 While this is far from an unconditional
MFN clause, Switzerland’s geographic, political and economic circumstances ensure that
commercial concessions granted to the United States will be carefully examined by the
European Union. However, Chapter 9 concludes that a Swiss-US FTA will at most
inflict a degree of “preference dilation” on the European Union, and might come to be
regarded by Brussels as a benign “reverse hub-and-spoke arrangement”. Ideally, the
European Union will show the same tolerance for a Swiss-US FTA as the United States
has shown for the Mexican-EU FTA.
17 Analysis done by Adams et al. (2003) at the Australian Productivity Commission (APC), using a variant of the gravity model, comes to strikingly different conclusions. The authors claim to find very little trade creation between FTA partners, and net trade diversion for 12 of 16 recent FTAs that they analyzed. For reasons explained in Chapter 8, we do not subscribe to their analysis. 18 The bilateral agreement is formally known as The Agreement between the European Community and the Swiss Confederation on Trade in Agricultural Products, signed in 1999. Article 13 is the Evolutionary clause.

Table 1.1 Foreign Direct Investment Stocks (2003)a
($ millions)
PARTNERS Rankc from US to US two-way FDINAFTAMexico 3 61,526 6,680 68,206Canada 1 192,400 105,255 297,655Other Current PartnersChile 12 9,986 63 10,049Jordan 32 47 -17 30Morocco 30 309 -23 286Singapore 5 57,589 -162 57,427Israel 13 6,208 3,834 10,042Australia 4 40,985 24,652 65,637
To be RatifiedBahrain 26 196 288 484Dominican Republic 25 860 18 878CAFTA 18 3,435 -29 3,406
Under NegotiationColombia 20 2,751 -150 2,601Ecuador 22 1,446 34 1,480Oman 29 358 -1 357Perub 21 2,659 -137 2,522Panama 9 6,497 8,383 14,880Thailand 15 7,393 182 7,575SACU-5 26 795 75 870UAE 23 1430 39 1,469
Under ConsiderationEuropeSwitzerland 2 86,435 112,856 199,291Middle EastQatar 19 3,113 33 3,146Egypt 7 18,960 -38 18,922East Asia and PacificTaiwan 10 10,961 2,708 13,669South Korea 8 13,318 2,337 15,655Malaysia 14 7,580 208 7,788Indonesia 11 10,387 27 10,414Philipines 16 4,700 33 4,733New Zealand 17 3,849 607 4,456Latin AmericaBolivia 28 375 -5 370CARICOM 6 16,972 9,968 26,940South AsiaPakistan 24 1,074 31 1,105Bangladesh 31 169 4 173

Notes and Sources for Table 1.1
Notes:a. FDI stock computed as direct investment position on a historical-cost basis. b. Data for 2001c. Based on two-way FDI
Sources: US Bureau of Economic Analysis (2004a).

Table 1.2 US Merchandise Trade (2003)($ millions)
PARTNERS Ranka two-way trade US Exports US ImportsNAFTAMexico 2 266,618 110,775 155,843Canada 1 445,028 189,101 255,927Others Current PartnersChile 18 8,358 3,625 4,733Jordan 27 1,645 552 1,093Morocco 28 1,038 523 515Singapore 6 34,905 19,600 15,305Israel 9 23,725 9,198 14,527Australia 10 21,814 14,270 7,544
To be RatifiedBahrain 31 706 301 405Dominican Republic 17 8,871 4,343 4,528CAFTA 7 33,430 15,730 17,700
Under NegotiationColombia 15 11,794 4,504 7,290Ecuador 19 5,951 1,666 4,285Oman 30 748 330 418Peru 20 5,795 2,095 3,700Panama 26 2,136 1,820 316Thailand 8 23,940 6,363 17,577SACU-5 16 10,237 3,317 6,920UAE 21 5,205 4,064 1,142
Under ConsiderationEuropeSwitzerland 11 20,911 9,268 11,643Middle EastQatar 29 842 455 387Egypt 24 4,435 3,105 1,330East Asia and PacificTaiwan 4 56,348 21,731 34,617South Korea 3 72,496 26,333 46,163Malaysia 5 39,082 10,897 28,185Indonesia 13 13,480 2,669 10,811Philipines 12 16,216 7,072 9,144New Zealand 22 5,043 2,076 2,967Latin AmericaBolivia 32 454 194 261CARICOM 14 13,407 5,744 7,663South AsiaPakistan 23 4,685 1,811 2,874Bangladesh 25 2,592 289 2,302

Notes and Sources for Table 1.2
Note:a. Ranking based on two-way trade
Source: US Department of Commerce, TradeStats Express, retrieved from the wide web site, http://tse.export.gov/
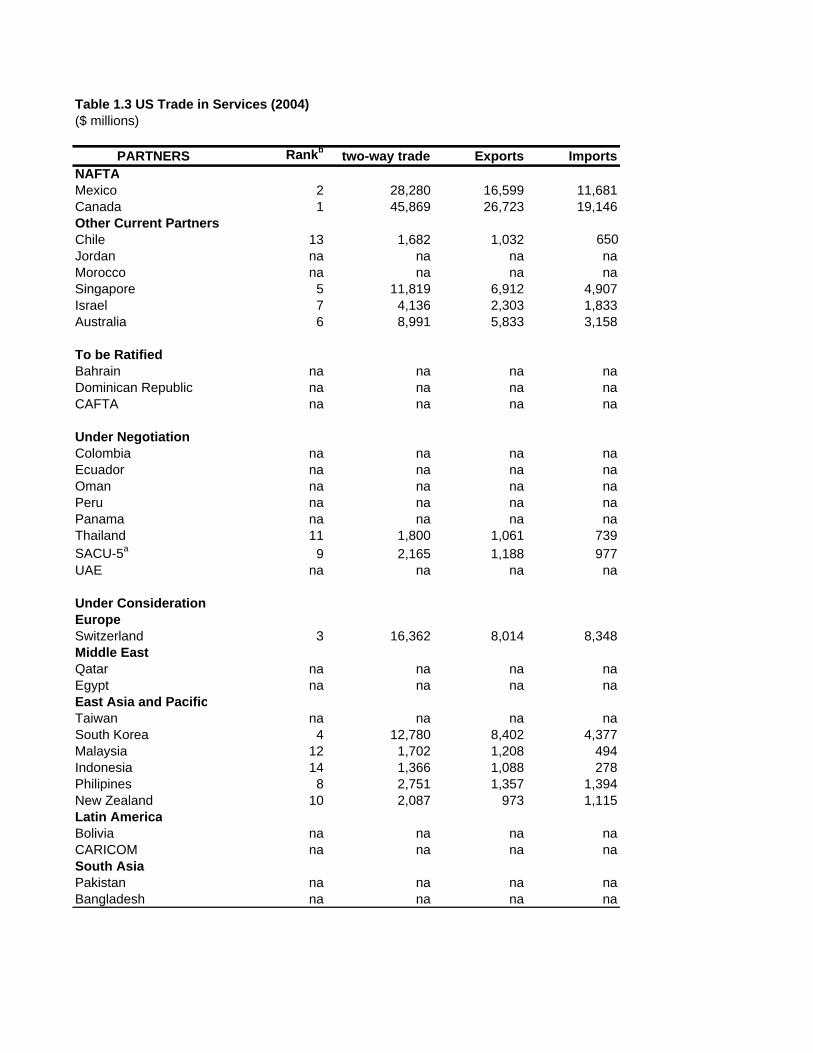
Table 1.3 US Trade in Services (2004)($ millions)
PARTNERS Rankb two-way trade Exports ImportsNAFTAMexico 2 28,280 16,599 11,681Canada 1 45,869 26,723 19,146Other Current PartnersChile 13 1,682 1,032 650Jordan na na na naMorocco na na na naSingapore 5 11,819 6,912 4,907Israel 7 4,136 2,303 1,833Australia 6 8,991 5,833 3,158
To be RatifiedBahrain na na na naDominican Republic na na na naCAFTA na na na na
Under NegotiationColombia na na na naEcuador na na na naOman na na na naPeru na na na naPanama na na na naThailand 11 1,800 1,061 739SACU-5a 9 2,165 1,188 977UAE na na na na
Under ConsiderationEuropeSwitzerland 3 16,362 8,014 8,348Middle EastQatar na na na naEgypt na na na naEast Asia and PacificTaiwan na na na naSouth Korea 4 12,780 8,402 4,377Malaysia 12 1,702 1,208 494Indonesia 14 1,366 1,088 278Philipines 8 2,751 1,357 1,394New Zealand 10 2,087 973 1,115Latin AmericaBolivia na na na naCARICOM na na na naSouth AsiaPakistan na na na naBangladesh na na na na

Notes and Sources for Table 1.3
Notes:a. Using data for South Africab. Based on two way trade; rank positions exclude countries for which information is not available (na)
Source: Bureau of Economic Analysis

Table 1.4 Average MFN Tariff Rates (2003-2004) (simple average ad valorem rates)
PARTNERS Agricultural Non AgriculturalBound Applied Ranke Bound Applied Rank
NAFTAMexico 35.1 24.5 27 34.9 17.1 28Canada 3.5 3.1 5 5.3 4.2 6Other Current PartnersChile 26.0 6.0 7 25.0 5.9 13Jordan 23.7 19.8 23 19.8 12.1 24Morocco 54.5 48.6 30 39.2 27.5 31Singapore 9.5 0.0 1 6.3 0.0 1Israel 73.0 15.9 19 9.2 4.0 4Australia 3.2 1.1 2 11.0 4.6 8
To be RatifiedBahrain 37.5 9.0 10 35.1 7.6 17Dominican Republic 39.6 13.0 16 34.2 7.8 18CAFTAa 42.3 10.5 14 38.2 5.7 11
Under NegotiationColombia 91.9 14.9 15 35.4 11.9 23Ecuador 25.5 14.7 17 21.1 11.5 22Omand 28.0 10.2 13 11.6 5.0 9Peru 30.8 17.2 21 30.0 13.1 25Panama 27.7 14.8 18 22.9 7.4 16Thailand 35.5 29.0 28 24.2 14.2 26SACU-5b 39.2 9.1 11 15.8 5.3 10UAE 25.4 na 13.1 na na
Under ConsiderationEuropeSwitzerlandc na 36.2 29 na 2.3 2Middle EastQatar 25.7 4.9 6 14.5 4.1 5Egypt 95.3 22.8 26 28.3 19.4 30East Asia and PacificTaiwan 15.3 16.3 20 4.8 5.5 12South Korea 52.9 52.1 31 10.2 7.0 15Malaysia 12.2 2.1 4 14.9 8.1 19Indonesia 47.0 8.2 9 35.6 6.7 14Philipines 34.7 8.0 8 61.8 4.3 7New Zealand 5.7 1.7 3 11.0 3.5 3Latin AmericaBolivia 40.0 10.0 12 40.0 9.3 20CARICOMe 98.0 18.4 22 51.2 11.1 21South AsiaPakistan 97.1 20.4 24 35.3 16.6 27Bangladesh 188.5 21.7 25 35.7 19.2 29
US Comparison 6.9 5.1 7 3.2 3.7 4

Notes and Sources for Table 1.4
Notes:a. Simple average of observations for Costa Rica, El Salvador, Guatemala, Honduras, and Nicaragua.b. Using South Africa Average Bound Tariff. Tariff binding figures are based on simple averages of national averages reported by the WTO and exclude Lesotho.c. Using ad valorem equivalent (AVE). Switzerland has a 99.8 percent binding coverage, but bindings are in the form of specific tariffs.d. Data for 2001e. Simple averages of observations reported by the WTO for each CARICOM member.f. Ranks based on applied rates, ranks run from high to low
Source: WTO 2004 World Report and WTO Trade Profiles.

Table 1.5 Corruption and Economic Freedom(index values)
PARTNERS Corruptiona Corruption Freedomb Freedomc Average2004 Rank Heritage, 2005 WEF, 2005 Rank
NAFTAMexico 3.6 20 2.9 3.9 17Canada 8.5 5 1.9 5.1 6Other Current PartnerChile 7.4 6 1.8 4.9 7Jordan 5.3 12 2.8 4.3 14Morocco 3.2 23 3.2 3.5 23Singapore 9.3 2 1.6 5.5 1Israel 6.4 7 2.4 4.8 11Australia 8.8 4 1.8 5.2 5
To be RatifiedBahrain 5.8 10 2.1 4.5 9Dominican Republic 2.9 26 3.5 3.1 26CAFTA 3.2 23 na na na
Under NegotiationsColombia 3.8 19 3.2 3.8 20Ecuador 2.4 28 3.5 3.0 28Oman 6.1 8 2.8 na naPeru 3.5 22 2.8 3.7 19Panama 3.7 18 2.7 3.6 18Thailand 3.6 20 3.0 4.5 16SACU-5d 4.9 15 2.8 4.3 15UAE 6.1 8 2.7 5.0 12
Under ConsiderationEuropeSwitzerland 9.1 3 1.9 5.5 3East Asia and PacificTaiwan 5.6 11 2.3 5.6 8South Korea 4.5 16 2.6 5.1 10Malaysia 5.0 14 3.0 4.9 13Indonesia 2.0 31 3.5 3.5 25Philippines 2.6 27 3.3 3.5 24New Zealand 9.6 1 1.7 5.1 4Middle EastQatar 5.2 13 3.1 na naEgypt 3.2 23 3.4 4.0 22Latin AmericaBolivia 2.2 29 2.7 3.1 21CARICOM 4.0 17 na na naSouth AsiaPakistan 2.1 30 3.7 3.3 27Bangladesh 1.5 32 4.0 2.9 29
US Comparison 7.5 6 1.9 5.8 2

Notes and Sources for Table 1.5
Notes:a. countries with high score are the most transparentb. Low score = economically freec. High score = economically freed. Using data for South Africa
Sources : Transparency International Corruption Perceptions Index 2005, The Heritage Foundation 2005 Index for Economic Freedom, World Economic Forum (2005 Growth Competitiveness Index)

Table 1.6 Environmental Standards
PARTNERS ESI Rank ESI CO2 Emissions Protected Compliance Treatye
2005 Indexa Damageb Areasc Envir.d
NAFTAMexico 19 46.2 High Low Medium Med/HighCanada 1 64.4 High Low High HighOther CurrentChile 10 53.6 Medium Medium Med/High HighJordan 18 47.8 Low Medium Med/High MediumMorocco 20 44.8 Medium Low Med/Low HighSingapore 13 50.0 Medium Low High LowIsrael 12 50.9 High Medium Medium MediumAustralia 3 61.0 Medium Medium Medium High
To be RatifiedBahrain N.A N/A Low Low N/A LowDominican Republic 25 43.7 Medium High Med/Low MediumCAFTA 15 49.0 High Medium Low Medium
Under NegotiationColombia 7 58.9 High High Medium Med/HighEcuador 12 52.4 Low High Low Med/HighOman 17 47.9 Medium Medium Med/Low Med/LowPeru 5 60.4 High Medium Low Med/HighPanama 8 57.7 Medium High Med/Low Med/HighSACU-5 11 52.9 Medium Medium Medium Med/LowThailand 14 49.7 Low Medium Medium MediumUAE 21 44.6 Low Low N/A Med/Low
Under ConsiderationEuropeSwitzerland 2 63.7 High High High HighMiddle EastQatar N.A N.A Low Low N/A LowEgypt 24 44.0 Low Medium Medium HighEast Asia and PacificTaiwan 29 32.7 Medium Low Med/High LowSouth Korea 26 43.0 Medium Low Med/High Med/HighMalaysia 9 54.0 Low High Med/High MediumIndonesia 16 48.8 Medium Low Med/Low MediumPhilippines 22 44.3 Medium Low Low Med/HighNew Zealand 4 60.9 High Medium High Med/HighLatin AmericaBolivia 6 59.5 Low Medium Low MediumCARICOM 27 41.0 Medium low Medium MediumSouth AsiaBangladesh 23 44.1 High Low Low Med/LowPakistan 28 39.9 Low Low Low Medium
US Comparison 11 52.9 High High Medium High

Notes and Sources for Table 1.6
Notes: a. Environmental Sustainability Index (ESI): countries with high scores have high enviromental standardsb. high = C02 Damage < 0.5%, Low = CO2 damage > 1%, Medium = CO2 damage > 0.5% and < 1%c. Ratio of protected area to total area: high = ratio > 0.2, low = ratio < 0.1, medium = ratio > 0.1 and < 0.2d. High = Compliance score > 5.8, Medium/High = Compliance < 5.8 and > 4.6, medium = Compliance < 4.6 and > 4.0, Medium/Low = Compliance > 3.6 and < 4.0, low = Compliance < 3.6e. High = more than 120 treaties, Low = less than 50, Medium/low = between 50 and 60, Medium = 60 to 80, Medium/High = between 80 and 120
Sources: Environment Sustainability Index (ESI), 2004 Global Competitiveness Report for Compliance with Environmental Agreements, Word Bank Development Indicators for Carbon Dioxide Emissions Damage, UN Environmental Statistics for Protected Areas, Globalis Human Impact 2002, Environmental Treaties and Resource Indicators (ENTRI) for Treaties Participation.

Table 1.7 Labor Standardsa
PARTNERS Rank Indexb Right of Forced Child Working Conventions(ca. 2004) Association Labor Labor Conditions Ratifiedc
NAFTAMexico 8 2.40 High Medium Medium Medium HighCanada 4 1.60 High Med/High High High MediumCurrent PartnersChile 4 1.60 Med/High High Med/High Med/High HighJordan 13 3.00 Medium Medium Med/High Med/Low MediumMorocco 19 3.40 Med/Low Medium Medium Low Med/HighSingapore 7 2.20 Medium High Med/High Med/High MediumIsrael 6 2.00 Medium High High Medium Med/HighAustralia 2 1.20 High High High Med/High High
To be RatifiedBahrain 19 3.40 Medium Medium Medium Medium LowDominican Republic 24 4.00 Med/Low Medium Low Low MediumCAFTA 8 2.40 Medium Med/High Med/High Medium Med/High
Under NegotiationColombia 13 3.00 Med/Low Med/High Med/Low Med/Low HighEcuador 16 3.20 Med/Low Medium Med/Low Med/Low HighOman 22 3.80 Medium Medium High Medium LowPeru 13 3.00 Medium Medium Med/Low Med/Low HighPanama 12 2.80 Medium Medium Med/Low Medium HighSACU-5 27 4.20 Low Medium Low Low MediumThailand 30 4.60 Med/Low Low Low Med/Low LowUAE 22 3.80 Medium Medium Med/High Medium Low
Under ConsiderationEuropeSwitzerland 1 1.00 High High High High HighMiddle EastQatar 27 4.20 Low Med/Low Med/High Low LowEgypt 16 3.20 Med/Low Medium Low Medium HighEast Asia and PacificTaiwan 16 3.20 Med/Low Medium Med/High Med/Low MediumSouth Korea 11 2.60 Medium Med/High Med/High Medium MediumMalaysia 19 3.40 Med/Low Med/Low Medium Medium MediumIndonesia 24 4.00 Medium Med/Low Low Medium LowPhilipines 29 4.40 Medium Low Low Med/Low MediumNew Zealand 2 1.20 Med/High high high high HighLatin AmericaBolivia 24 4.00 Med/Low Low Low Med/Low Med/HighCARICOM 8 2.40 Med/High High Med/High Med/High MediumSouth AsiaPakistan 30 4.60 Med/Low Low Low Low MediumBangladesh 30 4.60 Med/Low Low Low Low Medium
US Comparison 5 1.8 High High High High Low

Notes and Sources for Table 1.7
Notes:
(a) Methodology for labor Indicators
1. Collective Bargaining, Right of Association and Labor StrikesLow : Collective bargaining, strikes, and right of association are all prohibited.Medium Low : Some prohibited or government approval needed.Medium : Not prohibited and no requirement to seek authorization prior to forming unions, but labor rights are not really enforced or widespread anti-union discrimination exists.Medium High : Not prohibited and labor rights are enforced most of the time.High: All allowed and labor rights enforced.
2. Forced Labor Low : Pervasive forced labor.Medium/Low : Law prohibits forced labor but certain foreigners and local groups are consistently subject to forced labor.Medium : Forced labor is prohibited but some cases are reported.Medium High : Rare cases of forced labor reportedHigh : No cases of forced labor is reported
3. Child LaborLow : Pervasive (child labor exceeds 8% of the age group).Medium/Low : Prohibited but many cases reported in different sectors of the economy (child labor represents 2% to 8% of the age group)Medium : Prohibited but some cases are reported in the informal sector (Child Labor 0% to 2% of the age group)Medium/High : Prohibited but rare cases of child labor are reported.High : No child labor reported.
4: Working ConditionsLow : low or no negotiations possible with employer, low or no protection, working standards not enforced, substandard living conditions, lack of protections, abuse, and labor law violations.Medium/Low : Labor Laws exist but not well enforced regarding protection, safety and health standards, and working hours.Medium : Working Conditions acceptable, usually with acceptable safety and health standards, and premium for working longer hours.Medium High : Most working conditions are satisfiedHigh : All working conditions are satisfied.
(b) Index based on average of the 5 indicators: High = 1, Medium/High = 2, Medium = 3, Medium/Low = 4, Low = 5 (c) ILO conventions ratified: High = ratified conventions > 50, Medium/High = ratified conventions > 40 and < 50, Medium = ratified conventions >20 and <40, Low = ratified conventions < 20
Sources: Based on WTO and US Department of State (Bureau of Democracy, Human Rights, and Labor) country reports, World Development Indicators, and ILO database

THE SHAPE OF A FREE TRADE AGREEMENT BETWEEN SWITZERLAND AND THE UNITED STATES
Chapter 2
AGRICULTURAL MARKET ACCESS
Agricultural trade is an important issue for both Switzerland and the United States.
Switzerland relies heavily on foreign agricultural production to supply domestic
consumption as well as for agrarian inputs for its world-renowned exports. In 2003, the
value of Swiss agricultural imports surpassed the value of domestic production measured
at consumer prices. On a per capita basis, Switzerland ranks among the biggest importers
of agricultural products. Agricultural and food products are also important to the United
States, and they make up almost 10 percent of US merchandise exports to world markets.
Despite the prospects for specialization, agricultural trade between the United States and
Switzerland remains well below potential. In 2004, the United States and Switzerland
exchanged agricultural goods with a total value below $400 million – only 2 percent of
total trade between the two countries. This figure is low in comparison to the importance
of agricultural trade in US and Swiss relations with other partners (notably the European
Union). It is also less than the volume of agricultural trade between the United States and
Switzerland in the recent past. (table 2.1).
Drilling below the aggregate two-way trade data, Swiss agricultural exports to the United
States expanded sharply in recent years. If current rates are sustained, Swiss agricultural
1
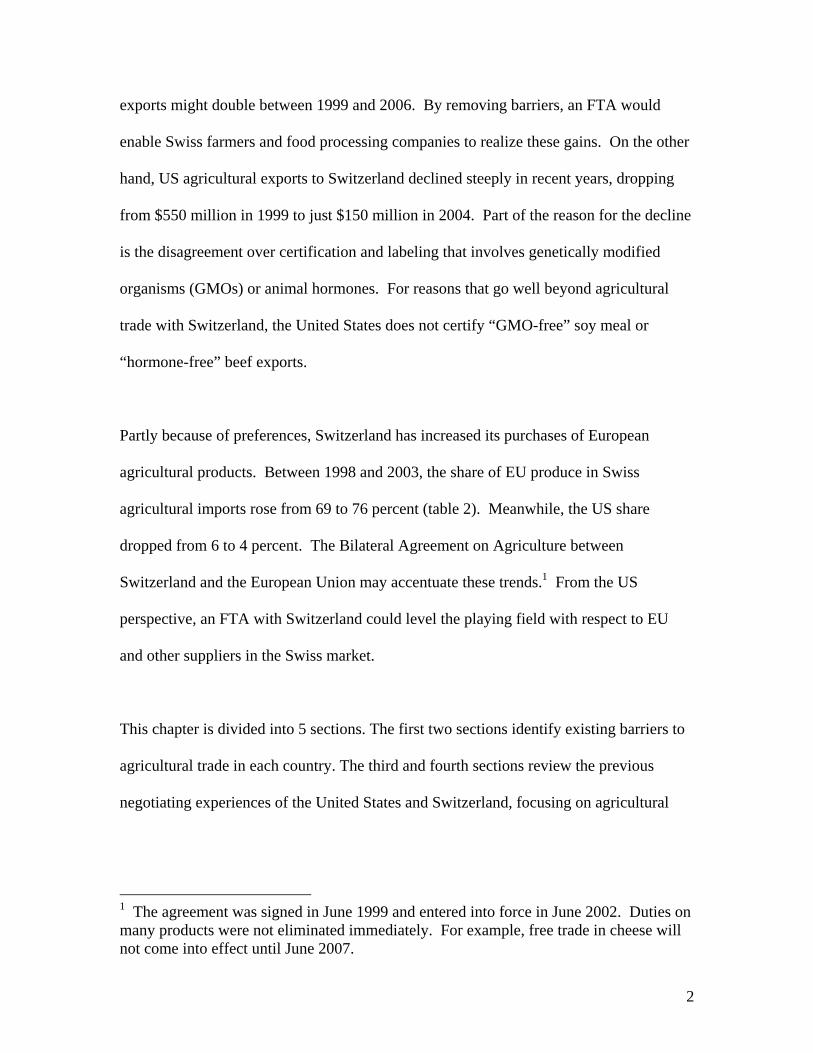
exports might double between 1999 and 2006. By removing barriers, an FTA would
enable Swiss farmers and food processing companies to realize these gains. On the other
hand, US agricultural exports to Switzerland declined steeply in recent years, dropping
from $550 million in 1999 to just $150 million in 2004. Part of the reason for the decline
is the disagreement over certification and labeling that involves genetically modified
organisms (GMOs) or animal hormones. For reasons that go well beyond agricultural
trade with Switzerland, the United States does not certify “GMO-free” soy meal or
“hormone-free” beef exports.
Partly because of preferences, Switzerland has increased its purchases of European
agricultural products. Between 1998 and 2003, the share of EU produce in Swiss
agricultural imports rose from 69 to 76 percent (table 2). Meanwhile, the US share
dropped from 6 to 4 percent. The Bilateral Agreement on Agriculture between
Switzerland and the European Union may accentuate these trends.1 From the US
perspective, an FTA with Switzerland could level the playing field with respect to EU
and other suppliers in the Swiss market.
This chapter is divided into 5 sections. The first two sections identify existing barriers to
agricultural trade in each country. The third and fourth sections review the previous
negotiating experiences of the United States and Switzerland, focusing on agricultural
1 The agreement was signed in June 1999 and entered into force in June 2002. Duties on many products were not eliminated immediately. For example, free trade in cheese will not come into effect until June 2007.
2

market access. Finally, the fifth section recommends possible elements in a free trade
agreement.
2.1 United States: Barriers to Agricultural Trade
The United States ranks among the world’s largest producers, exporters, and importers of
agricultural products; correspondingly, US agricultural policy reflects a variety of
objectives and interests. While the United States is a very open economy, certain
agricultural sectors enjoy exceptional levels of protection. Tobacco, peanuts, dairy
products, sugar-based products, and chocolates are well known examples of US products
that are shielded by high tariffs, tariff-rate quotas (TRQs), or both. Agricultural
protection is also conferred through other instruments, such as antidumping measures and
safeguards, as in the case of fruit juices and certain vegetables. In addition, foreign
reports indicate that US sanitary and phyto-sanitary measures are sometimes
implemented in pursuit of protectionist objectives (these are explored in chapter 3). Over
the last decade, US bilateral FTAs have liberalized some of the protected sectors,
especially now that the longer transition periods are beginning to expire.
A. Tariffs & Tariff-Rate Quotas
Tariffs
According to the WTO Trade Policy Review of the United States, in 2002, the simple
average applied MFN tariff, including ad valorem equivalents, was 5.2 percent on all
3

merchandise and 9.8 percent on agricultural products.2 Tables 2.3 and 2.4 summarize
tariffs and identify the highest tariff peaks in the US agricultural profile. The agricultural
figure is strongly affected by extraordinarily high tariffs on tobacco products (350
percent), peanuts (147 percent) and certain fruits and nuts (53 percent), and high tariffs
on dried and fresh vegetables (27 and 20 percent respectively), beef (26 percent), most
dairy products (18 percent), and aerated mineral waters (17 percent). Sugar ranks among
the highest ad valorem equivalent tariffs, with a rate above 100 percent, but the
underlying sources for tables 2.3 and 2.4 did not capture the effect of highly restrictive
US import quotas on sugar. About 12 percent of all merchandise tariffs are non ad
valorem – for the most part specific or compound duties. Many of these apply to
agricultural imports, such as dairy products, fruits and vegetables and meats (table 2.3).3
Average US agricultural tariffs in unilateral preference schemes and bilateral FTAs are
lower than MFN rates. For example, in 2002, average US applied agricultural tariffs, by
the WTO definition, were 9.8 percent for MFN, 8.4 percent for GSP, 6.2 percent LDCs,
4.4 percent for Israel and Canada, and 2.7 percent for Mexico (table 2.6).
With the exception of bilateral trade with Mexico and Chile, US bilateral FTAs do not
promise full elimination of agricultural barriers. Under the US-Canada FTA, certain
agricultural products remain indefinitely subject to reduced tariff rates. Likewise, in the
US-Israel FTA, reduced tariffs remain on about 220 lines for dairy products and peanuts.
2 The figure for agriculture is based on the WTO definition of that category. The analogous figure using the ISIC definition is lower, 5.6 percent. 3 The United States publishes ad valorem equivalents at http://reportweb.usitc.gov/tariff/tariff_form.jsp.
4

Under the US-Jordan FTA, new tariff-rate quotas were created to provide additional US
market access for certain Jordanian agricultural exports.4
Many of the top agricultural exports of Switzerland to the United States face
comparatively high tariffs. Chocolates, cheeses and certain food preparations are subject
to tariffs ranging between 5 and 10 percent (table 2.7). Moreover, US tariffs or tariff-rate
quotas may play a role in the negligible size of Swiss exports to the United States for 7 of
Switzerland’s top 10 exports to the world (the 7 items are listed in table 2.8). US tariffs
are particularly high for concentrates of coffee (9.4 percent) and tobacco (11.4),5 and the
combination of high tariffs (8 percent) and quotas may impede Swiss exports of certain
chocolate products (HTS 1806.32 and 1806.90).
Tariff-Rate Quotas (TRQ)
The United States applies two distinct tariff-rate quota (TRQ) regimes, namely the US
Section 22 TRQ regime and the preferential TRQ regime. The US Section 22 TRQ
regime applies to all US trade partners, unless a special quota has been negotiated on a
bilateral basis (or applied in a unilateral preference scheme). The preferential TRQ
regime applies to FTA partners or countries benefiting from unilateral preferences
(notably in the Caribbean and Africa). These two TRQ regimes may be applied
concurrently on a product originating in a single country, as proposed, for example, in the
4 Exceptions are discussed in more detail in the section on phase-outs in US bilateral FTAs. 5 Note that tariffs and quotas for HTS 2402 are significantly lower than for other tobacco products (e.g. HTS 2401 and 2403) where they sometimes reach 150 percent.
5

case of beef imports from CAFTA countries.6 We first explain the Section 22 TRQ
system and then the preferential system.
The highest US ad valorem equivalent (AVE) tariffs on agricultural imports are generally
US Section 22 TRQs and usually take the form of specific rates (table 2.5). Certain out-
of-quota tariffs are prohibitive, such as those in tobacco (350 percent), peanuts (135
percent), and butter oil/substitutes (98 percent). High out-of-quota rates, ranging from 50
to 60 percent, apply to dairy products, cotton waste, cane or beet sugars or syrups, and
infant formulas. According to a Congressional Budget Office (CBO) report (2005),
TRQs affect just less than 200 tariff lines, but the simple average for out-of quota duties
on these lines stands at nearly 50 percent. However, since over-quota imports are found
in more than 70 percent of products subject to TRQs, the United States argues that the
TRQ system does not generally act as a quantitative restriction. We do not find this
argument convincing.
In-quota imports are typically subject to lower duties in line with average duties for the
whole agricultural sector.7 In-quota imports are administered by first-come-first-served
and country-based historical license systems.8 Several trading partners have objected to
6 How the two regimes interact is not always clear, and the question of interpretation of certain provisions has already come up in the context of US FTAs. 7 The CBO (2005) report estimates the simple average in-quota tariff for TRQ lines at around 10 percent. 8 An explanation of the administration of US TRQs is found in WTO document G/AG/N/USA/2/Add.3.
6

“certain built-in rigidities in the import-licensing system,” and other features in the
administration of quotas.9
Switzerland has been granted exclusive access under three US Section 22 TRQs on
Swiss/Emmental, Gruyere, and other varieties of cheese. Nevertheless, other Swiss
exports of cheese and dairy products, chocolate, and sugar-based products are probably
constrained by the TRQ system (see tables 2.5 and 2.8).
US bilateral agreements maintain protective barriers on sensitive products through special
TRQs. Often in bilateral FTAs, preferential TRQs replace US Section 22 import quotas
for imports originating in the partner country. Preferential TRQs typically allow duty free
access to in-quota imports, while the over-quota tariffs are, in most cases, gradually
eliminated over a specified transition period. However, barriers are retained in many US
bilaterals.10
In both Section 22 and preferential regimes, the United States reserves the right to apply
price or volume based safeguards, which take the form of additional tariffs on over-quota
imports. These have been invoked in recent years.
9 For example, foreign governments have requested clarification of the role of the Commodity Credit Corporation (CCC) in the administration of tariff quotas. It seems that the CCC has, in the past, exchanged commodities already held in stock for certificates for quota eligibility. Canada has complained about “un-authorized” imports of refined sugar entering the United States against Canada’s portion of the refined sugar in-quota level. 10 For more information see the section on phase-outs in US bilateral FTAs.
7
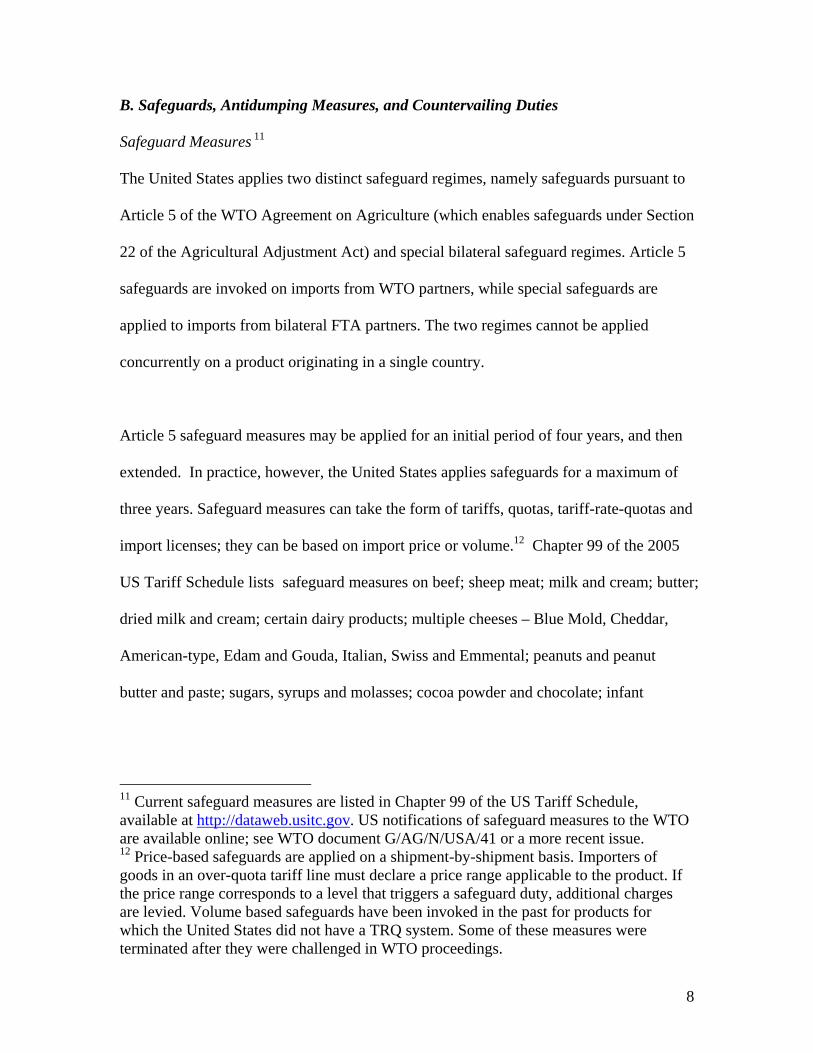
B. Safeguards, Antidumping Measures, and Countervailing Duties
Safeguard Measures 11
The United States applies two distinct safeguard regimes, namely safeguards pursuant to
Article 5 of the WTO Agreement on Agriculture (which enables safeguards under Section
22 of the Agricultural Adjustment Act) and special bilateral safeguard regimes. Article 5
safeguards are invoked on imports from WTO partners, while special safeguards are
applied to imports from bilateral FTA partners. The two regimes cannot be applied
concurrently on a product originating in a single country.
Article 5 safeguard measures may be applied for an initial period of four years, and then
extended. In practice, however, the United States applies safeguards for a maximum of
three years. Safeguard measures can take the form of tariffs, quotas, tariff-rate-quotas and
import licenses; they can be based on import price or volume.12 Chapter 99 of the 2005
US Tariff Schedule lists safeguard measures on beef; sheep meat; milk and cream; butter;
dried milk and cream; certain dairy products; multiple cheeses – Blue Mold, Cheddar,
American-type, Edam and Gouda, Italian, Swiss and Emmental; peanuts and peanut
butter and paste; sugars, syrups and molasses; cocoa powder and chocolate; infant
11 Current safeguard measures are listed in Chapter 99 of the US Tariff Schedule, available at http://dataweb.usitc.gov. US notifications of safeguard measures to the WTO are available online; see WTO document G/AG/N/USA/41 or a more recent issue. 12 Price-based safeguards are applied on a shipment-by-shipment basis. Importers of goods in an over-quota tariff line must declare a price range applicable to the product. If the price range corresponds to a level that triggers a safeguard duty, additional charges are levied. Volume based safeguards have been invoked in the past for products for which the United States did not have a TRQ system. Some of these measures were terminated after they were challenged in WTO proceedings.
8

formulas; and rough cotton.13 The top Swiss agricultural export to the United States,
food preparations containing over 10 percent of sugars (HS code 2106.90.97), is currently
subject to Article 5 safeguard measures. US safeguard measures also have targeted Swiss
exports of Swiss/Emmental and other type of cheeses (HS code 0406.90.97).
As a general rule, the United States does not invoke WTO safeguard measures on goods
originating in bilateral FTA partner countries (Canada, Mexico, Jordan, Singapore, Chile,
Morocco and Australia). Thus, in December 2001, President Bush excluded Mexican,
Canadian, Israeli and Jordanian steel from its safeguard regime. This exclusion was
challenged by third countries, including Switzerland. The WTO Appellate Body held that
bilateral FTA partners can be excluded from a safeguards remedy, but that the products
from excluded countries must not be counted in the findings of injury (contrary to what
happened in the steel case).14
The United States reserves the right to apply special safeguards to products originated in
FTA partner countries, including agricultural products subject to preferential TRQs.15
The special agricultural safeguard provision, a standard clause in US FTAs, allows the
application of additional tariffs when over-quota imports pass certain thresholds in terms
13 2005 US Tariff Schedule – Chapter 99, pgs 59-81. Online at http://www.usitc.gov. 14 In the earlier US-Wheat Gluten case, the WTO Appellate Body concluded that the US practice of including certain countries in the determination of injury while excluding some of these from the application of the measure was inconsistent with the Agreement on Safeguards. US-line Pipe further clarifies that the competent authorities must "establish explicitly" that imports from the sources covered by the measure must by themselves satisfy the conditions for applying safeguards. US-Steel Safeguards reaffirms this line of interpretation. 15 For a full description of the actual application of special safeguards in US bilateral FTAs see the later section on phase-outs.
9

of price or quantity. Dairy products, fruits and vegetables and their products, and beef
are often targeted.16 Typically, the special safeguard provision is a transition measure, but
in some instances the United States and its partner countries have agreed to its
continuation in the post-transition period. In a similar spirit, US unilateral preference
schemes include “competitive need” provisions whereby products can lose eligibility
when imports exceed certain thresholds.
Antidumping and Countervailing Duties (AD & CVD)
Though AD measures are typically associated with certain manufactured products, the
United States applies AD measures on agricultural and food imports. In fact, AD
measures on these products are applied to a greater extent than their share in total US
imports. In recent years, US AD measures have targeted honey, sugar, frozen apple and
orange juices, raspberries, fresh garlic, preserved mushrooms, live swine and canned
pineapple fruit.17 However, no product originating in Switzerland was subject to AD
measures as of December 2004.
C. Other Measures18
Domestic Support19
The OECD (2003) concludes, “Agricultural policy in the United States is characterized
16 See Chapter 99 US Tariff Schedule. 17 See WTO document GADP/N/126/USA 18 Sanitary and phyto-sanitary issues and standards are explored at length in chapter 3. 19 Domestic support is rarely a topic treated in bilateral FTAs. We do not anticipate it will be addressed in the context of the negotiations between Switzerland and the United States. Therefore, our discussion does not delve into details.
10
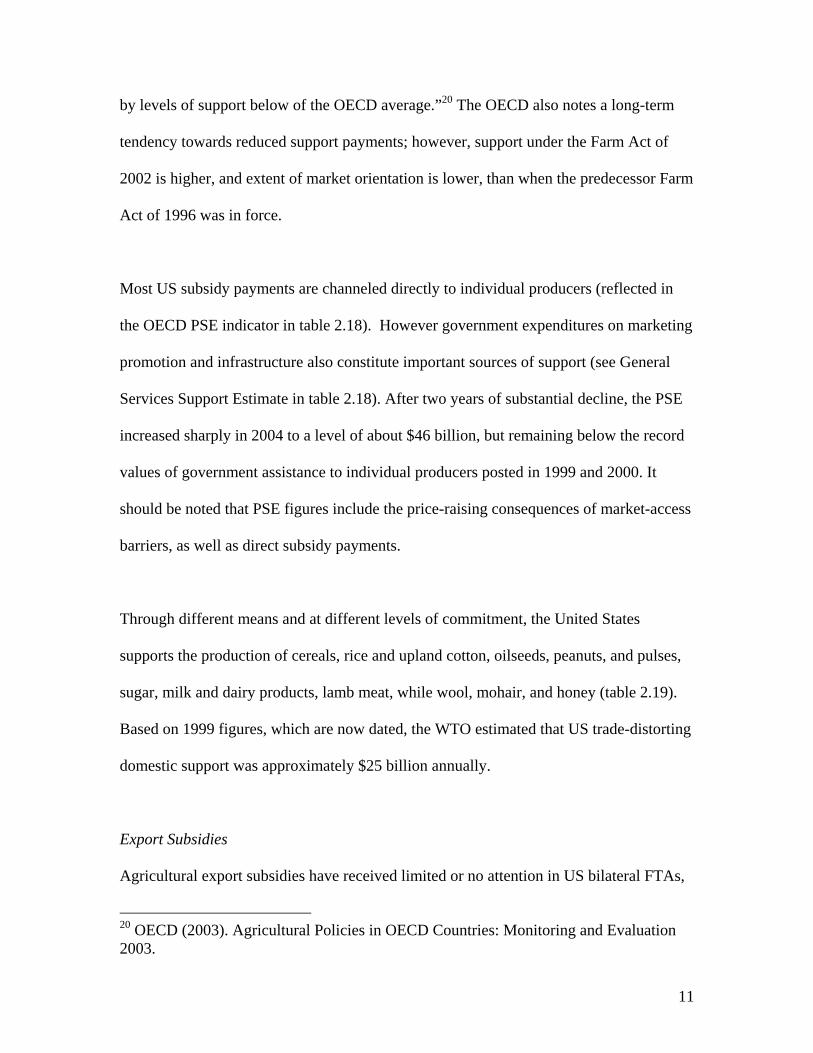
by levels of support below of the OECD average.”20 The OECD also notes a long-term
tendency towards reduced support payments; however, support under the Farm Act of
2002 is higher, and extent of market orientation is lower, than when the predecessor Farm
Act of 1996 was in force.
Most US subsidy payments are channeled directly to individual producers (reflected in
the OECD PSE indicator in table 2.18). However government expenditures on marketing
promotion and infrastructure also constitute important sources of support (see General
Services Support Estimate in table 2.18). After two years of substantial decline, the PSE
increased sharply in 2004 to a level of about $46 billion, but remaining below the record
values of government assistance to individual producers posted in 1999 and 2000. It
should be noted that PSE figures include the price-raising consequences of market-access
barriers, as well as direct subsidy payments.
Through different means and at different levels of commitment, the United States
supports the production of cereals, rice and upland cotton, oilseeds, peanuts, and pulses,
sugar, milk and dairy products, lamb meat, while wool, mohair, and honey (table 2.19).
Based on 1999 figures, which are now dated, the WTO estimated that US trade-distorting
domestic support was approximately $25 billion annually.
Export Subsidies
Agricultural export subsidies have received limited or no attention in US bilateral FTAs,
20 OECD (2003). Agricultural Policies in OECD Countries: Monitoring and Evaluation 2003.
11
nor in the context of the Switzerland-EU Bilateral Agreement on Agriculture. Recent
US bilateral FTAs such as US-Chile, US-Australia, CAFTA, and US-Morocco, include
the reciprocal commitment not to subsidize agricultural sales in the partner country’s
home market, unless subsidies are necessary to meet the export subsidies of a third
country (notably, the European Union). We anticipate that the Swiss-US FTA will
follow the norm, and either ignore export subsidies altogether or contain a similar “non-
aggression” clause. However, since export subsidies clearly distort markets we present a
brief overview of their magnitude and trends.
Under the WTO Agreement on Agriculture, the United States committed to discipline
export subsidies to total outlays not exceeding $594 million per annum. In addition, the
United States pledged to reduce that amount over time. In its schedule, the United States
identified 13 agricultural product groups that receive export subsidies, including cereals,
oilseeds, dairy products, and vegetables.
The actual amount of export subsidies granted yearly by the US government is much
lower than the agreed cap. According to the latest figures reported to the WTO, the
United States distributed $32 million in 2002, a significantly lower figure than the
US$147 million estimate for 1998. While export subsidies under $150 million are
insignificant in comparison to total US agricultural exports, subsidies can be important
for particular commodities. For example, the WTO Trade Policy Review for the United
States (2004) mentions that, in the year 2000, “91% of total exports of skim milk powder
were subsidized.”
12

While perhaps not technically export subsidies (the characterization is still debated), US
export finance, insurance, and guarantee programs also play a role in the promotion of
exports. Export finance and kindred systems provide short, medium, and long-term
credit-lines, guaranteed by the Commodity Credit Corporation (CCC).The value of
officially supported export credits stood at $3.4 billion in 2002. According to the WTO
Trade Policy Review (2004), “Government-guaranteed export financing confers an
export advantage, because the interest rates charged does not reflect the actual risk of the
transaction, but rather the credit rating of the underlying guarantee.” Few government-
financed exports are shipped to Switzerland; typical destinations are South America,
Mexico, Turkey, and South Korea.
Customs procedures
Foreign reports on US barriers have frequently voiced concerns over US licensing
systems, invoice requirements, customs fees, and other charges.21 More recently, foreign
governments have objected to higher transaction costs and delays associated with the
Homeland Security Act of 2002.22
21 Title 19 of the US Code contains provisions on fees for custom services. Fees include the Harbor Maintenance Act (ad valorem levy of 0.125 percent). 22 This Act established new and stricter customs procedures, and given the perceived threat of terrorism, these procedures are not subject to negotiation in a free trade agreement. Under the Container Security Initiative (CSI), the US Customs Service, renamed the Customs and Border Protection Service (CBP), now operates container screening checks in ports of departure, 24 hour pre-shipment vessel cargo declarations, and supply chain guidelines for business desiring to export goods to the United States. The main ports of continental Europe – Rotterdam, Antwerp, Le Havre, and Genoa among others – have been selected by the CBP to participate in a CSI related program that uses new technology to speed-up pre-shipment inspection. Switzerland benefits from
13

2.2 Switzerland: Barriers to Agricultural Trade
As far as agriculture is concerned, Switzerland ranks among highly protected countries in
the industrial world. Other industrial countries with comparable levels of protection
include Japan, Korea, and Norway. Swiss barriers to agricultural trade result from
policies designed to:
• Ensure the conservation of rural areas;
• Promote the decentralized use of territory through income generation;
• Contribute to food security through national self-sufficiency in agriculture.
Apart from agricultural self-sufficiency, most goals of Swiss agricultural policy could be
achieved by policy measures that do not entail trade protection. Historically, however,
protection has been the chosen instrument. Swiss barriers to agricultural trade are
implemented mostly through tariff and tariff-quota barriers. These measures are
supplemented by domestic subsidies and barriers such as safeguards, standards and
technical regulations (including sanitary and phyto-sanitary measures).23 US officials
have stated repeatedly that Switzerland is a “difficult market” for many US agricultural
products. US agricultural producers trying to sell into the Swiss market often face high
tariffs, they must compete with third-country firms that enjoy preferential access, and
this program. According to the CBP, no complaints of cargo delayed due to the CSI system have been received. Foreign reports, however, highlight the unilateral nature of US measures, as well as business concerns. On the other hand, it has been argued that there are some offsetting gains in efficiency arising from efforts to meet the new US security requirements. 23 In some instances, standards and technical regulations are more restrictive than tariffs and quotas.
14
they must overcome negative public attitudes toward biotechnology.24
A. Tariffs and Tariff-Rate Quotas
Tariffs
Estimates of the simple average tariff equivalent for Swiss agricultural imports for 2004
range from 28.6 percent (using Major Division 1 of the ISIC) to 36.2 percent (WTO
definition), as shown in tables 2.10 and 2.11. Switzerland’s tariff peaks are concentrated
in the agricultural sector (table 2.12). For the purposes of this report, we emphasize the
WTO definition, since it better corresponds to the concerns of trade negotiators.
However, even the ISIC estimate, at 28.6 percent, is nearly three times the corresponding
level of US applied MFN tariffs on agricultural imports (9.3 percent).
The WTO tariff definition is expressed in ad valorem equivalent terms (AVE), since
Switzerland applies specific tariffs and TRQs. It is worth noting that, when dealing with
specific tariffs, exchange rate fluctuations affect the analysis of AVE levels. For example,
when the Swiss franc is strong, specific tariffs translate into a higher AVE figure.
Despite high tariff and quota barriers, many agricultural products enter Switzerland at
reduced rates – often close to zero – depending on the period when they are imported or
their final use. According to Ordonnance sur l’allègement douanier selon l’emploi (1999),
eligible agricultural products include live swine, animal products, fruit cereals, fodder
24 See, for example, the section on “Switzerland” in the USTR publication, 2005 National Trade Estimate Report on Foreign Trade Barriers.
15

goods, oilseeds, and edible oils.25 The purpose of low rates is to boost the
competitiveness of Swiss food processing and pharmaceutical firms, which otherwise
would be hampered by costly inputs. Yet Swiss retail prices substantially exceed the
average prices for most agricultural products found in neighboring countries (table 2.17).
So far, Switzerland has not used its extensive network of bilateral FTAs, including
agreements with its EFTA partners and the European Union, to sharply reduce the
average level of agricultural protection. However, the Bilateral Agreement on Agriculture
between the European Union and Switzerland significantly liberalized a limited number
of products.
With only six exceptions, all the top 30 US agricultural exports to Switzerland face
specific tariff barriers (table 2.15). In addition, seasonal tariffs affect US agricultural
exports of certain fruits and vegetables such as fresh green asparagus. Top US
agricultural exports to the European Union and the world, such as wheat, corn, and
soybeans fare quite poorly in the Swiss market. Table 2.16 shows that high tariffs and
quotas partly explain the low volumes registered for US exports of wheat, corn, and
soybeans to Switzerland.
Tariff-Rate Quotas (TRQs)
Switzerland currently applies 28 TRQs to 282 tariff lines (table 2.13 lists the broader
25 The complete list of eligible products is listed in the 20-page annex of the Ordonnance, available at http://www.admin.ch/ch/f/rs/6/631.146.31.fr.pdf.
16

product categories, not the specific tariff lines).26 The simple average in-quota and out-of-
quota tariff rates on products subject to TRQs are respectively 11.2 percent and 118.8
percent. Switzerland is among the top countries in the world in terms average out-of-
quota TRQ rates. The highest out-of-quota tariffs are those on cut flowers (336 percent),
durum wheat (199 percent), pork and poultry (153 percent), grapes and grape juice (143
percent), vegetables (125 percent), cereals (120 percent), and grains (112 percent).
Swiss TRQs may affect 4 out of the top 20 US agricultural exports. These products are
bovine semen, meat of horses and mules, bovine meat, and asparagus. Moreover, many of
the top US exports to the European Union fare rather poorly in the bilateral trade between
the United States and Switzerland. Some of these products (e.g. wheat, poultry, cereals,
grains) also face prohibitive out-of-quota barriers. Swiss TRQs are administered by
different allocation systems such as, prise en charge, auctions, and first-come-first-served
systems.27 In recent years, some US exporters such as potato producers, have
complained about the allocation of quotas. On the other hand, the auctioning of the
white wine quota, from 1996 to 2000, led to considerable increases in the US share of the
white wine market, a product that is relatively expensive.
B. Safeguards, Antidumping Measures and Countervailing Duties
26 The list of the 282 tariff lines affected by TRQs is available at www.tares.ch. The specific link in French is: http://www.zoll.admin.ch/f/firmen/import/kontingente.php 27 The prise en charge system requires traders to purchase domestic production in order to use the quota on foreign imports (e.g. potato products, milk powder and poultry). Recent reforms have replaced the prise en charge system with the first-come-first-served system in some instances (e.g. eggs) or the auctioning system (e.g. beef, pork and poultry).
17

Switzerland does not have any anti-dumping (AD), countervailing duty (CVD) or
safeguard measures in place, nor do they intend to establish any.28 But Switzerland
reserves the right to impose special safeguards (SSG) for all imports subject to TRQs
when domestic prices fall below, or import quantities exceed, certain thresholds. 29 This
prerogative has not been invoked since 2000, and only once before then (for pork meat).
C. Other Barriers
Domestic Support Measures30
According to the OECD report (2003), “Agriculture in Switzerland is characterized by
high support levels and limited market orientation.” In 2004, producer support was
estimated at 68 percent of gross receipts from agriculture, more than twice the OECD
average and double of the EU level. Switzerland ranks among the top OECD countries in
terms of per capita support to agricultural producers. For the period 1995 to 2003, the per
capita producer support estimates (PSE) were estimated at €293 for the European Union,
€122 for the United States and €683 for Switzerland.
28 See WTO Trade Policy Review Report, “Switzerland and Liechtenstein,” 17 November 2004, available at: www.wto.org/english/tratop_e/tpr_e/tpr_e.htm (accessed May 2005). 29 One legal basis is Article 7 of the Customs Law, which allows any tariff modification when the “national interest is at stake.” Other articles allow temporary increases in agricultural tariff products, consistent with international agreements. SECO is the competent Swiss authority for antidumping (AD) and countervailing duty (CVD) investigations. 30 Domestic support is rarely a topic treated in bilateral FTAs. We do not anticipate it will be addressed in the context of the negotiations between Switzerland and the United States. Therefore, our discussion does not delve into details.
18

As estimated by the OECD, the level of producer supports stood at Sfr 7.2 billion in 2004
(see tables 2.18, and 2.20). Of that amount, government support was about Sfr 4 billion;
the remaining amount essentially reflected transfers from consumers to producers through
high prices induced by tariff and quota protection. Agricultural support in Switzerland
remained broadly unchanged between 1995 and 2001, but increased in dollar terms after
2001 due to the appreciation of the Swiss franc.31
Price Controls, Export Refunds, and Export Subsidies
Government intervention through target prices has now been replaced by market
determined prices, bolstered by restrictive TRQs.32 The price compensation scheme
provides “export refunds” with the objective of compensating domestic food processors
for the high input costs resulting from agricultural protection. The products eligible are:
dairy and milling products when exported in processed agricultural products falling under
HS chapters 15-22; sugar confectionery; preparations of cereals, and other food
preparations These products comprise most of the top 20 Swiss agricultural exports to
the United States.
31 Domestic support in Switzerland consists for the most part of product-specific market-price supports and producer-specific subsidies (payments based on historical entitlements, or the so-called “ecological payments” distributed on planted area/number of animals), with a gradual tendency to shift from the former to the latter. However, as shown in Tables 2.19 and 2.20, in 2003, support through market prices represented about 60 percent of total support provided to individual farmers, while the support on historical entitlements and planted area/number of animals made up 30 percent. The milk subsector receives the largest share of support – about 40 percent of the total, while beef and pigmeat also command large entitlements (16 and 13 percent respectively). See table 2.19 for estimates of agricultural production in Switzerland. 32 The WTO TPR notices that the Ordonnance sur les produits agricoles maintained a complex system of price brackets for certain agricultural goods, including duty-inclusive imports. The system currently applies to animal feed stuffs and seeds.
19
Total export subsidies granted by the Swiss government to agricultural producers
declined 30 percent between 1996 and 2000, reaching Sfr.318 million (roughly $190
million). According to the 2004 WTO Trade Policy Review of Switzerland and
Liechtenstein, Switzerland has not submitted notifications with more recent data. While
the reported level of export subsidies is dwarfed by domestic support to agriculture, their
relevance lies in the high ratio of export subsidies to the value of agricultural exports. A
recent report by CBO estimated that, for the year 2000, the ratio was nearly 7 percent,
and as a percentage of agricultural exports, Switzerland was the highest provider of
export subsidies in the world, surpassing even the European Union (4 percent in 2000).
Given the affected trade volumes, Swiss agricultural export subsidies are not nearly as
disruptive as those provided by larger players such as the European Union. However, the
2004 WTO Trade Policy Review of Switzerland and Liechtenstein concludes that, “Swiss
export subsidies, when they were last notified in 1998 … were likely to distort world
markets of mainly cheese.” The Swiss Agricultural Policy 2007 promises to reform
domestic support, but the document does not address export subsidies.
Import Prohibitions
The Ordinance on Plant Protection prohibits imports, on the grounds of plant protection,
of the following products: potatoes, potato plants, vines, fruit trees from non European
countries, and certain soils. 33
33 Details are available at http://www.admin.ch/ch/f/rs/c916_20.html
20

2.3 Phase-out Schedules for Agricultural Barriers in US FTAs
This section describes US and partner country agricultural phase-out schedules, and
correspondingly agricultural market access commitments in selected FTAs. We consider
NAFTA, US-Australia, US-Chile, US-Morocco and US-CAFTA-DR. The material is
divided between the text of this chapter and Appendix A. The chapter text presents a
general overview of market access commitments in the selected FTAs, focusing on
tariffs, tariff-rate quotas, and safeguards.34 Appendix A gives a detailed description of
phase-outs for 15 selected agricultural product-categories, and includes a summary table
of concessions on selected products across the different FTAs (table A.1).
With the exception of US bilateral relations with Mexico and Chile, all other US bilateral
FTAs fall short of full liberalization for both parties. Products that were excluded, or
phased-out over more than 20 years in one or more agreements include sugar, some dairy
items, beef, wheat, poultry, eggs, margarine, ethanol, potatoes and onions. In addition,
US bilateral FTAs establish quantity or price-based special safeguards for certain
agricultural products. In a few cases, parties have agreed to extend, or review the
possibility of extending, the application of the special agricultural safeguards beyond the
transition period.
A. NAFTA
34 The overview is based on USDA Foreign Agricultural Service, DIRECON, Australian Department of Foreign Affairs and Trade, Secretaria de Economia of Mexico, and Costa Rica’s COMEX. Chapter 3 discusses commitments on sanitary and phyto-sanitary matters in US and Swiss FTAs.
21

The North American Free Trade Agreement includes three sets of bilateral market access
commitments: US-Mexico, US-Canada, and Canada-Mexico. We cover the first two
relationships in that order. In general, Canada-Mexico commitments are similar to US-
Mexico commitments, but they fall short of full liberalization.35
US-Mexico
When NAFTA went into effect in 1994, immediately more than half the value of the
bilateral US-Mexico agricultural trade became duty free. The remaining tariffs and non-
tariff barriers (NTBs) are being phased-out over transition periods of 5, 10, or 15 years.
Once the 15-year transition period is ended, free trade between the US and Mexico will
prevail for all agricultural products.36
Quota barriers affecting agricultural trade between the United States and Mexico were
immediately converted to preferential tariffs or tariff-rate quotas. NAFTA established
preferential TRQs that provide in-quota duty-free access, while the initial over-quota
tariffs are equivalent to the border protection provided by previous quantitative
restrictions. The over-quota tariffs are phased-out over 10 or 15-year periods.37 The
United States established NAFTA TRQs to replace US section 22 TRQs for imports of
cotton, dairy products, certain fruit juices, peanuts, and sugar from Mexico. Mexico
replaced its import licensing system with NAFTA TRQs on imports of corn, dry beans,
35 Important exceptions to full liberalization are in dairy products, poultry, eggs, and the sugar sector. 36 This is not the final outcome of Mexico’s other bilateral FTAs, including for example, the Mexico-EU FTA and Mexico’s NAFTA relations with Canada. 37 Over-quota tariffs lasting 15 years are applied to corn, dry beans, peanuts, and powdered milk.
22

milk powder, poultry, barley/malt, animal fats, potatoes, eggs, and some lumber products
from the United States. 38
A special agricultural safeguard provision is included in NAFTA for certain import-
sensitive products. NAFTA’s agricultural safeguards are quantity-based. Once the
threshold is met, the importing country may apply the tariff rate in effect at the time the
agreement went into effect or the then-current MFN rate, whichever is lower. The
threshold level grows at an annual rate of 3 percent throughout the transition period.39
The United States may apply special agricultural safeguards on seasonal horticultural
imports, while Mexico may do the same on certain meats, vegetables, and fruits.40
US–Canada
Tariff elimination schedules in the US-Canada Free Trade Agreement (CUSFTA)
remained in place for US-Canadian agricultural trade under NAFTA.41 Many tariffs on
agricultural products were eliminated over 9 years after the CUSFTA agreement entered
into force, but there are important exceptions for US imports of dairy products, peanuts,
peanut butter, sugar, sugar-containing products, and cotton. Canadian over-quota tariffs
remain in place for dairy, poultry, eggs, and margarine.
38 Additionally, Mexico’s import licenses on wheat, grapes, tobacco, certain cheeses, evaporated milk, and day-old chicks imported from the United States were replaced by tariffs, which were phased out over a 10-year period. 39 Information about the thresholds for each product is available at http://www.fas.usda.gov/itp/policy/nafta/safeguards.html 40 The special safeguards products for the United States are fresh tomatoes, eggplant, chili peppers, squash, watermelon and onions; for Mexico, they are live swine, pork, potato products, fresh apples, and coffee extract. 41 The Canada US FTA entered into force in January 1, 1989.
23

CUSFTA’s “snap-back provision” allows both countries to invoke priced-based special
safeguards on fresh fruits and vegetables for twenty years after the entry in force of the
agreement.42 Safeguard measures must satisfy two conditions: (1) for each of five
consecutive days, the import price of the product must be below 90 percent of the
corresponding five-year average monthly import price; and (2) the planted acreage for the
product in the importing country must be no higher than the average planted acreage over
the preceding five years (excluding the years with the highest and lowest acreage). If
these conditions are met, a partner country may restore MFN duties on imports of the
product.43
B. US-Australia
When the US-Australia was ratified in 2004, Australia immediately eliminated nearly all
its agricultural tariffs.44 The United States eliminated almost two-thirds of its agricultural
tariffs when the agreement entered into force. The United States will reduce a further 9
percent of tariff-lines to zero within four years. The United States will liberalize duties on
products that are subject only to tariffs (not TRQs) either immediately, or in 4, 10 or 18
years. However, the agreement falls short of complete liberalization. Sugar was excluded
altogether from the agreement, and tariffs on some dairy products, such as certain cheeses,
42 The snap-back provision remains in force until 2008. 43 Safeguards may remain in place 180 days or until the price of the product exceeds 90 percent of the 5-year price average, whichever comes first. 44 With the exception of dairy products, Australia’s agricultural tariffs were already low. Australia, however, will preserve its single-desk (state-managed) arrangements for marketing Australian commodities such as sugar, rice, wheat and barley; Australia will also maintain its “best practice” quarantine and food safety regime.
24
will remain at base year rates throughout phase-out periods that will go beyond 18
years.45
The United States will establish preferential TRQs with duty free in-quota volumes on
several products: beef; cotton; peanuts; avocados; tobacco; milk, powder and other milk
products; cream; ice-cream; butter and butterfat; and Cheddar, American, Swiss,
European type and other cheeses.46 Over-quota tariffs will be phased-out over 18 years,
except for certain dairy products, where the in-quota tariff free level will grow at constant
fixed rates after year 18 of the agreement.
Both countries agreed not to subsidize their agricultural exports to the partner’s market,
but preserved “the right to respond” to third-country use of export subsidies that displace
their own products in the partner’s market. The agreement establishes a system of
recourse to special agricultural safeguards, but they may not be applied concurrently on
the same product with general FTA safeguards or WTO Article 19 safeguards. The
United States may invoke automatic, price-based agricultural safeguard measures on
imports of beef, vegetables, and fruits.47 Beef is subject to both a volume-based safeguard
during the transition period and the continuation of price-based safeguards in the post-
45 More information: http://www.fas.usda.gov/itp/Australia/us-aus.html http://www.dfat.gov.au/trade/negotiations/us_fta/fact_sheets/Agriculture.pdf46 The Australian Government will administer FTA dairy quotas through a system of certification not available under the existing WTO cheese quota system of access into the US market. The administration of quotas by Australia allows the financial gains (quota rents) derived from additional FTA access to be retained by the Australian dairy industry. 47 The actual list of products includes beef, onions, garlic, canned fruits, grape juice, orange juice, and tomato paste and puree.
25

transition period. The price-based safeguard trigger is based on US market prices, and
there is no requirement that the US prices be affected by imported beef. The threshold
prices for commodities subject to safeguards are programmed into the US Customs and
Border Protection computers, which automatically assess the tariff uplift if the import
value of the commodity falls below the trigger price established in the agreement.
However, the United States has the option to waive application of the safeguard.48
C. US-Chile
More than three-quarters of US agricultural exports, by value, to Chile will be duty free
within 4 years of the agreement’s entry into force (January 2004).49 The analogous figure
for Chile is nearly 85 percent.50 The remaining tariffs will be phased-out over the course
of 8, 10, or 12 years. Some 12-year phase-outs will apply a nonlinear formula. At the end
of the twelfth year, all agricultural products, with no exceptions, will be duty free.51
Sugar was not a problematic product in the Chile-US negotiation, in large part because
Chile does not export sugar.52 According to the USDA, “US farmers will have access to
Chile that is as good as or better than the EU or Canada, both of which already have
48 More information available at the Australian Department of Agriculture, Fisheries and Forestry (http://www.affa.gov.au/content/output.cfm?ObjectID=D2C48F86-BA1A-11A1-A2200060B0A00018 or http://www.affa.gov.au/corporate_docs/publications/word/agriculture_ind/meat_livestock/quotas/Fact_Sheet_Web1.doc). 49 For more information see presentation of Chilean Head-negotiator, Osvaldo Rosales at: http://www.direcon.cl/documentos/TLC%20EEUU/TLC%20de%20Chile%20con%20Estados%20Unidos%20y%20la%20Union%20Europea.pdf50 It is worth noting that, by value, tariffs on 13.7 percent of Chilean agricultural exports to the United States will be eliminated according to the 12 year phase-out category. 51 This was not the case in other bilateral agreements of Chile. 52 See Osvaldo Rosales’ presentation cited in a previous footnote.
26

FTAs with Chile.”53
The agreement provides for the establishment of preferential TRQs. In-quota volumes
will be duty free and all quotas will be removed at the end of 12-year phase-out periods.
The United States may apply TRQs on Chilean beef, turkey, poultry, avocados, sugar,
tobacco, processed artichokes, cheeses, condensed and powder milk, butter, and other
dairy products, including some chocolates. Chile may apply quotas to US exports of beef,
poultry, turkey and dairy products.
The agreement stipulates that special agricultural safeguards may not be applied
concurrently for the same product as general safeguards under the FTA agreement or
WTO safeguards under Article 19. The agreement contemplates the use of price-based
special safeguards in 50 tariff lines. The United States may apply safeguard measures on
canned or processed fruits; grape juice; orange juice; artichokes, mushrooms, tomato
products, garlic, spinach, broccoli, avocados and asparagus, and cherries from Chile.
Chile may invoke safeguards on eggs, several varieties of rice, and wheat grains.
Safeguards are automatically imposed once the price of imports drops below a certain
threshold. Import prices will be calculated for each shipment. Any differential from the
53 Chile has committed to eliminate its price band mechanism as it relates to the United States over a 12-year transition period. Elimination of price bands was not part of the EU or Canadian FTAs with Chile. In the transition period, Chile also guarantees to treat the United States no less favorably than any other trading partner. The US has agreed not to subsidize US agricultural exports to Chile, but preserves “the right to respond” to third countries’ (e.g. the EU) use of export subsidies to displace US products in the Chilean market. More information: http://www.fas.usda.gov/itp/chile/us-chile.html and http://www.direcon.cl/documentos/TLC%20EEUU/Impacto%20TLC%20Chile%20USA.pdf
27

reference price will be used as a basis for assessing additional duties, as long as overall
duties do not exceed the MFN rate. The United States and Chile may use this recourse
only during the 12-year transition period.
D. US-Morocco
The United States and Morocco will provide preferential market access on all agricultural
products. The agreement falls short of full liberalization as the United States only
achieved limited access to the Moroccan market on beef, wheat and certain pasta
products, and poultry.54 The United States, on the other hand, will phase-out all
agricultural tariffs under the agreement, most within 15 years.
Besides immediate elimination, preferential tariff phase-outs will take place over 5, 8, 10,
12, 15, and 18 year periods. Some US tariffs in the 18-year period will be phased-out
using a non-linear formula. Moroccan tariffs on certain US products will be phased-out
using non-linear formulas applied over 6, 18, 19, and 25 years.55
The US-Morocco FTA establishes preferential TRQs. In-quota volumes are zero duty,
while out-of-quota tariffs are gradually eliminated over 15 years. The United States will
apply TRQs on beef, dairy products, peanuts, cotton, tobacco, sugar and sugar-containing
products, tomato products, tomato sauces, dried onions, and dried garlic. Sugar and
54 Katherine Novelli, Assistant USTR, said that, for these products, Moroccan concessions to US producers consists of “extremely small quantities that could in no way disrupt the Moroccan market.” 55 More information: http://www.fas.usda.gov/itp/us-morocco.html and http://www.moroccousafta.com/index_ang.htm
28

sugar-containing products are subject to a net surplus exporter methodology and an 18-
year phase-out period. Morocco established preferential TRQs for US beef, whole birds,
leg quarters, durum and non-durum wheat, almonds, and apples. Moroccan TRQs on beef
and wheat are quite limited. Moreover, in-quota volumes of wheat and beef will still be
subject to duties. Out-of quota tariffs are not eliminated for some beef, wheat and certain
pasta products.56
The agreement contains an automatic "preference clause"57 whereby US exporters of
wheat, beef, poultry, corn, soybeans, and corn and soybeans obtain any better market
access Morocco gives other trading partners (notably the European Union). As in the US-
Chile FTA and CAFTA-DR, the United States has agreed not to subsidize US agricultural
exports to Morocco, but preserving “the right to respond” to third-country (e.g., the
European Union) use of export subsidies to displace US products in the Moroccan
market.
The agreement stipulates that special agricultural safeguards may not be applied
concurrently for the same product as general FTA safeguards or WTO Article 19
safeguards. During the implementation period, Morocco may apply quantity-based
safeguards on chickpeas; lentils; almonds; dried prunes; poultry and turkeys. The margin
56 Talking about the limited access provided to certain agricultural products Katherine Novelli, Assistant USTR, stated that “We have never agreed to limit our access in this way, but we did this willingly because we understand how vital it is to preserve rural income in Morocco and we wanted to also have a free trade agreement that covers all products ... but do it in a way that would in no way have a negative impact on Morocco's farmers or its citizens.” 57 Annex 1 of the agreement states: “In the event that Morocco grants or maintains with respect to any other trading partner market access better than that granted to the United States under this Agreement for any good listed in subparagraph (b) below, Morocco shall immediately grant such better market access to the United States.”
29

of extra-duty permitted by the agreement is calculated as a variable percentage of the
difference between the MFN rate and the preferential rate under the agreement, and is
phased-out over the transition period. The United States may apply price-based
safeguards on certain fruits, vegetables and fruit juices.58 The United States can invoke
these safeguards in the event the import prices drop below certain thresholds. The extra-
duty applied is proportional to the price differential, but may not exceed MFN rates.
Morocco and the United States will evaluate the need for post-transitions safeguards on
certain products (e.g., poultry).
E. CAFTA-DR
Under prior unilateral arrangements, notably the Caribbean Basin Initiative, the United
States already allowed duty free entry to over 99 percent of Central American exports,
measured by tariff lines. However, the most sensitive products (with the greatest export
potential) belonged to the remaining 1 percent of tariff lines.
Under the CAFTA-DR Agreement, the United States will provide the same tariff
treatment to each of the six countries, but its partners need not apply the same tariffs to
the United States.59 Tariff phase-outs will be immediate or in 5, 10, 12, 15, 17, or 20
years. As a general rule, tariffs will be linearly reduced over the phase-out period. For a
few products, tariff reductions will be back-loaded. Tariffs will eventually be eliminated
58 The actual products are dried onions; dried garlic; preserved tomato products; tomato pastes/purees; canned asparagus; certain canned black olives; canned pears, apricots, peaches, and fruit mixtures; and orange juice. 59 US quotas, however, are determined on country-by-country basis.
30

for all products, except sugar and ethanol for the United States, fresh potatoes and fresh
onions for Costa Rica, and white corn for the other Central American countries.60
The CAFTA countries will create preferential TRQs with duty free access for all in-quota
imports. The United States will establish different initial volumes for each country as
well as different growth rates for in-quota volumes.61 Exceptions aside, the longest phase-
out for over-quota tariffs will be 20 years. The United States will apply TRQs on beef,
dairy products, peanuts, ethyl alcohol, and sugar; CAFTA countries will apply TRQs on
poultry, beef, rice, dairy products, and corn.62
The United States has agreed not to subsidize US agricultural exports to CAFTA-DR
countries, but it preserves the right to respond to third-country export subsidies that
displace US products in the Central American or Dominican market. Also, the agreement
stipulates that special agricultural safeguards may not be applied concurrently for the
same product as general safeguards under the agreement FTA or WTO Article 19
safeguards. The special safeguards will be volume-based, activated by specific triggers.
The sum of any additional import duty and any other customs duty can not exceed the
lesser of the prevailing MFN applied rate, or the MFN applied rate applied before the
agreement entered into force.
60 In the United States, white corn is considered a food grade corn, while yellow corn is primarily used for animal feed. The distinction is rather arbitrary, and price differentials play a role in explaining the different usages of corn varieties. 61 Typically lower growth rates for Central American countries and faster growth for imports from the Dominican Republic. 62 More information: http://www.fas.usda.gov/itp/CAFTA/cafta.html http://www.comex.go.cr/difusion/otros/USAv8Resultados.pdf
31

The United States may invoke safeguards on out-of-quota imports of peanuts, peanut
butter, cheese, butter, ice-cream, fluid fresh and sour cream, some milk items, and other
dairy products. All CAFTA-DR countries can apply safeguards on US poultry products,
dairy items, milled rice, rough rice, onions, pork cuts, corn and corn syrups. In addition,
certain country specific safeguards are remitted. For example, US fresh tomatoes and
potatoes will face agricultural safeguards only in Costa Rica and Guatemala. Though the
possibility of employing safeguards will expire at the end of the transition period,
safeguard coverage can be extended beyond the tariff phase-out period if all parties agree.
2.4 Phase-outs Schedules for Agricultural Barriers in Swiss FTAs
A. Overview
As mentioned earlier, Switzerland has not used its extensive network of bilateral FTAs,
including agreements with its EFTA partners and the European Union, to sharply reduce
the average level of agricultural protection. While Switzerland has granted duty free entry
to 99.8 percent of non-agricultural goods in its bilateral agreements, the lowest FTA
average preferential agricultural tariff (per the WTO definition) applies to EFTA partners
– namely 34.5 percent, a slight reduction compared to an average MFN agricultural tariff
of 36.2 percent (table 2.14). However, since April 2004, Swiss agricultural imports from
less developed countries (LDCs) are entitled to unilateral tariff reductions that range
between 55 and 75 percent, thereby bringing the average AVE rate on these imports
down to 24.1 percent in 2004. A complete phase-out of all tariffs and TRQs for LDCs
has been decided in principle, along the lines of the EC’s “Everything but Arms”
32
initiative.
B. Swiss-EU Agricultural Agreement
Though Switzerland and the European Union have a long record of trade agreements that
extends as far back as 1972, for the most part these agreements excluded agricultural
liberalization. However, in June 1999, Switzerland and the European Union addressed
the issue in their Bilateral Agreement on Agriculture.63 Entered into force in June 2002,
this agreement aims to reduce tariff barriers and eliminate non-tariff barriers arising, for
example, from differences in sanitary measures. In this section we discuss the agreement
as it concerns tariff barriers. Chapter 3 discusses the agreement’s treatment of sanitary
measures, standards, and geographical indications.
The reduction in custom duties was limited to those agricultural products in which both
parties have a particular interest. Switzerland gained full access in cheese, plus additional
(but not full) access in other dairy products; and fresh vegetables and fruits. The EU also
obtained full access in cheese and concessions on products exported during non-
harvesting periods and for foodstuffs that are not either produced, or that are produced in
small quantities, in Switzerland. The agreement did not reduce custom duties on fresh
meat, wheat and milk. According to the Swiss Integration Office, Swiss concessions
under the agreement amount to an annual loss of nearly Sfr 115 million of tariff revenue.
63 The Bilateral Agreement on Agriculture was one of seven Bilateral Agreements signed by the European Union and Switzerland in June 1999. The other agreements covered free movement of persons, overland transport, air transport, research, technical barriers to trade and public procurement.
33

Cheese and Dairy
Trade in cheese products will be fully liberalized at the end of the 5-year transition period
January 1, 2007). All tariff and quotas on cheeses of all kinds are eliminated at the end of
the transition period. Switzerland gains access on certain creams and yogurts through a
duty-free TRQs of 2000 metric tons. Out-of-quota shipments will be subject to the EU
common external tariff. Switzerland did not make reciprocal commitments on these
products.
Plants and Flowers
Switzerland gains unlimited free access for bouquets (HS 0603.10) and certain
ornamental plants (HS 0602). The European Union gains free access to the Swiss market
on ornamental plants and bouquets from 26 October until 30 April, but only TRQ access
for bouquets during other periods.
Fruits and Vegetables
Switzerland obtained several duty free TRQs on the following fresh or chilled fruits and
vegetables: seed potatoes; tomatoes; onions; cabbages; lettuce; carrots; beets; cucumbers;
beans; eggplants; spinach; celeries; apples; apricots; pears; cherries; prunes; raspberries.
The EU common external tariff will apply for out-of-quota shipments of these products.
In addition, Switzerland gained unlimited access for champignons and powders for
certain fruit juices.
34

The European Union obtained free and unlimited access on citrus; kiwis; saffron; oranges;
mandarins; melons; olives; certain processed tomato products; asparagus; mushrooms.
Switzerland established several duty free TRQs for EU exports of: apricots, strawberries,
lettuce and tomatoes. The European Union also obtained free and unlimited access on
certain nuts.
The EU obtained free and unlimited access on certain fruit products (with our without
sugars or spirit) such as peach or citrus fruits. Switzerland maintained reduced tariffs on
similar fruit products of apricots.
Dried Meat
Within one year of the agreement’s entry into force, Switzerland obtained a duty-free
TRQ of 1200 metric tons on dried boneless meat of bovine animals. The European Union
obtained a TRQ of 200 metric tons on dried boneless meat of bovine animals and a duty-
free TRQ of 1000 metric tons on boneless dried hams. Both concessions were conditional
on the solution of outstanding BSE issues.
Other products
Switzerland granted the European Union a 50 percent tariff reduction on olive oil and a
duty-free TRQ of 1000 metric tons on EU exports of port wine. The European Union
gained preferential access (though not full liberalization) on sweet wines, and Retsina
Wine from Greece. The European Union did not grant reciprocal concessions on these
products.
35
2.5 Recommendations on Agricultural Market Access Barriers
As this chapter shows, both the United States and Switzerland protect agriculture in
multiple ways, and to a considerable extent their restrictions limit bilateral trade in basic
agricultural goods and processed foods. This chapter did not assess sanitary and phyto-
sanitary measures (SPS) or geographic indications (GIs) – these issues are discussed in
Chapter 3. Instead, this chapter is concerned with barriers that have no ostensible
purpose aside from protecting the agricultural sector. Reducing these barriers will be at
the core of the Swiss-US FTA, because they stick out like Alpine peaks and hinder
substantial volumes of commerce at great cost to both countries.
It is useful to preview the calculations reported in Chapter 8 as to the possible gains in
bilateral agricultural trade resulting from a Swiss-US FTA. Based on “gravity model”
estimates, two-way agriculture trade might increase by as much as 140 percent, following
the total elimination of trade barriers by both partners. Based on “computable general
equilibrium model” estimates, again assuming total elimination of market access barriers,
US exports to Switzerland of broadly defined agricultural products (grains, oil seeds,
fibers, other crops, animal products, wool, forestry, dairy, and food products) – starting
from a small base -- might increase by more than five times (a dollar increase of about
$1.3 billion, table 8.6). Similarly, Swiss agricultural exports to the United States –
starting from a substantial base -- might increase by about 50 percent (a dollar increase of
about $1.4 billion, table 8.6). Of course total elimination of agricultural trade barriers
will not happen immediately, and phase-in periods will often be lengthy. Nevertheless,
36

the prize, in terms of expanded trade, is very large. We turn now to ambitious but still
feasible recommendations for eventually eliminating many agricultural barriers.
The place to begin is by recognizing that certain measures that indirectly limit imports are
beyond the reach of a bilateral FTA: in this category we place agricultural subsidies,
whatever the WTO “box” – amber, blue or green. Subsidies will be reduced in size or
shifted between boxes (e.g., from amber to green) only in the larger context of the WTO
Doha Round. Based on precedent, neither EFTA nor US bilateral FTAs have any
prospect of altering the size or changing the composition of agricultural subsidies.
Other market access barriers have a long history, and are fiercely protected by domestic
agricultural lobbies – however great the costs to society at large. In Switzerland, cows
grazing at altitude fit this category.64 In the United States, extremely restrictive cheese
quotas are another classic example. The failure of previous trade agreements – in the
GATT, the WTO, and on a bilateral basis – to ease these barriers will certainly give
Swiss-US FTA negotiators reason to pause. But past failures should not be an excuse for
abandoning the quest. Rather, the most difficult agricultural products should be
liberalized on very long timetables. Long phase-out schedules will give farm owners and
64 A classic example, not of Swiss protection, but of German willingness to liberalize beef trade in a way that would pose no competitive threat in the German market, was the Swiss-German Commercial Treaty of 12 April 1904. A new German tariff concession was granted for “Large dapple mountain cattle or brown cattle reared at a spot at least 300 meters above sea level and having at least one month’s grazing each year at a spot at least 800 meters above sea level.” Curzon (1965, p. 60) describes this provision as a “grotesque reclassification [designed to deprive Germany’s other trading partners of] their most-favored-nation advantages [in existing trade agreements].”
37

workers time to find alternative land use and employment, and the government time to
implement green payments as a means of income support.
38
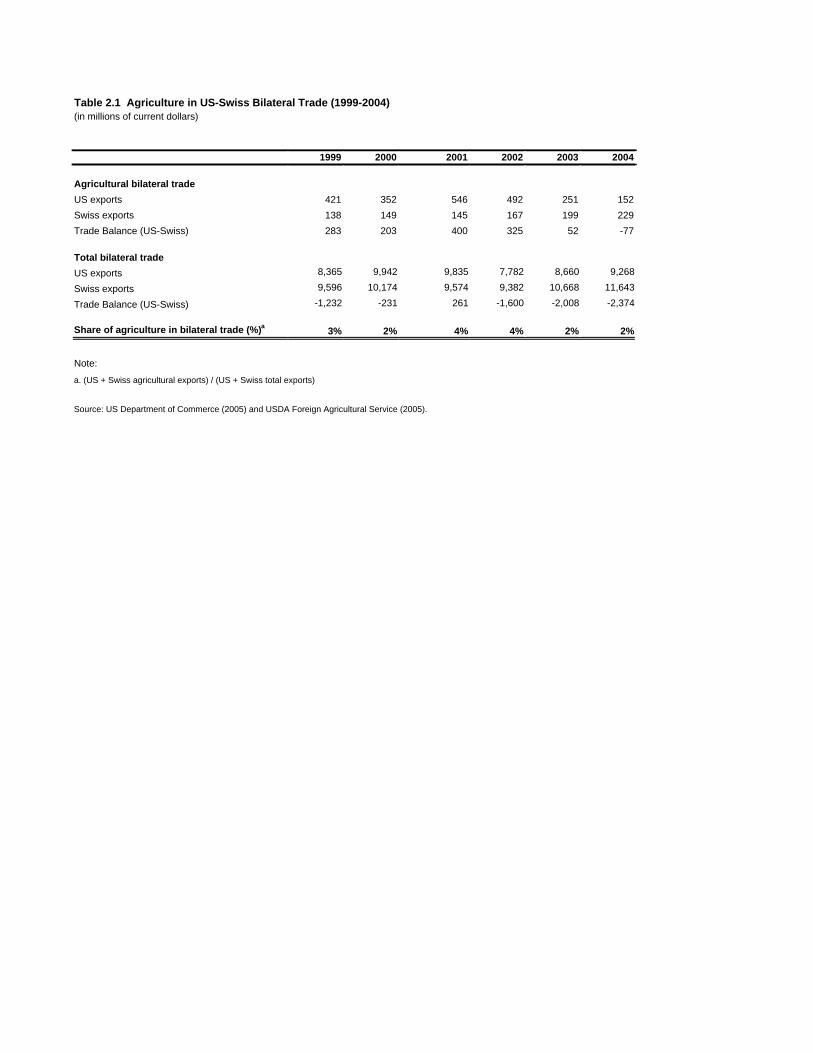
Table 2.1 Agriculture in US-Swiss Bilateral Trade (1999-2004)(in millions of current dollars)
1999 2000 2001 2002 2003 2004
Agricultural bilateral tradeUS exports 421 352 546 492 251 152Swiss exports 138 149 145 167 199 229Trade Balance (US-Swiss) 283 203 400 325 52 -77
Total bilateral tradeUS exports 8,365 9,942 9,835 7,782 8,660 9,268
Swiss exports 9,596 10,174 9,574 9,382 10,668 11,643
Trade Balance (US-Swiss) -1,232 -231 261 -1,600 -2,008 -2,374
Share of agriculture in bilateral trade (%)a 3% 2% 4% 4% 2% 2%
Note:
a. (US + Swiss agricultural exports) / (US + Swiss total exports)
Source: US Department of Commerce (2005) and USDA Foreign Agricultural Service (2005).
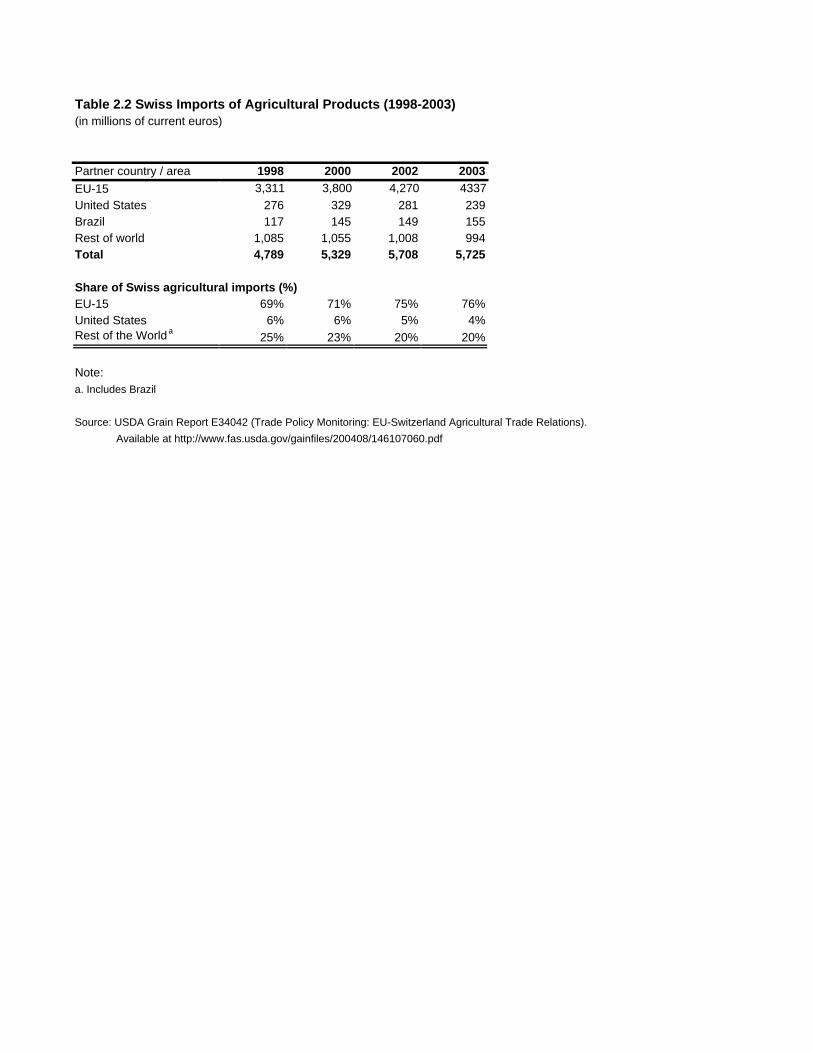
Table 2.2 Swiss Imports of Agricultural Products (1998-2003)(in millions of current euros)
Partner country / area 1998 2000 2002 2003EU-15 3,311 3,800 4,270 4337United States 276 329 281 239Brazil 117 145 149 155Rest of world 1,085 1,055 1,008 994Total 4,789 5,329 5,708 5,725
Share of Swiss agricultural imports (%)EU-15 69% 71% 75% 76%United States 6% 6% 5% 4%Rest of the World a 25% 23% 20% 20%
Note: a. Includes Brazil
Source: USDA Grain Report E34042 (Trade Policy Monitoring: EU-Switzerland Agricultural Trade Relations). Available at http://www.fas.usda.gov/gainfiles/200408/146107060.pdf
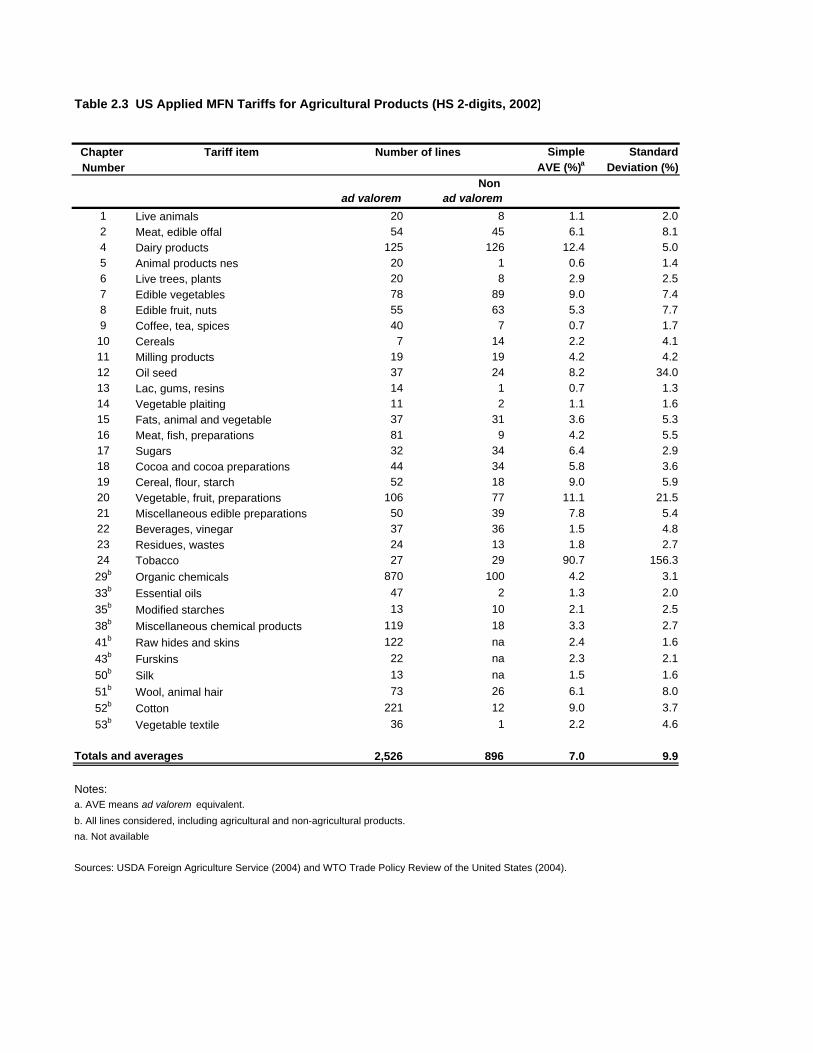
Table 2.3 US Applied MFN Tariffs for Agricultural Products (HS 2-digits, 2002)
Chapter Tariff item Simple StandardNumber AVE (%)a Deviation (%)
Non ad valorem ad valorem
1 Live animals 20 8 1.1 2.02 Meat, edible offal 54 45 6.1 8.14 Dairy products 125 126 12.4 5.05 Animal products nes 20 1 0.6 1.46 Live trees, plants 20 8 2.9 2.57 Edible vegetables 78 89 9.0 7.48 Edible fruit, nuts 55 63 5.3 7.79 Coffee, tea, spices 40 7 0.7 1.710 Cereals 7 14 2.2 4.111 Milling products 19 19 4.2 4.212 Oil seed 37 24 8.2 34.013 Lac, gums, resins 14 1 0.7 1.314 Vegetable plaiting 11 2 1.1 1.615 Fats, animal and vegetable 37 31 3.6 5.316 Meat, fish, preparations 81 9 4.2 5.517 Sugars 32 34 6.4 2.918 Cocoa and cocoa preparations 44 34 5.8 3.619 Cereal, flour, starch 52 18 9.0 5.920 Vegetable, fruit, preparations 106 77 11.1 21.521 Miscellaneous edible preparations 50 39 7.8 5.422 Beverages, vinegar 37 36 1.5 4.823 Residues, wastes 24 13 1.8 2.724 Tobacco 27 29 90.7 156.329b Organic chemicals 870 100 4.2 3.133b Essential oils 47 2 1.3 2.035b Modified starches 13 10 2.1 2.538b Miscellaneous chemical products 119 18 3.3 2.741b Raw hides and skins 122 na 2.4 1.643b Furskins 22 na 2.3 2.150b Silk 13 na 1.5 1.651b Wool, animal hair 73 26 6.1 8.052b Cotton 221 12 9.0 3.753b Vegetable textile 36 1 2.2 4.6
Totals and averages 2,526 896 7.0 9.9
Notes: a. AVE means ad valorem equivalent.b. All lines considered, including agricultural and non-agricultural products. na. Not available
Sources: USDA Foreign Agriculture Service (2004) and WTO Trade Policy Review of the United States (2004).
Number of lines
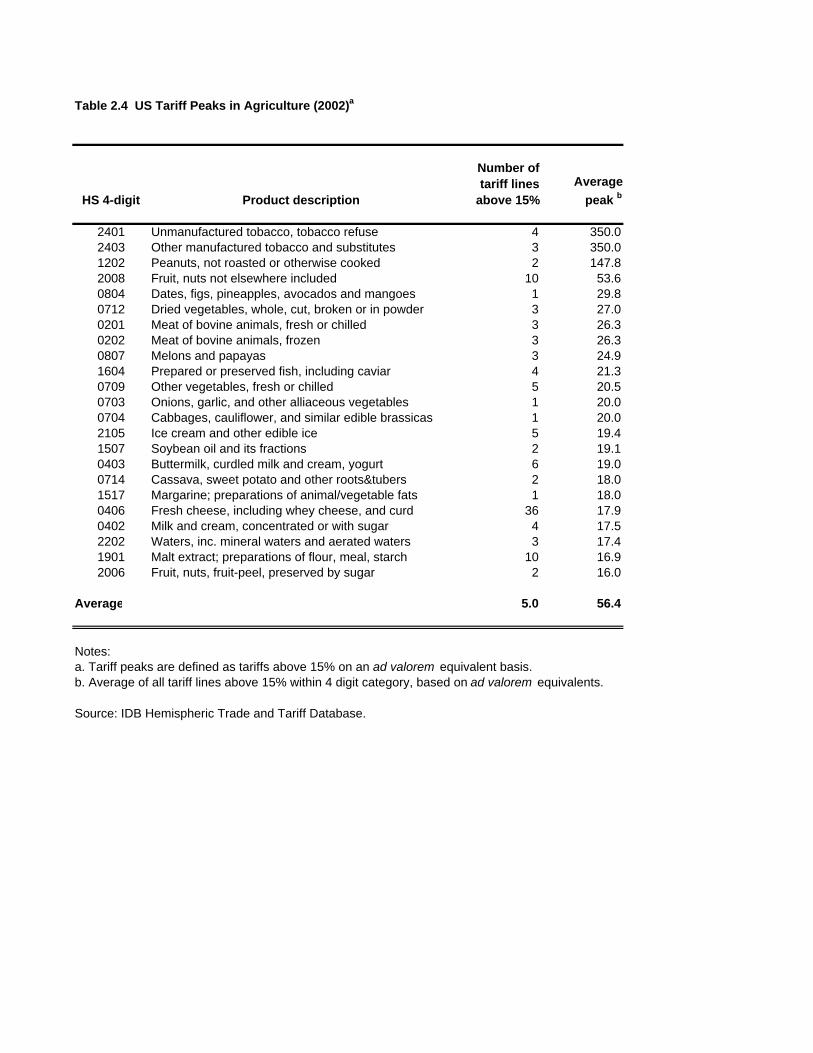
Table 2.4 US Tariff Peaks in Agriculture (2002)a
HS 4-digit Product description
Number of tariff lines
above 15%Average
peak b
2401 Unmanufactured tobacco, tobacco refuse 4 350.02403 Other manufactured tobacco and substitutes 3 350.01202 Peanuts, not roasted or otherwise cooked 2 147.82008 Fruit, nuts not elsewhere included 10 53.60804 Dates, figs, pineapples, avocados and mangoes 1 29.80712 Dried vegetables, whole, cut, broken or in powder 3 27.00201 Meat of bovine animals, fresh or chilled 3 26.30202 Meat of bovine animals, frozen 3 26.30807 Melons and papayas 3 24.91604 Prepared or preserved fish, including caviar 4 21.30709 Other vegetables, fresh or chilled 5 20.50703 Onions, garlic, and other alliaceous vegetables 1 20.00704 Cabbages, cauliflower, and similar edible brassicas 1 20.02105 Ice cream and other edible ice 5 19.41507 Soybean oil and its fractions 2 19.10403 Buttermilk, curdled milk and cream, yogurt 6 19.00714 Cassava, sweet potato and other roots&tubers 2 18.01517 Margarine; preparations of animal/vegetable fats 1 18.00406 Fresh cheese, including whey cheese, and curd 36 17.90402 Milk and cream, concentrated or with sugar 4 17.52202 Waters, inc. mineral waters and aerated waters 3 17.41901 Malt extract; preparations of flour, meal, starch 10 16.92006 Fruit, nuts, fruit-peel, preserved by sugar 2 16.0
Average 5.0 56.4
Notes:a. Tariff peaks are defined as tariffs above 15% on an ad valorem equivalent basis. b. Average of all tariff lines above 15% within 4 digit category, based on ad valorem equivalents.
Source: IDB Hemispheric Trade and Tariff Database.
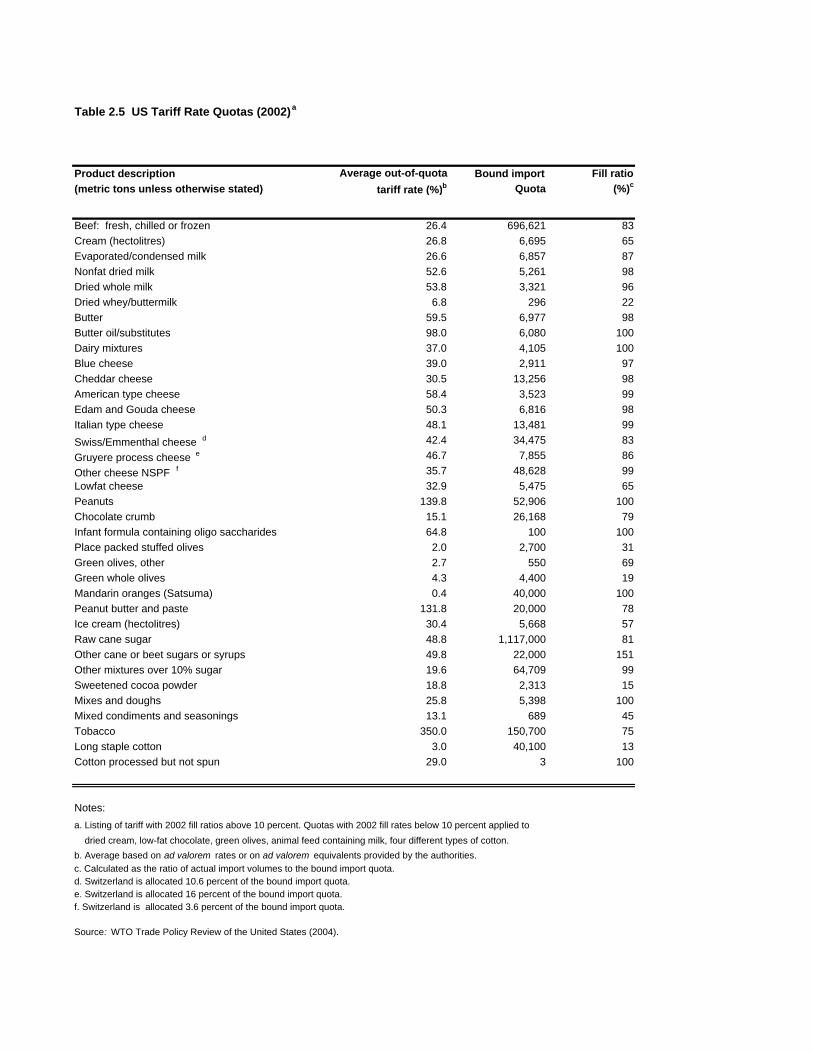
Table 2.5 US Tariff Rate Quotas (2002)a
Product description Average out-of-quota Bound import Fill ratio(metric tons unless otherwise stated) tariff rate (%)b Quota (%)c
Beef: fresh, chilled or frozen 26.4 696,621 83Cream (hectolitres) 26.8 6,695 65Evaporated/condensed milk 26.6 6,857 87Nonfat dried milk 52.6 5,261 98Dried whole milk 53.8 3,321 96Dried whey/buttermilk 6.8 296 22Butter 59.5 6,977 98Butter oil/substitutes 98.0 6,080 100Dairy mixtures 37.0 4,105 100Blue cheese 39.0 2,911 97Cheddar cheese 30.5 13,256 98American type cheese 58.4 3,523 99Edam and Gouda cheese 50.3 6,816 98Italian type cheese 48.1 13,481 99Swiss/Emmenthal cheese d 42.4 34,475 83Gruyere process cheese e 46.7 7,855 86Other cheese NSPF f 35.7 48,628 99Lowfat cheese 32.9 5,475 65Peanuts 139.8 52,906 100Chocolate crumb 15.1 26,168 79Infant formula containing oligo saccharides 64.8 100 100Place packed stuffed olives 2.0 2,700 31Green olives, other 2.7 550 69Green whole olives 4.3 4,400 19Mandarin oranges (Satsuma) 0.4 40,000 100Peanut butter and paste 131.8 20,000 78Ice cream (hectolitres) 30.4 5,668 57Raw cane sugar 48.8 1,117,000 81Other cane or beet sugars or syrups 49.8 22,000 151Other mixtures over 10% sugar 19.6 64,709 99Sweetened cocoa powder 18.8 2,313 15Mixes and doughs 25.8 5,398 100Mixed condiments and seasonings 13.1 689 45Tobacco 350.0 150,700 75Long staple cotton 3.0 40,100 13Cotton processed but not spun 29.0 3 100
Notes: a. Listing of tariff with 2002 fill ratios above 10 percent. Quotas with 2002 fill rates below 10 percent applied to dried cream, low-fat chocolate, green olives, animal feed containing milk, four different types of cotton.b. Average based on ad valorem rates or on ad valorem equivalents provided by the authorities.c. Calculated as the ratio of actual import volumes to the bound import quota.d. Switzerland is allocated 10.6 percent of the bound import quota.e. Switzerland is allocated 16 percent of the bound import quota.f. Switzerland is allocated 3.6 percent of the bound import quota.
Source: WTO Trade Policy Review of the United States (2004).

Table 2.6 US MFN and Preferential Tariffs by Partner Country or Group (2002)a
Country or Group All products Agriculture Non agricultureb
Canada 0.7 4.3 0.0Mexico 0.6 2.7 0.2Jordan 2.7 6.2 2.1Israel 0.7 4.4 0.0
AGOAc,d 2.4 6.0 1.8ATPDEAd 2.6 6.0 1.9CBERAd 2.4 5.9 1.8CBTPAd 2.3 5.9 1.6
LDCd 2.7 6.2 2.1GSPd 3.7 8.4 2.8
MFN 5.1 9.8 4.2
Notes: a. If a tariff line is not eligible for the preferential program, the rate used in the calculation of averages is the GSP or MFN rate.b. Excludes petroleum products.c. The calculations were made for LDC AGOA beneficiaries, as they constitute the majority of beneficiaries.d. Groups: African Growth and Opportunity Act (AGOA), Andean Trade Promotion and Drug Eradication Act (ATPDEA), Caribbean Basin Economic Recovery Act (CBERA), Caribbean Basin Trade Partnership Act of 2000 (CBTPA), Less Develpoed Countries (LDC), Generalized System of Preferences (GSP).
Source: WTO Trade Policy Review of the United States (2004).
Average tariff rates (%)
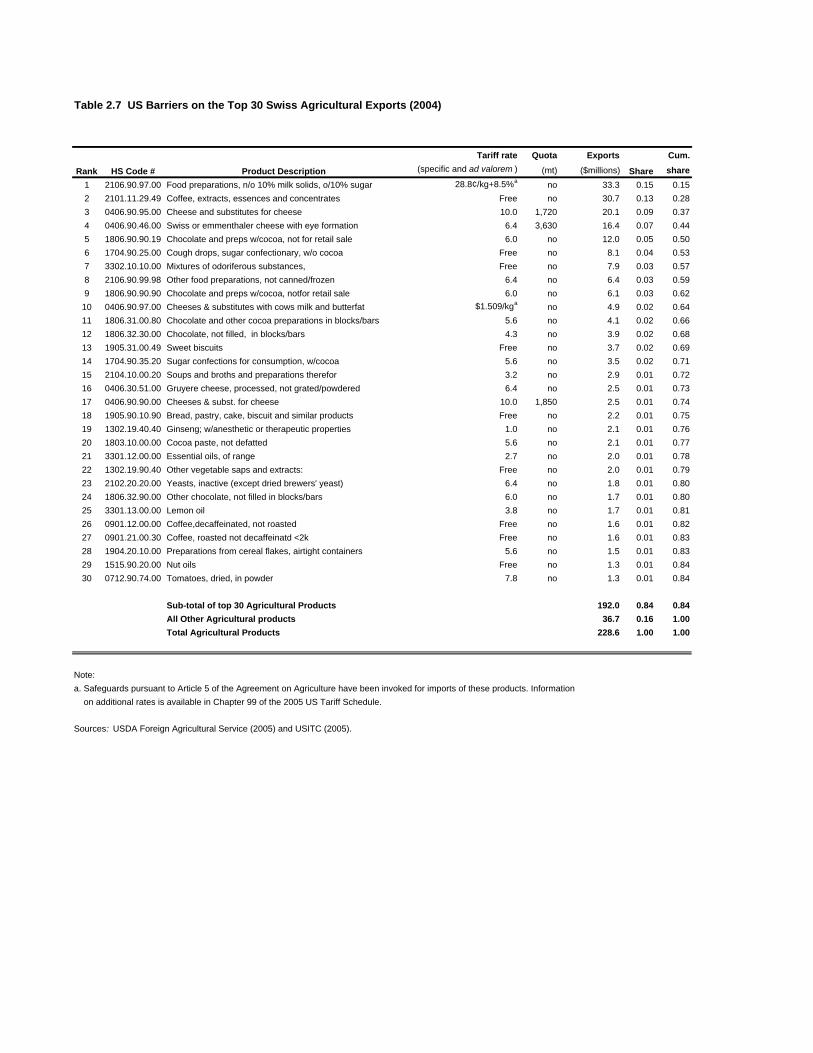
Table 2.7 US Barriers on the Top 30 Swiss Agricultural Exports (2004)
Tariff rate Quota Exports Cum.(specific and ad valorem ) (mt) ($millions) share
1 2106.90.97.00 Food preparations, n/o 10% milk solids, o/10% sugar 28.8¢/kg+8.5%a no 33.3 0.15 0.152 2101.11.29.49 Coffee, extracts, essences and concentrates Free no 30.7 0.13 0.283 0406.90.95.00 Cheese and substitutes for cheese 10.0 1,720 20.1 0.09 0.374 0406.90.46.00 Swiss or emmenthaler cheese with eye formation 6.4 3,630 16.4 0.07 0.445 1806.90.90.19 Chocolate and preps w/cocoa, not for retail sale 6.0 no 12.0 0.05 0.506 1704.90.25.00 Cough drops, sugar confectionary, w/o cocoa Free no 8.1 0.04 0.537 3302.10.10.00 Mixtures of odoriferous substances, Free no 7.9 0.03 0.578 2106.90.99.98 Other food preparations, not canned/frozen 6.4 no 6.4 0.03 0.599 1806.90.90.90 Chocolate and preps w/cocoa, notfor retail sale 6.0 no 6.1 0.03 0.62
10 0406.90.97.00 Cheeses & substitutes with cows milk and butterfat $1.509/kga no 4.9 0.02 0.6411 1806.31.00.80 Chocolate and other cocoa preparations in blocks/bars 5.6 no 4.1 0.02 0.6612 1806.32.30.00 Chocolate, not filled, in blocks/bars 4.3 no 3.9 0.02 0.6813 1905.31.00.49 Sweet biscuits Free no 3.7 0.02 0.6914 1704.90.35.20 Sugar confections for consumption, w/cocoa 5.6 no 3.5 0.02 0.7115 2104.10.00.20 Soups and broths and preparations therefor 3.2 no 2.9 0.01 0.7216 0406.30.51.00 Gruyere cheese, processed, not grated/powdered 6.4 no 2.5 0.01 0.7317 0406.90.90.00 Cheeses & subst. for cheese 10.0 1,850 2.5 0.01 0.7418 1905.90.10.90 Bread, pastry, cake, biscuit and similar products Free no 2.2 0.01 0.7519 1302.19.40.40 Ginseng; w/anesthetic or therapeutic properties 1.0 no 2.1 0.01 0.7620 1803.10.00.00 Cocoa paste, not defatted 5.6 no 2.1 0.01 0.7721 3301.12.00.00 Essential oils, of range 2.7 no 2.0 0.01 0.7822 1302.19.90.40 Other vegetable saps and extracts: Free no 2.0 0.01 0.7923 2102.20.20.00 Yeasts, inactive (except dried brewers' yeast) 6.4 no 1.8 0.01 0.8024 1806.32.90.00 Other chocolate, not filled in blocks/bars 6.0 no 1.7 0.01 0.8025 3301.13.00.00 Lemon oil 3.8 no 1.7 0.01 0.8126 0901.12.00.00 Coffee,decaffeinated, not roasted Free no 1.6 0.01 0.8227 0901.21.00.30 Coffee, roasted not decaffeinatd <2k Free no 1.6 0.01 0.8328 1904.20.10.00 Preparations from cereal flakes, airtight containers 5.6 no 1.5 0.01 0.8329 1515.90.20.00 Nut oils Free no 1.3 0.01 0.8430 0712.90.74.00 Tomatoes, dried, in powder 7.8 no 1.3 0.01 0.84
Sub-total of top 30 Agricultural Products 192.0 0.84 0.84All Other Agricultural products 36.7 0.16 1.00Total Agricultural Products 228.6 1.00 1.00
Note: a. Safeguards pursuant to Article 5 of the Agreement on Agriculture have been invoked for imports of these products. Information on additional rates is available in Chapter 99 of the 2005 US Tariff Schedule.
Sources: USDA Foreign Agricultural Service (2005) and USITC (2005).
ShareRank HS Code # Product Description

Table 2.8 Swiss Agricultural Exports that Fare Poorly in the US Market a
Rank in Swissagricultural exports Average
HS code to world US tariff (%)2402.20 Cigarettes containing tobacco 3 11.4 no1806.32 Chocolate in blocks/slabs/bars, weighing 2k 4 8.1 yesb
2309.10 Dog or cat food 5 0.0 no1806.90 Chocolate not included in 1806.20 through 1806.32 6 8.2 yesb
4403.20 Wood, in the rough 7 0.0 no2101.11 Extracts, essences and concentrates of coffee 8 9.4 no4410.32 Particle board of wood 9 0.0 no
Notes: a. Swiss exports of the product are not in the top 30 Swiss agricultural exports to the United States.b. Quotas on 1806.32.04; 1806.32.14; 1806.90.15; and 1806.90.25.
Source: UN Comtrade (2005).
QuotaProduct

Table 2.9 Swiss Agricultural Production (1997-2003)
Branch 1997-99 2003a
Total vegetable production 4,817 4,067 0.45Plants and flowers 923 790 0.09Vegetables 472 536 0.06Fruits 575 534 0.06Cereals 715 428 0.05Wine 366 388 0.04Potatoes 207 178 0.02Sugar beet 152 151 0.02
Total animal production 5,241 4,933 0.55Milk 2,665 2,360 0.26Porcines 1,124 1,082 0.12Bovines 1,003 1,016 0.11Poultry 169 202 0.02Eggs 184 184 0.02
Total agricultural production 10,058 9,000 1.00
Note:
Source: WTO Trade Policy Review of Switzerland and Liechtenstein (2004).
a. Provisional figures.
Value (Sfr millions) Share 2003
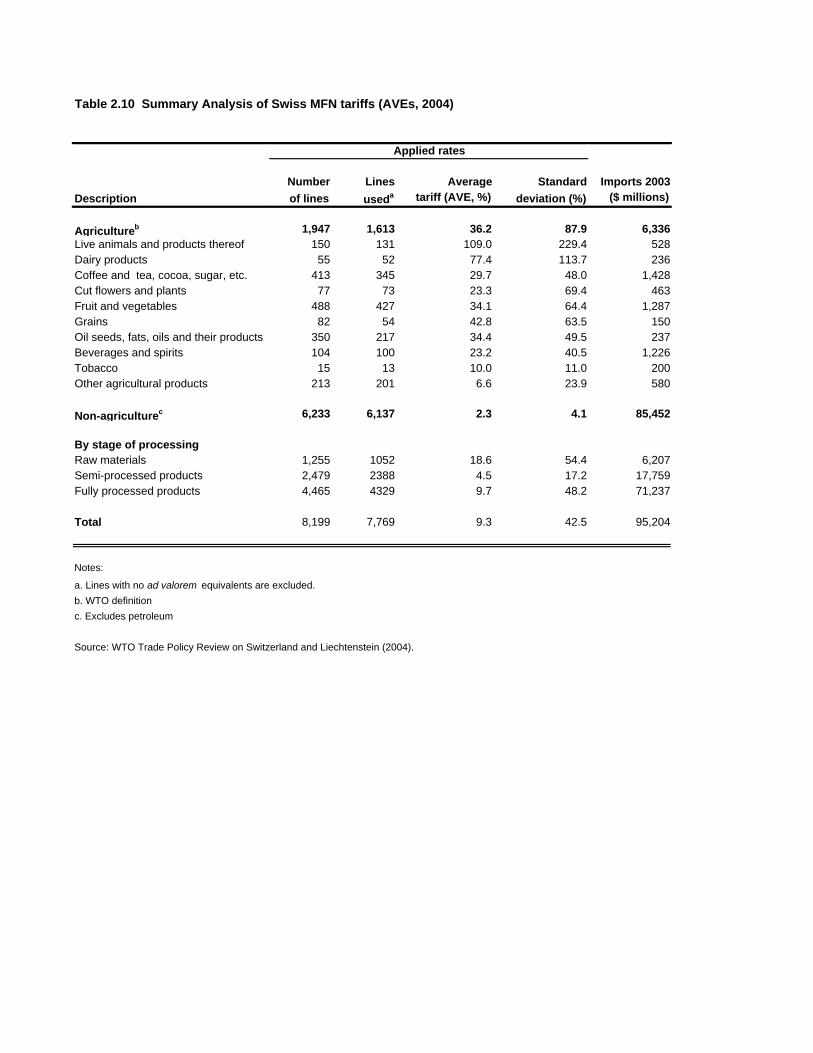
Table 2.10 Summary Analysis of Swiss MFN tariffs (AVEs, 2004)
Number Lines Average Standard Imports 2003 Description of lines useda tariff (AVE, %) deviation (%) ($ millions)
Agricultureb 1,947 1,613 36.2 87.9 6,336Live animals and products thereof 150 131 109.0 229.4 528Dairy products 55 52 77.4 113.7 236Coffee and tea, cocoa, sugar, etc. 413 345 29.7 48.0 1,428Cut flowers and plants 77 73 23.3 69.4 463Fruit and vegetables 488 427 34.1 64.4 1,287Grains 82 54 42.8 63.5 150Oil seeds, fats, oils and their products 350 217 34.4 49.5 237Beverages and spirits 104 100 23.2 40.5 1,226Tobacco 15 13 10.0 11.0 200Other agricultural products 213 201 6.6 23.9 580
Non-agriculturec 6,233 6,137 2.3 4.1 85,452
By stage of processingRaw materials 1,255 1052 18.6 54.4 6,207Semi-processed products 2,479 2388 4.5 17.2 17,759Fully processed products 4,465 4329 9.7 48.2 71,237
Total 8,199 7,769 9.3 42.5 95,204
Notes:
c. Excludes petroleum
Source: WTO Trade Policy Review on Switzerland and Liechtenstein (2004).
Applied rates
a. Lines with no ad valorem equivalents are excluded.b. WTO definition

Table 2.11 Swiss Applied MFN Tariffs for Agriculture (AVEs, HS 2-digits, 2004)
Total Average Standard number of Lines tariff deviation
2-digit lines used (%) (%)1 Live animals 32 30 47.1 81.42 Meat, edible offal 99 82 143.6 280.13 Fish, crustaceans 106 104 0.2 0.64 Dairy products 62 59 72.0 107.85 Animal products nes 30 29 3.2 9.96 Live trees, plants 51 49 34.1 82.87 Edible vegetables 277 232 47.9 77.18 Edible fruit, nuts 112 99 14.6 38.59 Coffee, tea, spices 38 37 1.9 4.1
10 Cereals 82 54 42.8 63.511 Milling products 156 91 65.7 79.112 Oil seed 211 110 6.9 15.613 Lac, gums, resins 18 16 2.1 7.914 Vegetable plaiting 10 10 0.3 0.815 Fats, animal, vegetable 175 144 48.7 54.716 Meat, fish, preparations 43 43 25.6 39.417 Sugars 56 56 15.3 20.018 Cocoa and cocoa preparations 35 35 13.3 11.419 Cereal, flour, starch 88 84 31.4 35.620 Vegetable, fruit, preparations 134 133 22.5 39.121 Miscellaneous edible preparations 46 45 12.1 9.922 Beverages, vinegar 58 55 14.9 15.323 Residues, wastes 72 61 12.2 30.624 Tobacco 15 13 10.0 11.029a Organic chemicals 505 496 0.3 0.933a Essential oils 40 40 4.3 6.435a Modified starches 22 20 14.8 47.738a Miscellaneous chemical products 88 85 1.8 4.341a Raw hides and skins 38 37 1.1 2.043a Furskins 14 14 0.9 1.744a Wood 92 90 3.1 3.450a Silk 18 18 1.8 1.951a Wool, animal hair 56 56 1.8 1.852a Cotton 180 168 3.7 2.053a Vegetable textiles 33 33 1.3 2.2
Note:a. All lines considered, including non-agricultural products.
Sources: USDA Foreign Agricultural Service (2004) and WTO Trade Policy Review of Switzerland and Liechtenstein (2004).
Chapter Product
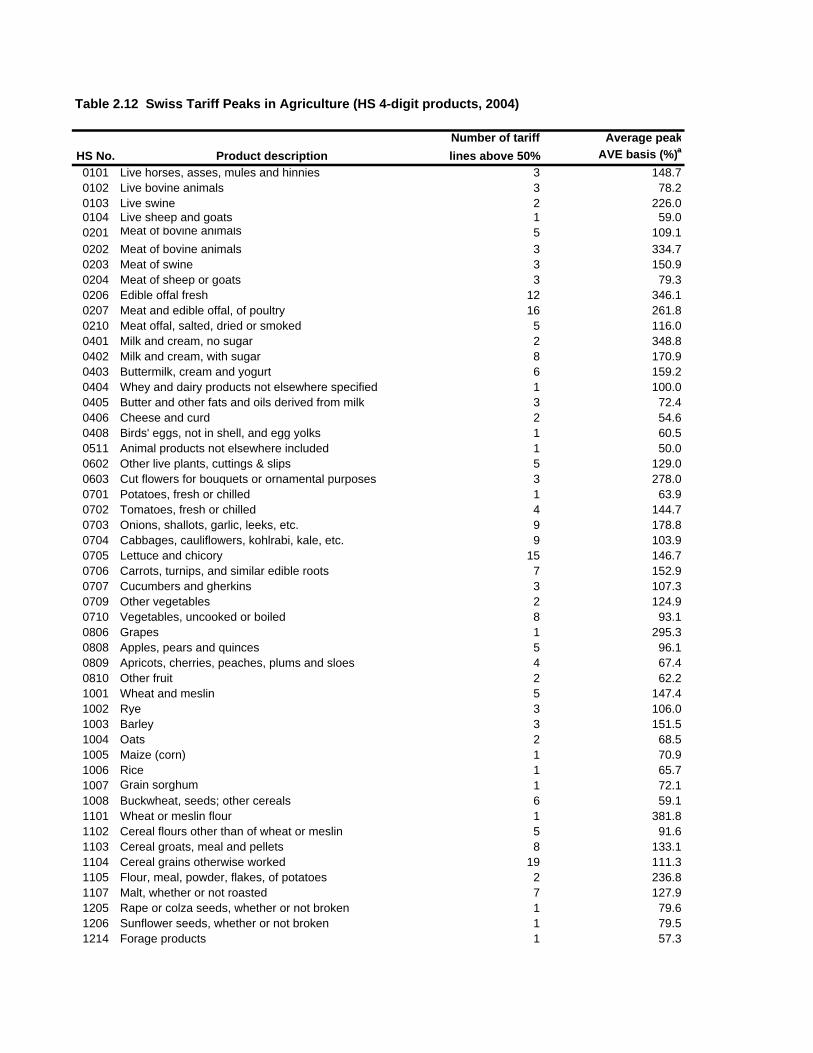
Table 2.12 Swiss Tariff Peaks in Agriculture (HS 4-digit products, 2004)
Number of tariff Average peaklines above 50% AVE basis (%)a
0101 Live horses, asses, mules and hinnies 3 148.70102 Live bovine animals 3 78.20103 Live swine 2 226.00104 Live sheep and goats 1 59.00201 Meat of bovine animals 5 109.10202 Meat of bovine animals 3 334.70203 Meat of swine 3 150.90204 Meat of sheep or goats 3 79.30206 Edible offal fresh 12 346.10207 Meat and edible offal, of poultry 16 261.80210 Meat offal, salted, dried or smoked 5 116.00401 Milk and cream, no sugar 2 348.80402 Milk and cream, with sugar 8 170.90403 Buttermilk, cream and yogurt 6 159.20404 Whey and dairy products not elsewhere specified 1 100.00405 Butter and other fats and oils derived from milk 3 72.40406 Cheese and curd 2 54.60408 Birds' eggs, not in shell, and egg yolks 1 60.50511 Animal products not elsewhere included 1 50.00602 Other live plants, cuttings & slips 5 129.00603 Cut flowers for bouquets or ornamental purposes 3 278.00701 Potatoes, fresh or chilled 1 63.90702 Tomatoes, fresh or chilled 4 144.70703 Onions, shallots, garlic, leeks, etc. 9 178.80704 Cabbages, cauliflowers, kohlrabi, kale, etc. 9 103.90705 Lettuce and chicory 15 146.70706 Carrots, turnips, and similar edible roots 7 152.90707 Cucumbers and gherkins 3 107.30709 Other vegetables 2 124.90710 Vegetables, uncooked or boiled 8 93.10806 Grapes 1 295.30808 Apples, pears and quinces 5 96.10809 Apricots, cherries, peaches, plums and sloes 4 67.40810 Other fruit 2 62.21001 Wheat and meslin 5 147.41002 Rye 3 106.01003 Barley 3 151.51004 Oats 2 68.51005 Maize (corn) 1 70.91006 Rice 1 65.71007 Grain sorghum 1 72.11008 Buckwheat, seeds; other cereals 6 59.11101 Wheat or meslin flour 1 381.81102 Cereal flours other than of wheat or meslin 5 91.61103 Cereal groats, meal and pellets 8 133.11104 Cereal grains otherwise worked 19 111.31105 Flour, meal, powder, flakes, of potatoes 2 236.81107 Malt, whether or not roasted 7 127.91205 Rape or colza seeds, whether or not broken 1 79.61206 Sunflower seeds, whether or not broken 1 79.51214 Forage products 1 57.3
HS No. Product description
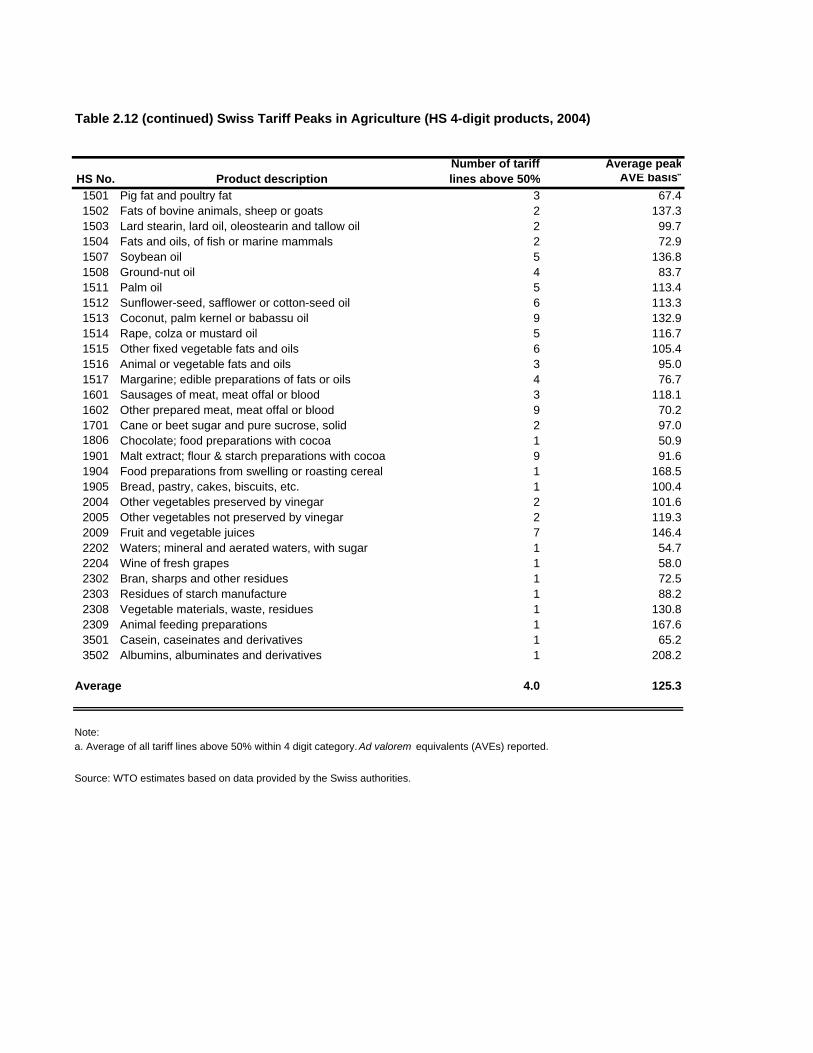
Table 2.12 (continued) Swiss Tariff Peaks in Agriculture (HS 4-digit products, 2004)
Number of tariff Average peaklines above 50% AVE basisa
1501 Pig fat and poultry fat 3 67.41502 Fats of bovine animals, sheep or goats 2 137.31503 Lard stearin, lard oil, oleostearin and tallow oil 2 99.71504 Fats and oils, of fish or marine mammals 2 72.91507 Soybean oil 5 136.81508 Ground-nut oil 4 83.71511 Palm oil 5 113.41512 Sunflower-seed, safflower or cotton-seed oil 6 113.31513 Coconut, palm kernel or babassu oil 9 132.91514 Rape, colza or mustard oil 5 116.71515 Other fixed vegetable fats and oils 6 105.41516 Animal or vegetable fats and oils 3 95.01517 Margarine; edible preparations of fats or oils 4 76.71601 Sausages of meat, meat offal or blood 3 118.11602 Other prepared meat, meat offal or blood 9 70.21701 Cane or beet sugar and pure sucrose, solid 2 97.01806 Chocolate; food preparations with cocoa 1 50.91901 Malt extract; flour & starch preparations with cocoa 9 91.61904 Food preparations from swelling or roasting cereal 1 168.51905 Bread, pastry, cakes, biscuits, etc. 1 100.42004 Other vegetables preserved by vinegar 2 101.62005 Other vegetables not preserved by vinegar 2 119.32009 Fruit and vegetable juices 7 146.42202 Waters; mineral and aerated waters, with sugar 1 54.72204 Wine of fresh grapes 1 58.02302 Bran, sharps and other residues 1 72.52303 Residues of starch manufacture 1 88.22308 Vegetable materials, waste, residues 1 130.82309 Animal feeding preparations 1 167.63501 Casein, caseinates and derivatives 1 65.23502 Albumins, albuminates and derivatives 1 208.2
4.0 125.3
Note:a. Average of all tariff lines above 50% within 4 digit category. Ad valorem equivalents (AVEs) reported.
Source: WTO estimates based on data provided by the Swiss authorities.
Average
HS No. Product description

Table 2.13 Swiss Over-Quota Tariff Rates for TRQ Imports (2004)
Average out-of- Fill ratiob
quota ratea (%) 2002 (%)01 Live horses, asses, mules and hinnies 85.6 8802 Live bovines 59.4 2,46503 Live swine 226.0 004 Live goats and sheep 46.4 11005 Meat (beef, sheep, goat, horse) 173.5 11506 Other meat (pork and poultry) 153.1 9607 Dairy products, in milk equivalent 71.7 8408 Casein 33.5 6009 Birds' eggs, in shell 34.2 8110 Dried egg products 36.8 9011 Other egg products 94.8 17012 Bull sperm 50.0 3,09513 Cut flowers 335.9 16114 Potatoes and products 80.7 13215 Vegetables 125.4 12616 Frozen vegetables 105.0 11917 Apples, pears, quinces, fresh 85.8 10918 Fresh apricots, cherries, plums, etc. 58.5 10919 Other fresh fruit 45.4 9020 Fruit for cider 78.4 6221 Products from fruit with pips 57.1 26922 Grapes for pressing and grape juice 143.3 8723 White wine in bottles 39.7 10624 Red wine, other than industrial wine 13.2 10625 White wine, in bulk 58.0 10626 Durum wheat, undenatured 199.7 9527 Bread and other cereals for human consumption 120.4 8228 Coarse grains for human consumption 112.6 60
Notes:
a. Averages are based on ad valorem equivalents.b. The fill ratio expresses imports as a percentage of in-quota import limit. A fill ratio above 100 percent indicates that the out-of quota tariff rates are determining prices within Switzerland.
Source: WTO Trade Policy Review of Switzerland and Liechtenstein (2004).
Quota No Product description

Average Free Lines Average Free Lines (%) (% of total) (%) (% of total)
Bulgaria 35.2 21.2 0.0 99.8Croatia 35.7 19.8 0.0 99.8EFTA 34.5 25.0 0.0 99.9European Union 34.6 22.0 0.0 99.3FYR of Macedonia 35.1 22.2 0.0 99.8Israel 34.7 25.2 0.0 99.8Jordan 35.2 21.9 0.0 99.8Mexico 35.4 25.1 0.0 99.8Morocco 34.9 23.9 0.0 99.8Faeroe Islands 36.1 17.2 0.0 99.8Romania 35.2 21.1 0.0 99.8Singapore 35.1 23.0 0.0 99.8Turkey 34.8 25.6 0.0 99.8West Bank and Gaza Strip 35.3 19.3 0.0 99.8
Generalized System of Preferences (GSP) 34.2 31.9 0.5 82.8Least-developed countries (LDCs) 24.1 45.8 0.0 99.8
MFN 36.2 15.9 2.3 18.0
Note: AVE refers to ad valorem equivalent of specific tariffs and non-tariff barriers.Source: WTO Secretariat estimates, based on data provided by the Swiss authorities.
Table 2.14 Swiss Preferential Tariffs by Country (AVEs, 2004)
Country or Group
Agriculture Non-agriculture

Table 2.15 Swiss Barriers on the Top 30 US Agricultural Exports (2004)
US Exports Cum.
(Sfr/100 kg) AVE (%) ($ millions) share
1 5201.00.10 Cotton; not carded or combed; length 25 to 28mm Free Free no 23.5 0.15 0.15
2 2401.20.80 Tobacco; flue-cured, threshed or similarly processed 25 3.7 no 19.2 0.13 0.28
3 2204.21.40 Wine of fresh grapes, alcoholic strength below 14% 24 26.9 yes c 13.7 0.09 0.37
4 2401.20.80 Tobacco; burley, threshed, stemmed/stripped 25 3.7 no 10.5 0.07 0.44
5 0205.00.00 Meat of horses, asses, mules 740 154.4 yes d 9.2 0.06 0.50
6 0709.20.00 Asparagus, fresh or chilled 370 56.9 yes e 7.0 0.05 0.54
7 0802.12.00 Almonds, fresh or dried, shelled Free Free no 6.0 0.04 0.58
8 0201.30.35 Meat of bovine animals, boneless 1210 183.2 yes d 4.8 0.03 0.61
9 3302.10.00 Mixture of odoriferous substance & mixture 37 1.6 no 4.8 0.03 0.65
10 3301.12.00 Essential citrus fruit oils 1 0.3 no 3.8 0.03 0.67
11 0806.20.00 Grapes, dried Free Free no 3.5 0.02 0.69
12 1515.90.80 Fixed vegetable fats and oils not chemically modified 153 33.8 no 3.4 0.02 0.72
13 0802.32.00 Walnuts, fresh or dried, shelled 19 1.6 no 2.7 0.02 0.73
14 3301.29.60 Essential oils, except those of citrus fruit 7 0.3 no 2.5 0.02 0.75
15 1006.30.10 Rice, semi-milled or wholly milled, parboiled 15 4.0 no 2.0 0.01 0.76
16 1006.20.40 Rice, long grain, husked (brown) 14 5.8 no 1.8 0.01 0.78
17 0804.10.00 Dates, fresh or dried 5 1.6 no 1.6 0.01 0.79
18 3301.19.00 Essential oils of citrus fruit 1 0.0 no 1.4 0.01 0.80
19 0511.10.00 Bovine semen 3 33.1 yes f 1.4 0.01 0.80
20 3301.24.00 Essential oils of peppermint 3 0.1 no 1.3 0.01 0.81
21 2401.20.80 Tobacco, partly or wholly stemmed/stripped 25 3.1 no 1.3 0.01 0.82
22 2005.80.00 Sweet corn Free Free no 1.3 0.01 0.83
23 3507.90.70 Enzymes; prepared, not elsewhere specified 24 1.1 no 1.1 0.01 0.84
24 0802.50.20 Pistachios Free Free no 0.9 0.01 0.84
25 0805.40.00 Grapefruit, fresh 2 1.82 no 0.9 0.01 0.85
26 2309.10.00 Dog & cat food 5.9 48.1 no 0.9 0.01 0.85
27 0202.20.60 Meat of bovine animals, with bone 721 132.6 yes d 0.8 0.01 0.86
28 1006.30.10 Rice, semi or wholly milled 15.3 4.0 no 0.8 0.01 0.86
29 1704.90.30 Sugar confectionery, not containing cocoa 103.5 31.5 no 0.7 0.00 0.87
30 4101.50.10 Raw hides & skins of bovine or equine, above 16kg Free Free no 0.7 0.00 0.87
Sub-total of top 30 agricultural products 133.4 0.87 0.87
Total agricultural products 151.6 1.00 1.00
Notes:a. Average of 6-digit level lines in the Swiss schedule, corresponding to US product at 6-digits level.b. The 6-digit level of the Swiss schedule lists a number of lines subject to quotas.c. See quotas no.23, 24 or 25 in table 3.d. See quota no.05 in table 3.e. See quota no.15 in table 3.f. See quota no.12 in table 3.
Sources: USDA Foreign Agricultural Service (2005) and Swiss Federal Customs Administration (2005).
ShareRank HS Code # Product Description Quotab
Tariff Ratea

Table 2.16 US Agricultural Exports that Fare Poorly in the Swiss Market a
Rank in US AVEagricultural 2001
HS code exports to EU (%)1201.00.00.40 Soybeans, whether or not broken 1 21.5 no2303.10.00.10 Corn gluten feed, whether or not in pellets 4 14.0 yesb
1001.90.20.55 Wheat and meslin, except seed, nesoi 8 118.7 yesc
0802.11.00.00 Almonds, fresh or dried, in shell (kg) 10 0.0 no0101.10.00.00 Purebred breeding horses and asses, live * 17 n.a. yesd
0101.90.10.00 Horses, live, except purebred breeding * 20 n.a. yesd
Notes:a. US exports of the product are not in the top 30 of US agricultural exports to Switzerland.b. See Quota No. 28 in Table 2.18.c. See Quota No. 26 in Table 2.18.d. See Quota No. 01 in Table 2.18.
Source: USDA Foreign Agricultural Service (2004).
QuotasProduct
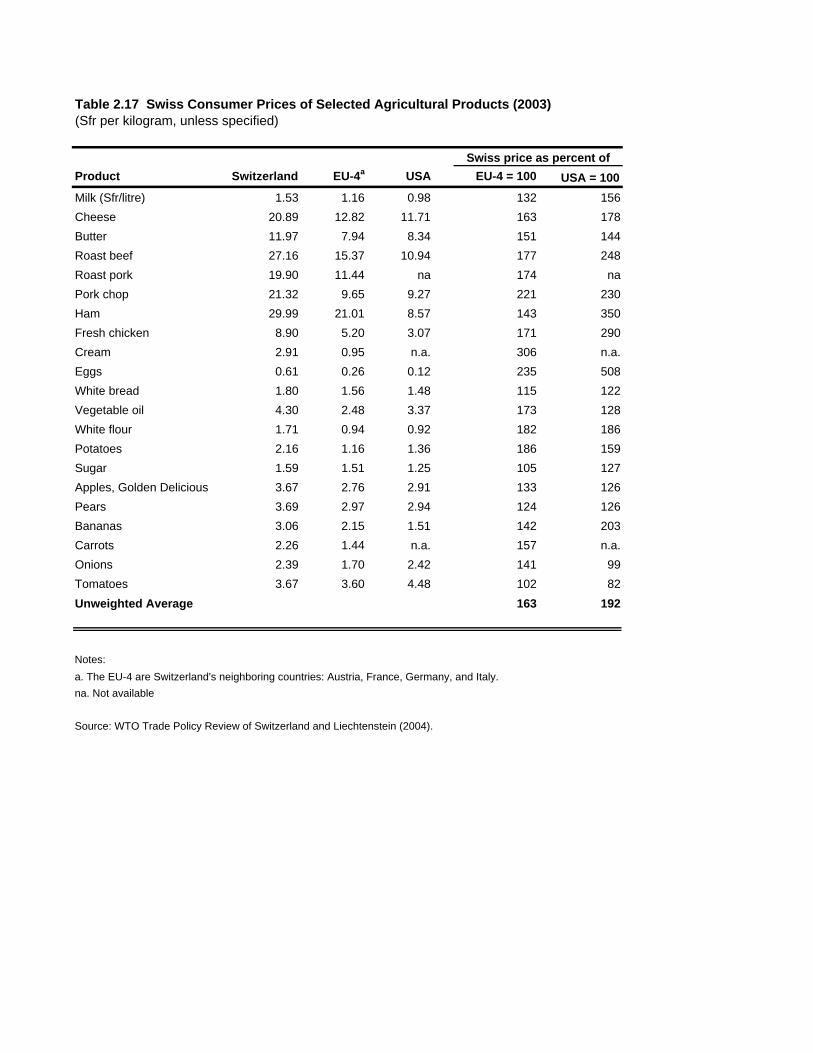
Table 2.17 Swiss Consumer Prices of Selected Agricultural Products (2003)(Sfr per kilogram, unless specified)
Product Switzerland EU-4a USA EU-4 = 100 USA = 100Milk (Sfr/litre) 1.53 1.16 0.98 132 156Cheese 20.89 12.82 11.71 163 178Butter 11.97 7.94 8.34 151 144Roast beef 27.16 15.37 10.94 177 248Roast pork 19.90 11.44 na 174 naPork chop 21.32 9.65 9.27 221 230Ham 29.99 21.01 8.57 143 350Fresh chicken 8.90 5.20 3.07 171 290Cream 2.91 0.95 n.a. 306 n.a.Eggs 0.61 0.26 0.12 235 508White bread 1.80 1.56 1.48 115 122Vegetable oil 4.30 2.48 3.37 173 128White flour 1.71 0.94 0.92 182 186Potatoes 2.16 1.16 1.36 186 159Sugar 1.59 1.51 1.25 105 127Apples, Golden Delicious 3.67 2.76 2.91 133 126Pears 3.69 2.97 2.94 124 126Bananas 3.06 2.15 1.51 142 203Carrots 2.26 1.44 n.a. 157 n.a.Onions 2.39 1.70 2.42 141 99Tomatoes 3.67 3.60 4.48 102 82Unweighted Average 163 192
Notes:
na. Not available
Source: WTO Trade Policy Review of Switzerland and Liechtenstein (2004).
Swiss price as percent of
a. The EU-4 are Switzerland's neighboring countries: Austria, France, Germany, and Italy.

Table 2.18 Production, Consumption and Support of the Agricultural Sector (2004)
Switzerland United States(Sfr. billions) ($ billions)
Total value of production (at farm gate) 7.3 225.4Total value of consumption of domestic produce (at farm gate)a 8.9 206.6Total value of agricultural importsb 8.9 47.4
Total Support Estimate (TSE) 7.8 108.7Producer Support Estimate (PSE) 7.2 46.5 of which Market Price Supports 4.0 16.2General Services Support Estimate (GSSE) 0.5 34.1
Share of Production (%)Total Support Estimate (TSE) 87% 53%Producer Support Estimate (PSE) 81% 23% of which Market Price Supports 45% 8%General Services Support Estimate (GSSE) 0.1 0.2
Notes: a. Does not include importsb. 2003 CIF import values
Sources: OECD PSE/CSE database (2004), USDA Foreign Agricultural Service (2004) and USDA Grain Report E34042 (2004). Exchange rates were obtained from the IMF.
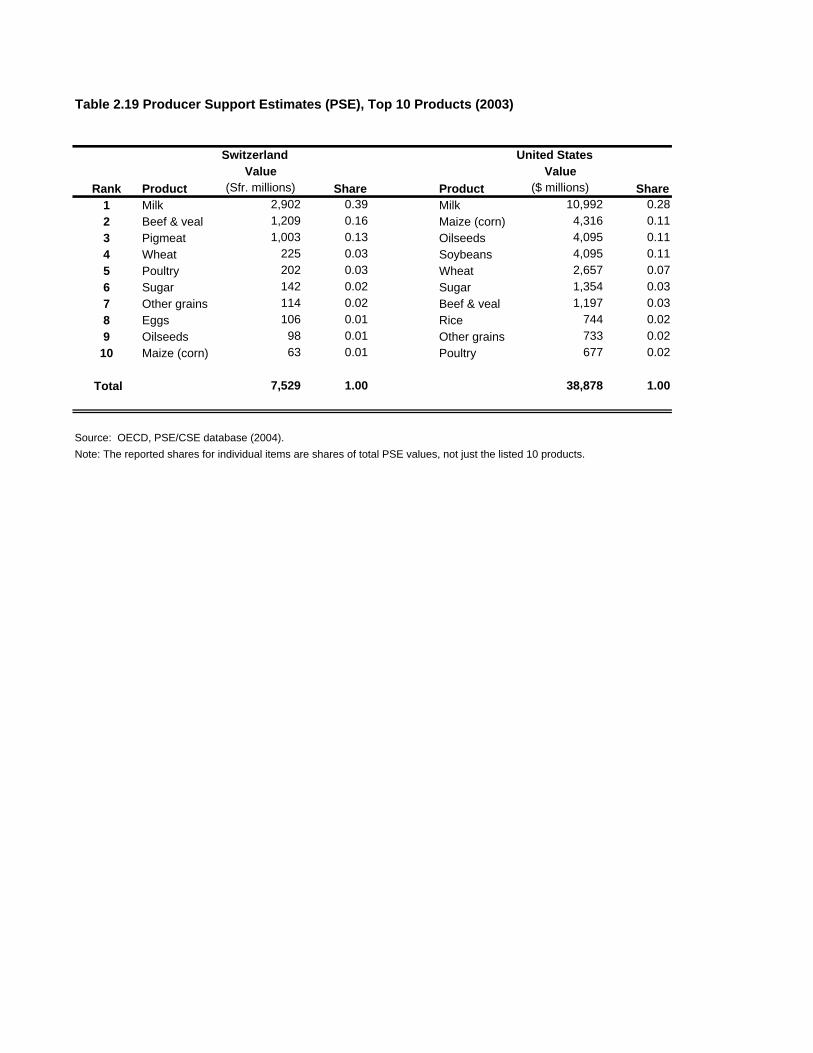
Table 2.19 Producer Support Estimates (PSE), Top 10 Products (2003)
Value Value(Sfr. millions) ($ millions)
1 Milk 2,902 0.39 Milk 10,992 0.28 2 Beef & veal 1,209 0.16 Maize (corn) 4,316 0.11 3 Pigmeat 1,003 0.13 Oilseeds 4,095 0.11 4 Wheat 225 0.03 Soybeans 4,095 0.11 5 Poultry 202 0.03 Wheat 2,657 0.07 6 Sugar 142 0.02 Sugar 1,354 0.03 7 Other grains 114 0.02 Beef & veal 1,197 0.03 8 Eggs 106 0.01 Rice 744 0.02 9 Oilseeds 98 0.01 Other grains 733 0.02
10 Maize (corn) 63 0.01 Poultry 677 0.02
Total 7,529 1.00 38,878 1.00
Source: OECD, PSE/CSE database (2004).Note: The reported shares for individual items are shares of total PSE values, not just the listed 10 products.
Switzerland United States
Rank Product Share Product Share

Table 2.20 Composition of Producer Support Estimates (PSE), 2003a
(Average percentage share in total value of PSE)
Type of payment Switzerland United States OECDMarket price supports b 57 38 62Based on output 5 8 4Based on area planted/animal numbers 13 5 16Based on historical entitlements 17 13 4Based on input use 4 19 9Based on input constraints 2 5 3Based on overall farm income 0 6 2Miscellaneous 3 0 0Counter cyclical c -- 6 --Producer support estimate (PSE) 100 100 100
Notes: a. Provisional figuresb. Market price supports reflects the impact of tariffs on domestic pricesc. Reported only for US data
Source: OECD, PSE/CSE database (2004).

THE SHAPE OF A FREE TRADE AGREEMENT BETWEEN SWITZERLAND AND THE UNITED STATES
Chapter 3
ISSUES LINKED TO AGRICULTURE
Sanitary and phyto-sanitary (SPS) and geographic indication (GI) issues are both closely
related to agricultural trade. Though SPS and GI measures reflect non-trade-related
objectives -- notably ensuring animal and human health and safeguarding know-how and
high standards of product quality-- at times, they are viewed as behind-the-border or non-
tariff barriers. The United States and Switzerland have searched for common ground on
SPS and GI issues both in the framework of the WTO and with their bilateral FTA
partners. However, both countries have well-established doctrines, and their differing
stances are buttressed both by commercial interests and entrenched bureaucracies.
These differences have led, on a few occasions, to disputes between Switzerland and the
United States. This chapter illuminates regulatory differences and examines US and
Swiss approaches to SPS and GI issues. We address SPS measures first and then focus
on GI issues. At the end of each section, we offer recommendations.
3.1 Sanitary and Phyto-sanitary Measures
SPS measures are sometimes viewed as behind-the-border trade barriers. The WTO
Trade Policy Review on the United States, for example, cites “actions targeted to
safeguard consumer health [as] one of the most frequent reasons behind most US
1

quantitative restriction and controls on trade.” Likewise, some countries, including the
United States, have voiced concerns of certain SPS measures implemented by
Switzerland.
Modern FTAs have typically addressed SPS matters. The Swiss-US FTA will also have
to tackle this topic, if it is to be a forward-looking agreement. In the following sections
we present each country’s approach to dealing with SPS matters in past trade agreements.
Then we discuss current SPS issues, labeling issues, and standard issues that affect
agricultural trade. Finally we offer recommendations for addressing these matters in the
Swiss-US FTA. Unlike the section on GIs, we do not describe the SPS regimes of each
country. This has been done already and in detail by the WTO in its Trade Policy
Reviews (TPRs) for both countries.
A. SPS Measures in US Trade Agreements
The United States has addressed SPS matters through various approaches that include --
on top of WTO multilateral agreements-- bilateral free trade agreements, veterinary
agreements, memoranda of understanding; and institutionalized dialogue. Here we
present a general overview of the US negotiating stance on SPS matters. Appendix B
deals with the fine print of the SPS chapters in selected US bilateral FTAs, veterinary
agreements, and memoranda of understanding.
The SPS chapter in the NAFTA constitutes the most comprehensive set of commitments
so far agreed by the United States on a bilateral basis. NAFTA SPS provisions encourage
2

equivalent SPS measures and the use of international or North American standards for
risk assessment; it establishes rules regarding pest-free areas; and it requires transparency
in the adoption and modification of SPS measures. At the same time, the NAFTA
reaffirms the right of each party to adopt the level of SPS protection that it considers
necessary. However measures must be based on scientific principles and proper risk
assessment; they must be applied only to the extent necessary to secure the desired level
of protection; and they should not result in unfair discrimination. (For more detail on
NAFTA’s SPS provisions, see Appendix B.)
Recent US bilateral FTAs are generally less ambitious in their treatment of SPS
questions, though bilateral agreements differ one from another. In FTA negotiations, the
primary US interest in agriculture matters has been the reduction of traditional tariff and
quota barriers, and SPS issues have received secondary attention. The United States has
concentrated on outstanding SPS issues rather than raise new issues of possible future
concern. By contrast, US partners often put a higher priority on SPS issues. The US
Animal and Plant Health Inspection Service (APHIS) concludes that SPS issues typically
raised by US partners “exceed the number of issues that APHIS can realistically deal with
given other priorities.”1
Reflecting the US negotiating stance, US bilateral FTAs generally reaffirm the parties’
obligations under the WTO SPS Agreement and establish the WTO dispute settlement
mechanism as the appropriate body for bilateral SPS disputes. Since SPS chapters in
1 APHIS Trade Support Team. Technical Trade Report, July 2004.
3

recent US bilateral FTAs create no new SPS rights or obligations, US officials believe
that there is no need for a bilateral dispute settlement mechanism.
In most negotiations, the United States and its negotiating partner instead established an
ad hoc special group to focus on outstanding SPS issues.2 The special groups worked to
find technical solutions to specific SPS measures prior to Congressional ratification of the
free trade agreement. Some of these groups made considerable progress.3
The United States views the actual existence of irritating SPS measures as a pre-requisite
to the establishment of ad hoc bodies.4 As pointed out later in this section, such irritants
appear to exist in the context of bilateral trade relations between the United States and
Switzerland. Examples of concrete SPS issues addressed by previous SPS bodies include:
recognition of equivalence of regulatory requirements for specific products; mutual
recognition of inspection systems; recognition of “pest-free status;” and acceptance of
product inspection in the exporting country.5
The SPS chapters in US bilateral FTAs often establish bodies, named SPS Committees,
with a view both towards shared understanding of regulatory procedures and resolving
outstanding bilateral SPS issues. These bodies continue the efforts of the ad hoc working
2 For the most part, ad hoc SPS groups were not considered “negotiating groups,” though they held meetings in the same time frame as negotiating groups. 3 For example, the ad hoc special group on SPS matters established for the US-Chile negotiations resolved several outstanding issues (see Appendix B). 4 The “lack of substantive issues” was cited as the reason for the US reluctance to establish formal mechanisms to address SPS measures with Morocco. 5 Appendix B gives more information.
4

groups formed during the negotiations (e.g., US-Chile FTA, US-Australia FTA, CAFTA-
DR). An important exception was the US-Morocco FTA: due to the relatively small
volume of bilateral agricultural trade and the low frequency of bilateral SPS issues, the
agreement did not establish an SPS Committee.
Though SPS Committees are not decision-making bodies, they are expected to “provide a
forum for the parties to engage at the earliest appropriate time in each other’s regulatory
processes on [technical and scientific aspects] and to cooperate in developing science
based measures that facilitate trade between them.”6 The US-Australia FTA contains
some of the strongest language on the attributes of an SPS Committee, mandating it to
review progress and resolve specific SPS matters.
US authorities sometimes cite different levels of SPS infrastructure in partner countries as
an impediment to progress in dealing with outstanding SPS issues. US officials argue that
countries without strong SPS infrastructure cannot demonstrate an ability to meet the
requirements of US SPS regulations or that they have fully implemented the WTO
agreement.7 This is evidently not the situation of Switzerland. But it is worth noting that
FTA negotiations with countries that enjoy stronger SPS infrastructure, such as Chile and
Australia, delivered comparatively better results.
6 APHIS Trade Support Team, Technical Trade Report. July 2004 7 Negotiations with countries having a relatively poor SPS infrastructure often involve some commitment of US aid to upgrade the local SPS regime.
5

The US-EU Veterinary Agreement also establishes a similar committee to oversee SPS
matters. However, the scope of this committee reflects the more limited nature of the
agreement, which is largely confined to trade in certain live animals and bovine and
swine meat. For these products, the agreement recognizes the equivalence of regulatory
requirements, and the health status of regions as determined by the exporting country.8 In
the context of the Positive Economic Agenda Initiative, the United States and the
European Union have also addressed outstanding SPS matters on products not covered by
the Veterinary Agreement.
The United States has also dealt bilaterally with SPS issues through memoranda of
understanding (MOU). Some memoranda establish consultative committees on
agriculture, with mandates to resolve trade issues and increase cooperation in a number of
areas, including sanitary and phytosanitary measures.
B. SPS Measures in Swiss Trade Agreements
Switzerland has dealt with SPS matters at the multilateral, regional and bilateral level. At
the multilateral level, Switzerland has implemented the SPS Agreement under the WTO
Agreement. At the regional level, it has made substantial progress in harmonizing its SPS
regime with the European Union. At the bilateral level, as an EFTA member, Switzerland
has reaffirmed its commitments under the WTO.
8 The recognition of the health status of regions as determined by the exporting country is limited to the list of diseases included in Annex III. BSE is not listed in that annex. Nevertheless, the most recent EU report on US Barriers to Trade and Investment argues that, “the United States has failed repeatedly to apply the regionalization provisions of the Veterinary Agreement.”
6

Switzerland’s decision to harmonize aspects of its SPS regime with the European Union
has to be seen as an important component within the broader context of special relations.
The European Union is the principal source of Swiss imports and destination for Swiss
exports.9 Switzerland has fostered economic integration with its neighbors, but has
stopped short of full membership in the European Union. Formal links between the
European Union and Switzerland are governed by a large number of agreements; indeed,
no other third country has as many agreements with the European Union in place as
Switzerland.10 In addition to facilitating trade, the harmonization of SPS regimes in
Europe has promoted the adoption of international standards. There are very few
regional phyto-sanitary standards left in Europe that differ from the International Plant
Protection Convention (IPPC) standards and procedures.
Annexes 4 and 6 (on plant health and seeds) and Annex 11 (veterinary annex) in the
Swiss-EU Bilateral Agreement on Agriculture regulate trade in certain plants, seeds, live
animals, animal products, foods of animal origin, and animal waste. Both annexes
recognize the equivalence of SPS protection levels resulting from the parties’ domestic
legislation for many of these products, notably dairy items. Additionally, Annex 5 (on
feed products) in the Swiss-EU Bilateral Agreement on Agriculture aims to recognize
legislative equivalence so as to facilitate trade in feed products. This annex, however, is
still under negotiation.
9 In 2004, the European Union was the destination for more than 60 percent of Swiss exports and the source of nearly 80 percent of Swiss imports.
10 Switzerland’s European Policy is explained in the following website: http://www.europa.admin.ch/.
7

The veterinary annex eliminates border checks. Controls other than mere inspection of
accompanying certificates will now be conducted within the country. The annex on plant
health also limits the scope of border checks to low percentages of consignments. Plants
designated under Annex 4 will obtain a “plant passport” certifying conformity with
domestic legislation.
When the agreement entered into force in June 2002, the recognition of equivalence of
legislation did not apply to all the products covered under the agreement. For example,
milk and dairy products where the only foods of animal origin for which the European
Union recognized the equivalence of Swiss legislation. Progress in recognizing
equivalence of SPS legislation for a number of products required the adaptation of certain
aspects of Swiss legislation to the format and substance of EU legislation.11
The application and functioning of Annexes 4, 6 and 11 of the agreement will be
overseen by Joint Committees. A working group on BSE was established by the Joint
Committee under the Veterinary Annex to analyze alternatives to the EU ban on Swiss
exports of cattle. At the end of 2003, the EU Council of Agricultural Ministers
recognized the equivalence of Swiss regulations regarding BSE.
Recent bilateral FTAs negotiated by EFTA include, for the most part, much weaker
approaches to tackling SPS matters. SPS provisions in many EFTA agreements involve
11 See the section on SPS measures of the 2004 WTO Trade Policy Review on Switzerland and Liechtenstein.
8
reaffirmation of the WTO agreement; commitments to apply SPS regulations in a non-
discriminatory fashion; and pledges not to introduce new measures that may have the
effect of “unduly obstructing trade.” The EFTA approach to SPS matters probably
reflects the absence of outstanding SPS issues and the small volume of bilateral
agricultural trade between EFTA and its partners. Also, agricultural liberalization has not
been a high concern for Switzerland in its bilateral FTAs through EFTA, as evidenced by
the low wedge between applied preferential and MFN tariff rates. (Appendix B gives
more detail on the bilateral EFTA agreements.)
The EFTA-Chile FTA goes beyond other EFTA bilateral FTAs as parties pledge to
strengthen their cooperation in the field of SPS measures with a view towards increasing
the mutual understanding of their respective systems. The EFTA-Chile EFTA also
establishes an ad hoc mechanism to review SPS measures that parties believe have an
effect on market access. Still the text establishing that mechanism is weaker than similar
mechanisms established in US bilateral FTAs.
Summing up, the US and Swiss approach to SPS matters on bilateral FTAs share a
number of important similarities. Leaving aside the Swiss relation with the European
Union, both countries have avoided introducing new SPS-related rights and obligations in
bilateral agreements, as they both believe that the WTO remains the central forum for the
discussion of SPS rights and obligations and settling SPS disputes. The United States,
however, favors SPS chapters that reflect a stronger commitment to dealing with
outstanding bilateral SPS issues. In this respect, it is worth highlighting the EFTA-Chile
9

FTA as an important precedent for EFTA efforts to address SPS measures. The Swiss-
US FTA should include similar commitments. With that objective in mind, we turn now
to a review of issues that need to be tackled.
C. Outstanding SPS Issues on the Bilateral Swiss-US Agenda
Given that the United States and Switzerland both view the WTO as the central forum for
discussing SPS matters, it is important to recognize that many outstanding SPS issues on
the bilateral agenda are already being addressed. For example, in the WTO both countries
are currently engaged in reaching common approaches on hormone-treated beef,
genetically modified organisms, and process and production methods (PPM).
FTA negotiations between Switzerland and the United States could search for common
ground on these topics. It is nonetheless unrealistic to expect that the FTA itself can
resolve these issues. Recognizing this fact need not devalue the SPS chapter in the
Swiss-US FTA. We first review the most relevant SPS issues on the bilateral agenda,
and then recommend ways to address them.
Some US products derived from biotechnology face case-by-case Swiss approval,
requiring detailed information on the process for creating biotech products. Swiss
certificates for approval of agricultural biotechnology products are valid for five years,
and then must be renewed. Under this system, some US firms, such as those in the animal
10

feed industry, have enjoyed market access for bio-engineered products; however other
firms, such as those in the creation of biotech crops, face difficult approval hurdles.12
The United States considers that Swiss regulations on meat from animals treated with
hormones, antibiotics and similar products are not based on sound science or proper risk
assessment. Moreover, the United States argues that, since tougher requirements are
applied to out-of-quota meat imported under the TRQ, there is a question mark, on the
validity of the public health objective.13
Some US producers complain that the Swiss Veterinary Agency refuses to list new US
meat-packing facilities as eligible to export beef to Switzerland. The USTR mentions that
“despite repeated requests, [Switzerland] has not produced science-based reasons for this
position. Swiss inaction has blocked three plants that the United States requested be listed
since early 2002.”14
12 Even so, the most significant barriers for biotechnology products in Switzerland stem from the attitudes of highly skeptical consumers, farmers and food retailers --not the Swiss government. In recent years, a coalition of environmental groups, consumers and farmers has actively petitioned for a five-year moratorium on genetically modified (GM) crops in Switzerland. This petition has been twice rejected by the Swiss Parliament on grounds that the existing legislation adequately protects humans, animals and the environment. However, the initiative will go to popular vote in November 2005. 13 See WTO documents G/SPS/GEN204R4.doc and G/SPS/GEN204R5.doc 14 For further details on this see the USTR 2005 report at: http://www.ustr.gov/assets/Document_Library/Reports_Publications/2005/2005_NTE_Report/asset_upload_file119_7500.pdf15 In the context of the Doha Round, Switzerland has advocated stronger labeling requirements. The Swiss proposal would increase consumer information to encompass production methods, food safety, and animal protection. Switzerland believes that consumers need more information so they can make choices based on ethical and moral
11

A potential source of disagreement might result from Switzerland’s sympathy for the
precautionary principle as a legitimate risk management approach to protect human,
animal, and plant health.16 Powerful players in the US private sector17 are highly
skeptical of the precautionary principle, and the US government “has often charged
against its implementation.”18 However, it is important to recall that currently no
bilateral SPS issues have resulted from Swiss SPS measures based on the precautionary
principle. In fact, Switzerland has not invoked the precautionary principle in its SPS
system, and though the possibility is not foreclosed, differences regarding the application
of this principle should not stand in the way of successful negotiations. Both Switzerland
and the United States have avoided discussion of the rights and obligations raised by the
precautionary principle in their previous FTA negotiations.
convictions, as well as taste. Switzerland argues that these information needs extend to the identification of GMOs, respect for the environment, and animal welfare. All this would entail a revision of the SPS Agreement. 16 The Swiss Agricultural Act revised as part of the 2007 Agricultural Policy defines the precautionary principle as follows:
“Precautionary measures may be adopted if it appears plausible that a farming product or plant material, which can be a carrier of particularly dangerous pests, can have an unacceptable side-effect for human, animal or plant health or the environment, and the likelihood of occurrence is assessed as considerable or the corresponding consequences are far-reaching yet the scientific information for a comprehensive risk assessment of the agricultural product or plant material is insufficient.”
17 The US Chamber of Commerce’s (AmCham) strategy is to “oppose the domestic and international adoption of the precautionary principle as a basis for regulatory decision making.” US Chamber of Commerce. “Precautionary Principle,” Available on-line at http://www.uschamber.com/issues/index/regulatory/precautionaryprinciple.htm. Last modified: May 2004. Last visited: June 14th, 2005. 18 Graham, John D. “The Perils of the Precautionary Principle: Lessons from the American and European Experience.” (Available on-lines at http://www.whitehouse.gov/omb/inforeg/speeches/031020graham.pdf).
12

Meanwhile, Switzerland objects to US import restrictions on meat and meat products.
Following the outbreak of Bovine Spongiform Encephalopathy (BSE or mad cow
disease) in Switzerland, the United States banned imports of Swiss meat and meat
products.19 The Swiss government questions many elements in that US measure: the
disregard of international standards; the application of a double inspection procedure; the
US failure to recognize that Switzerland had a low incidence of BSE, as well as its failure
to stick to the agreed “road map”.20 Furthermore, the Swiss government believes that the
US measure is unwarranted now that original circumstances have changed and home-
grown cases of BSE have been discovered in the United States. As further evidence of the
tension between the measure and current circumstances, Swiss authorities note that
nowadays Switzerland and the United States share the same World Organization for
Animal Health (OIE) category with regards to BSE risk.21
In previous FTAs, such as the US-Australia FTA, the United States has agreed to work
towards common solutions on BSE risk to food safety and animal health in Codex and
other forums. More recently, the United States has recognized Canada as a “minimum-
risk country.” The recent discovery of the first home-grown case of BSE in the United
States should advance the effort to find common ground on BSE quarantine measures.
19 See WTO document G/SPS/GEN/321. 20 Switzerland is not the only country to voice concerns regarding BSE related measures in the United States. The European Union largely shares the Swiss views, while Canadian authorities have criticized the United States for “slow rule-making to resume trade in live cattle.” 21 OIE is a French acronym that stands for Office International des Epizooties.
13
The WTO Secretariat reports that, “bilateral consultations had clarified some of the
[BSE] questions raised by Switzerland. [However] the United States noted that there was
a further complication pertaining to the Foot and Mouth Disease status of certain
countries providing meat to Switzerland for processing and subsequent export to the
United States.” 22
Another Swiss concern relates to the tighter US food safety requirements under the
Bioterrorism Act of 2002.23 A number of Swiss exporters have been affected by measures
related to its implementation. The 2004 Report on Foreign Economic Policy, delivered by
the Swiss Economic Secretariat for Economic Affairs to the Federal Council, notes
difficulties both in the process of approval of Swiss food consignments to the United
States, and in the treatment of confidential records regarding exported products.24
Despite differences, these various SPS issues on the bilateral agenda do not appear to
pose a major obstacle to an FTA between Switzerland and the United States. The
Agricultural Attaché of the US Mission to the WTO reports: “there are some US concerns
with SPS relative to Swiss market access, but generally these concerns have been at a
22 See documents /G/SPS/GEN204R4.doc and /G/SPS/GEN204R5.doc 23 The Act introduces new requirements, including registration of food manufacturing facilities; prior notice to FDA of all food consignments; maintenance of records regarding distribution of food; and permission to detain any food that is suspected of posing a threat to the health of humans or animals. Additional information on the Bioterrorism Act is available at http://www.fda.gov/oc/bioterrorism/bioact.html. 24 The report states: “Les programmes de lutte contre le bioterrorisme (formalités pour les importations de produits alimentaires), l’initiative des conteneurs (annonce 24 heures à l’avance pour le fret maritime) et l’application de nouvelles procédures pour entrer aux Etats-Unis ont eu des répercussions en Suisse. Des difficultés sont apparues dans l’expédition des denrées alimentaires et dans le traitement des données confidentielles transmises par les cargos.”
14

much lower level compared with other neighboring European country policies.”25 Swiss
authorities have also been more accommodating than neighboring European countries in,
for example, providing access for US beef with growth promoter treatment and allowing
access for US poultry products packed under current US water treatment methods.
D. Labeling and Equivalent Standards 26
Switzerland and the United States disagree as to the adequate scope of labeling
requirements for certain agricultural products. While Switzerland favors a consumer
“right-to-know” rationale for labeling, the United States believes that labels are only
justified for safety related issues. The positions of both governments reflect the attitudes
of domestic constituencies. A large and visible segment of the Swiss public supports
strong regulation, including labeling requirements, particularly for products derived from
biotechnology. By contrast, consumer research in the United States shows that while a
substantial majority of American consumers want more information about their food
(including genetically engineered products), biotechnology labeling is rarely mentioned
unless consumers are specifically asked. Meanwhile, agricultural firms fear that
additional labeling requirements will be effectively turned into campaigns against their
products. The basic disagreement on the proper content of labels has affected market
access: US agricultural producers have found increasing difficulty in accessing the Swiss
25 Information gathered through exchange of e-mails. 26 While we address standards and technical barriers more generally in chapter 4 on manufactures trade, this section presents two standards and TBT issues are intimately related to trade in agricultural products and could be examined in the context of a Swiss-US FTA, namely labeling measures and the mutual recognition of standards with regards to organic products.
15

market, and the US government has raised concerns over specific Swiss mandatory
labeling requirements.
The United States has questioned Swiss labeling requirements for foodstuffs not
produced according to certain Swiss standards. Special labeling requirements apply to
beef, pork, and eggs when production includes the use of growth hormones, antibiotics,
and certain other substances in the raising of beef and pork or, in the case of eggs, the
manner of caging.27 Swiss authorities, however, claim that the United States has failed to
pursue the bilateral consultations that took place on the issue of foodstuff process and
production methods (PPM).
Switzerland and the United States have addressed labeling issues in the WTO Doha
Round and in other international forums, but their positions continue to differ. Their
respective positions in the WTO illustrate the divide.
In the WTO Doha Round agricultural negotiations, Switzerland has questioned whether
the current TBT agreement sufficiently addresses the needs of consumers. Switzerland
backs more stringent labeling requirements on production methods, particularly with
27 In the context of the Doha Round, Switzerland has advocated stronger labeling requirements. The Swiss proposal would increase consumer information to encompass production methods, food safety, and animal protection. Switzerland believes that consumers need more information so they can make choices based on ethical and moral convictions, as well as taste. Switzerland argues that these information needs extend to the identification of GMOs, respect for the environment, and animal welfare. All this would entail a revision of the SPS Agreement.
16

regard to presence of GMOs, and respect for the environment and animal welfare. In the
Swiss view, proper labeling will allow consumers to make informed choices based on
their own preferences, and their ethical and moral convictions.
The United States, does not object to a “right to know” policy per se, but it does object to
labeling requirements that are independent of the product risk assessments and lack
scientific justification. The United States believes that labeling requirements designed
solely in response to moral and ethical concerns will impose additional costs for the food
and feed supply chain, and may sharply limit the world market for US agriculture.
A more tractable and somewhat related issue – one that could be tackled in FTA talks --
is the equivalence of standards for organic products. In previous US FTA pacts, the
parties have agreed to give positive consideration to accepting, as equivalent, each other's
technical regulations, provided they are satisfied that they adequately fulfill the objectives
of domestic regulations. However, imported organic agricultural produce may only be
sold, labeled or represented in the United States as organic when: (i) it is certified by a
US Department of Agriculture (USDA) accredited certifying agent; (ii) the USDA
recognizes the ability of a foreign governments to assess and accredit certifying agents as
meeting the requirements of the USDA National Organic Program (NOP); or (iii) USDA
has determined a foreign government’s organic certification program to be equivalent to
the NOP. Currently, two USDA accredited certifying agents operate in Switzerland.
17

Likewise, imported organic products must meet the minimum requirements laid down in
the Swiss Federal Ordinance on Organic Farming and the Labelling of Organically
Produced Products and Foodstuffs in order to be labeled “organic” in Switzerland.
Organic imports originating in countries whose regulation is not recognized as equivalent
to Swiss legislation need to be registered with an approved Swiss certification/inspection
body in order to demonstrate their compliance with Swiss legislation. Switzerland does
not recognize the USDA National Organic Program (NOP) as equivalent, but it has
granted import permits for a few US organic products on an individual basis.
Trade in organic products would be facilitated if both countries could, within the context
of the FTA, establish equivalent standards for organic products. Moreover, it could level
the playing field with third countries that already have established equivalence of organic
standards with Switzerland or the United States. The United States has already
recognized conformity assessment systems in Canada (Quebec and British Columbia
only), Denmark, Israel, Japan, New Zealand, and the United Kingdom; and it is working
towards recognizing Spain and the rest of Canada. The United States is also working
towards establishing the equivalence of organic standards with Australia, Japan, India,
and the European Union. Switzerland has established equivalence of the production rules
and inspection systems for certain organic products from Argentina, Australia, Costa
Rica, all members of the European Union, Israel, and New Zealand.28
E. Recommendations for SPS and Related Issues
28 Ordinance on Organic Farming (910.181) of 22. September 1997. Available on-line at: http://www.admin.ch/ch/f/rs/910_181/index.html.
18

• Negotiators should recognize that while some outstanding issues may be
addressed in the context of a Swiss-US FTA, others are best left to the WTO.
This is particularly true for issues that engage core principles in each country’s
approach towards SPS.
• Switzerland and the United States both have veterinary agreements with the
European Union, and Switzerland has plant health and seed agreements. Given
the central role of the European in SPS matters, both for the United States and
Switzerland, it makes sense for the Swiss-US FTA to borrow heavily from the
best parts of their respective EU agreements. In particular, both countries could
build on their prior recognition of equivalency between their own SPS measures
and those adopted by the European Union for live animals, meats, foods of animal
origin, and plants.
• As a separate matter, the United States and Switzerland should reach an
understanding on BSE. As in the US-Australia FTA, the United States and
Switzerland should agree to work cooperatively in the Office International des
Epizooties (OIE), Codex, and other appropriate forums to ensure consistency in
the standards and guidelines relating to BSE. Also the United States should
instruct its responsible agencies to work towards recognizing, with the shortest
possible delay, Switzerland as “minimum-risk country.”
19

• As in the US-Australia FTA, Switzerland and the United States should establish
both an SPS Committee and a Standing Technical Working Group on Animal and
Plant Health Measures. Meeting at a senior level, the SPS Committee should
have two broad mandates: to further mutual understanding about national SPS
regulatory processes, and to promote the convergence of US and Swiss SPS rules,
giving appropriate consideration to EU rules
• The Working Group should be instructed to thrash out conflicting animal, meat,
and plant standards and tests. To the maximum extent, the Working Group
should resolve mutual recognition of animal, meat and plant tests conducted in the
exporting country. Whenever possible, Working Group members should be the
same persons who handle the Swiss-EU and the US-EU files on SPS questions.
• Certain issues should be awarded priority attention in the Working Group: US
BSE measures; Swiss certification of US slaughter plants; and labeling
requirements that provide information on production methods, food safety, and
animal protection.
• In addition, the SPS Committee should evaluate the approval hurdles faced by US
firms that ship biotech foodstuffs to Switzerland. It should also evaluate Swiss
concerns stemming from the US implementation of the Bioterrorism Act.
However, in dealing with these matters, representatives from both countries may
sometimes find rather limited scope for accommodation, as differences may
20

spring from fundamental societal choices. In such instances, the SPS Committee
could still contribute to mutual understanding of each country’s regulatory
processes.
• The WTO is perhaps the most natural forum where a solution can be reached that
takes into account the global context of the labeling issue. However, the Swiss-
US FTA could present an opportunity for both countries to the work towards
bridging the divide. While we do not advocate changes in national legislation with
regards to labeling, the Working Group could be instructed to explore ways to
facilitate access for products that are currently facing obstacles. The work of SPS
Committee should aim towards reducing the risks and costs on producers, for
example, by increasing the transparency of requirements and reducing the time
burden associated with compliance with domestic regulations.
• Within the context of the FTA, Switzerland and the United States should reach a
mutual recognition agreement to recognize equivalent standards for organic
products. This will promote trade in high value produce, and will level the playing
field vis-a-vis third countries that already have established equivalence of organic
standards with Switzerland or the United States.
• As in the prior FTA agreements signed by both Switzerland and the United States,
any disputes that cannot be resolved by the Working Group and the SPS
Committee should be consigned to the WTO dispute settlement mechanism. To
21
expedite disputes that may arise, the parties should agree in advance, in
consultation with the WTO Secretariat, on a short roster of qualified panelists.
3.2 Geographical Indications
According to the TRIPS Agreement, geographical indications (GIs) “identify a good as
originating in the territory of a Member, or a region or locality in that territory, where a
given quality, reputation or other characteristic of the good is essentially attributable to its
geographical origin.” Geographical indications have spawned a certain amount of trans-
Atlantic controversy, with Europe generally and Switzerland specifically. The Swiss and
US approach to GIs differ substantially. We first explain the regimes protecting
geographical indications in Switzerland and the United States. We then examine the
Swiss and US positions in the Doha Round and in bilateral agreements. Finally, we
present recommendations on how GI issues could be addressed on the Swiss-US bilateral
FTA.
A. Geographical Indications in the United States 29
The United States protects geographical indications, whether of domestic or foreign
origin, through its trademark system, in the category of certification, collective marks, or
common law (unregistered) versions of such marks.30 The US rationale for linking GIs
29 These paragraphs draw extensively on the US Patent and Trademark Office. For more information, please visit http://www.uspto.gov/web/offices/dcom/olia/globalip/geographicalindication.htm. 30 A collective mark indicates the commercial origin of goods or services in a product where no single individual owns the trademark. A certification mark has two peculiar characteristics. First is that the owner of the mark does not use it. Second, that it does not indicate commercial source nor distinguish the goods or services within the users of the
22

and trademarks arises from the fact that both are source-identifiers, marks of a certain
quality or standard (mandatory for geographical indications), and indicators of particular
business interests. However, there are differences between trademarks and GIs. The
function of trademarks is to indicate the commercial origin of goods or services. To get a
trademark registered or protected, it is normally not necessary to specify the quality or
standard of the goods or services it identifies. On the contrary to get the registration/ or
protection of a GI, it is necessary to establish a quality, reputation or other characteristic
of the product that is linked to its geographical origin.
GIs may be registered as certification marks, but registration is not necessary to enforce
GI rights against infringement if the GI qualifies as a common-law (unregistered)
certification mark. Certain statutes and regulations related to spirits may have the
incidental effect of providing additional protection for GIs. Examples include wine
labeling laws and USDA inspection standards. These pieces of legislation are not
intellectual-property laws, and consequently they do not establish a particular sign as a
geographical indication. Sources from the US Patent and Trademark Office (USPTO)
nevertheless point out that these other statutes and regulations may be quite helpful in the
enforcement of GI rights.
“Roquefort”, “Parma Ham”, “Stilton”, “Darjeeling”, and “Cognac” are examples of
foreign geographical indications protected in the United States through registration as
certification mark. A certification mark can take the form of any word, symbol or name used by a person other than its owner to certify for instance a certain origin, quality, accuracy, or production process. Any entity that meets the certifying standards is entitled to use the certification mark.
23

certification marks. Examples of geographical indications from the United States include
"Florida" for oranges, "Idaho" for potatoes, "Washington State" for apples, “Tennessee”
for whisky, and "Napa" for wine. Anecdotal evidence suggests that some Swiss GIs
already enjoy protection through registration in the United States. Some Swiss GIs
registered as PAOs or PGIs, such as Tête de Moine Fromage de Bellelay, are registered
as certification marks in the United States. 31
Even so, the US trademark system falls short of Swiss expectations since it only protects
Swiss GIs for products (other than wines and spirits) from misleading uses of the GIs and
not from simple incorrect uses of the GIs or from confusingly similar labels. For
example, it is common to find domestic products in the United States with labels that
evoke Swiss origin through confusing readings such as “Swiss style” or pictures of snow
covered mountains.
Recent US bilateral FTAs, such as US-Chile, US-Australia, and CAFTA-DR, include
provisions on GI protection. Typically, these agreements reinforce the commitment of
parties to treat GIs as trademarks, but expressly refuse GI protection in the event that they
correspond to pre-existing trademarks. The US-Chile FTA, the US-Australia FTA and
CAFTA-DR, as well as the US-EU Agreement on Distilled Spirits/Spirit Drinks, provide
mutual recognition of certain spirits. These bilateral FTAs introduce the concept of
“distinctive products” --products that may only be manufactured in a certain region of a
31 Between 2000 and 2004, Swiss residents filled 14,122 trademark applications, and obtained 5,025 trademarks in the United States. These figures include all trademarks, and do not indicate the extent of protection of Swiss GIs in the United States.
24

country, in accordance with the country’s laws governing manufacture, consumption, sale
or export. The FTAs explicitly forbid the sale, under a “distinctive product” label, of any
product that does not qualify for such distinction.
B. Geographical Indications in Switzerland 32
Switzerland has a long tradition, one that can be traced to the 19th century, for protecting
GIs for all goods (agricultural, craft and industrial products alike) and services. Until the
adoption of special rules for the registration of geographical indications for agricultural
products in 1997, legal protection for agricultural GIs was exclusively granted under the
Federal Law on the Protection of Trademarks and Indications of Source.33 Under this
law, known as the LPM, protection of geographical indications is granted automatically,
without a formal notification/registration procedure, provided that certain conditions are
satisfied. In addition to the protection granted by the LPM, producers of agricultural
products have, since 1997, the possibility of entering their GIs in a national registry (see
the Ordinance on the Protection of Appellations of Origin and Geographical Indications
in respect of Agricultural Products and Processed Agricultural Products). The first GI for
such products was registered in January 2000. The Ordinance on PAOs and PGIs
distinguishes two different types of GIs, the Appellation d’origine contrôle (AOC/PAO)
32 This section draws mostly on publications of the Swiss Federal Institute of Intellectual Property. We also thank the Institute staff members for their comments. 33 Federal Law on the Protection of Trademarks and Indications of Source of 28 August 1992 (LPM; RS 232.11) provides general protection to trademarks and GIs. A number of ordinances complete the general protection of GI for different products such as watches (Ordinance on the Use of the Designation “Swiss” for Watches of December 1971; RS 232.119), wine (Ordinance on Viticulture and the Importation of Wine of 7 December 1998; RS 916.140), agricultural products (Ordinance on the Protection of Appellations of Origin and Geographical Indications in respect of Agricultural Products and Processed Agricultural Products of 28 May 1997; Ordinance on PAOs and PGIs; RS 910.12).
25

and the Indication géographique protégée (IGP/PGI). Indication géographique protégé
(IGP).
The AOC constitutes the name of a place, region, or traditional denomination that is used
to designate an agricultural product whose quality and character draw essentially or
exclusively from the surrounding geographical environment, including both human and
natural factors. As of May 2005, some 13 products had successfully completed AOC
registration, including for the most part cheeses, spirits, bakery products and other
products of vegetable origin.34
The IGP concept is based on a slightly weaker linkage between the product and the
territory of origin. This concept applies to products for which the quality, reputation or
other characteristic may be attributed to the region or place of origin. As of May 2005,
five products enjoyed IGP protection, including for the most part meats and sausages.35
An important difference with the US approach lies in the range of protection enjoyed by
GIs. For registered AOCs and IGPs, for instance, the “direct or indirect” use of protected
denominations for commercial purposes is strictly prohibited for similar products not
complying with the specification. The same protection also extends to non-similar
34 These products included cheeses such as L’Etivaz, Tête de Moine, Gruyère, Sbrinz, Formaggio d’Alpe Ticinese, Vacherin Mont-d’Or, and Berner Alpkäse/Hobelkase; spirits such as Abricotine and Eau-de-vie de poires du Valais; vegetable products such as Rheintaler Ribelmais (corn), Safran de Mund (spice), and Cardon épineux genevois (vegetable); and bakery products such as Pain de seigle valaisan (bread). 35 The five products are: Viande des Grisons, Viande séchée du Valais, Saucisse d’Ajoie, Saussice and Saucisson neuchâteloise, Saucisse aux choux and Saucisson vaudois.
26

products, if the use exploits the reputation of the protected denomination. The most
relevant laws are the Ordinance on the Protection of Appellations of Origin and
Geographical Indications in respect of Agricultural Products and Processed Agricultural
Products, and the Federal Law on the Protection of Trademarks and Indications of
Source. Also, unlike the US trademark system, GI protection in Switzerland extends
widely to imitations; fallacious indications; misleading packaging; translations; abusive
labeling such as “like”, “type,” “according to the recipes”; as well as “other recourses to
the distinctive shape of the product” even if the true origin of the product is identified.36
Registration of AOC or IGP is not an easy process. Petitions for AOC or IGP protection
undergo a thorough review by the Swiss authorities. Currently, six cheese products, five
meat products, one plant-based product, two alcohol-based products, and one forestry
product are undergoing evaluation. Challenges against the decision to register
“Emmentaler” as an AOC are still pending. Registered GIs (both AOCs and IGPs) also
undergo surprise inspections and other controls to ensure respect for traditional
production methods, trace ability, and authenticity.
Under the Swiss legislation, foreign GIs, including those of US origin, are granted the
same protection as Swiss GIs. Thus, US GIs may benefit from the general protection
provided by Law 232.11, and may apply for AOC or IGP registration under Ordinance
910.12. The 2003 US Commerce Department Country Commercial Guide stated that,
36 Article 16.6 of the Law on Agriculture allows an exception for prior trademarks and Article 17a of the Ordinance does so for products that have been commercialized under a protected denomination at least five years prior to the demand for registration of the GI.
27

“Switzerland has one of the best regimes in the world for the protection of intellectual
property, and protection is afforded equally to foreign and domestic rights holders.” The
US concern that US GI owners face systematic discrimination in the European Union
does not apply to Switzerland.
All bilateral FTAs negotiated by EFTA include provisions whereby parties “ensure in
their national legislations adequate and effective means to protect GIs with regards to all
products, including appellations of origin.” In some of these agreements, the protection
of GIs is also granted to services. The negotiated text within EFTA reinforces but does
not go much beyond the commitments incorporated in the TRIPS agreement. In some
FTAs (e.g. with Mexico), a separate annex deals exclusively with the protection of GIs.
Annexes 7 and 8 of the Bilateral Agreement on Agriculture between the European
Community and Switzerland ensure mutual protection for GI names, without recipes or
enological practices, for wines, spirits and wine-based drinks. A Joint Declaration also
calls for the mutual protection of Designations of Origin and Geographical Indications
for agricultural products and foodstuffs. Currently, the ad hoc working group is
discussing the list of denominations that should be protected under the agreement.
C. US and Swiss Views of GI Protection in the TRIPS Agreement
Articles 22 and 23 of the TRIPS Agreement grant two types of protection to GIs, namely
regular and “additional protection”. Regular protection for GIs that identify any type of
product aims at protecting consumers and producers by preventing the use of indications
that mislead the public or constitute unfair competition. “Additional protection” forbids
28

the use of indications that do not originate in the place designated by the GI, regardless of
any risk that the use of GIs might mislead the public or constitute unfair competition.
“Additional protection” applies only GIs identifying wines and spirits. For example,
regular protection allows labeling such as “Sbrinz from Argentina,” but additional
protection bans the use of that expression or kindred phrases, such as such as “Bordeaux
produced in Australia” or “Australian wine, Bordeaux style”.
The Swiss government has actively participated in GI talks at the WTO since the
Uruguay Round, and especially in the context of the ongoing Doha Round. Switzerland
considers that the TRIPS Agreement is the appropriate framework to establish minimum
standards for more effective protection of GIs for all products at the multilateral level.37
Swiss authorities believe that the regular protection of TRIPS Article 22 is less effective
than the protection of TRIPS Article 23, since Article 22 is based on an inappropriate test
(consumer deception or unfair competition). Protection through Article 22 of TRIPS for
products other than wines and spirits does not secure GIs from abusive use in translated
form, or in conjunction with modifiers such as “like”, “type,” or “style”.38 Thus,
producers from any other region can evoke the region of origin in a label such as
“Gruyère-style cheese, made in Spain”. If this practice continues to be permitted, Swiss
37 Swiss GI-based producers have also been in the front line in advocating the creation of an international organization, such as ORIGIN, to get a more effective protection for GIs at the international level, and in particular in the WTO. 38 “Additional protection” under Article 23 of TRIPS prevents this sort of abusive modifier.
29

officials argue, GIs risk becoming generic concepts with the passage of time, thus loosing
even the limited protection granted by Article 22.
Swiss authorities also worry that Article 22 of TRIPS distributes unfairly the burden of
proof in GI disputes. GI protected producers not only have to prove incorrect use of the
disputed label, but they also have to prove intent to mislead of public, a difficult claim to
establish. Fine print on labels, seldom read by consumers, may correctly state the origin,
while the headline type conveys a false impression. Swiss officials thus conclude that GI
rights are difficult to enforce under the current standards of protection of the TRIPS
Agreement, for products other than wines and spirits.
Swiss negotiators, supported by other delegations, have proposed the extension of
“additional protection” (TRIPS Article 23) to all products, as part of the Doha Round
package. This would lead, in their view, to a better protection system: one that ensures
the exclusivity and better enforceability of rights; eliminates abusive exploitation of
certain GIs; maximizes the value of GIs as a marketing tool; creates conditions for the
sustained development of certain regions; and better protects consumers from misleading
labeling.
US negotiators, supported by other delegations, reject the Swiss proposal, as they
consider that the current level of protection available under the TRIPS agreement is
sufficient. They argue that the Swiss proposal would create an imbalance between
trademark and GI protection, in favor of the latter, which the US views as “a hidden
30

subsidy”. Moreover, the United States interprets the Swiss proposal as leading to the
creation of a supra-national registry for GIs, and the United States believes that
registration should remain a national prerogative.
Some US officials consider the Swiss proposal a vehicle for “taking back” generic
terms.39 Moreover, US officials worry that adopting stronger GI protection could
adversely impact on certain production carried out by immigrants, or descendants of
immigrants, in the United States.
D. Recommendations for GI Issues
• To balance the political economy of Swiss market access liberalization in
agriculture, the FTA will need US concessions on geographical indications, an
area of considerable commercial value not only to Swiss farmers and food
processors, but also to Swiss industry (watches, textiles, machinery, medical
devices, etc.).
.
• A unique feature of the Swiss food sector is its production of epicurean
specialties, notably cheese and chocolate. Switzerland is also reputed for its
luxury and technical industry (watches, textiles, machinery, medical devices, etc).
All these items embody Swiss comparative advantage, but to access the US
39 The TRIPS agreement allows countries to exempt from GI protection indicators that correspond to a “generic” term or a preexisting trademark. Since the United States considers “Chablis” a generic term, US producers are still permitted to use that word in the United States as a synonym for white wine. The European Union disagrees and argues that “Chablis” is GI that evokes unique quality tied to a specific geographical area.
31
market to the maximum extent, Swiss producers need adequate protection of their
geographical indications. Contrary to its stance on other intellectual property
rights (IPR) issues, the United States has adopted a defensive posture on the GI
question.
• Nevertheless, in bilateral agreements with the European Union, Chile, Australia,
and CAFTA, the United States obtained specific recognition of Bourbon Whisky
and Tennessee Whisky, and in turn recognized certain GIs of the partner country
(e.g., Scotch Whisky, Irish Whisky, Pisco Chileno, Pajarete). In other words, the
United States has established a precedent for recognizing particular GIs in the
context of bilateral agreements.
• Based on these precedents, in the context of the Swiss-US FTA, the United States
should ensure a better protection of Swiss GIs for all goods and services (an
Agreement on the Protection of GIs) and expressly recognize protection for a list
of Swiss GIs (Annex to the Agreement on the Protection of GIs). As part of the
same bargain, Switzerland should recognize the same level of protection for US
geographical indications for all products, and expressly for the GIs listed in the
Agreement, such as Florida oranges, Idaho potatoes, Washington State apples,
Tennessee Whiskey, Bourbon Whisky, Napa wine.
• As a collateral agreement, in the context of Doha Development Round, the United
States should accede to the request made by Switzerland and other countries that
32

Article 23 of the TRIPS Agreement be amended to state that additional protection
should apply to all products. The use of words such as “like”, “style” or “type”, or
label information that, in relatively small print, correctly states the origin of the
product would then be prohibited. This amendment to Article 23 would also give
Swiss producers better grounds for challenging the words “Swiss-style”.
• Finally, in the context of the Swiss-US FTA, the parties should form a Standing
Working Group on Intellectual Property to consult on issues concerning GIs or
other intellectual property rights that arise from time to time. Disputes would
continue to be handled by the WTO Dispute Settlement Mechanism, but the
Working Group might head off some disagreements at an early stage.
33

THE SHAPE OF A FREE TRADE AGREEMENT BETWEEN SWITZERLAND AND THE UNITED STATES
Chapter 4
MANUFACTURES TRADE
Manufactured goods (also referred to as industrial products) dominate merchandise trade
between the United States and Switzerland, accounting for more than 95 percent of two-
way commerce.1 In 2004, two-way trade between Switzerland and the United States in
manufactured goods -- excluding gold (HS 7108) -- reached nearly $17 billion (table
4.1). In 2004, Swiss manufactured exports to the United States reached $10.4 billion,
while US manufactured exports to Switzerland, excluding gold, were $6.6 billion (table
4.1). In the past decade, the US bilateral deficit with Switzerland has widened, reflecting
the ballooning US merchandise trade deficit on a global basis.
While both countries have very low average tariffs on manufactured imports, they
maintain significant barriers on selected products.2 Based on current export figures from
the US International Trade Commission (USITC), export prospects of greatest interest for
Switzerland, based on existing sales to the United States, include (table 4.2): boilers, 1 Throughout this chapter, manufactured goods are defined as all products comprised in HS Chapter 25 through 97. 2 Because our goal is to present an overall picture of industrial protection, the analysis of Swiss tariffs presented in this chapter is not based on data at the finest level of tariff detail. Another word of caution: we base US export figures on data compiled by the United States at the moment of export. According to Swiss authorities, figures compiled by Swiss Customs Revenue based on import data often differ significantly (see http://www.afd.admin.ch/f/aussen/zahlen/laender/laender_bedeutend.php). Evidently, US exporters often divert shipments en route to Switzerland to other destinations (principally in Europe). However, Swiss data is not available publicly at the same level of detail as US data, which explains our use of US data.
1

machinery and mechanical appliances (HS Ch.84); clocks and watches (HS Ch.91);
optical, measuring, precision and medical instruments and apparatus (HS Ch.90); organic
chemicals (HS Ch 29); and pharmaceuticals (HS Ch. 30). Likewise, based on current US
exports to Switzerland, the United States will be most interested in (table 4.2): boilers,
machinery and mechanical appliances (HS Ch.84); optical, measuring, precision and
medical instruments and apparatus (HS Ch.90); pharmaceuticals (HS Ch. 30); precious
metals (HS Ch. 71); works of art (HS Ch.97). In most of these industries, trade between
the United States and Switzerland is either tariff-free or pays only nuisance duties.
However, tariffs or other barriers are significant for a few tariff lines, and those are the
cases that attract our attention.
The chapter is divided into six sections. The first section deals with tariffs and quotas.
The second section reviews safeguard, antidumping and countervailing measures. The
third section examines technical barriers as they relate to industrial products. The fourth
section reviews tariff phase-out schedules in selected US bilateral FTAs. The fifth section
addresses rules of origin in industrial products. Finally, the sixth section presents our
recommendations for liberalizing industrial trade.
4.1 Tariffs and Tariff-Rate Quotas
Both countries are among the most open economies in the world for trade in industrial
products. According to recent WTO trade policy reviews, the average applied tariff for
manufactured imports was 2.3 percent for Switzerland and 4.2 percent for the United
States. World Bank trade-weighted averages, reported in the 2005 Index of Economic
2

Freedom, indicate that the tariff burden on actual trade is even lower, namely 0.8 percent
in Switzerland and 2.6 percent in the United States. These figures indicate that, on
average, the United States imposes higher tariffs on industrial products than Switzerland.3
The principal manufactured exports of Switzerland and the United States to each other
are subject to low rates. Analyzed at the HTS 10-digit and 6-digit levels, the simple
average tariff rates for all industrial exports above $10 million to the other party were 2.4
percent for Swiss exports to the United States and 2.6 percent for US exports to
Switzerland (tables 4.3 and 4.4).4 Trade-weighted average tariffs are again lower, 0.8
percent for Swiss manufactured imports the United States and 1.2 percent for US
manufactured exports to Switzerland (table 4.5).5
Nevertheless, several high tariffs remain and the affected products will be of great
interest in Swiss-US FTA negotiations. According to Swiss authorities, in 2004, high
tariffs (those exceeding 5 percent) obstructed about 10 percent of Swiss industrial exports
3 Some analysts object to the use of trade-weighted tariff averages, on the argument that such averages frequently understate the protective effect of tariffs, since (other things being equal) imports of items with higher tariffs will be lower relative to production or consumption. These analysts would prefer the use of production-weighted or consumption-weighted tariff averages. However, these alternative weighting schemes are very time-consuming and costly to implement. In our view, given the low level of Swiss and US tariff barriers on manufactured goods, the weighting scheme is not critical for an evaluation of average tariff levels. 4 The cutoff at $10 million of exports covers 64 percent of Swiss manufactured exports to the United States and 77 percent of US manufactured exports to Switzerland. 5 Another way of looking at protection is to calculated average collected duties. According to estimates provided by Swiss authorities, the average customs duty paid for imports of industrial goods from the United States was 0.2 percent, while the figure for industrial goods exported from Switzerland to the United States was 1.5 percent.
3

to the United States and less than 1 percent of US industrial exports to Switzerland. The
United States applies high tariffs on leading Swiss exports such as clocks and watches
and chemicals (excluding pharmaceuticals), as shown in table 4.3.
By contrast, high tariffs (above 5 percent) do not affect any of the current leading US
industrial exports to Switzerland. Table 4.4, however, identifies a number of tariff-lines
where potential US exports of chemicals, printed materials, clocks and watches and
machinery and electrical apparatus would face high tariffs. In fact, as shown in table 4.8,
high Swiss tariffs (often in the form of specific duties) are not rare, and may limit imports
of selected industrial products.
More generally, the mutual elimination of all industrial tariffs could boost trade among
products for which current volumes are modest. This possibility is suggested by the fact
that the trade-weighted tariff averages are very low in comparison to simple tariff
averages on bilateral trade. In other words, the highest industrial tariffs apply to those
products where bilateral trade volumes are small. Currently, no products facing tariffs
exceeding 10 percent record imports over $15 million at the 6-digit level (Switzerland) or
the 10-digit level (United States).
6 These are rough estimates based on averages at the HS 4-digit level. Within those HS-4 tariff headings where Swiss exports to the United States exceed $10 million, it is possible to identify 914 individual tariff lines where US tariffs are above 5 percent (foot of table 4.7). The other way around, it is possible to identify 205 individual tariff lines where Swiss tariffs are above 5 percent (foot of table E.3).
4

Table 4.6 presents a list of manufactured goods at the 6-digit HTS level subject to US
tariffs above 10 percent ad valorem. The table excludes textiles, clothing and footwear,
sectors where hundreds of tariff lines are routinely subject to high tariffs. Table 4.7
presents a list of 4-digit HTS categories where the simple average tariff exceeds 5 percent
(averaging tariffs at the 6-digit level). Nearly $2 billion of Swiss exports to the United
States arrive in these high tariff 4-digit HTS categories. As a minor but not negligible
barrier, the United States applies quantitative restrictions on imports of certain cotton-
based products.7 For example, under a US tariff-rate quota (TRQ), Swiss exports of card
strips made from cotton having a staple length under 30.1625 mm (HS 5202.99.10) are
guaranteed a minimum access of just 6,711 kilograms.8
Comparable detail is not available for high Swiss tariffs. However, table 4.8, drawn from
WTO sources, lists several 2-digit HS categories where tariffs on 6-digit items exceed 10
percent in terms of their ad valorem equivalents.9 This table excludes textiles and
clothing, sectors where high tariffs are the rule, as in the United States.
According to gravity model estimates, presented in Chapter 8, a Swiss-US FTA could
more than double bilateral trade in manufactured goods. According to estimates from a
static computable general equilibrium (CGE) model, also discussed in Chapter 8, a
comprehensive US-Swiss FTA might increase two-way manufactures trade by about 20
7 See chapter 52 of the 2005 HTSA. http://www.usitc.gov/tata/hts/ 8 It is worth pointing out that Switzerland has no quantitative restrictions on manufactured products (WTO 2004). 9 In the Swiss tariff schedule, specific duties are common, and these need to be converted to ad valorem equivalents for meaningful evaluation.
5
percent. These robust estimates reflect the fact that nuisance tariffs drag down trade to a
far greater extent than simple models, based on the elasticity of demand, might suggest.10
They also reflect the fact that high tariffs can choke off manufactures trade altogether,
especially when alternative sources of supply are readily available, or when firms forego
industrial investments because imported inputs are burdened by trade barriers.
4.2 Safeguards, Antidumping and Countervailing Duties
A. Safeguards 11
According to the most recent WTO Trade Policy Review of Switzerland, Switzerland and
Liechtenstein do not maintain or intend to establish any safeguard measures as envisaged
under Article 19 of GATT-1994. However, existing legislation permits safeguards
consistent with the WTO, and they could be invoked without new implementing
legislation.
At present, the United States has no safeguards on imports of manufactured goods from
Switzerland. Moreover, while US law has long permitted the application of safeguards,
they are not frequently imposed. But there is one safeguard issue that concerns
Switzerland: the US practice of excluding NAFTA and other FTA partners from the
10 Before the advent of gravity and CGE models, it was common to estimate the impact of tariffs by applying the estimated demand elasticity (a value, for example, between –1.0 and –3.0) to the ad valorem tariff. For example, if the tariff on an item was 2 percent, and the demand elasticity was –3.0, an increase in trade volume of 6 percent would supposedly follow from the elimination of the tariff. The recent literature on free trade areas (e.g., DeRosa and Gilbert, 2005) suggests that this approach badly understates the effect of a free trade area in augmenting trade. 11 Safeguards are also discussed in Chapter 2 on Agricultural Barriers, where they have greater relevance.
6

application of its safeguard measures.12 Switzerland participated in a group of countries
that, in March 2002, challenged US safeguard measures on steel, arguing that among
other defects the United States “did not respect the requirement of parallelism between
the scope of the investigation of the injury arising from imported products and the scope
of the safeguard measures.”13 The WTO Panel and Appellate Body found the US
safeguard measures to be inconsistent with the Agreement on Safeguards and the GATT-
1994, citing the absence of parallelism among a long list of defects (in December 2003,
the United States revoked the steel safeguard). Of course, if a Swiss-US FTA is
concluded, the Swiss concern over parallelism will be moot.
B. Antidumping and Countervailing Duties
According to its latest notification to the WTO (March 2005), the United States does not
apply antidumping duties to any product originating in Switzerland.14 However, if the
United States applies future AD duties on imports from Switzerland, the Byrd
Amendment could be a matter of concern. The Byrd Amendment ensures that a large
portion of the revenues collected from the imposition of AD measures are distributed
(akin to a damage award) to firms in the affected US industry that supported the AD
12 Under US practice, NAFTA and FTA partners are included only when they contribute in a significant way to total imports and to the injury suffered by the domestic industry. 13 In other words, the United States did not justify the exclusion of Canada and Mexico from its safeguard measures. 14 See WTO document G/ADP/N/126/USA. Nor is the United States considering the application of antidumping duties (ADs).
7

petition. The Byrd Amendment was ruled illegal by the WTO Appellate Body, but
Congress remains strongly opposed to its repeal.15
Between 1995 and 2004, Switzerland did not apply antidumping measures against any
country.16 Moreover, Swiss exporting firms are infrequently involved as targets of
antidumping investigations. Since 1995, Swiss firms have faced just five AD
investigations, of which only one ended with the application of definitive duties, and
none of these cases involved the United States. The Swiss record is all the more
remarkable given that an important share of Swiss exports corresponds to sectors with a
moderate incidence of antidumping investigations, such as chemicals and machinery.17
There are no outstanding issues on the bilateral agenda with respect to countervailing
duties (CVDs). Switzerland has not applied CVDs since 1995. Though the United States
is the world’s most frequent user of CVDs, Switzerland rarely subsidizes industrial
production.18
15 Many observers believe that the Byrd Amendment will remain on the US law books at least until the WTO Doha Development Round is concluded and the package is ratified by Congress. 16 See WTO Statistics on antidumping at http://www.wto.org/english/tratop_e/adp_e/adp_stattab7_e.xls. 17 About 57 percent of US antidumping initiations between 1995 and 2004 corresponded to base metals and articles thereof (HS chapters 72 through 83), and Swiss exports to the United States are small in these sectors, only 2 percent of total trade. US antidumping initiations on chemicals and machinery and apparatus, over that same period, represented about 18 percent of total AD measures. 18 Moreover, between 1995 and 2004, 60 percent of US countervailing duty investigations targeted base metals and articles thereof (HS chapters 72 through 83), not products that Switzerland exports in large volume.
8
4.3 Standards, Technical Barriers, and Conformity Assessment
A. Standards and Technical Regulations
United States
Voluntary standards are usually developed by private-sector associations in a given
industry, profession or academic field (WTO 2004). By contrast, mandatory standards
can be established at either the federal or state level (WTO 2004). While Congress retains
the power to write product regulations, “it usually delegates enabling legislation to
regulatory agencies, generally pursuant to broad guidance as to the factors considered and
policy goals to be achieved” (WTO 2004). An agency may develop standards and
technical regulations on its own initiative, if the Congress has previously conferred broad
authority to do so.
The United States is often criticized for ignoring international standards. International
standards are sometimes contradicted by US standards and purposefully not adopted in
some instances. Thus, US standards on electrical and electronic products differ from
international standards (EU Commission 2004). Likewise, US standards for non-
destructive testing (NDT) require that the personnel be certified twice, whereas the
international standard is a single certification (EU Commission 2004). Moreover, it
annoys other countries when US officials argue that US standards, such as those for
pressure containers, are “international” because they are widely used abroad.
In the pharmaceutical area, the European Union (2004) claims that FDA approval of new
medicinal products takes much longer for new non-US drugs than it does for new US
9

drugs. The European Union attributes this delay to the Investigational New Drug (IND)
system, which allows “the FDA advanced knowledge of medicinal products tested in
clinical trials in the United States” (EU Commission 2004). The European Union also
takes exception to the US “over the counter” (OTC) procedure in which active substances
that have been approved for an array of medicinal products by the FDA are put on an
approved list (EU Commission 2004). The approved active substances can then be sold
without a prescription. However, this procedure is only available for active substances
that have a US market history. This limits market access for OTC products that come
from the European Union and Switzerland, despite their equivalent regulatory system for
pharmaceuticals.
In the textile and leather area, custom formalities are costly. Textile, clothing, and
footwear imports require detailed and voluminous information that sometimes entails
disclosure of confidential processing methods such as type of finishing or type of
dyeing.19 As a result, “liquidation” (i.e., final determination) of custom duties may take
210 days or longer. The EU Commission argues that this practice constitutes an important
barrier since apparel articles often have a short shelf life (EU Commission 2004).20
19 Moreover, imported textile fabrics have to be marked with generic names and, when constituent fibers are more than 5 percent, their percentages by weight must be identified. Products with woolen fiber need to be clearly marked to comply with the Wool Products Labelling Act of 1939 (EU Commission 2004). 20 If the importer is not in a position to re-deliver the goods when US Custom so requests, the importer faces a large penalty, which usually amounts to 100 percent of the value of the good (EU Commission 2004).
10

The American Society of Mechanical Engineers (ASME) sets basic standards for
pressure equipment in the United States. In addition, however, local jurisdictions may
regulate pressure equipment, leading to a multiplicity of standards from state to state.
Also, if foreign manufacturers want to use a particular material for the US market not
listed in the ASME code, they will have to initiate a “code case” procedure, which is
extremely costly and lengthy. Finally, the ASME requires an initial inspection of each
manufacturing firm by an authorized authority. This authority must be an insurance
company authorized to write pressure equipment insurance in at least one US jurisdiction.
Finally, the European Union contends that the complexity of the US regulatory system
acts as an additional import barrier, not only for pressure equipment but also for many
other products. Products entering the United States are often subject to an array of
standards and technical regulations in respect of consumer and environmental protection.
The European Union (2004, p.32) complains that “equipment for use in the workplace is
subject to US Department of Labor certification, [national] electrical equipment
standards, specific regulations imposed by municipalities, and other product safety
requirements as determined by insurance companies.” Swiss exporters have similar
complaints as those voiced by the European Union.
Switzerland
Possibly because the Swiss market is small, or possibly because Swiss standards and
technical regulations are closely aligned with international practice, few complaints are
heard from trading partners. As in the United States, Swiss federal departments and
11

agencies develop standards and technical regulations, if the Parliament has granted
authority. In 1996, the Federal Law on Technical Barriers to Trade (LETC) entered into
force. This law, which applies to the regulations at the federal level, states that technical
legislation has to be drafted in such a way that it does not create trade barriers. To this
end, product standards must be harmonized with the most important trading partners.
Today, the legal competence for all technical regulations resides at the federal level, not
at the cantonal level as in former timers. The WTO (2004) reports that Swiss efforts to
harmonize technical requirements across cantons and with the European Union have been
successful. For example, requirements for motor vehicles and telecommunications
equipment have been harmonized with EU technical standards.
B. Conformity Assessment
United States
To ensure that manufactures meet standards and technical regulations, the United States
often relies on third party conformity assessment procedures for industrial products.
Thus, the United States often requires third party certification rather than self-
certification for telecommunications equipment, electrical equipment and domestic
appliances (EU Commission 2004). By contrast, the norm in other countries is usually
self-assessment. Third party assessment can therefore imply additional costs for foreign
suppliers of industrial goods.
12
Switzerland
The Federal Law on Technical Barriers to Trade (LETC) does not require third party
assessment. According to the WTO (2004), “the LETC states that several conformity
assessment procedures should be proposed when a technical regulation is established, and
that at least one procedure should allow producers or suppliers self-assessment.”
C. Mutual Recognition
United States
As a general rule, the United States does not follow the European Union norm of mutual
recognition of product standards established by EU member states. Nor has the United
States embarked on a large scale effort to harmonize its product standards with
international product standards. However, on a case-by-case basis, the United States has
accredited foreign testing agencies. In December 1998, the European Union and United
States signed a Mutual Recognition Agreement (MRA), dealing more broadly with
conformity assessment. The EU-US MRA aims at allowing manufacturers in both
countries “to test and certify their products with a domestic conformity assessment body
(CAB) according to the requirements of the other Party” (EU Commission 2004).
The US-EU MRA was initially targeted at manufacturers of computers and medical
devices but encompassed other sectors as well. The European Commission (2004, p.26),
however, considers that the United States “has not made a sufficient commitment to
implementing [the US-EU MRA], particularly in the areas of electrical safety and
13

pharmaceutical good manufacturing practice.” These areas are of significant interest to
Switzerland. The European Union complains that, in 2003, it was obligated to suspend its
MRA with the United States regarding electrical safety because the US Occupational
Safety and Health Administration (OSHA) refused to grant European authorities the right
to designate European laboratories as acceptable conformity assessment bodies (EU
Commission 2004). Switzerland underwent the same experience when it tried to have
Swiss conformity assessment bodies recognized by OSHA in 1998. As between
Switzerland and the United States, there are different accreditation requirements.
Furthermore, the product marking requirements create another barrier, since smaller
certification bodies have difficulty in promoting their own trademark.
The Swiss-American Chamber of Commerce reports that, in 2002, the United States
initiated a proposal to negotiate a conformity assessment MRA with three European Free
Trade Association (EFTA) countries (i.e., Norway, Iceland, and Liechtenstein), but
Switzerland was excluded. The contemplated agreement was supposed to match the
provisions of the US-EU MRA, but would be restricted to telecommunications
equipment, electromagnetic compatibility and recreational craft. In April 2002, the
Swiss-American Chamber of Commerce submitted a letter to the USTR suggesting that
Switzerland be part of this agreement, arguing that it was “in the best interest of US
business to also facilitate access to the three proposed sectors in the Swiss market”
(Swiss-American Chamber of Commerce 2002). Negotiations are under way, but
apparently not at a brisk pace.
14
Switzerland21
Unlike the United States, Switzerland has entered into MRAs dealing both with product
standards and with conformity assessment. Switzerland has concluded MRAs with
Canada (1999), the European Union (2002), and the EFTA/EEA States (2002), and is
negotiating with Australia and New Zealand, and the United States.
The MRA between Switzerland and the European Union covers 15 product areas and
deals both with product standards and conformity assessment. The 15 product areas and
assessment subjects covered are: machinery; personal protective equipment; toys;
medical devices; gas appliances and boilers; pressure vessels; telecommunications
terminal equipment, equipment and protective systems intended for use in potentially
explosive atmospheres, electrical equipment and electromagnetic compatibility;
measuring instruments and pre-packaging; motor vehicles; agricultural or forestry
tractors; Good Laboratory Practice (GLP) for chemicals and pharmaceuticals; good
medicinal products (GMP) inspection and Batch Certification.
For product sectors in which EC and Swiss legislation are equivalent, the agreement
enables conformity assessment to be carried out by a recognized Swiss conformity
assessment body according to Swiss technical legislation. For products in which the
legislation is not equivalent (e.g., boilers, certain measuring instruments), conformity
assessment procedures must be made on the basis of EC technical regulations. However,
a Swiss body that is recognized by both parties may deliver an attestation of conformity
21 This section is based on information retrieved from the SECO website at http://www.seco.admin.ch/themen/aussenwirtschaft/seiten/00033/index.html?lang=fr.
15

based on EC regulations. Finally, while the Swiss-EU MRA facilitates trade in
pharmaceuticals by providing mutual recognition of GMP inspection and Batch
Certification by manufacturers, each party retains responsibility for authorizing the sale
of pharmaceuticals in its territory.
The MRA between Switzerland and Canada does not cover as many products as the
Swiss-EC MRA. However, the Swiss-Canada MRA allows conformity assessment to be
achieved by a Swiss body that is recognized by both parties.
Independently of future FTA negotiations, regulatory cooperation already exists between
the Swiss and US health authorities in the field of good manufacturing practice (GMP)
for pharmaceuticals (Memorandum of Understanding on Cooperation between the US
Food and Drug Administration and Swissmedic, dated September 22, 2003). Swiss
authorities believe that this cooperation might eventually lead to mutual recognition.
4.4 Tariff Phase-outs in US and Swiss FTA Agreements
A. Selected US FTAs
US-Singapore FTA
Tariffs on most products exchanged were already low before the agreement. Despite the
modest agenda on tariffs, and possibly due to the ease of negotiations in this area,
16

progress on other issues, such as rules of origin and customs procedures, achieved results
that are characterized by the USTR as “ground-breaking.”22
Under the US Singapore FTA, Singapore committed to apply zero tariffs for all
manufactured imports upon entry into force. Since Singapore already applied zero tariffs
on almost all manufactured goods, the agreement entailed the elimination of tariffs on a
very few products such as beer, stout, samsoo and medicated samsoo.
In negotiating market access for industrial products, the United States secured the longest
phase-outs (8 to 10 years) for products that enjoy the highest MFN tariff protection
(above 8 percent). Products that enjoy moderate MFN tariff protection (5 to 8 percent)
typically obtained shorter phase-outs (4 years). Products that enjoy low MFN tariff
protection (below 5 percent) were granted, for the most part, immediate access into the
US market.
According to the USTR, the United States committed to eliminate immediately 92
percent of its tariffs on Singaporean manufactured exports, leaving only 8 percent of
tariff lines for longer phase-out periods. However, table 4.9 shows a larger percentage of
phase-out tariffs, affecting important product-categories, such as organic chemicals,
starches and enzymes, clocks, optical and medical instruments and certain vehicles. In
fact, for the selection of products listed table 4.9, only 77 percent of the tariff-lines will 22 The US-Singapore FTA is among the first US trade agreements with specific obligations on the conduct of customs procedures. See USTR press release “Free Trade with Singapore: America's First Free Trade Agreement in Asia”. Available on-line at www.ustr.gov.
17

qualify for immediate duty-free access. Most of the remaining US tariffs will be phased-
out within 4 years (16 percent); but very sensitive US products qualify for 8 to 10-year
phase-outs (7 percent of tariff lines considered in table 4.9).
An interesting element of the US-Singapore FTA is that, unlike the US-Australia FTA,
many textiles and apparel enjoy immediate duty-free entry into the US market if they
meet the agreement’s special rules of origin.23 The website of the Ministry of Trade and
Industry of Singapore, however, does not include textiles among the sectors that stand to
benefit from US tariff liberalization. The “benefit” sectors identified by the Ministry are:
electronics; information technology equipment; chemicals and petrochemicals;
instrumentation equipment; processed foods; and minerals.24
US-Australia FTA
Similar to the US trading relation with Switzerland, manufactured exports account for
almost 95 percent of US merchandise exports to Australia. Before the agreement,
Australia applied higher tariffs on US manufactured products than the United States did
on similar products originating in Australia.25 Re-balancing this situation was an
important US objective. For its part, Australia wanted to provide its exporters an equal
footing with competitors that already benefit from preferential access to the US market.
23 Rules of origin are discussed below. 24 For more information see the section on the US-Singapore FTA in the MTI Website. http://www.mti.gov.sg/public/FTA/frm_FTA_Default.asp?sid=36&cid=1647 25 The difference was particularly noticeable on durable goods, which accounted for about three quarters of US exports to Australia.
18

Australia will provide immediate duty-free access to more than 99 percent of its
manufactured imports from the United States. Indeed, table 4.10 shows that, leaving
textiles aside, Australia only managed to apply phase-outs (6 years) on about 15 tariff-
lines that correspond to second-hand passenger vehicles. According to the USTR, the
following US sectors will benefit immediately: autos and auto-parts; chemicals and
plastics; construction equipment; electrical equipment and appliances; fabricated metal
products; furniture and fixtures; medical and scientific equipment; non-electrical
machinery; and paper and wood products.
Though the United States will provide immediate duty-free access to 97 percent of non-
agricultural tariff lines, it insisted on phase-out terms for a substantial number of sensitive
products. Table 4.10 shows that US phase-outs will apply to tariff-lines in ceramic
products, glassware, certain tools used in construction, optical and medical instruments,
and electrical machinery. Tariffs on most of these products will be phased-out over 4 to
10 years. Tariffs on a few milk proteins and casein will be phased-out over 18-years.
Despite these long phase-outs, the Australian Department of Foreign Affairs and Trade
highlights that the following sectors stand to benefit immediately: automotive; metals;
minerals; seafood; paper and chemical; and sectors that use US inputs. Australia expects
benefits on textiles, clothing and footwear sectors over a longer time frame, since many
tariffs on this sector will be only eliminated over the 15 years. The agreement also
establishes a Committee on Trade in Goods to address market access concerns (mainly on
the part of Australia), particularly those relating to non-tariff barriers.
19

The USITC expects that FTA concessions will result in gains for the following US
manufactured exports (listed in decreasing order of projected gain): coal, oil and gas;
processed food; textile, apparel, and leather products; motor vehicles and parts; ferrous
metals; and wood products. Australian manufactured exports projected to increase (listed
in decreasing order of projected gain) are: textiles; chemicals, rubber and plastic; and
motor vehicles and parts.26
US-Chile FTA
Manufacturing trade plays a smaller role between the United States and Chile than in US
trade relations with more highly developed countries. In 2004, durable goods represented
only 30 percent of US exports to Chile (less than half the share in US exports to
Australia). Likewise, industrial products represented less than 60 percent of Chilean
exports to the United States, and many Chilean industrial exports are food or forest-based
products (there is also rapid expansion of Chilean chemical exports). More than 85
percent of bilateral trade in consumer and industrial products became duty-free
immediately upon entry into force. Most of remaining tariffs will be eliminated within
four years. Tariffs on textile products were eliminated immediately on both sides.
However, Chile does not export a large amount of these products to the United States.27
26 USITC. “US-Australia Free Trade Agreement: Potential Economywide and Selected Sectoral Effects”. May 2004. 27 In 2002, Chilean textile exports were just over $10 million.
20

US manufactured exports gaining immediate duty-free access to Chile include:
agricultural and construction equipment; autos and auto parts; computers and other
information technology products; medical equipment; and paper products. Chile retained
4 to 10 year phase-outs on certain tariff lines in organic chemicals (HS 2905, 2915, 2917,
and 2930), fertilizers (HS 3102), tanning colors (HS 3204, 3207-09, and 2314); cosmetics
(HS 3303-05), enzymes (HS 3501-06); and miscellaneous products of the chemical
industry (HS 38); plastics (HS 3901-02; 3905-09; 3519-20, and 3926); rubbers (HS 4005-
08, 4010 and 4012); certain shoes (HS 6403); stones used in construction (HS 68),
including brick of ceramic; glassware (HS 7004-7018); certain machinery and
mechanical appliances (HS 8419-26); vehicles and parts thereof including HS 8702 and
parts listed in other chapters. However Chile applies an almost perfectly uniform MFN
tariff of 6 percent, and for none of the phase-out products does the MFN tariff exceed that
level.
Before the FTA many Chilean industrial–based exports entered the United States duty-
free under GSP. Hence the FTA tariff cuts will have a comparatively small effect on
Chilean manufactured exports. However, the United States will apply 4 to 10 year phase-
outs on certain tariff lines in HS 3502 and 3503 (e.g., egg albumin and indelible gelatin),
HS 4202 (trunks and suitcases), HS 4203 (gloves), HS 4602 (luggage), HS 6907 and
6908 (glazed ceramic tiles), HS 7013 (drinking glasses), HS 8203 though 8208 and HS
8214 and 8215 (articles of metal such as knives, scissors, joint pliers, etc); HS 8714
21
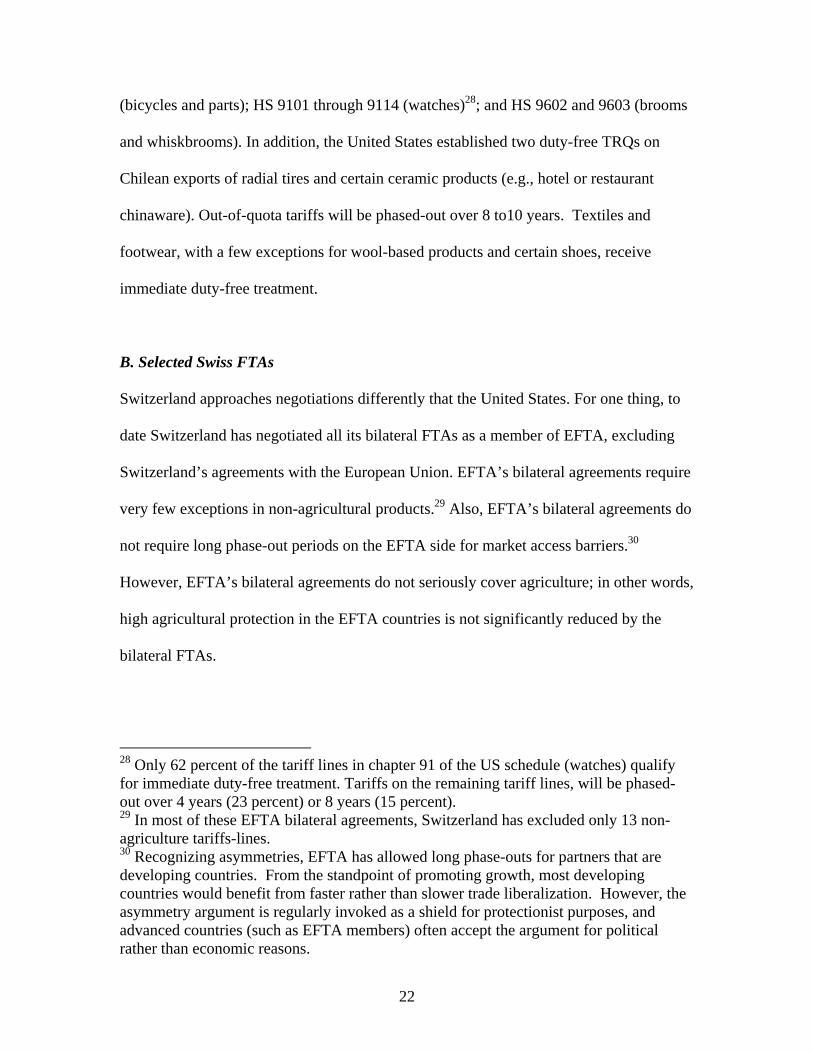
(bicycles and parts); HS 9101 through 9114 (watches)28; and HS 9602 and 9603 (brooms
and whiskbrooms). In addition, the United States established two duty-free TRQs on
Chilean exports of radial tires and certain ceramic products (e.g., hotel or restaurant
chinaware). Out-of-quota tariffs will be phased-out over 8 to10 years. Textiles and
footwear, with a few exceptions for wool-based products and certain shoes, receive
immediate duty-free treatment.
B. Selected Swiss FTAs
Switzerland approaches negotiations differently that the United States. For one thing, to
date Switzerland has negotiated all its bilateral FTAs as a member of EFTA, excluding
Switzerland’s agreements with the European Union. EFTA’s bilateral agreements require
very few exceptions in non-agricultural products.29 Also, EFTA’s bilateral agreements do
not require long phase-out periods on the EFTA side for market access barriers.30
However, EFTA’s bilateral agreements do not seriously cover agriculture; in other words,
high agricultural protection in the EFTA countries is not significantly reduced by the
bilateral FTAs.
28 Only 62 percent of the tariff lines in chapter 91 of the US schedule (watches) qualify for immediate duty-free treatment. Tariffs on the remaining tariff lines, will be phased-out over 4 years (23 percent) or 8 years (15 percent). 29 In most of these EFTA bilateral agreements, Switzerland has excluded only 13 non-agriculture tariffs-lines. 30 Recognizing asymmetries, EFTA has allowed long phase-outs for partners that are developing countries. From the standpoint of promoting growth, most developing countries would benefit from faster rather than slower trade liberalization. However, the asymmetry argument is regularly invoked as a shield for protectionist purposes, and advanced countries (such as EFTA members) often accept the argument for political rather than economic reasons.
22
As an illustration, the EFTA-Singapore FTA immediately abolishes practically all custom
duties on products listed in HS chapters 25 through 97 upon entry into force. A few
exceptions are listed in Annex V. For Switzerland the excluded products are concentrated
in chapter 35 (casein, albumins, and dextrin and other modified starches, and prepared
glues) and chapter 38 (finishing agents, fatty oils and alcohols and acid oils, prepared
binders for foundry moulds, and residual products of the chemical industry).
The EFTA-Chile FTA recognizes the asymmetry between parties in terms of
development levels,31 and Annex VI allows Chile to establish phase-outs on certain
manufactured products. The phase-out periods for more than three-fourths of the products
listed in Annex VI are indefinite, but this provision will be renegotiated within two years
after the agreement entered into force. Affected products include organic chemicals;
fertilizers; certain tanning products; cosmetics; other chemicals; plastics and rubbers; raw
fur skins; bricks and other ceramic products; certain glassware; a few articles of iron and
base metals; some electrical and mechanical appliances; vehicles and parts thereof.32
Still, Chile will allow EFTA partners to propose changes in the phase-out schedules, to
the extent Chile grants better access for the same products originating in the European
Union. For its part, Switzerland only excluded from immediate duty-free treatment those
same tariff-lines that were reserved in the EFTA-Singapore accord.33
4.5 Rules of Origin
31 See the preceding note. 32 This listing is very similar to the list of products that received 4 to 8 year phase-outs in the US-Chile FTA. 33 See Annex III.
23

Overview
Rules of origin determine which goods are eligible for the preferential FTA tariff rates,
and defining these rules will be a crucial aspect of the negotiation.34 Many sectors in
Switzerland rely heavily on foreign inputs in the production of exported goods. Producer
associations have commented that the benefit of reduced and zero tariffs on manufactured
goods will critically depend on whether the FTA contains “liberal rules of origin.”
This is all the more important because, for the majority of traded goods, FTA preferences
will be meaningful only if the cost of compliance with the rules of origin is modest –
otherwise firms will simply pay the MFN tariff and avoid the hassle. We focus this
section on rules of origin for sectors where high MFN tariffs prevail (such as textiles and
apparel), and sectors where the used of imported inputs is an important part of industrial
production. Before turning to details, as revealed in past FTA negotiations, it is worth
calling out three general issues that are sure to arise in negotiating the rules of origin: the
convention on cumulation; the rule on remanufactures; the method of certification.
Cumulation. The cumulation issue centers on the designation of countries whose
products qualify for meeting the rules of origin set forth in the free trade agreement. Will
only goods manufactured in the two partner countries qualify? Or will goods
manufactured in third-country FTA partners also quality? The answer is critical in a
34 The legitimate purpose of rules of origin is to avert “trade deflection” -- the practice of routing third country imports into the FTA partner with the lowest MFN tariff, and then re-exporting the same goods into the other partner (the one with a higher MFN tariff), taking advantage of the FTA preferential tariff rate.
24

world where the components from several countries are assembled to make many final
products, such as shoes, clothing, or computers.
EFTA’s approach to the cumulation issue often accords with the European model. Under
the EU model, rules of origin permit goods from a number of countries that are linked by
trade agreements with identical rules of origin to qualify, and the result is called
“diagonal cumulation”. Some but not all bilateral FTAs negotiated by EFTA follow the
principle of diagonal cumulation; however FTAs with non Euro-Mediterranean partners
do not. Under one version of a diagonal cumulation approach, if both the United States
and Switzerland had FTAs with identical rules of origin with the same third country, that
country’s products would qualify for meeting the rule of origin test in preferential Swiss-
US trade.35
By contrast, as a normal practice, the United States has adopted a “bilateral cumulation”
approach in its FTAs, meaning that only products manufactured in the partner country,
whether sold a final goods or as inputs, qualify for meeting the rules of origin. Following
a “bilateral cumulation” rule, inputs made in Chile, Singapore, or Australia – all countries
with which the United States has negotiated FTAs – would not qualify if they were
embedded as components of a Swiss product shipped to the United States.
35 Under a strict interpretation, diagonal cumulation with third partners linked to both the United States and Switzerland by bilateral FTAs (such as Chile, Singapore or Mexico) would not be possible since the regimes of origin established by these FTAs differ. However, as we suggest in our recommendations, a considerably less strict interpretation would have substantial benefits.
25

Remanufactures. Remanufactures are industrial products assembled from “recovered
goods”. Remanufactured products are typically made from items listed in HS chapters 84,
85 and 87. The parts resulting from the disassembly of a product do not constitute a
“recovered good” unless they are cleaned, inspected, and tested. In the production of a
remanufactured good, the parts must be subjected to welding, flame spraying, surface
machining, knurling, plating, sleeving, or rewinding. The United States contends that
remanufactured products should qualify under the rules of origin, regardless of their
original source. The US auto industry is particularly interested in this provision.
Certification. Switzerland has adopted procedures for the certification of origin that are
significantly different from those adopted by the United States. While US bilateral FTAs
establish declaration of origin by the importer, Switzerland requires certification by the
exporter.
US Bilateral FTAs
Many US bilateral FTAs agreements contain rules that require the preference import to
be wholly made in the partner country, or the “substantial transformation” of components
that originated elsewhere. The underlying principles that define “substantial
transformation” are similar in the US-Chile, US-Australia, US-Singapore, and CAFTA-
DR agreements.
Substantial transformation. Substantial transformation can be achieved by a change in
the tariff classification between inputs from a third country and the exported product,
26

resulting from activity in the territory of the FTA exporter. Depending on the product,
that requirement could correspond to a change involving different HS chapters at the 4-
digit or 6-digit heading level. US bilateral FTAs include a de minimis exception to HS
classification change tests when the product contains 10 percent or less of non-originating
material.
An alternative requirement, which is sometimes combined with the change-of-tariff-
heading rule, is a minimum share of local value added in the FOB value of the product.
Typically, the minimum local content is 35 percent using the “build-up” method and 45
percent using the “build-down” method.36 Chemical products (HS 28 through 40) are
subject to specific rules that define substantial transformation based on the place where
specific chemical reactions occur.
The agreements allow cumulation of origin for inputs originating in the territory of either
party. Thus, for example, Singaporean inputs can be counted as American in US exports
to Singapore and vice versa.
The US-Singapore FTA makes an important effort to give the rules of origin greater
flexibility. It does this through the Integrated Sourcing Initiative (ISI) which applies to
specific products designated in Annex 3B of the agreement. ISI coverage extends to more
36 The “build-down” method estimates the share of the local value added in the FOB price by subtracting overhead, transportation, and similar costs. The “build-up” method, estimates the share of local value added by combining the cost of originating materials used in making the final product. The US-Australia FTA uses a variant, a net cost method, for certain automotive products.
27

than 250 US tariff-lines, representing almost 30 percent of US imports from Singapore in
2004. Based on 2004 data, more than 90 percent of US imports from Singapore of
designated ISI products take place in the following four-digit HS categories: 8470, 8471,
8473, 8479, 8517, 8525, 8534, 8541, 8542, 9021, 9027, and 9030. For the most part
these are information technology products and medical devices.37 The US-Singapore
FTA allows the addition of new products to the ISI list, by mutual agreement of the
parties.
With regards to verification, the agreements require importers to declare the origin of the
products. The agreements allow importers to make a claim for preferential treatment
based on “the importer’s knowledge or on information in the importer’s possession that
the good qualifies as an originating good.” Moreover, the agreements stipulate that each
party will grant any properly filed claim for preferential treatment, unless a party
possesses information that the claim is invalid.
Special textile and clothing rules. Textile and clothing rules of origin in many US
bilateral FTAs include the “yarn-forward rule.” For fabrics to be conferred origin, the
yarns (cotton, wool, and most man-made fibers) must be produced in one of the parties to
the agreement. The transformation (fabric making process, cutting or knitting, sewing,
and finishing activities) must also take place in one of the parties. The yarn-forward rule
37 The actual description for these HS categories are: Calculating and data processing machines, magnetic or optical readers, telecommunication and sound and image transmitting apparatus, semiconductor devices, electronic integrated circuits, orthopedic appliances, instruments and apparatus for physical or chemical analysis, and instruments and apparatus for measuring or checking electrical quantities.
28

is obviously designed to ensure that the maximum amount of manufacturing activity
takes place in the territory of the FTA partners, not third countries. Some Australian
textile producers correctly complain that the yarn rule does not allow them to reap the full
benefits of the agreement since they will not be able to source yarn from cheaper Asian
suppliers.38
There are exceptions to the “yarn rule.” For instance, under the US-Singapore FTA, silk
garments only need to undergo cutting, knitting, sewing and finishing in Singapore in
order to qualify.39 A special provision in that same agreement stipulates that if a
particular type of yarn is designated as “short supply” in the United States, Singaporean
textiles based on yarn from third countries can claim origin if the yarn is transformed in
Singapore.40
Swiss Agreements
38 The Australian Textile, Clothing, and Footwear Union stated to the Senate Commission on the AUSFTA that “Whilst there was potential for considerable benefits to the Australian TCF industry from this agreement, the US insistence on maintaining ’yarn forward’ rules of origin has significantly reduced, if not eliminated, any potential up-side for industry and created a considerable down-side.” The TFC representatives also pointed out that the regime of origin for textiles in AUSFTA is very different from the one of ANZCERTA, that only requires 50 percent value added. (see http://www.aph.gov.au/Senate/committee/freetrade_ctte/submissions/sub204.pdf). 39 For a full treatment of textile rules of origin in US-Singapore, see Circular No 47/2003 of the Customs Service of Singapore (23 December 2003). 40 Textile rules of origin also include a modified version of the de minimis provision. Products that fail to meet the requisite HS classification change, but contain non-originating material of not more than 7 percent of the total weight, can still qualify.
29

Switzerland applies different regimes of origin in various trade agreements -- the Swiss-
EU FTA of 1972; the EFTA Convention; EFTA’s bilateral FTAs; and non-reciprocal
preferential schemes.
The rules of origin in the Swiss-EU FTA (SEFTA) and the EFTA Convention are very
similar. In fact the definition of origin, as it applies to Switzerland, is the same.41 The
current definition of origin detailed in the latest Revision to Protocol Three of SEFTA
stipulates that wholly obtained or substantially transformed products may qualify. The
principles used are change of tariff classification (generally a change of heading),42 and a
maximum amount of third party content (typically between 40 and 50 percent of the ex-
works price).43 For sensitive products, more complex rules combine both principles.
Both regimes facilitate the use of third country inputs through a 10 percent of value
tolerance rule, and by allowing transformation in third-countries as long as there is less
than 10 percent value added.44 Textile products in HS chapters 50 through 63, however,
are excluded from these exceptions.45
41 The definition of origin is also the same in EFTA bilateral FTAs with Bulgaria, Morocco, Romania, Tunisia and Turkey. 42 A tariff heading refers to an HS classification at the 4-digit level. 43 The ex-works price equals the FOB price of a good as it leaves a factory for export. 44 The 10 percent general tolerance rule allows the use of non-originating products up to 10 percent of the ex-works price. 45 However, Note 5 to Annex 1 introduces a different exception for third-country basic textile materials which, when used in the manufacture of certain textile products, represent 10 per cent or less of the total weight of all the basic textile materials used.
30

In both regimes the proof of origin requires the presentation of a certificate (EUR.1) or
the submission of an invoice declaration describing the products “in sufficient detail.”
The exporter, or his authorized representative, is responsible for submitting information
on the origin of products.
In 1992, the Swiss population rejected Swiss participation in the European Economic
Area (EEA). This decision prevented the unification of several rules of origin regimes
that are applied concurrently in Switzerland.46 However, according to the WTO Trade
Policy Review (2004) “the only fundamental difference between the EEA origin regime
and the SEFTA is the full cumulation which can be used within the EEA.”47
Instead of full cumulation, Switzerland has enjoyed, since 1997, so-called “diagonal
cumulation” under the Pan-European Cumulation System. Diagonal cumulation means
that Swiss firms can use inputs from all members of the Pan-European Cumulation
System. All members operate identical origin rules concerning the working or processing
of non-originating materials, and they all consent to cumulate inputs from other members.
46 See Philippe Nell, “Rules of origin – problems and solutions to the Swiss non-participation in the European Economic Area” in the Journal of World Trade (Vol.28, 1994. pg 65-82). 47 According to the User's Handbook to the Rules of Preferential Origin used in trade between the European Community and other European countries, “full cumulation means that all operations carried out in the EEA are taken into account when assessing the final origin. It does not require that the goods be originating in one of the EEA partner countries before being exported for further working or processing in other EEA partners but it does require that all the working or processing necessary to confer origin is carried out on the product.”
31

More than 30 countries participate in this system -- all EU and EFTA members and
Turkey. Many partners in EFTA bilateral FTAs, such as Israel, Jordan and Lebanon, are
in the process of adopting the Pan-European Cumulation System.
Similarly, most EFTA bilateral FTAs define origin in a similar fashion. However,
differences between agreements remain, since EFTA bilateral FTAs with countries such
as Chile, Mexico, and Singapore have tried to include more liberal rules of origin “taking
into account the trade flows between the parties.” These agreements have tried to include
more liberal rules, particularly in those sectors where “either party is faced with a lack of
raw materials.”48
4.6 Recommendations for Manufactures Trade
The Swiss-US FTA should aim at eliminating tariffs on manufactured products to the
maximum extent, and reducing non-tariff barriers arising from technical standards and
conformity assessment practices, and restrictive rules of origin. As the gravity and CGE
models reported in Chapter 8 suggest, the payoff of tariff elimination, will be an
expansion of bilateral trade of at least 20 percent ($3.4 billion) and perhaps more than
100 percent ($17 billion). The US-Singapore and US-Australia FTAs illustrate what an
FTA can achieve, but the Swiss agreement should be more ambitious. In this context, we
offer the following recommendations:
48 See for example the EFTA Secretariat’s description of the Rules of Origin Regime in the EFTA-Mexico FTA.
32

• Switzerland should accord immediate duty free access to nearly all the products
for which Australia gave immediate duty-free access to the United States in 2004.
Those sectors would include autos and auto-parts, chemicals and plastics, metal
products, electrical equipment, and medical and scientific equipment.
• The United States should eliminate immediately nearly all of its tariffs on
watches, chemicals and pharmaceuticals, optical and medical instruments. As in
the US-Singapore FTA, the United States should immediately eliminate nearly all
of its tariffs on Swiss textiles and apparel.
• Phase-outs of 4 years should apply to no more than 3 percent of tariff-lines, and
phase-outs of 5 to 10 years should apply to no more than 2 percent of tariff-lines.
In other words, US and Swiss tariffs on 95 percent of manufactures tariff-lines
should be eliminated immediately. No phase-out of manufactures tariffs should
last longer than 10 years.
• In the context of the FTA negotiations, each party should accord mutual
recognition to approved conformity assessment bodies based in the other country.
The mutual recognition process should be open ended, so that additional bodies
can be recognized at a later date.
• The parties should establish a Working Group on Standards to do two things.
First, on a periodic basis, it should recommend products where US and Swiss
33

technical standards should be harmonized, and products where the mutual
recognition principle should apply. The Working Group should begin in areas
where Switzerland has achieved harmonization or mutual recognition with the
European Union. Second, the Working Group should identify products where
self-assessment by the manufacturer can replace – if the firm desires – third-party
conformity assessment by an independent body.
• “Diagonal cumulation” is clearly the preferable approach to rules of origin –
because it reduces their protective impact and opens up a wider array of sources
for purchased inputs. However, since the United States has no experience with
this approach, it would be too ambitious in the context of the Swiss-US FTA.
Instead, the FTA should establish a Working Party to examine both US and
Swiss FTA networks, with a mandate to identify third countries whose products
could qualify as inputs under the bilateral rules of origin. The qualifying third
countries need not be limited to countries that are partners of both the United
States and Switzerland. Instead for example, on the basis of reciprocity, inputs
from Canada and Mexico (NAFTA partners) might qualify, along with inputs
from selected EFTA partners.
• Swiss firms very often rely on purchased inputs beyond Swiss borders. The same
is true of US firms, but to a lesser extent. A forward-looking Swiss-US FTA
should accommodate, and indeed encourage, integration of the world economy,
in which slices of the value added chain are performed in different countries.
34

This goal can be accomplished by liberal interpretation of the “substantial
transformation” principle: allow remanufactures, provide for low “build-down”
and “build-up” thresholds, avoid stringent change-of-tariff-heading rules. The
least burdensome certification method should be adopted.
• Additionally, for products with low or zero tariffs on an MFN basis, the Swiss-
US FTA should eliminate origin requirements so that firms can benefit from
simplified bookkeeping and customs procedures. The Integrated Sourcing
Initiative (ISI) devised in the US-Singapore FTA provides an excellent model.
35

Table 4.1 Manufactured Goods in US-Swiss Bilateral Trade (1996-2004)(millions current $)
1996 2000 2004
Trade in manufactured products a
US exports 5,598 6,136 6,607Swiss exports 7,023 9,123 10,388Trade balance (US-Swiss) -1,425 -2,987 -3,781
Total bilateral tradeUS exports 5,832 6,488 6,759Swiss exports 7,162 9,272 10,617Trade balance (US-Swiss) -1,330 -2,784 -3,858
Share of manufactures in bilateral trade b 0.97 0.97 0.98
Notes:
a. Trade in manufactures was estimated as total trade in chapters 25 through 97, with the exclusion of gold (HS 7108).
b. (US + Swiss industrial exports) / (US + Swiss total exports).Sources: USITC (2005) and USDA Foreign Agricultural Service (2005).

Table 4.2 Manufactured Exports in Leading 2-digit HS Chapters (2004)(millions current $)
Swiss Manufactured US Manufactured Exports to the Exports to
United States Switzerland
Description 2004 2004HS-91 Clocks and watches and parts thereof 1,695 120HS-84 Nuclear reactors, boilers, machinery; parts 1,675 906HS-90 Optical, cinematographic, medical instruments; parts 1,590 731HS-30 Pharmaceutical products 1,289 1,305HS-29 Organic chemicals 1,191 163HS-85 Machinery, electrical apparatus and instruments; parts 765 322HS-71 Precious stones, metals, pearls and articles thereof; 446 812HS-39 Plastics and articles thereof 182 76HS-88 Aircraft, spacecraft, and parts thereof 164 344HS-97 Works of art, collectors' pieces and antiques 155 936HS-82 Tools, implements, cutlery; parts 153 21HS-32 Tanning or dyeing extracts; dyes, pigments, paints, varnishes 120 107HS-73 Articles of iron or steel 101 68HS-33 Essential oils; perfumery, cosmetic or toilet preparations 88 102HS-48 Paper and paperboard; articles of paper pulp 83 naHS-38 Miscellaneous chemical products 62 105HS-95 Toys, games and sports requisites; parts 52 19
All manufactured exports excluding gold (HS 7108) and special provisions 10,388 6,607HS 7108 Gold 15 2,283HS-98 Special classification provisionsa 832 280HS-99 Temporary legislation; additional import restrictionsb 191 0
Notes: na. Not Available (value of trade below $10 million).a. Trade under "special classification provisions" includes repairs and alterations of previously imported products; donated pharmaceuticals, textiles and food products; non-identified military equipment; small transactions; and US goods returned without having been advanced in value or improved in condition while abroad.b. Not all safeguards correspond to manufactured products.Source: Dataweb USITC (2005).
HS Chapter
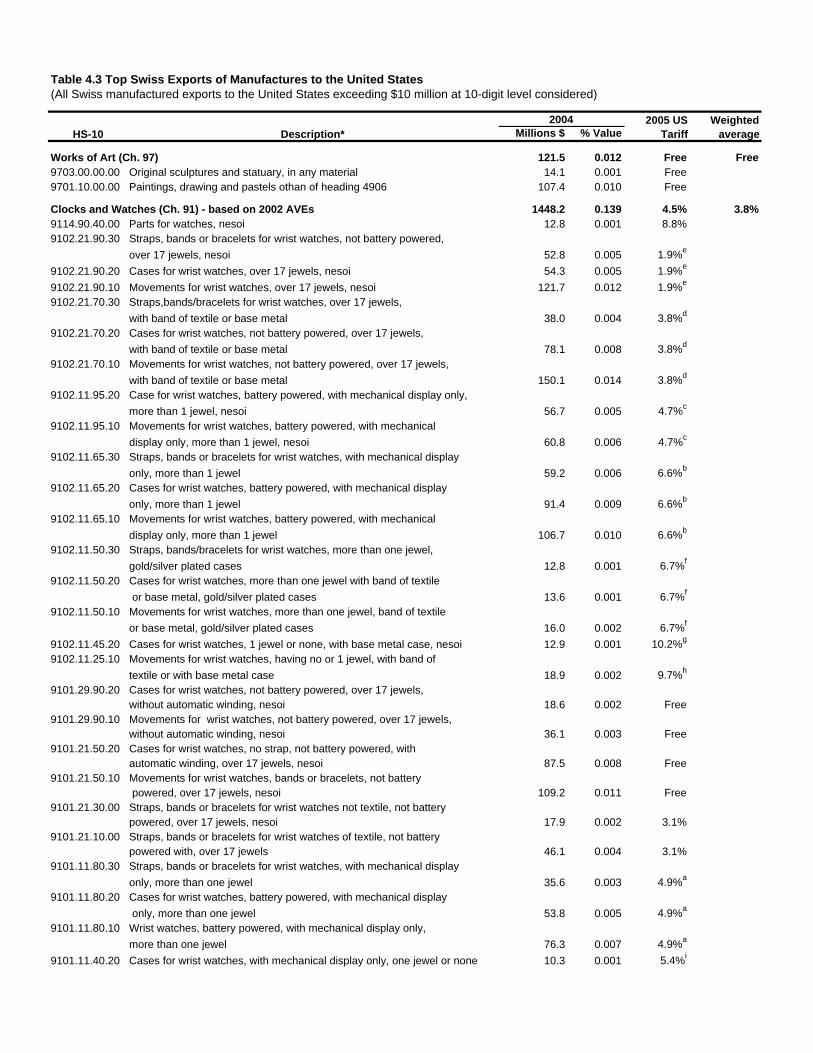
Table 4.3 Top Swiss Exports of Manufactures to the United States(All Swiss manufactured exports to the United States exceeding $10 million at 10-digit level considered)
Millions $ % Value
Works of Art (Ch. 97) 121.5 0.012 Free Free9703.00.00.00 Original sculptures and statuary, in any material 14.1 0.001 Free9701.10.00.00 Paintings, drawing and pastels othan of heading 4906 107.4 0.010 Free
Clocks and Watches (Ch. 91) - based on 2002 AVEs 1448.2 0.139 4.5% 3.8%9114.90.40.00 Parts for watches, nesoi 12.8 0.001 8.8%9102.21.90.30 Straps, bands or bracelets for wrist watches, not battery powered,
over 17 jewels, nesoi 52.8 0.005 1.9%e
9102.21.90.20 Cases for wrist watches, over 17 jewels, nesoi 54.3 0.005 1.9%e
9102.21.90.10 Movements for wrist watches, over 17 jewels, nesoi 121.7 0.012 1.9%e
9102.21.70.30 Straps,bands/bracelets for wrist watches, over 17 jewels, with band of textile or base metal 38.0 0.004 3.8%d
9102.21.70.20 Cases for wrist watches, not battery powered, over 17 jewels, with band of textile or base metal 78.1 0.008 3.8%d
9102.21.70.10 Movements for wrist watches, not battery powered, over 17 jewels, with band of textile or base metal 150.1 0.014 3.8%d
9102.11.95.20 Case for wrist watches, battery powered, with mechanical display only, more than 1 jewel, nesoi 56.7 0.005 4.7%c
9102.11.95.10 Movements for wrist watches, battery powered, with mechanical display only, more than 1 jewel, nesoi 60.8 0.006 4.7%c
9102.11.65.30 Straps, bands or bracelets for wrist watches, with mechanical display only, more than 1 jewel 59.2 0.006 6.6%b
9102.11.65.20 Cases for wrist watches, battery powered, with mechanical display only, more than 1 jewel 91.4 0.009 6.6%b
9102.11.65.10 Movements for wrist watches, battery powered, with mechanical display only, more than 1 jewel 106.7 0.010 6.6%b
9102.11.50.30 Straps, bands/bracelets for wrist watches, more than one jewel, gold/silver plated cases 12.8 0.001 6.7%f
9102.11.50.20 Cases for wrist watches, more than one jewel with band of textile or base metal, gold/silver plated cases 13.6 0.001 6.7%f
9102.11.50.10 Movements for wrist watches, more than one jewel, band of textile or base metal, gold/silver plated cases 16.0 0.002 6.7%f
9102.11.45.20 Cases for wrist watches, 1 jewel or none, with base metal case, nesoi 12.9 0.001 10.2%g
9102.11.25.10 Movements for wrist watches, having no or 1 jewel, with band of textile or with base metal case 18.9 0.002 9.7%h
9101.29.90.20 Cases for wrist watches, not battery powered, over 17 jewels, without automatic winding, nesoi 18.6 0.002 Free
9101.29.90.10 Movements for wrist watches, not battery powered, over 17 jewels, without automatic winding, nesoi 36.1 0.003 Free
9101.21.50.20 Cases for wrist watches, no strap, not battery powered, with automatic winding, over 17 jewels, nesoi 87.5 0.008 Free
9101.21.50.10 Movements for wrist watches, bands or bracelets, not battery powered, over 17 jewels, nesoi 109.2 0.011 Free
9101.21.30.00 Straps, bands or bracelets for wrist watches not textile, not battery powered, over 17 jewels, nesoi 17.9 0.002 3.1%
9101.21.10.00 Straps, bands or bracelets for wrist watches of textile, not battery powered with, over 17 jewels 46.1 0.004 3.1%
9101.11.80.30 Straps, bands or bracelets for wrist watches, with mechanical display only, more than one jewel 35.6 0.003 4.9%a
9101.11.80.20 Cases for wrist watches, battery powered, with mechanical display only, more than one jewel 53.8 0.005 4.9%a
9101.11.80.10 Wrist watches, battery powered, with mechanical display only, more than one jewel 76.3 0.007 4.9%a
9101.11.40.20 Cases for wrist watches, with mechanical display only, one jewel or none 10.3 0.001 5.4%i
HS-102005 US
TariffWeighted
average2004
Description*
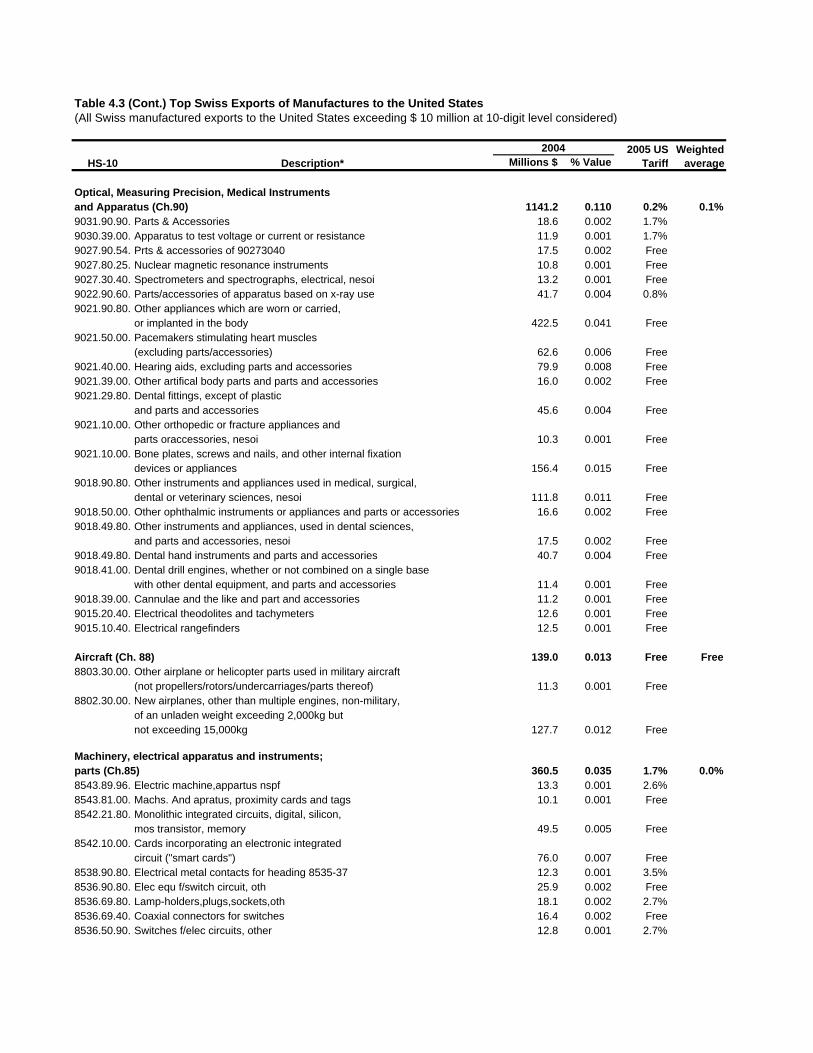
Table 4.3 (Cont.) Top Swiss Exports of Manufactures to the United States(All Swiss manufactured exports to the United States exceeding $ 10 million at 10-digit level considered)
Millions $ % Value
Optical, Measuring Precision, Medical Instruments and Apparatus (Ch.90) 1141.2 0.110 0.2% 0.1%9031.90.90.9Parts & Accessories 18.6 0.002 1.7%9030.39.00.4Apparatus to test voltage or current or resistance 11.9 0.001 1.7%9027.90.54.3Prts & accessories of 90273040 17.5 0.002 Free9027.80.25.0Nuclear magnetic resonance instruments 10.8 0.001 Free9027.30.40.8Spectrometers and spectrographs, electrical, nesoi 13.2 0.001 Free9022.90.60.0Parts/accessories of apparatus based on x-ray use 41.7 0.004 0.8%9021.90.80.0Other appliances which are worn or carried,
or implanted in the body 422.5 0.041 Free9021.50.00.0Pacemakers stimulating heart muscles
(excluding parts/accessories) 62.6 0.006 Free9021.40.00.0Hearing aids, excluding parts and accessories 79.9 0.008 Free9021.39.00.0Other artifical body parts and parts and accessories 16.0 0.002 Free9021.29.80.0Dental fittings, except of plastic
and parts and accessories 45.6 0.004 Free9021.10.00.9Other orthopedic or fracture appliances and
parts oraccessories, nesoi 10.3 0.001 Free9021.10.00.5Bone plates, screws and nails, and other internal fixation
devices or appliances 156.4 0.015 Free9018.90.80.0Other instruments and appliances used in medical, surgical,
dental or veterinary sciences, nesoi 111.8 0.011 Free9018.50.00.0Other ophthalmic instruments or appliances and parts or accessories 16.6 0.002 Free9018.49.80.8Other instruments and appliances, used in dental sciences,
and parts and accessories, nesoi 17.5 0.002 Free9018.49.80.4Dental hand instruments and parts and accessories 40.7 0.004 Free9018.41.00.0Dental drill engines, whether or not combined on a single base
with other dental equipment, and parts and accessories 11.4 0.001 Free9018.39.00.5Cannulae and the like and part and accessories 11.2 0.001 Free9015.20.40.0Electrical theodolites and tachymeters 12.6 0.001 Free9015.10.40.0Electrical rangefinders 12.5 0.001 Free
Aircraft (Ch. 88) 139.0 0.013 Free Free8803.30.00.6Other airplane or helicopter parts used in military aircraft
(not propellers/rotors/undercarriages/parts thereof) 11.3 0.001 Free8802.30.00.6New airplanes, other than multiple engines, non-military,
of an unladen weight exceeding 2,000kg but not exceeding 15,000kg 127.7 0.012 Free
Machinery, electrical apparatus and instruments; parts (Ch.85) 360.5 0.035 1.7% 0.0%8543.89.96.9Electric machine,appartus nspf 13.3 0.001 2.6%8543.81.00.0Machs. And apratus, proximity cards and tags 10.1 0.001 Free8542.21.80.6Monolithic integrated circuits, digital, silicon,
mos transistor, memory 49.5 0.005 Free8542.10.00.0Cards incorporating an electronic integrated
circuit ("smart cards") 76.0 0.007 Free8538.90.80.4Electrical metal contacts for heading 8535-37 12.3 0.001 3.5%8536.90.80.8Elec equ f/switch circuit, oth 25.9 0.002 Free8536.69.80.0Lamp-holders,plugs,sockets,oth 18.1 0.002 2.7%8536.69.40. Coaxial connectors for switches 16.4 0.002 Free8536.50.90.6Switches f/elec circuits, other 12.8 0.001 2.7%
Weighted averageHS-10 Description*
2004 2005 US Tariff

Table 4.3 (Cont.) Top Swiss Exports of Manufactures to the United States(All Swiss manufactured exports to the United States exceeding $10 million at 10-digit level considered)
Millions $ % Value
8536.49.00.6Contactors for a voltage exceeding 60 v but not exceeding 1,000 v 30.1 0.003 2.7%
8535.21.00.0Automatic circuit breakers for a voltage exceeding 1000 v but less than 72.5 kv 10.2 0.001 2.7%
8534.00.00.2Printed circuits, base of plastic with glass, 3 or more layers of conducting materials 13.3 0.001 Free
8516.71.00.8Electric tea makers, domestic 10.5 0.001 3.7%8515.90.30.0Welding machine & appart,parts,other 17.0 0.002 1.6%8515.80.00.8Elec welding machines, nesoi; machines for hot spraying of metals 11.4 0.001 Free8501.10.40.6 electric motors under 18.65w,dc,o/t brushless, nesoi 33.4 0.003 4.4%
Boilers, Machinery & Mechanical Appliances (84) 632.0 0.061 1.1% 1.1%8481.90.90.8Parts,nesoi,of taps,cocks,valves & similar appliances 33.3 0.003 Free8479.90.94.9Other parts of machines and mechanical appliances
having individual functions, nesoi 63.1 0.006 Free8479.89.98.9Other machines and mechanical appliances
having individual functions, parts thereof 48.1 0.005 2.5%8479.89.84.9Machines nesoi for production and assembly of
diodes, transistors & similar semiconductor devices 11.8 0.001 Free8473.30.50.0Parts/accessories of heading 8471 machines, nesoi 10.4 0.001 Free8466.94.85.8Mch pts,n/irn,n/mech trans 13.1 0.001 4.7%8466.93.95.8Mch pts,n/iron,metal,other 16.7 0.002 4.7%8461.40.50.7Gear grinding or finishing machines, metal
removing, valued $3,025 and over, nesoi, new 11.8 0.001 4.4%8456.30.10.2Machine tools for working metal, by electro-
discharge processes, traveling wire (wire-cut) type 27.1 0.003 3.5%8456.10.10. Machine tools for working metal, by laser or other
light/photon beam processes, of numerical control 31.2 0.003 3.5%8452.10.00.9Sewing machines, household type, over $20 each 26.9 0.003 Free8443.90.90.0Parts of printing machinery, except textile,
and machines for uses ancillary to printing 14.1 0.001 Free8443.60.00.0Machines for uses ancillary to printing 35.6 0.003 Free8443.30.00.0Flexographic printing machinery 11.5 0.001 2.2%8441.90.00.0Parts of machinery for making up paper pulp, paper
or paperboard, including cutting machines 13.5 0.001 Free8441.30.00.0Machines for making cartons, boxes, cases, tubes,
drums or similar containers, other than by molding 62.8 0.006 Free8441.10.00.0Cutting machines for paper products 10.9 0.001 Free8431.39.00. Parts of pneumatic elevators and conveyors 18.5 0.002 Free8422.40.91.8Packing or wrapping machinery, nesoi 15.0 0.001 Free8419.89.95.8Industrial machinery, plant/equipment for treatment
of materials, with change in temperature, nesoi 10.1 0.001 Free8419.81.90.4Industrial machinery/equipment used in restaurants
or hotels for making hot drinks or cooking, nesoi 43.9 0.004 Free8415.90.80.8Parts of air conditioning machines, nesoi 15.5 0.001 1.4%8414.90.41.7Parts of compressors, except compressor housings, nesoi 18.7 0.002 Free8413.91.90.8Parts of pumps for liquids, nesoi 11.0 0.001 Free8411.99.90.6Nonaircraft gas turbines parts, except turbojets/turbopropellers 57.4 0.006 2.4%
Pearls and Precious Metals and Stones (Ch. 71) 360.5 0.035 0.9% 1.0%7118.90.00. Gold coin nesoi 20.0 0.002 Free7115.90.05.3Articles of precious metal, in rectangular shapes,
99.5% or more by weight of precious metal, of gold 18.7 0.002 Free
Weighted averageHS-10 Description*
2004 2005 US Tariff

Table 4.3 (Cont.) Top Swiss Exports of Manufactures to the United States(All Swiss manufactured exports to the United States exceeding $10 million at 10-digit level considered)
Millions $ % Value
7114.11.70.00 Silver artls nesoi for office, desk, religious uses; smokers requisites nesoi 10.5 0.001 3.0%
7113.19.50.00 Gold or platinum jewelry, whether plated, clad or not, nesoi 57.3 0.006 5.5%7110.31.00.00 Rhodium, unwrought or in powder form 17.4 0.002 Free7110.21.00.00 Palladium, unwrought or in powder form 32.5 0.003 Free7110.11.00.20 Sponge of the metal platinum 26.1 0.003 Free7103.91.00.20 Sapphires cut but not set for jewelry 11.1 0.001 Free7103.91.00.10 Rubies cut but not set for jewelry 11.4 0.001 Free7102.39.00.50 Diamonds nonindustrial,(cut, faceted, set or
mounted) weighing 0.5 carat and over each 155.4 0.015 Free
Other Chemicals and Plastics (Ch. 32-40) 173.8 0.017 4.6% 3.8%3926.90.98.80 Other articles of plastic,nesoi 16.4 0.002 5.3%3921.12.50.00 Plates,sheets,film,foil & strip,cellular,of
polymers of vinyl chloride,nesoi 10.6 0.001 6.5%3907.99.00.50 Other polyesters,nesoi 10.7 0.001 6.5%3907.30.00.00 Epoxide resins 12.1 0.001 6.1%3824.90.91.50J Chemical products and preparations and residual
products of the chemical or allied industries nesoi 10.9 0.001 5.0%3707.90.32.90 Chem preparations for photographic uses, nesoi 11.4 0.001 6.5%3304.99.50.00 Beauty or make-up preparations & preparations
for skin care (other than medicaments), nesoi 15.5 0.001 Free3303.00.30.00 Perfumes and toilet waters containing alcohol 39.6 0.004 Free3215.19.00.50 Printing ink, not black, offset lithographic 15.3 0.001 1.8%3204.17.04.85 Pigments & preparations based thereon, pigment black 1, etc., nesoi 16.2 0.002 6.5%3204.16.30.00 Reactive dyes and preparations based thereon 15.0 0.001 6.5%
Pharmaceuticals (Ch.30) 1263.0 0.122 Free Free3006.40.00.00 Dental cements and other dental fillings; bone
reconstruction cements 13.3 0.001 Free3004.90.91.90 Medicaments put up in measured doses or in
forms or packings for retail sale, nesoi 280.5 0.027 Free3004.90.91.85 Medicaments primarily affecting the eyes, ears
or respiratory system, nesoi 15.5 0.001 Free3004.90.91.60 Medicaments primarily affecting the digestive system put
up in measured doses or in forms for retail sale 65.8 0.006 Free3004.90.91.40 Medicaments affecting the central nervous system,
in measured doses/packings for retail sale, nesoi 13.7 0.001 Free3004.90.91.30 Anticonvulsants, hypnotics and sedatives, affecting
central nervous system, in doses for retail sale 27.3 0.003 Free3004.90.91.20 Cardiovascular medicaments put up in measured
doses or in forms for retail sale, nesoi 229.7 0.022 Free3004.90.91.15 Antineoplastic and immunosupressive medicaments,
in doses or packings for retail sale, nesoi 31.5 0.003 Free3004.90.91.10 Anti-infective medicaments, in measured doses
or packings for retail sale 28.1 0.003 Free3004.39.00.50 Products of heading 2937 but not containing
antibiotics, not for veterinary use 123.5 0.012 Free3003.90.00.00 Other medicaments consisting of two or more constituents
which have been mixed together etc 149.9 0.014 Free3002.10.01.90 Blood fractions not elsewhere specified or included 84.0 0.008 Free3002.10.01.10 Human blood plasma 200.1 0.019 Free
Weighted averageHS-10 Description*
2004 2005 US Tariff

Table 4.3 (Cont.) Top Swiss Exports of Manufactures to the United States(All Swiss manufactured exports to the United States exceeding $10 million at 10-digit level considered)
Millions $ % Value
Organic Chemicals (Ch. 29) 787.9 0.076 4.8% 5.5%2941.90.50.0Other antibiotics (excluding natural, aromatic
or modified aromatic antibiotics) 17.3 0.002 Free2937.90.00.0Hormones, prostaglandins, thromboxanes and
leukotrienes, natural or synthetic, nesoi 10.8 0.001 Free2936.28.00.0Vitamin e (tocopherols and related compounds with
vitamin e activity) and its derivatives 50.0 0.005 Free2936.21.00.0Vitamins a and their derivatives unmixed 15.5 0.001 Free2935.00.60.0Other sulfonamide drugs (not anti-infective agents) 15.4 0.001 6.5%2934.99.30.0Heterocyclic compounds used as drugs, nesoi 66.9 0.006 6.5%2934.99.12.0Heterocyclic compounds used as fungicides, not
elsewhere specified or included 19.5 0.002 6.5%2933.99.65.0Anticonvulsants, hypnotics and sedatives with heterocyclic
compounds and nitrogen hetero-atom(s) only 50.9 0.005 6.5%2933.99.53.0Cardiovascular drugs, not elsewhere specified 234.4 0.023 6.5%2933.69.60.5Other compounds containing an unfused triazine ring
(whether or not hydrogenated) in the structure 11.3 0.001 3.5%2933.59.46.0Antidepressants, tranquilizers and other psychotherapeutic
agents, with pyrimidine or piperazine ring 14.2 0.001 6.5%2933.49.70.0Compounds with quinoline/isoquinoline ring-system 10.1 0.001 6.5%2933.29.20.0Aromatic or modified aromatic drugs containing an
unfused imidazole ring in the structure 19.2 0.002 6.0%2932.99.90.90 16.4 0.002 3.7%2930.90.90.9Non-aromatic organo-sulfur compounds nesoi 10.3 0.001 3.7%2929.90.15.0Other aromatic compounds with other nitrogen function
of products in u.s.note 3 to section 6 15.6 0.002 6.5%2924.29.47.0Other cyclic amides used as pesticides 83.2 0.008 6.5%2924.19.80.0Acyclic amide derivatives, salts thereof 10.8 0.001 6.5%2922.50.25.0Other aromatic amino-alcohol-phenol drugs 45.5 0.004 6.5%2921.49.43.0Aromatic monoamine drugs, nesoi 26.2 0.003 6.5%2914.29.50.0Other cyclanic, cyclenic, cycloterpenic ketones
without other oxyg 16.2 0.002 4.8%2914.23.00.0Iones and methyliones 16.9 0.002 5.5%2912.29.60.0Other cyclic aldehydes without oxygen function 11.3 0.001 5.5%
Other Industrial Products 204.0 0.020 3.2% 2.9%9503.30.00.0Oth construct set/toy/prts,oth 15.8 0.002 Free8211.93.00.3Pen knives, pocket knives and others with folding blades 19.6 0.002 7.7%k
8202.99.00.0Other saw blades and parts, base metal 19.5 0.002 Free8202.40.60.6Chain saw blades & parts, base metal other, not continuous lengths 18.4 0.002 Free8202.40.60.3Chain saw blades base metal other, continuous lengths 12.4 0.001 7.2%7324.10.00.0Sinks and wash basins of stainless steel 11.4 0.001 3.4%7306.30.50. Tubes, pipes and hollow profiles, welded, nesoi, iron or nonalloy
steel,165mm, cold-drawn, not for boilers 14.2 0.001 Free6203.11.90.0M/b suits of wool lt 30% slk, nt knt/crchtd nesoi 11.2 0.001 17.5%5911.20.10.0Textile products and articles, for technical uses, bolting cloth,
whether or not made up 12.6 0.001 3.3%4811.51.60.0Paper and paperboard, coated, impregnated or covered with
plastics, bleached, over 150 g/m2, nesoi 12.6 0.001 Free4811.51.40.0Paper and paperboard, coated, with plastics, bleached, over 150 g/m2,
15x36x15cm, max 3mm thick, in strips or rolls 19.8 0.002 Free4202.91.00.9Containers, with outer surface of leather, composition
leather or patent leather, nesoi 10.8 0.001 4.5%
Weighted averageHS-10 Description*
2004 2005 US Tariff

Table 4.3 (Cont.) Top Swiss Exports of Manufactures to the United States(All Swiss manufactured exports to the United States exceeding $10 million at 10-digit level considered)
Millions $ % Value
2710.11.15.14 Unleaded gasoline, reformulated 13.1 0.001 1.8%L
2707.10.00.00 Benzene,weight of aromatic constituents 12.7 0.001 Freegreater than nonaromatic
Subtotal 6,632 0.638 2.4% 1.2%
Total Swiss manufactured exports to the United States 10,388 1.000 ---- ----
Total US manufactured imports from all countries 1,353,654 ---- 4.3% 2.6%m
Notes:* Some descriptions have been slightly abbreviated for formatting purposes. a. 2002 ad valorem equivalent of: 87¢ each + 6.25% on the case and strap, band or bracelet + 5.3% on the battery.b. 2002 ad valorem equivalent of: 76¢ each + 8.5% on the case + 14% on the strap, band or bracelet + 5.3% on the battery.c. 2002 ad valorem equivalent of: 76¢ each + 8.5% on the case + 2.8% on the strap, band or bracelet + 5.3% on the battery.d. 2002 ad valorem equivalent of: $1.53 each + 4.2% on the case + 9.8% on the strap, band or bracelet.e. 2002 ad valorem equivalent of: $1.53 each + 4.2% on the case + 2% on the strap, band or bracelet.f. 2002 ad valorem equivalent of: 80¢ each + 6% on the case + 14% on the strap, band or bracelet + 5.3% on the battery.g. 2002 ad valorem equivalent of: 40¢ each + 8.5% on the case + 2.8% on the strap, band or bracelet + 5.3% on the battery.h.2002 ad valorem equivalent of: 40¢ each + 8.5% on the case + 14% on the strap, band or bracelet + 5.3% on the battery.i. 2002 ad valorem equivalent of: 51¢ each + 6.25% on the case, strap, band or bracelet + 5.3% on the battery.j. This number does not match a position at 10-digit level in the 2005 US HTS, thus we only use the first 8 digits.k. 2002 ad valorem equivalent of: 3¢ each + 5.4%.l. 2002 ad valorem equivalent of: 52.5¢/bbl.m. 2002 World Bank Figure cited in 2005 Index of Economic Freedom. (http://www.heritage.org/research/features/index/country.cfm?id=United States)
Source : USITC
Weighted averageHS-10 Description*
2004
2005 US Tariff

Table 4.4 Top US Exports of Manufactures to Switzerland(All US manufactured exports to Switzerland exceeding $10 million at 6-digit level considered)
Millions $ % Value Simple Weighted
Works of Art (Ch. 97) 926.6 0.140 Free Free9706.00 Antiques of an age exceeding one hundred years 37.8 0.006 Free9703.00 Original sculptures and statuary, in any material 87.0 0.013 Free9702.00 Original engravings, prints and lithographs, framed or not framed 13.3 0.002 Free9701.10 Paintings, drawings and pastels, hand executed works of art,
framed or not framed 788.5 0.119 Free
Clocks and Watches (Ch. 91) 82.7 0.013 0.2% 0.3%9101.99 Pocket watches and other watches, except wrist watches, with cases
of precious metal, not battery powered 10.6 0.002 3.6%b
9101.21 Wrist watches, not battery powered, with cases of precious metal (or of metal clad with precious metal), with automatic winding 14.2 0.002 0.1%
9101.11 Wrist watches, battery powered, with cases of precious metal (or of metal clad with precious metal), with mechanical display only 57.9 0.009 0.3%
Optical, Measuring Precision, and Medical Instruments and Apparatus (Ch. 90) 518.7 0.079 0.9%9031.80 Measuring or checking instruments, appliances and machines, nesoi 12.6 0.002 9.4%9027.80 Instuments and apparatus for physical or chemical analysis, nesoi 16.4 0.003 Free9027.30 Spectrometers, spectrophotometers and spectrographs using
optical radiations (ultraviolet, visible, infrared) 10.3 0.002 Free9022.14 Apparatus based on the use of x-rays for medical, surgical, or veterinary
uses, including radiography or radiotherapy apparatus, nesoi 14.8 0.002 Free9021.90 Appliances worn or carried, or implanted in the body, to compensate
for a defect or disability; parts and accessories thereof 177.8 0.027 Free9021.39 Artificial parts of the body (other than artificial joints) and parts
and accessories thereof, nesoi 32.0 0.005 Free9021.31 Artificial joints and parts and accessories thereof 15.1 0.002 na9021.10 Orthopedic or fracture appliances, and parts and accessories thereof 81.0 0.012 Free9018.90 Instruments and appliances for medical, surgical or veterinary sciences,
nesoi, and parts and accessories thereof 83.7 0.013 Free9018.49 Instruments and appliances used in dental sciences, nesoi, and
parts and accessories thereof 11.3 0.002 Free9018.39 Medical etc. Needles nesoi, catheters, cannulae and the like;
parts and accessories therof 10.9 0.002 Free9018.19 Electro-diagnostic apparatus (and apparatus for functional exploratory
examination) nesoi, and parts, etc. 19.7 0.003 Free9014.20 Instruments and appliances for aeronautical or space navigation 22.6 0.003 0.0%
(other than compasses)9001.90 Lenses, prisms, mirrors and other optical elements,
unmounted, other than elements of glass not optically worked 10.5 0.002 2.6%c
Motor Vehicles and Aircraft (Chs. 87 and 88) 385.2 0.058 0.5% 0.2%8803.30 Parts of airplanes or helicopters, nesoi 189.8 0.029 Free8802.40 Airplanes & other aircraft nesoi, unladen weight exceeding 15,000 kg 124.9 0.019 0.1%8802.30 Airplanes and other aircraft nesoi, of an unladen weight exceeding 2,000 kg
but not exceeding 15,000 kg 11.8 0.002 0.1%8703.24 Passenger motor vehicles with spark-ignition internal combustion
reciprocating piston engine, cyclinder capacity over 3,000 cc 30.8 0.005 1.3%8703.23 Passenger motor vehicles with spark-ignition internal combustion reciprocating
piston engine, cylinder capacity over 1,500 cc but not over 3,000 cc 27.9 0.004 0.9%c
Average Swiss Tariffa
HS-6 Description2004

Table 4.4 (Cont.) Top US Exports of Manufactures to Switzerland(All US manufactured exports to Switzerland exceeding $10 million at 6-digit level considered)
Millions $ % Value Simple Weighted
Machinery, electrical apparatus & instruments; parts (Ch.85) 117.1 0.018 2.9% 2.5%8542.21 Electronic monolithic digital integrated circuits 38.9 0.006 Free8541.40 Photosensitive semiconductor devices, including photovoltaic cells;
light-emitting diodes 11.7 0.002 Free8529.90 Parts (except antennas and reflectors) for use with radio transmission, radar,
radio navigational aid, reception and television apparatus, nesoi 14.5 0.002 9.7%c
8522.90 Parts and accessories, except pickup cartridges, for sound reproducing,sound recording, and video recording or reproducing apparatus 20.7 0.003 6.4%d
8517.50 Electrical telecommunication apparatus for carrier-current line systems or for digital line systems, n.e.s.o.i. 12.3 0.002 Free
8504.40 Electrical static converters; power supplies for adp machines or units of 8471 19.0 0.003 1.0d
Boilers, Machinery and Mechanical Appliances (Ch. 84) 640.2 0.097 1.6% 3.3%8481.80 Taps, cocks, valves and similar appliances for pipes, vats, including
thermostatically controlled valves, nesoi 21.9 0.003 8.6%d
8479.90 Parts of machines & mechanical appliances having individual functions 18.5 0.003 0.8%d
8473.30 Parts and accessories for automatic data processing machines and units thereof, magnetic or optical readers, transcribing machines, etc., nesoi 56.3 0.009 Free
8471.80 Automatic data processing units, n.e.s.o.i. 19.5 0.003 Free8471.70 Automatic data processing storage units, n.e.s.o.i. 10.8 0.002 Free8471.60 Automatic data processing input or output units, containing storage
units in the same housing or not, n.e.s.o.i. 13.6 0.002 Free8471.49 Digital automatic data processing machines and units thereof
presented in the form of systems, n.e.s.o.i. 10.6 0.002 Free8440.10 Bookbinding machinery, including book-sewing machines 16.4 0.002 0.1%8411.99 Parts of gas turbines, nesoi (not parts for turbojets or turbopropellers) 52.8 0.008 0.2%8411.91 Parts of turbojets or turbopropellers 187.0 0.028 0.1%8411.82 Gas turbines, not turbojets/turbopropellers, of power over 5,000kw 31.9 0.005 0.0%8411.12 Turbojets of a thrust exceeding 25 kn 20.1 0.003 0.1%8409.91 Parts for use with spark-ignition internal combustion piston engines
(including rotary engines), nesoi 180.9 0.027 10.4%
Pearls and Precious Metals and Stones (Ch. 71) 756.1 0.114 na na7118.90 Coin, nesoi 16.8 0.003 Free7116.20 Articles of precious/semiprecious stones -natural,synthetic/reconstructed 19.6 0.003 3999 Sfr/100kg7113.19 Jewelry and parts thereof, of precious metal other than silver 256.7 0.039 0.7%7112.91 Gold waste and scrap, including metal clad with gold but excluding sweepings
containing other precious metals 49.4 0.007 8 Sfr/100kg7110.21 Palladium, unwrought or in powder form 32.3 0.005 80 Sfr/100kg7106.91 Silver, unwrought nesoi (other than powder) 17.3 0.003 7 Sfr/100kg7103.91 Rubies, sapphires and emeralds, otherwise worked 32.1 0.005 na7102.39 Diamonds, nonindustrial, worked, including polished or drilled 331.9 0.050 800 Sfr/100kg
,Other Chemicals and Plastics (Ch. 32-40) 238.1 0.036 3.3% 4.4%
3824.90 Chemical products and preparations of the chemical or allied industries, n.e.s.o.i.; residual products of the chemical or allied industries, n.e.s.o.i 70.1 0.011 7.8%d
3822.00 Composite diagnotic or laborartory reagents, not heading 3002/3006 pharmas; certified reference materials 16.8 0.003 Free
3304.99 Beauty or make-up preparations and preparations for care of the skin (excluding medicaments) nesoi, including sunscreens and suntan preparations 26.5 0.004 8.1%
3303.00 Perfumes and toilet waters 41.0 0.006 4.4%3206.49 Coloring matter of a kind used for coloring any material or used in the manufacture
of coloring preparations (other than paints or enamels), nesoi 50.8 0.008 1.8%
HS-6 Description2004 Average Swiss Tariffa

Table 4.4 (Cont.) Top US Exports of Manufactures to Switzerland(All US manufactured exports to Switzerland exceeding $10 million at 6-digit level considered)
Millions $ % Value Simple Weighted
3204.19 Synthetic organic coloring matter and specified preparations based thereon, nesoi 14.5 0.002 0.3%d
3204.17 Pigments and preparations based thereon 18.5 0.003 0.6%
Pharmaceuticals (Ch.30) 1259.1 0.191 Free Free3004.90 Medicaments, in measured doses (excluding vaccines, coated
bandages and pharmaceutical goods), nesoi 347.9 0.053 Free3004.40 Medicaments, containing alkaloids or derivatives thereof
but not containing hormones and similar steriods or antibiotics 72.6 0.011 Free3004.39 Medicaments, containing hormones or other steriods
used primarily as hormones, but not containing antibiotics, nesoi 28.3 0.004 Free3003.39 Medicaments containing hormones or other steriods,
but not containing antibiotics, not in measured doses, etc. 486.9 0.074 Free3002.90 Human blood; animal blood prepared for therapeutic, etc. uses; toxins,
cultures of micro-organisms and similar products nesoi 121.0 0.018 Free3002.20 Vaccines for human medicine 70.0 0.011 Free3002.10 Antisera and other blood fractions, and modified immunological
products 132.3 0.020 Free
Organic Chemicals (Ch. 29) 76.8 0.012 0.1% 0.0%2941.90 Antibiotics, nesoi 25.1 0.004 Free2933.99 Heterocyclic compounds with nitrogen hetero-atom(s) only,nesoi 26.1 0.004 na2930.90 Organo-sulfur compounds, nesoi 14.6 0.002 0.1%d
2918.30 Carboxylic acids with aldehyde or ketone function but no other oxygenfunction, their anhydrides, halides, peroxides, etc. 11.0 0.002 0.1%d
Other Industrial Products 148.1 0.023 2.2% 1.6%8703.24 Passenger motor vehicles with spark-ignition internal combustion
reciprocating piston engine, cyclinder capacity over 3,000 cc 30.8 0.005 1.3%8703.23 Passenger motor vehicles, spark-ignition internal combustion reciprocating
piston engine, cylinder capacity 1,500 cc to 3,000cc 27.9 0.004 0.9%d
8108.90 Titanium and articles thereof, nesoi 10.6 0.002 2.1%7602.00 Aluminum waste and scrap 11.1 0.002 Free7307.22 Pipe or tube fittings, nesoi, stainless steel threaded elbows, 27.6 0.004 1.9%d
bends and sleeves5201.00 Cotton, not carded or combed 24.1 0.004 Free4911.99 Printed matter, nesoi 16.1 0.002 8.9%e
Subtotal 5,090 0.771 2.6% 0.8%
Total US manufactured exports to witzerland 6,607 1.000 --- ---
Total Swiss manufactured imports from all countries 88,704 2.3%f 0.8%g
Notes: a. Values reported correspond to ad valorem equivalents for non ad valorem tariffs. When more than one tariff-line (at 8-digits) corresponded to the position at six digits, simple averages were computed. Superscript character corresponding to footnote c indicates that such an approach was taken. b. This value corresponds to the top value of the range for chapter 91 as reported by the WTO Trade Policy review on Switzerland and Liechtenstein. According to UNCTAD the ad-valorem equivalent for that tariff lines is 20.4 percent. The Swiss Federal Customs Administration establishes that the specific tariff for this product is 1.10 Sfr/each unit.c. This value corresponds to the top value of the range for chapter 85 as reported by the WTO Trade Policy review on Switzerland and Liechtenstein. According to UNCTAD the ad-valorem equivalent for that tariff lines is 13.4 percent.d. The tariff level is an average of several tariff lines whose tariffs vary depending on the final use of the product. e. This value corresponds to the top value of the range for chapter 49 as reported by the WTO Trade Policy review on Switzerland and Liechtenstein. According to UNCTAD the ad-valorem equivalent for that tariff lines is 70.9 percent. The Swiss Federal Customs Administration establishes that the specific tariff for this product is 48 Sfr/100kg.Sources: USITC (2005) and UNCTAD (2005).
HS-6 Description2004 Average Swiss Tariffa

Table 4.5 Trade-Weighted Tariffs on Bilateral Trade(Trade-weighted average tariffs affecting industrial trade flows exceeding $10 million at 6-digit or 10-digit level). a
Millions $ Share Millions $ Share United States Switzerlandb
Works of Art (Ch. 97) 927 0.14 121 0.01 0.0% 0.0%Clocks and Watches (Ch. 91) 83 0.01 1,448 0.14 3.8% 0.3%Optical, Measuring and Medical Instruments (Ch. 90) 519 0.08 1,141 0.11 0.1% 0.3%Aircraft (Ch. 88) 385 0.06 139 0.01 0.0% 0.2%Machinery, electrical apparatus and instruments (Ch.85) 117 0.02 360 0.03 0.0% 2.5%Boilers, Machinery and Mechanical Appliances (Ch. 84) 640 0.10 632 0.06 1.1% 3.3%Pearls and Precious Metals and Stones (Ch. 71) 756 0.11 360 0.03 1.0% nac
Other Chemicals and Plastics (Ch. 32-40) 238 0.04 174 0.02 3.8% 4.4%Pharmaceuticals (Ch.30) 1,259 0.19 1,263 0.12 0.0% 0.0%Organic Chemicals (Ch. 29) 77 0.01 788 0.08 5.5% 0.0%
Subtotal 5,001 0.76 6,427 0.62 1.2% 0.8%Total Manufactured Exports to Each Party 6,607 1.00 10,388 1.00 --- ---
Notes:a. Calculations for Switzerland are at the 6-digit level; those for the United States are at the 10-digit level.b. Based on ad valorem equivalents at the 6-digit level as reported by UNCTAD.c. Ad valorem equivalents not reported by UNCTAD.
Sources: USITC and TRAINS
DescriptionUS Exports Weighted Average TariffSwiss Exports

Table 4.6 Selected US Ad Valorem Tariff Peaks (2002)(Tariff peak is defined as tariff above 10%. Textiles, clothing and footware tariff lines are excluded)a
8704.21 G.v.w. Not exceeding 5 tonnes 1 25.0 25.08704.23 G.v.w. Exceeding 20 tonnes 1 25.0 25.08704.31 G.v.w. Not exceeding 5 tonnes 1 25.0 25.08704.32 G.v.w. Exceeding 5 tonnes 1 25.0 25.08704.90 Other 1 25.0 25.04202.19 Other 1 20.0 20.07013.10 Of glass-ceramics 2 16.5 6.97013.99 Other 10 15.4 6.68605.00 Railway or tramway passenger coaches, not self-propelled; luggage vans, post office coaches and other
special purpose railway or tramway coaches, not self-propelled (excluding those of heading no. 86.04) 1 14.8 14.88606.10 Tank wagons and the like 1 14.8 14.88606.20 Insulated or refrigerated vans and wagons, other than those of subheading no. 8606.10 1 14.8 14.88606.30 Self-discharging vans and wagons, other than those of subheading no. 8606.10 or 8606.20 1 14.8 14.88606.91 Covered and closed 1 14.8 14.88606.92 Open, with non-removable sides of a height exceeding 60 cm 1 14.8 14.88606.99 Other 1 14.8 14.88704.22 G.v.w. Exceeding 5 tonnes but not exceeding 20 tonnes 2 14.5 4.09603.10 Brooms and brushes, consisting of twigs or other vegetable materials bound together, with handles or no 5 14.4 8.09102.29 Other 1 14.0 14.07013.29 Other 7 13.9 5.07013.32 Of glass having a linear coefficient of expansion not exceeding 5 x 10⁻⁶ per kelvin within a
temperature range of 0 c to 300 c 4 13.9 7.26905.10 Roofing tiles 1 13.5 13.54203.29 Other 8 13.3 12.66911.10 Tableware and kitchenware 12 13.3 6.07013.39 Other 6 13.0 7.29607.19 Other 1 13.0 13.08540.11 Colour 7 12.9 7.54202.12 With outer surface of plastics or of textile materials 4 12.6 5.97013.91 Of lead crystal 4 12.6 6.07318.11 Coach screws 1 12.5 12.57318.12 Other wood screws 1 12.5 12.56907.10 Tiles, cubes and similar articles, whether or not rectangular, the largest surface area of which
is capable of being enclosed in a square the side of which is less than 7cm 1 12.0 12.0
Minimum TariffbHS-6 Tariff Item
Simple AverageAd valorem Lines
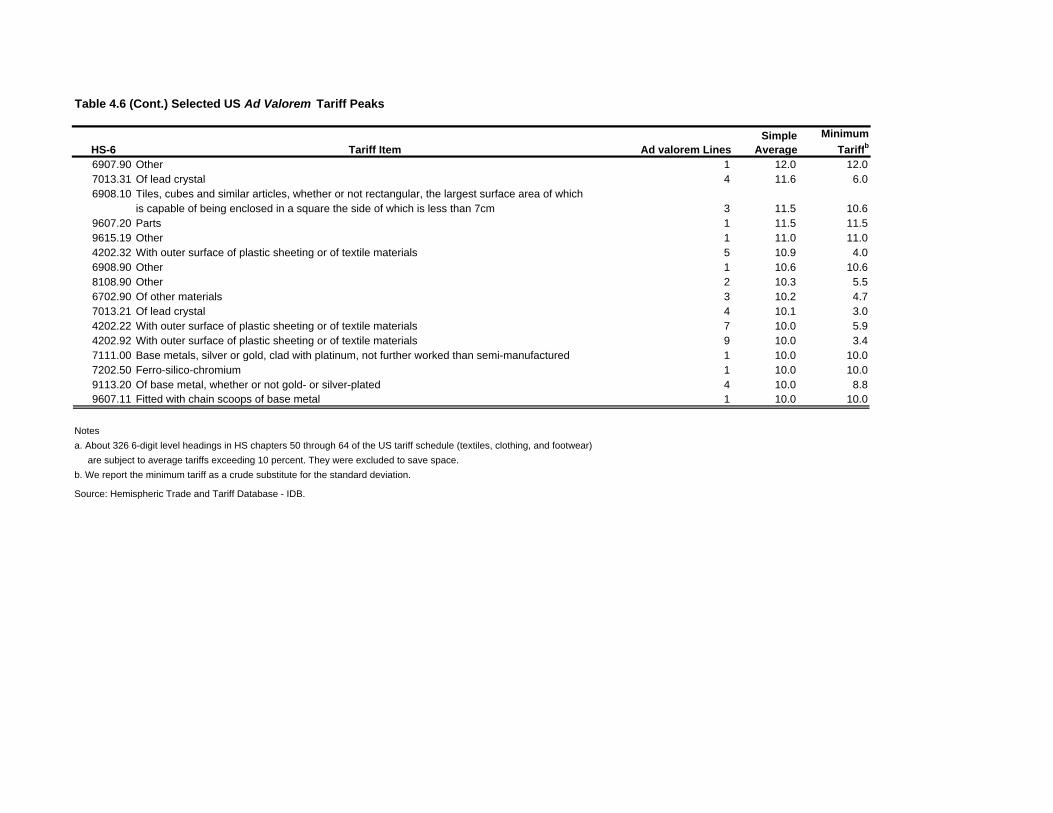
Table 4.6 (Cont.) Selected US Ad Valorem Tariff Peaks
6907.90 Other 1 12.0 12.07013.31 Of lead crystal 4 11.6 6.06908.10 Tiles, cubes and similar articles, whether or not rectangular, the largest surface area of which
is capable of being enclosed in a square the side of which is less than 7cm 3 11.5 10.69607.20 Parts 1 11.5 11.59615.19 Other 1 11.0 11.04202.32 With outer surface of plastic sheeting or of textile materials 5 10.9 4.06908.90 Other 1 10.6 10.68108.90 Other 2 10.3 5.56702.90 Of other materials 3 10.2 4.77013.21 Of lead crystal 4 10.1 3.04202.22 With outer surface of plastic sheeting or of textile materials 7 10.0 5.94202.92 With outer surface of plastic sheeting or of textile materials 9 10.0 3.47111.00 Base metals, silver or gold, clad with platinum, not further worked than semi-manufactured 1 10.0 10.07202.50 Ferro-silico-chromium 1 10.0 10.09113.20 Of base metal, whether or not gold- or silver-plated 4 10.0 8.89607.11 Fitted with chain scoops of base metal 1 10.0 10.0
Notesa. About 326 6-digit level headings in HS chapters 50 through 64 of the US tariff schedule (textiles, clothing, and footwear) are subject to average tariffs exceeding 10 percent. They were excluded to save space.b. We report the minimum tariff as a crude substitute for the standard deviation.
Source: Hemispheric Trade and Tariff Database - IDB.
Simple Average
Minimum TariffbHS-6 Tariff Item Ad valorem Lines

Table 4.7 High US Tariffs on Selected Swiss Manufactured Exports(4-digit level headings facing average applied tariffs exceeding 5 percent)
6203 Men's suits, ensembles, suit-type jackets, trousers, not knitted or crocheted 14.1 39 206204 Women's suits, ensembles, dresses, trousers, not knitted or crocheted 12.4 61 194202 Travel goods, cases, handbags, and other containers, of various materials 10.3 63 179108 Watch movements, complete and assembled 8.3 11 119113 Watch straps, watch bands and watch bracelets, and parts thereof 7.6 5 292710 Petroleum and oils from bituminous minerals and certain derivatives 6.8 15 143204 Synthetic organic coloring matter and preparations 6.6 46 768211 Knives with cutting blades 6.5 14 323809 Finishing agents, dye carriers and preparations for textiles and papers 6.3 5 137113 Articles of jewelry and parts, of or with precious metal 6.3 15 652929 Nitrogen function compounds nesoi 6.3 10 272921 Amine-function compounds 6.0 46 343907 Polyacetals, polycarbonates, alkyds, and other polyesters, in primary forms 6.0 9 269011 Compound optical microscopes and parts and accessories thereof 5.7 4 159013 Liquid crystal devices, lasers, optical appliances and instruments 5.6 5 119102 Watches, wrist, pocket and other, with other cases 5.6 18 1,108 2916 Monocarboxylic acids and their derivatives 5.5 23 253921 Plates, sheets, film, foil and strip nesoi, of plastics 5.5 12 282934 Nucleic acids and their salts, other heterocyclic compounds 5.5 42 1012922 Oxygen-function amino-compounds 5.3 50 582932 Heterocyclic compounds with oxygen hetero-atom(s) only 5.2 17 347010 Glass containers for packing of goods; jars, lids and other glass closures 5.2 6 109114 Clock or watch parts, nesoi 5.2 6 232924 Carboxyamide and other amide-function compounds 5.1 29 1162918 Carboxylic acids with oxygen function, their anhydrides and derivatives 5.0 33 262912 Aldehydes; cyclic polymers of aldehydes; paraformaldehyde 5.0 16 22
Subtotal for High Tariff HS-4 Manufactured Exports 6.7a 600 1,960 Total HS-4 Manufactured Exports over $10 million 2.5b 914 6,632Notes: a. Simple average of all observations in the column.b. Simple average of tariffs for Swiss HS-4 exports to the United States exceeding $10 million. By comparison, in 2002, the simple average US MFN tariff for non-agricultural products (WTO definition) was 4.2%.Source: USITC Dataweb (2005).
2004 Swiss Exports to US (millions $)Heading (HS-4) Tariff Item
Average Tariff (2002)
US Tariff Lines > 5%

(Highest tariff value observed by 2-digit HS Chapter. Textiles and clothing chapters are excluded)
25 Salt; sulphur; earths and stone; plastering materials, lime and cement 15.528 Inorganic chemicals; organic or inorganic compounds of precious metals 16.232 Tanning or dyeing extracts and other colouring matter 16.033 Essential oils and resinoids; perfumery, cosmetic or toilet preparations 24.335 Albuminoidal substances; modified starches; glues; enzymes b 208.236 Explosives; pyrotechnic products; matches; pyrophoric alloys 17.838 Miscellaneous chemical products 20.739 Plastics and articles thereof 15.140 Rubber and articles thereof 16.142 Articles of animal gut (other than silk-worm gut) 16.544 Wood and articles of wood; wood charcoal 18.348 Paper and paperboard 23.966 Umbrellas, sun umbrellas, walking-sticks, seat-sticks, whips 10.067 Prepared feathers and down and articles made of feathers or of down 13.470 Glass and glassware 25.872 Iron and steel 13.273 Articles of iron or steel 20.276 Aluminium and articles thereof 10.181 Other base metals; cermets; articles thereof 30.783 Miscellaneous articles of base metal 15.184 Nuclear reactors, boilers, machinery and mechanical appliances 16.987 Vehicles other than railway or tramway rolling-stock 10.596 Miscellaneous manufactured articles 11.2
Notes:a. Shipments data are not available, nor are numbers of 6-digit tariff lines.
subject to tariffs higher than 50 percent. Only 6 tariff lines in the entire Swiss schedule have rates above 50 percent.
Source: 2004 WTO Trade Policy Review
b. Products with HS codes 35011090 and 35021990 are the only two non-textile industrial products in the Swiss schedule
Table 4.8 Selected Swiss Ad Valorem Tariff Peaks (2004)a
HS-2 DescriptionHighest Tariff
Value

Table 4.9 Phase-outs for Tariffs on Manufactured Goods, US-Singapore FTADistribution of tariff-lines according to phase-out periods for selected productsa
EDF 0 4 8 to 10 EDF 0 to 10ChemicalsOrganic (Ch. 29) 254 160b 337c 207d All 0Pharmaceuticals (Ch. 30) 40 0 1 0 All 0Fertilizers (Ch. 31) 25 0 0 0 All 0Cosmetics (Ch. 33) 32 13 3 0 All 0Starches, enzymes, et al. (Ch. 35) 5 12 4 1e All 0
Consumer goodsJewelry (Ch. 71) 48 33 16 8f All 0Clocks (Ch. 91) 24 39 95 19g All 0
Construction materialsStone, cement, and ceramics (Chs. 68-69) 53 28 20 14i All 0Glass and Glassware (Ch. 70) 39 47 44 28k All 0Tools and articles of metal (Chs .82-83) 55 80 50 8l All 0
Electrical machineryBoilers, machinery; parts (Ch. 84) 547 273 31 0 All 0Electrical apparatus; parts (Ch. 85) 247 316 39 7m All 0
Optical and other instruments (Ch. 90)Optical (HTS 9001-05) 4 24 3 2n All 0Photographic (HTS 9006-10) 41 22 4 0 All 0Medical and other (HTS 9011-30) 109 97 9 4o All 0
PlasticsPlastics (Ch. 39) 28 86 105 3p All 0Rubbers (Ch. 40) 58 78 10 1q All 0
TextilesArticles of apparel (Chs. 61-62) 11r 557 0 0 All 0
Vehicles and transport goodsAircraft (Ch. 88) 17 1 0 0 All 0Automobiles (Ch. 87) 80 61 7 14s All 0Railway and Tramway (Ch. 86) 8 15 2 7t All 0
Total 1725 1942 780 323 All 0as percentage 36% 41% 16% 7%
Notes:General note: As a rule of thumb there is a positive relation between existing MFN tariffs and phase-outs. See notes b, c, and d.EDF. Existing duty-free access.a. All tariff-lines in the corresponding chapter were considered. Note that the number of lines in each chapter varies across countries. Before the agreement Singapore applied tariffs only on beer (HTS 2203) and Samsu (2208.90).b. Tariff-lines enjoying protection lower than 5 percent are for the most part subect to immediate phase-out.c. Medium phase-outs correspond to tariff-lines enjoying moderate tariff protection, ranging between 5 and 8 percent.d. Long phase-outs correspond to tariff-lines enjoying high tariffs above 8 percent. These are fairly evenly distributed throughout the chapter. At 4-digits the most problematic ones appear to be HTS: 2903-04; 2908; 2915-18; 2921-27; 2932-35; and 2942. The relation between existing tariff-protection and phase-outs applies to most manufacturing chapters, with the exception of textiles.e. Stage C (8 years): Other egg albumin (HTS 3502.19.00).f. Stage C (8 years): Unworked or cut but not set precious stones (HTS 7103.10.40 and 7103.9950); iridium (7110.49.00); ropes and chains of precious metal (HTS 7113.11.20, 7117.19.20, 7117.19.90, 7117.90.90); other articles of precious stones (7116.20.50).g. Most of these long phase-outs occur in HTS 9101.29; 9102.29; 9106.90; 9108.90; and 9113.20.i. Most of these long phase-outs occur in HTS 6907.10 and 90; 6908.10; 6911.10; and 6912.00.j. Not used.k. Most of these long phase-outs are related to glassware products (HTS 7113), and in particular: 7113.10; 21-39; 91; and 99. l. Most of these long phase-outs occur in HTS 8203; 8206; 8211; and 8215.m. Most of these long phase-outs occur in HTS: 8513.10; 8513.90; and 8540.11.n. Stage C (8 years): Parts and accessories (HTS 9005.90.40 and 9005.90.60).o. Most of these long phase-outs occur in HTS: 9013.10 and 90; 9015.90 and 9017.90.p. Most of these long phase-outs occur in HTS: 3907.40; 3921.90; and 3926.20.q. HTS 4015.19.10.r. This number differs substantially from the number of tariff-lines enjoying "existing duty-free" treatment in the US Tariff Schedule for the US-Australia FTA. A number of tariff-lines, for example 6103.19.15, changed status in the interval between negotiations.s. Most of these long phase-outs correspond to motor vehicles for the transport of goods (HTS 8704.21 through 90), and bicycles (HTS 8712 through 14).t. All of these long phase-outs correspond to railway or traimway passenger coaches or freight cars (HTS 8606 and 8607).
Sources: US and Singaporean Harmonized Tariff Schedules, USTR
ProductUnited States Singapore

Table 4.10 Phase-outs for Tariffs on Manufactured Goods, US-Australia FTA(Distribution of tariff-lines according to phase-out periods for selected products)a
EDF 0 4 to 18 EDF 0 4 to 10ChemicalsOrganic (Ch. 29) 264 723 1b 310 51 1c
Pharmaceuticals (Ch. 30) 40 1 0 26 8 0Fertilizers (Ch. 31) 25 0 0 22 0 0Cosmetics (Ch. 33) 32 15 1d 17 22 0Starches, enzymes, et al. (Ch. 35) 5 12 5e 12 4 0
Consumer goodsJewelry (Ch. 71) 47 58 1f 34 11 0Clocks (Ch. 91) 21 157 0 47 5 0
Construction materialsStone, cement, and ceramics (Chs. 68-69) 59 40 27g 20 58 0Glass and Glassware (Ch. 70) 43 93 32h 36 30 6i
Tools and articles of metal (Chs .82-83) 52 115 19k 13 93 0
Electrical machineryBoilers, machinery; parts (Ch. 84) 568 289 16l 268 335 0Electrical apparatus; parts (Ch. 85) 278 322 12m 165 184 0
Optical and other instruments (Ch. 90)Optical (HTS 9001-05) 4 27 2n 7 11 0Photographic (HTS 9006-10) 39 20 4o 43 5 0Medical and other (HTS 9011-30) 123 87 8p 108 19 0
PlasticsPlastics (Ch. 39) 28 194 0 12 132 0Rubbers (Ch. 40) 59 88 2q 8 85 0
TextilesArticles of apparel (Chs. 61-62) 45 126 404r 33 0 238s
Vehicles and transport goodsAircraft (Ch. 88) 17 1 0 14 0 0Automobiles (Ch. 87) 81 87 0 40 100 15t
ProductUnited States Australia

Notes:EDF. Existing duty-free access.a. All tariff-lines in the corresponding chapter were considered. Note that the number of lines in each chapter varies across countries. In the chapters considered, the US Tariff Schedule has more entries than Australian one (4800 vs 2650).b. US Headnote, note #4: Tariffs on other chloride-based acid (HTS 2918.90.20) will be removed in equal annual stages over 5 years.c. Stage L (6 years): Other carboloxylic acids with alchohol function (HTAS 2918.90.00).d. Stage B (4 years): Essential oil of peppermint - mentha piperita (HTS 3301.24.00).e. Stage F (18 years): Milk protein concentrate (HTS 3501.10.10) and other cassein (HTS 3501.90.60) Stage B (4 years): Inedible gelatin and animal glue valued under 88 cents/kg (HTS 3503.00.20); dried egg albumin (HTS 3502.11.00); and casein glues (HTS 3501.90.20).f. Stage C (8 years): Unworked Precious stones, other than diamonds (HTS 7103.10.20). g. Stage D (10 years): porcelain or ceramic tableware, kitchenware, other household articles (HTS 6911.10.10 and 6912.00.20) and 6912.00.20). Stage C (8 years): Roofing tiles (HTS 6905.10.00); Tiles, cubes and similar articles (HTS 6907.10.00 and 6907.90.00); and glazed ceramic paving, wall tiles and ceramic mosaic cubes (4 tariff lines in HTS 6908.10 through 6908.90). Stage B (4 years): Ceramic sinks, washbasins, bidets (HTS 6910.90.00); porcelain tableware, kitchenware, other household articles (11 tariff lines in HTS 6911.10.15 through 10.80); ceramic tableware, kitchenware, other household articles (HTS 6912.00.35, 6912.00.46 and 6912.00.48); other ceramic statues, valued over $2.50 each and produced by professional sculptors (HTS 6913.90.50); and other ceramic articles (HTS 6914.10.80 and 6914.90.80).h. Stage D (10 years): Glassware of a kind used for table, kitchen, toilet, office, indoor decoration or similar purposes (7 tariff-lines in HTS 7013). Stage C (8 years): Glassware of a kind used for table, kitchen, toilet, office, indoor decoration or similar purposes (11 tariff-lines in HTS 7013). Stage T1US (6 years): Glass fibers, including glass wool and articles thereof (14 tariff-lines in HTS 7019).i. Stage T1AU (6 years): Glass fibers, including glass wool and articles thereof (6 tariff-lines in HTS 7019).j. Not usedk. Stage B (4 years): Axes and chain saw blades (HTS 8201.40.60 and 8202.40.30); slip joint pliers (HTS 8203.20.40 and 8203.20.60); hand-operated spanners and wrenches (all tariff lines in HTS 8204); handtools, including glass cutters, nesoi (4 tariff lines in HTS 8205); tools for driling (HTS 8207.50.40 and 8207.90.30); certain padlocks (HTS 8301.10.60); harness and saddlery (HTS 8302.49.20 and 8302.49.60); other paper clips (HTS 8305.90.60); bells and the like (HTS 8306.10.00).l. Stage B (4 years): Ball or roller bearings, and parts thereof (all 14 tariff lines in HTS 8482); condensers for steam or other vapor power units (HTS 8404.20.00). Stage C (8 years): Steam turbines for marine propulsion (HTS 8406.10.10).m. Stage C (8 years): Color cathode-ray television picture tubes (HTS 8540.11.10, 8540.11.28, 8540.11.30, 8540.11.48, and 8540.11.50). Stage B (4 years): Other parts of printed circuit assemblies of line telephone handsets (HTS 8518.90.40); other reception apparatus for radiotelephony, radiotelegraphy or radiobroadcasting (HTS 8527.90.95); color cathode-ray television picture tubes (HTS 8540.11.24 and 8540.11.44) ; and cathode-ray tubes and parts (HTS 8540.20.20, 8540.91.15, and 8540.91.50).n. Stage B (4 years): Binoculars, monoculars, other optical telescopes and parts (HTS 9005.80.60 and 90.40).o. Stage B (4 years): Slide projectors (HTS 9008.10.00); photographic cameras valued at less than $10 (HTS 9006.52.60; 9006.59.60; and 9006.40.60).p. Stage C (8 years): Telescopic sights for fitting to arms with infrared light (HTS 9013.10.10) and telescopic sights for rifles (HTS 9013.90.20). Stage B (4 years): Taximeters (HTS 9029.10.40); Drafting tables and machines, plotters and other instruments (HTS 9017.20.70 and 9017.80.00); hand magnifiers, magnifying glasses, and door viewers (HTS 9013.80.20 and 9013.80.40); and telescopic sights for fitting to arms (HTS 9013.10.40).q. Stage C (8 years): Conveyor or transmission belts or belting, of vulcanized rubber with textile components in which vegetable fibers predominate by weight over any other single textile fiber (HTS 4010.19.10); and other gloves, mittens and mitts of apparel and clothing and vulcanized rubber other than hard rubber (HTS 4015.19.50).r. Nealy 87 percent of these 404 tariff lines retain tariffs of 15.5 percent during the 10 year transition period. The rest retain lower tariff on 10 year phase-out, with the exception of 8 tariff-lines that qualify for a five-year phase-out. Cuts will be backloaded.s. Nearly 88 percent of these 238 tariff lines retain tariffs of 15.5 percent during the 10 year transition period. The rest retain lower tariff on 10 year phase-out. Cuts will be backloaded.t. Stage L (6 years): Used or secondhand Passenger vehicles (HTS 8703.21 through 24; 31 through 33, and 90).
Sources: US and Australian Harmonized Tariff Schedules, USTR.

THE SHAPE OF A FREE TRADE AGREEMENT BETWEEN SWITZERLAND AND THE UNITED STATES
Chapter 5
SERVICES TRADE
The service sectors of Switzerland and the United States are already open by international
norms. However, Swiss and US barriers still persist in some industries such as financial
services, network industries, and the audiovisual complex, and assorted obstacles hinder
the cross-border delivery of professional services. A Swiss-US FTA could push the
envelope of service sector liberalization, especially at the canton and state levels, and
promote freer movement of personnel. By removing barriers, both countries could benefit
from faster transmission of advanced technology and management skills. Moreover, US
firms could better take advantage of Switzerland’s geography and commercial expertise.
Foreign companies tend to establish headquarters in Switzerland not so much for
accessing the Swiss market but rather to locate in the heart of Europe and draw on a pool
of qualified personnel (e.g. IBM and Citibank) (Swiss Visiting Report 2005).
This chapter is divided into four sections. The first two sections analyze barriers to trade
in services in the United States and in Switzerland in sectors such as financial services,
network industries (e.g., electricity, telecommunications), the audiovisual complex and
professional services. The third section revisits services trade negotiations in selected US
bilateral FTAs. The last section outlines our recommendations for further liberalization of
services trade in the context of a prospective Swiss-US FTA. 1 Victoria Courmes authored this chapter.
1
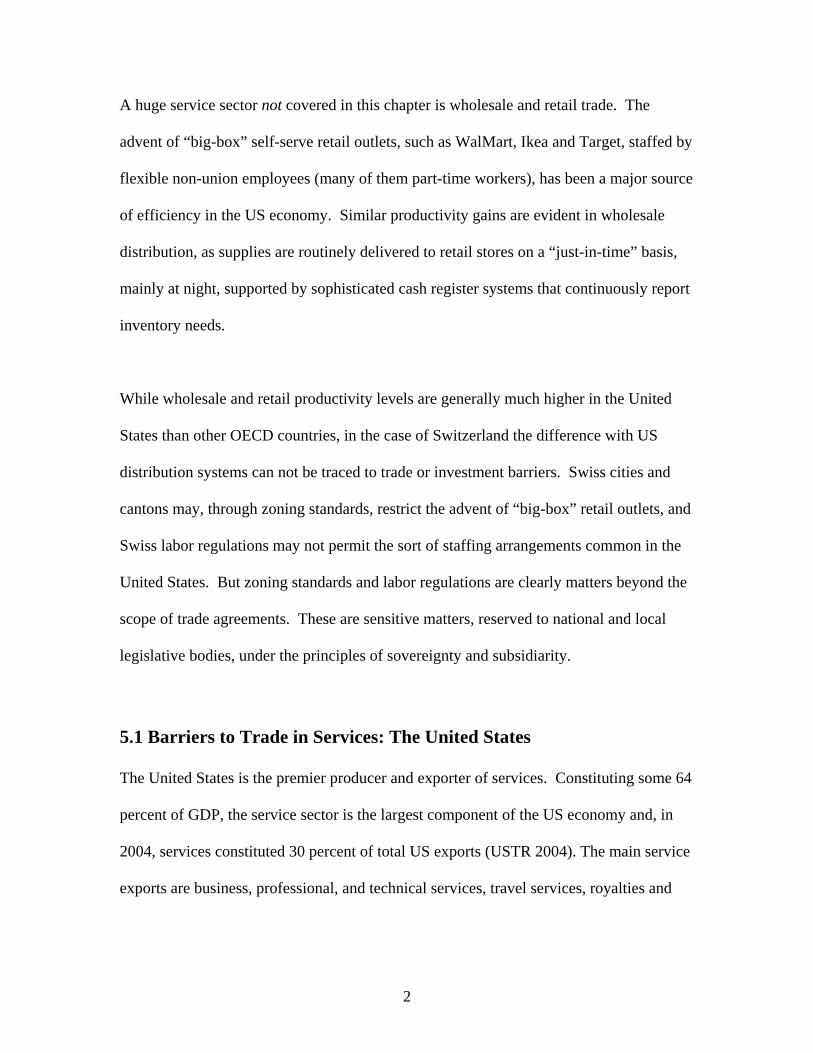
A huge service sector not covered in this chapter is wholesale and retail trade. The
advent of “big-box” self-serve retail outlets, such as WalMart, Ikea and Target, staffed by
flexible non-union employees (many of them part-time workers), has been a major source
of efficiency in the US economy. Similar productivity gains are evident in wholesale
distribution, as supplies are routinely delivered to retail stores on a “just-in-time” basis,
mainly at night, supported by sophisticated cash register systems that continuously report
inventory needs.
While wholesale and retail productivity levels are generally much higher in the United
States than other OECD countries, in the case of Switzerland the difference with US
distribution systems can not be traced to trade or investment barriers. Swiss cities and
cantons may, through zoning standards, restrict the advent of “big-box” retail outlets, and
Swiss labor regulations may not permit the sort of staffing arrangements common in the
United States. But zoning standards and labor regulations are clearly matters beyond the
scope of trade agreements. These are sensitive matters, reserved to national and local
legislative bodies, under the principles of sovereignty and subsidiarity.
5.1 Barriers to Trade in Services: The United States
The United States is the premier producer and exporter of services. Constituting some 64
percent of GDP, the service sector is the largest component of the US economy and, in
2004, services constituted 30 percent of total US exports (USTR 2004). The main service
exports are business, professional, and technical services, travel services, royalties and
2
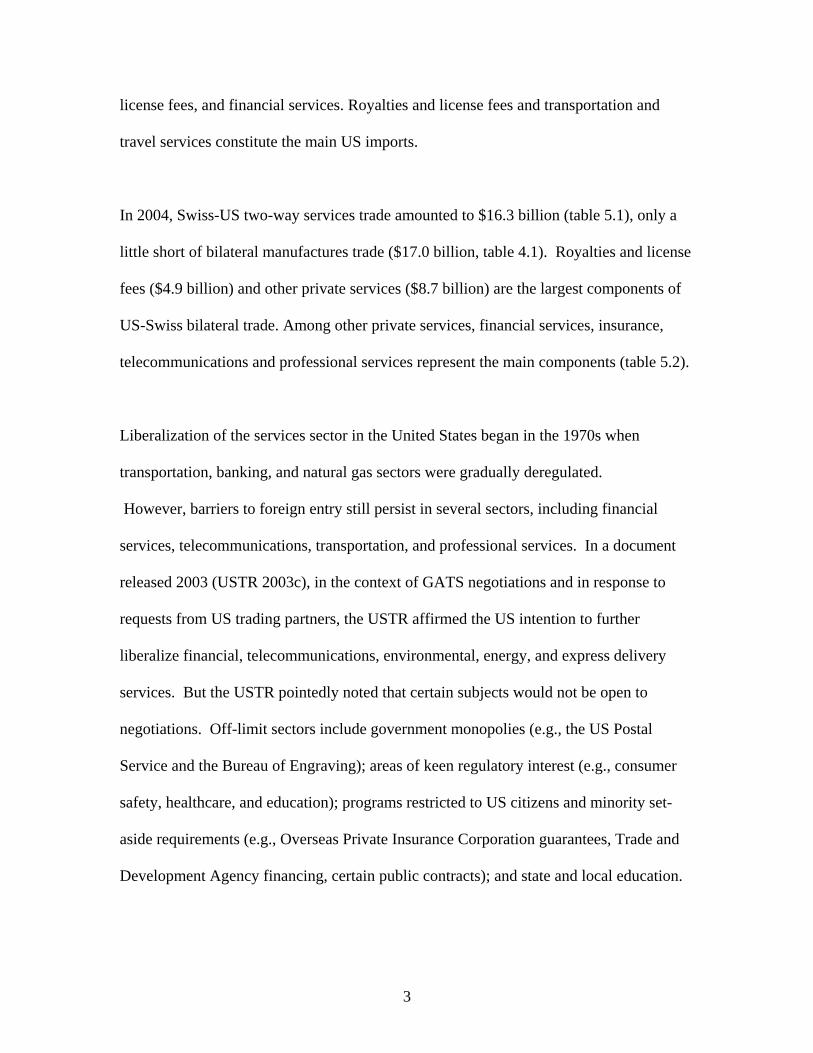
license fees, and financial services. Royalties and license fees and transportation and
travel services constitute the main US imports.
In 2004, Swiss-US two-way services trade amounted to $16.3 billion (table 5.1), only a
little short of bilateral manufactures trade ($17.0 billion, table 4.1). Royalties and license
fees ($4.9 billion) and other private services ($8.7 billion) are the largest components of
US-Swiss bilateral trade. Among other private services, financial services, insurance,
telecommunications and professional services represent the main components (table 5.2).
Liberalization of the services sector in the United States began in the 1970s when
transportation, banking, and natural gas sectors were gradually deregulated.
However, barriers to foreign entry still persist in several sectors, including financial
services, telecommunications, transportation, and professional services. In a document
released 2003 (USTR 2003c), in the context of GATS negotiations and in response to
requests from US trading partners, the USTR affirmed the US intention to further
liberalize financial, telecommunications, environmental, energy, and express delivery
services. But the USTR pointedly noted that certain subjects would not be open to
negotiations. Off-limit sectors include government monopolies (e.g., the US Postal
Service and the Bureau of Engraving); areas of keen regulatory interest (e.g., consumer
safety, healthcare, and education); programs restricted to US citizens and minority set-
aside requirements (e.g., Overseas Private Insurance Corporation guarantees, Trade and
Development Agency financing, certain public contracts); and state and local education.
3

This section reviews impediments to market access in US service activities based on the
2001 and 2004 WTO Trade Policy Reviews (WTO 2001, 2004), the OECD’s 2004
Economic Survey of the United States, selected USTR documents, the 2004 EU
Commission Report on US Trade Barriers (EU Commission 2004), the European
Commission Request to the United States (EC 2002), and a restrictiveness index for trade
services prepared by Findlay and Warren (2001). The industries considered are those of
potential interest to Swiss suppliers: financial services (mainly banking, insurance and
securities), telecommunications, and professional services.
A. Financial Services
Two-way financial services trade between Switzerland and the United States is
substantial, amounting to $750 million in 2003. However, barriers remain, particularly
against foreign insurance firms and foreign participation in the securities markets. In the
document released in April 2003, “Free Trade in Services: Opening Dynamic New
Markets,” the USTR indicates that the United States is willing to curtail the registration
requirements that may discriminate against foreign-owned banks.
Banking
Findlay and Warren’s restrictiveness index indicates that barriers to banking services are
somewhat higher in Switzerland than in the United States (table 5.3). This difference
arises from disparities in ongoing operations (mostly limits on extending the network of
branches) and restrictions on establishing a firm (mainly due to differences in visas and
work permits for professional personnel).
4

For the most part, legislation permits the cross-border supply of banking services.
Accordingly, foreign banks without a commercial presence in the United States may deal
directly with US customers. As a consequence of the US dual banking system -- both
federal and state governments can charter and supervise banks -- foreign banks can
establish a commercial presence by opening either a federal or a state-licensed branch,
agency, or representative office, or by creating or acquiring (as a corporate subsidiary) a
national or state bank (WTO 2004).
Nevertheless, the EU Commission has identified US impediments to foreign participation
in banking services. First, the majority of directors of national banks (i.e., federally
chartered banks) must be US citizens; likewise, half of the states require either all or the
majority of bank directors to be US citizens. In addition, the federal regulator (the Office
of the Comptroller of the Currency, OCC) and some state banking supervisors require
foreign banks to maintain “asset pledges” for funds readily available under US
jurisdiction. The “asset pledges” are in addition to the paid-up capital that the foreign
banks are already bound to maintain in their home country. Legislation has been
proposed that would permit the OCC to vary its asset pledge requirements to reflect the
risk characteristics of different institutions (EU Commission 2004).
Another limitation is that banks cannot automatically expand through the establishment
or acquisition of branches. Some states limit the issuance of branch licenses for foreign
banks; others restrict the opening of representative offices by foreign banks (WTO 2003).
The EU has requested relaxation of these restrictions. Finally, US legislation prohibits a
5
foreign bank branch from accepting a domestic retail deposit of less than $100,000, if the
branch was established after 1991. The EU has requested a reduction in this threshold.
Despite these various restrictions, representatives of the Swiss Banking Association in
Switzerland and Swiss banks operating in the United States question whether a Swiss-US
FTA would bring much to the table for their industry, since Swiss banks are generally
satisfied with US market access (Swiss Visiting Report 2005). Moreover, given the fact
that bank secrecy is an important feature of the banking system, Swiss banks ask whether
a Swiss-US FTA would disturb the existing arrangements for the exchange of sensitive
financial information. However, the US Treasury does not seem inclined to address the
issues surrounding the exchange of financial information in a free trade agreement.
Insurance
The United States has the largest insurance market in the world. The United States is also
a net importer of insurance in its trade with Switzerland (Switzerland is especially
prominent in the reinsurance market).2 The US retail insurance market is highly
segmented because regulations are made at the state level: each insurance company must
be licensed under the laws of each state where it intends to offer insurance (WTO 2004).
Hence, each company faces different solvency, licensing, and operating requirements on
a state-by-state basis. In addition, contrary to banking, there is no such thing as a
federally licensed or regulated insurance company. Market segmentation may impede
2 For unaffiliated companies, US insurance premiums paid to Switzerland from the United States amounted to $2.7 billion in 2003; US premium receipts from Switzerland amounted to $64 million.
6

foreign firms as it entails higher compliance costs: if a foreign insurer wants to offer
nationwide services, the insurer would have to fulfill the licensing requirements of all 50
states.
7

Commercial presence. The 2004 EU Report on US Barriers to Trade and Investment
notes that foreign insurance companies face discrimination on two main fronts. The first
involves the absence of “Port of Entry” legislation in many states. If a foreign insurance
company wants to underwrite risks in a state that does not offer a Port of Entry, it must
first seek a license in another state that does offer such a port before seeking a license in
the targeted state. Second, some states require their insurers to buy reinsurance from
state-licensed companies, before allowing reinsurance premiums to leave the state.
Cross border supply. Most states do not allow companies that are not licensed in the
state to transact insurance business within the state. Nevertheless, certain prominent
insurers are exempted from licensing requirements and are allowed to operate on a cross-
border basis.3 These prominent insurers, such as Lloyd’s, are part of the $9 billion US
“surplus lines” market. However, they face some important constraints. In order to
participate in surplus lines business, foreign insurers (as well as reinsurers) have to be
“white-listed” by the National Association of Insurance Commissioners (NAIC). In
addition (and this is minor), they must name a US attorney, and hold a local trust fund in
a US bank of up to $60 million. In making its determination, the NAIC does not give
much weight to the fact that some foreign companies are effectively regulated in their
home country (EU Commission 2004).
3 By this means, various types of insurance related to maritime shipping, commercial aviation, space launching, and other hard-to place risks, are exempted from licensing requirements.
8

Companies that are not incorporated either within the United States, or in a country with
which the United States has signed a double taxation treaty, are also subject to a federal
excise tax on all insurance premiums ceded abroad.4 The EU has requested the United
States to eliminate this discriminatory tax. Since the United States and Switzerland have a
double tax treaty, this is not a bilateral issue.
Movement of natural persons. Most states require US citizenship and in-state
residency for key personnel in insurance companies. For example, some states require
that a majority of directors, lawyers and brokers be US citizens or permanent US
residents (Mexico and Canada are exempted). Moreover, local brokers must be used in all
states where a risk has been underwritten.
Securities
Foreign and domestic security firms are both subject to regulation by the Securities and
Exchange Commission (SEC). Broker-dealers and investment advisers are required to
register both with the SEC and with state regulatory authorities. There are 25 “primary
dealers” -- a designation that the Federal Reserve gives to select firms that are eligible to
participate in Treasury bill and bond auctions -- and two-thirds of them are US
subsidiaries of foreign firms based in seven countries (WTO 2001). In general, foreign
securities firms are granted national treatment.5
4 The tax rates are 1 percent for reinsurance and life insurance, and 4 percent for non-life insurance. 5 However, the United States took an MFN exemption in its GATS schedule for participation by foreign firms in the issuance of new government-debt securities (mainly Treasury bills and bonds). (GATS 2000, EC request to the United States).
9

Current legislation allows a foreign securities firm to establish a branch in the United
States. However, this process is impractical for many foreign firms, since opening a
branch makes them subject to SEC regulation, which entails costs and might conflict with
home-country regulation (EU Commission 2004). The Investment Company Act of 1940
(as amended) does not allow foreign investment companies (e.g., mutual funds) to
conduct direct public offerings in the United States unless the SEC permits the company
to register under the act. This explains why few foreign funds are registered in the United
States.6 The Act represents a substantial barrier to foreign mutual funds.
However, foreign firms may register as investment advisers under the Investment
Advisers Act of 1940. Thereafter, they may organize a mutual fund under US law and
register the fund under the Investment Company Act. The managers and directors are not
subject to residency or citizenship requirements, and the fund can be managed from
abroad. Despite this “end run,” the EU has requested the opening of the US market to
sales of foreign mutual funds, and has also sought US market access for foreign financial
derivatives (EU Commission 2004).
Finally, regulatory requirements for listing on US stock exchanges became more
burdensome in the aftermath of corporate scandals. The Sarbanes-Oxley Act of 2002 has
increased the cost of access to the US market.7 Several companies are said to have
considered delisting from US stock exchange. However, it is very difficult for foreign
6 Only 19 foreign funds, most of them from Canada, have been permitted to register. The last permission was issued in 1973 (SEC 2002). 7 It is claimed that Sarbanes-Oxley raises costs by imposing stiff accounting and disclosure requirements. Empirical evidence, however, remains scarce.
10

firms to delist under current SEC rules (EU Commission 2004). Moreover, firms that
have more than 300 US shareholders would still be subject to SEC scrutiny even after
delisting.
B. Telecommunications Services
The restrictiveness index for telecommunications services (table 5.4) shows that the
United States has a more open market than its current and prospective FTA partners.
Moreover, the US telecommunication market is the largest in the world and is highly
competitive with mobile, fixed line, cable, and VOIP (Voice Over Internet Protocol) all
fighting for market share. Table 5.2 indicates that, based on current “accounting” or
“settlement” rates, the United States is a net exporter of telecommunications services
with Switzerland and with the rest of the world.8 Given the volume of present and
prospective traffic, conditions of access to the telecommunications sector will probably
be an important issue in FTA talks between Switzerland and the United States.
The Federal Communication Commission (FCC), in cooperation with the USTR, began
the process of international liberalization in 1996. One element of the US strategy was
the GATS Basic Telecommunications Agreement, which entered into force in February
1998. That agreement committed the 69 signatory countries to significant market access.
However, the EC identifies important US barriers in the satellite and mobile sectors.
These barriers include investment restrictions, lengthy regulatory proceedings,
8 In 2003, US exports of telecommunication services amounted to $5.5 billion while US imports amounted to $4.7 billion (Bureau of Economic Analysis 2003). These payments represent “settlement charges” on incoming and outgoing telecommunications traffic respectively.
11

conditionality of market access, reciprocity-based procedures, and certain congressional
attitudes (EU Commission 2004). In April 2003, the USTR stated that the United States
will offer further liberalization in the telecommunications and information services in the
Doha Round. The USTR offer contemplates two things: foreign ownership of cable
television networks, plus direct broadcast by non-US satellite companies to American
viewers. In May 2003, the FCC started a reform program aimed at faster licensing
procedures in the satellite sector. The USTR also seems willing to push for an expanded
ability by foreign companies to provide information services directly to consumers
Despite these offers and initiatives, US market access restrictions are still a matter of
contention (EU Commission 2004). First, the US offer schedule in the GATS only refers
to the liberalization of common carrier networks, and thereby excludes cable networks.
Second, the United States maintains restrictions on foreign ownership. In 2002, the EC
requested that restrictions on direct foreign ownership of a common carrier radio license
be removed.9 Meanwhile, the US firm Comcast retains its exclusive right on satellite-
based services that link up with Intelsat and Inmarsat (EU Commission 2004). Finally,
the United States has retained its MFN exemption on one-way satellite transmission of
DHT and DBS television services, and digital audio services (EU Commission 2004).10
9 The EC claims that non-US citizens and any corporation that was not organized under US laws face restrictions on direct foreign ownership of a common carrier in the communication sector. For example, radio licenses may not be granted to these legal persons (EC 2000). 10 However, the USTR has communicated its willingness to open a new round of negotiations on this issue.
12
C. Professional Services
In 2004, US professional services accounted for 11 percent of GDP and approximately 5
percent of US exports of goods and services. US exports of professional services are
geographically diversified, with 25 percent of the revenues originating from Asia and 16
percent from Latin America. Imports, however, are highly concentrated, the OECD being
the main destination of US payments (WTO 2004).
The Findlay-Warren restrictiveness index for professional services (table 5.5) indicates
that trade barriers to accounting, architectural and engineering services are higher in the
United States than in Switzerland (legal services are an important exception). Table 5.2
shows that, in 2003, the United States exported $0.8 billion of professional services to
Switzerland, with legal services being the largest single category. US imports of
professional services from Switzerland amounted to $0.2 billion and are highly
diversified. The relative severity of restrictions may not be a major explanation of the
favorable US trade balance, since US exports of legal services face higher barriers in
Switzerland than vice versa (see table 5.5). For the most part, US net exports very likely
reflect US comparative advantage.11
The 2004 EU Commission Report on the US Barriers to Trade and Investment notes that,
since the implementation of the GATS schedules for professional services, access terms
for foreign suppliers to the US market for professional services have improved.
11 See Mann (2005), “High-Tech and the Globalization of the American Economy,” forthcoming.
13

Moreover, Plascencia, Freeman, and Setzler (2003), in their article “The Decline of
Barriers to Immigrant Economic and Political Rights in the American States: 1977-
2001,” argue that citizenship requirements for these occupations have dropped
significantly, and that requirements still on the statute books appear to be poorly
enforced.12 However, foreign access is still restrained by differing regulatory and
licensing requirements from state to state. The EU report adds, “the application of Buy
America and positive discrimination provisions as well as burdensome visa procedures
for registration and for obtaining work permits, make it difficult for foreign suppliers of
professional services to enter the US market” (EU Commission, 2004).
Legal services
Total cross-border exports of legal services in 2002 amounted to $3.3 billion and imports
amounted to $1.2 billion (WTO 2004). The surplus in legal services trade reflects the fact
that major US accounting firms have expanded their legal branches abroad (WTO 2001).
In 2000, the United States committed to liberalize its citizenship and residency
requirements for licensing, scope of practice, 13 association of foreign-qualified lawyers
with local lawyers (only possible in 24 states), and association of foreign partner law
firms with local law firms (WTO 2004). US courts have held that nationality
12 This change is attributed to federal court decisions, advisory opinions of state attorneys general, and state legislative and administrative action. 13 US willingness to liberalize citizenship and residency requirements does not, however, imply greater US willingness to extend work visas (e.g., H1-B visas) to foreign lawyers. It only means that, once legally admitted to the United States, foreign-born lawyers should not be denied the right to practice because they are not US citizens, or because they have not resided in a certain state for a period of years.
14

requirements for licensing are prohibited by the US Constitution.14 As of 2003, nine
jurisdictions require in-state offices for licensing and 16 require in-state or US residency
of practitioners (WTO 2004). The EU has requested the United States to remove in-state
residency requirements for commercial companies and natural persons (GATS modes 3
and 4) in Michigan, Texas, and Washington for consultancy practice on the law of the
foreign jurisdiction where the service supplier is already a qualified lawyer (GATS 2000,
EC Request to the United States).
The market for legal services in the United States is currently segmented by different
regulatory requirements across states. The US GATS schedule specifies that legal
services must be supplied by a natural person as opposed to a company. In turn, this
means that barriers to international labor mobility are important – and the United States is
not disposed to grant additional work visas in the context of trade negotiations (WTO
2004). However, the United States is willing to address barriers that take the form of state
residency requirements, and state requirements regarding minimum age, diploma or title,
professional examinations, and registration with a professional body (WTO 2001, 2004).
Accounting and Auditing Services
Foreign accountants who wish to practice in the United States are required to pass the
CPA Uniform Examination, to comply with state laws (which differ across states), and to
meet state board educational or continuing professional education requirements. The EU 14 The California Supreme Court held in Raffaelli v. State Bar of California (1972) that the citizenship requirement for attorneys was unconstitutional. The US Supreme Court issued a similar finding in In re Griffiths (1973), holding that “Connecticut's exclusion of aliens from the practice of law violates the Equal Protection Clause of the Fourteenth Amendment.”
15

has challenged residency and citizenship requirements, and the obligation to create an in-
state office, in several states (GATS 2000, EC Request to the United States).
The EU may also challenge the requirement that accounting firms operating in the United
States abide by US accounting standards, as opposed to the international standards used
in Europe (EU Commission 2004). The SEC has rejected several requests to allow the
domestic use of international accounting standards. The EU argues that this “regulatory
trade barrier” must be resolved (GATS 2000, EC Request to the United States).
Finally, the Sarbanes-Oxley Act of 2002 could have a substantial impact on US-listed
Swiss companies and on Swiss auditing firms. New provisions on audits and corporate
governance might conflict with the laws Swiss firms face at home (EU Commission
2004). Whether or not it creates a conflict of laws, the Sarbanes-Oxley Act will likely
entail higher costs. Essentially, foreign firms that list their shares on US security markets
need to comply with US governance and auditing standards, as well as standards in their
home country. Moreover, the law obliges all accounting firms that do business in the
United States (e.g., by auditing foreign firms that list their shares on US security markets)
to register with the Public Company Accounting Oversight Board (PCAOB). This
requirement conveys an objectionable “extraterritorial” flavor to some foreign firms
(WTO 2004).
Engineering Services
As with other services, engineering services face market segmentation owing to different
regulations from state to state. Citizenship and in-state residency requirements persist in
several states. The EC has requested the United States to abolish citizenship requirements
16

in the District of Columbia and in-state residency requirements in Idaho, Iowa, Kansas,
Maine, Mississippi, Nevada, Oklahoma, South Carolina, South Dakota, Tennessee,
Texas, and West Virginia (GATS 2000, EC Request to the United States).
.
5.2 Barriers to Trade in Services: Switzerland
Switzerland’s service sector accounts for more than two-thirds of GDP, with financial
services (banking and insurance) representing 11 percent and tourism another 6 percent.
However, certain service sectors are shielded from competition through market
segmentation, and border barriers. Switzerland’s free trade agreement with the European
Union triggered some reforms, but further liberalization remains a goal. The conclusion
of a Swiss-US FTA could prompt reforms in the Swiss market, to the benefit of both
parties.
After summarizing Switzerland’s competition law, we review impediments to market
access based on the 2004 WTO Trade Policy Review (WTO 2004), the OECD’s 2004
Economic Survey of Switzerland (OECD 2004), USTR reports on Swiss barriers (USTR
2003, 2005), the Economist Unit Intelligence country profile (EIU 2004), and a
restrictiveness index for trade services prepared by Findlay and Warren (2001). The
industries considered are two network utilities, electricity and natural gas; two other
network activities, the postal services and telecommunications; professional and
audiovisual sectors; and financial services. Several of these have elements of “natural
monopoly”, so we start with a discussion of competition law.
17

A. Switzerland’s competition law
Compared with other industrial countries, Swiss legislation designed to increase market
competition is relatively new. The main texts were adopted in the mid-1990s in the
context of the economic “revitalization program”, as a way to align Switzerland with the
EU and other OECD members. The main pieces of legislation include the Federal Act on
Cartels and other Restraints of Competition (LCart, adopted in 1995); the Regulation on
Business Merger Control (1996); the Domestic Market Act (DMA, 1995) and the Act on
Technical Hindrances to Trade (1996).
LCart was the first legislation to give the competition authorities decision-making
powers. It was amended in June 2003, and the new version entered into force in April
2004. One amendment enabled the immediate imposition of sanctions. Another gave the
authorities a leniency option, to be used in appropriate cases. Prior to the 2003
amendments, sanctions could only be imposed in the event of repeated offences (which
never occurred) (OECD 2004). In other words, before 2003, companies had a free pass to
break the competition law, and be caught once or twice before facing any penalty.
The competition authority comprises both the Competition Commission (or COMCO, the
decision-making body) and its Secretariat (the investigation body). The authority is
responsible for applying LCart, by rendering decisions on antitrust and merger cases.
COMCO can make recommendations to the political authorities, and answer general
questions relating to competition. COMCO is also empowered to ensure that the
18
Confederation, cantons, communes and other bodies with public responsibilities comply
with the provisions of the Domestic Market Act (DMA).
Many areas that are subject to additional regulation, such as imposing a state pricing
system or granting special entitlements to certain companies to carry out public tasks.
Nevertheless, they are not formally excluded from LCart and the law remains applicable.
(For example, the telecommunications incumbent Swisscom has faced several
investigations by COMCO). are excluded from LCart..
B. Financial Services
One of the most stable and sophisticated countries in the world, Switzerland is a key
financial center. Financial services represent approximately 11 percent of Swiss GDP.
Swiss-US commerce in financial services amounted to approximately $800 million in
two-way trade in 2004.
Banking Services
Switzerland requires all branches, subsidiaries, and agencies of foreign banks to obtain a
license from the Swiss Federal Banking Commission (SFBC) as a condition of operation.
Once a license has been granted, foreign banks enjoy the same status as Swiss banks
(WTO 2004). In 2000, the SFBC extended its licensing requirements to Internet-
exclusive banks and securities dealers. While the SFBC has the right to supervise foreign
banks, it also allows foreign supervisory agencies to inspect their banks in Switzerland.
19
The Investment Fund Act (IFA) regulates investment funds. Foreign funds can be
established if the representative agent is a Swiss resident and has a license (WTO 2004).
An important feature of the Swiss banking system is secrecy. While bank secrecy does
not affect market access, and lies well outside the scope of an FTA, the issue has come up
in other international settings. The European Union in particular has pressured the Swiss
government to modify its banking secrecy laws. In January 2003, EU members reached a
political agreement to introduce a system of information exchange to avoid tax evasion
within the European Union. Under the agreement, national regulators in Austria, Belgium
and Luxembourg will be allowed to maintain bank secrecy contingent on the collection of
a withholding tax on interest and dividends paid to EU residents (OECD 2004). The EU
and Switzerland reached a similar agreement that entered into force on July 1, 2005. The
agreement was accepted by popular vote, in the course of a referendum. A prospective
US-Swiss FTA could also face the challenge of a referendum when dealing with the
Swiss banking sector. However, the US Treasury seems disposed to deal with the tax
evasion and anti-money laundering aspects of information exchange in a different context
than a free trade agreement.
Insurance Services
Since it has the highest per capita insurance expenditure in the world, Switzerland’s
insurance market is extremely appealing to foreign competitors. Certain barriers to
foreign entry still persist. Foreign insurers attempting to do business in Switzerland are
required to establish a subsidiary or a branch in Switzerland and may offer only those
20

types of insurance for which they are licensed in their home countries. The manager of
the foreign-owned branch must be resident in Switzerland and the majority of the board
of directors of the Swiss subsidiary must have EFTA citizenship. However, foreign
companies offering only reinsurance are not subject to oversight by the supervisory body,
the Federal Office of Private Insurance (FOPI).
Public monopolies exist for fire and natural damage insurance in 19 cantons, and for the
insurance of workplace accidents in certain industries (WTO 2004). Private insurance
firms must establish a fund, amounting to between 20 percent and 50 percent of their
minimum capital requirement, available at short notice to cover potential losses. As part
of the bilateral agreement with the European Union, EU non-life insurers are not required
to deposit a certain percentage of their assets with the Swiss National Bank (SNB), but
EU life-insurers are so required. All other non-EU insurers are required to make this
deposit, and US insurers face this requirement (OECD 2004).
C. Network Industries
Most network industries are only partially liberalized and the degree of liberalization
differs among them. The absence of competition abets higher prices (evidenced by the
fact that prices in Switzerland exceed the OECD average) and probably limits
productivity gains. As the Swiss-EU free trade agreement concerns only goods, the
liberalization process of services has been slower and pursued less aggressively in
Switzerland than in the European Union. Non-trade barriers still insulate four of
21

Switzerland’s network industries: electricity, natural gas, telecommunications, and postal
services.
Electricity
Electricity is the main source of energy produced in Switzerland. Switzerland counts 350
hydroelectric plants and five nuclear power plants. Electricity is considered as a good;
imports are duty free and, like exports, they are not curtailed by licensing requirements.
Production is competitive, but public monopolies dominate electricity transmission and
distribution within Switzerland. To the extent that they are only factual monopolies (as
opposed to public legal monopolies), they are nullified by the Cartel Law (Lcart), as the
Swiss Supreme Court confirmed in 2003. Cantons and municipalities own 72 percent of
capital invested in the electricity industry. Energy revenues are a substantial source of
financing for local governments (Sfr 700 million a year, some 0.2 per cent of GDP). The
non-competitive character of this sector, along with the high taxes set by cantons and
municipalities, make electricity rates for the Swiss industry the fourth highest among
countries that belong to the International Energy Agency (WTO 2004). Many regional
and local activities are cross-subsidized by cantons, on the basis of revenues and taxes
collected on electricity generation and transmission.
In a referendum launched by the Swiss labor unions in 2002, the population rejected a
proposed Energy Market Law (EML) aimed at permitting third party access to the grid.
In part, this reflected a general lack of confidence in liberalization, owing to private-
sector management problems, particularly the collapse of Swissair and scandals in the
22

United States (OECD 2003). However, most experts argue that lower energy power
prices in neighboring countries will eventually force Switzerland to adapt, triggering a
restructuring process. Consequently, the Federal Council proposed a new electricity
supply law and an urgent temporary amendment to the Electricity Law (EIU 2005). The
goal is to nest the Swiss electricity industry within the European Union. The proposals
encompass two phases. The first phase, which is supposed to start in 2007, will allow
commercial users to choose their electricity supplier (EIU 2005). Furthermore, the first
phase envisages the following additional measures :
• Legal unbundling of transmission from commercial activities.
• Merging of transmission operators into a single system (Swissgrid).
• Establishing an independent regulatory agency for the electricity sector.
Originally a second phase foresaw full market liberalization in 2012, unless it was
defeated in a referendum. In the course of parliamentary debate, the second phase
proposal has now been modified. Full liberalization (regulated third party access, rTPA,
according to the EU-model) is proposed from the moment of entry into force of the law
(2007), accompanied both by extensive security of supply provisions (the so-called
“Oregon model”) for households and small business enterprises consuming less than 100
MWh per year, and by measures in favor of electricity from renewable sources.
Natural Gas
The natural gas sector faces much the same restrictions and challenges as the electricity
sector. Liberalization of the natural gas market is high on the Swiss government’s reform
23

agenda. However, after the failed attempt to restructure electricity (rejection of the EML),
the project of liberalizing gas was aborted. Contrary to electricity, the legal regime
governing the gas sector already applies negotiated third party access (by virtue of the
law on pipelines). However, current initiatives by a few private companies to create a
gas market and enable third party access to the pipeline grid are making little headway.
The initiatives do not provide for the creation of an independent regulator and
consequently could raise competition law issues. Moreover, the lack of unbundling
between non-commercial and commercial activities, as well as the necessity to negotiate
transport tariffs on a case-by-case basis, are both handicaps for gas trade.
Telecommunications
The telephone network in Switzerland is one of the densest in the world and Internet
usage is growing at a fast rate (WTO 2004). The Swiss telecommunications sector was
liberalized in 1998. After the sector was open to foreign investment and competition,
three different operators -- Swisscom, TDC Switzerland (sunrise), and Orange -- became
the main players in the mobile telephone market.15 With a stake of about 63 percent in
Swisscom’s capital, the Swiss Confederation still plays a leading role (WTO 2004). The
foreign restrictiveness index for telecommunications services (Findlay and Warren 2001)
indicates that discrimination against foreign firms persists in Switzerland, and that entry
barriers are higher in Switzerland than they were in the United States (table 5.4).
However, it must be added that the values calculated in this study are based on 1996
15 Since 1998, liberalization has attracted approximately 40 providers for mobile network services (WTO 2004).
24

barriers, whiiich was before Switzerland’s telecommunications liberalization in
Switzerland. Most probably, Switzerland’s barriers are nearly as low as US barriers
today.table 5.4 also shows that Switzerland’s barriers to trade in telecom services are low
compared to most other current and prospective US FTA partners.16
In Switzerland, the new foreign entrants were able to gain substantial shares of the Swiss
national long-distance and international markets for fixed-line services, respectively 32
and 46 percent in 2002 (WTO 2004). However, Swisscom retains a dominant role in the
local market.17 In 2001, the independent regulator, the Federal Communications
Commission (ComCom), attempted to unbundle the local loop and dismantle the federal
monopoly on network infrastructure. Those efforts were defeated in Swiss courts. The
Swiss Federal Council then approved a telecommunications reform package.
The first part of the reform proposal, which took effect in April 2003, gave ComCom the
legal authority to order Swisscom to provide leased lines at cost-oriented prices.
ComCom then ordered Swisscom to lower its interconnection rates by between 25
percent and 35 percent, starting in January 2004 (WTO 2004). The USTR report notes,
“the ComCom decision is retroactive for the past three years and will ultimately force
Swisscom to reimburse tens of millions of Swiss francs to Sunrise and MCI WorldCom,
Swisscom’s direct competitors” (USTR 2005). However, claiming that its rates were
already aligned with those of EU members, Swisscom took the ComCom decision to the
16 Rankings are better for Chile, Australia, and New Zealand. 17 According to the WTO (2004), Swisscom operates 99 percent of subscriber lines and 72 percent of the local traffic.
25

Swiss Federal Court. In October 2004, the Federal Court approved the appeal for formal
reasons and referred the matter back to the ComCom for reassessment. In an order issued
mid-June 2005, the ComCom took a fresh decision that is largely identical in terms of its
content with the decision issued in 2003. Swisscom has announced that it will challenge
the new ComCom decision in the Swiss Federal Court.
In the second part of the reform proposal, the Swiss Federal Council recommended an
amendment of the Law on Telecommunications to unbundle Swisscom’s local loop, to
eliminate state authorization requirements for market access, and to establish an
independent body to resolve simply and quickly any disputes between users and
providers of telecommunications services. After deliberating on these proposals, in
October 2004, the lower House of the Parliament (the National Council) passed
legislation to allow telecom operators to set their own fees and charge their clients
directly for the use of subscriber lines, to unbundle the local loop, and to allow operators
physical access to the cabling network. The Senate (Council of States) -- in its resolution
of June 2005 – even went a stage further with the liberalization. Because of the divergent
decisions taken by the two Parliamentary Councils, they will have to reconcile their
differences in the coming months.
The USTR has evaluated the issue of termination charges for mobile calls in Switzerland.
Switzerland’s rates are said to be particularly high, and there is no regulatory oversight.
Swisscom still retains substantial monopoly power and has succeeded in blocking any
26

attempts by ComCom to change the current regulation (USTR 2005). However,
Swisscom announced in May 2005 that it will reduce its termination charges.
Postal Services
Switzerland has a dense network of post offices of different sizes. Only a quarter of them
record an accounting profit. La Poste/Die Post has estimated its annual operating loss to
be Sfr 500 million (OECD 2004). This loss is covered by profitable business in reserved
areas such as domestic first class mail and inbound international letters.18 At prevailing
exchange rates, postal service prices remain the highest in the OECD (OECD 2004).
Swiss postal services are divided into three different market segments: “reserved”
services, offered exclusively by Swiss Post as a monopoly under its universal services
obligations; “non-reserved” services, also offered by Swiss Post under its universal
services obligations, but in competition with other suppliers; and liberalized services.
The first segment, reserved to La Poste/Die Post, consists of domestic and incoming
international mail for letters. A lowering to 100 grams of the maximum size of letters
subject to the postal monopoly is foreseen for 2006, if a study (to be published in 2005),
concludes that Swiss Post can still finance its universal service obligations.19
18 Letters are defined as any mail of dimensions not exceeding 353 x 250 millimeters, a thickness of 2 centimeters, and a weight of 1 kilogram. 19 At present the incumbent firms in the EU member states and Switzerland retain monopoly rights over letters up to 100 grams (first class mail in US terminology). The limit within the EU is supposed to be reduced to 50 grams by 2006. Full liberalization of the market for EU letters is planned for 2012 (OECD 2003b). However, in Switzerland, this second phase of liberalization is limited to letters over 100 grams and is conditioned “on the result of analyses of reform processes in Switzerland and in the EU, and on the condition that the universal service can be financed” (OECD, Switzerland Economic Survey, 2004).
27
The second market segment includes outbound international services for letters as well as
all postal services (domestic and international) for packages up to 20 kilograms. Licenses
are required for all non-reserved services if turnover exceeds Sfr 100,000 (newspaper and
magazine subscriptions are exempted) (WTO 2004). (Smaller services are open to
competition and do not require licensing.) Unlike its private competitors, La Poste/Die
Post has the obligation to provide universal service. The implication is that La Poste/Die
Post is obliged to provide service in the first (“reserved services”) and second market
segment (“non-reserved services”) in the whole country at the same price (OECD 2004).
The third market segment includes express delivery services and parcels of more than 20
kilograms. This is already fully liberalized. La Poste/Die Post is not obliged to provide
these services on a universal basis (OECD 2004).
D. Audiovisual Services
Switzerland does not set quotas on non-Swiss or non-European origin programming.
However, film distributors and cinema companies are expected to maintain a certain
diversity in the programs they offer. Since 2002, a law permits the government to levy a
nominal development tax on the tickets sold by a region’s movie theater if the
government judges that the content is not sufficiently diversified. The proceeds of the
development tax will be redirected toward the financing of new theaters within the region
that are willing to offer greater diversity (USTR, 2005).
28
E. Professional Services
The Swiss-EU Agreement on Free Movement of Persons, signed in 2002, marginally
facilitated the employment of foreign workers by domestic Swiss firms.20 However,
professional services perfectly illustrate activities facing market access barriers within
Switzerland. Professional services are subject to regulations in different cantons, leading
to entry barriers not only against foreigners but also between cantons. A Swiss-US FTA
could have a positive impact on the free movement of people, as it would increase
mobility between cantons (Swiss Visiting Report, 2005).
While barriers to entry differ from profession to profession, they are pervasive for
accountants, lawyers, architects and engineers. Barriers include compulsory certificates to
exercise a profession; special permits to work in a given canton; and fixed or
recommended prices. More certificates are being granted by the cantons, but
authorizations to exercise a profession are still required, and are often conditioned on
solvency and insurance. Moreover, the Swiss Federal Tribunal has refused to recognize
the right of establishment by professional firms. The Tribunal supports cantonal decisions
that reject certificates issued either by another canton or by a foreign government. Hence,
a professional firm may not be able to practice in a given canton, even though the
applicant has already been recognized in another canton (WTO 2004). All this adds up to
formidable entry barriers.
20 The IMF reports that foreign labor force increased by 2 percent annually in 2003 and 2004. Also see Swiss National Bank (2004).
29

Fortunately, it appears that, from a Swiss standpoint, all professional services can be
negotiated in the FTA with the United States, except for the medical profession (Swiss
Visiting Report 2005). The Swiss health system entails compulsory health insurance and
is heavily regulated. These features, along with medical licensing standards, will hamper
any effort to liberalize the medical market.
Accounting and Auditing
Federal law stipulates that each audit firm must have at least one auditor with Swiss
residency, and that the firm itself must be registered in the Swiss commercial register
(WTO, 2004). Qualification of foreign professionals is contingent on Swiss recognition
of foreign diplomas by the Office for Professional Education and Technology, although
there is as yet no system of accreditation within Switzerland (WTO 2004).
.
Legal services
Access to the legal profession improved following a federal law enacted in June 2002,
aimed at harmonizing requirements across cantons. The law requires a period of practice
of at least a year in Switzerland, and an equivalent law diploma for foreigners (WTO
2004). The legal diploma needs to be awarded by a country that is recognized by
Switzerland, mainly EU and EFTA states. There is no mention that US legal diplomas are
currently recognized.
30
Architecture and Engineering
The practice of architecture and engineering does not require a license. Entry by
foreigners may be difficult, but under the law foreigners are accorded national treatment
if they have worked for two years in Switzerland (WTO 2004). However, prior practice
requirements may differ across cantons. For example, the EU has requested the removal
of prior practice requirements in the canton of Lucerne (EC 2002). The federal
government is now trying to harmonize requirements at the federal level as a way to
comply with EU standards (EIU 2005). Recommended prices are published every year by
the professional association, the Swiss Society of Engineers and Architects (SIA) (WTO
2004).
Other service sectors
Other service sectors, like taxis, restaurants and hotels are highly regulated. Licenses are
exclusively valid in a given canton (OECD 2004). For crafts and arts, a State Secretariat
for Economic Affairs (SECO) report found that not one of the 15 different categories is
harmonized across the 26 cantons (OECD 2004). Finally, the medical profession is
protected by strong entry barriers. Fees are usually fixed at the cantonal level (WTO
2004).
F. Recent Developments
The process of changing Swiss legislation regarding the service sector was launched in
2002, and should continue in 2005 or 2006. While residency requirements are bound to
31

persist, other restrictions are expected to be removed. SECO officials expect better terms
for intra-corporate transfers, allowing personnel to remain five years in Switzerland
(Swiss Visiting Report 2005). In addition, the nationality requirement for the composition
of boards may be lifted in the near future. The Swiss-American Chamber of Commerce
has recommended that members of a governing board can have any nationality within the
range of WTO members (Swiss Visiting Report 2005).
5.3 Services Trade Negotiations in Selected US Bilateral FTAs
We focus our analysis of phase-outs for the most part on US FTAs because the United
States has “pushed the envelope” farther in bilateral negotiations on services. Inrecent
negotiations, such as US-Australia (2004) and US-Singapore (2003), the parties have
used a “negative list” approach – meaning that all services are covered except for those
specifically reserved. By contrast, Switzerland and EFTA have adopted the “positive
list” approach, meaning the covered services must be specifically identified. The
negative list approach inherently leads to broader coverage than the opposite positive list
approach.22 However, some of EFTA’s bilateral pacts, such as EFTA-Singapore (2003),
go well beyond commitments at the multilateral level,
As we hold high expectations for the liberalizing potential of a Swiss-US FTA in the area
of services, we concentrate on US negotiating results to establish a benchmark. This
section reviews the main points regarding services trade in the US-Australia and the US-
22 The GATS uses a positive list approach.
32

Singapore FTAs. The first part reviews the critical points of the US-Australia FTA
provisions related to audiovisual, financial, express delivery, telecommunications, and
professional services. The second part reviews the US-Singapore FTA provisions for a
range of similar service industries and compares selected features of the US-Singapore
FTA with the EFTA-Singapore FTA.24
A. The United States and Australia
Broadcasting and Audiovisual services
The Australian commitment to provide US films and television programs some access to
cable, satellite, and the Internet was seen as a major accomplishment (USTR 2004).
However, Australia’s list of reservations ranked among the most detailed and complex of
all negative lists in the audiovisual sector (Bernier 2004). Australia retains its existing
commercial television quotas (55 percent of the programs must have Australian content).
Content quotas for commercial radio remain at levels up to 25 percent, and subscription
television firms (pay TV) must spend 10 percent of their budgets for drama and general
entertainment channels on new Australian drama.25 Finally, minimum “sub-quotas” for
adult and children drama and documentaries are permitted to ensure the preservation of
local culture (Bernier 2004). The only thing conceded by Australia in the audiovisual
sector was its ability to implement tighter quotas or more restrictive measures, especially
with respect to new media services (USITC 2004).
24 The selection of Singapore as the case study for comparison is based on is the statement by the EFTA Secretariat that Singapore is the most advanced EFTA agreement on services and the fact that both parties are developed countries. 25 The agreement allows Australia to increase the funding requirement up to 20 percent, and to extend the 10 percent requirement to other genres.
33

Financial Services
The agreement guarantees that Australia will extend national treatment and most favored
nation with respect to private sector management of its civil service pension funds.
Moreover, the FTA allows US asset management firms to sell portfolio management
services to Australian mutual funds. In addition, the Agreement improves the
transparency of regulation of financial services (Industry Sector Advisory Committee on
Services for Trade Policy Matters 2004). Australia retains the international investment
screening mechanism embodied in its old Foreign Investment Policy. As implemented by
the Foreign Investment Review Board (FIRB), the policy creates modest barriers against
inbound investment. However, investments in new financial services companies, and
acquisitions of existing financial services firms, of less than A$800 million are exempted
from the investment screening mechanism (the threshold was previously set at A$50
million). Australia also agreed to lock-in existing “good practice” with regard to its
review of acquisitions in the banking and insurance sectors. A side letter on financial
services commits Australia to pursue the current practice of a restrained approach by the
FIRB.26
Insurance
The FTA covers life, non-life, reinsurance, intermediation (brokerage) for MAT (Marine,
Aviation and Transport) services that are auxiliary to insurance (but are not covered by
26 The side letter encourages a process of government-to-government consultation and periodic revisions of the investment screening mechanism (USITC, 2004).
34

the GATS), and key cross-border insurance products (marine, aviation). Under the
agreement, US life insurers may conduct operations by expanding their branches in
Australia, a practice that was previously prohibited.
Express delivery services
The agreement recognizes express delivery services (EDS) as a unique service sector and
makes important commitments to maintain market access. The agreement also contains
provisions to facilitate customs clearance, which is critical to the efficient operation of
express carriers.
Telecommunications
The USITC Report (2004) claims that “the agreement includes several important “WTO-
plus” obligations for major suppliers, including resale, provisioning of leased circuits and
co-location. The agreement also meets a key industry goal by fostering the independence
of regulatory bodies, and prevents anti-competitive conduct.”
The agreement guarantees the independence of regulatory bodies, and ensures that the
regulatory agency cannot have a financial interest in any supplier of public
telecommunications services. The agreement commits Australian regulatory bodies to
consult with interested parties before issuing regulations, to seek public remarks on
prospective rules, and to publish all relevant regulations. Improved transparency is
intended to ensure non-discriminatory access for US firms on the public telephone
networks operated by major carriers. As with the Singapore FTA, however, mobile
35

service providers are excluded from the definition of “major carriers.” This exclusion
means that cost-based interconnection rates are not the norm for mobile service providers
(unlike the obligation for “major carriers”).27 In fact, Australian mobile carriers have
recently demanded higher termination rates (USITC 2004).
Professional Services
The Agreement creates a Professional Services Working Group. This mechanism aims at
encouraging the relevant bodies to harmonize their criteria for licensing and certifying
professional service suppliers, and recognizing professional credentials (Industry Sector
Advisory Committee on Services for Trade Policy Matters 2004). However, the
Agreement does not directly alter state regulation of professional services either in
Australia or in the United States. Nor does the agreement contain commitments for the
temporary entry of business persons. The professional services commitments in the FTA
are limited by the Annexes, which reiterate that the two countries commitments need be
“no greater than accepted under the market access provisions of Article XVI of the
GATS.”
In addition, the commitments made in the FTA by the two federal governments are
explicitly precluded from impinging on the existing rules of sub-federal units. This
limitation applies to commitments on national treatment, most-favored-nation treatment,
local presence requirements, performance requirements, or senior management provisions
(Industry Sector Advisory Committee on Services for Trade Policy Matters 2004).
27 However, mobile service providers are required to comply with the country's WTO commitments.
36

However, since the FTA makes no reference to new rules enacted by sub-federal units
after the FTA is ratified, there appears to be some scope for future federal level
agreements that would override new sub-federal rules.
B. The United States and Singapore
Banking Services
The US-Singapore chapter on financial services contains core obligations regarding non-
discrimination, most-favored-nation treatment, and additional market access obligations.
The US-Singapore FTA guarantees the following conditions of access in the banking
sector:
• Removal of Singapore’s ban on new licenses for full-service banks within 18
months, and within three years for wholesale banks.
• Access for US banks to Singapore’s local ATM network within two and a half
years for locally incorporated Singapore banks, and within four years for all other
banks.
• Qualified US banks can open up to 30 branches and service locations. Before the
FTA, they could only open up to 15.
• US firms are allowed to offer asset and portfolio management and securities
services in Singapore by establishing or acquiring local firms.
• US firms are allowed to offer pension services under Singapore’s privatized social
security system, with more liberal requirements regarding the number of portfolio
managers who must reside in Singapore.
37

Insurance
All US and Singapore suppliers are assured of fair and non-discriminatory treatment and
market access. Singapore has generally been recognized for its open insurance market.
However, the FTA ensures further liberalization in the sector:
• The FTA guarantees US firms access to customers in Singapore through
subsidiary or branch offices located there, including life and non-life insurance,
reinsurance, insurance intermediation, and insurance auxiliary services.
• The FTA provides significant new access allowing US insurance companies to
sell, from offices in the United States, to customers in Singapore the following
kinds of insurance: MAT insurance, intermediation of reinsurance and MAT
insurance, and insurance auxiliary services.
• The FTA stipulates that US firms can continue to sell reinsurance services to
Singapore customers from offices in the United States.
• The FTA also includes an innovative provision that allows licensed US insurers to
provide new insurance products to their business customers in Singapore, without
prior regulatory approval.
The United States took a reservation stating, “The Overseas Private Investment
Corporation insurance and loan guarantees are not available to certain aliens, foreign
enterprises or foreign-controlled domestic enterprises.” (US-Singapore Agreement,
Annex 8A, 2003).
38

Securities
The FTA guarantees market access, national treatment, and most-favored-nation
treatment. The agreement opened Singapore’s market to US investment firms, which was
not the case before. US investment firms that establish mutual funds in Singapore can use
personnel based in the United States to manage the securities held in the fund portfolios.
In addition, Singapore commits to ease the local staffing rules for US asset management
and insurance companies that offer market access for their investment products to the
Central Provident Fund (Singapore’s mandatory national savings scheme) (USITC 2004).
Telecommunications
The US-Singapore FTA addresses interconnection, resale of services, regulatory
procedures, and nondiscriminatory access to the market. The FTA ensures that all US
telecommunication companies have market access to all of Singapore’s
telecommunications sectors.28 US companies are permitted to access the market in
different ways. They can acquire or build local facilities, link their US network with a
network in Singapore, or lease lines from Singapore firms. Singapore’s telecom
regulatory authorities commit to open and transparent administrative procedures (USITC
2004). However, the United States took a reservation to protect its restrictions on
ownership of US radio licenses (US-Singapore FTA Final Text, Annex 8A, 2003).
Professional Services
28 By contrast, under the WTO, Singapore has committed to give market access in select telecom markets to only three foreign telecom providers.
39

The agreement guarantees that Singapore will improve market access to US providers of
professional services and ease the entry procedures for legal, architectural, engineering
and other professions. For example, Singapore reduced the requirement that two-thirds
of the directors of engineering and architectural firms must be professionally accredited
in Singapore to a figure of more than half. However, Singapore included a reservation
regarding the residency requirements of architects, registration and residency
requirements on auditing services, and a reservation regarding national treatment for
engineering services.29 Singapore commits to entirely eliminate local ownership
requirements for US land surveying firms by 2004. Finally, Singapore commits to ease
restrictions on US law firms that form joint law practices in Singapore, and to recognize
degrees earned from certain US law schools for purposes of admission to the Singapore
bar (Industry Sector Advisory Committee on Services for Trade Policy Matters 2004).
Express Delivery
While Singapore took a reservation regarding its postal services, the FTA guarantees
further liberalization of Singapore’s express delivery services by giving market access to
US services suppliers and by improving customs administration. The USTR reports, “the
FTA includes an innovative, comprehensive definition of express delivery services
29 The first reservation relates to restrictions on the temporary entry of professionals. The second reservation relates to the requirement for 51 percent local ownership of services in engineering corporations and, in the case of engineering partnerships, full local control of assets and profits. The USITC (2004) argues that these reservations “severely constrain US firms trying to open a Singaporean operation for single projects and requires them to give technical, managerial and financial control to outsiders in order to establish a long term presence.”
40
(including express letters delivery) that ensures that market access restrictions that
Singapore includes for its postal sector do not concern express delivery services.”30
Audiovisual Services
The FTA guarantees national treatment and MFN status to all US audiovisual services.
However, Singapore took two reservations concerning cultural services in Annex 8B.
These apply to basic obligations regarding national treatment, most-favored-nation
treatment, and market access, and cover existing as well as future measures. The first
reservation relates to broadcasting services, meaning that Singapore limits its obligation
with respect to television content broadcasts that are aimed at local audiences (USTR,
2004). The second reservation applies to distribution and publication of printed media,
meaning “any publication containing news, intelligence, reports of occurrences, or any
remarks, observations or comments relating thereto or to any matter of public interest,
printed in any language and published for sale or free distribution at intervals not
exceeding one week” (Bernier 2004). The purpose of these reservations appears to be the
protection of the Singapore public against provocative American television shows, or
rguably defamatory media reports (Bernier 2004).
Comparing US-Singapore with EFTA-Singapore
The US and EFTA FTAs with Singapore are contemporary agreements and in both cases
most of the negotiations took place in 2002. Both agreements address key service issues
30 For example, the agreement requires Singapore to prohibit its postal authority from subsidizing its express letter service in a way that gives the authority an unfair commercial advantage in express delivery services.
41
in a chapter of general commitments, accompanied by specific chapters or annexes
dealing with financial services and telecommunications.31 In their comments on the
services provisions, US and EFTA authorities stressed that they broke new ground, well.
beyond what has been achieved at the multilateral level.
Table 5.6 presents a comparison of the treatment of the core provisions on general
services in both agreements. While the negotiated texts are quite similar, there are
important differences in the scope of the two agreements.
The US-Singapore FTA adopts a negative list approach to the core provisions, namely
market access, national treatment, and most-favored-nation treatment. There are
relatively few exclusions for domestic regulation and the entry of business persons. US-
Singapore also goes beyond EFTA-Singapore FTA in topics such as local presence and
transparency measures. (Table 5.6)
By contrast the core services provisions in EFTA-Singapore were negotiated on basis of
positive lists that identify sectors and measures where the commitments apply. EFTA-
Singapore also applies the positive list approach to other provisions, such as the entry of
business persons and domestic regulations. (Table 5.6)
5.4 Recommendations for Services Trade
31 Unlike the EFTA-Singapore FTA, the treatment of “Temporary Entry of Business Persons” receives a full chapter in the US-Singapore FTA.
42

We believe that Swiss-US FTA can push the envelope of services liberalization, well
beyond what has already been accomplished in the GATS, and even beyond the US-
Australia and US-Singapore FTAs. One reason is that both Switzerland and the United
States have already reduced or eliminated the most obvious barriers to services trade, so
the field is clear to attack the more subtle barriers. The other reason is that both countries
are highly service-oriented -- in terms of shares in GDP, drivers of productivity, and in
prospective growth in international trade. Bilateral exchange of services can only
flourish with further liberalization; equally important, working together, Switzerland and
the United States can set a high standard both for WTO negotiations, in the Doha Round
and beyond, and for future bilateral free trade agreements. With these high ambitions in
mind, we offer the following recommendations.
• Both countries should abolish citizenship and residency requirements for
senior professionals, managers and directors, except in very short lists of
reserved activities (negative lists). In particular, financial firms based in each
country should be able to offer mutual funds and portfolio management
services in the other country without the necessity of establishing a physical
presence there.
• As a general rule, again with negative lists, both countries should extend
umbrella national treatment and unconditional MFN rights to each other with
respect to the their service sectors. The negative lists could contain state and
cantonal exceptions to the national treatment requirement. However, a State
43

and Cantonal Working Group should be created and tasked to work on the
progressive abolition of these sub-federal exceptions.
• As in the Australia FTA, the Swiss-US FTA should establish a Professional
Services Working Group to review professional diplomas and credentials, and
recommend the mutual recognition of those degrees and standards that the
Working Group determines are essentially equivalent. The Working Group
should have an adequate budget to engage experts to assist in making these
determinations.
• The FTA should extend the scope of insurance and reinsurance that can be
sold in one country by properly capitalized and regulated firms based in the
other country, without additional capital or regulatory requirements. In other
words, for designated lines of insurance, Switzerland and the United States
should accord mutual recognition to firms based in the other country. For the
United States, this provision will require the assent of key states, which should
be obtained before the insurance mutual recognition clause comes into effect.
• Switzerland should commit to enact its proposed new electricity supply law
and comparable natural gas legislation as auxiliary provisions to the FTA.
Similarly, Switzerland should commit to pursue the initiatives launched by the
telecom regulator, ComCom, with respect to interconnection terms and rates.
44
• Although enhanced access to the US telecommunications and information
services market might have limited commercial interest to Swiss firms,
nevertheless the United States should use the FTA as a vehicle for advancing
its liberalization agenda. In particular, the United States should permit
ownership of cable networks, direct satellite broadcast, provision of satellite
services, and provision of information services by bona fide Swiss firms.
• Although Switzerland does not set quotas on non-Swiss origin programming,
the new nominal development tax that was enacted in 2002 could have a
negative impact on US film distributors and cinema companies. Switzerland
should commit to consult with the United States before imposing this tax.
45

Table 5.1 Cross-Border Services Trade between the United States and Switzerland (millions current $)
Service Category 2001 2002 2003 2001 2002 2003
Total Private Services 6,513 6,815 8,014 6,488 7,450 8,348Travel 958 696 624 704 619 570Passenger Fares 145 195 185 821 530 351Other Transportation 510 353 485 611 422 525Royalties, Licence Fees 1,708 2,023 2,715 1,706 2,065 2,202Other Private Services 3,192 3,548 4,005 2,646 3,814 4,700
Source: Bureau of Economic Analysis
US Exports US Imports

Table 5.2 US-Swiss Trade in Services by Industry (2003)a
(millions $)
Exports Imports Two-way Exports Imports Two-WayTransport, Fares, Passengers 1,294 1,446 2,740 na na naRoyalties and License Fees 313 348 661 2,402 1,854 4,256 Other Private Services 1,529 3,140 4,669 2,475 1,561 4,036 Business, Professional, 799 193 992 na na naand TechnicalComputer/ Information 129 22 151 na na naAdvertising 18 16 34 na na naResearch, Development, Testing 137 59 196 na na naManagt., Consulting, Public Relations 46 10 56 na na naLegal Services 179 20 199 na na naConstruction, Architecture, Engineering 9 4 13 na na naIndustrial Engineering 7 na na na na naInstallation, Maintenance, Repair 89 3 92 na na naOperational Leasing (D) na na na na naOthers (D) 34 na na na naEducation Services 36 15 51 na na naFinancial Services 537 219 756 na na naInsurance 64 2,680 2,744 na na naTelecommunications 42 21 63 na na naFilm, TV tape, Rentals 51 12 63 na na naTotal Services 3,136 4,934 8,070 4,877 3,415 8,292
Notes:na = not available (D) = Not disclosed
a. Affiliated trade represents transactions between related companies. Unaffiliated trade represents transactions between independent companies.
Source: Bureau of Economic Analysis
US Unaffiliated trade US Affiliated trade

Table 5.3 Restrictions on Bankinga
Foreign Restriction Indexb
Switzerland 0.08United States 0.06Current US PartnersCanada 0.07Mexico 0.17Chile 0.40Australia 0.12Prospective US PartnersColombia 0.23Indonesia 0.55South Korea 0.43Malaysia 0.65New Zealand 0.06Philippines 0.53Singapore 0.37South Africa 0.19Thailand 0.39
Notes:a. Index based on restrictions on establishment (licensing requirements for newfirms, restrictions on direct investment in existing firms and on the permanent movement of people) and restrictions on ongoing operations (on firms conducting their core business the pricing of services and the temporary movement of people). b. Foreign index measures all restrictions that hinder foreign firms from entering and operating in an economy.
Source: Findlay and Warren Restrictiveness Index on Trade in Services, available at http://www.pc.gov.au/research/rm/servicesrestriction/index.htmlretrieved from the World Wide Web May 2, 2005.
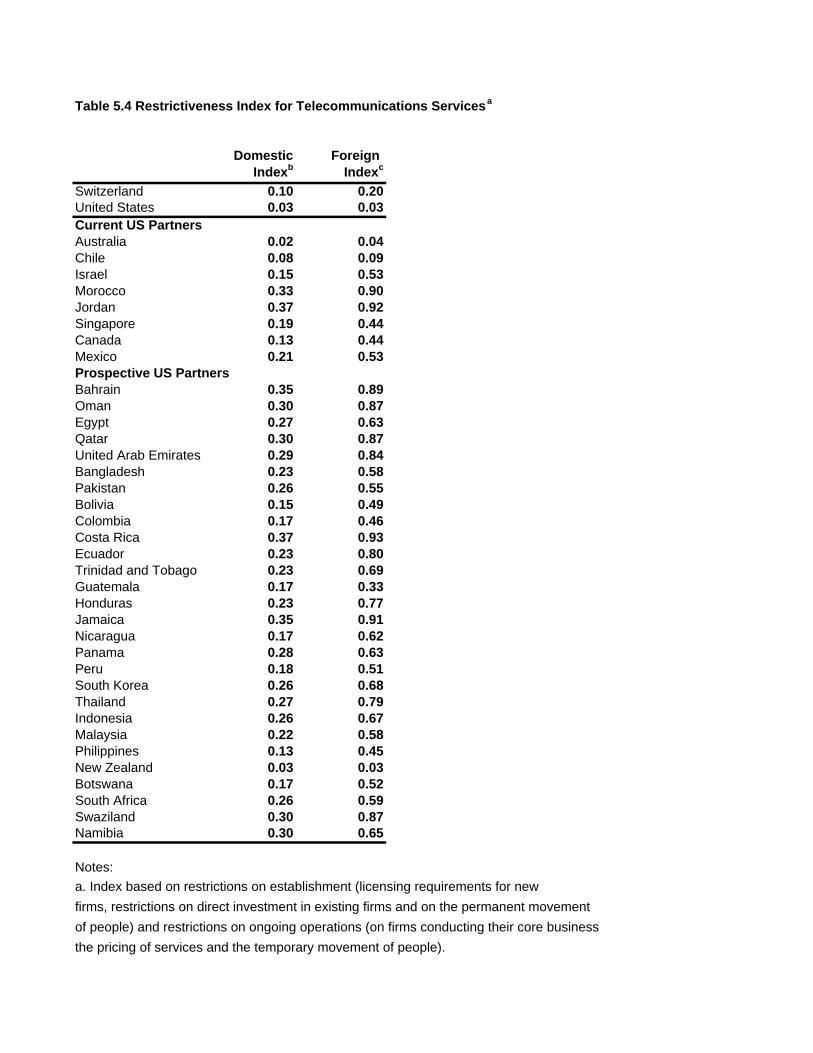
Table 5.4 Restrictiveness Index for Telecommunications Servicesa
Domestic Foreign Indexb Indexc
Switzerland 0.10 0.20United States 0.03 0.03Current US PartnersAustralia 0.02 0.04Chile 0.08 0.09Israel 0.15 0.53Morocco 0.33 0.90Jordan 0.37 0.92Singapore 0.19 0.44Canada 0.13 0.44Mexico 0.21 0.53Prospective US PartnersBahrain 0.35 0.89Oman 0.30 0.87Egypt 0.27 0.63Qatar 0.30 0.87United Arab Emirates 0.29 0.84Bangladesh 0.23 0.58Pakistan 0.26 0.55Bolivia 0.15 0.49Colombia 0.17 0.46Costa Rica 0.37 0.93Ecuador 0.23 0.80Trinidad and Tobago 0.23 0.69Guatemala 0.17 0.33Honduras 0.23 0.77Jamaica 0.35 0.91Nicaragua 0.17 0.62Panama 0.28 0.63Peru 0.18 0.51South Korea 0.26 0.68Thailand 0.27 0.79Indonesia 0.26 0.67Malaysia 0.22 0.58Philippines 0.13 0.45New Zealand 0.03 0.03Botswana 0.17 0.52South Africa 0.26 0.59Swaziland 0.30 0.87Namibia 0.30 0.65
Notes:a. Index based on restrictions on establishment (licensing requirements for newfirms, restrictions on direct investment in existing firms and on the permanent movement of people) and restrictions on ongoing operations (on firms conducting their core business the pricing of services and the temporary movement of people).

b. Domestic Index measures restrictions on domestic firmsc. Foreign index measures restrictions on foreign firms
Source: Findlay and Warren Restrictiveness Index on Trade in Services, available at http://www.pc.gov.au/research/rm/servicesrestriction/index.htmlretrieved from the World Wide Web May 2, 2005.

Table 5.5 Foreign Restrictiveness Index for Professional Servicesa
Foreign Indexb Engineering Accountancy Architecture LegalSwitzerland 0.18 0.15 0.27 0.50United States 0.23 0.19 0.33 0.48Current US PartnersAustralia 0.15 0.08 0.41 0.42Canada 0.33 0.16 0.42 0.52Chile 0.14 0.24 0.35 naMexico 0.31 0.33 0.36 0.49Prospective US PartnersIndonesia 0.30 0.24 0.56 0.57South Korea 0.19 0.12 0.48 0.44Malaysia 0.33 0.26 0.51 0.54Thailand 0.12 0.11 0.49 0.44New Zealand 0.34 0.19 0.39 0.47Philippines 0.33 0.15 0.63 0.54Singapore 0.08 0.11 0.41 0.42South Africa 0.11 0.10 0.44 na
Notes:a. Index based on restrictions on establishment (licensing requirements for newfirms, restrictions on direct investment in existing firms and on the permanent movement of people) and restrictions on ongoing operations (on firms conducting their core business the pricing of services and the temporary movement of people). b. Foreign index measures restrictions on foreign firms
Source: Findlay and Warren Restrictiveness Index on Trade in Services, available at http://www.pc.gov.au/research/rm/servicesrestriction/index.htmlretrieved from the World Wide Web May 2, 2005.

Table 5.6 Selected General Provisions in Services
US-Singapore FTA EFTA-Singapore FTA
Scope of Measures
Measures by central, regional or local government affecting cross-border trade in services (negative list).
Measures by central, regional or local government affecting trade in services in commited sectors only (positive list).
Each schedule specifies country-specific:(a) terms, limitations and conditions on market access.
(b) conditions and qualifications on national treatment.(c) undertakings relating to additional commitments.
(d) Time-frame for implementation of commitments.
Applies to all sectors unless those specified in the agreement
Applies to sectors where specific commitments are undertaken
Removal of limitations on the participation of foreign capital in terms of maximum percentage limit on foreign shareholding.
Exceptions to MFN: a.- Agreements and MRAs in accordance of articles V and VII of GATS.b.- Annex VI.
National Treatment
Yes, unless specified in Annexes 8A and 8B. Only in sectors considered under the agreement.
Local Presence A Party shall not require a service supplier of the other Party to establish or maintain a representative office or any form of enterprise, or to be resident, in its territory as a condition for the cross-border supply of a service.
No equivalent provision other than general reference on market acces.
Applies to sectors where specific commitments are undertaken.
Commitment to inform about status of requests and final decision In cases where a party requires authorization.
Commitment to inform about status of requests and final decision In cases where a party requires authorization.
Domestic Regulations
Removal of limitations on: the number of services providers; the value of services transactions; the quantity of services output; the number of persons that may be employed in a particular sector;and measures which restict or require specific types of legal entity or joint venture.
Most-Favoured Nation Treatment
Unconditional MFN treatment in like circumnstances.
Schedules Annex 8A (measures) and 8B (sectors) include schedules exeptions to: National Treatment and Most-Favored-Nation Treatment; Market Access; Local Presence; Performance Requirements; or Senior Management and Boards of Directors.
Market Access
Removal of limitations on: the number of services providers; the value of services transactions; the quantity of services output; the number of persons that may be employed in a particular sector;and measures which restict or require specific types of legal entity or joint venture.

Measures relating to qualification and licences requirements should be based on objective and transparent criteria, not more burderdensome than necessary to ensure the quality of the service, and should not be in themselves restrictions to the provision of the service.
Each party establishes arbitral instance to review at the request of the party administrative decisions affecting trade in services.
Joint review of of results of negotiations pursuant Article VI.4 of GATS
Establishment of mechanisms to respond to inquiries of persons regarding measures included in the chapterMandates publication of laws, regulations, procedures, and administrative rulings affecting trade in services or reasons for failure to comply with these mandates. Address substantive comments received from interested persons with respect to proposed regulations and allow reasonable time between publication of final regulations and their effective date.
Entry of Business Persons
Secures temporary access for business visitors and investors for up to 90 days without need for labor market tests. Additional grant, not subject to labor market tests, of 5,400 work visas for different categories of Singaporean professionals. This concession was reciprocated by Singapore.
Temporary access is granted to service suppliers and natural persons of a party who are employed by a service supplier of a Party, in respect of the supply of a service. Commitments are based on conditions and qualifications stipulated under each national schedule.
Chapter 8 Trade in Services Articles 21-36Chapter 9 Telecommunications Annex on TelecommunicationsChapter 10 Financial Services Annex on Financial ServicesChapter 11 Temp. Entry of Business Per. Annex on Most-Favoured-Nation TreatmentAnnexes to chapters 8, 10, and 11. Annexes with Country Specific Commitments
Sources: US-Singapore Free Trade Agreement and Fact Sheets on the US-Singapore and EFTA-Singapore FTAs of the Ministry of Trade of Singapore.
No equivalent provision other than general references on other articles of the chapter.
Full Set of Provisions on Services
Measures relating to qualification and licences requirements should be based on objective and transparent criteria, not more burderdensome than necessary to ensure the quality of the service, and should not be in themselves restrictions to the provision of the service.
Transparency Measures

THE SHAPE OF A FREE TRADE AGREEMENT BETWEEN SWITZERLAND AND THE UNITED STATES
Chapter 6
GOVERNMENT PROCUREMENT
Switzerland and the United States are both signatories of the WTO government
procurement agreement (GPA). Hence, one might think that a Swiss-US FTA would not
open as many procurement opportunities as the US-Australia FTA, since Australia did
not sign the GPA. However, Switzerland reserved its application of the GPA to US firms
in important sectors, arguing that the United States had not given equivalent access to
Swiss firms. Moreover, the GPA does not cover all federal procurement. Finally, multiple
restrictions persist at the sub-federal level, both in Switzerland and the United States.
Opening government procurement markets in both countries could thus deliver
considerable benefits. Taxpayer dollars will be saved when states and cantons invite a
larger number of bidders. As the largest public procurement body in the world, the US
federal government too would benefit from Swiss bids, even in select market niches.
This chapter includes three sections. The first two sections review the regulatory
environment and recent developments in the United States and Switzerland respectively.
The third section outlines our recommendations for liberalizing government procurement
in the context of a prospective Swiss-US FTA.
6.1 Government Procurement: The United States
1

A. Regulatory Environment
In 1996, the United States became a signatory of the WTO Government Procurement
Agreement (GPA), along with 28 other nations. At the federal level, public procurement
takes place through various departments supervised both by the Office of Management
and Budget (OMB) and two acquisition regulatory councils, the Defense Acquisition
Regulations Council and the Civilian Agency Acquisition Council (WTO 2004b). The
Federal Acquisition Regulation (FAR) furnishes umbrella regulation for all federal
entities, but permits them to follow their own internal guidelines (WTO 2004b).1 Under
the FAR, federal entities are obligated to publish their procurement requirements on a
website known as FedBizOpps when the procurement exceeds $25,000.2 The proposed
procurement contract must be published at least 15 days before bids begin; thereafter,
prospective bidders must be given at least 30 days to place their bids (WTO 2004b).
At the sub-federal level, state and local governments regulate procurement contacts.
Contracts are subject to threshold values and other provisions that are specific to each
state. Some states grant preferences to local suppliers and impose local-content
requirements. However, 37 states have implemented the GPA provisions.3 These states
1 The FAR was amended in 2001 to change aspects of electronic procurement and preferential access for small businesses; to improve transparency of procedures; and to alter bidding process and thresholds. Part 25 of the FAR deals with policies and procedures to acquire foreign supplies, services, and construction materials (WTO 2004b). 2 Exceptions are made for purchases of perishable supplies when delayed publication could be damaging (WTO 2004b). 3 The 37 states are listed in Annex 2 of the US GPA schedule.
2

are obligated to publish tender invitations on the FedBizOpps website for GPA-covered
sectors.
The Buy America Act (BAA)
The Buy America Act of 1933 (as amended) is the core document governing US
procurement of goods at the federal level. The Act establishes discriminatory measures,
also known as Buy American restrictions, for government-funded purchases, including
supply and construction contracts (EU Commission 2004a). These restrictive measures
can take several forms:
• Prohibit government entities from purchasing foreign goods and services.
• Require a certain amount of local content.
• Give domestic suppliers a preference in evaluating bid prices.
The United States maintains a number of Buy America restrictions for procurement that
is not covered by the GPA, NAFTA, the WTO plurilateral Agreement on Trade in Civil
Aircraft, and bilateral procurement agreements with Chile, Singapore, Australia, and
Israel (WTO 2004c). Where in force, Buy America requirements apply to goods, not
services. They require Federal entities to procure only US mined or produced
unprocessed goods. In addition, only manufactured articles with at least 50 percent local
content can be procured (EU Commission 2004a).
The Executive Order 10582 of 1954 goes beyond the scope of the BAA by carving out a
special status for procurement contracts with small businesses and firms in areas with
3

labor surplus. The order also allows government entities to reject bids placed by foreign
firms, by invoking national interest and security clauses (EU Commission 2004a).
The balance of payment program
The balance of payment program is a non-statutory program, which potentially restricts
purchases of supplies by government entities and contracts for construction, alteration, or
repair of any public building outside the United States (WTO 2004c). Since 2001, this
program no longer applies to civilian agency acquisitions, but it still applies to the
Department of Defense for purchases of end products that are used abroad and exceed
$100,000 in cost (WTO 2004c).
The Trade Agreements Act of 1979
The Trade Agreements Act of 1979 implemented the GATT Government Procurement
Code agreed in the Tokyo Round. Essentially the 1979 Act overrides the BAA and
kindred legislation by ensuring national treatment to signatories of the Code with respect
to scheduled entities and above-threshold contracts (USITC 2004a). Thus the Act gives
up BAA preferences regarding civil aircraft and related articles,4 and other end products,
for designated parties.5
4 Related articles are articles that “meet the substantial transformation test of the Act and originate in countries that are parties to the WTO agreement on Trade in Civil Aircraft” (WTO 2004c). 5 Similar preferences are extended unilaterally to eligible countries through the GPA, NAFTA, other bilateral procurement agreements, and to least-developed countries (WTO 2004c). For example, end products that are granted duty-free entry under the Caribbean Basin Economic Recovery Act (CBERA) are eligible for government contracts.
4

Exemptions and Waivers
Exemptions and waivers to the BAA and the balance of payments program are granted if
it can be shown that domestic preferences are inconsistent with national interests, and if
the supply of a particular material is not available in the United States or too expensive
(WTO 2004c).6 For example, BAA restrictions have been waived for the acquisition of
defense equipment originating from countries with which the United States has a
reciprocal procurement agreement, such as Switzerland.7
The goods listed in sub-Chapters VIII and X of Chapter 98 of the Buy America Act are
not subject to custom duties when they are purchased for use in government contracts.
Other supplies may also be eligible for duty-free entry if the contract price is reduced by
the amount of duty that would prevail if the supplies did not enter duty free (WTO
2004c). Finally, with the exception of equipment, supplies aimed at government-operated
vessels or aircraft are eligible for entering the United States duty-free (WTO 2004c).
B. The WTO GPA and US Bilateral Agreements
In 1996, the United States became a signatory of the WTO Government Procurement
Agreement (GPA), along with 28 other nations. As of 2004, the threshold values of
covered procurement contracts have been maintained at their 1996 levels (WTO 2004c).
6 A domestic offer is judged too expensive if the foreign product is priced “below the lowest domestic offer when this offer is from a large business concern” (including import duty and a 6 percent added margin) (WTO 2004c). If the offer is from a small business, the added margin would be 12 percent and for defense-related purchases the price difference has to be of a minimum of 50 percent. 7 However, the Secretary of Defense retains the right to restrict or reject an offer from a qualifying country for national defense reasons.
5

Table 6.2 shows the threshold values set by the United States in the WTO GPA Schedule,
NAFTA, and in its FTAs with Singapore and Chile. Table 6.3 shows the list of services
that the United States has chosen to exclude from the GPA and in selected FTAs.
The US-Chile and US-Singapore FTAs opened additional state and federal agencies to
foreign bids (Schott 2004). However, under the US-Singapore FTA, state obligations do
not expand beyond the sector obligations already committed under the GPA. Local
procurement is not covered under either the GPA or the two FTAs. Under the US-Chile
FTA, the 37 US states that have agreed to GPA provisions will treat Chilean suppliers in
essentially the same manner (USTR 2003e). Finally, the US-Chile and US-Singapore
FTAs specify high threshold values, and exclude state set-aside programs for small and
minority businesses (Salazar-Xirinachs and Granados 2004).
Some observations on the US-Australia FTA are informative. As with other FTAs, the
procurement chapter (Chapter 15) sets out specific rules and standards to achieve the
objective of non-discrimination.8 The agreement requires the elimination of the
Australian government’s industry development programs and limits selective tendering.
These provisions will level the playing field for US firms that bid on public contracts.
Australia will become a designated country under the US Trade Agreements Act. This
means that Australian firms no longer have to establish operations in the United States, or
in a designated country, or establish partnering arrangements with US firms, in order to
8 For example, the FTA requires each country to enact laws that make bribery of procurement officials a criminal or administrative offense.
6
sell to the US government. Chapter 15 is complemented with eight annexes that
determine the covered government entities and the types of procurements excluded by
each party. A side letter deals with government procurement of blood plasma.
Government procurement was a source of concern in the CAFTA-DR FTA debate.
Congressman Benjamin Cardin (D – Md) attempted to withdraw Maryland from the list
of states subject to government procurement rules in the FTA package, but ultimately
relented.9
C. Effect of Restrictions
US government expenditures amounted to $1,980 billion in 2002 or 19 percent of GDP.
Defense related expenditures were the largest component, some $400 billion. Most
government expenditures, however, represent salaries and transfer payments. In 1999, the
United States reported 56,598 procurement contracts totaling $205 billion (WTO 2004c).
The EU Commission has estimated that Buy America restrictions each year affect
approximately $25 billion of public contracts, most noticeably in mass transport and
airport improvements (EU Commission 2004a).10
9 Cardin dropped his demand after Deputy US Trade Representative Peter Allgeier gave him assurances that “if USTR found it acceptable, it would consult with DR-CAFTA parties in a way that would not delay congressional consideration of the free trade package.” Subsequently, however, Allgeier informed Cardin that Maryland “will have to remain on the list of states subject to government procurement rules” in the CAFTA-DR See “Maryland to Remain on Government Procurement Annex for CAFTA,” Inside US Trade, July 1, 2005. 10 This figure is expected to increase to $35 billion in 2005 (EU Commission 2004a).
7

US public procurement restrictions take place in three different ways: federal restrictions
on procurement by federal entities; state restrictions on state and local procurement
contracts; and federal restrictions on how federal grant money can be used by state and
local governments (USITC 2004a). At the federal level, the major restrictions relate to
defense procurement contracts and small and minority-owned business contracts. At the
state level, federal regulations (mostly Buy America restrictions) prohibit the use of
federal grant money in transportation and food assistance projects (USITC 2004a).
Public Transportation
Federal aid to state and local governments is distributed by the Department of
transportation (DOT) under the Highway Administration Act, the Urban Mass Transit
Act, and the Airports Improvements Act. For example, the federal government may fund
40 percent to 80 percent of the project while the state funds the rest. All these projects are
subject to local content requirements of 60 percent (or face a penalty of up to 25 percent
of the price) (EU Commission 2004a).
Highway construction
Federally-assisted highway projects amounted to $46 billion in 2002 while federal grants
to state and local governments totaled $26 billion (USITC 2004a). Under the BAA,
highways must be constructed with iron and steel that is domestically produced. A waiver
is possible but is rarely granted.
8

Airport construction
The Federal Aviation Administration (FAA) monitors Buy America restrictions on state
and local public procurement for airport construction projects. Some 80 to 90 percent of
airport construction spending comes from the federal government. Airport construction
projects are obligated to use steel and manufactured goods that are domestically
produced, unless a waiver is invoked.
Food assistance
A wide array of food assistance procurement programs is monitored by the US
Department of Agriculture and other federal entities (e.g., the Department of Health and
Human Services). Those programs, such as the National School Lunch Program and the
Child and Adult Care food program, give preferences to local food suppliers. Even
donated commodities must be of domestic origin. Some programs require that school
food authorities buy domestic commodities to the maximum extent (USITC 2004a).
Under NAFTA and the Uruguay Round agreement, the United States retained the right to
exempt from its national treatment obligations the “procurement of agricultural goods
made in furtherance of agricultural support programs or human feeding programs”
(USITC 2004a).
Small business set-asides
Federal grants and subcontracts for goods and services awarded to small business firms
are governed by the Small Business Act of 1958 (as amended) (SBA). The Act
establishes certain targets: 23 percent of prime contracts must be awarded to small
9

businesses; 5 percent of prime and subcontracts to minority-owned businesses; 5 percent
to women-owned businesses; 3 percent to service-disabled veteran-owned businesses;
and prime contracts for Historically Underutilized Business Zone firms (HUBZone) are
phased in from 1 percent in FY1999, to 2.5 percent in FY2002, and 3 percent in FY2003
(USITC 2004a). The SBA requires that all owners of small businesses be US citizen to
qualify for these preferential procurement programs. Because SBA regulations require
that receipts of all domestic and foreign affiliates of the business be counted to qualify as
a “small size business,” most US affiliates of foreign-owned corporations cannot obtain
small business status. Most federal purchases under the SBA programs face Buy
America restrictions, although a general waiver may be granted to federal purchases that
are below $2,500 (USITC 2004a).
Defense procurement
The Buy America Act governs domestic sourcing requirements for defense procurement.
In addition, the Defense Federal Acquisition Regulations System (DFARS) regulates
defense-related procurement of specific products such as food, clothing, and fibers, vessel
acquisition, and anchor chain (USITC 2004a). The DFARS regulations are intended to
ensure that government procurement contracts comply with the Memorandum of
Understanding (MOU) between DOD and SBA in respect to the small-business goals
mentioned above (USITC 2004a). NATO countries that have ratified the MOU can
obtain a waiver from DOD’s domestic preferences (USITC 2004a).
State and local government procurement
10

The states impose procurement restrictions over and above the restrictions imposed by
federal rules. So far, all negotiated US trade agreements have given states the choice to
retain their state procurement rules or accede to the agreement. In response, some of the
50 states have chosen to relinquish state preferences. For the US FTA partner, the
benefits of state accession are enhanced by the large number and diverse nature of state
programs (USITC 2004a). As of 2005, Ohio, Indiana, Virginia, Georgia, and New Jersey
are the important hold-out states.
Sub-federal selective purchasing laws
Selective purchasing laws at the sub-federal level often impede foreign firms that have
links to “offensive” third countries such as Burma. Such laws have been adopted by
Massachusetts and 20 other cities and local authorities (EU Commission 2004a). The
Supreme Court ruled that the Massachusetts law was unconstitutional (Crosby et al. v.
National Foreign Trade Council, U.S. Sup. Ct., No. 99-474, June 19, 2000), but the
ruling was relatively narrow. Hence municipal selective purchases on foreign policy
grounds can still be a problem. For example, in 2001, New York attempted to apply
selective purchasing legislation based on the so-called “MacBride principles” (EU
Commission 2004a). While the proposal was dropped, it flagged a continuing concern.
Services
While the BAA is not supposed to apply to procurement of services, the offshore
outsourcing debate has inspired new legislative forays, mainly at state level. In 2002,
New Jersey (followed by Michigan in 2004) enacted legislation stating that “only citizens
11

of the United States and persons authorized to work in the United States pursuant to
federal law may be employed in the performance of services [funded by the states]” (EU
Commission 2004a). Connecticut, Florida, Maryland, Missouri, and Wisconsin, have also
announced the implementation of similar provisions (EU Commission 2004a). The target
of this legislation is to discourage “call centers” and data processing abroad (EU
Commission 2004a).
D. Recent Developments
Recent initiatives have attempted to improve the efficiency of federal government
procurement. The E-Government Act of 2002 led to the creation of an Internet portal for
government procurement known as the Integrated Acquisition Environment (IAE)
initiative. The General Services Administration has promoted two new programs. The
first program, the GSA Global Supply (GGS) identifies an array of goods and services
that conform to government acquisition policies and socio-economic regulations (WTO
2004c). GSA Advantage is an Internet program that allows interested parties to
communicate with authorized contractors online. Under this program, 5,298 contracting
foreign firms registered online in 2004 (WTO 2004c).
6.2 Government Procurement: Switzerland
A. Regulatory Environment
Switzerland ratified the WTO Agreement on Government Procurement (GPA) in 1994.
The 1994 Federal Law on Government Procurement, however, deals only with federal
12

procurement, not cantonal procurement. The federal law “specifies the procurement
regime; it also provides for, inter alia, periodic adjustments of definitions and threshold
values to the relevant GPA provisions” (WTO 2004b). Some 42 entities have been
designated for the purchase of goods. As for relevant services -- road and air transport,
financial services, and certain professional services such as advertising, counseling, and
publishing -- these can be purchased by each of the 42 designated federal entities (WTO
2004b). A 1995 Ordinance, subsequent to the 1994 Federal Law, covers remaining areas,
such as procurements below the relevant WTO thresholds, or purchases by entities that
are not included in Switzerland’s commitment under the GPA (WTO 2004b).
For the cantonal and local levels, the Swiss cantons passed the 1994 Inter-cantonal
Concordat, which altered “previous cantonal arrangements that provided scope for buy-
local, buy-regional and buy-national preferences” (WTO 1996). The Concordat covers
contracts for construction projects in excess of SFr 9.6 million; contracts for goods and
services in excess of SFr 0.38 million; and contracts for goods and services purchased by
public water, energy, and transport companies in excess of SFr 0.77 million (WTO
2004b). In 1995, the Swiss Parliament passed the Internal Market Law (LMI), which
explicitly provided for non-discriminatory access to public procurement in cantons and
municipalities.
Competition for public procurement contracts was enhanced in recent years, after
Switzerland concluded a bilateral Agreement with the European Union extending the
coverage of the GPA to the liberalization level of the EU internal market at EU
13

thresholds. As a result, in March 2001 the Inter-Cantonal Agreement on Public
Procurement (AIMP) was further revised, as was the federal Ordinance in July 2002. The
revised federal Ordinance established a surveillance mechanism, the Commission des
Marchés publics Confédération/Cantons (CCMC). The CCMC aims at enforcing
Switzerland’s international commitments regarding public procurement contracts. The
revised AIMP aimed at harmonizing thresholds and procedures of those contracts that are
not governed by international treaties (OECD 2004a).11 To this effect, thresholds much
lower than the WTO levels were established, to be applied both at the cantonal and
communal levels, thereby seriously opening local procurement markets. These lower
thresholds apply to Swiss-established bidders, while foreign bidders may bid on contracts
that meet GATT/WTO thresholds.
Presently, the Swiss government is undertaking a thorough revision of the Swiss Federal
Law on Public Procurement. The initiatives aim at simplifying and harmonizing the
public tender procedures (US Department of State 2005).12 The OECD likewise reports
that efforts are being made to improve the application of procurement procedures by
federal purchasing entities (OECD 2004a).13
B. Swiss Reservations under the WTO GPA
11 The revised text of the AIMP was in force in 21 cantons at the end of June 2005. 12 Under rules of the WTO Government Procurement Agreement, each canton was allowed to implement the agreement independently, leading to disparities across cantons (US Department of State 2005). 13 For example, the Swiss federal government created a database was created to track trends in procurement contracts and to assess reforms (OECD 2004a).
14

Switzerland took reservations on the application of the GPA with respect to participants
that do not provide for similar and effective access for Swiss firms. Table 6.1 indicates
that Switzerland’s reservations apply mostly to the United States and Canada. Indeed,
Switzerland made important reservations with respect to US firms regarding communal
entities (public authorities that operate at the communal or district level); water, local
transport, and airport authorities; service sub-sectors; and challenge procedures.14
C. Bilateral Agreements
Switzerland has signed bilateral procurement agreements with the United States (1996),
the European Union (2002), Mexico (2001, as part of EFTA-Mexico FTA), Chile (2004,
as part of EFTA-Chile FTA). These agreements expand access to government
procurement opportunities, including at the sub-Federal level.
The agreement between the United States and Switzerland in 1996 was incorporated in
the WTO GPA. The agreement between Switzerland and the European Union draws and
expands on WTO provisions. The WTO GPA guarantees that the Swiss Federal state and
the cantons, as well as public companies in the water, urban transport and energy sectors,
will tender and award contracts for goods, services and construction projects when they
exceed certain threshold values (e.g., Sfr 250,000, about $211,000). The Swiss-EU
14 Challenge procedures are the result of difficulties that have been encountered in honoring the recommendation in the WTO dispute settlement procedure that calls for “retrospective” remedies. The provisions on challenge procedures can be found in Article 20 of the WTO GPA. This article requires the parties to the GPA “to set up a domestic bid challenge system for the purpose of giving suppliers, who believe that procurement has been executed inconsistently with the requirements of the GPA, a right of recourse to an independent domestic tribunal” (WTO 2003).
15

bilateral agreement expands on the WTO GPA by opening the public procurement market
to tender in the rail transport sector, and by allowing contract awards to private
companies that are working on the basis of exclusive rights, such as private utility
companies (The Switzerland Office DFA/DEA 2005).
The Mexican procurement agreement, part of FTA between Mexico and the EFTA bloc
(including Switzerland), was ratified in July 2001. The agreement guarantees that Mexico
will provide EFTA suppliers the same access it provides to US, European, and Canadian
suppliers (WTO 2004b). In counterpart, the EFTA member countries will give Mexico
access similar to their GPA commitments, except at the sub-federal level (WTO 2004b).
In the EFTA-Chile FTA, both parties agreed to a mutual non-discriminatory access to
their government procurement markets for goods, services and public works at both the
federal and sub-federal government level, as well as for certain utilities (WTO 2004b).
D. Effect of Restrictions
Despite the GPA and FTA agreements, the OECD reports that competition for
government procurement contracts is weak in Switzerland (OECD 2005). In 2000, total
public spending on goods, services, and construction amounted to more than SFr 30
billion, representing 25 percent of total government spending and 8 percent of GDP
(WTO 2004b).15 Cantons and municipalities play the major role in public procurement,
which engenders a bias in favor of local firms (OECD 2005).16
15 Swiss public procurement as a share of GDP is somewhat lower than other industrial countries. The International Trade Administration (ITA) reports that government
16

This bias against foreign firms can be explained by three different factors. First, most
contracts for open public tenders are valued below the financial thresholds for
international competition (OECD 2004a); they are however open to Swiss bidders at
relatively low thresholds. Second, the legislation on procurement contracting differs
across cantons, and between the Swiss federation and the cantons.17 These differences
should, however, not be overstated; they refer mainly to procedures and secondary issues.
For example, each canton has his own remedy tribunal and the decisions of the various
tribunals may not be consistent across cantons and with the federal remedy authority.18
Third, competition and transparency are hampered by the fact that, when international
thresholds are not reached, “the lower thresholds above which competition applies at
national level have appreciably differed across cantons” (OECD 2004a). However, with
the revised AIMP a uniform threshold has been set for the different procedures at the
national level in order to harmonize the procedures across Switzerland.
E. Recent Developments
procurements generally accounts for 10 to 15 percent of a country’s GDP. The OECD reports that government procurement in the EU zone varies between 14 percent and 15 percent (OECD 2002). 16 More than 80 percent of the contracts are granted by cantons and municipalities (OECD 2004a). 17 The complexity of the legislation renders its application for both bidders and contracting authorities difficult. The incorporation of international agreements in domestic legislation is not harmonized between the Confederation and the cantons. For example, the OECD remarks, “Under federal law, negotiations with bidders are allowed during the procedure, which is not the case for the cantons” (OECD 2004a). 18 Similar differences exist in other federal countries.
17

The level of competition has improved thanks to recent initiatives. For example, the
cantons of Geneva and Vaud initiated a government procurement website aimed at
pooling tenders (both at the federal and cantonal levels) and unifying the bidding system
(OECD 2004a).19 A new system is planned to go into effect in April 2006 under SIMAP
II with the Federal state and no less than 14 cantons. The OECD report argues, “The
system should encourage scale economies on standard procurement contracts and a
reduction in the management costs of tendering, which should lead to lower threshold
values” (OECD 2004a).20
Some evidence indicates that the Internet portal, along with the revision of the AIMP and
the Ordinance mentioned earlier, have created a more competitive environment. The
OECD reports that, when comparing identical tenders in the Swiss federation between
2000 and 2002, figures show that prices have decreased by 25 percent on average (OECD
2004a).
6.3 Recommendations for Government Procurement While the United States and Switzerland have different national competition policies,
both countries permit state and cantonal regulations that impair competition. In the
19 The site has 5 500 public contractors, over 98 per cent of whom operate at the cantonal and communal level. 20 The OECD reports that “the maximum amount for contracts negotiable by mutual agreement was [recently] raised from [SFr] 50 000 to 150 000 for a service or construction supply contract and to [SFr] 300 000 for a contract on the shell of a building” (OECD 2004a). Higher thresholds are justified by the transactions costs incurred in public tendering, and these costs should be reduced by the new system.
18

United States, for example, the “state action doctrine” immunizes state and local
governments from antitrust liability. Stemming from a US Supreme Court decision that
allowed a state to sponsor a Depression-era cartel, US states can pursue anti-competitive
regulation of transportation, hospitals, healthcare and electric-power sectors (OECD
2004d). Likewise, despite Swiss Federal efforts to gradually liberalize the electricity
market, local and regional firms still continue as monopoly owners of the national
electricity network (known as Swissgrid).
Subfederal practices that impede competition cannot be abolished overnight.
Nevertheless, in the realm of public procurement, the Swiss-US FTA should be ambitious
and forward-looking. For budget reasons alone, public authorities in both countries
should welcome the precedent of greater competition. With that goal in mind, we offer
the following recommendations, starting with the United States and then Switzerland.
A. Recommendations for the United States:
• The FTA should grant Swiss firms the best terms enjoyed under the GPA, and by
NAFTA partners, Chile, Singapore, Australia, and future US bilateral free trade
agreements (an unconditional MFN provision). The MFN provision should apply
to both Federal and state procurement.
• In addition, the United States should extend its procurement coverage to at least
three additional sectors that were excluded from the WTO GPA: research and
development; transportation services; and utility services. R&D contracts are
19

likely to be of commercial interest to leading Swiss firms. Both US and Swiss
firms may be interested in transportation and utility contracts in the other
country.
• The USTR should seek to cover two or three “holdout” states (in addition to
states that have previously agreed to GPA or FTA procurement provisions).
Likely candidates might be Atlantic coast states, New Jersey, Virginia and
Georgia.
• Additionally, the USTR should seek to cover a few metropolitan areas. Again,
Atlantic coast metropolitan areas seem most plausible, because of their greater
familiarity and proximity to Switzerland. Boston, New York, Washington DC,
Charlotte, Savannah and Miami come to mind as eligible cities.
B. Recommendations for Switzerland:
• Reciprocally with the recommended US provision, the FTA should grant US
firms the best terms enjoyed under the GPA, and by EFTA partners and future
Swiss bilateral free trade agreements (an unconditional MFN provision). The
MFN provision should apply to both Federal and cantonal procurement. This
provision would eliminate most of Switzerland’s GPA reservations with respect to
the United States (communal bodies would still be excepted), and thus open both
the Federal and cantonal procurement markets to US firms.
20

Table 6.1 Swiss Reservations in the Government Procurement AgreementEn
titie
s
United States Canada Japan South Korea Israel Singaporecommunal bodies regional bodies, communal bodies communal bodies communal bodies communal bodieswater, electricity, water, electricity electricity water, electricitylocal transports, local transport local transports local transports local transportairports and ports airports and ports airports services subsectors services subsectors services subsectorschallenge procedures challenge procedures challenge procedures challenge procedures challenge procedures
Source: WTO Government Procurement Agreement, http://www.wto.org/english/tratop_e/gproc_e/chegen.doc

Table 6.2 Threshold Values in the WTO GPA and US bilateral FTAs
WTO Canada Mexico Chile SingaporeSupplies 169,000$ 25,000$ 56,190$ 56,190$ 56,190$ Services 169,000$ 56,190$ 56,190$ 56,190$ 56,190$ Construction 6,481,000$ 7,304,733$ 7,304,733$ 6,481,000$ 6,481,000$
Source: WTO (2004)

Table 6.3 Services Covered by the United States in the GPA and bilateral FTAs
Services WTO NAFTA/ Chile Singapore Australia/MoroccoPurchase of military services overseas Excl. Excl. Excl. Excl.Automatica data processing, telecom. and transmission Excl. Excl. Incl. Incl. Telecom. Network, automated news services, data services Excl. Excl. Incl. Incl. Basic Telecommunications network services Incl. Incl. Excl. Excl.Dredging Excl. Excl. Excl. Excl.Federally Funded Research and Development Centers Excl. Incl. Excl. Incl. Department of Defense, Energy, Aeronautics/Space facilities Incl. Excl. Incl. Excl.Research and Development Excl. Excl. Excl. Excl.Transportation Services Excl. Excl. Excl. Excl.Utility Services Excl. Excl. Excl. Excl.Maintenance, repair, rebuilding, installation of equipment Incl. Excl. Incl. Excl.related to ships, Including non-nuclear ship repair Incl. Excl. Incl. Excl.
Source: Retrieved from the World Wide Web at http://www.arnet.gov/far/current/html/Subpart%2025_4.html

THE SHAPE OF A FREE TRADE AGREEMENT BETWEEN SWITZERLAND AND THE UNITED STATES
Chapter 7
DIRECT AND PORTFOLIO INVESTMENT
The United States and Switzerland are both prominent in the realm of foreign direct
investment (FDI). They are known worldwide for their brand name multinational
enterprises (MNEs) and outward FDI. Outward FDI stocks represented 112 percent of
GDP for Switzerland in 2003, and 19 percent for the United States (UNCTAD 2004). In
terms of “Performance Index” rankings for outward FDI between 2001 and 2003,
Switzerland occupied the 9th position among the listed nations, and the United States
ranked 30th.1 Both countries have also become important hosts to foreign MNEs and
inward direct investment. Since 1980, inward FDI stocks as a share of Swiss GDP
increased from 8 percent to 50 percent in 2003, and in the United States from 3 percent to
14 percent.2
For both countries, portfolio investment faces low barriers. Outward portfolio investment
is particularly weighty for Switzerland while inward portfolio investment is a major
feature of the US economy. Portfolio investment exchanges between the two countries
are substantial, and equity holdings are the dominant asset. The size of Swiss-US
1 Based on data reported in the UNCTAD World Investment Report (2004). 2 During the period 2001 to 2003, Swiss and US inward “FDI performance” (as measured by a three year moving average of several indexes), ranked 49th and 112th respectively. According to a recent OECD report, Switzerland’s gross fixed capital formation will rise by 3.6 percent in 2006, driven partly by inward FDI. This estimate is supported by the UNCTAD, which argues that the short- and medium-term outlook for the Swiss economy seems brighter than in the past four years. See OECD 2005 and UNCTAD 2004.
1
portfolio income flows is quite considerable, especially when benchmarked against flows
to and from the European Union.
In most bilateral relationships, US outward direct investment outpaces the partner
country’s investment in the United States. The opposite is true, however, in the Swiss-
US relationship. Instead, Swiss direct investment in the United States has historically
exceeded US FDI in Switzerland. In 2003, the stock of Swiss FDI in the United States,
based on US data, reached $113 billion. By comparison, in the same year, the stock of
US FDI in Switzerland was $86 billion (tables 7.1 and 7.2). In fact, the United States is
the chief destination for Swiss direct investments abroad, making Switzerland the sixth
largest foreign direct investor in the United States (surpassing Canada). Conversely,
Switzerland is the fourth most important destination for US direct investments, and US-
based MNEs are the most important foreign investors in Switzerland. Switzerland is
often the preferred European headquarter for US companies, because of its central
location, good air access, and skilled multi-lingual personnel. A key Swiss objective in
the FTA is to reinforce these advantages
A recent OECD cross-country analysis examines the treatment of direct investment in
international agreements.3 The report argues that superior benefits will result from
addressing investment issues in the context of multilateral and bilateral trade agreements
(because of their broader scope) rather than classic bilateral investment treaties (BITs). A 3 Specifically, the OECD Report emphasized the dominant role of a few countries in negotiating both free trade agreements (FTAs) and bilateral investment treaties (BITs): “Germany, Switzerland, the UK, France and the Netherlands are party to close to 70 percent of the BITs concluded by OECD countries. Mexico, the United States, Australia and Canada account for 90 percent of the OECD area’s FTAs including BIT-like disciplines.” See OECD (2005).
2
Swiss-US FTA that addresses the small number of Swiss and US investment frictions
should augment an already robust relationship.
Some of the negotiating issues that might arise within the context of a Swiss-US FTA can
be anticipated by analyzing each country’s position. We first evaluate bilateral FDI
within a larger trans Atlantic context, and sketch the industry and geographic breakdown
of bilateral FDI stocks. The next two sections identify leading companies in the Swiss-
US relation, the share of FDI in capital formation, and its relation to GDP. We address a
handful of barriers facing FDI and then turn to portfolio investment. Portfolio investment
channeled by Swiss financial institutions to the United States is huge, and encounters
very few obstacles. The chapter concludes with recommendations, mainly for FDI.
7.1 Foreign Direct Investment in Perspective
A. Trans Atlantic Overview
By yearend 2003, the global stock of outward US direct investment totaled $1,789 billion
(historical cost); the stock in the EU-15 totaled approximately $845 billion; and over $86
billion was placed in Switzerland (table 7.1). In terms of outward US FDI, Switzerland
thus hosts approximately 10 percent of the EU-15 magnitude. Recent increases in US
direct investment in Europe mainly reflect activity in the United Kingdom, Switzerland,
the Netherlands, and Germany. Since 1999 the US FDI stock in each of these countries
has increased by at least $30 billion.
By yearend 2003, the inward stock of FDI in the United States from all countries was
valued at $1,378 billion (historic cost). Of this total, $856 billion originated from the
3

EU-15, and $113 billion from Switzerland (table 7.2). In terms of country of origin, first
place is held by the United Kingdom, followed by Japan, Germany, the Netherlands,
France, Switzerland, and Canada in that order. For comparison, UK FDI is 16.7 percent
of the US total inward stock, while Swiss FDI is 8.2 percent. Over the past five years,
affiliates with parents in the United Kingdom, Germany, Luxembourg, the Netherlands
and Switzerland accounted for the largest dollar increases of inward investment positions
in the United States.
B. The Swiss-US FDI Relation
Total FDI Positions
The total stock of inward foreign direct investment in Switzerland reached Sfr 200 billion
in 2003 (approximately $154 billion, at end-2003 exchange rates) (table 7.3). This
represents an 18-fold increase of inward FDI in Switzerland since 1980, and an almost
five-fold increase since 1990.4 In 2003, the United States was the largest single source of
FDI in Switzerland, accounting for 40 percent of the country’s total, up from 28 percent
in 1998. EU member states taken together held 56 percent, with the Netherlands,
Germany, and France constituting the largest EU sources of FDI in Switzerland. The
recent growth in US FDI primarily reflects activity in the financial and management
sector. Within this sector, holding companies play the most significant role by far (table
7.1). Investment in Swiss finance and holding companies, reaching nearly 50 percent in
2003, likewise accounts for the predominant share of global FDI in Switzerland (table
7.3).
4 The stock of total FDI in Switzerland increased from $9 billion in 1980 to $34 billion in 1990, to $154 billion in 2003. See UNCTAD (2004).
4

Total Swiss FDI in the United States reached almost $113 billion in 2003, which
represents about 13 percent of the total EU-15 FDI stock in the United States (table 7.2).
The stock of Swiss FDI in the EU is about twice as large as Swiss FDI in the United
States (table 7.4). Switzerland’s FDI in the United States is concentrated in the
manufacturing sector, where pharmaceuticals and food are prominent. By comparison,
the US financial sector receives a fifth of total Swiss FDI (table 7.2). On a global level,
Swiss firms allocate almost twice as much FDI into services as into manufacturing (table
7.4).
Industry Breakdown of FDI
As already mentioned, FDI in Switzerland is highly concentrated in finance and kindred
activities. Out of a total inward FDI stock in 2003 of Sfr 200 billion, 53 percent was
attributed to financial and holding companies,5 15 percent to banks and insurance, and 10
percent to commerce (table 7.3). The remainder is essentially divided between transport,
chemicals and plastic, machinery and metalworking, electronics, energy, optics, and
watches.6
The stock of Swiss FDI in the United States reflects major investments in
pharmaceuticals, chemicals, food, equipment, finance, and banking (UNCTAD 2004).
As illustrated in table 7.2, Swiss FDI in the US manufacturing sector ($72 billion)
accounted for about 64 percent of the total Swiss FDI stock in the United States ($113
billion).
5 In 1998, the comparable figure was 44 percent. 6 Figures provided by the Swiss National Bank Monthly Statistical Bulletin (May 2005).
5
C. FDI Income Flows
FDI income flows --dividends, interest and royalties-- between the United States and
Switzerland are significant in both directions. FDI income flows from the United States
to Switzerland are about $13 billion annually, and income flows from Switzerland to the
United States are approximately $7 billion (table 7.10). By comparison, FDI income
flows from the EU-15 to the United States are about $10 billion annually.
D. The Connection Between FTAs, FDI, and Exports.
Appendix D summarizes several academic articles on the connection between free trade
agreements and foreign direct investment. Most studies use variants of the gravity
model. While different studies reach different numerical results, on the whole FTAs are
found to encourage inward FDI. One reason is that each country extends its own
“economic market” to include the partner. Firms located in one FTA partner gain reliable
access to markets and inputs from the other partner. The FTA provides assurance that
industrial inputs can be acquired from firms in the partner country, free of tariffs and
other barriers, and that goods and services can be readily sold to purchasers in the partner
country.
A fair summary of the empirical studies is that, for Switzerland, the FDI augmenting
effect of an FTA could be substantial. Linked to the United States, Switzerland would
extend its “economic market” by 4700 percent, since US GDP is almost 47 times the size
of Swiss GDP. Even applying an elasticity coefficient of 0.01 – about the size of the
smallest positive elasticity reported in Appendix D -- the increase in the inward Swiss
FDI stock (from all sources) might eventually exceed 40 percent. Applied to US
6

investment in Switzerland, a 40 percent increase suggests that the US FDI stock in
Switzerland might eventually rise by $34 billion on account of the FTA (from its 2003
level of $86 billion to about $120 billion).
Empirical analysis by Graham and Wada (Graham 2000) suggests that a 40 percent
increase in the US FDI stock in Switzerland might boost US manufactured exports by 24
percent.7 Assuming a 24 percent increase, US exports of manufactures might rise by $2.2
billion annually (from $9.2 billion to $11.4 billion) on account of the “pull” from a larger
US FDI stock in Switzerland. While all these estimates are highly speculative and
exceedingly rough, it seems likely that a Swiss-US FTA would sharply boost both direct
investment in Switzerland and US exports to Switzerland. To a very much smaller
extent, the FTA would inspire parallel effects in the other direction (Swiss FDI in the
United States and Swiss exports to the United States). The reason is that adding
Switzerland to the US “economic market” represents an increase of only about 2 percent
in US market size.
Table 11 illustrates the complementary relationship between exports and outward direct
investment. Over the decade 1994-2004, positive correlations between FDI stocks and
exports can be observed in both directions, as between Switzerland and the United States.
For example, the US FDI stock in Swiss manufacturing industries increased by 6.8 times
while US manufactured exports increased 1.7 times. Simple correlations such as this do
7 Graham’s estimated coefficient is an increase of 6 percent in US manufactured exports for every 10 percent increase in the US stock of FDI. Hejazi and Safarian (1999), however, estimate a much smaller coefficient for the “pull” on Canadian exports. The higher US coefficient estimated by Graham may reflect the fact that the United States can supply a very wide array of manufactured goods.
7
not, of course, demonstrate causality, but they do suggest that Swiss-US experience
supports the causal relationships found by Graham (2000) using sophisticated
econometric techniques.
7.2 Leading Companies in the Bilateral Relation
Out of the world’s 100 largest non-financial MNEs, 5 are Swiss (Nestle, ABB, Novartis,
Roche Group, and Holcim), and 25 are American. The top Swiss firms, together with
many others, are present in the United States (table 7.5).
A. Swiss Companies in the United States
In 2004, Swiss-owned companies operating in the United States employed 500,000
persons and paid an average compensation per employee of about $64,000. By
comparison, average US compensation per employee is approximately $53,000.8 In
2002, Swiss firms spent over $4.3 billion on US research and development activities, and
imported $6.2 billion of goods from the United States. Nestle appears to be the largest
Swiss firm operating in the United States, employing almost 47,000 people in the food
sector (table 7.5).
Swiss direct investment is largest in the states of New Jersey ($5.5 billion), California
($4.9 billion), New York ($2.9 billion), Texas ($2.4 billion) and Illinois ($1.5 billion)
8 Based on the hourly compensation rate of $25.57 for the fourth quarter of 2004, as reported by the US Bureau of Labor Statistics, available at: http://data.bls.gov/PDQ/outside.jsp?survey=cm (accessed on July 25, 2005).
8
respectively.9 In terms of number of Swiss companies, the leading states are Illinois
(with 147), New York (with 96), Missouri (130), Pennsylvania (98) and Florida (68).
B. US Companies in Switzerland
In 2004, US-owned companies in Switzerland employed 58,000 persons. Out of the 650
American companies in Switzerland, the largest employers are McDonald’s, IBM and
Altria. The principal sectors are food, technology, and consumer goods. Over the past
two decades, US parent companies have increasingly used holding companies --
essentially management vehicles -- to supervise their worldwide activities, and many of
these holding companies are based in Switzerland.10 The US parent companies of Swiss
firms are mostly headquartered in New York, Nevada, California, Utah and New Jersey.11
7.3 FDI Related to Capital Formation and GDP
Swiss inward and outward FDI flows are a substantial proportion of annual gross fixed
capital formation. On average, between 1998 and 2003, they amounted to 22 percent and
44 percent respectively (table 7.6). The current level of FDI flows into Switzerland
reflects an almost five-fold increase since the early 1990s, based on the indicated average
9 See UNCTAD (2004). 10 In technical terms, a holding company is a company whose primary activity is holding the securities or financial assets of other companies. See BEA Survey of Current Business, Holding Companies in the Data on US Direct Investment Abroad (2004). 11 New York firms invest most heavily in miscellaneous manufactures, used merchandise, and chemical manufactures. Nevada comes next with a focus on primary metals, particularly gold and silver. Then follow California (chemical manufactures, computer and electronic products, transportation equipment including aircraft parts), Utah (primary metal manufactures essentially), and New Jersey (chemical manufactures, primary metal manufactures, computer and electronic products). For more information, see the Swiss Embassy, available at: http://www.eda.admin.ch/washington_emb/e/home.html (accessed on July 25, 2005).
9

of 4.7 percent for inward FDI as a share of gross fixed capital formation between 1992
and 1997. The current level for Swiss outward FDI represents a two-fold increase over
the same period, and constitutes a substantial share of Swiss gross fixed capital
formation.
While Swiss inward and outward flows have reached a two-digit relationship to gross
fixed capital formation, in the United States both inward and outward flows remain at a
one-digit relationship. US inward FDI as a percentage of gross fixed capital formation
rose from about 5 percent in the early 1990s to about 9 percent in the late 1990s (table
7.5). Outward FDI has increased less, remaining in the range of 7 to 8 percent of gross
fixed capital formation.
For both the United States and Switzerland, the size of the FDI stock has grown
significantly relative to GDP. As portrayed in table 7.7, Swiss inward FDI rose from 8
percent of GDP in 1980 to nearly 50 percent in 2003. Swiss outward FDI escalated
nearly six-fold relative to GDP since 1980, from 20 percent to 112 percent. Likewise, US
inward FDI rose from 3 percent of GDP in 1980 to 14 percent in 2003. Relative to GDP,
outward US FDI grew from 8 percent in 1980 to almost 19 percent in 2003.
In terms of market value, FDI in the United States reached $2,435 billion in 2003,
reflecting both financial inflows and a substantial appreciation in share values. By
comparison, the historic cost FDI in the United States was $1,378 billion for 2003, less
than two-thirds of the market value.
10

7.4 FDI Friction
A. Impediments to FDI in Switzerland
General Background
Investment barriers are very low in Switzerland, and the country has a reputation for
welcoming FDI. The freedom of trade and industry guaranteed by the Swiss Constitution
allows anyone, including foreign nationals, to operate a business in Switzerland, establish
a company, or acquire a company. With few exceptions, no approval from the
Government, chambers of commerce or professional associations is required to establish
a business. Switzerland does not have a screening mechanism for foreign investments,
nor does it have preferences or restrictions in terms of sectors or geography. Since 1997,
permission has not been required to buy commercial or industrial real estate, or principal
residences. Exchange control restrictions on capital flows are unknown.
However, there are Swiss investment restrictions in business sectors dominated by public
monopolies, including rail transport, postal services, certain insurance services, aspects of
trade in alcoholic beverages, and salt (WTO 2004c). Special licensing provisions apply
to banks, insurance companies, and investment brokers. They also affect hotels and
restaurants in certain cantons. Physicians, dentists, pharmacists and attorneys are
licensed professions, as are certain mercantile and service businesses, such as wine
merchants, private employment agencies, and temporary employment services.
Temporary Skilled Worker Visas
MNEs usually require foreign nationals, both permanent and temporary, to carry out key
operations. If visas and work permits are difficult to obtain, the country becomes a less
11

desirable location, especially for headquarters activity. Foreign nationals may perform
skilled activities in Switzerland on a temporary basis, if they have the required permits
(WTO 2004c). For some cases, visa approval requires demonstration of need. This
situation will evolve as residence qualifications for EU nationals will be completely
liberalized by 2014, under the bilateral agreement with the European Union on free
movement of persons.12
In the non-financial sector, all corporate directors must be individuals (not other
companies), and the majority of the board of directors of a stock corporation must be
Swiss citizens, domiciled in Switzerland.13 However, this latter requirement does not
apply to holding companies. At least one managing director of a limited liability
company must be domiciled in Switzerland, and to establish a branch of a foreign
company in Switzerland, an individual domiciled in Switzerland must be nominated as
representative.14 The Swiss parliament is considering repealing the nationality
requirement, in line with Switzerland’s initial offer in 2003 in the GATS negotiations.
12 Similar terms apply to nationals of the European Economic Area (EEA). 13 According to the WTO, “Switzerland’s revised Law on Stock Corporations, adopted in 1991, forms the basis of its investment legislation. Corporate governance (except in the banking sector) is generally based on a unitary system in which the board of directors has supreme strategic responsibility for the conduct of a company’s affairs. Related powers may not be delegated, nor may they be withdrawn by the shareholders.” See WTO (2004c). 14 The WTO elaborates on Swiss establishment procedures in greater detail. For instance the WTO explains that “a permanent residence permit of the associate(s) is required under cantonal laws for the establishment of a commercial presence in the form of an enterprise without legal personality under Swiss law (i.e. in a form other than stock corporation, limited liability company or cooperative society), and for the establishment of a commercial presence by natural persons. (…) The minimum capital requirement ranges from S Fr 20,000 to S Fr 100,000 depending on the form of business; a maximum of S Fr 2 million is set for limited liability companies. (…) Establishment of a limited liability company does not normally take more than 10 days, substantially under the European average.” See WTO (2004c).
12

Draft legislation was originally published in the Federal Journal in July 2001, and the
legislation is expected to enter into force by 2007.
Companies or their manufacturing facilities must be registered at cantonal or district
levels. In certain regions, such as remote zones, the Confederation and canton may
provide investment incentives. Examples include tax exemptions for up to ten years
maximum, or a financial guarantee up to one-third the total cost of a project for eight
years.
B. Impediments to FDI in the United States
Overview
As a general rule, foreign investors, like domestic firms, are not obligated to register with
or seek approval from the federal government (EIU 2005). Foreign firms are not
subjected to local content requirements, ownership restrictions, current transfer
requirements, nor do they face controls on foreign exchange access or repatriation of
profits. However, an important impediment that faces nearly all foreign firms is the
difficulty and expense of obtaining work visas (e.g., H1-B visas) for temporary
personnel.
Other barriers remain for foreign firms entering the banking, mining, defense contracting,
certain energy-related, fishing, shipping, communications and aviation industries. The
federal government also screens foreign acquisitions that might threaten national security
13

under the terms of the Exon-Florio amendment.15 As a general rule, foreign nationals or
firms are allowed to purchase US real estate, but some states restrict the purchase of
land.16 Foreign nationals or firms are required to report to the US Department of
Agriculture when they purchase agricultural land (EIU 2005).
The 2004 European Union Report on US Barriers to Trade and Investment singled out
three FDI limitations in the United States. The first involves the Exon-Florio
amendment; the second deals with foreign ownership restrictions in areas like defense,
communications and aviation; and the third concerns tax discrimination.
The Exon-Florio Amendment
To monitor the influence of foreign investment in the United States, a Committee on
Foreign Investment in the United States (“CFIUS”)17 was established in 1975. From its
inception, the committee received notification of foreign acquisition of US companies,
and then determined whether such acquisitions raised national security concerns. The
committee’s authority was bolstered, in 1988, by passage of the Exon-Florio
amendment,18 which authorizes an investigation into the national security dimensions of
15 In addition, restrictions exist on financial transactions with Cuba and Cuban nationals, Burma, Iran, Iraq, Sudan, the Taliban, specified terrorist groups, and specified drug traffickers. Those restrictions are strictly enforced (EIU 2005). 16 State restrictions are easily circumvented by establishing a US corporate presence. 17 The CFIUS is an interagency committee that is chaired by the Secretary of the Treasury, and is represented by the departments of State, Defense, Commerce, Justice and the offices of Management and Budget, of US Trade Representative, and the Council of Economic Advisers. See Graham and Krugman (1995). 18 The Exon-Florio Amendment to the Defense Production Act (section 5021 of the 1988 Trade Act) encourages the President to investigate the potential national security impact of any merger, acquisition, or take over leading to foreign ownership of legal persons
14

foreign acquisitions. This amendment represented a considerable expansion of federal
authority to obstruct foreign investment. While a threat to national security is the
statutory justification for impeding FDI, “national security” is an elastic term that can be
interpreted expansively, if the President wishes.19 Under Exon-Florio, the CFIUS reports
and advises the President, who makes a final determination.
Apart from blocking a handful of transactions, the Exon-Florio amendment and the
CFIUS process can inflict delays and legal costs on foreign firms.20 The United States
has taken a reservation for Exon-Florio under the OECD Code of Liberalization of
Capital Movements and the National Treatment Instruments. The European Commission
asserts that, after September 11th, potential acquisitions in the telecommunications sector
were deterred by the Exon-Florio amendment (European Commission 2004a).21
Foreign Ownership Restrictions
engaged in interstate commerce. The President can block any foreign transaction based on national security grounds. 19 According to Graham and Krugman, the role of the CFIUS “remains to be fully defined [and it is feared] that the direction of policy is toward ever broader definitions of national security concerns, [which would lead] the Exon-Florio amendement [to create] a de facto screening agency for FDI.” See Graham and Krugman (1995). 20 Over the past 18 years since the Exon-Florio amendment, the CFIUS has reviewed approximately 10 percent of all foreign acquisitions proposed in that period. These 1,560 reviews led to 25 investigations, of which 11 were approved. Of the remaining transactions, 13 investigations were cancelled by the parties, and only one was halted by the President (National Journal, July 23rd 2005). 21 US agencies have allegedly used the Exon-Florio legislation to impose stringent corporate governance requirements “on companies seeking FCC approval of the foreign takeover of a US communications firm in the form of Network Security Arrangements going further than before” (European Commission 2004).
15

According to the OECD, the United States scores slightly below the OECD mean on an
aggregate indicator of FDI restrictions (OECD 2004c). Foreign ownership restrictions
usually involve limiting the share of foreign equity capital in selected sectors. In 2000,
such equity restrictions were comparatively more stringent in the United States than in
the European Union.
Equity restrictions are based on a mix of sovereignty and national security concerns.
Most pertinent for Switzerland, foreign investment restrictions apply to the
communications market. In the communications industry, the United States maintains
restrictions on the share of foreign ownership in a few services sectors, including
broadcasting, common carrier radio licenses, and mobile phones. For example, a foreign
investor can only own 20 percent of a US firm that holds common carrier radio licenses.
Tax Discrimination
Foreign investment in the US market may face discriminatory tax practices (European
Commission 2004a). Tax discrimination arguably originates from burdensome reporting
requirements, “earnings-stripping” provisions, and state “worldwide” unitary tax
systems.22 We merely note these issues without commenting on them. Historically tax
issues are addressed in tax treaties, not in free trade agreements. The Swiss-US FTA is
22 US reporting rules obligate foreign controlled firms to keep books and records on related parties transactions, and to store the required documents in a location that the US tax authority specifies. Internal Revenue Code provisions on “earnings stripping” limit the extent of interest payments that can be made to a related party and still be deducted against US corporate income. State “worldwide” unitary tax systems can subject the foreign earnings of a Swiss MNE (for example) to taxation by the state (e.g., California).
16
very unlikely to depart from historic practice. Moreover, US and Swiss withholding tax
rates on direct investment income flows to parent companies based in the other country
are very low, as a result of the bilateral income tax treaty of 1996.23 The statutory rate of
Swiss withholding tax is 35 percent, while the statutory US rate is 30 percent. However,
the bilateral Swiss-US withholding tax rates on FDI flows are only 5 percent for
dividends, 5 percent for interest, and 0 percent for royalties. Withholding taxes paid to
the foreign jurisdiction can be credited against the parent firm’s home country tax
liability – which mitigates their force as an investment deterrent.
International Disputes24
Investment disputes between the United States and Switzerland are rare. Among the
cases addressed by the International Center for Settlement of Investment Disputes
(ICSID), no disputes involving both the Switzerland and the United States are listed. The
United States is, however, involved in numerous cases, and such disputes more often
result from foreign demands for equal treatment in the United States rather than the other
way around. For example, based on the 1978 US International Banking Act, all foreign-
owned bank operations in the United States face constraints on interstate banking.
Although domestic banks in the United States are subject to substantially similar
23 This Swiss-US treaty became effective as of 1998. For complete details, see the treaty, which is available at: http://www.irs.gov/pub/irs-trty/swiss.pdf (accessed on July 25, 2005). 24 This section draws on Hufbauer and Schott (2005).
17

restrictions, these controls remain more severe than parallel restrictions against US banks
in Europe.25
A big NAFTA innovation was the establishment of a trilateral mechanism for handling
investment disputes. Mexico had long been a champion of the Calvo doctrine, which
called for strict regulation of foreign investment and required that disputes be adjudicated
only in local courts. The NAFTA accord codified a major change in Mexican policy: it
liberalized investment rules and created, in Chapter 11, a trilateral dispute resolution
framework.26 Mexico thus signaled to investors that it was committed to a new regime,
and correspondingly opened many sectors to foreign investment (Vega and Winham
2002).27
Chapter 11 of NAFTA is unique among NAFTA provisions in allowing private investors
to enforce government obligations.28 For purposes of the NAFTA dispute settlement
25 Under pressure from the United States, the Commission decided, in the spring of 1989, that it would apply a national treatment standard rather than a reciprocity standard for US banks operating in Europe. For more information, see ICSID, available at: http://www.worldbank.org/icsid/cases/cases.htm (accessed on July 25, 2005). 26 NAFTA’s Chapter 11 refers to its dispute settlement mechanism. 27 According to Vega and Winham, industries opened to FDI included railroads, telecommunications, satellite transmission, banking and some petrochemicals. See Vega and Winham (2002). However the NAFTA accord did not mean North America was wide open to foreign investors. In fact, each country maintained investment thresholds or screening mechanisms. There are three types of reservations under NAFTA’s Chapter 11: sectoral, reciprocal (“tit for tat”), and investment review reservations. Among the three NAFTA partners, the United States retained the longest list of “tit-for-tat” reservations. 28 Several principles embodied in NAFTA Chapter 11 are also found in the WTO Agreement on Trade Related Investment Measures (TRIMs). However, unlike NAFTA, the WTO TRIMs agreement does not grant private foreign investors the right to launch dispute settlement proceedings.
18

process, the definition of investment is broadened to include minority interests, portfolio
investment, and real property. NAFTA’s substantive rules include investment
liberalization rights for foreign investors (Article 1101) and guarantees to protect existing
investments established under conditions more favorable than those scheduled in the
national reservations of individual NAFTA members (Article 1108).29 However, the
investor provisions that have sparked the most disputes filed under Chapter 11 are
national treatment rights (Article 1102), most-favored nation (MFN) rights (Article
1103), minimum international standards of treatment (Article 1105), performance
requirements (Article 1106), and especially provisions for compensation in the event of
expropriation (Article 1110). The most criticized provision, Article 1110, is controversial
because it attempts to balance investor rights against government measures to protect
public welfare.
In a joint statement,30 NAFTA member governments somewhat narrowed the scope of
foreign investment protections under Chapter 11, and concurrently the US government
adopted more restrictive investor protection language in its free trade agreements with
Chile, Singapore, and CAFTA-DR. The new language in the Chile and Singapore FTAs
indicates that environmental or health regulations would rarely constitute indirect
expropriation eligible for compensation.
29 Under Article 1108 (4), no party may “require an investor of another Party, by reason of its nationality, to sell or otherwise dispose of an investment existing at the time the measure becomes effective.” Other rights and obligations covered under Chapter 11 are: prohibitions on senior management nationality requirements (Article 1107), and an environmental protection provision – members are not allowed to reduce environmental standards as a way of attracting investment (Article 1114). 30 NAFTA Free Trade Commission (2005).
19
It has been recommended that NAFTA’s Chapter 11 should add an appellate body for
investor-state disputes.31 A similar procedure might be adopted in the Swiss-US FTA.
An appellate body could help establish clear and uniform jurisprudence for arbitration
panels.
7.5 Portfolio Investment
A. Overview
Table 7.8 gives an overview of holdings of portfolio securities, by type of security,
between the United States on one hand and, on the other hand, Switzerland, the European
Union (EU-15), and the world.32 While the stock of total US inward portfolio investment
was about $6,000 billion in 2004, total outward portfolio investment was about $3,200
billion. Similarly, in 2003, the stock of Swiss portfolio investment abroad totaled $650
billion while the stock of inward portfolio investment in Switzerland amounted to about
$450 billion (table 7.9).
Long-term debt securities account for the largest share of US inward portfolio investment
(59 percent). Equity investment constitutes the most important component of US
portfolio investment abroad (66 percent). For Switzerland, equities constitute the largest
share of inward portfolio investment (89 percent in 2003), while debt securities,
31 Hufbauer and Schott (2005). 32 Data on foreign holdings of US portfolio securities and US holdings of portfolio securities, by type and country, are available on the US Treasury website at: http://www.ustreas.gov/tic/fpis.html (accessed on July 25, 2005). Data on Swiss portfolio investment abroad on a global basis can be found on the Swiss National Bank website at: http://www.snb.ch/e/daten/angaben.html (accessed on July 25, 2005). However, Swiss data does not provide for a detailed picture of the Swiss position in the United States or in Europe.
20

specifically bonds, are the largest component of outward portfolio investment (55
percent) (table 7.9).
Swiss holdings of US portfolio securities totaled approximately $200 billion in 2004,
while US holdings of Swiss portfolio securities totaled $120 billion in 2003. Swiss
portfolio investment in the United States represents 3 percent of total US inward portfolio
investment.
Likewise, US holdings of Swiss portfolio securities represent 4 percent of the share of
total US holdings of foreign portfolio securities. US holdings of Swiss securities are
about 7 percent of US holdings of EU-15 securities. By contrast, Swiss portfolio
investment in the United States is about 10 percent of EU-15 portfolio investment in the
United States.
B. Equity Investment
Equity investment represents the largest share of US portfolio investment in Switzerland
and vice versa. Equity investment constitutes 98 percent of US portfolio investment in
Switzerland and 60 percent of Swiss portfolio investment in the United States. By
comparison, equities represent only 40 percent of EU portfolio investment in the United
States, and 53 percent of US portfolio investment in the EU-15.
In 2003, Swiss holdings of US equities amounted to $120 billion or 6 percent of total
foreign equity investment in the United States (table 7.8). US holdings of Swiss equities
amounted to $118 billion, accounting for 6 percent of total US equity investment abroad.
21

US inward and outward equity investments with Switzerland are thus about the same.
This relationship also holds for equity investment between the United States and the
European Union.33
C. Debt Securities
Long-term debt securities accounted for 35 percent of total Swiss portfolio securities in
the United States, but represented only 1 percent of US portfolio investment in
Switzerland (table 7.8). In other words, investment in debt securities between
Switzerland and the United States is heavily one-sided. Swiss holdings of US debt
securities account for approximately $80 billion, while US holdings of comparable Swiss
securities amount to only $2 billion. By contrast, the United States has invested much
more heavily in the EU debt market, with long-term debt securities representing 23
percent of overall US portfolio investment in the European Union. Nevertheless, EU
outward debt investment in the United States ($1,106 billion) is almost three times higher
than EU inward investment from the United States ($412 billion) (table 7.8).
A leading reason for the lop-sided Swiss-US relationship is that Swiss banks act on
behalf of investors around the world – and many of them want to acquire US debt
securities. On the other hand, most US investors who want to hold European debt
securities prefer the larger and more liquid markets of Germany, France and Italy.
33 US holdings of EU equities amounted to $977 billion in 2003, while EU holdings of US equities amounted to $843 billion in 2004 (table 7.8).
22
D. Portfolio Income Flows
US portfolio income receipts from Switzerland were around $9 billion in 2004, about 15
percent of US portfolio income receipt inflows from the EU-15. By comparison, Swiss
portfolio income receipts from investments in the United States (in other words, US
payments in table 7.10), reached $38 billion in 2004. The $38 billion figure corresponds
to half the amount of EU-15 portfolio income receipts from investments in the United
States – and underscores Switzerland’s role as a financial center.
E. Portfolio Investment Issues
Barriers to portfolio investment in the United States and Switzerland are insignificant. In
the United States, barriers to foreign portfolio investment persisted in US real estate
investment trusts (REITs). However, President Bush recently signed into law the
American Jobs Creation Act of 2004, which gives foreign portfolio investors in listed US
real estate investment trusts (REITs) the same favorable US tax treatment as US
corporations (AFIRE 2004).
The rate of withholding taxes for Swiss-US portfolio investment is about half the
statutory rate. For both Switzerland and the United States, the withholding tax rate is 15
percent of portfolio investment income flows (PWC 1999). However, these tax payments
can be credited against the home country tax liability. The credit is important for
portfolio investors that pay home country tax, but it does not alleviate the tax burden for
non-profit investors and pension funds that pay no home country tax.
23

Swiss banks have raised concerns over the question of exchange of information.
However, the US Treasury appears to have no intention of raising exchange of
information or money laundering issues in the context of a Swiss-US FTA.
7.6 Recommendations for Investment
It is no exaggeration to say that investment provides the bedrock for Swiss-US
commercial relations. On every investment question of global importance, Swiss and US
policies are closely aligned. Both nations agree that direct and portfolio investment
should be unfettered to the maximum extent; both respect property rights; both adhere to
the principles of national treatment and most-favored-nation treatment; both countries are
skeptical of state corporations; and both take a critical (but not altogether hostile) view of
public subsidies for infant and senescent industries.
The synergy between direct investment and trade -- a matter of common observation at
least since the work of Reddaway (1967) and Hufbauer and Adler (1968) -- has been
established by econometric research (e.g., Graham 2000). The US and Swiss two-way
stocks of FDI exceed $200 billion. In turn, these powerful investment links foster two-
way trade in manufactured goods that totals over $20 billion annually, two-way trade in
services of some $16 billion annually; and two-way FDI income flows of some $20
billion annually. And the relatively free flow of two-way trade in goods, services, and
income cycles back to promote more US investment in Switzerland and vice versa.
The very good Swiss-US commercial relationship can still be improved -- first and
foremost by eliminating barriers to merchandise and services trade, but secondly by
24

addressing a few modest frictions in the investment relation. On both counts, two-way
commerce will flourish, and two-way investment will expand beyond its already robust
level. In the bullets that follow, we offer recommendations for the investment frictions
that could be fruitfully addressed in the Swiss-US FTA.
• Swiss investment restrictions in sectors dominated by public monopolies should
be phased out, within the broader framework of welcoming private investment by
Swiss and foreign firms. Rail transport, postal services, certain insurance
services, and alcoholic beverages all deserve attention.
• Swiss conditions for licensing select professions and business activities deserve
scrutiny. Some of the restrictions inhibit the operations of foreign MNEs --
notably licensing terms that affect banks, insurance companies, investment
brokers, employment agencies, wine merchants, hotels and restaurants.
Restrictions on certain professionals, such as attorneys and accountants, may also
have an inhibiting effect and should be reviewed. Technically speaking, this
recommendation can also be classified under services, as a Mode 3
recommendation in the parlance of the GATS. We point it out here because of its
importance for FDI, and the Switzerland’s attractions as a headquarters location.
• Easier access to temporary employee visas is particularly important for US-based
MNEs with operations in Switzerland, and for Swiss-based MNEs with operations
in the United States. Swiss legislation is expected to relax visa barriers by 2007,
but the FTA should supplement the process. For example, spouses of accredited
25

temporary employees should be allowed to work in Switzerland. The United
States should apply similar principles to Swiss nationals working on a temporary
basis in the United States (usually under H1-B visas).
• Impediments to FDI in the United States primarily involve foreign ownership
restrictions in selected sectors, and potentially the CFIUS review process. The
United States should liberalize its foreign ownership restrictions that inhibit bona
fide Swiss investments in the communications sector, particularly broadcasting
services, common carrier radio licenses and mobile phone services.
• As for the CFIUS process, the United States should commit to the proposition that
the sole ground for blocking a bona fide Swiss transaction is national security.
Further, the United States should commit to expeditious CFIUS reviews,
including advisory opinions when requested.
• As an example to the world, the Swiss-US FTA should proclaim the rights of
private investors with respect to national treatment, performance requirements,
standards for the public taking of private property, and appropriate compensation
in the event of expropriation. In terms of obligations, the examples of the US-
Chile and US-Singapore FTAs are more relevant than the older language of
NAFTA.
• As in the NAFTA, as well as the US-Chile, US-Australia, US-Singapore and
CAFTA-DR accords, the Swiss-US FTA should contain procedures for resolving
26

disputes between private investors and host states through arbitration, preferably
under the auspices of the International Center for the Settlement of Investment
Disputes (ICSID). The Swiss-US FTA should also provide for an appellate body
to ensure that arbitration parels are faithful and consistent in applying legal
principles.
• The main friction point for portfolio investment appears to be the 15 percent rate
of withholding tax. While this tax is credited against the investor’s home tax
liability, some important investors -- such as pension funds and charitable
foundations -- have no home country tax liability to absorb the credit. The FTA
is not the place to negotiate withholding tax rates, or other tax issues, but it can
provide an opportunity for the parties to indicate whether the time is ripe to revisit
the 1996 bilateral income tax treaty.
27

Table 7.1 US Foreign Direct Investment Stock Abroad by Industry (2003)a
Industry(billions $) % of (billions $) % of (billions $) % of
Total FDI Total FDI Total FDI
Mining 0.0 0 12.1 1 98.7 6
Utilities 0.0 0 7.9 1 26.9 2
Manufacturing Food 0.2 0 10.1 1 22.7 1 Chemicals 3.0 3 48.3 6 90.3 5 Primary and fabricated metals (D) (D) 8.8 1 23.0 1 Machinery 0.5 1 10.2 1 21.4 1 Computers and electronic products 0.6 1 23.5 3 57.6 3 Electrical equipment, appliances, and components (D) (D) 4.3 1 9.7 1 Transportation equipment (D) (D) 15.0 2 45.4 3 Subtotal 8.7 10 160.3 19 378.0 21
Wholesale trade 11.9 14 75.9 9 140.6 8
Retail trade n/a n/a n/a n/a n/a n/a
Information -2.7 -3 32.2 4 47.5 3
Depository institutions (banks) 7.1 8 27.8 3 63.7 4
Finance (except banks) and insurance 3.3 4 110.8 13 299.8 17
Real estate and rental and leasing n/a n/a n/a n/a n/a n/a
Professional, scientific, and technical services 0.5 1 19.8 2 40.6 2
Other industriesb 57.6 67 397.8 47 693.1 39
Total All Industries 86.4 100 844.7 100 1788.9 100
Notes: a. Historical-cost basis, year-end 2003.b. Holding companies (except banks) comprised 84% of the 'other industries' share to the world.(D) Deleted to maintain data confidentiality.
Source: U.S. Department of Commerce, Survey of Current Business (2004).
Switzerland EU (15) World

Table 7.2 Foreign Direct Investment Stock in the United States by Industry (2003)a
Industry(billions $) % of (billions $) % of (billions $) % of
Total FDI Total FDI Total FDI
Mining (D) (D) (D) (D) (D) (D)
Utilities (D) (D) (D) (D) (D) (D)
Manufacturing Food 5.3 5 10.3 1 19.1 1 Chemicals 26.2 23 83.1 10 123.2 9 Primary and fabricated metals 1.3 1 11.7 1 19.4 1 Machinery 2.6 2 27.0 3 37.7 3 Computers and electronic products 0.6 1 26.1 3 45.9 3 Electrical equipment, appliances, and components (D) (D) 7.2 1 42.3 3 Transportation equipment (D) (D) 36.3 4 63.7 5 Subtotal 72.3 64 291.8 34 475.5 35
Wholesale trade 4.0 4 101.3 12 182.2 13
Retail trade 0.3 0 17.6 2 24.2 2
Information 11.7 10 76.8 9 120.1 9
Depository Institutions (banks) (D) (D) 60.4 7 87.5 6
Finance (except banks) and insurance 23.0 20 108.8 13 185.7 13
Real estate and rental and leasing 0.6 1 18.7 2 47.0 3
Professional, scientific, and technical services 0.5 0 22.8 3 28.4 2
Other industries (D) (D) 157.4 18 227.5 17
Total All Industries 112.9 100 855.7 100 1,378.0 100
Notes: a. Historical-cost basis, year-end 2003.(D) Deleted to maintain data confidentiality.
Source: U.S. Department of Commerce, Survey of Current Business (2004).
Switzerland EU-15 World

Table 7.3 Foreign Direct Investment Stock in Switzerland (2003) a
Industry(billions Sfr) % of (billions Sfr) % of (billions Sfr) % of
Total FDI Total FDI Total FDI
Manufacturing Textiles and clothing n/a n/a n/a n/a n/a n/a Chemicals and plastics n/a n/a n/a n/a 11.7 5.8 Metals and machinery n/a n/a n/a n/a 4.8 2.4 Electronics, energy, optical and watchmaking industries n/a n/a n/a n/a 9.8 4.9 Other manufacturing and construction n/a n/a n/a n/a 6.8 3.4 Subtotal n/a n/a n/a n/a 33.0 16.5
Services Trade n/a n/a n/a n/a 20.6 10.3 Finance and holding companies n/a n/a n/a n/a 105.7 52.8 Banks n/a n/a n/a n/a 26.1 13.1 Insurance n/a n/a n/a n/a 4.0 2.0 Transportation and communications n/a n/a n/a n/a 6.4 3.2 Other services n/a n/a n/a n/a 4.3 2.1 Subtotal n/a n/a n/a n/a 167.2 83.5
Total All Industries 79.2 40 112.0 56 200.2 100
Note: a. End 2003, Sfr 1.00 = $US 0.80 according to IFS database
Source: Swiss National Bank, Development of Direct Investment (2003).
WorldUnited States European Union

Table 7.4 Swiss Direct Investment Stock Abroad (2003)a
Industry(billions Sfr) % of (billions Sfr) % of (billions Sfr) % of
Total FDI Total FDI Total FDI
Manufacturing Textiles and clothing n/a n/a n/a n/a 9.4 2.2 Chemicals and plastics n/a n/a n/a n/a 62.2 14.7 Metals and machinery n/a n/a n/a n/a 20.1 4.8 Electronics, energy, optical and watchmaking industries n/a n/a n/a n/a 12.4 2.9 Other manufacturing and construction n/a n/a n/a n/a 38.6 9.1 Subtotal n/a n/a n/a n/a 142.8 33.7
Services Trade n/a n/a n/a n/a 10.8 2.6 Finance and holding companies n/a n/a n/a n/a 116.2 27.4 Banks n/a n/a n/a n/a 59.4 14.0 Insurance n/a n/a n/a n/a 81.1 19.1 Transportation and communications n/a n/a n/a n/a 3.8 0.9 Other services n/a n/a n/a n/a 9.6 2.3 Subtotal n/a n/a n/a n/a 280.9 66.3
Total All Industries 81.6 19 181.6 43 423.7 100
Note: a. End 2003, Sfr 1.00 = $US 0.80 according to IFS database
Source: Swiss National Bank, Development of Direct Investment (2003).
United States European Union World

Table 7.5 Top 15 Companies in the Bilateral Relationship (2004)(number of employees)
RankName Name
1 Nestlé 46,600 McDonald's 7,2002 UBS AG 25,000 IBM 3,4003 Zurich Financial Services 21,100 Altria Group, Inc. 3,0004 Novartis 20,000 Johnson & Johnson 2,1005 Credit Suisse 18,500 Hewlett-Packard 1,8006 Hoffmann-La Roche 17,000 Synthes-Stratec 1,7007 ABB 11,000 Texas Pacific 1,6008 Gate Gourmet 10,000 Procter & Gamble 1,5009 Schindler 6,500 Cablecom 1,450
10 Adecco 6,500 Mettler-Toledo 1,25011 Scintilla 3,000 General Electric 97012 SGS 3,800 EDS 96513 Syngenta 3,000 HCA Healthcare 90014 Holcim 2,300 Johnson Controls 90015 Clariant 2,800 Dow 830
Total Employment: 197,100 Total Employment: 29,565
Source: Swiss-American Chamber of Commerce (2004).
Swiss Companies in the United States US Companies in Switzerland
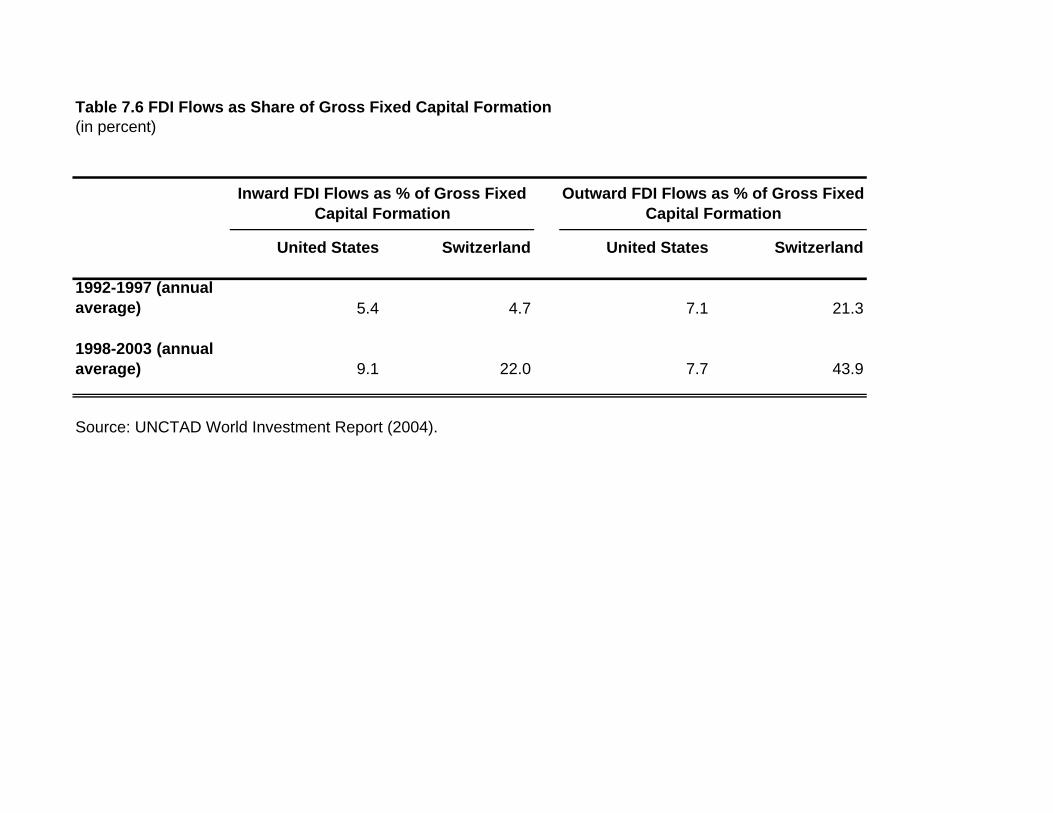
Table 7.6 FDI Flows as Share of Gross Fixed Capital Formation(in percent)
United States Switzerland United States Switzerland
1992-1997 (annual average) 5.4 4.7 7.1 21.3
Source: UNCTAD World Investment Report (2004).
Inward FDI Flows as % of Gross Fixed Capital Formation
Outward FDI Flows as % of Gross Fixed Capital Formation
1998-2003 (annual average) 9.1 22.0 7.7 43.9

Table 7.7 FDI Stock as Share of GDPa
(in percent)
United States Switzerland United States Switzerland
1980 3.0 7.9 7.8 20.01990 6.9 15.0 7.5 28.92000 12.4 36.1 13.2 97.12003 14.1 49.7 18.8 112.0
Note: a. Historical-cost basis, year-end.
Source: UNCTAD World Investment Report (2004).
Inward FDI Stock as % of GDP Outward FDI Stock as % of GDP

(in billions $)
to the US from the US to the US from the US to the US from the US (2004) (2003) (2004) (2003) (2004) (2003)
Equity Securities 120.0 118.0 842.6 977.4 1,904.0 2,079.0
Long-term Debt Securities 69.0 1.0 1,106.0 412.1 3,515.0 874.0Treasury Debt 33.0 n/a n/a n/a 1,462.0 n/aOther LT Debt, of which: 36.0 1.0 n/a n/a 2,052.0 n/a US Agency debt 12.0 n/a n/a n/a 623.0 n/a Corporate debt 24.0 n/a n/a n/a 1,429.0 n/a
Short-term Debt Securities 11.0 1.0 137.0 152.8 588.0 199.0
Total Debt 80.0 2.0 1,243.0 442.0 4,103.0 874.0
Total Equity and Debt 199.0 120.0 2,085.6 1,831.6 6,007.0 3,152.0
Source: US Treasury, data available at: http://www.ustreas.gov/tic/fpis.html (accessed July 2005).
Switzerland Europe 15 World
Table 7.8 US Holdings of Portfolio Securities, by Partner and Type (2003/04)

billions $ billions Sfr billions $ billions Sfr
Equity Securities 398.4 498.0 290.6 363.2Shares 345.4 431.8 179.8 224.8Investment fund certificates 53.0 66.2 138.4 173.0
Debt Securities 58.8 73.5 360.1 450.1Bonds 46.2 57.7 331.9 414.9Money Market Paper 0.9 1.1 28.2 35.2
Total Equity and Debt 445.6 557.0 650.4 813.0
Note:a. End 2003, Sfr 1.00 = $US 0.80 according to IFS database
Source: Swiss National Bank, data available at: http://www.snb.ch/e/daten/angaben.html (accessed July 2005).
to Switzerland from Switzerland
Table 7.9. Swiss Holdings of Portfolio Securities, World Totals (2003)a
(in billions Sfr and billions $)
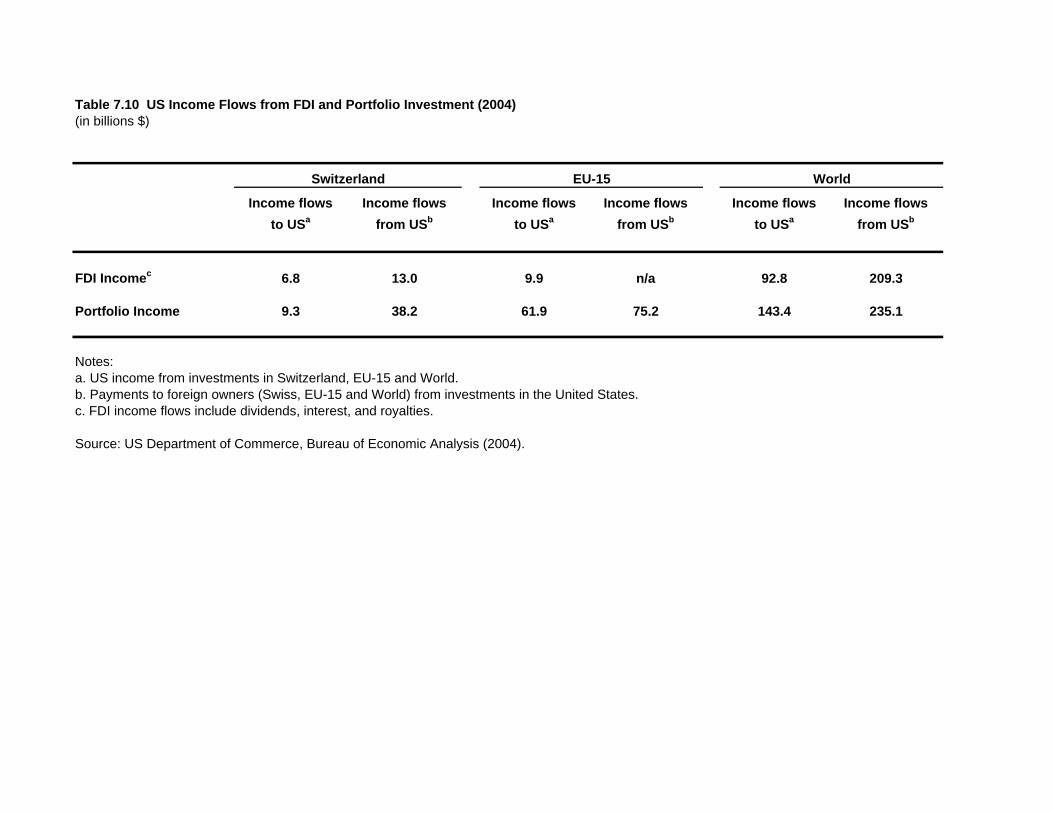
Table 7.10 US Income Flows from FDI and Portfolio Investment (2004)(in billions $)
Income flows Income flows Income flows Income flows Income flows Income flowsto USa from USb to USa from USb to USa from USb
FDI Incomec 6.8 13.0 9.9 n/a 92.8 209.3
Portfolio Income 9.3 38.2 61.9 75.2 143.4 235.1
Notes:a. US income from investments in Switzerland, EU-15 and World. b. Payments to foreign owners (Swiss, EU-15 and World) from investments in the United States. c. FDI income flows include dividends, interest, and royalties.
Source: US Department of Commerce, Bureau of Economic Analysis (2004).
WorldSwitzerland EU-15

Table 7.11 FDI Stock and Exports, Selected Sectors
PART A (billions$)1994 1996 1998 2000 2002 2004
US Direct Investment Position in SwitzerlandTotal FDI Stock 27.9 30.7 38.2 55.4 74.2 100.7All Manufacturing 1.6 3.7 4.5 3.4 5.4 10.8Chemicals 0.3 1.8 2.7 1.5 2.3 4.8
Swiss Direct Investment Position in the United StatesTotal FDI Stock 24.9 30.4 48.3 64.7 123.9 122.9All Manufacturing 13.2 16.2 23.2 30.1 82.4 77.3Chemicals 6.8 8.8 14.2 18.4 25.1 30.0
US Exports to SwitzerlandTotal Manufacturinga 5.5 8.2 7.1 9.8 7.7 9.2
Chemicalsb 0.8 0.6 0.9 1.4 1.4 1.8
Swiss Exports to the United StatesTotal Manufacturinga 6.2 7.6 8.4 9.9 9.1 11.2
Chemicalsb 1.5 2.0 2.0 2.2 2.5 2.8

PART B (index values, 1994=100)1994 1996 1998 2000 2002 2004
US Direct Investment Position in SwitzerlandTotal FDI Stock 100 110 137 198 266 361All Manufacturing 100 234 288 218 342 687Chemicals 100 540 811 462 685 1,437
Swiss Direct Investment Position in the United StatesTotal FDI Stock 100 122 194 260 497 493All Manufacturing 100 123 176 228 624 585Chemicals 100 129 209 271 369 441
US Exports to SwitzerlandTotal Manufacturinga 100 150 130 179 140 167
Chemicalsb 100 83 114 183 179 240
Swiss Exports to the United StatesTotal Manufacturinga 100 123 136 160 147 182
Chemicalsb 100 132 132 147 166 188
Notes:a. Manufacturing is defined as all trade in HTS chapters 24 through 98.b. Chemicals are defined as all trade in HTS chapters 28 through 38.Sources: BEA and USITC

THE SHAPE OF A FREE TRADE AGREEMENT BETWEEN
SWITZERLAND AND THE UNITED STATES
Chapter 8
ESTIMATES FROM GRAVITY AND CGE MODELS
Quantitative assessments of the trade expansion and income gains fostered by a Swiss-US FTA
require detailed consideration of economic structure and multilateral trade patterns. To carry
out this task, we use both gravity and computable general equilibrium (CGE) models. Our
gravity model is an augmented version of Rose’s (2004) framework.1 Whereas Rose analyzed
total merchandise trade between multiple partner countries, we examine disaggregated
merchandise trade. Our CGE model is the comparative static framework of world trade and
economic activity designed by the Global Trade Analysis Project. The GTAP model
disaggregates world merchandise trade by sectors and also (unlike the gravity model) covers
world trade in services.
The reason for presenting estimates from two models is to increase our confidence is the general
tenor of the results. Whereas the gravity model is grounded in the empirical tradition of trade
analysis, the CGE model rests foremost on theoretical foundations. Hence each model serves as a
check on the other. The basic features and results of our gravity and CGE models are described
in the sections that follow. Appendix E provides further technical details on the two models.
1 Andrew Rose is well known for his contentious questioning as to the role of GATT/WTO membership in promoting trade. In this chapter, we cite Rose for his contribution to the technical gravity model and for his data base – not for his analysis of the GATT/WTO system.
Before diving into the models, we must emphasize that the results of these exercises do not
purport to track the details of the recommendations offered in previous chapters. In particular,
the CGE model presents “before and after” comparisons, assuming that all trade barriers that
have been measured in the model’s database are eliminated. The CGE model does not attempt
the more exacting task of modeling the phase-out, over time, of tariffs, quotas and other non-
tariff barriers. Similarly, the gravity model attempts to say what a Swiss-US FTA might
accomplish in terms of merchandise trade expansion, based on the average experience of prior
free trade agreements and customs unions. Few of these agreements have achieved the extent of
liberalization that we recommend for the Swiss-US FTA. Hence the model results should not be
read as precise forecasts as to what would happen if our recommendations were closely followed.
Instead, they suggest, in broad terms, the quantitative outcome of a free trade agreement.
8.1 Gravity Model: Construction and Results
A. Description of the Gravity Model
With the proliferation of preferential trading arrangements during the last decade, the gravity
model has become a widely utilized tool for analyzing the consequences of bilateral and regional
trade agreements.2 The basic gravity model evaluates thousands of two-way bilateral trade
flows, measured in a common currency (and adjusted for inflation), against the gravitational
"mass" of explanatory variables describing the characteristics of bilateral trading partners. The
“core” variables are distance and joint real GDP.3 Most gravity models find that two-way trade
2 Greenaway and Milner (2002) provide an excellent introduction to and review of the recent literature on the gravity model and econometric applications of the model for assessing the trade and other impacts of preferential trading arrangements among regional trading partners. 3 A third “core” variable is joint GDP per capita. A higher joint GDP per capita figure implies a smaller joint population figure (for a given joint GDP level). Less combined population tends to
2

between countries is significantly greater, the larger the combined GDP, and the shorter the
distance between them. Additional explanatory variables are specified as well, and these are of
greatest interest. The additional variables show how much two-way trade is added or subtracted
from the quantity predicted by the basic core variables on account of institutional or policy
features of the partners. For instance, trading partners that share a common border, a common
language, or a common currency are typically found to enjoy significantly greater mutual trade.
To analyze regional trade agreements, a dichotomous (0, 1) explanatory variable – often called a
“dummy” variable -- is introduced to represent preferential arrangements, individually or on a
combined basis. If the coefficient on the dummy variable is positive and significant, then the
regional trading arrangement is judged to expand mutual two-way trade between the arrangement
members. The extent of trade expansion is usually measured in percentage terms. The
percentage trade expansion can be derived from the estimated coefficient on the dummy variable.
Given the log-linear specification of the gravity model regression equation,4 the impact of a free
trade agreement on bilateral trade can be computed in percentage terms as 100*[exp(brta) – 1.00].
In this expression, brta is the estimated coefficient for the dummy variable representing the
presence of a regional trade agreement, and exp(brta) is the value of the natural number e raised
to the exponent brta. For example, if the coefficient brta is 0.33, then the value of exp(brta) is
1.39, and the percentage expansion in trade is estimated as 100*[1.39 – 1.00], which equals 39
percent.
depress the bilateral level of trade; hence the coefficient on joint GDP per capita is normally negative. 4 In a log-linear regression equation, the dependent variable (here two-way bilateral trade) is expressed in logarithmic terms, whereas some independent variables (notably the discreet dummy variables) are expressed simply as linear numbers (e.g., 0 or 1), while others (notably the continuous variables, such as distance or joint GDP) are expressed in logarithmic terms.
3
B. Swiss-US FTA Analytical Framework
We investigate the potential for expansion of Swiss-US trade under a FTA following the
approach of Frankel (1997) and Choi and Schott (2001), among others, using the general
framework of the Rose (2004) gravity model. Our approach represents the existing regional trade
agreements on a combined basis. It also tries to account for the possibility that Swiss-US trade is
already significantly greater than the level predicted by the basic explanatory variables of the
gravity model in the absence of a FTA. It does this in two ways described in a moment.
Our econometric results are based on bilateral trade flows worldwide from 1962 to 1999,
compiled by Feenstra and Lipsey (2005) and originally disaggregated according to the 4-digit
Standard International Trade Classification (SITC). For the present analysis, the Feenstra-Lipsey
trade data were aggregated to the 1-digit SITC level, and deflated by the US consumer price
index. They were then concorded, by year and country pair, to the extensive set of explanatory
variables compiled for the Rose (2004) gravity model.5 The "core" explanatory variables in the
Rose data set include distance between trading partners, joint real GDP, and joint real GDP per
capita. The Rose data set also includes a number of country-specific variables, such as
landlocked and island status, language, colonizers, and dates of independence. In all, the data set
constructed for the present analysis, using the augmented Rose gravity model, entails nearly
5 The complete set of regression variables constructed from the Feenstra-Lipsey and Rose data sets is described in Appendix Table E.1.
4

940,000 observations, covering bilateral trade for about 61,000 combinations of commodities
and pairs of trading countries.6
To the core explanatory variables are added dummy variables representing bilateral, regional,
and other preferential trading arrangements. These include an explanatory variable representing
the generalized system of preferences (GSP).7 The regional trading arrangement variable (RTA),
covers ten regional trade agreements around the world, treated on a combined basis in our
analysis.8 This treatment of the regional trade agreements on a combined basis enables gravity
model estimation of a single coefficient for the impact of preferential trading arrangements on
bilateral trade.
Regional trade agreements have, of course, proliferated in recent years. Jeffery Schott (2004), for
example, calculates that, as of May 2003, some 155 bilateral and regional trade agreements had
been notified to the World Trade Organization (WTO) under Article 24 of the General
6 Notwithstanding its large size, the combined Feenstra-Lipsey and Rose data set has some gaps, and excludes Taiwan and some centrally planned economies, because of holes in the two data sets individually. 7 The dummy variable is needed to distinguish between countries that receive GSP benefits and those that do not. Under the GSP system, a number of advanced countries extend preferences to less developed countries on a non-reciprocal basis. The GSP programs of major industrial and other countries are monitored by the UN Conference on Trade and Development (UNCTAD), including through a series of manuals describing the individual programs. See UNCTAD (2004). 8 The Rose data set includes indicators for the Association of Southeast Asian Nations (ASEAN), European Union (EU), US-Israel FTA, North America Free Trade Agreement (NAFTA), Caribbean Community (CARICOM), Agreement on Trade and Commercial Relations between the Government of Australia and the Government of Papua New Guinea (PATCRA), Australia-New Zealand Closer Economic Relations Trade Agreement (ANZCERTA), Central American Common Market (CACM), South Pacific Regional Trade and Economic Cooperation Agreement (SPARTECA), and the Common Market of the South (Mercosur).
5

Agreement on Tariffs and Trade (GATT).9 Accordingly, in accounting for just 10 “strong”
regional trade agreements, the Rose data upon which we rely does not reflect the breath of recent
experience with bilateral and regional trade agreements worldwide. This has uncertain
implications for the magnitude of our estimated coefficient of the RTA variable. However, many
of the 155 notified agreements are weak, in that they require considerably less than total free
trade between the partners. Many others are quite recent (the 1990s decade was a boom period
for FTAs), and their effects need time to flower. For those reasons, Rose’s strategy of singling
out the 10 strong and well-established RTAs to estimate the trade impact of bilateral and regional
free trade has merit.
In our calculations, two Swiss-US trade integration and openness variables are specified (in
addition to Rose’s set of explanatory variables). Actual trade integration between Switzerland
and the United States is captured by a dummy (0,1) variable for trade between the two countries,
as if a FTA were already in place. Swiss and US “openness” are measured by separate dummy
variables, one for each country. The dummy variable takes the value of one each time
Switzerland (or the United States) is a trading partner with any other country in the world. The
estimated coefficients for these “openness” variables suggest the degree to which Swiss (or US)
trade with the world is greater or less than the norm established by the "core" gravity model
variables.
C. Results from the Gravity Model
9 As of July 2005, the WTO features an illustrative list of 32 major regional trade agreements worldwide on its web site, of which the majority are agreements between small developing countries or newly independent states of Eastern Europe. See http://www.wto.org/english/tratop_e/region_e/region_areagroup_e.htm.
6
Tables 8.1 and 8.2 present the regression results for overall trade (SITC 0 through 9) and for
trade by major commodity categories -- food, beverages, and tobacco (SITC 0 and 1); raw
materials (SITC 2 and 4); mineral fuels and lubricants (SITC 3); and manufactures (SITC 5
through 8). Regression coefficients are presented for the overall period 1962-1999, and for two
sub-periods, 1990-1999 and 1995-1999. The two sub-periods correspond to the decade of the
1990s and the post-Uruguay Round period respectively. Finally, the gravity model estimates are
presented both with, and without, the Swiss-US trade integration and openness explanatory
variables. As it turns out, the presence or absence of these additional variables makes
surprisingly little difference to the other coefficients, including the estimated impact of a regional
trade agreement.
The regression results both for total trade and for disaggregated trade mirror the widely reported
empirical robustness of the gravity model. In particular, the core explanatory variables, led by
distance, joint real GDP, and joint real GDP per capita, bear the anticipated signs and are
generally significant at high levels. Thus, for instance, bilateral trade is positively related to the
joint GDP of the partner countries and negatively related to the distance between them. Similarly,
countries sharing a common border tend to trade significantly more with one another, whereas
landlocked countries tend to trade significantly less than other pairs of countries.
The overall explanatory power of the gravity model using disaggregated bilateral trade data from
the Feenstra-Lipsey data set (R-squared generally about 0.30) is appreciably lower than found by
Rose (2004) using aggregate bilateral trade data (R-squared 0.50-0.60). An exception, however,
7
is the impressive explanatory power of the regression results in table 8.2 for manufactures (R-
squared about 0.50).
Gravity model studies by Rose (2004) and most other previous investigators, using aggregate
bilateral trade, frequently report estimated coefficients near unity for the regional trade
agreement (RTA) variable. By contrast, in our analysis, the estimated coefficients for the RTA
variable are generally less than 0.50, except for the post-Uruguay Round period when the RTA
coefficient estimates generally exceed unity, both for total trade and for all commodity groups
except mineral fuels. A regression coefficient of 0.50 implies that the RTA increases trade
between the partners by 65 percent; a regression coefficient of 1.00 implies that the RTA
increases trade by 172 percent.
We note that Adams et al. (2003) report negative RTA coefficients, using an analytic framework
in the spirit of the gravity model and a database that ends in 1997. Indeed, these authors at the
Australia Productivity Commission (APC) claim that they find net trade diversion for 12 out of
16 recent PTAs. Their technique for measuring diversion is poorly explained or justified in the
paper. For reasons explained in Appendix E, we do not subscribe to the APC findings.
The regression coefficients for the US openness variable are always greater than those for the
Swiss openness variable, suggesting that "trade resistance" forces are stronger in Switzerland
than the United States. Estimated coefficients for the Swiss-US trade integration variable on a
sector-by-sector basis (table 8.2) generally have high positive values, suggesting that bilateral
trade already exceeds the international norm. However, the coefficient is only significant for
8

trade in manufactures in the 1990s. These results tend to suggest that US exports to Switzerland
would expand more than Swiss exports to the United States under a Swiss-US FTA. They also
suggest that agriculture is a prime candidate for trade expansion in both directions, probably
because high levels of protection characterize both countries. Other evidence, reported shortly,
suggests that there is also considerable room for expanded manufactures trade between
Switzerland and the United States.
The following tabulation reports the trade expansion effects implied by the various coefficient
estimates for the RTA variables in tables 8.1 and 8.2.10
1962-1999 1990-1999 1995-1999
Simple
Average
Total Trade (SITC 0-9) 39% 39% 235% 104%
Disaggregated Trade
Agriculture (SITC 0&1)
73% 76% 278% 142%
Raw Material (SITC 2&4)
43% 45% 215% 101%
Fuels
(SITC 3) -25% 20% 82% 26%
Mfg. Goods (SITC 5-8)
45% 36% 339% 140%
Simple
Average* 34% 44% 229% 102%
10 The figures in the tabulation are based on the regressions that include the dummy variables for Swiss-US trade integration and openness. However, as mentioned, the dummy variables make very little difference to the RTA coefficients.
9

* The simple average excludes the estimate for total trade (SITC 0-9).
The simple average column gives equal weight to the coefficients estimated for each of the
overlapping periods. Based on the simple average percentage expansion for total trade (104
percent) and for the four sectors taken together (102 percent), it appears that overall Swiss-US
merchandise trade might expand, under an FTA, by a central estimate of about 100 percent,
holding all other factors constant. Both agriculture and manufactures two-way trade might
expand by about 140 percent. Predicted expansion of Swiss-US trade in manufactures by more
than 100 percent may seem implausible, given the relative openness of both Switzerland and the
United States. However, a great deal of bilateral trade expansion could be induced by a leap in
bilateral foreign direct investment, as suggested in Chapter 7.11
8.2 CGE Model: Construction and Results
A. Description of the CGE Model
Computable general equilibrium (CGE) models are based on general equilibrium principles; they
are built with the objective of turning abstract theories into practical tools. A number of features
distinguish CGE models from other widely used frameworks for trade policy analysis (especially
gravity models). In particular, the actions of economic agents are modeled explicitly through
utility and profit maximizing assumptions, while economy-wide resource and expenditure
11 Ignoring the other coefficients, and just focusing on post-Uruguay Round estimation results, suggests that overall Swiss-US trade might grow by 235 percent, led by expansion of manufactures (nearly 340 percent) and agriculture (nearly 280 percent). These results do seem implausible. However, given the array of hidden barriers to manufactures trade as well as overt barriers to agricultural trade, bilateral trade expansion could conceivably exceed 100 percent.
10

constraints are rigorously enforced. Because they link markets into a single system, CGE
techniques effectively capture feedback and flow-through effects induced by policy changes.
Economic distortions often have repercussions beyond the sector in which they occur, and CGE
models are designed to capture these indirect effects. CGE analysis is particularly well-suited to
the examination of free trade arrangements, where multi-sector liberalization is undertaken in at
least two countries simultaneously, and where adverse consequences of discriminatory
preferences may well arise (Panagariya, 2000).
Against these significant advantages, CGE models are highly data intensive, and subject to
several uncertainties: how should equations be specified, what parameters should be used, and
how should the FTA experiment be designed? Because CGE simulation results are sensitive to
these decisions, they should be viewed cautiously. Our CGE model is the GTAP framework, a
publicly available model that is widely adopted. The GTAP model is a multi-region, multi-
sector model that assumes perfect competition and constant returns to scale. The assumptions of
perfect competition and constant returns to scale are very strong and in practice tend to apply
best for homogeneous goods, and not so well for services (which are more heterogeneous in
character and often entail large fixed costs). Other CGE frameworks assume that countries enjoy
increasing returns to scale as they specialize, and that monopolistic markups are eroded by trade
liberalization. Such models may also assume that freer trade spurs investment and productivity.
Some models also incorporate dynamic effects, such as fostered innovation due to greater
competition. These additional assumptions typically result in significantly larger calculated trade
and economic gains as a consequence of removing barriers. By contrast the results reported here,
using a comparative statics framework, are very conservative and may severely underestimate
11
the benefits of a free trade agreement. Notably in services, which command more than 70
percent of GDP in both the US and Switzerland, products are in practice differentiated and
knowledge-intensive. Accordingly the expected gains of a Swiss-US FTA should come from
returns to scale, competitive erosion of markup margins, and dynamic innovation. These effects
are not, however, captured by the GTAP model.
B. Experimental Design
The proposed free trade agreement between Switzerland and the United States is first simulated
independently of the existence of other potential free trade agreements. The results thus reflect
the estimated effect of the proposal in isolation from any liberalization that occurred after the
reference year for the GTAP6 database (2001), or that might be on the drawing boards. For
services trade, the base year for the tariff equivalent values used in the analysis is 1996,
reflecting barriers to trade in services as reported by Dee et al (2000).
We then consider an all-partners experiment, in which the proposed Swiss-US FTA is
implemented simultaneously with other “new” US FTAs (those ratified after the GTAP6
database) and prospective US FTAs that might come in force by the end of 2006. The “new” US
FTAs are Chile, Australia, Singapore and Morocco; the prospective FTAs (in addition to the Swiss-US
FTAs) are CAFTA, Thailand and SACU.
In all cases, the arrangements are assumed to be implemented “clean”, meaning that all import
tariffs are eventually reduced to zero by the participating economies, on a bilateral preferential
12

basis. Services trade barriers are also eliminated.12 However, all other tariffs and barriers (i.e.,
those applied to non-participating economies) are left in place. In other words, possible
liberalization negotiated in the WTO Doha Development Round is not taken into consideration.
Moreover, in the experiment with all free trade areas, it is assumed that the free trade agreements
are implemented only with the United States. Preferential liberalization amongst the proposed
partner regions is not considered.
To provide an additional benchmark for the implications of bilateral free trade areas agreements,
namely, in addition to the "status quo benchmark" provided by the CGE model baseline itself,
we also consider unilateral trade reform scenarios for Switzerland and the United States. In these
scenarios, each economy is assumed to unilaterally remove all tariffs on a non-discriminatory
basis, thereby providing a indication of the extent to which a free trade agreement either
improves upon or falls short of the usual textbook optimum of free trade.
All of the simulations are run as exercises in comparative statics. This entails “before” and
“after” pictures, allowing all the agreed bilateral liberalization to take place and all industries to
adjust, but with no attempt to profile the time path of adjustment. The factor market “closure”
conditions allow full mobility of capital and labor across domestic industries. In other words, all
capital and labor (both skilled and unskilled) are assumed fully employed once the adjustment
process is complete.13 The implicit time frame is the long-run, typically regarded as an
12 Estimates of barriers to services are those reported by Dee et al. (2000), which reflects barriers as of 1996. . 13 An alternative assumption, consistent with the same results, is that unemployment rates for labor and capital remain the same before and after full adjustment.
13

adjustment period of about 10 years. However, the adjustment path is not directly modeled.
Land is treated as imperfectly mobile across agricultural activities, while other natural resources
are assumed committed to individual industries as specific factors.
C. Results from the CGE Model
Estimates of the overall effect of the proposed agreement are presented in table 8.3. The model
predicts fairly dramatic increases in the volume of bilateral trade between the United States and
Switzerland, with US exports to Switzerland increasing by 32 percent, and Swiss exports to the
United States increasing by approximately 12 percent. One reason for the dramatic increase in
US exports is that Swiss imports from other countries may decline, once US firms enjoy a
preferential tariff structure. This effect, known as “trade diversion”, seems quite strong in the
case of Switzerland.14 A major reason is that Swiss tariffs on agriculture are high, and the
United States would become a preferred supplier, alongside the European Union. The overall
welfare effects of the agreement are estimated to be small for both economies, and positive for
Switzerland.15
The unilateral benchmark results give some indication of why the welfare outcomes occur. The
United States is already a very open economy, and hence has little to gain in terms of efficiency
from further liberalization, and in fact loses in welfare terms (although by only a small fraction
14 Swiss trade diversion is also reflected in the significant drop in Swiss tariff revenues, shown in the third section of table 8.3, and in the adverse terms-of-trade shift (discussed below) 15 The welfare effects presented in table 8.3 are measured as the equivalent variation (EV) in income. This is essentially the change in household income that is equivalent to the proposed change, at constant consumer prices.
14

of GDP) from unilateral reform due to shifts in the terms-of-trade.16 Recall also that the GTAP
model results do not incorporate returns to scale, competitive or dynamic effects – and all of
these are important, especially for the services sector. Finally, since the Swiss market is
relatively small, there are only small opportunities to counter adverse terms-of-trade shifts with
increased market access. For Switzerland, the gains from unilateral liberalization are larger,
reflecting higher protection levels in a few key markets, and much smaller adverse terms-of-trade
effects.
It should be emphasized that alternative modeling techniques suggest a much larger GDP gains
from expanded Swiss-US trade than the gains calculated by our static CGE analysis using the
GTAP framework. Based on table 8.3, Swiss-US bilateral trade might increase by $5.3 billion in
the wake of a Swiss-US FTA.17 Research reported elsewhere (Bradford et al. 2005), using a
variety of alternative techniques, suggests that annual GDP gains to each partner would amount
to about 20 percent of the expanded trade, or about $1.1 billion annually.18 These gains reflect
the adoption of improved production methods to answer competitive pressures, the exit of less
efficient firms, scale and network economies, reduced mark-up margins, and more intense use of
imported inputs, and greater variety in the menu of available goods and services. For the United
16 This result for US unilateral trade liberalization is commonly found in CGE models that use the GTAP framework, and emphasizes the importance of concerted, reciprocal trade liberalization for a large economy, such as the United States, to avoid adverse terms-of-trade effects. For a smaller economy, such as Switzerland, reciprocal trade liberalization is not so essential to avoid an adverse movement in the terms of trade. 17 In addition, the United States would slightly expand its imports from the rest of the world, but Switzerland would slightly contract its imports. 18 This rough rule of thumb finds strong support in the econometric literature, but of course counter-examples can be cited where GDP gains are not related in a simple fashion to trade expansion. On the other hand, GDP gains could be much larger than the figures cited in the text, if two-way trade doubled, as suggested by the gravity model calculations reported earlier.
15
States, as a percentage of GDP, the annual gains calculated by the static GTAP model are very
small, but for Switzerland the annual gains represent an increment of about 0.5 percent in GDP.
The welfare effects of the Swiss-US FTA on third countries are presented in more detail in table
8.4. Most other economies suffer very small welfare losses as a consequence of the free trade
agreement. The largest adverse effects are incurred by China. Preference dilution – the
phenomenon whereby existing FTA partners lose the benefits of preferential access to the Swiss
or US market when Switzerland enters into free trade with the United States -- does not seem to
be significant for either the NAFTA members or EFTA, although there is a slight effect for the
European Union. As a proportion of regional GDP, all welfare effects on non-members are very
minor. Under unilateral reform, by contrast, non-members generally benefit.
In fact, it is worth pointing out that the CGE model predicts that Switzerland would gain twice as
much in GDP terms if the United States would unilaterally abolished its barriers with all
countries, not just enter an FTA with Switzerland. This result presumably reflects the spur to
global growth that would result from unilateral US trade reform. While unilateral reform is not
in the cards, if a Swiss-US FTA is implemented, the calculation suggests that Switzerland can be
relaxed about further US liberalization in the Doha Round or other trade contexts.
Table 8.5 contains details on the change in the pattern of overall trade by region. The effects of
the Swiss-US FTA on non-member exports to the United States are very small. For Switzerland,
however, the effects are more significant and consistently negative, especially for Australia and
New Zealand, China, and the members of ASEAN.
16

CGE models allow us to predict which sectors are most likely to be affected by the proposed
agreement. The results of the analysis are presented in tables 8.6 and 8.7. Table 8.6 presents the
estimated changes in bilateral and total exports by economic sector. The simulations predict
some very large gains in US exports of agricultural products, including grains, oil seeds, animal
products, and dairy (extremely large, but from a very small base of only $1.8 million in 2001),
and other manufactures. These results reflect very high protection levels for Switzerland in 2001
in the GTAP6 database (34 percent for grains, 21 percent for oil seeds, 101 percent for animal
products, and 108 percent for dairy). The simulations also predict US export gains of 73 percent
for “other manufactures” (manufactures excluding motor vehicles, machinery and electronic
equipment).19 From the perspective of overall US trade, only the Swiss tariff changes in raw
animal products, dairy products and “other manufactures” are large enough to have a significant
impact on US bilateral exports.
For Switzerland, the bilateral export gains are much smaller, but very still significant in dairy,
textiles, metal products and some agricultural products. Reflecting the comparatively large role
that the United States plays in Switzerland's bilateral trade profile, these translate into significant
overall trade expansion in the areas of raw animal products, dairy products, and certain
manufactures.
19 Based on the data in Appendix E, we have assumed that the Swiss tariff barrier for this category is 11 percent. This is well below the implausibly high figure in the GTAP6 database, namely 155 percent.
17

The predicted changes in bilateral trade in services are positive, but relatively small at 10 percent
for US exports to Switzerland and 13 percent for Swiss exports to the United States. Moreover,
total US exports of services are in fact predicted to decline, indicating that the increase in US
exports to Switzerland represents a diversion. There are three model-related explanations for the
small and counter-intuitive changes. The first is that the trade flow barriers estimated by Dee et
al. (2000) are relatively low (about 5 percent on an ad valorem equivalent basis). The second is
that certain types of barriers (e.g., taxes on interest and dividends, and taxes on sales) are not
region-specific in the GTAP model. The third and possibly most important possibility is that
barriers to trade in services limit trade flows to a greater extent than modeled in the GTAP
framework. For example, barriers to trade in services may hinder firms from investing in the
foreign market (GATS mode 3). Hence reducing these barriers could spur foreign direct
investment in the affected service sectors and beneficially enhance competitive pressures. Such
positive productivity effects are not captured by the GTAP model. Hence, the applied general
equilibrium analysis reported here very likely understates the potential for expanded bilateral
services trade under a Swiss-US FTA.
The estimated changes in output by sector are presented in table 8.7. These figures are useful for
understanding the possible extent of structural adjustment that might be required under the
agreement. In the United States, the only sector affected by the proposed FTA (beyond a
marginal extent) is the “other manufactures” sector, which enjoys an expansion of 2.5 percent.
This finding suggests that US adjustment issues in response to the Swiss-US FTA would be
negligible.
18

In Switzerland the adjustment burdens are likely to be more substantial, with significant output
declines predicted in manufacturing and crops. However, output gains are estimated in dairy and
textiles/apparel. Overall, while Swiss adjustments are much greater than those predicted for the
United States, burden seems to be manageable. This is especially so when the bilateral FTA is
compared with the unilateral benchmark, where the required adjustments are substantial (table
8.7).
A final issue of concern is how the benefits of the proposed FTA are likely to be spread across
different members of society. The GTAP framework deals with this issue in the “Ricardian”
tradition, by estimating changes in the rewards to the primary factors (capital, labor, land) used
in the production process. The estimated percentage changes in real factor rewards are presented
in table 8.8. In the United States, all effects are relatively minor; in Switzerland, important
changes are predicted. In particular, the model predicts a decline in the returns to land and
natural resources, suggesting that agricultural households are likely to come under pressure from
increased in US agricultural exports, although again by a much smaller amount than would occur
under unilateral reform.
Since the United States has recently signed several new FTAs, and is considering others, it is
important to consider how the presence of those FTAs would affect our simulation outcomes. As
noted above, we consider a scenario in which the proposed Swiss-US agreement is implemented
simultaneously with other current and prospective US FTAs that conceivably might enter into
force by 2006, with the United States as the FTA hub (Chile, Australia, Singapore, Morocco
19

agreed; CAFTA, SACU, and Thailand prospective). The results are presented in tables 8.9
through 8.13.
The most notable result from table 8.9 is that the presence of the other FTA partners does not
substantially alter the predicted changes in bilateral trade between the United States and
Switzerland. However, there are substantial increases in total US trade, reflecting the broader
array of trading opportunities that arise under the hub formation. Similarly, while the overall
welfare effect is only slightly reduced for Switzerland, the benefits are much greater for the
United States from multiple FTAs. Even so, the gains are still very small as a fraction of US
GDP, reflecting both low initial US barriers to trade, and the relatively small economic size of its
current and prospective FTA partners.
Table 8.9 shows the estimated regional welfare effects. Under the multiple FTA scenario, the
effects on non-partner countries are magnified, especially for NAFTA partners and the EU
members. However, the negative effects on non-members remain small in proportion to their
GDP levels.
The regional trading pattern estimates in table 8.10 indicate that, when the Swiss-US FTA is
considered in conjunction with other FTAs, a significant reduction occurs in the volume of
bilateral trade between the other US partners and Switzerland. This happens because the hub-
and-spoke structure does not eliminate barriers between Switzerland and the other US partners.
20

While estimated changes in the sectoral pattern of trade (tables 8.11 and 8.12) are not
significantly different from those already discussed (tables 8.6 and 8.7), there are some
differences in the volume of total US trade, especially in animal products, dairy, food and textiles.
However, tables 8.11 and 8.12 indicate that a large fraction of the projected trade changes are
redirection, and production changes remain relatively small.
8.3 Summing Up
The quantitative results from the gravity and CGE models presented in this chapter offer two
useful views of the economic prospects of a Swiss-US FTA. The views concur in some respects
that deserve emphasis. Importantly, the estimates from the two models concur in the view that a
FTA between Switzerland and United States would result in significant expansion of bilateral
two-way trade between the two countries. The gain is estimated at about 100 percent by the
gravity model and more modestly at between 32 percent (US exports to Switzerland) and 12
percent (Swiss exports to the United States) by the GTAP model (averaging an increase of about
20 percent in bilateral two-way trade). Further, both models agree that much of the expansion in
bilateral trade might be focused in agriculture, where the two countries maintain significant
protection for domestic producers of dairy, grain, livestock, and other farm products owing to the
political strength of the agriculture lobbies in both countries.
The general equilibrium estimates of the GTAP model provide additional insights as to the
impact of a Swiss-US FTA. Although they find little improvement in overall economic welfare,20
20 It deserves mention that the GTAP protection data for manufactured goods almost exclusively refers to tariffs, even though non-tariff barriers are often important. If the Swiss-US FTA can make a dent in these non-tariff barriers, the calculated welfare benefits would be larger.
21

they point to particular sectors of both economies that would benefit from the expansion of
bilateral exports. These include the dairy, grain, oilseed and “other manufacturing” sectors in the
United States, and the dairy, raw animal products, and select manufacturing sectors in
Switzerland. As for the limited overall economic gains found by the CGE model, in important
respects this outcome likely reflects deficiencies in modeling the services sector. By contrast,
sector specific studies suggest strong positive effects from liberalizing services trade.21
Spillover effects arising from trade diversion under the hypothesized Swiss-US FTA would
adversely impact third-countries, especially China, the European Union, and the NAFTA
partners of the United States. These effects are generally modest in magnitude however, and in
the case of the EU and NAFTA they largely reflect "leveling of the playing field" for Swiss and
US exporters -- owing to the dilution of preferences enjoyed by competing Canadian and
Mexican exporters in the US market and EU exporters in the Swiss market.
21 See for instance Copenhagen Economics (2005).
22

Table 8.1 Gravity Model Estimates for Total Trade (1962-99)
All Commodities and Manufactures (SITC 0 through 9)
1962-1999 1990-1999 1995-1999Without With Without With Without With
Constant -19.27 *** -18.20 *** -7.00 *** -5.77 *** -6.93 *** -5.70 ***Distance -0.79 *** -0.81 *** -0.77 *** -0.79 *** -0.72 *** -0.74 ***Joint GDP 0.75 *** 0.74 *** 0.53 *** 0.51 *** 0.53 *** 0.51 ***Joint GDP per capita -0.10 *** -0.10 *** -0.25 *** -0.25 *** -0.28 *** -0.28 ***Common language 0.20 *** 0.13 *** 0.19 *** 0.08 *** 0.22 *** 0.12 ***Common border 0.55 *** 0.57 *** 0.96 *** 0.98 *** 0.91 *** 0.93 ***Landlocked -0.19 *** -0.25 *** -0.50 *** -0.62 *** -0.53 *** -0.66 ***Island 0.11 *** 0.11 *** 0.34 *** 0.35 *** 0.31 *** 0.33 ***Land area -0.13 *** -0.13 *** -0.07 *** -0.07 *** -0.06 *** -0.07 ***Common colonizer -0.06 ** -0.03 -0.15 *** -0.10 ** -0.11 ** -0.06Colony 0.75 *** 0.76 *** 0.30 * 0.30 * 0.29 0.29Ever a colony 1.67 *** 1.76 *** 1.00 *** 1.13 *** 0.95 *** 1.08 ***Common ctry 0.22 0.20 -0.65 -0.75 -0.67 -0.77Currency union 0.80 *** 0.79 *** 1.52 *** 0.66 *** 1.40 *** 0.48 *GSP -0.14 *** -0.15 *** 0.33 *** 0.26 *** 0.28 *** 0.22 ***RTAs 0.33 *** 0.33 *** 0.32 *** 0.33 *** 1.19 *** 1.21 ***US-Swiss trade 0.94 * 1.63 *** 1.57 ***US openness 1.46 *** 1.52 *** 1.50 ***Swiss openness 0.51 *** 0.94 *** 1.01 ***
R-sq 0.40 0.41 0.34 0.35 0.36 0.36Obs. (Th.) 940 940 263 263 146 146Groups (Th.) 61 61 44 44 41 41
Source: Author's calculations based on generalized least squares estimation of the Rose (2004) gravity model with random effects, using a combined version of the Rose (2004) and the Feenstra-Lipsey (2005) data sets.
Notes: Regressand is log real trade. Distance, GDP, GDP per capita, and land area are measured in log terms. Estimated year effects are not reported. ***, **, * indicate that the coefficients are statistically significant at the 99 percent, 95 percent, and 90 percent levels, respectively. Groups are numbers of country-pair-commodity combinations for which trade exists in the data sample.
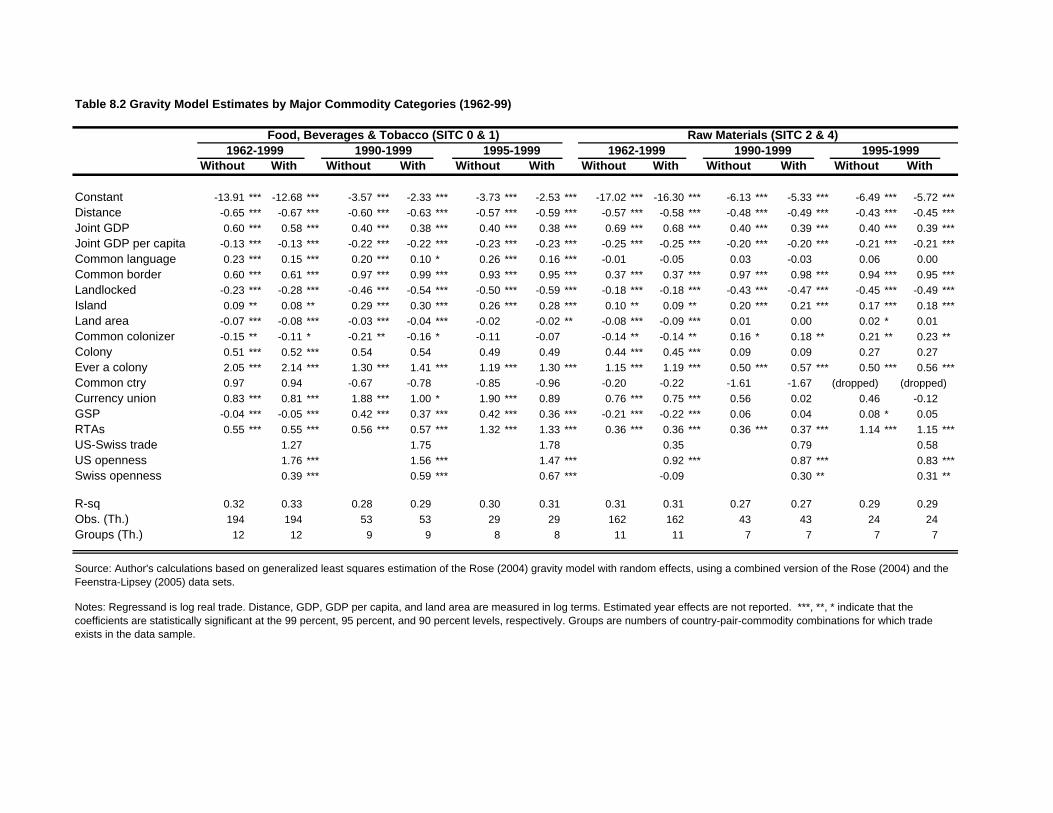
Food, Beverages & Tobacco (SITC 0 & 1) Raw Materials (SITC 2 & 4)1962-1999 1990-1999 1995-1999 1962-1999 1990-1999 1995-1999
Without With Without With Without With Without With Without With Without With
Constant -13.91 *** -12.68 *** -3.57 *** -2.33 *** -3.73 *** -2.53 *** -17.02 *** -16.30 *** -6.13 *** -5.33 *** -6.49 *** -5.72 ***Distance -0.65 *** -0.67 *** -0.60 *** -0.63 *** -0.57 *** -0.59 *** -0.57 *** -0.58 *** -0.48 *** -0.49 *** -0.43 *** -0.45 ***Joint GDP 0.60 *** 0.58 *** 0.40 *** 0.38 *** 0.40 *** 0.38 *** 0.69 *** 0.68 *** 0.40 *** 0.39 *** 0.40 *** 0.39 ***Joint GDP per capita -0.13 *** -0.13 *** -0.22 *** -0.22 *** -0.23 *** -0.23 *** -0.25 *** -0.25 *** -0.20 *** -0.20 *** -0.21 *** -0.21 ***Common language 0.23 *** 0.15 *** 0.20 *** 0.10 * 0.26 *** 0.16 *** -0.01 -0.05 0.03 -0.03 0.06 0.00Common border 0.60 *** 0.61 *** 0.97 *** 0.99 *** 0.93 *** 0.95 *** 0.37 *** 0.37 *** 0.97 *** 0.98 *** 0.94 *** 0.95 ***Landlocked -0.23 *** -0.28 *** -0.46 *** -0.54 *** -0.50 *** -0.59 *** -0.18 *** -0.18 *** -0.43 *** -0.47 *** -0.45 *** -0.49 ***Island 0.09 ** 0.08 ** 0.29 *** 0.30 *** 0.26 *** 0.28 *** 0.10 ** 0.09 ** 0.20 *** 0.21 *** 0.17 *** 0.18 ***Land area -0.07 *** -0.08 *** -0.03 *** -0.04 *** -0.02 -0.02 ** -0.08 *** -0.09 *** 0.01 0.00 0.02 * 0.01Common colonizer -0.15 ** -0.11 * -0.21 ** -0.16 * -0.11 -0.07 -0.14 ** -0.14 ** 0.16 * 0.18 ** 0.21 ** 0.23 **Colony 0.51 *** 0.52 *** 0.54 0.54 0.49 0.49 0.44 *** 0.45 *** 0.09 0.09 0.27 0.27Ever a colony 2.05 *** 2.14 *** 1.30 *** 1.41 *** 1.19 *** 1.30 *** 1.15 *** 1.19 *** 0.50 *** 0.57 *** 0.50 *** 0.56 ***Common ctry 0.97 0.94 -0.67 -0.78 -0.85 -0.96 -0.20 -0.22 -1.61 -1.67 (dropped) (dropped)Currency union 0.83 *** 0.81 *** 1.88 *** 1.00 * 1.90 *** 0.89 0.76 *** 0.75 *** 0.56 0.02 0.46 -0.12GSP -0.04 *** -0.05 *** 0.42 *** 0.37 *** 0.42 *** 0.36 *** -0.21 *** -0.22 *** 0.06 0.04 0.08 * 0.05RTAs 0.55 *** 0.55 *** 0.56 *** 0.57 *** 1.32 *** 1.33 *** 0.36 *** 0.36 *** 0.36 *** 0.37 *** 1.14 *** 1.15 ***US-Swiss trade 1.27 1.75 1.78 0.35 0.79 0.58US openness 1.76 *** 1.56 *** 1.47 *** 0.92 *** 0.87 *** 0.83 ***Swiss openness 0.39 *** 0.59 *** 0.67 *** -0.09 0.30 ** 0.31 **
R-sq 0.32 0.33 0.28 0.29 0.30 0.31 0.31 0.31 0.27 0.27 0.29 0.29Obs. (Th.) 194 194 53 53 29 29 162 162 43 43 24 24Groups (Th.) 12 12 9 9 8 8 11 11 7 7 7 7
Table 8.2 Gravity Model Estimates by Major Commodity Categories (1962-99)
Source: Author's calculations based on generalized least squares estimation of the Rose (2004) gravity model with random effects, using a combined version of the Rose (2004) and the Feenstra-Lipsey (2005) data sets.
Notes: Regressand is log real trade. Distance, GDP, GDP per capita, and land area are measured in log terms. Estimated year effects are not reported. ***, **, * indicate that the coefficients are statistically significant at the 99 percent, 95 percent, and 90 percent levels, respectively. Groups are numbers of country-pair-commodity combinations for which trade exists in the data sample.

Mineral Fuels & Lubricants (SITC 3) Manufactures (SITC 5 through 8)1962-1999 1990-1999 1995-1999 1962-1999 1990-1999 1995-1999
Without With Without With Without With Without With Without With Without With
Constant -11.26 *** -10.57 *** -3.35 *** -2.25 *** -3.52 *** -2.40 *** -25.04 *** -23.96 *** -11.08 *** -9.85 *** -10.60 *** -9.33 ***Distance -1.02 *** -1.03 *** -0.82 *** -0.84 *** -0.80 *** -0.83 *** -0.98 *** -1.00 *** -1.03 *** -1.05 *** -0.98 *** -1.00 ***Joint GDP 0.31 *** 0.31 *** 0.27 *** 0.26 *** 0.29 *** 0.28 *** 0.98 *** 0.96 *** 0.73 *** 0.71 *** 0.72 *** 0.70 ***Joint GDP per capita 0.41 *** 0.41 *** 0.03 0.02 -0.05 -0.05 * -0.12 *** -0.13 *** -0.32 *** -0.33 *** -0.37 *** -0.37 ***Common language -0.25 *** -0.28 *** 0.01 -0.07 0.05 -0.03 0.36 *** 0.27 *** 0.25 *** 0.14 *** 0.28 *** 0.17 ***Common border 0.54 *** 0.53 *** 1.13 *** 1.15 *** 1.21 *** 1.22 *** 0.66 *** 0.68 *** 1.09 *** 1.10 *** 0.99 *** 0.99 ***Landlocked -1.34 *** -1.21 *** -1.28 *** -1.34 *** -1.30 *** -1.37 *** -0.07 *** -0.21 *** -0.50 *** -0.66 *** -0.56 *** -0.72 ***Island 0.50 *** 0.47 *** 0.58 *** 0.58 *** 0.65 *** 0.65 *** 0.02 *** 0.03 0.35 *** 0.37 *** 0.32 *** 0.35 ***Land area 0.18 *** 0.17 *** 0.16 *** 0.15 *** 0.16 *** 0.15 *** -0.24 *** -0.23 *** -0.15 *** -0.15 *** -0.15 *** -0.15 ***Common colonizer 0.74 *** 0.71 *** 0.79 *** 0.81 *** 1.11 *** 1.13 *** -0.12 *** -0.06 * -0.32 *** -0.26 *** -0.32 *** -0.25 ***Colony 0.69 *** 0.69 *** -0.08 -0.08 0.32 0.32 0.82 *** 0.83 *** 0.39 0.39 0.33 0.33Ever a colony 0.97 *** 0.98 *** 0.20 0.28 0.23 0.32 2.06 *** 2.16 *** 1.47 *** 1.62 *** 1.40 *** 1.54 ***Common ctry -0.75 -0.80 -1.10 -1.19 -1.43 -1.52 0.46 *** 0.47 -0.81 -0.90 -1.05 -1.15Currency union 0.70 *** 0.69 *** 0.66 0.05 1.05 0.42 0.66 *** 0.65 *** 1.67 *** 0.75 ** 1.32 *** 0.33GSP -0.37 *** -0.37 *** -0.30 *** -0.33 *** -0.31 *** -0.36 *** -0.13 *** -0.14 *** 0.54 *** 0.45 *** 0.46 *** 0.37 ***RTAs -0.28 *** -0.28 *** 0.18 ** 0.18 ** 0.59 *** 0.60 *** 0.37 *** 0.37 *** 0.29 *** 0.31 *** 1.45 *** 1.48 ***US-Swiss trade 1.43 -0.18 0.10 0.64 2.48 *** 2.44 ***US openness 0.91 *** 1.10 *** 1.12 *** 1.51 *** 1.67 *** 1.71 ***Swiss openness -0.95 *** 0.26 0.33 1.34 *** 1.32 *** 1.37 ***
R-sq 0.33 0.33 0.26 0.27 0.27 0.28 0.57 0.58 0.50 0.51 0.52 0.53Obs. (Th.) 61 61 17 17 9 9 461 461 133 133 74 74Groups (Th.) 5 5 3 3 3 3 28 28 21 21 20 20
Table 8.2 (Cont.) Gravity Model Estimates by Major Commodity Categories (1962-99)
Source: Author's calculations based on generalized least squares estimation of the Rose (2004) gravity model with random effects, using a combined version of the Rose (2004) and the Feenstra-Lipsey (2005) data sets.
Notes: Regressand is log real trade. Distance, GDP, GDP per capita, and land area are measured in log terms. Estimated year effects are not reported. ***, **, * indicate that the coefficients are statistically significant at the 99 percent, 95 percent, and 90 percent levels, respectively. Groups are numbers of country-pair-commodity combinations for which trade exists in the data sample.

Table 8.3 CGE Changes in Key Variables, Swiss-US FTA
(Millions $) (Millions $)
Total Import Value 1,289,855 0.1% 2.9% 97,559 1.9% 3.1%From Partner 14,909 12.3% 2.1% 10,981 32.4% 5.5%From ROW 1,274,946 -0.1% 2.9% 86,578 -2.0% 2.8%
Total Export Value 881,759 0.6% 4.4% 107,007 1.0% 1.9%To Partner 10,811 32.0% 5.7% 14,683 12.2% 3.5%To ROW 870,948 0.2% 4.4% 92,324 -0.8% 1.6%
Tariff Revenue 19,946 -192 -19,946 2,445 -821 -2,445From Partner 157 -157 -157 324 -324 -324From ROW 19,789 -35 -19,789 2,120 -496 -2,120
Welfare as % of GDP 0.0% -0.1% 0.0% 0.1%
Total EV - -94 -11,510 - 106 186Allocative Efficiency - -145 1,716 - -30 33Terms-of-trade - 51 -13,226 - 135 154
Source: Initial data from the GTAP6 database (Dimaranan and McDougall, 2005). Estimates from simulation results.
Free Trade AreaUnilateral
BenchmarkInitial Value Initial Value(% change or millions $) (% change or million $)
United States Switzerland
Free Trade AreaUnilateral
Benchmark

Table 8.4 CGE Changes in Net Welfare by Region, Swiss-US FTA
Country TotalAllocative Efficiency
Terms of Trade Total
Allocative Efficiency
Terms of Trade Total
Allocative Efficiency
Terms of Trade
(Billion $)
Australia 350.4 9 5 4 224 1 223 9 0 9New Zealand 49.8 -4 1 -5 73 0 74 5 -1 6China 1,061.6 -21 8 -29 3,060 795 2,266 51 -18 68Hong Kong 165.3 7 3 4 -4 -63 59 -27 -3 -24Japan 4,027.3 90 17 73 2,019 352 1,666 47 9 37Republic of Korea 408.6 -3 2 -6 848 55 793 4 -6 10Taiwan 275.9 -10 1 -11 623 4 619 1 -2 3Brazil 490.9 18 10 8 389 107 283 102 13 89Chile 65.0 1 1 0 58 1 57 1 -1 2Rest of S. America 693.0 22 12 10 545 118 427 10 0 10Central America 102.2 -3 -1 -2 757 320 437 -6 0 -6European Union 7,781.7 -16 204 -220 4,925 253 4,672 171 11 161Switzerland 242.5 106 -30 135 204 -5 208 207 1,146 -939Rest of EFTA 198.6 5 3 1 143 -10 153 7 0 7Eastern Europe 817.2 9 19 -9 493 22 471 144 -8 152Morocco 32.9 -1 0 -1 21 7 14 82 6 75SACU 10.0 -1 0 -1 28 2 26 0 0 0Rest of World 1,939.7 -2 28 -31 1,566 100 1,466 174 77 98
Indonesia 140.6 -6 0 -6 323 -69 392 11 -2 13Malaysia 86.9 -5 4 -9 150 -52 203 4 -3 7Philippines 67.4 -4 -3 -2 246 68 178 4 3 0Singapore 84.8 1 2 -1 8 -22 30 -6 -2 -3Thailand 111.7 -8 0 -8 280 -48 328 4 -1 5Vietnam 31.2 -4 0 -4 178 92 86 12 4 8Sum ASEAN 522.6 -26 1,186 28Canada 703.8 54 12 42 -844 37 -881 29 4 25United States 9,987.0 -94 -145 51 -11,510 1,716 -13,226 186 33 154Mexico 599.3 0 -15 15 -1,175 -101 -1,074 28 -3 31Sum NAFTA 11,290.1 -40 -13,529 244Sum WORLD 30,525.3 138 3,630 1,254Source: Initial data from the GTAP6 database (Dimaranan and McDougall, 2005). Estimates from simulation results.
(Millions $) (Millions $)(Millions $)
United States SwitzerlandUnilateral Benchmark
Free Trade Area
Initial GDP

Table 8.5 CGE Changes in the Regional Pattern of Exports, Swiss-US FTA (Percent change in value)
TotalTo the
USTo
Switzerland TotalTo the
USTo
Switzerland TotalTo the
US TotalTo
Switzerland
Australia 72.3 8.6 0.4 0.0 0.0 -6.1 0.3 4.7 0.0 2.2New Zealand 18.1 2.8 0.1 0.0 -0.1 -20.9 0.4 5.9 0.0 33.6China 379.6 108.4 1.5 0.0 -0.1 -3.7 1.2 9.8 0.0 22.3Hong Kong 98.2 20.4 0.9 0.0 0.0 -4.6 0.6 7.5 0.0 2.7Japan 448.8 123.9 2.0 -0.1 -0.3 -0.7 0.4 4.3 0.0 5.8Republic of Korea 175.4 37.2 0.6 0.0 -0.1 -0.7 0.6 6.3 0.0 3.1Taiwan 135.7 36.1 0.5 0.0 -0.1 -0.6 0.6 5.2 0.0 0.7Brazil 67.8 16.0 0.5 -0.1 -0.1 -3.6 0.3 4.4 0.0 88.3Chile 21.7 4.0 0.1 0.0 0.0 -3.4 0.2 2.3 0.0 6.2Rest of S. America 119.7 33.5 1.3 0.0 0.0 -1.9 0.4 2.7 0.0 0.9Central America 34.1 13.4 0.3 0.0 0.0 -5.7 1.7 11.6 0.0 -0.7European Union 2,477.9 287.1 62.6 0.0 -0.1 -1.8 0.3 3.2 0.0 0.0Switzerland 107.0 14.7 - 1.0 12.2 - 0.3 2.1 1.9 0.0Rest of EFTA 66.4 7.8 0.4 0.0 0.0 -3.3 0.0 0.3 0.0 -4.5Eastern Europe 340.8 24.3 5.8 0.0 -0.1 -0.7 0.2 1.1 0.1 13.3Morocco 11.2 1.1 0.1 0.0 0.0 -4.0 0.3 1.9 0.3 300.2SACU 6.2 0.5 0.0 0.0 0.0 -7.9 0.9 24.4 0.0 -6.6Rest of World 507.5 99.8 3.5 0.0 0.0 -4.9 0.5 2.7 0.0 2.9
Indonesia 68.0 11.4 0.2 0.0 -0.1 -1.3 1.0 13.2 0.0 6.9Malaysia 124.4 24.0 0.3 0.0 -0.1 -2.2 0.4 3.0 0.0 1.6Philippines 37.9 11.5 0.1 0.0 -0.1 -4.2 0.1 5.4 0.0 -1.9Singapore 110.4 17.8 0.5 0.0 -0.1 -7.8 0.2 1.0 0.0 5.1Thailand 79.4 17.2 0.5 0.0 -0.1 -2.9 0.3 6.3 0.0 4.8Vietnam 15.3 1.4 0.1 0.0 0.0 -1.5 0.2 8.3 0.0 -1.5Sum ASEAN 435.3 83.4 1.7 0.0 -0.1 -4.0 0.4 5.1 0.0 3.7Canada 265.3 198.2 0.6 0.0 0.0 -3.5 -0.9 -2.2 0.0 4.1United States 881.8 - 10.8 0.6 - 32.0 4.4 - 0.0 5.4Mexico 164.3 129.5 0.5 0.0 0.0 -2.6 -0.5 -1.8 0.0 22.3Sum NAFTA 1,311.4 327.8 11.9 0.4 0.0 28.9 2.7 -2.0 0.0 6.0Sum WORLD 6,835.1 1,250.9 94.1 0.1 0.1 1.9 0.9 2.8 0.1 3.1
Source: Initial data from the GTAP6 database (Dimaranan and McDougall, 2005). Estimates from simulation results.
Initial Value
(Billions $)
SwitzerlandFree Trade Area United StatesUnilateral Benchmark
(% Change) (% Change) (% Change)

Table 8.6 CGE Changes in the Sectoral Pattern of Exports, Swiss-US FTA(Percent change in value or millions $)
TotalTo
Switzerland TotalTo
Switzerland Total TotalTo the
US Total To the US Total(% Change) (% Change)
Grains 9,638 8 0.1 401.4 1.5 64 0 6.3 7.0 72.9Oil Seeds 5,698 11 0.2 115.1 1.3 9 0 4.8 5.1 27.7Plant Based Fibers 2,209 4 -0.1 0.4 5.4 50 0 1.4 5.4 9.0Other Crops 8,062 57 0.1 21.4 2.1 205 7 3.8 33.9 30.8Raw Animal Products 12,287 32 7.6 2,880.1 2.0 118 8 24.6 30.8 111.2Wool 9 0 -0.3 -1.3 13.5 3 0 2.5 21.3 19.6Forestry 1,254 3 0.0 2.8 1.2 129 0 0.3 13.6 1.3Coal, Oil and Gas 4,246 2 -0.1 10.3 2.9 57 0 0.2 1.8 4.4Dairy Products 802 2 26.5 11,799.7 2.5 361 35 41.3 349.8 31.1Other Food Products 19,615 123 0.8 105.1 1.2 1,888 102 2.4 29.6 13.7Textiles and Clothing 19,337 65 0.5 60.7 8.8 2,180 172 6.1 82.7 -0.1Wood Products 8,212 17 0.3 12.0 1.7 823 27 0.0 4.3 -1.0Paper Products 20,031 88 0.4 26.6 0.9 2,001 78 -0.4 1.0 -1.5Chemicals 117,946 1,451 0.3 3.6 1.5 24,126 2,797 0.4 11.4 -1.8Ferrous Metals 6,932 36 0.3 8.2 0.9 994 36 -0.2 9.5 -1.6Non-ferrous Metals 11,379 223 0.3 1.1 2.7 5,626 465 -0.4 3.3 -1.7Metal Products 14,857 52 0.4 16.6 1.3 2,823 276 1.6 22.6 -1.9Motor Vehicles 108,533 597 0.3 3.9 1.4 2,068 336 0.1 3.2 -1.7Electronic Equipment 110,550 514 0.4 1.5 2.9 2,901 408 -1.0 -0.4 -2.7Machinery and Equip. 165,096 1,241 0.5 3.8 2.5 30,230 3,939 0.3 8.1 -2.3Other Manufactures 15,588 2,029 9.8 73.1 3.6 4,739 659 1.8 10.8 1.4Non-traded Services 4,083 16 0.4 0.9 1.8 2,715 20 -0.8 -1.1 -1.7Traded Services 215,394 4,240 -0.1 10.2 11.2 22,898 5,316 2.1 13.1 12.2
Source: Initial data from the GTAP6 database (Dimaranan and McDougall, 2005). Estimates from simulation results.
Free Trade AreaUnilateral
Benchmark
(Millions $) (% Change)
Initial Value
United States Switzerland
(Millions $)
Unilateral BenchmarkFree Trade Area
(% Change)
Initial Value
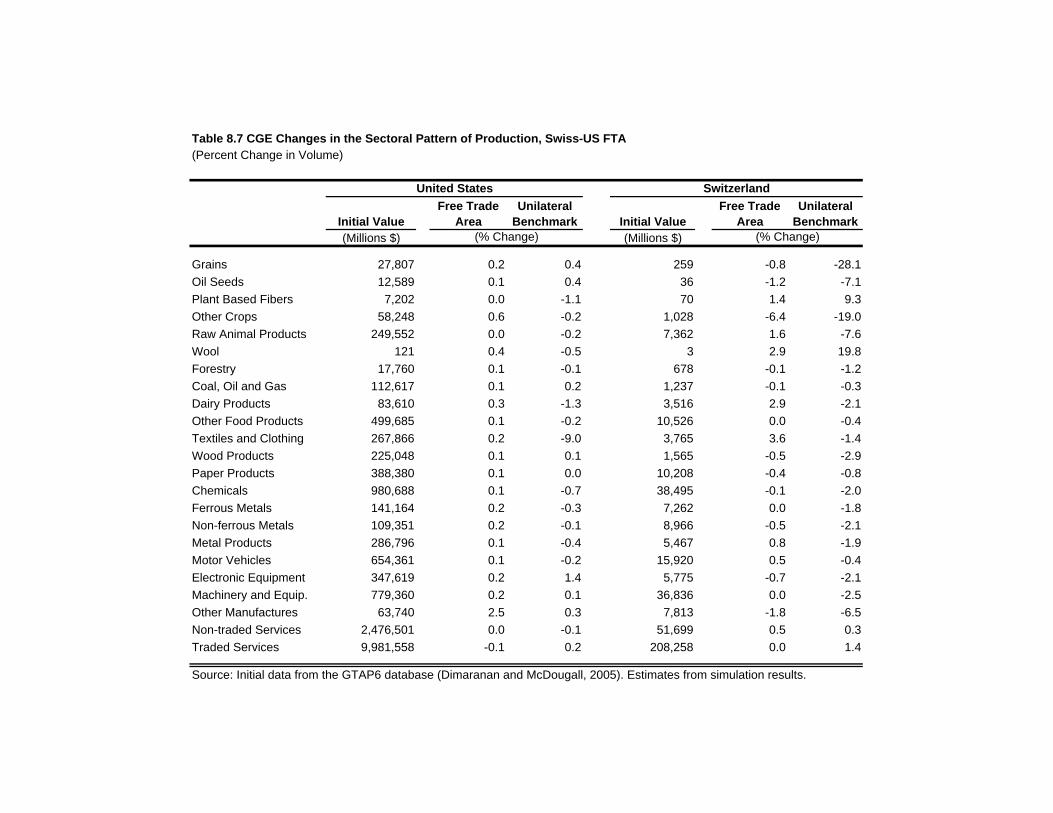
Table 8.7 CGE Changes in the Sectoral Pattern of Production, Swiss-US FTA (Percent Change in Volume)
(Millions $) (Millions $)
Grains 27,807 0.2 0.4 259 -0.8 -28.1Oil Seeds 12,589 0.1 0.4 36 -1.2 -7.1Plant Based Fibers 7,202 0.0 -1.1 70 1.4 9.3Other Crops 58,248 0.6 -0.2 1,028 -6.4 -19.0Raw Animal Products 249,552 0.0 -0.2 7,362 1.6 -7.6Wool 121 0.4 -0.5 3 2.9 19.8Forestry 17,760 0.1 -0.1 678 -0.1 -1.2Coal, Oil and Gas 112,617 0.1 0.2 1,237 -0.1 -0.3Dairy Products 83,610 0.3 -1.3 3,516 2.9 -2.1Other Food Products 499,685 0.1 -0.2 10,526 0.0 -0.4Textiles and Clothing 267,866 0.2 -9.0 3,765 3.6 -1.4Wood Products 225,048 0.1 0.1 1,565 -0.5 -2.9Paper Products 388,380 0.1 0.0 10,208 -0.4 -0.8Chemicals 980,688 0.1 -0.7 38,495 -0.1 -2.0Ferrous Metals 141,164 0.2 -0.3 7,262 0.0 -1.8Non-ferrous Metals 109,351 0.2 -0.1 8,966 -0.5 -2.1Metal Products 286,796 0.1 -0.4 5,467 0.8 -1.9Motor Vehicles 654,361 0.1 -0.2 15,920 0.5 -0.4Electronic Equipment 347,619 0.2 1.4 5,775 -0.7 -2.1Machinery and Equip. 779,360 0.2 0.1 36,836 0.0 -2.5Other Manufactures 63,740 2.5 0.3 7,813 -1.8 -6.5Non-traded Services 2,476,501 0.0 -0.1 51,699 0.5 0.3Traded Services 9,981,558 -0.1 0.2 208,258 0.0 1.4
Source: Initial data from the GTAP6 database (Dimaranan and McDougall, 2005). Estimates from simulation results.
(% Change) (% Change)Initial Value
United States SwitzerlandFree Trade
AreaUnilateral
BenchmarkFree Trade
AreaUnilateral
BenchmarkInitial Value

Table 8.8 CGE Changes in Returns to Factors of Production, Swiss-US FTA(Percent change at constant prices)
Free Trade AreaUnilateral
Benchmark Free Trade AreaUnilateral
Benchmark
Land 0.6 0.2 -9.7 -40.9Unskilled Labor -0.3 -0.1 0.1 1.8Skilled Labor -0.3 0.0 0.1 2.0Capital -0.3 -0.1 0.8 2.4Natural Resources 0.2 0.7 -2.1 -7.6
Source: Simulation results.
United States Switzerland

Table 8.9 CGE Changes for Key Variables, All US FTAs
United States Switzerland Chile Australia Singapore Morocco CAFTA SACU Thailand
Import Value (%) 0.8 1.8 2.8 1.6 1.4 9.4 11.3 7.4 3.1From Partner/s 38.6 31.7 36.8 17.9 1.9 143.6 53.3 48.7 53.2From ROW -1.3 -2.1 -4.7 -2.1 1.3 0.1 -1.9 3.9 -2.6
Export Value (%) 1.7 1.0 1.5 0.7 2.3 -3.5 7.7 -1.6 1.1To Partner/s 27.3 12.1 9.7 14.5 9.2 12.6 41.4 65.1 22.0To ROW -0.4 -0.8 -0.4 -1.1 0.9 -5.3 -14.0 -7.9 -4.6
Tariff Revenue (Millions $) -2,596 -819 -241 -421 0 -153 -922 -20 -658From Partner/s -2,246 -324 -189 -333 0 -85 -844 -25 -444From ROW -350 -494 -52 -88 0 -68 -77 6 -214
Welfare as a % of GDP (%) 0.0 0.0 0.2 0.0 -0.3 0.8 1.8 1.6 0.6
Total EV (Millions $) 1,137 53 141 132 -219 261 1,820 156 651Allocative Efficiency 6 -40 37 -24 -206 138 806 66 -154Terms-of-trade 1,131 93 104 156 -13 123 1,013 90 805
Source: Simulation results.

Table 8.10 CGE Changes in the Regional Pattern of Exports, all US FTAs (Percent Change in Value)
Total To the USTo
Switzerland Total To the USTo
Switzerland
Australia 72.3 8.6 0.4 0.7 14.5 -7.3New Zealand 18.1 2.8 0.1 -0.1 -0.7 -20.6China 379.6 108.4 1.5 -0.2 -1.0 -3.3Hong Kong 98.2 20.4 0.9 -0.1 -1.5 -4.3Japan 448.8 123.9 2.0 0.0 0.1 -0.5Republic of Korea 175.4 37.2 0.6 -0.1 -0.5 -0.5Taiwan 135.7 36.1 0.5 -0.1 -0.4 -0.4Brazil 67.8 16.0 0.5 0.0 -0.4 -3.3Chile 21.7 4.0 0.1 1.5 9.7 -5.6Rest of S. America 119.7 33.5 1.3 -0.1 -0.6 -1.5Central America 34.1 13.4 0.3 7.7 41.4 -20.0European Union 2,477.9 287.1 62.6 0.0 -0.3 -1.8Switzerland 107.0 14.7 - 1.0 12.1 -Rest of EFTA 66.4 7.8 0.4 0.0 0.0 -3.4Eastern Europe 340.8 24.3 5.8 0.0 -0.4 -0.8Morocco 11.2 1.1 0.1 -3.5 12.6 -9.7SACU 6.2 0.5 0.0 -1.6 65.1 -10.4Rest of World 507.5 99.8 3.5 -0.1 -1.1 -4.7Indonesia 68.0 11.4 0.2 -0.1 -2.2 -1.0Malaysia 124.4 24.0 0.3 0.0 -0.4 -2.3Philippines 37.9 11.5 0.1 0.0 -1.1 -3.5Singapore 110.4 17.8 0.5 2.3 9.2 -6.5Thailand 79.4 17.2 0.5 1.1 22.0 -8.3Vietnam 15.3 1.4 0.1 0.0 -1.1 -1.3Sum ASEAN 435.3 83.4 1.7 0.8 5.9 -5.1Canada 265.3 198.2 0.6 -0.1 -0.1 -3.3United States 881.8 - 10.8 1.7 - 31.3Mexico 164.3 129.5 0.5 0.0 -0.1 -2.2Sum NAFTA 1,311.4 327.8 11.9 1.1 -0.1 28.3Sum WORLD 6,835.1 1,250.9 94.1 0.3 0.8 1.8
Source: Initial data from the GTAP6 database (Dimaranan and McDougall, 2005). Estimates from simulation results.
Free Trade AreaInitial Value
(% Change)(Billions $)

Table 8.11 CGE Changes in the Sectoral Pattern of Exports, all US FTAs (Percent change in value)
TotalTo
Switzerland TotalTo
Switzerland Total TotalTo the
US TotalTo the
US Total(% Change) (% Change)
Grains 9,638 8 3.0 391.5 1.5 64 0 6.3 8.4 72.9Oil Seeds 5,698 11 0.8 112.5 1.3 9 0 4.8 4.6 27.7Plant Based Fibers 2,209 4 1.0 -1.2 5.4 50 0 1.1 6.2 9.0Other Crops 8,062 57 1.0 20.3 2.1 205 7 3.8 34.0 30.8Raw Animal Products 12,287 32 8.5 2,869.1 2.0 118 8 24.4 28.6 111.2Wool 9 0 -1.5 -3.9 13.5 3 0 2.4 18.0 19.6Forestry 1,254 3 -0.1 2.4 1.2 129 0 0.3 14.0 1.3Coal, Oil and Gas 4,246 2 1.3 9.1 2.9 57 0 0.9 2.3 4.4Dairy Products 802 2 42.1 11,723.2 2.5 361 35 40.2 339.6 31.1Other Food Products 19,615 123 3.7 104.3 1.2 1,888 102 2.2 28.6 13.7Textiles and Clothing 19,337 65 20.4 60.9 8.8 2,180 172 4.8 69.4 -0.1Wood Products 8,212 17 2.2 11.3 1.7 823 27 0.0 4.6 -1.0Paper Products 20,031 88 1.5 25.7 0.9 2,001 78 -0.5 1.3 -1.5Chemicals 117,946 1,451 1.6 3.0 1.5 24,126 2,797 0.4 11.5 -1.8Ferrous Metals 6,932 36 0.4 7.4 0.9 994 36 -0.2 9.8 -1.6Non-ferrous Metals 11,379 223 0.7 0.0 2.7 5,626 465 -0.6 3.4 -1.7Metal Products 14,857 52 1.6 15.5 1.3 2,823 276 1.6 23.0 -1.9Motor Vehicles 108,533 597 1.1 3.1 1.4 2,068 336 0.0 3.4 -1.7Electronic Equipment 110,550 514 0.2 0.5 2.9 2,901 408 -1.0 -0.3 -2.7Machinery and Equip. 165,096 1,241 1.2 2.7 2.5 30,230 3,939 0.2 8.3 -2.3Other Manufactures 15,588 2,029 11.8 72.3 3.6 4,739 659 1.8 10.9 1.4Non-traded Services 4,083 16 -0.1 0.2 1.8 2,715 20 -0.9 -0.8 -1.7Traded Services 215,394 4,240 0.2 9.9 11.2 22,898 5,316 2.3 12.9 12.2
Source: Initial data from the GTAP6 database (Dimaranan and McDougall, 2005). Estimates from simulation results.
(Millions $) (% Change) (Millions $)
United States Switzerland
Free Trade AreaUnilateral
BenchmarkInitial Value Initial Value Unilateral
BenchmarkFree Trade Area
(% Change)

Table 8.12 CGE Changes in the Sectoral Pattern of Production, all US FTAs (Percent change in volume)
United States Switzerland Chile Australia Singapore Morocco CAFTA SACU Thailand
Grains 1.0 -0.7 0.9 -0.9 0.7 -4.3 -8.4 -8.8 -1.4Oil Seeds 0.2 -1.1 0.7 0.1 0.1 -3.0 -3.7 -5.6 -5.2Plant Based Fibers 0.3 1.3 0.8 0.2 0.3 -0.6 6.5 30.5 6.0Other Crops -0.1 1.7 1.6 0.0 0.5 -1.2 -3.5 -5.3 0.7Raw Animal Products 0.6 -6.4 0.8 1.6 1.5 0.6 -0.9 -4.7 -0.7Wool -0.8 2.7 1.1 -1.3 1.3 -0.2 3.8 -2.6 11.6Forestry 0.1 -0.1 0.6 -0.2 0.9 10.4 -5.0 -4.7 -4.3Coal, Oil and Gas 0.0 0.0 0.3 -0.4 4.7 -15.2 -14.0 -8.6 -1.6Dairy Products 0.4 2.8 2.8 -0.3 3.7 -5.1 -4.5 -10.6 -2.3Other Food Products 0.2 -0.1 0.8 0.5 1.7 -0.4 -2.9 -3.0 -0.3Textiles & Wearing Apparel 0.3 2.8 1.4 0.6 29.7 -0.1 40.2 42.7 19.1Wood Products 0.1 -0.4 1.5 -0.8 4.1 -1.0 -13.2 -5.4 -8.1Paper Products 0.1 -0.3 -0.5 -0.4 2.9 -4.5 -7.4 -6.9 -2.8Chemicals 0.2 0.0 0.9 -0.6 4.4 -2.4 -7.3 -3.9 -2.5Ferrous Metals 0.1 0.0 0.7 -0.8 3.4 -1.4 -14.6 -3.7 -3.3Non-ferrous Metals 0.1 -0.6 2.1 -1.7 3.9 -4.5 -21.4 8.4 -4.4Metal Products 0.1 0.7 0.8 -0.5 3.3 -0.7 -11.7 0.5 -5.2Motor Vehicles 0.1 0.4 0.7 -0.6 4.1 1.6 -6.7 -3.5 -0.9Electronic Equipment -0.1 -0.7 -4.6 -0.7 1.9 -4.9 -23.7 0.6 -4.8Machinery and Equipment 0.2 0.0 0.4 -1.2 5.1 -1.3 -21.0 2.4 -3.2Other Manufactures 2.8 -1.7 0.7 -0.6 3.2 -2.8 -12.6 -11.4 -4.6Non-traded Services 0.0 0.4 1.6 0.3 -0.5 10.6 4.4 13.1 2.5Traded Services -0.1 0.1 -1.3 0.0 -1.7 -0.4 -1.4 1.3 -1.6
Source: Simulation results.

Table 8.13 CGE Changes in Returns to Factors of Production, all US FTAs(Percent change at constant prices)
United States Switzerland Chile Australia Singapore Morocco CAFTA SACU Thailand
Land 2.0 -9.6 0.5 3.4 -5.3 -10.7 0.1 -2.4 -10.0Unskilled Labor -0.2 0.1 -0.1 -5.5 -5.4 2.1 -4.1 -2.8 -3.6Skilled Labor -0.2 0.1 -0.1 -8.3 -9.4 0.5 -4.7 -6.2 -6.8Capital -0.2 0.8 0.4 1.3 12.0 6.9 -2.6 2.5 13.6Natural Resources 0.1 -1.9 -1.8 0.3 -20.2 -18.9 3.7 -3.8 -24.4
Source: Simulation results.

THE SHAPE OF A FREE TRADE AGREEMENT BETWEEN SWITZERLAND AND THE UNITED STATES
Chapter 9
SWISS RELATIONS WITH THE EUROPEAN UNION
Switzerland is a landlocked nation surrounded by four European Union members,
including three of the EU’s largest economies, German, France and Italy. Given this
geographical reality, the European Union currently plays a preponderant role in Swiss
trade flows and Swiss trade policy. For the same reason, Swiss-EU trade relations will
continue to occupy a central place in Bern’s thinking, even if a Swiss-US FTA becomes a
reality.
This chapter considers the implications of a Swiss-US FTA for Bern’s relationship with
the European Union. Bern-Brussels trade relations have a long and peculiar history that is
essential background for understanding the likely impact of Swiss free trade agreement
with the United States. Hence the chapter begins with a brief discussion of the main
post-war steps in Swiss-EU trade ties. We stress the political economy logic that guided
the relationship, providing a basis for conjectures on the consequences of a Swiss-US
FTA. The final section considers specific problems and speculates on their outcome.
To summarize, this chapter argues that a Swiss-US FTA will not cause major difficulties
for Swiss-EU trade relations. Three central reasons support this conjecture. First, the
2
European Union has already obtained almost all of the market access it wants from
Switzerland, via 50 years of bilateral negotiations. The only area where major trade
barriers remain is farm trade, but here the lack of reciprocal market access is firmly
supported by the “body politic” in both Bern and Brussels. Second, except in agriculture,
Swiss MFN tariffs are low, so the margin of preference extended to US firms will be
modest. Third, the Swiss market is a relative minor concern to EU exporters, so the
modest erosion of EU’s preferential access implied by a Swiss-US FTA is unlikely to
cause a severe backlash in Brussels.
9.1 Historical Perspective
The realities of intra-European trade relations are – even today – shaped by the Second
World War. The war’s massive death and destruction, following on the heels of
devastation from the First World War, radically altered attitudes in Europe. All
Europeans agreed that economic integration was critical to avoiding another war, but
opinions differed on whether it would be enough. The Six,1 led by France and Germany,
believed that Europe’s former enemies needed political as well as economic integration.
And their citizens, having lived through such spectacular governmental failures, thought
it was a good idea to bind their national sovereignty in supra-national organisations such
as the European Coal and Steel Community (1950) and the European Economic
Community (EEC, 1958). For the Swiss, the lessons of the war were exactly the opposite.
1 The European Six, original members of the European Economic Community, are Germany, France, Italy, Netherlands, Belgium and Luxembourg.

3
Absolute national sovereignty and strict non-involvement, they believed, were exactly
what saved Switzerland from wreckage in the two world wars.
A. First Reaction: EFTA and the EEC
When the Six rebuffed the United Kingdom’s attempt, in the late 1950s, to set up a pan-
European free trade area that would include the EEC, Britain proposed the creation of the
European Free Trade Association (EFTA), and Switzerland became a founding member
in 1960.
For the next 40 years, Swiss relations with the EEC/EU were dominated by a string of
similar reactions to events decided in Brussels. The 1960s saw rapid intra-EEC and intra-
EFTA trade liberalization. Discriminatory integration by the two blocs had a dramatic
effect on trade patterns. The EEC’s share of trade with itself rose from 30 to 50 per cent.2
The share of EEC imports from other European nations stagnated or fell. This
discrimination meant lost profit opportunities for exporters in both groups, but since the
EEC market was more than twice the size of EFTA’s (and growing faster), the EEC club
was far more attractive to exporting firms. This generated new political economy forces
within the EFTA nations – forces that pushed for EEC membership.
2 See Baldwin and Wyplosz (2003). Chapter 5 gives the details, and Chapter 1 provides a broader historical perspective.

4
The United Kingdom was the first domino to fall. Despite the UK’s lead role in creating
EFTA, the British government reacted to new trade pressures by applying for EEC
membership in 1961. Three more dominos fell immediately.3 If Britain were to jump to
the EEC customs union, exporters in the remaining EFTA nations would face
discrimination in even more markets. In reaction, Ireland, Denmark and Norway –
nations that had found it politically optimal to avoid EEC membership in 1958 – also
applied in 1961. But Switzerland, which wished to maintain its political neutrality in the
escalating Cold War, decided to stay with EFTA.4
B. Second Reaction: Swiss-EU FTA
When the EEC enlargement finally occurred in 1973, many more dominos fell. The
impending UK accession – which would heighten discriminatory effects facing Swiss
exporters – created new political economy forces. Exporters in Switzerland and the other
remaining EFTA nations pushed their governments to sign bilateral free trade agreements
with the EEC in 1973.
This second Swiss reaction set the pattern that governs Swiss-EU relations right up to
today. In retrospect, we can discern three salient points:
• Any EU initiative that threatens important new discrimination for Swiss exporters
elicits a Swiss reaction, but Bern is the follower and Brussels is the leader.
3 See Baldwin (1994, 1995, 2005) for details on the ‘domino theory of regionalism’. 4 See Nell (1994) for a more extensive review of Swiss-EU trade relations.

5
• The reaction addresses the new economic realities in a way that minimizes
political integration.
• Agriculture is excluded by mutual agreement. Neither the EU members nor the
Swiss have ever shown as great an interest in freer trade in food products, as has the
United States. Instead both sides are happy to forego reciprocal market access in
exchange for a free hand on farm policy.
As part of this reactive pattern, Switzerland has been in a relationship that might be called
a “virtual FTA union” with the European Union for the last 40 years. Each time the
European Union signs a new free trade deal with a third nation, Switzerland follows suit.
Again the domino logic prevails. For example, the 1991 EU-Poland trade deal would
have given German firms an edge over their Swiss rivals in the Polish market. Impending
discrimination generated new political economy forces in Switzerland that pushed Bern
into signing its own FTA with Poland (under EFTA auspices).
Switzerland’s list of actual and planned FTAs (negotiated under the EFTA umbrella with
its partners, Norway, Iceland and Liechtenstein) is similar to the EU’s list. Like the
European Union, EFTA partners have negotiated agreements with Bulgaria, Chile,
Croatia, Israel, Jordan, Macedonia, Mexico, Morocco, the Palestinian Authority,
Romania, Singapore, Tunisia, and Turkey.5 Unlike the European Union, however, EFTA
5 An FTA with Lebanon has been signed but has not entered into force.

6
has already concluded an FTA with Singapore (which is in force), and has recently
completed negotiations with South Korea. Moreover, EFTA is negotiating with Canada
and Thailand, and exploratory talks are underway with Japan – again countries that are
not yet EU partners.
The Swiss-US FTA would be exceptional as the first Swiss FTA separate from its EFTA
partners. In the past -- apart from its bilateral FTAs with the European Union and the
Faroe Islands – Switzerland has negotiated FTA pacts as part of the EFTA group.
C. Third Reaction: the EEA and Bilateral Accords
An important test of this reactive pattern came when the European Union decided to
radically deepen its goods and factor market integration with its Single European Act of
1986. To redress the impending discrimination, Switzerland joined the other EFTA
nations in negotiating the European Economic Area (EEA) agreement. This arrangement
had the effect of extending the Single Market to the EFTA nations; as usual, political
integration was minimized and agriculture was largely excluded.
The EEA negotiations were long and difficult, since the depth of the economic
integration was unprecedented in the world of commercial diplomacy. When the talks
were launched, tariffs and quota (apart from agriculture) had been gone for two decades.
The negotiations concerned the free movement of capital and labor as well as behind-the-

7
border trade measures – measures that were previously viewed as purely national
concerns. Moreover, given the defuse and ever-changing nature of behind-the-border
barriers, extending the Single Market to EFTA would require surveillance and
enforcement mechanisms akin to the European Commission and the EU Court of Justice.
The lessons from the EEA talks for the EFTA nations were crystal clear. Truly deep
economic integration was almost impossible without some form of political integration.
The real options facing the EFTA nations were either to accept hegemonic authority from
Brussels on Single Market matters (retaining the ultimate ability to say “no” on particular
issues but only at the cost of jeopardizing the whole relationship), or to join the European
Union.
This realization, in conjunction with the end of the Cold War in the early 1990s,
convinced the Swiss government that joining the EU was the best way to redress the
impending discrimination of the Single Market. Indeed, by the end of the EEA talks, all
the EFTA nations, except Iceland and Liechtenstein, came to the same conclusion.6
Despite the efforts of Swiss political leaders, Swiss voters rejected the EEA agreement in
a referendum held in December 1992. Brussels took this vote as a rejection of
6 Iceland’s dependence on fishing and Liechtenstein’s dependence on private banking both reduced the impact of being outside the EU circle and increased the cost of joining, given the EU’s questionable Common Fishery Policy and its negative attitude towards bank secrecy.

8
membership and Swiss accession talks never started. In essence, Swiss citizens did not
share their government’s conclusions that truly deep economic integration required
political integration, and that the best form of political integration was membership.
The adverse 1992 referendum has dominated Swiss-EU relations ever since. Bern has
struggled to redress the Single Market’s discriminatory effects by negotiating a string of
bilateral agreements with the European Union. As always, these have followed the
principles of minimizing political integration and including only limited concessions on
agriculture. The modest opening of Swiss-EU food trade was driven by the outcome of
the WTO’s Uruguay Round.
9.2 From Reactive to Proactive
The reactive stance of Switzerland is not unusual. Small nations around the world tend to
depend heavily on a single trade partner. Accordingly, the trade policies of small nations
are typically shaped by the trade policies of their dominant partner.
Historically, these political economy realities have led to hub-and-spoke bilateralism. In
North America and Europe, one sees many bilateral FTAs between economically small
nations and the dominant economy (the United States or the European Union). An Asian-
style hub and spoke system also seems to be emerging, but it appears to have two hubs,
China and Japan (Baldwin 2002, 2004).

9
In recent years, however, some of the “spokes” have shifted from reactive to proactive
trade policies. Mexico, which is even more dependent on the US market than Switzerland
is on the EU market, provides the classic example of this “anti-spoke” strategy (Baldwin
2004). Mexico has signed an impressive list of FTAs in recent years, two of which stand
out in sharp contrast to standard practice. By signing FTAs with the European Union and
Japan, Mexico broke free of the traditional hub-and-spoke pattern, whereby the
commercial policies of small spoke economy are narrowly focused on the dominant hub
economy.
Interestingly, Mexico’s FTAs with the world’s three giant economies (United States,
European Union and Japan), means that Mexico now probably has the best market access
in the world from the standpoint of tariff barriers confronting Mexican exports. Of course,
trade barriers are only one component of locational competitiveness, but Mexico has used
its trade policy to maximise this component. Singapore has followed a similar strategy.
The Swiss-US FTA is the most important, but not the only plank in the new pro-active
Swiss FTA strategy. Switzerland, through EFTA, has already concluded an FTA with
Singapore that is in force. Negotiations have recently been concluded with South Korea
and are also under way, at different stages, with Canada and Thailand. Finally,
exploratory talks are taking place with Japan.

10
When considering the EU reaction to a Swiss-US FTA, it is useful to examine the US
view of Mexico’s anti-spoke strategy. The United States has not reacted negatively to
Mexican initiatives. There are four main reasons for this. First, given that market access
is power in an FTA negotiation, the uneven market sizes meant that the United States
obtained almost everything it wanted in terms of direct market access via the NAFTA.
Second, Japan and the European Union are relatively minor players in the Mexican
market. Third, while the Mexican market is important, it is not a priority concern for most
US exporters. Fourth, since Mexican MFN tariffs are now modest, US preference
margins in the Mexican market were correspondingly limited in the post-NAFTA era.
What all these considerations meant was that the erosion of US preferences arising from
Mexico’s new FTAs caused little concern to US exporters.
9.3 Would the EU Object to a Swiss-US FTA?
The Swiss-US FTA can be viewed as part of a strategy akin to what Mexico has pursued.
A trade deal with the United States would reduce Swiss dependence on EU policy while
simultaneously improving Swiss market access to the world’s largest economy. There
are, however, two important factors that might make a Swiss anti-spoke strategy more of
a problem for the European Union than Mexican strategy is for the United States.
First, the EU is a customs union with a single external tariff, whereas NAFTA is a free
trade area in which each partner can set its own tariffs on third country imports. Hence if
Switzerland ever joined the European Union, it would have to withdraw from the Swiss-
11
US FTA (unless in the meantime a US-EU FTA was negotiated, which seems remote).
This could pose a problem for a future Swiss government and the European Union – after
all, the Swiss application to join the European Union is frozen but it has not been
withdrawn.
Second, a Swiss-US FTA would involve the creation of substantial preferences in
agricultural goods. Since Swiss MFN tariffs are already so low in manufacturing, the
Swiss-US FTA would imply very little preference erosion for EU industrial firms selling
into Switzerland. The story, however, is quite different in food trade. Swiss MFN barriers
on agriculture are some of the highest in the world. If the Swiss-US FTA lowered these
barriers substantially, US food exporters might take a sizeable share of the Swiss market,
at the expense of third-nation exporters, including EU exporters.
This development could prove to be a problem for the European Union; however, it is
unlikely to become a major issue. Unlike US agribusiness, the EU farm sector does not
have a tradition of aggressively pushing for better market access. To a large extent, this
commercial policy stance follows from the form of the Common Agricultural Policy
(CAP). The CAP entails domestic price floors for most major export commodities; in
turn, this means that improved foreign market access only indirectly benefits EU farmers.
Better export access mainly shows up in lower export subsidies and thus lower EU
budgetary costs. Given the indirect nature of this link, EU farm organisations have never
invested heavily in lobbying for improved foreign market access. Indeed, the European
12
Union has shown a willingness, even eagerness, for the exclusion of agriculture from the
dozens of FTAs that it has concluded with third countries.
These features, combined with the fact that the Swiss market is a minor outlet for EU
farm exporters, suggests that preferential access for US farmers would not elicit a major
reaction from Brussels. As in the case of US-Mexico relations, lopsided market size has
allowed the European Union to obtain almost all the market access in Switzerland that it
wanted. Swiss-EU agricultural trade barriers remain high to this day, but largely because
the European Union is content with that arrangement.
9.4 Indirect Effects on Political Forces
Swiss trade policy is driven mainly by the struggle between pro-trade and anti-trade
forces inside Switzerland. The size and political power of pro-trade and anti-trade groups
are, however, affected by Swiss trade policy. In light of the “juggernaut theory of trade
liberalization” (Baldwin 1994, Baldwin and Robert-Nicoud 2005), it is worth considering
the indirect impact of a Swiss-US FTA on the political forces that will guide future Swiss
liberalization with the European Union and more broadly.
Again, the Mexican example provides useful insight. Up until the late 1980s and early
1990s, Mexico followed a classic import-substitution policy: tariffs were extreme and not
until 1986 could President Miguel de la Madrid lead a reluctant Mexico into the GATT.

13
NAFTA, launched by President Carlos Salinas in 1992, changed all this.7 Once NAFTA
was implemented in 1994, Mexico had zero tariffs on three-quarters of its imports.
Moreover, because the United States and Canada have very low MFN tariffs, NAFTA
was not – from Mexico’s perspective – much different than unilateral free trade with the
world.
In textbook fashion, NAFTA’s liberalization caused massive restructuring in Mexico. By
the late 1990s, almost all Mexican firms that would be harmed by MFN free trade had
already been driven out by bilateral free trade. The US-Mexico bilateral arrangement –
the heart of NAFTA -- changed the array of pro-trade and anti-trade forces inside Mexico
in a way that substantially lowered the political cost to the Mexican government of
further liberalization. The Mexican government might have followed Adam Smith’s
counsel to pursue unilateral free trade, but Mexico devised what it considered to be a
superior strategy: it improved market access for its own firms by signing FTAs with
every important country. Simplifying to make the point, NAFTA started a juggernaut
rolling down the Mexican political scene, and this crushed most internal opposition to
further liberalization.
The Swiss-US FTA may have a similar effect in Switzerland. The main opposition to
further MFN liberalization is the Swiss farm sector. If a Swiss-US FTA brings about
substantial cuts in Swiss farm protection, the result will be a restructuring that ultimately
7 For a detailed account of NAFTA, see Hufbauer and Schott, 2005.

14
shifts the balance of power towards the pro-trade camp. This political economy shift is
likely to make the future liberalization of Swiss-EU farm trade much easier than
otherwise. Although this scenario involves a good deal of abstract reasoning, it does
provide an argument that a Swiss-US FTA will ultimately improve EU access to the
Swiss market.
1
THE SHAPE OF A FREE TRADE AGREEMENT BETWEEN SWITZERLAND AND THE UNITED STATES
Chapter 10
CONCLUSIONS
This report has identified both benefits and obstacles to a Swiss-US FTA. Our central
message is that an agreement can be highly worthwhile for both parties. But it requires a
strong commitment to surmount entrenched interests. The size of potential benefits is
directly related to the capacity of each government to open new frontiers of trade and
investment liberalization. To achieve a noteworthy outcome, policy officials not only
need to make path-breaking concessions at the negotiating table, they also need to build
persuasive coalitions for liberalization at home.1
US Trade Promotion Authority (TPA) expires in June 2007, and without that authority it
would be almost impossible for the United States to negotiate and ratify a free trade pact
with Switzerland. For the United States, as for Switzerland and most other countries, the
big trade event over the next 18 months is completion of the WTO Doha Development
Round. In practical terms, that means the Swiss-US FTA must be agreed by late 2006, so
that it can be brought to the Congress either shortly before, or as a companion to, the
Doha Round package. The contentious debate over ratification of the CAFTA-DR
agreement will not be repeated with Switzerland – none of the labor or environmental
1 We use the term “concession” in the time-honored sense of mercantilism. In this sense, nearly all trade and investment concessions benefit the country that makes them.
2
issues that featured so prominently will be present – but difficult commercial issues may
attract the opposition of some Congressmen and Senators.
On the Swiss side, two aspects will attract considerable political notice and very likely
spark a referendum. One of those is the liberalization of agriculture, even if phased in
over the working life of today’s farmers. The other is the precedent of a stand-alone
agreement with the United States, outside the EFTA framework, and as a counterpart to
Switzerland’s strong economic ties to the European Union. Swiss leaders will need to
persuade the population that the benefits of an FTA, especially the spur to investment and
growth, justify a departure from traditional ways of managing a prosperous but lethargic
economy.
A. Strong Links, Similar Values, Large Benefits
The United States is Switzerland’s most important economic partner after the European
Union. On a number of political economy criteria (summarized in Chapter 1)
Switzerland ranks near or at the top of partners under consideration by the United States
for new FTA pacts. To be sure, on national security grounds, Switzerland ranks low in
the US queue, like most non-Muslim countries. However, as the US-Chile, US-
Singapore, and CAFTA-DR agreements attest, national security is not the only
touchstone for launching or concluding US free trade agreements. Commercial relations
between Switzerland and the United States rest firmly on large investment holdings,
substantial two-way flows of business services, and significant bilateral merchandise
3
trade.2 As leading advocates of market capitalism, Switzerland and the United States are
well situated to conclude an FTA that breaks new ground in dismantling barriers.
Calculations based on gravity and computable general equilibrium (CGE) models,
reported in Chapter 8, suggest that a Swiss-US FTA could augment bilateral merchandise
trade flows by between 20 percent (CGE model) and 100 percent (gravity model). The
CGE model calculates a very modest increase in two-way services trade (about 12
percent), but this figure probably reflects limitations in modeling services trade and
estimating the height of barriers. Gravity models of foreign direct investment (FDI),
surveyed in Chapter 7, suggest that a free trade area might increase the stock of FDI in
Switzerland by some 40 percent, giving a strong push to Swiss technology, as well as
trade in services and manufactured goods.
The CGE framework reported in Chapter 8 calculates that the projected increase in two-
way trade would lead to negligible changes in US and Swiss GDP levels. We are
skeptical of this result for Switzerland, because the modeling framework does not reflect
several benefits: the adoption of improved technology in the wake of more intense
competition, the exit of less efficient firms, and greater scale and network economies.
Based on alternative methodologies, summarized in Chapter 8, the annual GDP gains to
each partner from expanded trade could be on the order of $1.1 billion. For Switzerland,
this amounts to a permanent gain of about 0.5 percent of GDP. An expansion of the
inward FDI stock, perhaps by 40 percent, would add significantly to this figure.
2 Two-way FDI and portfolio investment levels, as well as two-way merchandise trade flows, are well above the norm predicted by gravity models of trade and investment.

4
Other benefits, hard to model but no less important, could flow from a forward-looking
Swiss-US FTA. The pact might push the agricultural reform agenda, both in the
European Union and the United States. And it might influence, in a positive way, the
multilateral agenda for liberalizing trade in services, government procurement, and other
topics.
B. Answering the Skeptics
The FTA undertaking, if launched, will require reasoned responses to skeptical questions.
In Chapters 1 and 9, we addressed three systemic concerns that might be raised. The first
concern is that a bilateral FTA might impede progress on the WTO Doha Round. In our
view, this argument invokes a false dichotomy. Swiss-US FTA negotiations should not
drain the resources of the US Trade Representative’s office. A Swiss-US FTA should
fully comply with the requirement of GATT Article 24 that barriers be eliminated on
“substantially all the [merchandise] trade [between the partners]”. To be sure, we have
recommended 20-year phase-outs for barriers on sensitive agricultural products, twice as
long as the norm agreed in the WTO’s 1994 Understanding on the Interpretation of
Article 24. In light of the practice already established in multiple FTAs, we believe a fair
review would conclude the standards of Article 24 are met, if these long phase-outs are
accompanied by our WTO-plus recommendations in other areas.
Nonetheless, we recommend that Switzerland and the United States should invite the
Director General of the WTO to appoint an independent group of experts to critique the

5
agreement for its consistency with the text and spirit of Article 24. This independent
review would be additional to the customary Article 24 reviews by government
representatives, which in virtually all cases – including past FTAs entered into by the
United States and EFTA -- have led to inconclusive findings.3 The independent review
should not only critique the new FTA, but also suggest appropriate remedies, or even
compensation to other WTO members, to the extent the agreement falls short.
In some areas, the Swiss-US FTA could set a benchmark for WTO agreements in the
Doha Round and subsequent multilateral agreements, and go beyond the minimal
requirements of Article 24. Topics for path-breaking provisions include elimination of
barriers to services trade (including movement of skilled personnel), new rules on
geographic indications and government procurement, very liberal rules of origin.
A second systemic concern is that a Swiss-FTA would simply add to the “spaghetti bowl”
of preferential trade agreements – numbering some 300 concluded and proposed4 -- that
critics claim are eroding the multilateral trading system. If equivalent liberalization could
have been achieved by the GATT/WTO system as has been achieved by the “strong”
bilateral and regional agreements, the FTA process would be rightly deplored. But the
post-war history of trade negotiations does not suggest that equivalent liberalization was
remotely possible. A worthwhile Swiss-US FTA will go far beyond the achievements of
the Doha Round, and could in fact set a model for diminishing the “spaghetti bowl”
3 See the Sutherland Report (2004) for an acid critique of the banal nature of past Article 24 reviews. 4 This figure is cited in the Sutherland Report (2004).

6
problem through liberal rules of origin. Moreover, most of the trade diversion resulting
from a Swiss-US FTA can in fact be categorized as “preference dilution”, since the new
agreement would create a more nearly level playing field between existing partners
(notably the EU and NAFTA members) and the new partner (the United States or
Switzerland).5
A third systemic concern – one which seems to be fading from the public debate – goes
to the formation of “hub-and-spoke” systems and super-regional trading blocs with
political as well as economic dimensions. Obviously a Swiss-US FTA would do nothing
to consolidate super-regional blocs in Europe or the Western Hemisphere. Quite the
opposite. By the same token, as spelled out in Chapter 9, a Swiss-US FTA has the
character of a “reverse-hub-and-spoke” agreement that would alleviate the commercial
disadvantages that confront a small “spoke” country (in this case Switzerland).
C. Managing Agriculture
Agriculture is by far the toughest area, both from the standpoint of negotiations and
adjustment. Chapters 2 and 3 showed that difficult issues spring not only from the
extremely high tariffs and strict tariff-rate quotas, but also from certain sanitary and
phyto-sanitary measures and different ideas about the protection of geographical
5 A more general observation can be made: since many FTAs are already in existence, each new FTA that has a major country as one partner is likely to level the playing field in a way that adds to global economic efficiency. As a major country’s network of FTAs expands, the list of “outsiders” grows shorter and shorter, and so does the prospect of harmful trade diversion when an additional country is added to the FTA roster.

7
indications. The combined result of various barriers is that agricultural trade between the
United States and Switzerland remains well below potential.
The gravity and computable general equilibrium models reported in Chapter 8 suggest
that the complete elimination of agricultural barriers would more than double two-way
trade, increasing each partner’s exports by more than a billion dollars annually. In
previous negotiations, through EFTA or on its own, Switzerland has liberalized
agricultural trade to a very limited extent, using a “positive list” approach. This would
not be an acceptable modus operandi for a Swiss-US FTA. However, as Chapter 2
pointed out, prior US free trade agreements have always allowed for long phase-out
periods, a very limited number of exceptions through the use of TRQs and special
safeguards on the path to eventual elimination of agricultural barriers. For instance, in
the FTA with Morocco, for at least 4 product categories there are (small) TRQs and no
phase-out periods. The same is true for the CAFTA-DR pact with respect to sugar
imports by the United States.
Sanitary and phyto-sanitary (SPS) standards are closely related to agricultural trade.
While ostensibly designed to ensure animal and human health, at times SPS measures can
amount to non-tariff barriers. Some issues are best left to the WTO, but others can be
addressed in the Swiss-US FTA. Chapter 3 recommended that the United States and
Switzerland incorporate the best elements of their respective SPS agreements with
Australia and the European Union in the Swiss-US FTA. Importantly, Switzerland and

8
the United States should create a standing group of senior government officials to
promote the convergence of SPS standards and, where possible, to resolve current and
future disagreements.
Chapter 3 also examined the protection given by the United States and Switzerland to
“branding” through geographic indications (GIs). Like the United States, Switzerland
applies a strong regime of intellectual property protection, but Swiss authorities believe
that the current US system does not adequately protect holders of GI rights. A forward-
looking agreement should endorse “state of the art protection” -- to borrow Ambassador
Zoellick’s expression -- for all forms of intellectual property, including GIs The United
States should certify appropriate Swiss agricultural goods as “distinctive products”, and
should support Switzerland’s position in WTO talks.
Finally, and critically important to enlist domestic support, the Swiss-US FTA should
contain special safeguard provisions for agriculture, and be accompanied by meaningful
adjustment programs for adversely affected workers, firms and communities. Robust
assistance will be necessary to manage the transition from extreme protection to freer
trade, especially in beef, pork, dairy products, cereals, oilseeds and sugar.
D. Expanding Trade in Manufactures
More than 95 percent of merchandise trade between the United States and Switzerland
involves manufactured products. While the vast majority of manufactures trade enters
free or pays only nuisance tariffs, the remaining high tariffs catalogued in Chapter 4 still
9
restrict trade in a number of products. Moreover, the elimination of even nuisance tariffs
can spark commerce: industrial firms can then rationalize production and invest in new
facilities with no fear of trade barriers.
The gravity model reported in Chapter 8 suggests that a Swiss-US FTA could more than
double two-way manufactures trade; the CGE model suggests an expansion of about 20
percent. Market access negotiations for manufactured products should be smooth, and
most tariffs should be eliminated immediately. For the most sensitive products, longer
phase-outs will be necessary. The Swiss-US FTA could further contribute to seamless
global production by adopting liberal rules of origin (especially with respect to
cumulation and certification), by giving greater scope for mutual recognition of
standards, and by permitting more self-assessment.
E. Services: The Future of International Trade
Both the United States and Switzerland recognize the crucial role of services as a source
of sustained competitiveness and export expansion. Barriers remain, but both countries
have affirmed their intention to further liberalize their service sectors. Chapter 5
documents the barriers that affect financial services, network industries, the audiovisual
sector, and professional personnel. In its FTAs with Singapore and Australia, the United
States negotiated “WTO plus” provisions that could be readily adopted in the Swiss-US
FTA. But the Swiss agreement should go further and set a higher standard. For
example, it should extend unconditional MFN rights with respect to services, advance the
10
process of mutual recognition of educational and professional credentials, and extend
national treatment to responsible insurance firms based in each country.
F. Government Procurement
Opening government procurement in Switzerland and the United States would improve
the efficiency of public spending and set a useful precedent for WTO negotiations. The
WTO Government Procurement Agreement (GPA), signed by both countries, does not
cover all federal procurement in either nation. Moreover, Switzerland reserved its
application of the GPA to US firms in important sectors, arguing that the United States
had not given equivalent access to Swiss firms. The Swiss-US FTA provides a new
opportunity for reciprocal extension of GPA benefits to firms in both countries. In
addition, both countries should extend their federal procurement coverage to offer the
best terms negotiated in prior FTAs, and to provide enhanced access for research and
development, and transportation and utility services.
Further, the FTA should include initiatives to open more US states to procurement from
Swiss firms (to the same extent Swiss cantons are already open to US firms, as explained
in Chapter 6). Thus, the United States should seek to cover two or three “holdout” states
(in addition to states that have previously agreed to GPA or FTA procurement
provisions).6
6 As an aside, the CGE model reported in Chapter 8 does not attempt to reflect barriers on government procurement. Meaningful liberalization of these highly protected purchases could make a significant addition to the calculated trade and welfare gains.

11
G. Investment
Investment provides the bedrock for Swiss-US commercial relations. Moreover, the
synergy between direct investment and trade is now widely recognized Most of the
literature endorses the idea the addressing the remaining frictions in the investment
relation could foster Swiss-US two-way trade.
On every investment question of global importance, Swiss and US policies are closely
aligned. Still, a Swiss-US FTA would improve the investment environment. Both
governments need to further liberalize sectors dominated by public monopolies, relax
impediments to foreign ownership in selected sectors, allow easier access to temporary
employees, and review conditions for licensing professional personnel. The FTA should
proclaim the rights of private investors with respect to national treatment, and should
ensure appropriate compensation in the event of public taking of private property.
Finally, the FTA should establish arbitration procedures for resolving disputes between
private investors and host states, including an appellate body to ensure the consistent
application of legal principles.
H. Swiss-EU Relations
Our penultimate chapter explored the implications of a Swiss-US FTA on Swiss-EU
economic relations. Brussels will surely take notice of a US agreement with Switzerland
– the first US FTA with a European country – but there are reasons to believe that the
pact would not damage relations between Bern and Brussels. From a purely commercial
point of view, EU producers have already obtained almost unfettered access to the Swiss

12
market – apart from agriculture. Brussels has historically respected the Swiss tradition of
operating on a different and somewhat independent commercial track. Very likely, as
Chapter 9 suggests, the European Union will come to view the Swiss-US FTA in the
same benign light that the United States views the EU-Mexico FTA.
I. Wrapping Up
Our bottom line is that a Swiss-US FTA makes very good sense, if negotiated as an
agreement that pushes the frontier of liberalization. The agreement can serve as a wedge
to point both America and Europe in a different, and less distortive, direction for
agriculture – preserving the scenic and cultural values of rural life without burdening
consumers with high prices and world markets with subsidized output. The agreement
can quickly reach the goal of tariff-free trade in manufactured goods, coupled with liberal
rules of origin and significant progress on aligning technical standards and conformity
assessment systems. The WTO GATS agreement is practically an empty vessel: while
the principles and strong and solid, they apply to very little trade. By contrast the Swiss-
US FTA can extend the principles quite widely, going so far as strict national treatment
for foreign investors, and mutual recognition of professional degrees and certificates.
The economic payoff from these and other terms will be significant: a sharp expansion of
bilateral trade, more choice and lower prices for household consumers and industrial
users, and an influx of direct investment, especially in Switzerland. The political
economy payoff will be even larger, if the Swiss-US FTA becomes a touchstone for
future trade and investment agreements.

THE SHAPE OF A FREE TRADE AGREEMENT BETWEEN SWITZERLAND AND THE UNITED STATES
Appendix A
Phase-outs Schedules for Agricultural Barriers in US FTAs
This appendix describes phase-outs for 15 selected agricultural product-categories and
includes a summary table of concessions on selected products across the different FTAs
(see Table A.1). The products considered are: beef; corn and corn products; cotton; dairy
products; distilled spirits; fruits, vegetables, and nuts; certain grains; processed foods;
peanuts; poultry; soybeans; sugar; tobacco; wheat; wine. The information on this
Appendix has been entirely obtained from official sources of the US Government that
actively participate in bilateral negotiations on agriculture, mainly the USDA Foreign
Agricultural Service and the USTR. We also relied on documents published by official
agencies of partner countries and also the actual texts of the agreements. All sources are
listed at the bottom of this Appendix.1
Beef
NAFTA, US-Mexico. The United States and Mexico immediately eliminated tariffs on
1 The information in this appendix is designed to provide readers with a better sense of the distance between the actual achievements of US trade negotiations and the pure free trade ideal. Care was taken to present highlight the products which tend to fall short of the ideal on both sides. The appendix however does not present a full and systematic discussion of US phase-out schedules. Readers interested in the details should consult the text of the respective FTA agreements.

beef cattle; fresh, chilled and frozen beef; and veal. The only exception is Mexico's
import tariff on beef edible offal that was phased-out over a 10-year period. 2
NAFTA, US-Canada. Canadian beef became exempt from quantity restrictions under the
US Meat Import Act. US beef was exempted from Canada's quantitative import
restrictions. 3
US-Australia. All Australian tariffs on beef imported from the United States will be
immediately eliminated under the FTA. The United States will establish preferential
TRQs for Australian beef. Out-of-quota tariffs will be phased-out over 18 years. Beef
imported within the TRQ will enter the United States duty-free. A volume-based
safeguard will be applied during the transition period; this will be converted to a price-
based safeguard after the transition period. 4
US-Chile. Chile established TRQs on US fresh and frozen beef and other meat products,
which are eliminated in the fourth year of the agreement. The United States granted
reciprocal treatment to Chilean beef products. Both governments agreed to immediately
recognize each others’ grading systems. Chilean beef is prohibited from accessing the
2 For more information, see Foreign Agricultural Service publication “NAFTA Agricultural Fact Sheets: Cattle.” 3 For more information, see Foreign Agricultural Service publication “NAFTA Agricultural Fact Sheets: Cattle.” 4 For more information, see Foreign Agricultural Service publication “US-Australia Free Trade Agreement: Commodity Fact Sheets – Beef ”.
2

U.S. beef market because USDA has not recognized Chile’s meat inspection system. A
technical group has been formed to eliminate barriers related to inspection procedures. 5
US-Morocco. Morocco will establish two preferential TRQs for US beef. For High
Quality Beef (prime or choice) the in-quota tariff will be eliminated over 5 years, while
the over-quota tariff in 18 years. For Standard Quality Beef the in-quota tariff will be
eliminated over 5 years, while the over-quota tariffs will remain unless Morocco
negotiates reductions with other partners. The United States will establish zero duty
preferential TRQ for beef imports from Morocco. The over-quota tariff will be phased-
out over 15 years.
Beef and beef product and poultry and poultry product imports must be accompanied by
an export certificate to be allowed entry into Morocco. Morocco’s veterinary services, in
cooperation with the United States Department of Agriculture’s Food Safety and
Inspection Service, will work together in good faith to define the content of the
certificates that will accompany US beef and poultry imports. 6
CAFTA-DR. Tariffs applied by CAFTA-DR countries on US Prime and Choice cuts of
beef are immediately eliminated, except by the Dominican Republic, which establishes a
15-year TRQ. For all other beef products most CAFTA-DR partners will phase-out
tariffs within 15 years. El Salvador and Guatemala and the Dominican Republic will
5 For more information, see Foreign Agricultural Service publication “US-Chile Free Trade Agreement: Commodity Fact Sheets – Beef ”. 6 For more information, see USTR publication “US-Morocco Free Trade Agreement Agriculture Provisions”.
3

establish 15-year TRQs for other US beef cuts. The United States establishes preferential
TRQs for beef products originating in CAFTA-DR countries. Over-quota tariffs will be
eliminated in 15 years. These preferential TRQs, however, will only kick in after the
existing US Section 22 TRQs provided for these countries are filled. CAFTA-DR
partners are working toward the recognition of the US meat inspection and certification
systems.7
Corn and Corn Products
NAFTA, US-Mexico. The United States immediately eliminated its tariff on corn imports
from Mexico. Mexico established a preferential TRQ for corn imports from the United
States. The TRQ will be in effect for 15 years and tariff cuts will be back-loaded. Under
the agreement, however, to bolster its livestock industry, Mexico liberalized corn imports
much faster than required under NAFTA. 8
US-Australia. Australia does not have tariffs on imported corn, and the United States
will immediately eliminate its duties on Australian corn.9
7 For more information, see Foreign Agricultural Service publication “US-Central America-Dominican Republic Free Trade Agreement: Overall Agriculture Fact Sheet”. 8 For more information, see Foreign Agricultural Service publication “NAFTA Agricultural Fact Sheets: Corn.” 9 Australia agreed to work with the United States in the WTO agriculture negotiations to develop disciplines that eliminate restrictions on the right to export. Australia has state trading organizations (STOs) with sole authority to export grains, and these STOs are the object of US negotiating efforts. For more information, see Foreign Agricultural Service publication “US-Australia Free Trade Agreement: Commodity Fact Sheets – Grains ”.
4
US-Chile. Tariffs, when different from zero, are immediately eliminated by both
countries.10
US-Morocco. Upon the agreement’s entry into force, Morocco will reduce its tariffs on
US corn and corn products by 50 percent. Morocco will eliminate the remaining tariffs on
these products over 5 years. The United States will eliminate its tariffs on corn and corn
products immediately. 11
CAFTA-DR. Under CBI, US imports of grains from CAFTA-DR countries enjoyed
duty-free access already. El Salvador, Honduras and Nicaragua establish preferential
TRQs on yellow corn12, which over-quota tariffs are phased-out over 15 years (10-years
phase-out in Guatemala). Costa Rica and the Dominican Republic immediately
eliminated tariffs.
El Salvador, Guatemala, Honduras and Nicaragua will not reduce their out-of-quota
tariffs for white corn. Some liberalization will occur through duty-free in-quota TRQs,
which grow 2 percent per annum in perpetuity. In Costa Rica, white corn tariffs will be
10 For more information, see Foreign Agricultural Service publication “US-Chile Free Trade Agreement: Commodity Fact Sheets – Grains ”. 11 For more information, see USTR publication “US-Morocco Free Trade Agreement Agriculture Provisions”. 12 In the United States, white corn is considered a food grade corn, while yellow corn is primarily used for animal feed. The distinction is rather arbitrary, and price differentials play a role in explaining the different usages of corn varieties.
5

gradually eliminated over 15 years.13 The Dominican Republic will immediately
eliminate its tariffs on US white corn.14
Raw Cotton
NAFTA: US-Mexico. Mexico’s tariffs on cotton were phased-out over either 5 or 10
years. Existing US quotas on Mexican cotton were replaced by NAFTA TRQs, which are
phased-out over a 10-year transition period. Cotton products are subject to NAFTA rules
of origin.15
US-Australia. Australia continues its duty-free tariff treatment for cotton. The United
States will establish a preferential TRQ for Australian cotton, which is phased-out in
equal annual steps over 18 years.16
US-Chile. US import tariffs on Chilean cotton are phased-out over 12 years, while
Chile’s import tariff is immediately eliminated. Chile does not produce or export cotton.17
13 Nearly 0.9 million acres of white food-grade corn were grown in the United States in 2002, while yellow corn acreage ranged between 1.2 and 1.5 million acres. White corn producers have benefited in the past from preferential access under bilateral FTAs. For example, in recent years, the demand for white corn has increased in Mexico. 14 For more information, see Foreign Agricultural Service publication “US-Central America-Dominican Republic Free Trade Agreement: Overall Agriculture Fact Sheet”. 15 For more information, see Foreign Agricultural Service publication “NAFTA Agricultural Fact Sheets: Cotton.” 16 For more information, see Foreign Agricultural Service publication “US-Chile Free Trade Agreement: Commodity Fact Sheets – Cotton ”. 17 For more information, see Foreign Agricultural Service publication “US-Chile Free Trade Agreement: Commodity Fact Sheets – Cotton ”.
6
US-Morocco. Morocco will immediately eliminate its tariffs on US cotton. The United
States will establish a preferential TRQ for Moroccan cotton. The over-quota tariff will
be phased-out over 15 years. 18
CAFTA-DR. CAFTA partners will eliminate all duties on US raw cotton immediately.
The US import duty on raw cotton from all six countries will be phased-out over 15 years.
The agreement establishes rules of origin that strongly favor US cotton and synthetic
fabrics.19
Dairy
NAFTA: US-Mexico. The United States established a NAFTA TRQ on imports of milk
powder from Mexico. The over-quota tariff was phased-out over 10 years. The US
NAFTA TRQ on cheese, also phased-out over 10 years, covered all cheese items
previously subject to US Section 22 quotas.
Mexico applied a NAFTA TRQ on milk powder and cheese. The over-quota tariffs were
phased-out over 10 years. Tariffs on US exports of fresh cheese and other cheeses to
Mexico will be eliminated over a 10-year transition period.20
18 For more information, see USTR publication “US-Morocco Free Trade Agreement Agriculture Provisions”. 19 Limited amounts of apparel and textiles that are in short supply in the US market may contain third-country fabrics, whether they are made from cotton, synthetic, or natural fibers. For more information, see Foreign Agricultural Service publication “US-Central America-Dominican Republic Free Trade Agreement: Overall Agriculture Fact Sheet”. 20 For more information, see Foreign Agricultural Service publications “NAFTA Agricultural Fact Sheets: Cheese” and “NAFTA Agricultural Fact Sheets: Milk Powder.”
7

US-Australia. Australia locks in its previous duty-free tariff treatment for all US dairy
products. The United States will provide Australia with two types TRQ access for dairy
items. First, the Australian country-specific dairy TRQs agreed by the United States in
the Uruguay Round will immediately receive duty-free treatment for in-quota shipments
to the US market. Second, Australia will have additional access through the creation of
preferential TRQs. Preferential in-quota volumes will be duty-free and will grow at an
average of 5 per cent per annum in perpetuity. For many dairy products, out-of-quota
tariffs will remain at base year rates. Tariffs on dairy items not included in TRQs will be
phased-out over 18 years in most cases. The TRQ system will apply to the following
products: American cheese; Cheddar; European-type cheese; Goya cheese; Swiss cheese;
cheese, other (NSPF); nonfat dry milk; other milk powders; condensed/evaporated milk;
butter/butterfat; creams/ice cream; other dairy products.21
US-Chile. Chile will phase-out its tariffs on cheeses, butter and butterfat, whey products,
and yogurts over 4 years, while tariffs on liquid, condensed and evaporated milk and
cream will be eliminated over 8 years. The United States created preferential TRQs for
Chilean dairy products, which are eliminated after 12 years. Products covered by the
TRQ system include cheeses; butter and butterfat; milk powders; condensed and
21 For more information, see Foreign Agricultural Service publication “US-Australia Free Trade Agreement: Commodity Fact Sheets – Dairy ”.
8

evaporated milk; and other dairy products including some chocolates and food
preparations.22
US-Morocco. Morocco will immediately eliminate its tariffs on US pizza cheese and
whey products. Tariffs on other US cheeses will be eliminated in 5 or 10 years depending
on the product; tariffs on US butter will be eliminated in eight years; and tariffs on US
milk powders will be eliminated in 12 or 15 years. The United States will create
preferential TRQs for: creams and ice-cream; cheese; milk powders; butter; and other
dairy products. Over-quota tariffs will be phased-out over 15 years. 23
CAFTA-DR. The FTA commits all parties to duty-free access for dairy products after 20
years. The FTA establishes reciprocal duty-free TRQs. Most tariffs on over-quota dairy
imports are phased-out over a 20-year transition period (for a few products the time
period is 10 to 15 years). The United States will apply TRQs to all partner countries on
cheese, ice-cream, fluid fresh milk and cream, sour cream, and other dairy products. The
US TRQ on butter will affect Costa Rica, El Salvador and Honduras, while the US TRQ
on milk powder targets only Costa Rica. CAFTA countries will establish preferential
TRQs on US milk, milk powder, butter, cream, cheese, ice-cream, and other dairy.
22 The Food and Drug Administration (FDA) will continue to test and approve imports from Chile. Chile also recognizes the authority of the FDA to approve US food processing plants that are eligible to export to Chile. For more information, see Foreign Agricultural Service publication “US-Chile Free Trade Agreement: Commodity Fact Sheets – Dairy Products”. 23 For more information, see USTR publication “US-Morocco Free Trade Agreement Agriculture Provisions”.
9
Safeguard duties will also be phased-out within 20 years. All parties may apply quantity-
based agricultural safeguards during the transition period. 24
Distilled Spirits
NAFTA: US-Mexico. Most US tariffs on Mexican distilled spirits that were not already
duty-free were eliminated immediately (e.g. brandy). The major exception was the tariff
on rum, which was phased-out over 10 years. US tariffs on beer were phased-out over 8
years. Mexico immediately eliminated the tariff on US Bourbon whiskey, while its tariff
on US rum was eliminated 4 years later. Mexican tariffs on beer were phased-out over 8
years. 25
US-Australia. Australia will immediately eliminate tariffs on distilled spirits. Duty-free
entry is locked in for distilled spirits that already enter duty-free. With the exception of
rum, all distilled spirits already enjoyed duty-free access into the United States. US tariffs
on two rum tariff lines (2208.4020 and 4060) will be removed in 18 years.26
US-Chile. Chile will fully eliminate tariffs on most distilled spirits in 2 years. With the
exception of rum, all distilled spirits already enjoyed duty-free access into the United
States. US tariffs on two rum tariff lines (2208.4020 and 4060) will be removed in 12
years. In addition, both countries agree to recognize Bourbon Whiskey, Tennessee
24 For more information, see Foreign Agricultural Service publication “US-Central America-Dominican Republic Free Trade Agreement: Overall Agriculture Fact Sheet”. 25 For more information, see Foreign Agricultural Service publication “NAFTA Agricultural Fact Sheets: Alcoholic Beverages.” 26 For more information, see Foreign Agricultural Service publication “US-Australia Free Trade Agreement: Commodity Fact Sheets – Processed Foods and Beverages ”.
10

Whisky, Pisco Chileno, Pajarete and Vino Asoleado as distinctive products that can only
be produced in State of Tennessee or Chile respectively.27
US-Morocco. Morocco will immediately eliminate its tariffs on all distilled spirits. With
the exception of rum, all distilled spirits already enjoyed duty-free access into the United
States. US tariffs on two rum tariff lines (2208.4020 and 4060) will be removed in 15
years. 28
CAFTA-DR. All distilled spirits, with no exceptions, will receive duty-free access into
the United States. CBI access condition into the US market will not change for some
ethyl alcohol products, for example HTS 2207.1060; Central American countries will
face TRQs on these products (essentially ethanol). Costa Rica and El Salvador obtained
larger TRQs, however, only the US TRQ for El Salvador will expand after year 15.
CAFTA countries will immediately eliminate tariffs on gin and whisky.29 Tariffs on
certain US liquors (tariff lines 2208.70) will be phased-out over 10 years in the
Dominican Republic and over 5 years in El Salvador, Guatemala, and Nicaragua. Costa
Rica and Honduras granted immediate duty free access for imports those products. All
27 For more information, see Foreign Agricultural Service publication “US-Chile Free Trade Agreement: Commodity Fact Sheets – Wine ”. 28 For more information, see USTR publication “US-Morocco Free Trade Agreement Agriculture Provisions”. 29 The Dominican Republic will phase-out its tariffs on gin over 10 years and Costa Rica will phase-out tariffs on whisky over 5 years.
11
CAFTA-DR countries will phase-out tariffs on US rum over 12 to 15 years30, with the
exception of El Salvador that will phase-out tariffs over 10 years. 31
Fruits, Vegetables, and Nuts
NAFTA: US-Mexico. Mexico phased-out tariffs on most US fruit products over 4 years,
but it applied a 10-year NAFTA TRQ on apples.32 Mexico also had a 10-year phase-out
for peaches, nectarines and grapes. The United States eliminated tariffs on fruits
immediately with the exception of citrus products and melons that were subject to a 10
year NAFTA TRQ.
Under NAFTA, the United States established 10 year TRQs on many vegetable products
(15 years for asparagus and broccoli) and reserved the right to apply special agricultural
safeguards on imports of certain horticultural products. Mexico matched the US tariff line
changes and phase-out periods for imports of vegetable products from the United States,
and consequently Mexico eliminated tariffs on most vegetables over 10 years. On
potatoes, however, Mexican treatment of US imports differs from this rule as Mexico
applied a 10-year NAFTA TRQ.
Both countries immediately eliminated their import tariffs on raisins, prunes, and
fresh/dried nuts. The United States may apply agricultural safeguards on imports of
30 The transition period will last 12 years for Costa Rica and Guatemala, and 15 years for the Dominican Republic, Honduras and Nicaragua. 31 For more information, see Foreign Agricultural Service publication “US-Central America-Dominican Republic Free Trade Agreement: Overall Agriculture Fact Sheet”. 32 Mexico may apply special agricultural safeguards on imports of US apples.
12
onions, tomatoes, eggplants, chili peppers, squash, and watermelons. Mexico, in turn,
applies this special safeguard on apples and potato products. 33
US-Australia. Australia locked in already existing duty-free tariff treatment for all US
exports of fruits, vegetables and nuts. The United States will eliminate its tariffs for
Australian fruits over 4 years. US tariffs on watermelons, cantaloupes, boysenberries,
papayas, mangoes, cherries, prunes, other figs will be eliminated in 10 years. Tariffs on
Australian canned dates, canned watermelon, canned pears, canned apricots, canned
peaches and nectarines, and grapefruit, will be phased-out over 18 years.
US tariffs on most Australian vegetables are eliminated over 4 years. US tariffs on
Australian leeks, cauliflower, Brussels sprouts, globe artichokes, celery, spinach,
pumpins, okra, and potatoes will be eliminated over 10 years. US tariffs on aparagus,
preserved tomatoes, packed artichokes, Agaricus mushrooms, dried onions, garlic, and
certain sweet corn products will be phased-out in 18 years.
The United States immediately eliminates tariffs on nuts and has also established an 18-
year preferential TRQ for avocados. The United States maintains phyto-sanitary
restrictions on imports of many Australian fruits, such as avocados and tropical fruit. The
33 For more information, see Foreign Agricultural Service publication “NAFTA Agricultural Fact Sheets: Commodities and other Topics”.
13

United States may impose special agricultural safeguard measures on certain fruits and
horticultural products, such as onions, garlic, canned fruits, and tomato products.34
US-Chile. Chile immediately eliminated tariffs on all products contained in chapter 8
(fruits and nuts). Many US fruit tariffs are phased-out according to schedules ranging
from immediate elimination to 12 years. Tariffs on limes, grapes, pears, kiwis, plums,
and raspberries are immediately dropped; tariffs on oranges and mandarins will be phased
out over 4 years; and tariffs on lemons, grapefruit, and frozen berries are reduced and
then eliminated over 8 years. The tariff phase-out will be completed in 12 years for
canned pears, canned apricots, canned nectarines, and canned fruit mixtures. The United
States may apply special agricultural safeguards on frozen cherry products, canned pears,
canned apricots, canned nectarines, and canned fruit mixtures.
The phase-out period for most tariffs on fresh and processed vegetables in both countries
varies by product from immediate elimination to elimination after 8 years. Exceptions on
the US side are dried tomatoes, garlic, and onions, mushrooms, sweet corn, Brussels
sprouts, leeks, broccoli, carrots, artichokes, spinach, and fresh tomatoes. Chile will
eliminate most tariffs on vegetables immediately, except that tariffs on spinach, sweet
corn, certain leguminous vegetables and peas will be eliminated over 8 years. The United
States may apply special agricultural safeguards on avocados, asparagus, tomato products,
garlic, spinach, and broccoli. US tariffs on nuts will be phased-out either immediately or
in 4 years for almonds and hazelnuts. Chile will eliminate its tariff on US nuts
34 For more information, see Foreign Agricultural Service publication “US-Australia Free Trade Agreement: Commodity Fact Sheets ”.
14
immediately. Technical discussions regarding Chile’s phyto-sanitary standards that limit
trade are on-going. 35
US-Morocco. Morocco will eliminate most tariffs on US fruits within 5 years. Moroccan
tariffs on US raisins will be phased-out over 8 years. Additionally, Morocco will phase-
out tariffs on US dates, avocados, dried apricots, dried prunes and plums, dried cherries
and peaches over 10 years. Morocco will create a 10-year preferential TRQ for US apples.
US tariffs on most Moroccan fruit products will be phased-out within 5 years. US tariffs
on Moroccan avocados, boysenberries, papayas, cherries, dried prunes and plums will be
phased-out over 10 years. Seasonal tariffs on grapefruits will be phased-out over 15 years.
The United States will eliminate tariffs on canned pears, canned apricots, canned peaches
and nectarines in 18 years.
Morocco will eliminate tariffs on most US vegetables immediately. Moroccan tariffs on
US certain onions, some peas, sweet corn, sliced potatoes, will be phased out over 5 years.
Tariffs on US potatoes, seeds of certain peas, dried and broad beans, and lentils will be
phased-out over 10 years. Most US tariffs on Moroccan vegetables will be phased-out
within 5 years. Tariffs on fresh asparagus will be eliminated over 8 years. The United
States will apply 10-year phase-outs for its tariffs on Moroccan leeks, broccoli, celery,
spinach, Brussels sprouts, Agaricus mushrooms, preserved olives, preserved oranges,
Jerusalem artichokes and Chinese water chestnuts. The US will create 15-year
preferential TRQs for Moroccan dried onions, dried garlic, tomato sauces, and other
35 For more information, see Foreign Agricultural Service publication “US-Chile Free Trade Agreement: Commodity Fact Sheets ”.
15
processed tomato products. Quotas will be lifted at the end of the 15-year period. The US
will eliminate tariffs on canned asparagus over 18 years.
US tariffs on walnuts and certain mixes of nuts and dried fruits will be phased out in 5
and 10 years respectively. All other Moroccan nut products will receive duty-free
treatment. Morocco will eliminate tariffs on most US nuts over 5 years, and will create a
15 year preferential TRQ for US almonds. Tariffs on US almonds not subject to TRQs
will be phased out in 15 years. 36
The United States has recourse to special agricultural safeguards on imports of certain
canned fruits, vegetables such as dried onions and garlic, preserved tomatoes, canned
asparagus, canned pears, canned apricots, and other products. Morocco may apply
agricultural safeguards on chick peas and lentils, prunes, and almonds. A side letter to the
agreement excludes non-bitter almonds, designated by Moroccan HS subheadings
0802.11.0091, 0802.11.0099, 0802.12.0091, and 0802.12.0099, from the list of products
subject to special safeguards.
CAFTA-DR. Prior to the agreement, imports of all fruits, vegetables and nuts from
CAFTA-DR countries enjoyed duty-free access under the CBI.37 Over 70 percent of US
fruit and nut products will be eligible for immediate duty-free access in the CAFTA-DR
36 For more information, see USTR publication “US-Morocco Free Trade Agreement Agriculture Provisions”. 37 Certain US SPS measures, however, prevented Central American countries from fully benefiting from these preferences.
16

market. Tariffs will be phased out over the next 5 to 10 years for another 26 percent of all
fruit and nut products. Under this plan, US exporters will gain immediate duty-free
access for apples, peaches, pears, grapes, cherries, almonds, walnuts, pistachios, raisins,
canned peaches, and canned pears. CAFTA tariffs on US oranges, will be phased-out
within 5 to 15 years. Costa Rica will eliminate it tariffs on kiwis over 5 years.
Most Central American and Dominican tariffs on mushrooms and sweet corn were
immediately eliminated. Tariffs on US fresh and canned tomatoes, and tomato pastes,
frozen vegetables, lettuce, cauliflower and broccoli, and canned asparagus will be
eliminated over periods up to 15 years by all CAFTA-DR countries. 38
Other Grains
NAFTA: US-Mexico. Both countries immediately eliminated tariffs on grain sorghum.
The United States also eliminated immediately its tariffs on barley and malt, but Mexico
imposed a NAFTA TRQ with a 10-year phase-out on these two products. Both countries
agreed to 10-year phase-outs on rice tariffs. 39
US-Australia. Australia does not have any tariffs on imports of wheat, rice, barley,
sorghum, or rye oats.40 The United States will immediately eliminate its duties on barley,
38 For more information, see Foreign Agricultural Service publication “US-Central America-Dominican Republic Free Trade Agreement: Overall Agriculture Fact Sheet”. 39 For more information, see Foreign Agricultural Service publication “NAFTA Agricultural Fact Sheets: Commodities and Other Topics”. 40 Australia agreed to work with the United States in the WTO agriculture negotiations to develop disciplines that eliminate restrictions on the right to export. Australia has state
17

corn and sorghum. Oats already enjoyed duty-free access in the US market. US tariffs on
parboiled rice will be phased-out over 5 years, while all other varieties of rice will receive
immediate duty free treatment.41
US-Chile. Tariffs on barley, barley malt, and sorghum are immediately eliminated by
both countries. Chilean tariffs on rice falls to zero in equal increments over 12 years.
Chile can apply special agricultural safeguards (priced-based) on US rice until tariffs are
eliminated. The United States will immediately eliminate tariffs on rice. Oats already
enjoyed duty-free access in the US market.42
US-Morocco. Morocco will immediately eliminate its tariffs on sorghum and oats.
Morocco’s tariffs for barley will be phased-out in 5 or 15 years, depending on the final
use. Morocco’s tariffs on rice will be phased-out in either 5 years or 10 years, depending
on the specific product. US tariffs on sorghum, barley, and rice will be eliminated
immediately. Oats already enjoyed duty-free access in the US market. 43
CAFTA-DR. US imports of these other grains from CAFTA-DR countries already enjoy
duty-free access. On US barley, oats and rye gain tariffs are immediately eliminated by
all CAFTA-DR countries. Costa Rica retains tariffs on sorghum over the transition period.
trading organizations (STOs) with sole authority to export rice and grains, and these STOs are the object of US negotiating efforts. 41 For more information, see Foreign Agricultural Service publication “US-Australia Free Trade Agreement: Commodity Fact Sheets – Grains”. 42 For more information, see Foreign Agricultural Service publication “US-Chile Free Trade Agreement: Commodity Fact Sheets – Grains”. 43 For more information, see USTR publication “US-Morocco Free Trade Agreement Agriculture Provisions”.
18
Each US CAFTA-DR partner will establish zero duty TRQs for several varieties of US
rice. Out-of-quota tariffs will be eliminated during a transition period of 18 to 20 years.
During this transition period, special agricultural safeguards (volume-based) are available
to CAFTA-DR countries.44
Other Processed Foods
NAFTA: US-Mexico. US tariffs on some processed fruits and juices imported from
Mexico are being phased-out over 10 years. Mexico lowered its duty to match the US rate
and is phasing out from there. The United States and Mexico are applying 15-year
NAFTA TRQ tariffs on frozen concentrated orange juice, as well as special agricultural
safeguards (price-based). Strict rules of origin apply to NAFTA fresh citrus fruit. 45
US-Australia. Australia locks in immediate duty-free tariff treatment for all US
processed foods and beverages (chocolate bars, pet foods, breakfast cereals, soups and
broths, fruit juices, pasta, etc.). US tariffs are immediately eliminated for many other
processed food products, including soups, and pet foods. US tariffs on certain breakfast
cereals and pasta are eliminated over 4 years. US import tariffs on chocolate bars are
phased-out over 10-years in equal annual cuts. With the exception of lime juice, which
received immediate duty-free treatment, the United States will eliminate its tariffs on
most other citrus fruit juices in 4 years (grapefruit) or 18 years (orange and lemon). The
44 For more information, see Foreign Agricultural Service publication “US-Central America-Dominican Republic Free Trade Agreement: Overall Agriculture Fact Sheet”. 45 For more information, see Foreign Agricultural Service publication “NAFTA Agricultural Fact Sheets: Commodities and Other Topics”.
19

United States has recourse to special agricultural safeguards on imports of grape and
orange juice from Australia.46
US-Chile. Initial duty-free quotas are established for some Chilean chocolates and food
preparations, and the quotas are eliminated after 12 years. Pet foods, breakfast cereals,
soups and broths, and pasta gain preferential access as tariffs fall to zero immediately in
both countries. With the exception of lime juice that will receive immediate duty-free
treatment, the United States will eliminate its tariffs on all other citrus fruit juices (orange,
lemon, grapefruit) in 10 or 12 years. Chile will grant immediate duty-free treatment for
US citrus juices. On instant coffee and other coffee extracts and concentrates, the United
States will eliminate its tariffs immediately, while Chile will do so over 12 years. The
United States has recourse to special agricultural safeguards on imports of grape and
orange juice from Chile.47
US-Morocco. Morocco will phase-out its tariffs on processed foods over periods ranging
from immediate elimination up to 15 years, depending on the product. Morocco will
phase-out its tariffs on breakfast cereals, pet food and certain food preparations in 8 years.
Moroccan tariffs on soups and broths and nearly all US fruit juices will be phased-out
over 10 years.48 A “preference clause” will apply to Moroccan imports of certain US
46 For more information, see Foreign Agricultural Service publication “US-Australia Free Trade Agreement: Commodity Fact Sheets – Processed Foods and Beverages ”. 47 For more information, see Foreign Agricultural Service publication “US-Chile Free Trade Agreement: Commodity Fact Sheets ”. 48 The only exceptions are tariffs on certain US apple and pineapple juices that will be eliminated over 5 years.
20
pasta products. Morocco will establish TRQs that will grow at the annual rate of 2
percent per annum in perpetuity after year 10. 49
The United States will eliminate immediately its tariffs on food preparations, pet food,
pasta, and soups and broths. Tariffs on certain breakfast cereal products will be phased-
out over 10 years. US tariffs on most Moroccan citric juices, with the exception of lime
juices that receive immediate duty-free, will be eliminated over 15 years. The United
States has recourse to special agricultural safeguards on imports of certain fruit juices (e.g.
orange juice) from Morocco.
CAFTA-DR. Prior to the agreement, US imports of processed foods from CAFTA-DR
countries already enjoyed duty-free access under the CBI. El Salvador and Guatemala
will immediately eliminate tariffs on US dog and cat food, while the other Central
American countries will eliminate duties over 5 to 15 years. Tariffs on US soups will be
eliminated immediately in Costa Rica and Honduras, over 5 years in the other three
Central American countries, and over 15 years in the Dominican Republic. US exporters
will obtain immediate duty-free access on frozen concentrated grapefruit juice in all six
countries, and on frozen concentrated orange juice in all Central American countries. 50
Peanuts and Peanut Products
NAFTA: US-Mexico. Mexican imports of US peanuts were already duty-free before the
49 For more information, see USTR publication “US-Morocco Free Trade Agreement Agriculture Provisions”. 50 For more information, see Foreign Agricultural Service publication “US-Central America-Dominican Republic Free Trade Agreement: Overall Agriculture Fact Sheet”.
21
NAFTA. The United States established a NAFTA TRQ, which is phased-out during a 15-
year transition period. Roasting or blanching of non-NAFTA peanuts does not confer
origin. 100-percent Mexican-grown peanuts must be used to make products that qualify
for NAFTA preferential tariffs. 51
US-Australia. Australia immediately eliminated tariffs on ground-nuts and ground-nut
butter (HS 1202.01, 1202.02 and 2008.11 and 2008.19). The United States will establish
preferential FTA TRQs for Australian peanuts and peanut butter. The over-quota rates
will be reduced to zero in equal annual steps over 18 years.52
US-Chile. The United States will grant Chilean peanut exports duty free access on year
12. Meanwhile, tariffs will be phased-out in equal annual cuts. Chile immediately
eliminated its tariffs on US peanut butter, and will eliminate its tariffs on US peanuts over
8 years.
US-Morocco. Morocco will phase-out tariffs on peanuts and peanut butter over 10 years.
Tariffs on peanut oil and flour will be phased-out immediately. The United States will
establish a preferential TRQ for peanuts and peanut butter from Morocco. Over-quota
tariffs will be phased-out over 15 years. 53
51 For more information, see Foreign Agricultural Service publication “NAFTA Agricultural Fact Sheets: Peanuts”. 52 For more information, see Foreign Agricultural Service publication “US-Australia Free Trade Agreement: Commodity Fact Sheets – Oilseeds ”. 53 For more information, see USTR publication “US-Morocco Free Trade Agreement Agriculture Provisions”.
22

CAFTA-DR. Tariffs on US peanuts and peanut butter are immediately eliminated in
most countries, except Guatemala and Nicaragua (5 to 10 years). The United States will
establish a preferential TRQ for peanuts and peanut butter for CAFTA countries that will
be phased-out over a 15-year period. The United States may apply special agricultural
safeguards during the transition period. 54
Poultry and other meats
NAFTA: US-Mexico. Most of these products already entered the United States duty-free;
with NAFTA, The United States immediately eliminated its remaining tariffs on pork,
poultry, and eggs. 55
Mexico established a 10-year NAFTA TRQ on certain pork products, poultry, and eggs.
For Mexico’s TRQ on pork products, the in-quota tariff was phased-out over 10 years.
Additionally, Mexico implemented a combination of tariffs with a 10-year phase-out and
special agricultural safeguards for slaughter swine, pork and hams. Turkey products
received the same treatment as poultry products in both countries.
US-Australia. Australia locked in its duty-free tariff treatment for US pork, poultry,
lamb and mutton, and immediately eliminated tariffs on certain processed meats. US
tariffs on goat, poultry, sausages and preserved meats will be phased-out over a 4-year
54 For more information, see Foreign Agricultural Service publication “US-Central America-Dominican Republic Free Trade Agreement: Overall Agriculture Fact Sheet”. 55 For more information, see Foreign Agricultural Service publication “NAFTA Agricultural Fact Sheets: Poultry”.
23
period. The United States immediately eliminated its tariff on all other pork, and lamb
and mutton.56
US-Chile. Both countries established preferential TRQs on poultry that will be
completely liberalized over 10 years. Chile immediately eliminated tariffs on pork and
processed pork products. Chile has recourse to special agricultural safeguards (price-
based) if import prices of US eggs and turkey drop below certain thresholds. The United
States may apply price-based safeguards on imports of turkey from Chile. Chile
determined that the US meat inspection system is equivalent to its own. The US tariff on
processed pork products will be immediately eliminated. Chilean exporters will gain
access to the United States upon approval of Chile’s meat inspection system.
US-Morocco. Morocco will create four preferential TRQs for US exports of chicken leg
quarters and wings, whole chickens and turkeys, frozen chicken thigh meat, and other
frozen poultry meat. The over-quota tariffs will be phased-out in 10 to 25 years using a
non-linear formula. For all other products, Moroccan tariffs will be eliminated in 5 to 10
years, except for tariffs on mechanically de-boned chicken and chicken nuggets, strips,
and patties that will be immediately eliminated. Morocco has recourse to special
agricultural safeguards (quantity-based) for poultry and turkey products. In the case of
chicken leg quarters and wings, Morocco and the United States will evaluate the need for
a post-transition safeguard.
56 For more information, see Foreign Agricultural Service publication “US-Australia Free Trade Agreement: Commodity Fact Sheets – Other Meats ”.
24

The United States will eliminate its tariffs on Moroccan frozen whole chickens and fresh
or chilled cuts over 5 years; while US tariffs on frozen chicken cuts will be eliminated
over 10 years. 57
US exports of beef and poultry must be accompanied by an export certificate for entry
into Morocco. Morocco’s veterinary services, in cooperation with the United States
Department of Agriculture’s Food Safety and Inspection Service, will work together in
good faith to define the content of export certificates that will accompany US beef and
poultry.
CAFTA-DR. Prior to the agreement, US imports of poultry and pork from CAFTA-DR
countries already enjoyed duty-free access under the CBI. Tariffs on US poultry products,
such as mechanically de-boned meat and wings and breast meat and, will be eliminated
immediately or within 5 years by all CAFTA-DR countries. In addition, each CAFTA-
DR country will establish preferential TRQs on US chicken legs that expand annually as
duties are eliminated in 17 to 20 years. Central American and Dominican tariffs on pork
will be eliminated over 15 years. Certain pork products will be subject to duty-free in-
quota TRQs that will expire over 15 years. During the transition period, CAFTA-DR
countries will have recourse to special agricultural safeguards for these products.
57 For more information, see USTR publication “US-Morocco Free Trade Agreement Agriculture Provisions”.
25

Each CAFTA-DR country is working toward the recognition of the US meat inspection
and certification systems in order to facilitate US exports. 58
Soybeans, soybean meal and soybean oils
NAFTA: US-Mexico. Mexican exports of soybeans and soybean meal already enjoyed,
or were immediately conferred, duty-free access to the United States. US tariffs on
Mexican crude and refined soybean oil were eliminated over a 4-year phase-out period.
Mexico eliminated its tariffs on US soybeans, soybean meal, and crude and refined
soybean oil over a 10-year period. 59
US-Australia. Australia immediately eliminated its tariffs for all oilseeds and products.
Australia gained preferential access as US tariffs fall immediately to zero for soybeans,
soybean flour, soybean meal, and cottonseed. US tariffs on Australian crude and refined
soybean oil will be eliminated in 10 years, while tariffs on crude and refined peanut oil
will be removed over 18 years. 60
US-Chile. Tariffs on soybean and soybean meal are immediately eliminated by both
countries. US seeds for sowing were granted immediate duty-free access by Chile. Chile
continues to enjoy free access to the US market for these products. US tariffs on crude
and refined soybean oil will be removed in 12 years, while tariffs on peanut oils will be
58 For more information, see Foreign Agricultural Service publication “US-Central America-Dominican Republic Free Trade Agreement: Overall Agriculture Fact Sheet”. 59 For more information, see Foreign Agricultural Service publication “NAFTA Agricultural Fact Sheets: Soybeans and Products”. 60 For more information, see Foreign Agricultural Service publication “US-Australia Free Trade Agreement: Commodity Fact Sheets – Oilseeds ”.
26

eliminated on 10 or 12 years. Chilean tariffs of soybean and peanut oils will be phased-
out on a back-loaded schedule over 12 years.61
US-Morocco. Morocco will eliminate tariffs on soybeans and other oilseeds and soybean
meal over the next 5 years. Tariffs on other oilseeds items will be phased-out over 10
years. The United States will immediately eliminate tariffs on soybeans, most other
oilseeds and soybean meal. US tariffs on soybean oil will be phased-out over 10 years. 62
CAFTA-DR. Prior to the agreement, US Imports of soybean, soybean meal, soybean oil,
and other vegetable oil from CAFTA-DR countries already enjoyed duty-free access
under the CBI. CAFTA-DR countries will immediately eliminate their tariffs on US
soybean and soybean meal. However, Costa Rican tariffs on soybean meal will be
eliminated over 15 years. US crude soybean oils gain preferential access since CAFTA-
DR tariffs are immediately eliminated in all countries except Costa Rica and Honduras
(12 to 15-year phase-outs in these countries). All CAFTA-DR countries will phase-out
tariffs on US refined soybean oil over 12 or 15 years. All countries, with the exception of
Nicaragua, reserve the right to apply special agricultural safeguards on refined soybean
oil. 63
61 For more information, see Foreign Agricultural Service publication “US-Chile Free Trade Agreement: Commodity Fact Sheets – Soybeans and meal ”. 62 For more information, see USTR publication “US-Morocco Free Trade Agreement Agriculture Provisions”. 63 For more information, see Foreign Agricultural Service publication “US-Central America-Dominican Republic Free Trade Agreement: Overall Agriculture Fact Sheet”.
27
Sugar
NAFTA: US-Mexico. The United States and Mexico established NAFTA TRQs on sugar.
At the end of year 15, there is supposed to be free trade in sugar between Mexico and the
United States. The United States and Mexico will each allow duty-free access to imports
of the following sugars: raw sugar that will be refined in the importing country and then
re-exported to the original exporting country; and refined sugar that has been refined
from raw sugar produced in and exported from the other country. However, since
NAFTA was ratified the United States and Mexico have been involved in continuous
disputes over sugar and high fructose corn syrup (HFCS). 64
Mexican tariffs on sugar-containing products were phased-out over 10 years. The United
States established a NAFTA TRQ on sugar-containing products, which was phased-out
over a 10-year transition period.
US-Australia. Many sugar and sugar containing products already entered duty-free into
Australia. For all other sugar and sugar containing products, Australia immediately
eliminated its tariffs. US duties are maintained indefinitely on sugar. Australia's sugar
access to the United States remains unchanged at 87,402 tonnes per annum. Australia
maintains its single desk arrangements for marketing sugar exports to the world. In the
wake of the FTA, Australia implemented a new buy-out program for Australian sugar
farmers, who were bitterly disappointed by the US refusal to liberalize its sugar market.
64 For more information, see Foreign Agricultural Service publication “NAFTA Agricultural Fact Sheets: Sugar”.
28

US-Chile. Chilean duties on sugar and sugar containing products will be eliminated by
year 12, but most tariff cuts will occur after year 5. US imports of sugar and sugar
containing products are limited by a TRQ that will be phased-out over 12 years.
US-Morocco. Morocco will phase-out its sugar tariffs in 5, 10, and 18 years. The United
States will establish a TRQ for Moroccan sugar and sugar-containing products. Over-
quota tariffs will be phased-out in year 15. Unless it is a net exporter of sugar to the
world, Morocco cannot export sugar to the United States. 65
CAFTA-DR. The United States will establish TRQs for Central American countries and
the Dominican Republic. Duty-free in-quota volume is established at 109,000 metric tons
(mt) for US imports of CA/DR sugar and sugar-containing products. This quantity will
gradually increase over a 15-year period to 153,140 mt. After year 15, the preferential
TRQ will increase by 2,000 mt annually in perpetuity. The quantity allowed under the
TRQs is the lesser of the amount of each country’s net trade surplus in sugar or the
specific amounts set out in each country’s TRQ. The agreement also includes a
mechanism that allows the United States, at its option, to provide some form of
alternative compensation to CAFTA exporters in place of imports of sugar. US over-
quota tariffs on sugar will not change under the CAFTA. The US over-quota tariff is
prohibitive, over 100 percent, one of the highest tariffs in the US tariff schedule. 66
65 For more information, see USTR publication “US-Morocco Free Trade Agreement Agriculture Provisions”. 66 For more information, see Foreign Agricultural Service publication “US-Central America-Dominican Republic Free Trade Agreement: Overall Agriculture Fact Sheet”.
29
Tobacco
NAFTA: US-Mexico. The United States and Mexico eliminated tariffs on tobacco
products over 10 years. 67
US-Australia. The United States established preferential TRQs for Australian tobacco
products. Over-quota tariffs will be phased-out over 18 years. Tobacco products already
enjoyed duty-free treatment in Australia.
US-Chile. The United States established preferential TRQs for Chilean tobacco products.
Over-quota tariffs will be phased out-over 12 years. Chile will eliminate immediately its
tariffs on all imports of tobacco from the United States.
US-Morocco. The United States established preferential TRQs for Moroccan tobacco
products. Over-quota tariffs will be phased-out over 15 years. Morocco will phase-out its
tariffs on most tobacco products over 10 years. The exceptions are non-processed tobacco
products (HS 2401) that will face transition periods of 5 years. 68
CAFTA-DR. The United States established preferential TRQs for tobacco products
originating in CAFTA-DR countries. Over-quota tariffs will be phased-out over 15 years.
US tobacco imports from Central America and Dominican Republic that already enjoyed
duty-free access under CBI will continue to receive such treatment. CAFTA-DR
67 For more information, see Foreign Agricultural Service publication “NAFTA Agricultural Fact Sheets: Tobacco”. 68 For more information, see USTR publication “US-Morocco Free Trade Agreement Agriculture Provisions”.
30

countries will eliminate tariffs on US tobacco products over 15 years. 69
Wheat
NAFTA: US-Mexico. The United States phased-out its tariff on durum wheat imports
from Mexico over 10 years. For non-durum wheat from Mexico, the US tariff was
eliminated on January 1, 1998. Mexican tariffs on US wheat exports were eliminated
over a 10-year transition period. 70
US-Australia. Australia does not have tariffs on imported wheat. It does have a State
Trading Organization (STO) with the sole authority to export wheat. Australia has agreed
to work with the United States in the WTO agriculture negotiations to develop disciplines
that eliminate restrictions on the right of other firms to export wheat. The United States
will immediately eliminate its duties on wheat.71
US-Chile. Tariffs on durum wheat are immediately eliminated by both countries. Chile
committed to eliminate its price band mechanism on non-durum wheat and wheat flour,
as it relates to the United States, over a 12-year transition period. Chile has recourse to
special agricultural safeguards during the transition period.72
69 For more information, see Foreign Agricultural Service publication “US-Central America-Dominican Republic Free Trade Agreement: Overall Agriculture Fact Sheet”. 70 For more information, see Foreign Agricultural Service publication “NAFTA Agricultural Fact Sheets: Wheat.” 71 For more information, see Foreign Agricultural Service publication “US-Australia Free Trade Agreement: Commodity Fact Sheets – Grains ”. 72 For more information, see Foreign Agricultural Service publication “US-Chile Free Trade Agreement: Commodity Fact Sheets – Grains ”.
31
US-Morocco. Morocco will create preferential TRQs for durum wheat and common
wheat. For durum wheat, Morocco’s over-quota tariff will remain in place unless
Morocco negotiates a reduction with another partner (e.g the European Union). The in-
quota tariff will be eliminated in 10 years. For common wheat (red wheat), TRQ in-quota
quantities are based on Morocco’s domestic production of common wheat.73 The over-
quota tariff will remain in place unless Morocco negotiates a reduction with another
trading partner. 74
CAFTA-DR. Prior to the agreement, US wheat imports from CAFTA-DR countries
enjoyed duty-free access already under the CBI. With the exception of Costa Rica, which
will eliminate its tariffs on US wheat immediately, all CAFTA-DR countries already
allowed duty-free access for most US wheat products. Tariffs on US wheat flour will be
phased out over 12 years in the five Central American countries, and over 15 years in the
Dominican Republic. 75
Wine
NAFTA: US-Mexico. US tariffs on most grape wines imported from Mexico were
73 The formula determining the in-quota volume is highly complex. For more information see http://www.ustr.gov/Document_Library/Fact_Sheets/2004/U.S.Morocco_Free_Trade_Agreement_Agriculture_Provisions.html 74 For more information, see USTR publication “US-Morocco Free Trade Agreement Agriculture Provisions”. 75 For more information, see Foreign Agricultural Service publication “US-Central America-Dominican Republic Free Trade Agreement: Overall Agriculture Fact Sheet”.
32

phased-out over 10 years. Mexican tariffs on grape wine were eliminated over 10 years,
on wine coolers over 6 years, and on most grape brandies over 10 years. 76
US-Australia. Australia locks in immediate duty-free tariff treatment for all US wine. US
tariffs for wine are phased-out over 11 years using a formula similar to that used in the
US-Chile FTA.77
US-Chile. Following a graduated schedule, tariffs in both countries will be eliminated in
year 12.78
US-Morocco. Morocco will eliminate its tariffs on wine over a period of 10 years. The
United States will eliminate its wine tariffs using a harmonization formula, under which
they will be progressively reduced over ten years to the lowest wine tariff level, before all
US wine tariffs are duty-free in year 11. 79
76 For more information, see Foreign Agricultural Service publication “NAFTA Agricultural Fact Sheets: Alcoholic Beverages”. 77 For more information, see Foreign Agricultural Service publication “US-Australia Free Trade Agreement: Commodity Fact Sheets – Processed Foods and Beverages ”. 78 or more information, see Foreign Agricultural Service publication “US-Chile Free Trade Agreement: Commodity Fact Sheets – Wine ”. 79 For more information, see USTR publication “US-Morocco Free Trade Agreement Agriculture Provisions”.
33

CAFTA-DR. Prior to the agreement, the United States already granted duty-free
treatment to wine imports from CAFTA-DR countries under the CBI. These countries
will eliminate tariffs on US wine over 5 years. 80
SOURCES:
Department of Foreign Affairs and Trade. The Australia-US Free Trade Agreement: Advancing Australian Agricultural Exports. Available on-line at: http://www.dfat.gov.au/trade/negotiations/us_fta/fact_sheets/Agriculture.pdf. (accessed October 30, 2005). Department of Foreign Trade of Costa Rica. “Principales Logros y Resultados”. Available on-line at: http://www.comex.go.cr/difusion/otros/USAv8Resultados.pdf. (accessed October 30, 2005). Chile Foreign Affairs Ministry (DIRECON, Dirección General de Relaciones Económicas Internacionales). 2003. Bilateral Chile-US Trade, Tratado de Libre Comercio Chile-Estados Unidos (August). Santiago: DIRECON. www.direcon.cl/documentos/TLC%20EEUU/Impacto%20TLC%20Chile%20USA.pdf (accessed October 30, 2005). Office of the USTR (2004). US-Morocco Free Trade Agreement Agriculture Provisions. Available on-line at: http://www.ustr.gov/Document_Library/Fact_Sheets/2004/USMorocco_Free_Trade_Agreement_Agriculture_Provisions.html. (accessed October 30, 2005). USDA, Foreign Agricultural Service (1998). NAFTA Agricultural Fact Sheets: Commodities and Other Topics. Commodities Consulted: “Alcoholic Beverages”; “Beef”; “Cheese”; “Corn”; “Cotton”; “Other Vegetable Oils”; “Peanuts”; “Poultry”; “Processed Fruits”; “Processed Vegetables”; “Rice”; “Soybeans and Products”; “Sugar”; “Swine and Pork”; “Tobacco”; “Wheat”. Available on-line at: http://www.fas.usda.gov/itp/Policy/NAFTA/nafta-com-fact-sheets.html. (accessed October 30, 2005). USDA, Foreign Agricultural Service (2003). US-Chile Free Trade Agreement: Commodity Fact Sheets”.
80 For more information, see Foreign Agricultural Service publication “US-Central America-Dominican Republic Free Trade Agreement: Overall Agriculture Fact Sheet”.
34

Commodities Consulted: “Beef”; “Cotton”; “Dairy Products”; “Fresh Citrus”; “Deciduous Fruits”; “Grains”; “Peanuts”; “Pork”; “Poultry”; “Processed Fruits”; “Soybeans and Meal”; “Tree Nuts”; “Vegetables” Available on-line at: http://www.fas.usda.gov/itp/chile/us-chilecomodfacts.html. (accessed October 30, 2005). USDA, Foreign Agricultural Service (2004). US-Australia Free Trade Agreement: Commodity Fact Sheets”. Commodities Consulted: “Beef”; “Cotton”; “Dairy”; “Fruits and Nuts”; “Grains”; “Oilseeds”; “Other Meats”; “Processed Foods and beverages”; “Vegetables”. Available on-line at: http://www.fas.usda.gov/itp/Australia/us-auscommodityfactsheets.html. (accessed October 30, 2005). USDA, Foreign Agricultural Service (2005). US-Central America-Dominican Republic Free Trade Agreement: Overall Agriculture Fact Sheet”. Available on-line at: http://www.fas.usda.gov/info/factsheets/CAFTA/overall021105a.html. (accessed October 30, 2005).
35
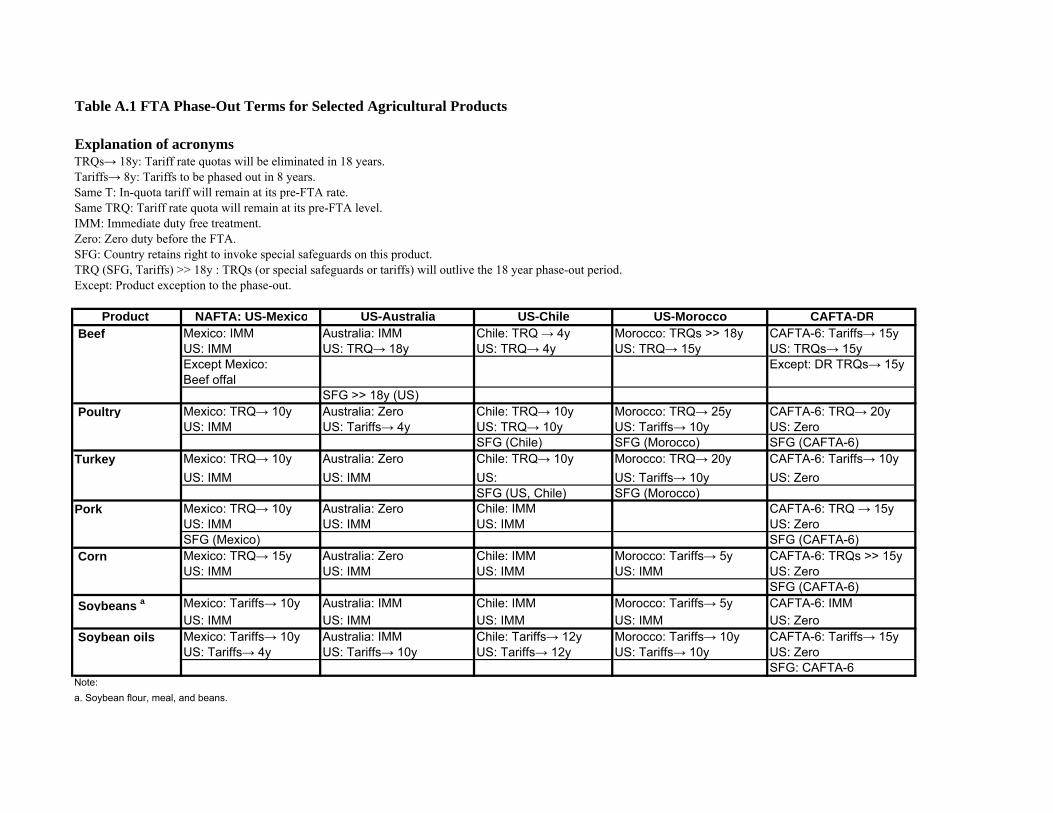
Table A.1 FTA Phase-Out Terms for Selected Agricultural Products
Explanation of acronymsTRQs→ 18y: Tariff rate quotas will be eliminated in 18 years.Tariffs→ 8y: Tariffs to be phased out in 8 years.Same T: In-quota tariff will remain at its pre-FTA rate.Same TRQ: Tariff rate quota will remain at its pre-FTA level.IMM: Immediate duty free treatment.Zero: Zero duty before the FTA.SFG: Country retains right to invoke special safeguards on this product.TRQ (SFG, Tariffs) >> 18y : TRQs (or special safeguards or tariffs) will outlive the 18 year phase-out period.Except: Product exception to the phase-out.
Product NAFTA: US-Mexico US-Australia US-Chile US-Morocco CAFTA-DR Beef Mexico: IMM Australia: IMM Chile: TRQ → 4y Morocco: TRQs >> 18y CAFTA-6: Tariffs→ 15y
US: IMM US: TRQ→ 18y US: TRQ→ 4y US: TRQ→ 15y US: TRQs→ 15yExcept Mexico: Except: DR TRQs→ 15yBeef offal
SFG >> 18y (US) Poultry Mexico: TRQ→ 10y Australia: Zero Chile: TRQ→ 10y Morocco: TRQ→ 25y CAFTA-6: TRQ→ 20y
US: IMM US: Tariffs→ 4y US: TRQ→ 10y US: Tariffs→ 10y US: ZeroSFG (Chile) SFG (Morocco) SFG (CAFTA-6)
Turkey Mexico: TRQ→ 10y Australia: Zero Chile: TRQ→ 10y Morocco: TRQ→ 20y CAFTA-6: Tariffs→ 10yUS: IMM US: IMM US: US: Tariffs→ 10y US: Zero
SFG (US, Chile) SFG (Morocco)Pork Mexico: TRQ→ 10y Australia: Zero Chile: IMM CAFTA-6: TRQ → 15y
US: IMM US: IMM US: IMM US: ZeroSFG (Mexico) SFG (CAFTA-6)
Corn Mexico: TRQ→ 15y Australia: Zero Chile: IMM Morocco: Tariffs→ 5y CAFTA-6: TRQs >> 15yUS: IMM US: IMM US: IMM US: IMM US: Zero
SFG (CAFTA-6) Soybeans a Mexico: Tariffs→ 10y Australia: IMM Chile: IMM Morocco: Tariffs→ 5y CAFTA-6: IMM
US: IMM US: IMM US: IMM US: IMM US: Zero Soybean oils Mexico: Tariffs→ 10y Australia: IMM Chile: Tariffs→ 12y Morocco: Tariffs→ 10y CAFTA-6: Tariffs→ 15y
US: Tariffs→ 4y US: Tariffs→ 10y US: Tariffs→ 12y US: Tariffs→ 10y US: ZeroSFG: CAFTA-6
Note:a. Soybean flour, meal, and beans.

Table A.1 Continued
Product NAFTA: US-Mexico US-Australia US-Chile US-Morocco CAFTA-DR Wheat Mexico: Tariffs→ 10y Australia: Zero Chile: IMM Morocco: TRQs >> 15y CAFTA-6: Zero
US: Tariffs→ 10y US: IMM US: IMM US: IMM US: ZeroChile: Price band →12y Except CAFTA-6:SFG (Chile) Wheat flour
Rice Mexico: Tariffs→ 10y Australia: Zero Chile: Tariffs→ 12y Morocco: Tariffs→ 10y CAFTA-6: TRQ→18-20yUS: Tariffs→ 10y US: IMM US: IMM US: IMM US: Zero
Except parboiled rice (US) SFG (Chile) SFG (CAFTA-6)
Other Grains Mexico: TRQ→ 10y Australia: Zero Chile: IMM Morocco: Tariffs→ 15 y CAFTA-6: IMMUS: IMM US: IMM US: IMM US: IMM US: Zero
Nuts Mexico: IMM Australia: Zero Chile: IMM Morocco: Tariffs→ 5y CAFTA-6: IMMUS: IMM US: IMM US: Tariffs→ 4y US: Tariffs→ 10y US: Zero
Except Morocco:TRQ almondsSFG (Morocco)
Peanuts & Mexico: Zero Australia: IMM Chile: Tariffs→ 8y Morocco: Tariffs→ 10y CAFTA-6: IMM Peanut Butter US: TRQ→ 15y US: TRQ→ 18y US: Tariffs→ 12y US: TRQ→ 15y US: TRQ→ 15y
Except: Gua. and Nic.Tariffs→ 5-10ySFG (US)
Raw Cotton Mexico: Tariffs→ 10y Australia: Zero Chile: IMM Morocco: IMM CAFTA-6: IMMUS: TRQ→ 10y US: TRQ→ 18y US: Tariffs→ 12y US: TRQ→ 15y US: Tariffs→ 15y
Milk products Mexico: TRQ→ 10y Australia: IMM Chile: Tariffs→ 8y Morocco: Tariffs→ 15y CAFTA-6: TRQ→ 20yand creams US: TRQ→ 10y US: TRQ >> 18y, Same T US: TRQ→ 12y US: TRQ→ 15y US: TRQ→ 20y
SFG (all parties)Cheese Mexico: TRQ→ 10y Australia: IMM Chile: Tariffs→ 4y Morocco: Tariffs→ 10y CAFTA-6: TRQ→ 20y
US: TRQ→ 10y US: TRQ >> 18y, Same T US: TRQ→ 12y US: TRQ→ 15y US: TRQ→ 20ySFG (all parties)
Butter Mexico: Australia: IMM Chile: Tariffs→ 4y Morocco: Tariffs→ 8y CAFTA-6: TRQ→ 20yUS: US: TRQ >> 18y, Same T US: TRQ→ 12y US: TRQ→ 15y US: TRQ→ 20y
SFG (all parties)

Table A.1 Continued
Product NAFTA: US-Mexico US-Australia US-Chile US-Morocco CAFTA-DR Fruit Mexico: Tariffs→ 10y Australia: Zero Chile: IMM Morocco: Tariffs→ 5 y CAFTA-6: IMM
US: TRQs→ 10y US: Tariffs→ 18y US: Tariffs→ 12y US: Tariffs→ 18y US: ZeroExcept Mexico: Except Morocco: Except CAFTA-6:TRQ apples TRQ apples Oranges SFG (US, Mexico) SFG (US) SFG (US) SFG (US)
Fruit Juices Mexico: TRQ→ 15y Australia: IMM Chile:IMM Morocco: Tariffs→ 10y CAFTA-6: IMMUS: TRQ→ 15y US: Tariffs → 18y US:Tariffs→ 12y US: Tariffs→ 15y US: Zero
Exceptions (US) Exceptions (US)SFG (US) SFG (US) SFG (US)
Vegetables Mexico: Tariffs→ 10y Australia: Zero Chile: Tariffs→ 12y Morocco: Tariffs→ 8y CAFTA-6: Tariffs→ 15yUS: TRQs→ 10y US: Tariffs→ 18y US: Tariffs→ 12y US: Tariffs→ 18y US: Zero Except Mexico: Except US: Except US: Except US:TRQ potatoes TRQ avocados TRQ avocados TRQ onions, garlic,
tomato productsSFG (US), (Mexico) SFG (US) SFG (US) SFG (US, Morocco)
Sugar and Mexico: TRQ→ 15y Australia: IMM Chile: Tariffs→ 12y Morocco: Tariffs→ 18y CAFTA-6: TRQ→ 15y Sugar Products US: TRQ→ 15y US: No change US: TRQ→ 12y US: TRQ→ 15y US: TRQ >> 15y Tobacco Mexico: Tariffs→ 10y Australia: Zero Chile: IMM Morocco: Tariffs→ 10y CAFTA-6: Tariffs→ 15y
US: Tariffs→ 10y US: TRQ→ 18y US: TRQ→ 12y US: TRQ→ 15y US: TRQ→ 15y Distilled spirits Mexico: Tariffs→ 8y Australia: IMM Chile: Tariffs→ 2y Morocco: IMM CAFTA-6: Tariffs→ 5y and beer US: Tariffs→ 10y US: Tariffs→ 18y US: Tariffs→ 12y US: Tariffs→ 15y US: Zero Wine Mexico: Tariffs→ 10y Australia: IMM Chile: Tariffs→ 12y Morocco: Tariffs→ 10y CAFTA-6: Tariffs→ 5y
US: Tariffs→ 10y US: Tariffs→ 11y US: Tariffs→ 12y US: Tariffs→ 11y US: Zero
Sources : USDA Foreign Agricultural Service, USTR, and Ministries of Foreign Affairs and/or of Australia, Chile, and Costa Rica (DFAT, Direcon, and Comex).

Last Modified: 9/28/2005 THE SHAPE OF A FREE TRADE AGREEMENT BETWEEN
SWITZERLAND AND THE UNITED STATES
Appendix B
SPS Measures in US and Swiss Trade Agreements
A. SPS Measures in US Trade Agreements
NAFTA1
The NAFTA Sanitary and Phytosanitary (SPS) agreement disciplines the development,
adoption and enforcement of SPS measures. These disciplines are designed to prevent the
use of SPS measures as disguised restrictions on trade, while safeguarding each country's
right to take SPS measures to protect human, animal or plant life or health.
NAFTA encourages the use of relevant international standards in the development of SPS
measures. At the same time, NAFTA confirms the right of each country to establish the
level of SPS protection that it considers appropriate (e.g., more stringent rules) as long as
the SPS measures meet three tests: they are based on scientific principles and a risk
assessment; they are applied only to the extent necessary to provide a country's chosen
level of protections; they do not result in unfair discrimination or disguised restrictions on
trade.
1 The Section on NAFTA draws extensively on information available on the USDA Foreign Agricultural Service (FAS) website.

Against the background of these principles, the NAFTA parties agreed to work toward
equivalent SPS measures. Each NAFTA country committed to accept the SPS measures
of another NAFTA country as equivalent to its own, provided that the exporting country
demonstrates that its measures achieve the importing country's chosen level of protection.
NAFTA requires public notice prior to the adoption or modification of any SPS measure
that may affect trade in North America.
The NAFTA establishes standards for risk assessment, including standards for evaluating
the likelihood of entry, establishment, or spread of pests and diseases. Risk assessment
methods should reflect techniques developed by international or North American
standards organizations.
The section on regional conditions establishes rules for the designation of pest-free or
disease-free areas and areas of low-pest or low-disease prevalence. An exporting country,
for example, must provide objective evidence proving that its goods originate in a pest-
free or low-pest prevalence area.
A SPS Committee was established to facilitate the enhancement of food safety and
sanitary conditions; promote the harmonization and equivalence of SPS measures;
facilitate technical cooperation and consultations; and consult on disputes involving SPS
measures.
US-Australia FTA
2

SPS issues were a central part of the negotiations between the United States and
Australia. Though both countries apply strict SPS protection, Australia’s approach to
quarantine is considered conservative. Before the negotiations, US stakeholders argued
that Australia’s SPS measures unjustifiably limited US access. The Australian
government welcomed consultations within the context of the negotiation as an
opportunity to placate US critics of the quarantine system.2
During the negotiation, an ad hoc group was established, and the first meeting was held
in August 2002. High priority issues for the United States included market access for
pork, California table grapes, Florida citrus, stonefruit, and poultry meat. Australia
identified access for feeder cattle, honeybees, Riverland citrus, cherries, and a variety of
tropical fruits as its priority issues.
The final text of the US-Australia FTA reaffirms the parties’ commitment to WTO rules
and to science-based decision making on matters affecting quarantine and food safety.
The WTO SPS Agreement will be applied should a dispute arise between the parties. The
dispute mechanism under chapter 21 of the FTA specifically does not apply to Chapter 7
(SPS provisions).
The US-Australia FTA also establishes a framework for discussing specific products.
This framework consists of an SPS Committee and a Standing Technical Working Group
2 See Page 146, Chapter 5 of the Final Report on the Free Trade Agreement between Australia and the United States of America. Australian Senate Select Committee. http://www.aph.gov.au/Senate/committee/freetrade_ctte/report/final/
3

on Animal and Plant Health Measures. The inclusion of a working group is a unique
feature of the US-Australia FTA that is not found on any other US bilateral FTA.3
The SPS Committee is a forum for discussing general matters and enhancing the
understanding of SPS regulatory processes. An official of the Australian Department of
Agriculture Forestry and Fisheries, Virginia Greville, stated in her testimony to the
Australian Senate:4
… the idea of the overarching SPS Committee is very much cooperation, increasing understanding and providing each with the opportunity to explain to each other how [each understands and applies the WTO agreement] so that misunderstandings do not occur and accusations do not fly backwards and forwards about bad citizenship under the WTO and SPS agreements.
The Working Group will focus on technical and scientific aspects of quarantine matters
relating to trade in specific animal and plant products. According to an APHIS Technical
Trade Report, the Working Group “would provide a forum for the parties to engage at the
earliest appropriate time in each other’s regulatory processes on such issues [technical
and scientific aspects] and to cooperate in developing science based measures that
facilitate trade between them.”5
Despite the fact that the Working Group and the SPS Committee are not decision making
bodies, their establishment generated controversy in Australia. Much of the debate
3 Other US bilateral FTAs, such as US-Chile, contemplate the possibility of establishing working groups, but these are not established in the agreement. 4 See Page 153, Chapter 5 of the Final Report on the Free Trade Agreement between Australia and the United States of America. Australian Senate Select Committee. http://www.aph.gov.au/Senate/committee/freetrade_ctte/report/final/ 5 APHIS Trade Support Team. Technical Trade Report, July 2004.
4
reflected a fear of unknown consequences and anxiety over the interpretation of key
provisions. For example, the agreement mandates the SPS Committee to “review
progress on and, as appropriate, resolve through mutual consent, sanitary and
phytosanitary measures.” Annex 7-A specifically mentions “resolving specific bilateral
animal and plant health matters” and “whenever possible, achieving consensus on
scientific issues” as objectives of the Working Group. No other US bilateral FTA
contains such explicit language on the purpose of the SPS Committee. The US-Chile
FTA, for example, uses the weaker expression “shall provide a forum for” rather than
“mandating” the SPS Committee to resolve and review progress on outstanding SPS
measures.
Australian government officials highlighted that these are nonetheless consultative bodies
for the discussion of technical and scientific interest. The Australian chief negotiator,
Stephen Deady, said “there is nothing in the establishment of these committees that will
impact on the integrity of the Import Risk Analysis processes in Australia.”6
Nevertheless, the Federation of Australian Scientific and Technological Societies
objected that the Working Group and the SPS Committee are bureaucratic instruments to
facilitate trade but “may undermine the fundamental role that proper scientific analysis
6 Quoted in page 149 of chapter 5 of the Final Report on the Free Trade Agreement between Australia and the United States of America. Australian Senate Select Committee. http://www.aph.gov.au/Senate/committee/freetrade_ctte/report/final/
5

must have in a sound quarantine system.” 7 The Australian Senate Select Committee
points out, in reference to the demands of US exporters, “there has been some comment
that the bilateral committees may have the potential to be de facto dispute settlement
regimes.”8 Some critics noted that, even if the Working Group and SPS Committee do
not become dispute settlement mechanisms, they will nonetheless allow the United States
to exercise pressure on Australian quarantine decisions. Consequently, Australia’s
reputation for a strong SPS regime may be watered-down. Still, the Senate’s Select
Committee concluded that “Australia’s processes may be robust enough to withstand
such pressure should it arise.”9
In a Side Letter to the Agreement, the United States and Australia agreed to work
cooperatively in the OIE, Codex, and other forums with the objective of securing science-
based standards and guidelines that address risks to food safety and animal health from
BSE.
US-Chile FTA
According to Animal and Plant Health Inspection Service (APHIS), the successful
negotiation and ratification of the US-Chile FTA made it a roadmap for subsequent SPS
discussions “in the Western Hemisphere and elsewhere.”
7 The Federation of Australian Scientific and Technological Societies (FASTS) was established in 1985. The Federation consists of societies representing the interests of Australian scientists and technologists. http://www.FASTS.org. 8 Quoted in the Final Report on the Free Trade Agreement between Australia and the United States of America. Australian Senate Select Committee. 9 Quoted in page 154 in chapter 5 of the Final Report on the Free Trade Agreement between Australia and the United States of America. Australian Senate Select Committee.
6
Before the negotiations, stakeholders in both countries had expressed concerns with
elements of the other party’s SPS regime. For example, the United States prohibited
importation of meats from Chile, while Chile limited market access for some US fruit and
meat products.
As in the US-Australia FTA, an ad hoc special working group was established during the
negotiations to address outstanding SPS issues. Though these SPS discussions did not
take part within the formal negotiations of the FTA, they went as far as possible in
finding technical solutions before Congressional ratification.
Some solutions involved modifications to SPS import measures in each party. These
modifications improved market access conditions for horticultural, meat and dairy
products of both countries. According to DIRECON, the principal achievements of the
working group were,10
• The partners reached an equivalence agreement on meat-cut classification systems
for bovine meats.
• Chile recognized the US inspection system for bovine, pork, and sheep meat. The
United States established a work plan to extend recognition to the Chilean
inspection system for those same products. A bilateral work plan was established
to exchange recognition of inspection systems for poultry meats.
10 This information is available on the US-Chile FTA section in the DIRECON website. See www.direcon.cl
7
• The United States began work to recognize Chile as “classical swine fever free”
country.
• The Chilean Secretaría de Agricultura granted the US FDA authority to inspect,
on behalf of Chile, US producing plants that export dairy products to Chile.
• Chile authorized the importation of Californian pit-containing fruits, and
advanced regulatory reforms to allow access to California citric products and
cherries, and Florida grapefruits.
• The United States agreed to speed up regulatory changes to allow imports of
Chilean clementines.
• Both countries pledged to work to harmonize measures regulating the importation
of tomatoes.
The US-Chile FTA reaffirms the parties’ commitment to WTO rules and to science-based
decision making on matters affecting human, animal and plant safety. The WTO SPS
Agreement and Dispute Settlement Mechanism will be applied should a dispute arise
between the parties on SPS matters.
Chapter 6 also establishes an SPS Committee charged with overseeing the
implementation of the WTO SPS Agreement between the parties and providing a forum
for technical discussions on the application of SPS measures in each country. The SPS
Committee will “review progress on addressing sanitary and phytosanitary matters” that
may arise between the parties and “enhance mutual understanding and consultation on
SPS regulatory processes.” The SPS Committee may establish ad hoc working groups,
8

but, unlike the US-Australia FTA, the agreement itself does not establish a standing
working group.
Since the entry into force of the US-Chile FTA in January 2004, the SPS Committee has
dealt with outstanding SPS issues. The SPS Committee established two ad hoc working
groups, one on grapes and another on meats. In July 2004, APHIS declared Chile to be
“free of classical swine fever” country. The US Food Safety and Inspection Service
(FSIS) conducted two in loco audits to certify the Chilean red-meat inspection system. In
December 2004, the USDA allowed the importation of Chilean clementines and
tangerines into the United States. In May 2005, the USDA published proposed rules and
regulations that include Chile to the list of countries eligible to export meat and meat
products to the United States. These proposed rules and regulations recognize the Chilean
inspection system as equivalent to the Federal Meat Inspection Act and its implementing
rules. The proposed amendment will eliminate the current prohibition of importation of
importation of Chilean meat products of cattle, sheep, swine, goats, horses, mules, or
other equines. Still pending are regulatory changes that will facilitate bilateral tomato,
and poultry trade as well as the importation of Chilean grapes into the United States.
US – Central America and Dominican Republic FTA (CAFTA-DR)
Central American products already enjoyed duty-free access through CBI and therefore
the need to address non-tariff barriers, including SPS barriers, was a priority for these
countries. Central American countries considered that certain US SPS measures had
prevented them from obtaining the full benefit of CBI preferences. For example, fruit
9

flies in Central America have prevented the export of fruits and vegetables to the United
States without costly treatment.
Many US exporters had likewise complained about the application of SPS measures in
CAFTA-DR countries. Some US producers had pointed to lengthy, complex and in some
cases arbitrary processes of SPS approval; costly local testing requirements, temporary
bans on exports of beef and poultry products, and the use of sanitary certificates as an
import licensing device for meat and dairy products.11
This negotiation differed from the US-Chile FTA and the US-Australia FTA, in that the
Central American partners enjoyed a relatively poor SPS infrastructure. A study by
researchers from the Texas A&M University on the phytosanitary capacity needs of
Central American nations indicated, among other findings, that most of these countries
lacked a sufficient number of employees and appropriate laboratories for inspection
services. 12 Since SPS infrastructure deficiencies limited the ability of CAFTA-DR
countries to gain market access, the United States pledged technical assistance from US
sanitary and agriculture agencies. According to the USTR, “the objective [of SPS
11 See sections on “Costa Rica”, “El Salvador”, “Guatemala”, “Honduras”, “Nicaragua”, and “Dominican Republic” in USTR’s publication 2005 National Trade Estimate on Foreign Barriers. 12 Alford, J. Et al. “CAFTA: Sanitary and Phytosanitary Evaluation.” Available on-line at http://bush.tamu.edu/content/programs/mpsa/program/capstone/projects/CAFTA_Report.pdf
10

negotiations] was to leverage the impetus of active trade negotiations to seek difficult
changes to the Central American countries’ SPS regimes.”13
A parallel working group on SPS measures was established during the negotiations of
CAFTA14 to exchange views on outstanding SPS issues and improve market access for
all parties. Several achievements were reported by the USTR:
• The United States obtained a commitment from the Central American nations to
resolve specific measures affecting US exports to those countries.
• Central American countries pledged to move towards recognizing import
eligibility for all producing plants inspected under US safety and inspection
system, in particular for meat, dairy, and poultry products.
• The United States committed to resolve delays in food inspection procedures for
meat and poultry products from Central America.
• The United States presented a schedule for the resolution of sanitary issues that
affect the export of poultry, dairy products, tomatoes and peppers from Honduras.
• Nicaragua received help solving SPS problems for exports of cheese, papaya,
pitahaya, peppers, and tomatoes.
• Costa Rica obtained guaranteed access of ornamental plants over eighteen inches
in height, more flexible sanitary treatment for some of its flower exports, and
recognition of its poultry inspection system.
13 USTR, “Costa Rica”, “El Salvador”, “Guatemala”, “Honduras”, and “Nicaragua”. 2005 National Trade Estimate on Foreign Barriers. 14 Dominican Republic did not participate in this groups because it negotiated separately with the United States.
11

The CAFTA-DR agreement reaffirms the rights and obligations under the WTO SPS
Agreement. No country will have recourse to the dispute settlement under the CAFTA
agreement for any matter arising under Chapter 6 (SPS Measures).
Article 3 of Chapter 6 of the agreement also establishes an SPS Committee that will
continue the work of the ad hoc working group. The SPS Committee provides a forum
for technical discussion on the application of SPS measures in each country. It reviews
progress on outstanding SPS issues and provides an avenue for consultation on SPS
regulatory processes. The CAFTA-DR SPS Committee is instructed to help each party
implement the SPS agreement and assist each party to protect human, animal, or plant life
or health.15
Another unique feature of CAFTA-DR’s SPS Committee is the requirement to facilitate a
Party’s response to a written request for information (from another party) with minimal
delay. Other provisions in the CFTA-DR SPS Committee are nearly identical to those in
the US-Chile FTA, with the exception that CAFTA-DR SPS Committee’s decisions will
be taken by consensus (a feature necessitated by the presence of representatives from 5
Central American countries, the Dominican Republic and the United States in the
committee). Also, unlike the US-Chile FTA, Annex 6.3 of CAFTA lists the agencies of
each party that will participate in the Committee.
15 SPS Committees under US-Chile FTA and US-Australia FTA include objectives geared to “enhance each party’s implementation” of the SPS agreement. The language is stronger in the case of CAFTA, reflecting the greater need of support in Central America. Also, the SPS Committees under US-Chile FTA and US-Australia FTA are not instructed to “assist parties to protect”, but rather just to “protect” human, animal, or plant life or health.
12

US-Morocco FTA
SPS issues did not play a significant role in negotiations between the United States and
Morocco. The agreement does not include a chapter on SPS measures and treats the
subject in three short articles. The provisions are general in nature, including a
reaffirmation of existing rights and obligations under the WTO SPS Agreement and the
absence of recourse to dispute settlement under the US-Morocco FTA for SPS issues.
The parties “affirm their desire” to provide a forum for addressing SPS, but the
agreement does establish a SPS Committee. According to the APHIS Trade Support
Team, given the lack of SPS issues and the relatively small volume of bilateral
agricultural trade, “the US strategy was to reaffirm the commitments under the WTO SPS
agreement.” Still, in side letters between Moroccan and US officials, Morocco pledged to
accept US export certificates issued by USDA FSIS for beef and poultry products.
In the negotiations, Morocco attempted to obtain commitments on technical assistance
and market access, but the United States was not responsive. According to APHIS “By
initially expecting too much and then failing to scale back expectations to more realistic
parameters, Morocco may have lost some genuine opportunities for receiving US
technical assistance”.16 On market access, Morocco expected APHIS approval of some
16 Morocco had sought a US commitment to upgrade Morocco’s entire plant and animal health infrastructure. The US authorities pointed out that Morocco failed to prioritize their needs, demonstrate how that assistance would facilitate trade, or explain how that assistance could be coordinated with technical cooperation from the European Union. See APHIS Trade Support Team, Technical Trade Report. July 2004
13
plant products for entry in the United States. The United States refused to circumvent
normal procedural channels and deemed the request as “not appropriate for FTA
negotiations”.17 Perhaps as a consolation, a subcommittee for discussion of SPS matters
was established in a side letter. Even here, the United States agreed reluctantly. Given the
“lack of substantive issues on both sides,” the forum will convene only on an as-needed
basis.
US-EU Veterinary Agreement
Early efforts to tackle outstanding SPS matters preceded the US-EU Veterinary
Agreement. The US-European Community Agreement on Meat Inspection Standards of
November 1992 touched upon some of the issues that later were revisited in the US-EU
Veterinary Agreement. Through the 1992 agreement, the parties agreed: to recognize the
equivalence of regulatory requirements with respect to trade in fresh bovine and swine
meat; to consider the possibility of approving plants certified by the other party’s
responsible authority; and to initiate discussions as soon as possible on other problems in
the veterinary field.
The US-EU Veterinary Agreement entered into force in August 1999. Under the
agreement, the parties reaffirmed their multilateral obligations. The scope of the 1999
agreement was limited to sanitary measures applied to the live animals and animal
products listed in Annex I. For these products, the agreement includes provisions with
regard to equivalency determination on health requirements, consultations, exchange of
17 APHIS Trade Support Team, Technical Trade Report. July 2004
14

information, notification on disease developments, scientific exchange, verification and
audit.
Article 6 of the Veterinary Agreement recognizes of the principle of regionalization.
Specifically, the importing party recognizes for trade purposes the health status of regions
as determined by the exporting party.18 However, this provision applies only with respect
to the animal and aquaculture diseases specified in Annex III. BSE (Mad cow disease) is
not listed in Annex III.19
Annex V lists the live animals and animal product areas, sectors, or parts of sectors, and
sets forth the status of consultations regarding the recognition of equivalency of a party’s
sanitary measures and the applicable trade conditions.
The Veterinary Agreement establishes a Joint Management Committee. At least once a
year, the Committee reviews activities under the agreement and recommends changes to
the annexes. The Parties agree to establish technical working groups to identify and
address technical and scientific issues arising from the Agreement.
18 In its most recent “Annual Report on Barriers to Trade and Investment in the United States”, the EU Commission argues “the United States has failed repeatedly to apply the regionalisation provisions of the Veterinary Agreement”. 19 The list of diseases for which regional designation is recognised includes: Foot and mouth disease, Swine vesicular disease, Peste de petits ruminants, Contagious caprine pleuropneumonia, Sheep and goat pox, African swine fever, Enterovirus encephalomyelitis, Newcastle disease, Pseudorabies/Aujeszky’s disease, Vesicular stomatitis, Rinderpest, Contagious bovine pleuropneumonia, Bluetongue, African horse sickness, Classical swine fever, Fowl plague (avian influenza), Venezuelan equine encephalomyelitis.
15
At a meeting in October 2003, the Joint Management Committee issued a
recommendation concerning the determination of equivalence for gelatin and collagen for
human consumption. As a result of this recommendation, the United States and the
European Union agreed to amend Annex V to the Agreement to incorporate these new
equivalences.
It is worth pointing out that the European Union and the United States have used other
channels to deal with outstanding SPS issues. For example, in 2002, the resumption of
exports of Spanish clementines to the United States and the resumption of US poultry
exports to the European Union were resolved within the context of the Positive Economic
Agenda Initiative. Yet the European Union still lists 10 US SPS measures as “non-tariff
barriers”.20
SPS Matters in Memorandums of Understanding (MOUs)
To date the United States has signed six MOUs that include SPS provisions: Argentina,21
China, Colombia, Peru, Russia, and Uruguay.22 With the exception of the Argentinian
20 These are: Plants in Growing Media; Bovine animals and products; Pathogen-free Areas; Hardy Nursery Stock ; Goats/Risk of Scrapie; Non-Comminglement; Uncooked Meat Products; Inspection of Egg Production; Columbia- Meat/On-site Inspection; meat and meat products. More information at: http://mkaccdb.eu.int/cgi-bin/stb/mkstb.pl#nontarbarr. 21 The Memorandum of Understanding between the United States and Argentina was signed within the framework of the Uruguay Round of Multilateral Trade Negotiations and is significantly different from other MOUs. 22 In all cases, the timing of the MOUs was linked to broader trade issues. Signatures on MOUs with Colombia and Peru (April 2003 and October 2002) correspond to the launching of FTA negotiations with the United States. Uruguay has repeatedly made public its desire to engage in FTA negotiations with the United States, but other commitments, notably its membership in MERCOSUR, have limited the US interest.
16

MOU, the MOUs establish bilateral Consultative Committees on Agriculture that provide
a forum for resolving trade issues and cooperating in a number of areas, including food
safety, animal and plant health, and biotechnology.
Article IV of the US-China MOU, signed before China’s accession to the WTO, calls for
science-based SPS requirements administered in a non-discriminatory manner. The MOU
also calls for continuous scientific and technical consultations concerning scientifically
unjustified SPS restrictions. In 2004, Chinese and US authorities exchanged letters of
intent where they pledged to “further enhance” their technical exchanges and long-term
cooperation in the field of food safety and animal and plant health. The letters establish a
consultative mechanism to “demonstrate their strong commitment to work cooperatively
to address outstanding bilateral SPS issues in accordance with each country’s domestic
rules and regulations.”
The MOUs with Peru, Colombia and Uruguay, do not include a reaffirmation of WTO
commitments, but they do establish Consultative Committees on Agriculture (CCA).
Former Secretary of Agriculture Ann Veneman stated that these CCAs “set the stage for
improved communication and coordination in a number of areas including food safety,
research and sanitary and phytosanitary issues."
Following President Jorge Batlle's February 2002 visit to the White House, however, the United States and Uruguay established a Joint Commission on Trade and Investment. The Commission has pursued a work plan and the MOU on Agriculture dates from April 2003, while a Bilateral Investment Treaty was concluded in September 2004. The US MOUs with China and Russia date from periods when neither country was a WTO member (October 1992 and September 2003), but both were engaged in WTO accession.
17
B. SPS Measures in Swiss Trade Agreements
SPS Issues in the Swiss-EU Agricultural Agreement
The Swiss-EU Agricultural Agreement (June 2002) aims to facilitate trade in farm
products by eliminating tariff and non-tariff barriers. The agreement addresses SPS issues
in Annex 4 on plant health, Annex 5 on feed, Annex 6 on seeds, and in Annex 11 on
animal health.23 With the exception of Annex 5 that it is still under negotiation, all of
these annexes go to great lengths in establishing the equivalence of EU and Swiss SPS
regulations. According to the Swiss Integration Office (DFA/ DEA), “The agreement will
reduce or eliminate altogether a number of technical barriers in the veterinary bracket
(dairy hygiene, epizootic diseases) and in relation to pesticides, animal feeds, seeds,
biological products and rules for the sale of wines, generally on the basis of arrangements
which arise out of the mutual recognition of the equivalence of each other's legislation.”24
In this Appendix we focus our discussion on Annexes 4 and 11.
Annex 4, Plant Health. Annex 4 recognizes the equivalence of protection levels
resulting from domestic legislation on the introduction and propagation of harmful
organisms. The equivalence, however, applies only to those plants and plant products
listed in Appendix 1 of the Agreement. For these products, the parties recognize the
“plant passports” issued by responsible organizations in each country. Such passports
23 Additionally, Annexes 5, 6, 9, 10 recognize legislative equivalence and eliminate border conformity checks for certain animal feed, seeds, organic products, and fruits and vegetables. However, these annexes deal more directly with standards rather than SPS measures. 24 Integration Office. “Bilateral Agreements I Switzerland – European Union of 1999. Fact Sheets”. Available on-line at: http://www.europa.admin.ch/ba/expl/factsheets/e/fs_ba_I_05.pdf
18

attest conformity with those pieces of domestic legislation deemed equivalent under the
agreement, and fulfill the documentary requirements for movement of plants and plant
products laid down in the Agreement. The annex also limits border checks: plant health
sampling may not exceed certain percentages of consignments of plants and plant
products.25
Annex 4 requires countries to inform other parties of any proposal to adopt new plant-
health measures with respect to plants and plant products listed in the agreement.
Countries can apply derogations with respect to regions or the entire territory of other
parties, so long as they indicate their reasons. Derogations may be applied immediately,
but parties must engage in consultations with a view to finding appropriate solutions.
Finally, Annex 4 establishes a Working Group on Plant Health that will consider all
matters that may arise in connection with the Annex and its implementation. The
Working Group may submit proposals to update Appendices to the Agricultural
Committee.
Annex 11, Veterinary Annex. Also known as the Veterinary Agreement, the Veterinary
Agreement regulates trade in live animals and animal products such as semen, embryos,
foods of animal origin, and animal waste. The Veterinary Agreement establishes that
Swiss animal disease control legislation is identical in substance and achieves the same
25 The agreement establishes a maximum sampling limit at 10 percent of consignments. Moreover, the percentage will be set on product-by-product basis in accordance with plant-health risk determined by the Agricultural Committee based on proposals from the Working Group on Plant Health.
19

objectives as the corresponding EU legislation; consequently, the Veterinary Agreement
grants Switzerland similar trading conditions with the European Union as enjoyed by EU
member states.
The agreement stipulates neither border checking of products nor of animals, but it allows
border inspection of accompanying documents to ensure compliance with animal
protection legislation. Still, the simplification of border checks will not entail the
elimination of product inspections. They will just be done away from the border.
According to the Swiss Federal Veterinary Office, “unavoidably, to maintain the health
of the animal population at its current high level, more checks will have to be conducted
within the country (as practiced in EU member states)”.
With regard to live animals, semen and embryos, the parties recognize that certain
products and animals of each party are free of specific diseases. For example,
Switzerland obtained guarantees on the status of pigs (Aujeszky’s disease), cattle
(Brucellosis, tuberculosis, and IBR/IPV), sheep and goats (Brucellosis), and poultry and
hatching eggs (“not vaccinating” against ND). Since June 2003, Switzerland has
requested the extension of guarantees to include other diseases that are not found in
Switzerland; however, “the European Union categorically refuses any extension of
guarantees.”26 The Veterinary Agreement prevents countries from placing embargoes on
imports of animals without a good reason. Outbreaks of disease are, however, a good
reason.
26Jemmi, T. and Herholz, C. “Bilateral Veterinary Agreement between Switzerland and the EU”. FVO Magazine, issues 4-5, 2003.
20

Concerning foods of animal origin, the European Union recognized only the Swiss
legislation on milk and dairy products as equivalent to its corresponding legislation. The
easing of restrictions on exports for other food products of animal origin will require the
harmonization of the Swiss Ordinance on Foodstuffs with the corresponding EU
legislation. In late 2003, the Swiss Federal Veterinary Office stated that it began efforts to
tackle these pending issues, and it was preparing a proposal for discussion in the Joint
Committee.
The Joint Committee oversees the application and functioning of the bilateral Swiss-EU
agreements as well as the Veterinary Appendix. To date, three working groups have been
established: The Animal Health Working Group (dealing with issues regarding the
certificates used in cross border trade); the Working Group for Animal Movement
(dealing with matters related to the simplification of border checks); and the Bovine
Spongiform Encephalopathy - BSE Working Group (analyzing alternatives so as to lift
the ban on imports of Swiss cattle). In the BSE Working Group, a draft text was drawn
up proposing the adoption of EU regulations. At the end of 2003, the EU Council of
Agricultural Ministers recognized the equivalence of Swiss regulations regarding BSE,
allowing the resumption of exports of Swiss cows to the European Union.
SPS Issues and Recent Swiss/EFTA’s Bilateral FTAs
Recent bilateral FTAs negotiated by EFTA include, for the most part, rather weak
approaches to tackling SPS matters. This may reflect the absence of outstanding SPS
21

issues and the small volumes of bilateral agricultural trade. Also, agricultural
liberalization has not been a high concern for Switzerland in bilateral FTAs, as evidenced
by the low wedge between applied preferential and MFN tariff rates.
Many recent EFTA FTA agreements include commitments to apply SPS regulations in a
non-discriminatory fashion and prevent the implementation of new measures that may
have the effect of “unduly obstructing trade”. The EFTA-Jordan FTA, EFTA-Macedonia
FTA, EFTA Morocco FTA, EFTA-Palestine Authority FTA, and EFTA-Romania FTA
limit their treatment of SPS matter to these provisions. The EFTA-Croatia FTA, EFTA-
Lebanon FTA, and EFTA-Singapore FTA include an additional provision that reaffirm
obligations under the WTO SPS Agreement. The EFTA-Mexico FTA and EFTA-Tunisia
FTA only reaffirm rights and obligations under the WTO SPS Agreement. Among
bilateral FTAs, only the EFTA-Chile FTA stands out in that it treats SPS issues to a
greater length than the other agreements.
The FTA agreement between EFTA and Chile goes beyond the other agreements as the
parties pledge to strengthen their cooperation in the field of SPS measures with a view
towards increasing the mutual understanding of their respective systems. Expert
consultations may be convened at the request of a party. Parties shall designate and
exchange “contact points”. Finally, the agreement calls for the development of bilateral
arrangements between respective regulatory agencies for better implementation of the
SPS provisions under the agreement.
22

THE SHAPE OF A FREE TRADE AGREEMENT BETWEEN SWITZERLAND AND THE UNITED STATES
Appendix C
GI Provisions in US and Swiss Trade Agreements
A. GI Provisions in Selected US FTAs
US-Australia FTA1
According to Article 17.2 of the agreement, titled “Trademarks, including geographical
indications”, each Party will provide that geographical indications are eligible for
protection as trademarks. Article 17.2 also provides that grounds for refusing an
application for protection or recognition of a geographical indication include the
following:
(A) The geographical indication is likely to cause confusion with a mark
[trademark] that is the subject of a good-faith pending application or registration;
and
(B) The geographical indication is likely to cause confusion with a preexisting
mark [trademark], the rights to which have been acquired through use in good
faith in the territory of the Party.
1 The US Free Trade Agreement Implementation Act 2004, passed by the Australian Parliament amends the Australian Wine and Brandy Corporation Act 1980 but does not amend the Trade Marks Act 1995. The Australian Wine and Brandy Corporation Act 1980 (AWBC) protects the names of Australian grape growing regions. For more information http://www.freehills.com.au/publications/publications_1283.asp
1

In the event a refusal is made, the parties will provide the applicant a written
communication of the reasons for the refusal, and allow the applicant the opportunity to
respond. Interested parties must also have the opportunity to oppose registration or seek
cancellation after registration.
US-Chile FTA
The US-Chile FTA also treats geographical indications as trademarks. To qualify for this
treatment, GIs must satisfy the same conditions that apply in the US-Australia FTA.
Chile specifically recognizes Bourbon Whiskey and Tennessee Whiskey as distinctive
products of the State of Tennessee. Accordingly, Chile will not permit the sale of any
product as Bourbon Whiskey or Tennessee Whiskey, unless it has been manufactured in
the United States in accordance with the laws and regulations of the United States
governing the manufacture of Bourbon Whiskey and Tennessee Whiskey.
The United States recognizes Pisco Chileno (Chilean Pisco), Pajarete, and Vino
Asoleado, which are authorized in Chile to be produced only in Chile, as distinctive
products of Chile. Accordingly, the United States will not permit the sale of any product
as Pisco Chileno (Chilean Pisco), Pajarete, or Vino Asoleado, unless it has been
manufactured in Chile in accordance with the laws and regulations of Chile governing the
manufacture of Pisco, Pajarete, and Vino Asoleado.
The US-Chile FTA applies the principle of "first-in-time, first-in-right" to trademarks and
geographical indications. This means that the first to file for a trademark is granted the
first right to use that name, phrase or geographical place-name.
2

CAFTA-DR
The agreement uses a similar definition as to the US-Australia FTA and the US-Chile
FTA. However, it expands on “Procedures with Respect to Geographical Indications”.
Each party will provide the legal means to identify and protect geographical indications
and will provide the means for persons of another party to apply for protection or petition
for recognition of geographical indications. Countries commit to limit the formalities on
the application procedure and to publicize GI petitions. Each party will ensure that
similarities between a geographical indication and a pre-exiting trademark constitute
grounds for refusing protection or recognition of a geographical indication. The US-
Morocco FTA has similar language.
US-European Community Distilled Spirits and Spirit Drink Agreement
This agreement was based on an exchange of letters between the United States and the
European Union in March 1994. This agreement provides for the mutual recognition of
distilled spirits. The key provisions are as follows:
“The USA agrees to restrict, within its regulatory framework (27 CFR 5.22 or an
equivalent successor regulation), the use of the product designations: "Scotch
whisky", "Irish whiskey"/"Irish whisky", "Cognac", "Armagnac", "Calvados" and
"Brandy de Jerez" to distilled spirits/spirit drinks products of the Member States
of the European Community, produced in compliance with Council Regulation
(EEC) No 1 576/89 and with the laws of the Member States in which those
products originate. Further, it is recognized that these products shall continue to
3

be subject to all of the labeling requirements of the USA.”
“The European Community agrees to restrict, within its regulatory framework
(Council Regulation (EEC) No 1 576/89, Article 11 or an equivalent successor
regulation), the use of the product designations: "Tennessee whisky"/"Tennessee
whiskey", "Bourbon whisky"/"Bourbon whiskey" and "Bourbon" as a designation
for Bourbon whisk(e)y to distilled spirits/spirit drinks products of the United
States produced in compliance with US laws and regulations (27 CFR 5.22 or an
equivalent successor regulation). Further, it is recognized that these whiskies shall
continue to be subject to all of the labeling requirements of the European Union.”
B. GI Provisions in Selected Swiss FTA
EFTA-Israel
The agreement was signed in September 1992. Article 1 of Annex V, titled definition and
scope of protection, states that intellectual property protection includes protection of
geographical indications. Article 3 of that same Annex, titled additional substantive
standards, affirms that “the Parties shall ensure in their national laws at least adequate
and effective legal means to protect geographical indications, including appellations of
origin, with regard to all products, at least to the extent that their use is misleading the
public.” The EFTA-Romania FTA, signed in December 1992, includes similar text.
4
EFTA-Bulgaria
The agreement was signed in March 1993. The agreement’s original provisions on
intellectual property rights were revised by Decision of the Joint Meeting of the EFTA-
Bulgaria Committee No. 7 of 1997. Article 1 of Annex X, on the definition and scope of
protection, states that intellectual property protection comprises protection of
geographical indications, including appellations of origin. Article 3 of Annex X, titled
additional substantive standards, states that parties to the agreement “shall ensure in their
national laws at least adequate and effective means to protect geographical indications,
including appellations of origin, with regard to all products and services.” Other
Agreements with similar text include EFTA-Croatia (2001); EFTA-Jordan (2001); EFTA-
Macedonia (2000), EFTA-Morocco (1997), EFTA-Turkey (1991).
EFTA-Mexico
The agreement was signed in November 2000. Provisions under Article 1, definition and
scope of protection, are similar to those of EFTA-Bulgaria, Article 3 of Annex XXI, on
additional substantive standards. However, the EFTA-Mexico language differs from
EFTA-Bulgaria in stating that “A Party shall, ex officio, if its legislation so permits, or at
the request of an interested party, refuse or invalidate the registration of a trademark
which contains or consists of a geographical indication with respect to services not
originating in or connected to the territory indicated, if use of the indication in the
trademark for such services in that Party is of such a nature so as to mislead the public as
to the true place of origin.”
5
Swiss-EU Agricultural Agreement
The Agreement on trade in agricultural products between Switzerland and the European
Union was signed in June 1999, and entered into force in June 2002. According to the
Joint Declaration on the protection of geographical indications and designations of origin
of agricultural products and foodstuffs (Appendix D), the Parties will provide for the
incorporation of provisions on the mutual protection of protected Denominations of
Origin (PDOs) and protected geographical indicators (PGIs).
In July 2003, Switzerland and the European Union established of a working group on the
protection of geographical indications. Work on mutual protection provisions awaits the
full application of Article 17 (simplified procedure) of Regulation (EEC) No 2081/92.
Meanwhile, the European Union proposed that a Working Group be set up, on an
exploratory basis, for the purposes of: the mutual protection of PDOs and PGIs; the
consideration of all related matters; and the exchange of the information required to
implement this protection. Also, two working groups were formed, one for wines and the
other for distilled spirits.
EFTA-Singapore
The agreement was signed in June of 2003. Article 1 of Annex XII, titled definition and
scope of protection, goes beyond previous agreements in clarifying that “Appellations of
origin are understood to be one form of geographical indications”. Paragraph 1 of Article
5 in Annex XXI, on the issue of geographical indications, affirms the same principles as
Article 3 of Annex X of EFTA-Bulgaria; however, paragraph 2 further states that “the
Parties may provide different legal means in accordance to the TRIPS Agreement to
6
prevent the misleading use of geographical indications in relation to services than that
provided for the protection of geographical indications for products and shall be deemed
to be in full compliance with the obligations under paragraph 1.”
EFTA- Chile
The agreement was signed in signed June 2003. This agreement uses the same definition
of intellectual property rights as previous agreements, such as EFTA-Bulgaria. However
Article 6 of Annex XII, on geographical indications, reaffirms the commitment of the
parties to ensuring protection in accordance with Articles 22, 23 and 24 of the TRIPS
Agreement. The EFTA-Tunisia FTA, signed in December of 2004, includes similar
provisions.
EFTA-Lebanon
The agreement was signed in signed June 2004. This agreement uses similar language on
intellectual property rights as previous agreements, such as EFTA-Bulgaria. However
Article 6 of Annex XII, on geographical indications, also affirms “Lebanon shall make
every effort to protect geographical indications with regard to all services.”
7
Appendix D
Preferential Trade Agreements and Foreign Direct Investment: Selected Literature
The connection between trade and foreign direct investment (FDI) has been widely
studied in the last two decades.1 To cite some examples, Lipsey and Blomström (1987)
examined the relation between US and Swedish FDI and trade, while Blomström and
Kokko (1997) and Dunning (1997, 2000) published articles with a comparative
perspective. Brainard (1997) has offered methodological contributions.2 Recent
empirical studies by Hejazi and Safarian (1999) and Graham and Wada (in Graham 2000)
find complementary relationships between exports and the stock of outward foreign
direct investment.3
Within this general topic, the relationship between preferential trade agreements (PTAs,
an umbrella term that includes FTAs), trade volumes, and FDI has attracted attention in
policy circles. Theoretical analysis has been inconclusive, because arguments can be
advanced for both positive and negative relations between trade and FDI. In principle,
the impact of trade liberalization on FDI depend crucially on whether FDI is a substitute
or complement to trade. In this appendix, we report the results of selected gravity models.
The numerical coefficients are summarized in table D.1. Many studies find a positive
relation between PTAs and the inward stock of FDI, both for PTA partners and for third 1 Earlier studies exist, but they were not based on gravity models. 2 For example, Brainard contends that it makes more sense to examine foreign production by multinational enterprises rather than FDI. 3 Dunning (1993) and Safarian and Hejazi (1999 and 2001) review the empirical literature.
2
countries. Perhaps the most skeptical comment comes from the US International Trade
Commission (USITC 2005) which concludes, “The investment provisions of the covered
FTAs are not expected to yield large changes in total foreign direct investment between
the United States and its FTA partners”.4
A. Studies Covering All Countries
Using a data set that reflects the experience of 20 FDI source countries (OECD members)
investing in 60 host countries from 1982 through 1999, Levy-Yeyati, Stein, and Daude
(2003) find that, when countries join an FTA, on average the bilateral FDI stock between
the members increases by about 24 percent. The size of the “extended market” of the
host country (i.e., adding the GDP figures for the FTA partners) has a positive effect on
the bilateral FDI stock attracted from the source country. The elasticity of the bilateral
FDI stock with respect to the size of the “extended market” of the host country is about
0.1.
Adams, Dee, Gali, and Mc Guire (2003) examined a sample of 116 countries over the
period 1988-97. They create dummies to capture separately the effect of “traditional
market access” provisions and “third wave provisions” (investment, government
procurement, services, etc.). They also create dummies to separate the effect of inward
FDI stock from PTA partners and from third countries (see table D.1). They find that
market access provisions are not statistically significant, but that third wave provisions
are significant, for both FDI stocks from within the PTA and from outside the area. For
4 The USITC also concludes that: “in specific sectors, however, the covered FTAs may generate new outbound U.S. investment.”

3
example, the third wave provisions of NAFTA are correlated with a 10 percent decrease
in intra-regional FDI, but an almost 5 percent increase in inward FDI stock from external
countries. Third wave provisions in the European Union are associated with a 3 percent
increase in inward FDI stock from external countries; the effect of MERCOSUR is much
larger, a 32 percent increase. However, EFTA is associated with a 41 percent decrease in
inward FDI stock from external countries, (perhaps because non-EFTA investors chose
the EU rather than EFTA).
Jaumotte (2004) reports on a sample of 71 developing countries over the period 1980-
1999, mostly South-South integration initiatives. She finds that a 1.0 percent increase in
the regional market size (i.e., adding the markets of both partners) is correlated with 0.4
percent increase in the stock of FDI in each party to the agreement. The result reflects a
more general finding about FDI, namely that it favors large markets, measured by GDP
(see, for example, Graham 2000).
B. Studies Covering NAFTA Partners
Globerman and Shapiro (1999) evaluate Canadian FDI using annual data for FDI stock
(book value) and disaggregated by sector, over the period 1950-1995. They find that the
CUSFTA/NAFTA dummy variable is correlated with greater Canadian outward direct
investment in all sectors (manufacturing, services, and energy). The authors also

4
conclude that the CUSFTA/NAFTA was not associated with net foreign investment in
Canada, although they highlight a trade-induced increase in FDI in manufacturing.5
Hejazi and Safarian (2002) indicate that “NAFTA has resulted in reduced Canadian
inward FDI and increased Canadian outward FDI, both to the United States and especially
beyond.” They find that the NAFTA dummy variable is correlated with a 17 percent
decrease in inward FDI stock to Canada and an almost 34 percent increase in Canadian
outward FDI stock.
By contrast, Buckley, Clegg, Forsans and Reilly (2005) find that “the introduction of the
free trade agreements between Canada and the USA increased the responsiveness of US
investors to growth in the Canadian economy by a factor of two.” In a 2000 working
paper, the same authors found that an increase in a compound variable that measures both
the size of the US GDP and the existence (or not) of a free trade agreement between
Canada and the United States is correlated with a larger non-NAFTA partner FDI stocks
placed in Canada. For example, a 1.0 percent increase in the compound variable is
associated with a 0.04 percent increase in the French FDI stock placed in Canada and a
0.01 percent increase in the US stock.
5 The authors however do not conclude that CUSFTA/NAFTA caused a net outflow of capital, since, “The direct investment data for Canada indicate that (in the post-1989 period) Canadian outward direct investment increased especially for destinations other than the United States.” Among other forces, they point to integration in the European Union as a “pull-factor”.

5
Hallward-Driemeier (2003) examined the relationship between bilateral investment
treaties (BITS) and FDI flows. Her data set covers bilateral outflows from 20 OECD
countries to 31 developing countries during the period 1980 to 2000. She finds a non-
significant negative correlation between BITS and flows.6 Interestingly, however, she
found that NAFTA did increase FDI flows to Mexico. The NAFTA dummy is correlated
with an increase in the level of FDI flows from OECD countries into Mexico.
C. Exports and FDI: Complements not Substitutes
Finally, it is worth reporting the analysis by Graham and Wada (in Graham 2000) of the
connection between US exports and US FDI stocks placed in host countries with different
income levels. Among other host countries, they examined the experience of some 19
high-income countries over the period 1983 to 1996. They found that US FDI and US
exports complement one another: on average, a 1.0 percent increase in the US outward
FDI stock was associated with a 0.6 percent increase in US manufactured exports to the
host country.
Hejazi and Safarian (1999) also confirm the complementary relationship between exports
and FDI for Canada. They found that a 1.0 percent increase in the Canadian outward FDI
stock was correlated with a 0.7 percent increase in Canadian exports. They also find that
6 Dee and Gali (2003) reach the same conclusion in their analysis of the relationship between BITS and FDI.

6
higher levels of inward FDI stock increase imports into Canada (but that the size of the
import associations is only one-third the size of the export association).7
7 The study also analyzes the relationship at sector level. They authors find that the relationship between exports and the outward FDI stock is positive for 9 sectors and negative for 4 sectors.

Table D.1 Relationship Between PTAs, FDI and Exports
PTAs and FDI: Studies Covering All Countries
Adams, Dee, Gali, Mc Guire (2003)Dependent Variable: LN (Inward FDI Stock ijt)Selected Independent Variables
ASEAN APEC EFTA EU NAFTAMRTA ij
a 5.77 -1.11 0.05 -0.69 na3wave ij
b -9.65 0.71 *** 30.77 * 0.05 -10.11 **MRTA ij*
a -0.02 0.04 1.15 0.37 -2.603wave ij*
b 4.05 0.68 *** -41.56 *** 3.18 ** 4.9 ***
Levy-Yeyati, Stein and Daude (2003)Dependent Variable: LN (Inward FDI Stock ijt +1)Selected Independent VariablesLN (EMit)
c 0.10 ***LN (EMjt)
d -0.05 ***Same FTA ijt
e 0.24 ***
Jaumotte (2004)Dependent Variable: LN (Inward FDI Stock ijt)Selected Independent VariableLN (REGY) f 0.40 **
Hallward-Driemeier (2003)Dependent Variable: FDI inflowsijt
Selected Independent VariablesNAFTA dummy: 256.31 **
PTAs and FDI: Studies Covering NAFTA Partners
Buckley, Clegg, Forsans and Reilly (2000)Dependent Variable: LN (Inward Canadian FDI Stock from UK, France and US)Selected Independent Variables
UK France USLN (USGDP*FTAdummy) 0.01 ** 0.04 ** 0.01 **

Globerman and Shapiro (1999)Dependent Variable: FDI Stock in CanadaSelected Independent Variables
Mfg Services Energy Mfg Services EnergyFTA/NAFTAdummy -16.4 -380.6 *** -204.7 1676.8 *** 860.6 *** 709.50 **
Hejazi and Safarian (2002)Dependent Variable: LN (Inward Canadian FDI Stock jt)Selected Independent VariablesNAFTA dummy: -0.17 *
Dependent Variable: LN (Outward FDI Stock from Canada jt)Selected Independent VariablesNAFTA dummy: 0.34 **
Exports and FDI: Complements not Substitutes
Graham and Wada (Graham 2000)Dependent Variable: LN (Outward US FDI Stock ijt)Selected Independent Variables
Low Income High IncomeLN (Importsijt) 0.79 * -0.39 **LN (Exportsijt) 1.3 * 1.59 **
Hejazi and Safarian (1999)g
Dependent Variable: LN (Canadian Imports ijt)Selected Independent VariableLN (Inward Canadian FD 0.02
Dependent Variable: LN (Exports ijt)Selected Independent VariablesLN (Outward Canadian 0.07 ***
Notes*** denotes the significance at the 1% level; ** denotes the significance at the 5% level; and * denotes the significance at the 10% level.a. MRTA: is an index capturing the merchandise trade provisions of a PTA, that takes the value of the Member Liberalization Index (MLI) if both countries i and j belong to the same PTA and otherwise MRTAij* means that country J* does not belong to the PTA.b. 3wave is an index capturing the ‘new age’ provisions of a PTA, that takes the value of the non-merchandise MLI if both countries i and j belong to the same PTA and 0 otherwise. 3waveij* means that country J* does not belong to the PTA.c. EMit is the logarithm of the joint GDP of all the countries to which the host has tariff-free access due to common membership in an FTA (includes the host’s own GDP as well).d. EMjt is the logarithm of the joint GDP of the source country plus all the countries that are FTA partners of the source country.e. Same FTA is a dummy that takes a value of 1 when the source and the host countries belong to the same free trade area.f. REGY denotes the market size extended to include the regional market size for all countries belonging to a regional trade agreement. g. Hejazi and Safarian (1999) also model the relationship at sectoral level for 14 sectors of the Canadian economy.
Inward Outward
Appendix E
Technical Aspects of the Gravity and CGE Models
8.1 Aspects of the Gravity Model
A. Data set construction
As mentioned in Chapter 8, the gravity model analysis underlying this study is based on a
data set specially constructed by joining the elements of two large data sets developed by
other researchers. The first of these is the extensive gravity model data set developed by
Andrew Rose (2004). The Rose data set covers aggregate bilateral merchandise trade
between 178 countries from 1948 to 1999 (with gaps and excluding Taiwan and some
centrally planned economies), compiled from IMF Directions of Trade Statistics. The
bilateral trade figures in the Rose data set are averages of FOB export and CIF import
data in US dollars, deflated by the US consumer price index.
The Rose data set also includes the "core" and RTA explanatory variables discussed in
Chapter 8 and identified in tables 8.1 and 8.2.1 The core explanatory variables are drawn
from several standard sources, including the CIA World Factbook, IMF International
Financial Statistics, Penn World Table, and World Bank World Development Indicators.2
1 The Swiss-US trade integration and openness variables were compiled for the present study and added to the data set by the authors. 2 See http://www.cia.gov/cia/publications/factbook/index.html for CIA World Factbook, http://ifs.apdi.net/imf/about.asp for IMF International Financial Statistics, http://pwt.econ.upenn.edu for Penn World Table, and http://publications.worldbank.org/WDI for World Bank World Development Indicators.

2
To provide the Rose gravity model and data set with somewhat greater "analytical depth,"
the Rose data set was concorded with bilateral merchandise trade data at the 1-digit SITC
level, taken from the highly disaggregated bilateral trade data set compiled by Feenstra
and Lipsey (2005). The Feenstra-Lipsey data set covers bilateral trade data for 1962-
2000, organized by 4-digit SITC (revision 2) categories. In contrast to the Rose trade
data, world trade flows in the Feenstra-Lipsey data set are drawn from United Nations
(UN) data sources and are based primarily on reporter country import data (supplemented
as possible where import data gaps occur by reporter country export data). The Feenstra-
Lipsey data set covers a somewhat smaller number of trading countries than the Rose
data set, especially during the period 1984-2000, when bilateral trade of only 72 countries
is represented in the data set (but still accounting for 98 percent of world exports during
1996-2000).
For the present study, the Feenstra-Lipsey world trade data were aggregated to the 1-digit
SITC level by country pairs and deflated by the US consumer price index (1983=100).
After transforming these real trade flows to natural log-terms, they were finally integrated
with the Rose data using a concordance between the UN (Feenstra-Lipsey) country codes
and the IMF (Rose) country codes. In the process, account was taken for all reported
adjustments to the UN trade data by Feenstra and Lipsey, except the estimated
redistribution of value-added in trade between China and Hong Kong, separately reported
in Feenstra and Lipsey (2005). Lost in the process, however, were disaggregated trade
flows for the former Soviet bloc countries, some less developed countries, and Taiwan,

3
for which no UN (Feenstra-Lipsey) or IMF (Rose) country codes were available. The
separate UN country codes for former West Germany and present-day Germany were
merged in the Feenstra-Lipsey data set before integrating the two data sets, thus
preserving pre-1991 observations on the bilateral disaggregated trade of West Germany
(including with Switzerland). Appendix Table E.1 provides a description of the
regression variables included in the combined Feenstra-Lipsey and Rose data set.
B. Estimating techniques
As might be expected, the estimation of gravity models using cross-sectional time-series
data presents some complex and difficult problems in econometric methodology (Egger
2002, Hsiao 2003). Essentially, ordinary least squares (OLS) regression is unsatisfactory
because it does not admit possible unobserved effects related to the combinations of
commodities and pairs of trading countries in the data set. As a consequence, the analysis
reported in Chapter 8 utilizes a random-effects variant of the gravity model, using
generalized least squares (GLS) as the estimating technique. For a discussion of the
application of the GLS technique to a random-effects regression model, see Hsiao (2003).
An important assumption of the random-effects approach, embodied in the estimation
results reported in Chapter 8, is that the unobservable random-effects variable is
uncorrelated with the observed explanatory variables included in the regression equation.
C. Reservations about the APC results
Adams et al. (2003), colleagues at the Australia Productivity Commission (APC), report
negative RTA coefficients, using an analytic framework in the spirit of the gravity model

4
and a database that ends in 1997. Indeed, these authors at the claim to find net trade
diversion for 12 out of 16 recent PTAs. The 12 PTAs for which the authors claim net
trade diversion (see their table 4.3) include: AFTA, EFTA, EC/EU, Mercosur, NAFTA,
CER, EU-Switzerland, Chile-Colombia, Australia-PNG, Chile-Mercosur, EU-Egypt, and
EU-Poland. The 4 PTAs for which the authors claim net trade creation are: Andean Pact,
LAFTA/LAIA, US-Israel, and SPARTECA.
For several reasons, we do not subscribe to the APC findings. To begin with, their
technique for measuring net trade diversion is poorly explained or justified in the paper.
The APC authors add up their three RTA coefficients in a different manner (and often get
a different sign) than the methodological predecessor paper authored by Soloaga and
Winters (2001). The text description of the variables does not match up with the tables.
Nowhere in the APC paper is there a simple table showing the amount of trade created
between RTA members and diverted from non-members; we believe such a table might
cast considerable doubt on the estimated coefficients. Instead of deleting zero-trade
observations from the database (the customary procedure), the authors represent them in
a curious manner in the regression analysis, and this could bias the estimated coefficients.
The “dynamic” gravity model used by the APC authors – adding a time dimension to
annual observations – is not, to us, a persuasive alternative to the customary before-RTA
and after-RTA analysis.
8.2 Aspects of the Computable General Equilibrium Model
5
A. Overview
As mentioned in Chapter 8, our CGE model is the GTAP framework, a publicly available
model that is widely adopted. The GTAP model is a multi-region, multi-sector model
that assumes perfect competition and constant returns to scale. Bilateral trade is handled
via the Armington assumption, which treats goods from alternative sources as imperfect
substitutes. Import demand functions are separated by agent (sometimes called the Salter
specification).3 Production conditions are modeled using “nested” constant elasticity of
substitution (CES) functions,4 and intermediate goods are used in fixed proportions.5
Representative household demand takes into account changes in demand structures as
incomes rise.6 These and other aspects of the GTAP model are fully documented in
Hertel (1997) and the GTAP website at www.gtap.org. Recent surveys of the application
of CGE models to regional trade negotiations include Scollay and Gilbert (2000), Scollay
and Gilbert (2001) Gilbert and Wahl (2002), Robinson and Thierfelder (2002) and Lloyd
and MacLaren (2004).
B. Base data
The base data for the simulations is drawn from the GTAP6 database (final release), the
most complete dataset available. It represents the world economy as at 2001. The
database contains IO representations of individual economies, obtained from national
statistical agencies, international trade and income data from the UN COMTRADE
3 <Give an example> 4 <Short explanation please> 5 <Short explanation please> 6 Changes in demand structure are modeled by so-called “non-homothetic” demand functions.

6
database and the World Bank, respectively. The GTAP6 database improves significantly
on GTAP5 by incorporating new protection data from the AMAD and MACMAPS
databases. The latter feature bilateral tariffs, so regional trading agreements in place at
2001 are fully integrated. Full database documentation can be found in Dimaranan and
McDougall (2002).
C. Aggregation strategy
While the GTAP6 database features 87 regions and 57 sectors, it must be aggregated for
reasons of computational efficiency. The aggregation strategy we have chosen is given in
Table E.2. The approach taken was to rank the total exports of the United States and
Switzerland, and the bilateral exports of the two countries, and then use this ranking,
along with “natural” sectoral groupings to aggregate the data. A similar approach was
followed for regional aggregation, where care was also taken to include current US
partners within NAFTA, and also new and prospective FTA partners (Chile, Australia,
Singapore, Morocco, CAFTA, SACU, and Thailand).
D. Data adjustments
While agricultural protection data in GTAP6 is excellent, services protection data is
limited. Dee et al. (2000) have published their estimates of barriers to services trade, at
the aggregate level. In this study, we split services into traded and non-traded categories,
following the classification adopted by Dee et al. (2000), and use the estimates of
services barriers from that study. These barriers are implemented using several
instruments (import tax equivalents, export tax equivalents, taxes on output and taxes on
7
domestic capital). The various tax rates were imposed on the GTAP6 data set prior to the
major simulation using the ALTERTAX procedure. This procedure fixes the current
account balance and uses parameters such that all key shares in the model remain
constant when the new taxes are imposed, while ensuring that the database remains
consistent.
An important data adjustment with respect to the Swiss ad valorem equivalent (AVE)
tariff on imports of “other manufactures” requires mention. “Other manufactures” is a
GTAP6 basket category that includes all manufactures except motor vehicles, machinery
and electronic equipment). The GTAP6 data set records the Swiss AVE tariff on this
category as 155 percent, an implausible figure that is not supported by the detailed tariff
information presented in Chapter 4. Based on the UNCTAD data summarized in table
E.3, we have assumed that the Swiss tariff barrier for the “other manufactures” category
is 11 percent, although even that figure might be exaggerated.7 The figure of 11 percent
is calculated by giving a two-thirds weight to the simple average Swiss tariff (6.1
percent) on all US HS-4 manufacture categories where US exports are over $10 million,
and a one-third weight to the Swiss average tariff (21.1 percent) on those HS-4
manufactured exports where the Swiss tariff exceeds 5 percent.
7 Detailed comparisons of UNCTAD and WTO AVE tariff figures for Switzerland (for example, as reported in the notes to table 4.4) suggest that UNCTAD figures are often too high. The problem in evaluating Swiss tariffs arises because many duties are specific, and different methodologies are used to compute their ad valorem equivalents.

Table E.1. Gravity Model Regression Variables, 1962-69
Regression Variable Description
Dependent variable Log value of bilateral trade by 1-digit SITC, real US dollarsDistance Log of distanceGDP Log of product of real GDPsGDP per capita Log of product of real GDPs per capitaCommon language Common language dummyCommon border Land border dummyLandlocked Number of countries landlocked (0/1/2)Island Number of island countries (0/1/2)Land area Log of product of land areasCommon colonizer Dummy for common colonizer post 1945Colony dummy for country pairs currently in colonial relationshipEver a colony Dummy for country pairs ever in colonial relationshipCommon country Dummy for same nation/perennial coloniesCurrency union Strict currency union dummyGSP GSP dummyRTAs RTA dummy covering 10 regional trading arrangementsSwiss-US trade Dummy for Swiss-US tradeUS openness Dummy for US trade with all partnersSwiss openness Dummy for Swiss trade with all partners
Notes: Dependent variable based on bilateral trade flows drawn from the Feenstra-Lipsey data set. Swiss-US trade and openness variables constructed by the authors. All other variables drawn directly from Rose data set. RTA variable covers the Association of Southeast Asian Nations (ASEAN), European Union (EU), US-Israel FTA, NAFTA (North America Free Trade Agreement), Caribbean Community (CARICOM), Agreement on Trade and Commercial Relations between the Government of Australia and the Government of Papua New Guinea (PATCRA), Australia-New Zealand Closer Economic Relations Trade Agreement (ANZCERTA), Central American Common Market (CACM), South Pacific Regional Trade and Economic Cooperation Agreement (SPARTECA), and Common Market of the South (Mercosur).
Sources: Rose (2004), Feenstra-Lipsey (2005), and authors' calculations.
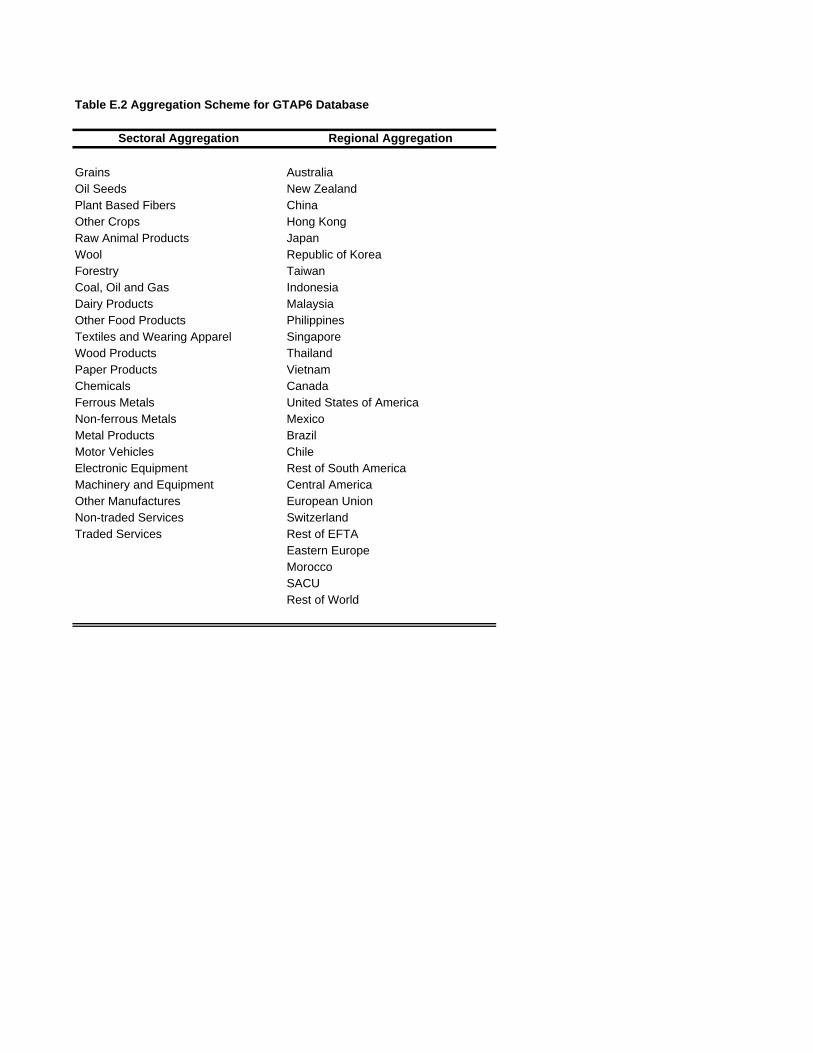
Table E.2 Aggregation Scheme for GTAP6 Database
Sectoral Aggregation Regional Aggregation
Grains AustraliaOil Seeds New ZealandPlant Based Fibers ChinaOther Crops Hong KongRaw Animal Products JapanWool Republic of KoreaForestry TaiwanCoal, Oil and Gas IndonesiaDairy Products MalaysiaOther Food Products PhilippinesTextiles and Wearing Apparel SingaporeWood Products ThailandPaper Products VietnamChemicals CanadaFerrous Metals United States of AmericaNon-ferrous Metals MexicoMetal Products BrazilMotor Vehicles ChileElectronic Equipment Rest of South AmericaMachinery and Equipment Central AmericaOther Manufactures European UnionNon-traded Services SwitzerlandTraded Services Rest of EFTA
Eastern EuropeMoroccoSACURest of World

Table E.3 High Swiss Tariffs on Selected US Manufactured Exports(4-digit level headings facing average applied tariffs exceeding 5 percent)
Heading (HS-4) Tariff Item
Avg Swiss Tariffa (2001)
Swiss Tariff Lines > 5%
US Exports 2004 (millions $)
Switz.7318 Screws, bolts, nuts, hooks, and similar articles, of iron or steel 75.2 30 15 8526 Radar, radio navigational aid, and remote control apparatus 48.6 1 12 2403 Tobacco and substitute manufactures; extracts and essences 29.1 7 13 8708 Parts and accessories motor vehicles of various purposes 28.0 33 13 4911 Printed matter nesoi, including printed pictures and photographs 24.1 4 24 8529 Parts for television, radio and radar apparatus 22.6 2 18 8524 Records, tapes and other recorded media 20.1 2 21 3917 Tubes, pipes and hoses, and fittings, of plastics 18.4 9 13 3304 Beauty or make-up and skin-care preparations 17.1 5 36 8504 Electrical transformers and power supplies for adp machines 15.8 13 22 8483 Transmission, gears, clutches, and other auto parts 15.7 13 10 8501 Electric motors and generators (excluding generating sets) 14.2 15 10 8409 Parts for spark-ignition or internal combustion piston engines 12.3 10 191 8481 Taps, cocks, valves and similar appliances for pipes 12.2 7 31 7307 Tube or pipe fittings of iron or steel 8.5 9 41 3824 Binders for foundry molds or cores 6.5 10 71 8413 Pumps for liquids, liquid elevators and parts 6.4 1 13 8421 Filtering or purifying machinery and apparatus and parts 5.3 5 12
Subtotal for High Tariff HS-4 Manufactured Exports 21.1b 176 565 Total HS-4 Manufactured Exports over $10 million 6.1c 205 8,306
Notes: a. Values reported correspond to averages of ad valorem equivalents for non ad valorem tariffs. All entries in the Swiss tariff schedule are non ad valorem.b. Simple average of all observations in that column.c. Simple average of tariffs for US HS-4 exports to Switzerland exceeding $10 million. By comparison, in 2004, the simple average swiss MFN tariff for non-agricultural products (WTO definition) was 2.3%.
Sources: USITC (2005) and UNCTAD (2005).

THE SHAPE OF A FREE TRADE AGREEMENT BETWEEN SWITZERLAND AND THE UNITED STATES
REFERENCES Adams, R., P. Dee, J. Gali, and G. McGuire. 2003. The Trade and Investment Effects of Preferential Trading Arrangements - Old and New Evidence. Australian Productivity Commission Staff Working Paper (May). Canberra. Addor, Felix and Alexandra Grazioli. 2002. Une meilleure protection des indications géographiques sur le plan international: une question qui nous concerne tous! Bern: Swiss Federal Institute for Intellectual property. www.ige.ch/F/jurinfo/documents/communication_ecrite_02-03-12.pdf (accessed July 19, 2005). Association of Foreign Investors in Real Estate (AFIRE). 2004. Barriers to Foreign Investment in US REITs Removed. AFIRE Newsletter (November/December). Washington. www.afire.org/newsletter/index.shtm (accessed July 20, 2005). Australia Department of Foreign Affairs and Trade (DFAT). 2005. The Australia-United States Free Trade Agreement: Advancing Australian Agricultural Exports. www.dfat.gov.au/trade/negotiations/us_fta/fact_sheets/Agriculture.pdf (accessed July 19, 2005). Australia Senate. 2004. Final Report of Select Committee on the Free Trade Agreement between Australia and the United States of America (August). Canberra: Parliament House, Senate. www.aph.gov.au/Senate/committee/freetrade_ctte/report/final/. (accessed July 19, 2005). Australia Senate. 2004. Submission from the Textile, Clothing and Footwear Union of Australia (TCFUA) to the Senate Select Committee on the Free Trade Agreement between Australia and the United States of America (April). www.aph.gov.au/Senate/committee/freetrade_ctte/submissions/sub204.pdf. (July 19, 2005). Baldwin, Richard E. 2005. Asian Regionalism: Promises and Pitfalls. In Choong Yang Ahn, Richard E. Baldwin and Inkyo Cheong, East Asian Economic Regionalism: Feasibilities and Challenges. New York: Springer. hei.unige.ch/~baldwin/policy.html (August 5, 2005)
1

Baldwin, Richard E. (2005). “Stepping stones or building blocs? Regional and multilateral integration,” in Regional Economic Integration in a Global Framework, J. McKay, M.O. Armengol and G. Pineau (eds), European Central Bank, Frankfurt. Baldwin, Richard E. and Charles Wyplosz. 2004. The Economics of European Integration. London: McGraw-Hill. Baldwin, Richard E. 2003. The Spoke Trap: Hub and Spoke Regionalism in East Asia. KIEP Discussion Paper Number 04-02 (December). Seoul: Korea Institute for International Economic Policy. hei.unige.ch/~baldwin/policy.html (August 5, 2005) Baldwin, R. (1995) ‘A domino theory of regionalism’ In R., Baldwin, P. Haaparanta and J. Kiander (eds) Expanding European Regionalism: The EU’s New Members, Cambridge University Press, Cambridge. Baldwin, R. (1994) Towards an Integrated Europe, CEPR, London. Freely downloadable from http://heiwww.unige. ch/�Baldwin/papers.htm. Bernier, Ivan. 2004. The Recent Free Trade Agreements of the United States as illustration of their New Strategy Regarding the Audiovisual Sector. Paper for Media Trade Monitor. www.mediatrademonitor.org/filestore2/download/146 (accessed July 13, 2005). Blomström, Magnus and Ari Kokko. 1997. Regional Integration and Foreign Direct Investment. NBER Working Paper No 6019 (April). Cambridge: NBER. Blomström, Magnus. and Robert.E. Lipsey. 1987. Transnational Corporations in U.S. and Swedish Trade. CTC Reporter Vol. 24 (Autumn). Bradford, Scott C., Paul L.E. Grieco and Gary C. Hufbauer. 2005. The Payoff to America from Global Integration. In The United States and the World Economy, ed., C. Fred Bergsten. Washington: Institute for International Economics. Brainard, Lael S. 1997. An Empirical Assessment of the Proximity-Concentration Trade-Off Between Multinational Sales and Trade., American Economic Review Vol. 87, No. 4: 520-44. Buckley, Peter J., Jeremy Clegg, Nicoals Forsans, and Kevin T. Reilly. 2000. Assessing NAFTA’s impact on the Strategies of Multinational firms in Canada: a First Econometric Investigation. Working paper (April). Leeds: Leeds University Business School. 129.11.89.221/MKB/KevinReilly/cannfta.pdf (accessed August 5, 2005). Buckley, Peter J., Jeremy Clegg, Nicoals Forsans, and Kevin T. Reilly. 2005. A Simple and Flexible Dynamic Approach to Foreign Direct Investment Growth: The Canada-
2

United States Relationship in the Context of Free Trade. International Finance 0507002. http://ideas.repec.org/e/pre23.html Chile Foreign Affairs Ministry (DIRECON, Dirección General de Relaciones Económicas Internacionales). 2003. Bilateral Chile-US Trade, Tratado de Libre Comercio Chile-Estados Unidos (August). Santiago: DIRECON. www.direcon.cl/documentos/TLC%20EEUU/Impacto%20TLC%20Chile%20USA.pdf (accessed July 19, 2005). Choi, Inbom and Jeffrey J. Schott. 2001. Free Trade between Korea and the United States. Washington: Institute for International Economics. Congressional Budget Office (CBO). 2005. Policies that Distort World Agricultural Trade: Prevalence and Magnitude. Washington: Congress of the United States. Copenhagen Economics. 2005. Economic assessment of barriers to the internal market for services. www.copenhageneconomics.com. Curzon, Gerard. 1965. Multilateral Commercial Diplomacy: GATT and Its Impact on National Commercial Policies and Techniques. London: Michael Joseph Limited. Dee, Philippa, K. Hanslow and T. Phamduc. 2003. Measuring the Cost of Barriers to Trade in Services. In Takatoshi Ito and Anne O. Krueger, eds. Services Trade in the Asia-Pacific Region, NBER-East Asia Seminar on Economics, Volume 11. Chicago: University of Chicago Press. DeRosa, Dean and John Gilbert. 2005. The Economic Impacts of Multilateral and Regional Trade Agreements in Quantitative Economic Models: An Ex Post Evaluation. Draft paper prepared for the Institute for International Economics. Washington: Institute for International Economics (June). Dimaranan, Betina and Robert A. McDougall. 2002. Global Trade, Assistance, and Protection: The GTAP5 Database. Center for Global Trade Analysis. West Lafayette: Purdue University. Dunning, John H. 1993. Multinational Enterprises and the Global Economy. Wokingham: Addison-Wesley Publishing Company. Dunning, John H. 1997. The European Internal Market Programmed and Inbound Foreign Direct Investment. Journal of Common Market Studies, Vol. 35, Issue 2 (June): 189–223. Dunning, John H., ed. 2000. Regions, Globalization, and the Knowledge-Based Economy. Oxford: Oxford University Press.
Economist Intelligence Unit (EIU). 2004. Country profile: Switzerland. London: EIU.
3

Economist Intelligence Unit (EIU). 2005. Country profile: Switzerland. London: EIU.
Egger, Peter. 2002. An Econometric View on the Estimation of Gravity Models and the Calculation of Trade Potentials. The World Economy Volume 25 (February): 297-312. European Commission. 1998. European Community-United States and the United States Agreement on Sanitary Measures. Brussels: European Commission. europa.eu.int/comm/food/international/trade/agreements_en.htm (accessed July 19, 2005). European Commission. 2002. European Community - Swiss Confederation Agreement on Agricultural Trade (April). Brussels: European Commission. europa.eu.int/eur-lex/pri/en/oj/dat/2002/l_114/l_11420020430en01320349.pdf (accessed July 19, 2005).
European Commission. 2004a. Report on US Barriers to Trade and Investment (December). Brussels: European Commission.
European Commission. 2004b. User's Handbook to the Rules of Preferential Origin Used in Trade between the European Community and other European Countries. Brussels: EU Commission. European Free Trade Association (EFTA). 2002a. Agreement between the EFTA States and Singapore. Geneva: EFTA Secretariat. European Free Trade Association (EFTA). 2002b. Introduction to the Agreement Between the EFTA States and Mexico. Geneva: EFTA Secretariat. European Free Trade Association (EFTA). 2003. Free Trade Agreement between the EFTA States and the Republic of Chile. Geneva: EFTA Secretariat. Feenstra, Robert C., Robert E. Lipsey et al. 2005. World trade flows: 1962-2000. NBER Working Paper No. 11040 (January). Cambridge: National Bureau of Economic Research. Francois, Joseph and Ian Wooton. 2005. Market Structure in Services and Market Access in Goods. Discussion Paper Series No. 5135 (July). London: Centre for Economic Policy Research. www.cepr.org/pubs/new-dps/dplist.asp?dpno=5135 (accessed August 9, 2005).
Freeman, Gary P., Luis F.B. Plascencia, and Mark Setzler. 2003. The Decline of Barriers to Immigrant Economic and Political Rights in the American States: 1977-2001. International Migration Review Volume 37, No. 1 (Spring): 5-23.
Findlay, C. and T. Warren, eds. 2000. Impediments to Trade in Services: Measurement and Policy Implications (December). New York: Routledge.
4

Frankel, Jeffrey A. 1997. Regional Trading Blocs in the World Economic System. Washington: Institute for International Economics (October). General Agreement on Trade in Services (GATS). 2002. Request from the European Commission and Its Member States to the United States. www.gatswatch.org/requests-offers.html, (accessed May 24, 2005). Gilbert, J. and T. Wahl. 2002. Applied General Equilibrium Assessments of Trade Liberalisation in China. World Economy Volume 25(5):697-731. Glick, Reuven and Andrew K. Rose. 2002. Does a Currency Union affect Trade? The Time-Series Evidence. The European Economic Review 46, no. 6: 1125-1151. Globerman, Steven and Daniel Shapiro. 1999. The Impact of Government Policies on Foreign Direct Investment: The Canadian Experience. Journal of Business Studies, Vol. 30, No. 3 (September). Graham, Edward M. and Paul R. Krugman. 1995. Foreign Direct Investment in the United States. Washington: Institute for International Economics. Graham, Edward M. and Erika Wada. 2000. Appendix B: Is Foreign Direct Investment a Complement to Trade? In Edward Graham. Fighting the Wrong Enemy: Antiglobal Activists and Multinational Enterprises. Washington: Institute for International Economics. Graham, John D. 2003. The Perils of the Precautionary Principle: Lessons from the American and European Experience (October). Paper Presented at Regulatory Forum. Washington: The Heritage Foundation. www.whitehouse.gov/omb/inforeg/speeches/031020graham.pdf (accessed July 19, 2005). Greenaway, David and Chris Milner. 2002. Regionalism and Gravity. Scottish Journal of Political Economy Volume 49, No. 5: 574-585. Hallward-Driemeier, Mary. 2003. Do bilateral investment treaties attract foreign direct investment? Only a bit - and they could bite. World Bank Policy Research Working Paper 3121. Washington: World Bank. Hejazi, Walid and Edward A. Safarian. 1999. Modelling Links between Canadian Trade and Foreign Direct Investment. Perspectives on North American Free Trade. Ottawa: Industry Canada. Hejazi, Walid and Edward A. Safarian. 2001. Canada and Foreign Direct Investment: A Study of Determinants. Mimeo. Toronto: University of Toronto Centre for Public Management.
5

Hejazi, Walid and Edward A. Safarian. 2002. Explaining Canada’s Changing FDI Patterns. Paper presented at the 37th Annual Meeting of the Canadian Economics Association (September). Ottawa: Carleton University. Hertel, Thomas, ed. 1997. Global Trade Analysis: Modeling and Applications. New York: Cambridge University Press. Hsiao, Cheng. 2003. Analysis of Panel Data. Cambridge: Cambridge University Press. Hufbauer, Gary C., and F. M. Adler. 1968. Overseas Manufacturing Investment and the Balance of Payments. US Treasury Department Tax Policy Research Study No. 1. Washington: US Government Printing Office. Hufbauer, Gary C. and Jeffrey J. Schott. 2005. NAFTA Revisited: Achievements and Challenges. Washington: Institute for International Economics. Hufbauer, Gary and Yee Wong. 2005. Prospects for Regional Free Trade in Asia. Presented at the RAND-China Reform Forum Conference. Santa Monica: RAND Corporation. International Monetary Fund (IMF). 2004. International Financial Statistics (December). Washington: IMF. International Monetary Fund (IMF). 2005a. Article IV Consultation: Switzerland, Answers by the Swiss National Bank (February). Washington: IMF International Monetary Fund (IMF). 2005b. Direction of Trade Statistics (May). Washington: IMF. Jaumotte, Florence. 2004. Foreign Direct Investment and Regional Trade Agreements: The Market Size Effect Revisited. IMF Working Paper 206 (November). Washington: IMF. Jemmi, T. and Cornelia Herholz. 2003. Bilateral Veterinary Agreement between Switzerland and the European Union.. Swiss Federal Veterinary Office (FVO) Magazine, Issues 4 to 5. Bern: FVO. Josling, Tim and Dale Hathway. 2004. This Far and No Farther? Nudging Agricultural Reform Forward. Policy Brief Number PB 04-1. Washington: Institute for International Economics (March). Levy-Yeyati E.; Ernesto Stein, and Christian Daude. 2003. Regional Integration and the Location of FDI. IDB Research Department Working Paper 492. Washington: Inter-American Development Bank.
6

Linnemannn, Hans. 1966. An Econometric Study of International Trade Flows. Amsterdam: North Holland. Lloyd, P.J. and D. MacLaren. 2004. Gains and Losses from Regional Trading Agreements: A Survey. Economic Record Volume 80(251):445-97.
Mann, Catherine. 2005. High-Tech and the Globalization of the American Economy. Working Paper (forthcoming). Washington: Institute for International Economics.
NAFTA Free Trade Commission. 2005. Note of Interpretation. www.webapps.dfait-maeci-gc.ca/minpub/Publication.asp?FileSpec=/Min_Pub_Docs/104441.htm (accessed March 2005). Press release from Canadian International Trade Minister Pettigrew.
Nell, Philippe G. (1994). "Les déterminants de l'évolution de la politique d'intégration européenne de la Suisse: 1948-1994", Revue d'Allemagne, Strasbourg, juillet-septembre. Organization for Economic Co-operation and Development (OECD). 2002. OECD Economic Surveys: Switzerland 2001-2002. Paris: OECD. Organization for Economic Co-operation and Development (OECD). 2003. Agricultural Policies in OECD Countries – Monitoring and Evaluation. Paris: OECD.
Organization for Economic Co-operation and Development (OECD). 2004a. OECD Economic Surveys: Switzerland 2003-2004. Paris: OECD.
Organization for Economic Co-operation and Development (OECD). 2004b. Economic Surveys: United States 2003-2004. Paris: OECD.
Organisation for Economic Co-operation and Development (OECD). 2004c. Trends and Recent Developments in Foreign Direct Investment (June). Paris: OECD. www.oecd.org/dataoecd/37/39/32230032.pdf#search='trends%20and%20recent%20developments%20in%20fdi' (accessed July 19, 2005). Organisation for Economic Co-operation and Development (OECD). 2004d. United States: Report on Competition Law and Institutions. Paris: OECD. Organisation for Economic Co-operation and Development (OECD). 2005. Economic Outlook, Number 77 (May). Paris: OECD. www.oecd.org/document/18/0,2340,en_2649_201185_20347538_1_1_1_1,00.html (accessed July 19, 2005). Organization for International Investment (OFII). 1999. Investing in American Jobs. Washington: OFII. Panagariya, A. 2000. Preferential Trade Liberalization: The Traditional Theory and New Developments. Journal of Economic Literature Volume 38(2): 287-331.
7

Price Water House Coopers (PWC). 1999. Corporate Taxes 1999-2000: Worldwide Summaries. Reddaway, William B. 1967. Effects of UK Direct Investment Overseas: An Interim Report. London: Cambridge University Press. Robinson, S. and K. Thierfelder. 2002. Trade Liberalisation and Regional Integration: The Search for Large Numbers. Australian Journal of Agricultural and Resource Economics Volume 46(4):585-604. Rosales, Osvaldo V. 2003. TLCs de Chile con Estados Unidos y la Union Europea (May). Santiago: Chile Foreign Affairs Ministry. www.direcon.cl/documentos/TLC%20EEUU/TLC%20de%20Chile%20con%20Estados%20Unidos%20y%20la%20Union%20Europea.pdf (accessed July 19, 2005). Rose, Andrew K. 2000. One Money, One Market: The Effect of Common Currencies on Trade. Economic Policy, Volume 30. Rose, Andrew K. 2004. Do we really know that the WTO increases trade? American Economic Review Volume 94 (1): 98-114.
Roye, Paul F. 2002. Remarks at the Global Challenge in Investment Management Regulatory and Legal Issues. Speech at Sufolk University School of Law on behalf of the US Security Exchange Commission. www.sec.gov/news/speech/spch552.htm, (accessed June 8, 2005).
Salazar-Xirinachs, Jose M. and Jaime Granados. 2004. The US–Central America Free Trade Agreement: Opportunities and Challenges. In Jeffrey J. Schott, ed. Free Trade Agreements: US Strategies and Priorities (April). Washington: Institute for International Economics. Schott, Jeffrey J. 2004. Reviving the Doha Round. Washington: Institute for International Economics. Schott, Jeffrey J. 2004. Free trade agreements: Boon or Bane of the World Trading System? In Jeffrey J. Schott, ed., Free Trade Agreements: US Strategies and Priorities. Washington: Institute for International Economics. Scollay, R. and J. Gilbert. 2000. Measuring the Gains from APEC Trade Liberalisation: An Overview of CGE Assessments. World Economy Volume 23(2):175-93. Scollay, R. and J. Gilbert. 2001. New Regional Trading Arrangements in the Asia-Pacific. Washington: Institute for International Economics).
8

Shelby, David. 2004. Trade Accord Opens Huge Opportunities for Moroccan Business in U.S. US State Department Press Release. Brussels: US Embassy. www.uspolicy.be/Article.asp?ID=2146D5C6-7EBB-4A6A-AE9E-A68E98BBA4EB. (accessed July 19, 2005). Singapore Customs. 2003. Rules of Origin for the Export of Textile and Garment Products to the United States under the United States-Singapore FTA Agreement (December). Circular No 47/2003. Singapore: Singapore Customs. www.customs.gov.sg/circular/c47-2003.pdf (accessed July 15, 2005). Singapore Ministry of Trade and Industry (MTI). 2003. Information Paper on the US-Singapore Free Trade Agreement (May). www.mti.gov.sg/public/FTA/frm_FTA_Default.asp?sid=36&cid=1647 (accessed July 15, 2005). Soloaga, I. and L.A. Winters. 2001. Regionalism in the nineties: What effect on trade? North American Journal of Economics and Finance Volume 12(1): 1-29. Stokes, Bruce. 2005. Tighter Control of Foreign Investment? National Journal (July). Washington: National Journal Group Inc. Sutherland, Peter. 2004. The Future of the WTO: Addressing Institutional Challenges in the New Millennium. Report by the Consultative Board to the Director-General Supachai Panitchpakdi. Geneva: World Trade Organization. Swiss-American Chamber of Commerce. 2002. Chamber suggests to include Switzerland in U.S. - EFTA Mutual Recognition Agreement. Press Release. www.amcham.ch/advo/content/archive/m_us_relations_efta.htm (accessed July 15, 2005). Swiss Federal Institute of Intellectual Property. 2005. Geographical Indications. Bern: Swiss Federal Institute of Intellectual Property. www.ige.ch/E/jurinfo/j104.shtm. (accessed July 19, 2005). Swiss Federal Office of Public Health (SFOPH). 2003. The Precautionary Principle in Switzerland and Internationally. Bern: SFOPH. Swiss Federal Statistical Office. 2005. Statistical Data on Switzerland 2005. www.bfs.admin.ch/bfs/portal/en/index/dienstleistungen/publikationen_statistik/publikationskatalog.html?publicationID=1728 (accessed July 19, 2005). Swiss National Bank. 2005. Bulletin Mensuel de Statistiques Economiques (May). Zurich: Banque National Suisse. Switzerland Customs (Administration Fédérale des Douanes). 2005. Accords de libre-échange, préférences tarifaires et origine des merchandises. www.zoll.admin.ch/f/gesetze/dokumente/d30/d30.php. (July 19, 2005).
9
Switzerland Integration Office DFA/DEA. 2005. Bilateral Agreements Between Switzerland and the European Union of 1999 (January). Berne: Integration Office DFA/DEA. www.europa.admin.ch/ba/expl/uebersicht/e/ (June 8, 2005).
Switzerland Ministry of Economy (SECO, Staatssekretariat für Wirtschaft). 2004. Report on Foreign Economic Policy. Bern: SECO. Switzerland Ministry of Economy (SECO, Staatssekretariat für Wirtschaft). 2005. Mutual Recognition Agreements. www.seco.admin.ch/themen/aussenwirtschaft/seiten/00033/index.html?lang=fr (accessed July 15, 2005). United Nations Conference on Trade and Development (UNCTAD). 2004. The Generalised System of Preferences. New York: United Nations. www.unctad.org/gsp (accessed August 10, 2005). United Nations Conference on Trade and Development (UNCTAD). 2004. World Investment Report 2004: The Shift Towards Services. New York: United Nations. US Animal and Plant Health Inspection Service (APHIS). 2004. Special Focus: SPS Issues and Free Trade Agreements. Technical Trade Report (July). Washington: US Department of Agriculture. US Bureau of Economic Analysis (BEA). 2004a. Survey of Current Business (September). Washington: US BEA. US Bureau of Economic Analysis (BEA). 2004b. Survey of Current Business (July). Washington: US BEA. US Bureau of Economic Analysis (BEA). 2005a. US Direct Investment Abroad: Balance of Payments and Direct Investment Position Data. Washington: US BEA. www.bea.gov/bea/di/di1usdbal.htm (accessed July 20, 2005). US Bureau of Economic Analysis (BEA). 2005b. US International Transactions Accounts Data. Washington: US BEA. www.bea.gov/bea/international/bp_web/list.cfm?anon=71®istered=0 (accessed July 20, 2005). US Bureau of Labor Statistics (BLS). 2005. Employer Costs for Employee Compensation. data.bls.gov/PDQ/outside.jsp?survey=cm (accessed July 19, 2005). US Chamber of Commerce. 2004. Precautionary Principle. Washington: US Chamber of Commerce.
10

www.uschamber.com/issues/index/regulatory/precautionaryprinciple.htm (accessed June 14, 2005).
US Department of Agriculture (USDA). 2004. NAFTA Agriculture Fact Sheet: Sanitary/Phytosanitary (March). Washington: USDA. www.fas.usda.gov/itp/Policy/NAFTA/sanitary.html. (accessed July 19, 2005).
US Department of Agriculture (USDA). 2005. Global Traceability and Labeling Requirements for Agricultural Biotechnology-Derived Products: Impacts and Implications for the United States (February). Washington: USDA. http://w3.usda.gov/agencies/biotech/ac21/reports/tlpaperv37final.pdf (accessed September 10, 2005).
US Department of State. 2005. Investment Climate: Switzerland. www.state.gov/e/eb/ifd/2005/42129.htm (June 8, 2005).
US Foreign Agricultural Service (FAS). 2005. Agricultural Fact Sheets on US Free Trade Agreements (FTAs): US-Australia FTA, US-Chile FTA, CAFTA, NAFTA, and US-Morocco FTA. www.fas.usda.gov/itp/ftas.html (accessed July 19, 2005). US International Trade Commission (USITC). 2003. US-Singapore Free Trade Agreement: Potential Economywide and Selected Sectoral Effects. USITC Investigation No. TA-2104-6, Publication 3603 (June). Washington: USITC. US International Trade Commission (USITC). 2004a The Economic Effects of Significant US Import Restraints. USITC Investigation No. 332-325, Publication 3701. Washington: USITC. US International Trade Commission (USITC). 2004b. US-Australia Free Trade Agreement: Potential Economywide and Selected Sectoral Effects. USITC Investigation No. TA-2104-11, Publication 3697 (May 2004). Washington: USITC. hotdocs.usitc.gov/docs/pubs/2104f/pub3697.pdf (accessed July 19, 2005). US International Trade Commission (USITC). 2004c. US-Central America Dominican Republic Free Trade Agreement: Potential Economywide and Selected Sectoral Effects. USITC Investigation No. TA-2104-13, Publication 3717 (August 2004). Washington: USITC. hotdocs.usitc.gov/docs/pubs/2104f/pub3717.pdf (accessed July 19, 2005). US International Trade Commission (USITC). 2005a. The Impact of Trade Agreements Implemented Under Trade Promotion Authority. Investigation No. TA-2103-1. Publication 3780. US International Trade Commission (USITC). 2005b. Tariff Information Center: Official Harmonized Tariff Schedule of the United States, 2005 HTSA.
11

http://www.usitc.gov/tata/hts/ (accessed July 15, 2005). US Patent and Trademark Office. 2005c. Geographical Indications. www.uspto.gov/web/offices/dcom/olia/globalip/geographicalindication.htm (accessed July 19, 2005). US Supreme Court of Conneticut. 1973. In Re Griffiths, 413 U.S. 717, No. 71-1336. caselaw.lp.findlaw.com/cgi-bin/getcase.pl?navby=volpage&court=us&vol=413&page=721 (accessed July 15, 2005). US Trade Representative (USTR). 2002. Free Trade with Singapore: America's First Free Trade Agreement in Asia. Singapore FTA Fact Sheets (December). www.ustr.gov/Trade_Agreements/Bilateral/Singapore_FTA/Fact_Sheets/Section_Index.html (accessed July 15, 2005). US Trade Representative (USTR). 2003a. Final Text of the US-Singapore Free Trade Agreement. www.ustr.gov/Trade_Agreements/Bilateral/Singapore_FTA/Final_Texts/Section_Index.html (accessed July 15, 2005). US Trade Representative (USTR). 2003b. United States – Chile Free Trade Agreement. Washington: USTR. www.ustr.gov/Trade_Agreements/Bilateral/Singapore_FTA/Section_Index.html (accessed July 15, 2005). US Trade Representative (USTR). 2003c. Free Trade in Services: Opening Dynamic New Markets. USTR Fact Sheet (March). www.ustr.gov/Document_Library/Fact_Sheets/2003/Free_Trade_in_Services_Opening_Dynamic_New_Markets.html (accessed July 13, 2005).
US Trade Representative (USTR). 2003d. National Trade Estimate Report on Foreign Trade Barriers Washington: US Trade Representative. http://www.ustr.gov/Document_Library/Reports_Publications/2003/2003_NTE_Report/Section_Index.html (accessed July 13, 2005).
US Trade Representative (USTR). 2003e. Report of the Industry Sector Advisory Committee on Services for Trade Policy Matters (ISAC 13). The US-Singapore Free Trade Agreement. Report from ISAC 13 (February). www.ustr.gov/assets/Trade_Agreements/Bilateral/Singapore_FTA/Reports/asset_upload_file184_3249.pdf (accessed July 15, 2005). US Trade Representative (USTR). 2004a. Final Text of the US-Australia Free Trade Agreement. www.ustr.gov/Trade_Agreements/Bilateral/Australia_FTA/Final_Text/Section_Index.html (accessed July 15, 2005).
12

US Trade Representative (USTR). 2004b. Report of the Industry Sector Advisory Committee on Services for Trade Policy Matters (ISAC 13). The US-Australia Free Trade Agreement (March). www.ustr.gov/assets/Trade_Agreements/Bilateral/Australia_FTA/Reports/asset_upload_file118_3412.pdf (accessed July 15, 2005). US Trade Representative (USTR). 2004c. United States – Morocco Free Trade Agreement. Washington DC: USTR. www.ustr.gov/Trade_Agreements/Bilateral/Morocco_FTA/Section_Index.html (accessed July 19, 2005). US Trade Representative (USTR). 2005a. Free Trade in Services: Opening Dynamic New Markets, Supporting Good Jobs. USTR Fact Sheet (May). www.ustr.gov/Document_Library/Fact_Sheets/2005/Free_Trade_in_Services_Opening_Dynamic_New_Markets,_Supporting_Good_Jobs.html (accessed July 13, 2005).
US Trade Representative (USTR). 2005b. National Trade Estimate Report on Foreign Trade Barriers Washington: US Trade Representative. www.ustr.gov/Document_Library/Reports_Publications/2005/2005_NTE_Report/Section_Index.html (accessed July 13, 2005).
US Trade Representative (USTR). 2005c. United States Submits Revised Services offer to the WTO. USTR Press Release (May). www.ustr.gov/Document_Library/Press_Releases/2005/May/US_Submits_Revised_Services_offer_to_the_WTO.html (accessed July 13, 2005). Vega-Cánovas, Gustavo, and Gilbert R. Winham. 2002. The Role of NAFTA Dispute Settlement in the Management of Canadian, Mexican and US Trade and Investment Relations. Ohio Northern University Law Review 28. Vontobel, Marianne, ed. 2004. Yearbook 2004/05. Swiss-American Chamber of Commerce. Zurich: Swiss American Chamber of Commerce. www.amcham.ch/publications/m_yearbook_0405.htm (accessed July 19, 2005).
World Trade Organization (WTO). 1996. Trade Policy Review: Switzerland (April). Geneva: WTO.
World Trade Organization (WTO). 2001. Trade Policy Review: United States (September). Geneva: WTO.
World Trade Organization (WTO). 2002a. Request for the Establishment of a Panel by Switzerland on US Definitive Safeguard Measures on Imports of Certain Steel Products. Geneva: WTO. www.wto.org/english/tratop_e/dispu_e/distabase_wto_members4_e.htm (accessed July 15, 2005).
13

World Trade Organization (WTO) 2002b. Committee on Sanitary and Phytosanitary Measures. Submission by Switzerland on United States Restrictions on the Import of Meat and Meat Products (June). WTO Report Number G/SPS/GEN/321. Geneva: WTO. World Trade Organization (WTO). 2003. Domestic Review Mechanisms related to Transparency in Government Procurement. Report Number WT/WGTGP/W/39 (February). Geneva: WTO. WTO (World Trade Organization) Committee on Sanitary and Phytosanitary Measures. 2004a. Specific Trade Concerns: Revision to Note from the Secretariat. Report Number G/SPS/GEN204R4. Geneva: WTO.
World Trade Organization (WTO). 2004b. Trade Policy Review: Switzerland and Liechtenstein (November). Geneva: WTO.
World Trade Organization (WTO). 2004c. Trade Policy Review: United States (January). Geneva: WTO.
WTO. (World Trade Organization). 2005a. Semi-Annual Report Under Article 16.4: United States. Geneva: WTO. www.wto.org/english/tratop_e/adp_e/adp_e.htm (accessed July 19, 2005). WTO (World Trade Organization) Committee on Sanitary and Phytosanitary Measures. 2005b. Specific Trade Concerns – Revision to Note from the Secretariat. Report Number G/SPS/GEN204R5. Geneva: WTO. World Trade Organization (WTO). 2005c. Statistics on Antidumping. www.wto.org/english/tratop_e/adp_e/adp_stattab7_e.xls (accessed July 15, 2005). World Trade Organization (WTO). 2005d. United States Notification to WTO Committee on Anti-Dumping Practices. WTO document G/ADP/N/126/USA (March). www.wto.org/english/tratop_e/adp_e/adp_e.htm (accessed July 15, 2005).
14