the shaping of higher education: the formative years in ... · 38 journal of economic perspectives...
TRANSCRIPT

/ 300f ja03 Mp 37 Friday Dec 17 09:03 AM LP–JEP ja03
Journal of Economic Perspectives—Volume 13, Number 1—Winter 1999—Pages 37–62
The Shaping of Higher Education: TheFormative Years in the United States,1890 to 1940
Claudia Goldin and Lawrence F. Katz
H igher education in the United States today has several salient character-istics: the large average size of its institutions; the coexistence of smallliberal arts colleges and large research universities; the substantial share
of enrollment in the public sector; a viable and long-lived private sector; profes-sional schools that are typically embedded within universities; and varying levels ofper capita funds provided by the states. Many of these features are often describedas having been an outgrowth of post-World War II developments, such as the G.I.Bill, the rise of federal funding for higher education, and the arrival of highereducation for the masses. This paper will argue, to the contrary, that the formativeperiod of America’s higher education industry, when its modern form took shape,was actually during the several decades after 1890.1
The shifts in the formative years profoundly altered the higher education in-dustry. The decade around the turn of the 20th century witnessed the flourishingof the American research university and the emergence of public sector institutionsas leaders in educational quality. In the subsequent two to three decades, institu-
j Claudia Goldin and Lawrence F. Katz are Professors of Economics, Harvard University,and Research Associates, National Bureau of Economic Research, both in Cambridge, Mas-sachusetts. During 1997-98, they were Visiting Scholars, Russell Sage Foundation, New YorkCity, New York. Their e-mail addresses are »[email protected]… and »[email protected]…respectively.1 Our focus is on four-year higher education. We omit two-year colleges, as well as independent teacher-training institutions, since most of the students at such colleges were there for only two years. Beforethe 1940s, many professional schools (teaching law, medicine, veterinary medicine, pharmacy, and den-tistry) had programs for which the bachelor’s degree was not a prerequisite—nor was it granted at thetermination of the program. Students in professional programs must, therefore, be grouped with all pre-bachelor’s. See Goldin and Katz (1998) for a more detailed presentation of the statistical materials inthis paper.
38 Journal of Economic Perspectives
/ 300f ja03 Mp 38 Friday Dec 17 09:03 AM LP–JEP ja03
tions of higher education vastly increased in scale, particularly those in the publicsector, and public sector institutions greatly expanded their enrollments relative totheir private counterparts. Universities widened their scope of operations by addinga multitude of highly specialized departments. Professional schools, which had beenmainly independent entities, became embedded in universities. Denominationalinstitutions, particularly schools of theology, went into absolute decline, and smallliberal arts colleges into relative decline. Something profoundly altered higher ed-ucation around 1890 so that almost all of today’s noteworthy U.S. universities andcolleges were founded before 1900.
This paper describes the shifts in industrial organization and political economyduring the formative years of higher education from 1890 to 1940, some of thereasons for them, and a few of the consequences. We begin with a discussion of the‘‘technological shocks’’ that swept the ‘‘knowledge industry’’ in the late 19th andearly 20th centuries. These changes are crucial to understanding why the structureof the higher education industry changed so abruptly from the 1890s to the 1920s,in terms of the increased scale of higher education, its widened scope, the relativerise of public sector enrollments, and the commitment of particular states to highereducation. We next discuss enrollments and the founding dates of institutions,along with other descriptive data, to give a sense of the growth of the industry’sfirms and clientele during the 1890 to 1940 period. We examine the political econ-omy of higher education; in particular, why the public sector grew relative to theprivate sector and what factors determined cross-state variation in funding highereducation from 1890 to 1940. In the conclusion, we turn to some of the conse-quences of publicly funded higher education.
Higher Education before World War II
Background: Changes in the Structure, Creation, and Diffusion of KnowledgeThe business of colleges and universities is the creation and diffusion of knowl-
edge. The structure of knowledge—by which we mean what was known and how itwas packaged into disciplines—changed radically in the late 19th and early 20thcenturies. These changes, in turn, expanded the optimal scale and scope of insti-tutions of higher education and gave an advantage to certain institutions, particu-larly those in the public sector.
In the latter part of the 19th century, an increasing number of subjects taughtin colleges and universities became subdivided and specialized, and those whotaught began to define themselves as occupying separate, specialized fields. In eachsubject, these changes were brought about by somewhat different factors and atslightly different moments in time. Yet several factors are common to most. Theyinclude the application of science to industry, the growth of the scientific and ex-perimental methods, and an increased awareness of social problems brought aboutby an increasingly industrial and urban society.
In industry after industry, in the late 19th century, there emerged a growingimportance of chemistry and physics, most notably in the manufacture of steel,
Claudia Goldin and Lawrence F. Katz 39
/ 300f ja03 Mp 39 Friday Dec 17 09:03 AM LP–JEP ja03
rubber, chemicals, sugar, drugs, nonferrous metals, petroleum, and goods directlyinvolved in the use or production of electricity (Kevles, 1979). Firms that had notpreviously hired trained chemists and physicists did so at an increasing rate, as didthe federal and state governments. The number of chemists employed in the U.S.economy increased by more than six-fold between 1900 and 1940 and by more thanthree-fold as a share of the labor force; the number of engineers increased by morethan seven-fold over the same period (Kaplan and Casey, 1958, table 6). Sciencereplaced art in production; the professional replaced the tinkerer as producer.
With greater demand for trained scientists, universities expanded their offer-ings. With new research findings, the classical scientific disciplines became increas-ingly fragmented, resulting in greater specialization. Greater specialization in bi-ology was driven by changes in empiricism and experimentation earlier stimulatedby the appearance of Darwin’s Origin of Species (Allen, 1979). Analogous changesappeared in the agricultural sciences. But here part of the impetus was the ex-panding crop variety in the United States as the railroad spurred cultivation clearacross the continent, resulting in the growth of highly specialized farming (Rossiter,1979). Even the social sciences expanded and splintered in the late 19th and early20th centuries. They were given a mission by the growing social problems of in-dustry, cities, immigration, and prolonged depressions, first in the 1870s and laterin the 1890s. They were shaped by Darwinian thought, Mendelian genetics, andlater by the increased role of statistics, testing, and empiricism generally (Ross,1979).
To illustrate the increasing specialization in academic disciplines we exploredthe numbers of ‘‘learned societies’’ founded over time, where, according to oneexpert, a learned society is (Kiger, 1963, p. 2):
. . . an organization composed of individuals devoted to a particular learneddiscipline or branch or group of disciplines in the humanities, social sciences,or natural sciences and primarily committed to the study and acquisition ofknowledge in such discipline. [It] excludes professional societies in medicine,law, engineering, etc., where the raison d’etre and primary emphasis is uponthe application of knowledge for professional and/or pecuniary purposes . . .
Our sample consists of all national learned societies existing in the United Statesin about 1980, when Kiger (1982) wrote his last volume on the subject, and thosethat are current members of the American Council of Learned Societies.2 Fivelearned societies came into existence in the 100 years following the founding ofthe first—the American Philosophical Society in 1743—and an additional six ap-peared before 1880. Then the pace picked up and 16 such societies came intoexistence from 1880 to 1899. Another 28 followed in the next 20 years, from 1900
2 Very few national learned societies disappeared. An important one that did was the American SocialScience Association (founded 1865), which was less a learned society than it was an advocacy group. Itgave rise to a host of professional organizations on crime and social service, as well as to the AmericanHistorical Association and the American Economic Association. Having thus exhausted its membership,it disbanded in 1912 (Kiger, 1963, p. 234–35).
40 Journal of Economic Perspectives
/ 300f ja03 Mp 40 Friday Dec 17 09:03 AM LP–JEP ja03
to 1919. Just 10 appeared from 1920 to 1939, although 20 were founded in the1940 to 1959 period. The final 20-year period in the data set—1960 to 1979—contains 12 more. The point is clear: the greatest period of founding of learnedsocieties was the first several decades of the 20th century during the time of disci-plinary proliferation in the U.S. academy.
The expansion is evident in the social sciences. Economists formed their societyin 1885 and the rest quickly followed: psychologists in 1892, anthropologists in 1902,political scientists in 1903, and sociologists in 1905. The biological and chemicalfields also proliferated in the 1890 to 1910 period, when societies were formed forbotanists, microbiologists, pathologists, electrochemists, and biological chemists, tomention a few.
These ‘‘technological shocks’’ in the structure of knowledge had far-reachingimplications for ‘‘firms’’ in the knowledge industry. Before this transition, duringthe early to mid-19th century, institutions of higher education were often staffedby a mere handful of faculty, at least one of whom was proficient in ancient lan-guages and religion whereas the rest were sufficiently informed to teach philosophyand history. A member of the group would be the college’s president, and he wouldhandpick the other faculty. But as a number of previous historians have argued,the higher education sector in the United States changed fundamentally and tookon its modern features between about 1890 and 1910. For example, Hofstadter andHardy (1952, p. 31) write that ‘‘by 1910 the American university as an institutionhad taken shape,’’ and Veysey (1965) discusses how various factors, such as the riseof the research university and the increase in vocational subjects had become ac-cepted facts of higher education by 1910. All changed as the scientific method,practically-oriented courses, the ‘‘lecture method’’ of teaching (Handlin and Hand-lin, 1970), and specialization in a host of dimensions swept the world of knowledge(for example, Bates, 1965; Kimball, 1992; Oleson and Voss, 1979).
The era of the division of labor in higher education had arrived. No longercould a respectable college survive with a mere handful of faculty. No longer couldthe college president keep abreast of all of his faculty’s teaching interests (andmorality). Most of the changes served to increase economies of scale in the pro-duction of higher education services and thus push out the minimum number offaculty and students required for a college to remain viable. Also important to thestory at hand is that in the universities that swept the landscape of higher educationbeginning in the late 19th century, those who diffused knowledge increasingly be-came its creators. Research became the handmaiden of teaching that we believe itis today.
Enrollments and Institutional Founding DatesThe formative period of higher education in the United States, while not one
of enormous growth in the enrollment rate, nonetheless contains an impressiveincrease. We graph in Figure 1 the number of individuals enrolled (either as un-dergraduate or graduate students) in institutions of higher education in the UnitedStates as a fraction of those 18 to 21 years old. Here, we include all institutions:
The Shaping of Higher Education: The Formative Years 41
/ 300f ja03 Mp 41 Friday Dec 17 09:03 AM LP–JEP ja03
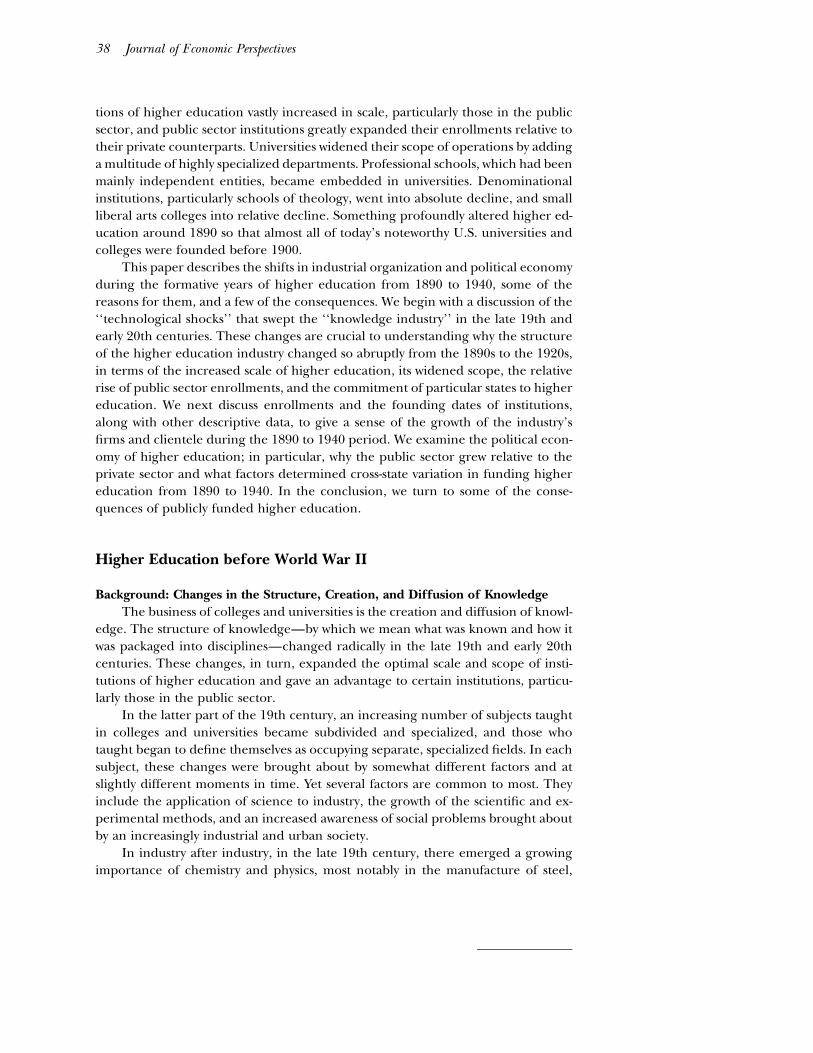
Figure 1Students in Two- and Four-Year Institutions in the United States as a Fraction of18 to 21 Year-Olds: 1890 to 1970
Notes and Sources: Historical Statistics (1975, series A 123, A 124, H 706). See Data Appendix for adjustmentsto series H 706. Data include all students in collegiate, graduate, and professional divisions, withoutduplication, as well as those in teacher-training programs and 2-year colleges. Those in preparatorydepartments of colleges, summer schools, extension programs, and correspondence courses, amongothers, are excluded. The number of 18 to 21 year-olds was estimated as 0.4 1 number of 15 to 24 year-olds. The ratio shown should not be interpreted as the fraction of 18 to 21 year-olds who ever attendedcollege because the numerator includes some who were enrolled in programs beyond the first degreeand others whose attendance at college extended for more than four years.
college, university, professional, teacher training, and junior college.3 The nearlyquadrupling of the higher education enrollment rate from 1940 to 1970 will befamiliar to many readers.4 However, enrollment increased more than three-foldfrom 1910 to 1940 and by five-fold from 1890 to 1940.
The founding of institutions of higher education flourished in the decades just
3 A few data issues should be mentioned. The figure overstates the fraction who ever attended a two- orfour-year institution of higher education, because some in professional or graduate school had alreadyearned their first degree and they and others may have attended for more than four years. Prior to 1955,enrollment was cumulated over the year, but after that date it is given as ‘‘opening fall enrollment.’’The difference, according to the U.S. Department of Education, is about 10 percent. Because of thisimplicit overcounting, the data in Figure 1 should not be strictly interpreted as the percentage of therelevant cohort who attended college. However, possible duplication of students within a university—for example, a student registered in two divisions—was accounted for in the original collection of thedata by the U.S. Department (Office) of Education.4 The college enrollment rate stabilized in the 1970s before continuing its upward advance in the 1980sand 1990s. Data from the October Current Population Surveys, since 1972, provide a direct measure ofthe share of new high school completers ages 16 to 24 who enrolled in college in the fall after completinghigh school. The share of recent high school graduates enrolled in college showed little change from49.2 percent in 1972 to 49.3 percent in 1980. But this measure of the enrollment rate then increasedsteadily in the period of rising relative earnings of college graduates and reached 65 percent in 1996(U.S. Department of Education, 1998, table 7-1).

42 Journal of Economic Perspectives
/ 300f ja03 Mp 42 Friday Dec 17 09:03 AM LP–JEP ja03
before 1900.5 From 1638 to 1819, only 49 institutions of higher education (40 ofthem private ones) were established in the United States. Then the pace began tostep up. From 1820 to 1859, 240 more institutions (225 private) were established.The next 40 years witnessed the greatest expansion in the pre-1940 period with 432colleges and universities (348 private ones) established from 1860 to 1899. In par-ticular, there were 186 institutions (151 private) opened from 1860 to 1879 and246 more (197 private) from 1880 to 1899. Then the number of new institutionsbeing established began to fall off. From 1900 to 1934, only 200 institutions opened(165 private). The closing decades of the 19th century, therefore, were the highpoint in the founding of four-year institutions of higher education before WorldWar II.
The reason for that peak in the founding of colleges and universities might bethought to be the Morrill Acts of 1862 and 1890. The 1862 act granted funds toexisting and future states to endow universities and colleges that specialized inagriculture and the mechanical arts (Nevins, 1962). The 1890 act set up many oftoday’s historically-black universities and also provided income to the institutionsset up by the first act. But overall, about five times as many private institutions aspublic ones were founded during the entire period, and private institutions, moreso than the public ones, were disproportionately founded in the closing years ofthe 19th century.
Not only were relatively few institutions founded after the turn of the 20thcentury, but those that were founded in the 20th century have tended not to be asprestigious. The 1890s, for example, saw the establishment of Stanford, Chicagoand the California Institute of Technology. But among the 35 private institutionsin the top 50 universities in the 1999 rankings by U.S. News and World Report (see»http://www.usnews.com…), only three began college-level instruction in the 20thcentury and just one was founded after 1900. The three are the Carnegie Instituteof Technology (later Carnegie Mellon University), established in 1900 with instruc-tion beginning in 1905; Rice Institute (later Rice University), founded in 1891 withcollege-level instruction beginning 1912; and Brandeis University, founded in 1948.Brandeis is a special case. It was established, in large measure, because Jewish aca-demics and students had long been discriminated against, because large numbersof Jewish scholars took refuge in the United States during the war, and because theJewish community had amassed funds to found a great university. In the top 35liberal arts colleges (all under private control), as ranked by U.S. News and WorldReport, just two were founded in the 20th century. They are Claremont McKennaCollege (1946) and Connecticut College (1915)—although Claremont is part of acollege system that includes Pomona College founded in 1888.
5 We use a sample of the 921 four-year institutions of higher education (778 private and 143 public) inexistence in 1934 and surveyed then by the Office of Education. The group excludes independentteacher-training institutions, but includes independent professional schools. We define the ‘‘founding’’date as the year in which the institution opened or had the ability to grant the bachelor’s degree, notnecessarily the year of establishment. Most branch institutions of state universities are not counted asseparate institutions.
Claudia Goldin and Lawrence F. Katz 43
/ 300f ja03 Mp 43 Friday Dec 17 09:03 AM LP–JEP ja03
Something fundamental changed around the turn of the 20th century, makingthe founding of new institutions of higher education, particularly private ones,more difficult. That change, we will contend, had much to do with barriers to entrystemming from the larger scale and widened scope that were needed to be com-petitive. Financial resources became of increasing importance and institutional rep-utation began to matter more.
Changes in the Industrial Organization and Political Economy ofHigher Education
Changes in ScaleThe size distribution of educational institutions altered considerably in the half
century before 1940, in both the public and the private sectors. The data we use toillustrate these points come from three cross sections constructed for 1897, 1924and 1934. The dates were chosen to span the period of interest.6 Several distribu-tional measures are offered in Table 1 because the surveys we use disproportionatelyundercount small private institutions in 1897, and possibly in 1924 as well, whereasvirtually all relevant public institutions were included in all years.
In 1897, the median private institution had 128 students and the median pri-vate student was in an institution with 505 students. In the public sector these twomeasures were 242 and 787. Thus, publicly-controlled institutions were, on average,larger than those in the private sector, but not very much larger—they were lessthan twice as large. By 1924 the average institution in both sectors had grown sub-stantially, but public sector institutions had grown far more. The median privateinstitution had 359 students in 1924 and the median student in the private sectorwas in an institution with 1,630 students. The public sector numbers were 1,225and 3,950. For both statistics, the average public sector institution grew by about1.8 times that of the private sector, and the relative growth of institutional revenueis about the same order of magnitude. By 1924, private sector institutions had aboutthree times as many students than their private counterparts. During the 1924 to1934 decade, the scale of both public and private institutions continued to increaseand public sector institutions continued to grow a bit faster than those in the privatesector. We also compared the 1924 and 1934 figures using a matched sample of thesame institutions, with similar results.
The evolution of scale as it played out in public and private institutions can besummed up easily enough. The ratio of the median number of students in public
6 Let us offer a few comments on the data we use. The Biennial 1938–40 was the last to present data forseparate institutions. Summaries by state exist in most years, but include junior colleges before 1934 andafter 1942. We exclude all independent teacher-training institutions and two-year colleges. In the dis-cussion of this section we also exclude students who were in the preparatory departments of highereducational institutions. In 1897, for example, about 35 percent of all students in liberal arts collegesand universities were not yet admitted to undergraduate rank but were, rather, preparatory students;the figure had declined to 13 percent in 1924. See the Data Appendix for further information.

44 Journal of Economic Perspectives
/ 300f ja03 Mp 44 Friday Dec 17 09:03 AM LP–JEP ja03
Table 1Scale of U.S. Private and Public Higher Education: 1897, 1924, and 1934
1897
Private Public
1924
Private Public
1934
Private Public
Mean number students 256 415 755 2,165 858 2,810Median number students 128 242 359 1,225 382 1,561Mean institutional revenue, 1997
dollars (000) $945 $1,729 $3,306 $13,300 $4,253 $14,112Median institutional revenue,
1997 dollars (000) $323 $1,153 $1,370 $8,282 $1,367 $8,305Number of students in median
student’s institution 505 787 1,630 3,950 2,271 5,465% institutions having ú1,000
students 4.9 9.9 15.1 59.6 14.2 71.1% students in institutions havingú1,000 students 34.9 41.1 60.1 90.3 62.6 94.3
% institutions having ú10,000students 0 0 0.60 2.75 0.56 5.79
Number of institutions in top 20institutions 14 6 10 10 8 12
Number of institutions for rows1 to 9 305 81 498 109 536 122
Notes and Sources: See Data Appendix for 1897, 1924, and 1934 sources and further details. Independenttheological and professional schools, students in preparatory departments of colleges and universities,and black-only schools are omitted here. Total revenue excludes additions to endowment. The revenuefigures use the BLS CPI in Historical Statistics (1975, series E 135) for which 1967 Å 1: 1897 0.250,1924 0.512, and 1934 0.401, and the CPI-U from the Economic Report of the President (1998) for which1982–84 Å 1, 1967 Å 0.334, and 1997 Å 1.605. Thus the multiplicative factor to produce 1997 dollarsfrom 1967 dollars is 4.805.
and private institutions, per institution, was 1.89 in 1897, but 3.41 in 1924 and 4.09in 1934. The ratio for the size of the institution of the median student was 1.56 in1897, but 2.42 in 1924 and 2.41 in 1934.
A major change in relative magnitudes, therefore, occurred sometime between1897 and the 1920s. By 1924 public sector institutions of higher education alreadyincluded many large, research-oriented universities.7 Interestingly, in more recentdata the absolute sizes of institutions have continued to rise, but the public/privateratios have not changed greatly. In 1990–94, the median number of students perinstitution was 1,579 in the private sector and 8,181 in the public sector, producing
7 We do not have good measures of total research funds at either the institutional or state levels, but wedo have expenditures for ‘‘organized research separately budgeted’’ for public and private institutions(not including teachers colleges, normal schools, and junior colleges). In 1934, 2.4 percent of all edu-cational and general expenditures for privately-controlled colleges went for ‘‘research,’’ defined in thismanner, and 9.3 percent did in the publicly-controlled sector. The highest private percentage by statewas New Jersey, because of a state-supported, privately-controlled institution—Rutgers University. Source:1932/34 Biennial, table 22.

The Shaping of Higher Education: The Formative Years 45
/ 300f ja03 Mp 45 Friday Dec 17 09:03 AM LP–JEP ja03
a ratio of 5.18.8 Since the 1930s, four-year public sector institutions have grown ata somewhat greater rate than those in the private sector, but not by much. Scaleeffects, however, have continued to advance for institutions in both sectors.
Table 1 also presents some measures relating to the upper tail of institutionsby number of students. In 1897 almost 5 percent of all private institutions had morethan 1,000 students and about 10 percent of the public institutions did. They con-tained about 35 percent of all students in the private sector and 41 percent of thosein the public sector. In 1924, 15 percent of private institutions had more than 1,000students but about 60 percent of public institutions did. About 60 percent of allprivate sector students were in these large schools, but more than 90 percent of thepublic sector students were. Six publicly-controlled institutions appear among thetop 20 by student population in 1897, ten in 1924, and twelve in 1934. Today, only5 percent of all private sector institutions have more than 10,000 students, whereas42 percent of public sector institutions do. All of today’s top 20 institutions by sizeare in the public sector.
Changes in ScopeThe formative years of American higher education from about 1890 to 1940
saw some major changes in the scope of institutions, including the emergence ofthe research university, the demise of independent professional institutions, andthe decline of independent schools of theology and denominational institutions ingeneral.
For most of the 19th century, American institutions of higher education werecenters of learning, not research. That began to change in the latter part of thenineteenth century with the founding of the Johns Hopkins University (1876), thefirst dedicated research center in the United States, followed by Clark University(1889), the first U.S. institution with only a graduate program, and the Universityof Chicago (1892) (Veysey, 1965). Universities had long existed in Europe, wherethey took several forms: the classical studies of British universities, the scientifictraining of French grand ecoles, and the graduate and research institutes of Ger-many. The modern university of the New World, however, was a different creaturethan its European counterpart, for it served a far broader clientele of students andthe state, yet increasingly strove to be a research center. The American researchuniversity was to become a melding of all the components of higher education,serving a multitude of functions simultaneously.
The distinction between a ‘‘university’’ and a ‘‘college’’ has long been some-what ambiguous. Many institutions incorporated as ‘‘universities’’ were actually lib-eral arts colleges, like Taylor University, whereas some colleges have been trueuniversities for some time, like Boston College. The U.S. Office of Education of-fered the definition that universities are ‘‘institutions in which there is considerablestress on graduate instruction, which confer advanced degrees in a variety of liberal
8 The 1990–94 data (a five-year average) are from the CASPAR (Computer Aided Science Policy Analysisand Research Database System) from which were excluded junior colleges, normal schools, independentteaching colleges, independent professional schools, and independent theological institutes.
46 Journal of Economic Perspectives
/ 300f ja03 Mp 46 Friday Dec 17 09:03 AM LP–JEP ja03
arts fields, and which have at least two professional schools that are not exclusivelytechnological’’ (American Council on Education 1960, p. 11). A ‘‘university,’’ then,would appear to be a department store of higher education, combining the spe-cialized disciplines with the broader ones of the past and adding the various pro-fessional subjects like law, medicine, dentistry, pharmacy, theology, and evenbusiness.
But the modern university is far more than a collection of higher educationservices brought together under one roof. It is a production center in which theresearch of one part enhances the teaching and research of the other parts. The‘‘university’’ form was an organizational innovation enabling the exploitation oftechnical complementarities among its various components. Although the publicsector did not have a corner on universities, it did, from the beginning of the periodwe are studying, have a disproportionate share of them. In 1897, for example, thepublicly-controlled sector had 43 percent of all universities but only 13 percent ofall institutions of higher education. The fact that the publicly-controlled sector wasdisproportionately established in the university, research-oriented form gave it asubstantial edge on the private sector in the period to 1940, when the overall shareof (non-preparatory) college students enrolled in ‘‘universities’’ increased from 42percent in 1897 to 59 percent in 1934.
Certain universities had, as well, the capacity to bestow reputation on newdivisions in untried areas, such as business, and in older disciplines plagued byclaims of quackery, as in the case of medicine. Medical schools were increasinglyvulnerable in the late nineteenth century with the advent of stricter state li-censing, designed in part to replace the ‘‘art of healing’’ with science. Theirnumbers thinned further in the wake of a 1910 Carnegie commission reportknown as the ‘‘Flexner Report’’ after its author Abraham Flexner which severelycriticized many of the 155 medical colleges in the United States and Canada(Starr, 1982). Thus, the university came to combine the features of a departmentstore, an integrated knowledge-production factory, and a brand name.
As independent professional institutions declined, professional schools asso-ciated with universities increased, although only in the case of medical schools isthe causation unambiguous. At the turn of the 20th century, 48 percent of studentstraining to be lawyers, dentists, pharmacists, and doctors (of both humans andanimals) attended professional schools that were independent of any other insti-tution of higher education. At this time, professional schools often did not requirethe students to have had a college degree, and many had not previously attendedcollege at all (Abbott, 1988). But by 1934, only 19 percent of professional studentswere attending independent schools. In 1897, the U.S. Office of Education surveyed185 independent professional schools: 103 medical schools, 22 law schools, 32schools of dentistry, and 28 that taught pharmacy. By 1934 the number of inde-pendent professional schools had dropped to 58, of which 27 were law schools.Over this time, the share of all students in higher education attending independentprofessional schools fell from 15.5 percent of all students to just 1.9 percent of allstudents.
The transformation of professional training occurred in several steps. In-
Claudia Goldin and Lawrence F. Katz 47
/ 300f ja03 Mp 47 Friday Dec 17 09:03 AM LP–JEP ja03
creased specialization and the greater need for rigorous scientific training en-hanced the returns to formal schooling. Thus, the first step in the transition wasthe shift from informal apprenticeships to formal education in specializedschools, although in the case of law and engineering, apprenticeships continuedwell into the 20th century. The schools providing the credentials were increas-ingly required to have state approval, research facilities, and an unassailablereputation. Professional education was eventually deemed to require an under-graduate education. But even as late as 1934 only 10.7 percent of the 122 lawschools listed in The College Blue Book (1933), a contemporary guide to colleges,required four years of college; 67.2 percent required one semester to two yearsof college, and 9.0 percent required just a high school diploma. Medicine wastransformed, as well, by the campaign of the American Medical Association inthe 1910s to rid the nation of ‘‘sub-standard’’ medical schools, and the regula-tory response of the various states.
Thus the clinical, informal, and apprenticeship programs of the past gave way,in almost all the professions, to scientific, formal, and school-based training. More-over, the schools in which the training was delivered increasingly became parts ofuniversities rather than existing as separate independent institutions. The researchuniversity had enormous advantages in terms of its productivity, and because it lentits reputation to occasionally-sullied professions.
As universities emerged as major research centers and as the classical cur-riculum of liberal arts colleges gave way to a more modern one, higher educationbecame secularized (Hofstadter and Hardy, 1952, ch. II). In 1897, 13 percent ofall surveyed institutions of higher education were independent theologicalschools (having 4.3 percent of all students), but by 1934 10 percent were (with1.5 percent of students). The decline is even greater (17 percent versus 11 per-cent) if the independent professional schools are omitted for they, too, de-creased in numbers. The change took place in a variety of ways. Many trans-formed themselves into non-sectarian, liberal arts colleges. Others merged withuniversities to become non-denominational divinity schools. Many simply van-ished. The demise in denominational institutions that trained ministers was fur-thered by the decreased relative demand for their services. The ratio of theaverage salary of Methodist and Congregational ministers to that of all wageearners in manufacturing fell from 1.81 in 1890, to 1.68 in 1900, 1.44 in 1910,and 1.38 in 1925 (Historical Statistics, 1975, series D 781, 793). But another partof the secularization of colleges was due to the triumph of the scientific methodand other aspects of secular thought that were incompatible with religiousdoctrine.
The Shift Toward Public Higher EducationThe discussion has already mentioned in a number of places that the publicly-
controlled portion of higher education expanded substantially in the 1890 to 1940period. Figure 2 shows various measures of the fraction of students in the publicly-controlled sector from 1897 to 1990. From 1897 to 1940 the fraction of students in
48 Journal of Economic Perspectives
/ 300f ja03 Mp 48 Friday Dec 17 09:03 AM LP–JEP ja03
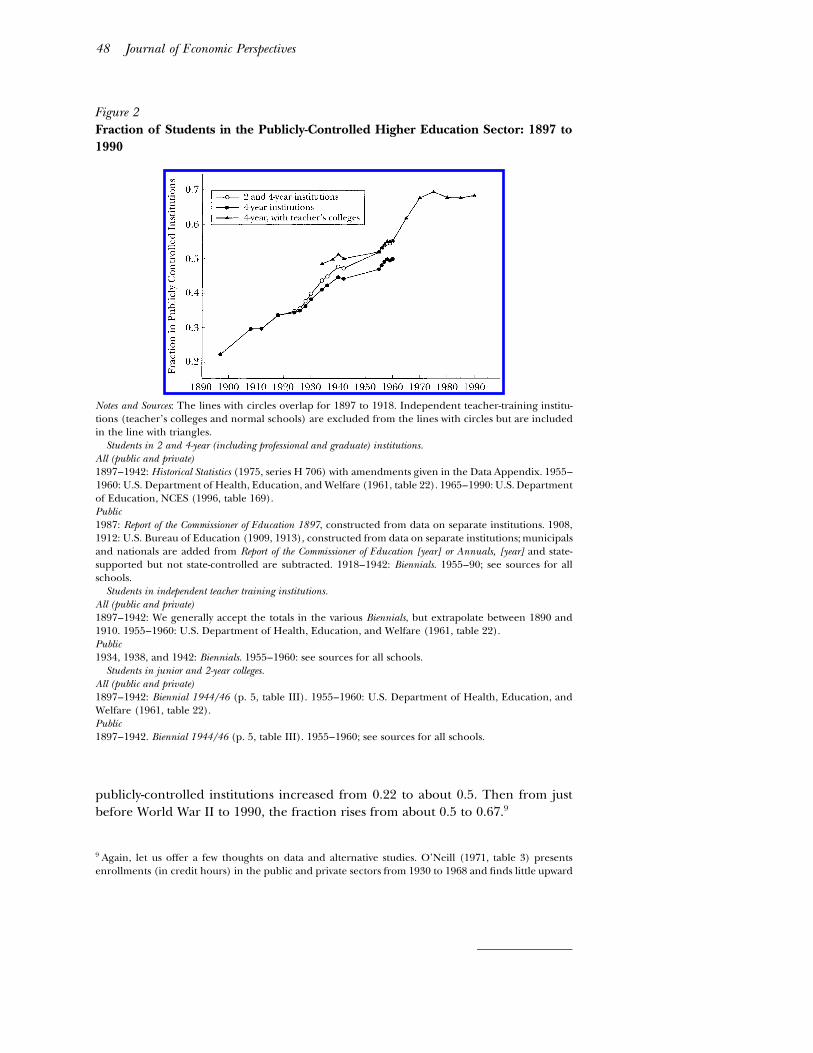
Figure 2Fraction of Students in the Publicly-Controlled Higher Education Sector: 1897 to1990
Notes and Sources: The lines with circles overlap for 1897 to 1918. Independent teacher-training institu-tions (teacher’s colleges and normal schools) are excluded from the lines with circles but are includedin the line with triangles.
Students in 2 and 4-year (including professional and graduate) institutions.All (public and private)1897–1942: Historical Statistics (1975, series H 706) with amendments given in the Data Appendix. 1955–1960: U.S. Department of Health, Education, and Welfare (1961, table 22). 1965–1990: U.S. Departmentof Education, NCES (1996, table 169).Public1987: Report of the Commissioner of Education 1897, constructed from data on separate institutions. 1908,1912: U.S. Bureau of Education (1909, 1913), constructed from data on separate institutions; municipalsand nationals are added from Report of the Commissioner of Education [year] or Annuals, [year] and state-supported but not state-controlled are subtracted. 1918–1942: Biennials. 1955–90; see sources for allschools.
Students in independent teacher training institutions.All (public and private)1897–1942: We generally accept the totals in the various Biennials, but extrapolate between 1890 and1910. 1955–1960: U.S. Department of Health, Education, and Welfare (1961, table 22).Public1934, 1938, and 1942: Biennials. 1955–1960: see sources for all schools.
Students in junior and 2-year colleges.All (public and private)1897–1942: Biennial 1944/46 (p. 5, table III). 1955–1960: U.S. Department of Health, Education, andWelfare (1961, table 22).Public1897–1942. Biennial 1944/46 (p. 5, table III). 1955–1960; see sources for all schools.
publicly-controlled institutions increased from 0.22 to about 0.5. Then from justbefore World War II to 1990, the fraction rises from about 0.5 to 0.67.9
9 Again, let us offer a few thoughts on data and alternative studies. O’Neill (1971, table 3) presentsenrollments (in credit hours) in the public and private sectors from 1930 to 1968 and finds little upward
The Shaping of Higher Education: The Formative Years 49
/ 300f ja03 Mp 49 Friday Dec 17 09:03 AM LP–JEP ja03
The full century would then appear to involve an increase from around 0.22to 0.67, although the group of included schools changes in large measure be-cause the functions of the schools did. Teacher-training institutions, which be-fore 1940 were often normal schools with a two-year curriculum, later becamepart of state universities. Even those that continued to specialize in teacher-training began to grant a bachelor’s to a majority of their graduates. If oneincludes two-year institutions, mainly community colleges, the share of total en-rollments accounted for by publicly controlled institutions reaches 78 percentby 1994 (U.S. Department of Education, 1996).
What accounts for the relative growth of the public sector? We will offer twocomplementary interpretations. The more novel explanation is that the applicationof the scientific method and the increased division of labor and specializationin higher education disproportionately benefited certain types of institutions.Those that had access to research funds, were initially large and diverse, were non-sectarian, and had reputation and a long purse were in the best position to prosperfrom the changes. More public sector institutions than private sector ones were sosituated and thus flourished and expanded in the wake of the changes to the struc-ture of knowledge that shook higher education from around 1880 to 1910.
The reason the changes to the structure and diffusion of knowledge favoredpublic sector institutions returns us, in part, to the notion that they created com-plementarities between research and teaching. Institutions of higher education thatengaged in research activities were suddenly able to provide teaching services atlower cost—they could spread their research base to benefit their teaching. Smallliberal arts colleges, independent professional schools, and sectarian institutionswere at a competitive disadvantage.
Of course, certain private institutions also gained from the technologicalchanges that affected higher education at the start of the formative period. Somewere research and graduate institutions prior to the changes at the turn of thecentury, like Johns Hopkins and Chicago, while others were well positioned tomake the transition with large endowments and long lists of prosperous alumni.However, the importance of pre-existing reputation and the immense scale re-quired to become a first-rate university after this technological shock is high-lighted by the trivial number of leading private universities founded in the 20thcentury.
An alternative, simpler explanation for the rise in the public share of highereducation enrollment concerns the high school movement that swept much of thenation between 1910 and 1940 (Goldin, 1994, 1998). In 1910, less than 10 percentof young Americans graduated from secondary schools, but by the mid-1930s about
trend until around 1952. However, her data include teacher-training institutions and once that adjust-ment is made, are consistent with our data. Hight (1976) computes for 1927 to 1972, a statistic apparentlysimilar to that in the triangle line in Figure 2, but which also includes two-year institutions. However,because Hight’s data do not contain the previous 30 years, the conclusion reached is somewhat differentfrom ours. Hight emphasizes the relative increase of the public sector after 1947 rather than seeing thegreater increase before, evident in our data.
50 Journal of Economic Perspectives
/ 300f ja03 Mp 50 Friday Dec 17 09:03 AM LP–JEP ja03
half did in most states outside the South. Not only did the supply of high schoolgraduates increase, but the increase was greater in states in the midsection of thecountry and on the west coast that earlier had well-functioning public higher ed-ucation institutions (Goldin and Katz, 1997).
As secondary school enrollments soared, a smaller fraction of high schoolgraduates went on to college, but a larger fraction of all youths did. The newgroup of high school graduates differed from the old by background, aspira-tions, and geography, and more of the newer graduates were less able to affordprivate school tuition. Differences in the cost of college attendance betweenpublic and private sector institutions of higher education were already sub-stantial in this period. The average (list) in-state tuition plus fees for under-graduates at public sector institutions in 1933 was $61 ($753 in 1997 dollars),as compared with $265 ($3,272 in 1997 dollars) in the private sector. The over-all difference in the costs of attending public versus private institutions wasfurther enlarged by the higher average room and board costs in private schools(College Blue Book, 1933). However, even at this time, the returns to collegewere high. Goldin and Katz (1999) find, using a unique data set from the 1915Iowa State Census, that the estimated return to a year of college from a stan-dard log earnings regression was over 12 percent a year for young workers—similar to estimates for the 1990s. Thus, there was a substantial inducement tocontinue with college, particularly if the youth was in a state with a high quality,inexpensive public system. The combination of an increased relative demandfor a more practically-oriented curriculum and the lower income levels of alarger fraction of high school graduates shifted out the relative demand forpublic institutions of higher education.
Explaining Political Economy Changes at the State Level
Providing Public Goods at the State LevelEven before the historic Morrill Act passed in 1862, four-fifths of the existing
33 states outside the Northeast had at least one state-controlled institution of highereducation; the exceptions were Arkansas, Illinois, Kentucky, Oregon and Texas. Ofthe nine states of New England and the Middle Atlantic region, only Vermont andPennsylvania had state institutions of higher education in 1860. To be sure, someof these institutions of higher education were not yet offering undergraduate in-struction in 1860—for example, the Universities of California and Minnesota wereestablished before 1860 yet neither had an operating undergraduate program until1869—but here we are focusing on the date of establishment (see also Brubacherand Rudy, 1958). The early state institutions were often established to produceeducated personnel needed to staff teaching at the lower grades. Most were set upusing federal land grants, similar to those of the 1862 Morrill Act. Although manystate institutions contained a liberal arts college indistinguishable from those in theprivate sector, almost all eventually produced services of value to the state apartfrom teaching undergraduates and training school teachers. A primary reason for
Claudia Goldin and Lawrence F. Katz 51
/ 300f ja03 Mp 51 Friday Dec 17 09:03 AM LP–JEP ja03
state support to higher education was to provide ‘‘public goods.’’ State institutionsin the 19th century were more practically and, often, more scientifically orientedthan were their private counterparts, in large measure because of the commitmentto provide goods and services of value to citizens and local industrial interests.10
Even though many state institutions were founded before the 1862 Morrill Actand another large group was established with that legislation, state funding on aper capita or per student basis was measly until the late 19th century, when scientificfindings became important in agriculture, mining, oil exploration, manufacturing,and construction. In states having a concentration of economic activity by industryor by product, the public sector often invested heavily in training and research inthese industries. Wisconsin subsidized work on dairy products, Iowa on corn, Col-orado and other western states on mining, North Carolina on tobacco, andOklahoma and Texas on oil exploration and refining.11 State institutions of highereducation often contained professional training institutes, such as in engineering,and graduate programs in various sciences, including those pertaining to agricul-ture. Rosenberg and Nelson (1993) discuss the role of both state and private uni-versities in producing ‘‘local public goods’’ before the 1940s but shifting to defenseand health-related work later. With this broad portfolio, the state institutions ofhigher education attained the status of ‘‘university’’ to a greater extent than didthose in the private sector. They had all the component parts of the university—the liberal arts college, the graduate programs, and the professional schools—andthey also had access to the research funds of the state at a time when such fundswere less available elsewhere.
Among the most striking differences between the curricula of public and pri-vate institutions in the formative period concerns engineering. In 1908, among allpublic sector college and university students, fully 30 percent were in engineeringprograms and 60 percent of all engineering students nationwide were being edu-cated in public sector institutions. Although by 1930 the share of all public sectorstudents who were in engineering dropped to 15 percent, the fraction of all engi-neers enrolled in public institutions rose to 66 percent. Engineering students were,quite obviously, being produced primarily by the public sector. In only a handfulof states was there any private sector institution enrolling engineers, and just threestates in 1930—Massachusetts, New York, and Pennsylvania—enrolled 62 percentof all private sector engineering students. Because two-thirds of engineers were
10 It is not clear why public financial support for higher education meant direct provision of highereducation by a state-run institution. In only two states—New Jersey and New York—did the state grantsubstantial funds to privately-controlled institutions (Rutgers and Cornell) for agricultural and otherresearch and training. One potential reason for the lack of public support to private research endeavorsmay be that research is a case where it is difficult to draw up an enforceable contract for the provisionof high-quality work, and so the incompleteness of contracts may argue for direct state control, alongthe analytical lines suggested by Hart, Shleifer and Vishny (1997).11 Another reason offered for state funding of university research is that it has localized positive spilloversthat increase economic growth and industrial development in the state, even if the research does notdirectly relate to the current industries. See Jaffe (1989) for evidence on positive spillover effects ofuniversity research on state patenting rates and industrial research and development.

52 Journal of Economic Perspectives
/ 300f ja03 Mp 52 Friday Dec 17 09:03 AM LP–JEP ja03
being trained in the public sector in 1930, the geographic dispersion of engineeringstudents came mainly from those enrolled in the public sector. The public sectorhad a great interest in producing engineers for governments that disproportion-ately hired them. In 1940, for example, before the large increase in defense spend-ing, almost 25 percent of all ‘‘engineers’’ were working directly for the government,and the figure excludes those working in the private sector under governmentcontract.
Public sector institutions of higher education generally became more highlyspecialized over time. New Mexico, Colorado, South Dakota, and Montana, in thatorder, founded mining schools from 1859 to 1921. The majority of the state schoolsestablished in the early part of the 20th century were for blacks or women, or wereteaching, technical, and industrial institutes, such as the Lowell Textile Institute inMassachusetts. Although states continued to found institutions that had broad localsupport, they were no longer the universities of the earlier period.
Differences among StatesState support for public higher education increased greatly from the late 1890s
to 1940, measured either by state spending on higher education or by the growthof enrollments in publicly-controlled institutions relative to all enrollments, or tothe college-aged population. For example, total expenditures of state higher-edu-cation institutions increased from 5.1 percent to 11.0 percent of state and localgovernment spending from 1902 to 1940 (Historical Statistics, 1975, series Y 684-85,F 1). But public funding for higher education and access to public colleges anduniversities varied substantially among states throughout the period. The greatestlevels of support were found in the Pacific, Mountain, and West North Centralstates, and the lowest levels of state support were found in New England and theMiddle Atlantic states.
Since many of the differences in state support for higher education persisttoday—the cross-state correlation between (log) state and local governmentspending per capita on higher education in 1929 and that in 1994 is 0.44—it isinteresting to explore the determinants of state support in the formative years.We will focus our discussion here on 1929, a year chosen to examine state dif-ferences before the expansions of federal support for higher education and justprior to the substantial effects on state and local budgets of the Great Depres-sion. We have also done analyses of cross-state differences in 1924 and 1934,which lead to similar conclusions.
In 1929, state and local government subsidies to higher education averaged$1,089 per 1000 persons across the 48 states, which was 6 percent of total state andlocal government spending. Almost 95 percent of state and local support for highereducation went to publicly-controlled institutions; only in New York (Cornell) andNew Jersey (Rutgers) was state support of privately-controlled institutions of signif-icance. State and local spending on higher education per 1000 inhabitants rangedfrom a low of $458 in New England to a high of $2,057 in the Mountain states.Enrollments in publicly-controlled institutions averaged 3.19 per 1000 inhabitants:from 0.82 in New England to 6.04 in the Mountain states and 6.09 in the Pacific
The Shaping of Higher Education: The Formative Years 53
/ 300f ja03 Mp 53 Friday Dec 17 09:04 AM LP–JEP ja03
states. What explains these substantial differences across regions and among indi-vidual states?
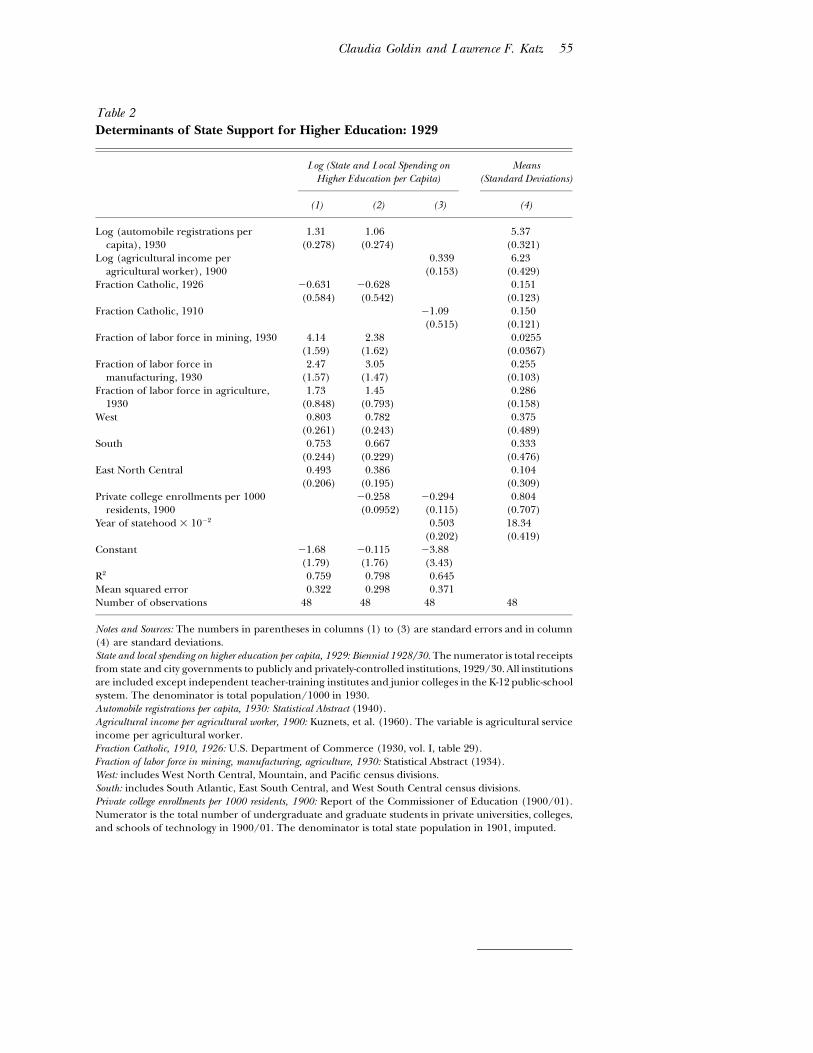
Table 2 explores the determinants of differences across states in (log) stateand local spending per capita on higher education in 1929 in a regression frame-work. The public choice decision to provide support for higher education is likelyto be affected by the level and distribution of wealth or income in a state, by com-munity stability and homogeneity, and by the importance of industries that capturelocalized benefits of research at state institutions.
We use automobile registrations per capita in this period as a measure of boththe level and distribution of wealth since it is, essentially, a count of the fraction ofindividuals wealthy enough to own a car. Thus it proxies for the share of voterssufficiently wealthy to believe their children were likely to attend college. Indeed,we found that automobile registrations per capita is a stronger predictor of statespending on higher education than either per capita property wealth or incomeper capita. Goldin and Katz (1997) similarly find that automobile registrations percapita is the best single predictor of state high school graduation rates during thisperiod. Indeed, the illustrative regression in the first column of Table 2 indicatesa strong positive relationship between automobile registrations per capita and statesupport for higher education. A one standard deviation increase (or 0.32) in reg-istrations is associated with a 0.42 log point (52 percent) increase in state spendingper capita on higher education.
The next variable in the first column of Table 2, percentage Catholic (whichranges across states from 0.2 percent to 50 percent in 1926), is highly correlatedwith the fraction of foreign-born citizens and the fraction of the population inurban areas in a state. All these variables provide measures of the degree of religiousand ethnic heterogeneity in the area and thus the potential for conflict in votingon public expenditures.
The shares of employment in mining, manufacturing, and agriculture are alsopositively related to state support for higher education. The relationship mightemanate from the ability of these sectors to lobby for research, extension, or ex-periment station support at state institutions. It might, as well, come from the beliefof state legislators that the social return on public expenditures was high and thatit would accrue to residents of states that had highly concentrated agriculture,unique manufacturing outputs, and idiosyncratic engineering and mining needs.The next few variables are dummies for geographic regions, which use the North-east as the base group. The Northeast has substantially and significantly lower publicsupport for higher education than do other regions—that is, the coefficient onevery other region is positive and significant—even after including controls forwealth and industrial structure.12
12 Interestingly, some plausible explanatory variables turned out to have insignificant effects. We at-tempted to control for overall state spending by using total state and local government spending in 1932to explain public higher education spending in 1929, but it did not materially affect the magnitude orstatistical significance of any of the effects of other included variables. The results of regressions alongthese lines are similar when the share of the population of college age (15 to 24 years old) is added as
54 Journal of Economic Perspectives
/ 300f ja03 Mp 54 Friday Dec 17 09:04 AM LP–JEP ja03
We add, in column 2, an additional variable to account for the historicalimportance of private colleges and universities. Enrollments in privately con-trolled institutions in 1900 had a significant depressing effect on state publicsupport for higher education in 1929. In fact, the raw correlation between statespending on higher education in 1929 and the importance of private universitiesin the state at the start of the 20th century is 00.69. The magnitude of the effectis also large; the difference between private college enrollments per 1000 resi-dents in Massachusetts and Iowa in 1900 (3.35 to 0.99) implies a difference inper capita spending on higher education between the two states of 61 log pointsor 84 percent.
State initial conditions around 1900 are strong predictors, by themselves, ofstate support for higher education in 1929. In column (3) we include four vari-ables for these initial conditions—the year of statehood, agricultural incomeper agricultural worker in 1900, fraction Catholic in 1910, and private collegeenrollments per 1000 residents in 1900—and find very strong predictive abilityfor them.
To sum up, newer states with a high share of well-to-do families and scantpresence of private universities in 1900 became the leaders in public higher edu-cation by 1930. They remain so today. The tradition of stronger private universitiesand lower support for publicly-controlled universities in the Northeast also contin-ues to the present—the correlation of public college enrollments per capita in 1994with private college enrollments per capita in 1900 is 00.56.
Consequences of the Increased Public Higher EducationEnrollments in the Formative Period
One reason for interest in the growth of public higher education is to under-stand its impact on overall rates of going to college. We therefore explore the factorsthat affected college-going at the state level from 1897 to 1931. Because collegestudents attend school both in and out of their state of residence, we use data onthe college attendance of individuals by their state of residence. Such data havebeen collected by the federal government at various intervals since the 1870s.13 Thepercentage of students attending college who enrolled in their state of residencewas 76.4 percent in 1897, 75.6 percent in 1923, and 80.3 percent in 1931.
an explanatory variable; the variable tends to be insignificant. It is sometimes argued that states thatbrought the university ‘‘to the people’’ through extension services created support for their publicinstitutions. We find, however, that extension funding per capita is not very related to per capita expen-ditures on public higher education. Many southern states like Alabama and South Carolina had highlevels of extension expenditures. It would appear that extension services often substituted for, ratherthan complemented, on-site education and training. Extension funding was just $0.12 per capita ($1.08in 1997 dollars) in 1921, whereas total public expenditure on higher education was $1.09 per capita($10.23 in 1997 dollars) in 1929 (U.S. Department of the Interior, 1923; Biennial 1928/30).13 See Hoxby (1997a, b) for an interesting use of these data to track the evolution of a national marketin education.
Claudia Goldin and Lawrence F. Katz 55
/ 300f ja03 Mp 55 Friday Dec 17 09:04 AM LP–JEP ja03
Table 2Determinants of State Support for Higher Education: 1929
Log (State and Local Spending onHigher Education per Capita)
(1) (2) (3)
Means(Standard Deviations)
(4)
Log (automobile registrations percapita), 1930
1.31(0.278)
1.06(0.274)
5.37(0.321)
Log (agricultural income peragricultural worker), 1900
0.339(0.153)
6.23(0.429)
Fraction Catholic, 1926 00.631(0.584)
00.628(0.542)
0.151(0.123)
Fraction Catholic, 1910 01.09(0.515)
0.150(0.121)
Fraction of labor force in mining, 1930 4.14(1.59)
2.38(1.62)
0.0255(0.0367)
Fraction of labor force inmanufacturing, 1930
2.47(1.57)
3.05(1.47)
0.255(0.103)
Fraction of labor force in agriculture,1930
1.73(0.848)
1.45(0.793)
0.286(0.158)
West 0.803(0.261)
0.782(0.243)
0.375(0.489)
South 0.753(0.244)
0.667(0.229)
0.333(0.476)
East North Central 0.493(0.206)
0.386(0.195)
0.104(0.309)
Private college enrollments per 1000residents, 1900
00.258(0.0952)
00.294(0.115)
0.804(0.707)
Year of statehood 1 1002 0.503(0.202)
18.34(0.419)
Constant 01.68(1.79)
00.115(1.76)
03.88(3.43)
R2 0.759 0.798 0.645Mean squared error 0.322 0.298 0.371Number of observations 48 48 48 48
Notes and Sources: The numbers in parentheses in columns (1) to (3) are standard errors and in column(4) are standard deviations.State and local spending on higher education per capita, 1929: Biennial 1928/30. The numerator is total receiptsfrom state and city governments to publicly and privately-controlled institutions, 1929/30. All institutionsare included except independent teacher-training institutes and junior colleges in the K-12 public-schoolsystem. The denominator is total population/1000 in 1930.Automobile registrations per capita, 1930: Statistical Abstract (1940).Agricultural income per agricultural worker, 1900: Kuznets, et al. (1960). The variable is agricultural serviceincome per agricultural worker.Fraction Catholic, 1910, 1926: U.S. Department of Commerce (1930, vol. I, table 29).Fraction of labor force in mining, manufacturing, agriculture, 1930: Statistical Abstract (1934).West: includes West North Central, Mountain, and Pacific census divisions.South: includes South Atlantic, East South Central, and West South Central census divisions.Private college enrollments per 1000 residents, 1900: Report of the Commissioner of Education (1900/01).Numerator is the total number of undergraduate and graduate students in private universities, colleges,and schools of technology in 1900/01. The denominator is total state population in 1901, imputed.
56 Journal of Economic Perspectives
/ 300f ja03 Mp 56 Friday Dec 17 09:04 AM LP–JEP ja03
The dependent variable is the number of college students by state of residenceas a fraction of those 18 to 21 year-olds in the state. In the first three columns ofTable 3 we present levels regressions for 1897 and 1931, and in the final columnwe show a change regression across the entire period as a function of various initialconditions. The variables included in the first three columns of Table 3 are moti-vated by a model of individual income maximization and by a public choice frame-work (Goldin and Katz, 1997). The first two variables are proxies for per capitaincome or wealth. During this period, the fraction elderly can be thought of as ameasure of community stability. A higher percentage elderly in a state could indi-cate that they are more connected to their community either because the area wasnot recently settled or because the elderly have not migrated from it.14 The fractionCatholic can be thought of as capturing the importance of the foreign-born and/or urban population, and thus telling something about the homogeneity of theelectorate.
Per capita material resources—whether proxied by per capita wealth or agri-cultural income per farm worker (data availability dictates which is used)—was animportant and strong stimulant to college enrollment, as is our measure of com-munity stability, although less so for 1931. In our geographic variables, which shouldagain all be considered relative to the Northeast, the West becomes a more im-pressive, positive outlier toward the end of the period, and the South emerges as anegative outlier.
We are able, for 1931, to measure the impact of public sector tuition and feeson the college enrollment rate. The estimates in column 3 imply that a decrease inpublic sector tuition and fees of one standard deviation in 1931 ($84) increasedthe college enrollment rate of state residents by 1.2 percentage points (or 9 percentof the mean level). This estimation, moreover, holds constant the fraction of youthgraduating from secondary school in the state.
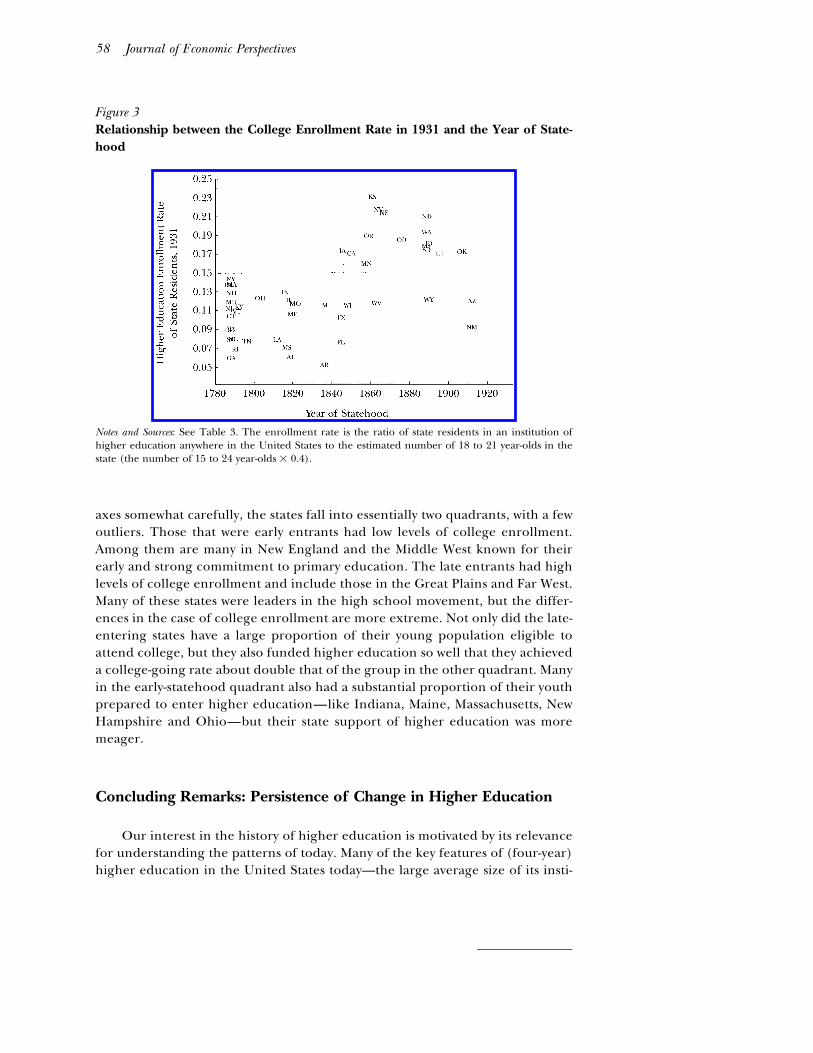
Finally, the regression in column 4 of Table 3 indicates that states with laterdates of statehood had more rapid growth in college enrollment rates from 1897to 1931, even conditioning on initial agricultural income per worker and percentCatholic. Figure 3 shows the positive relationship between the year of statehoodand the college enrollment rate that existed by 1931.15 After drawing in the two
14 In 1910 the states with the highest percentage elderly were in New England, where out-migration ofthe young produced the result. But there is considerable variation among the other states and our resultson secondary schooling are robust to including a dummy variable for New England. Poterba (1997)finds a contrasting result using recent data: a more rapid growth in the percentage elderly is associatedwith lower growth in K–12 spending per child. Hoxby (1998) finds that per pupil spending at the schooldistrict level is positively related to the elderly share of the population in 1900 and 1910, but negativelyrelated in 1990.15 The positive impact of later statehood may originate, in part, in the greater generosity of the federalgovernment over time in granting lands to new states for institutions of higher education. Almost allstates entering after the ‘‘original fifteen’’ (the usual thirteen plus Maine and Vermont) received 72sections of land for a ‘‘seminary’’ or ‘‘university.’’ Some western states entering after 1862 received yetmore, to compensate for Morrill land grants received by previous states (Gates, 1968). Note that therelationship shown in Figure 3 holds even if we exclude the ‘‘original fifteen.’’ Quigley and Rubinfeld(1993) discuss the relationship between state higher education more recently and the year of statehood.

The Shaping of Higher Education: The Formative Years 57
/ 300f ja03 Mp 57 Friday Dec 17 09:04 AM LP–JEP ja03
Table 3Determinants of College Enrollment Rates by State: 1897 and 1931
(1)1897
(2)1931
(3)1931
(4)D(1931–1897)
Log (agricultural income peragricultural worker), 1900
0.0289(0.00743)
0.0492(0.0105)
Log (per capita wealth), 1922 0.0571(0.0170)
0.0472(0.0159)
Fraction ú65 years old, 1900, 1930a 0.993(0.173)
0.418(0.329)
Fraction Catholic, 1910, 1926b 00.00560(0.0188)
00.111(0.0413)
00.0697(0.329)
00.0939(0.0343)
Per student fees in public institutions(000), 1930
00.139(0.046)
Public and private high schoolgraduation rate, 1930
0.187(0.0481)
Year of statehood 1 1003 0.411(0.103)
West 0.0138 0.0321(0.00618) (0.0118)
South 0.0159 00.119(0.00833) (0.0166)
Constant 00.188 00.337 00.273 00.956(0.489) (0.136) (0.115) (0.170)
Mean of dependent variable 0.0396 0.130 0.130 0.0902R2 0.671 0.727 0.756 0.627Root mean squared error 0.0121 0.0257 0.0240 0.0260Number of observations 48 48 48 48
a The 1900 and 1930 figures are used for cols. (1) and (2), respectively.b The 1910 figure is used for cols. (1) and (4); the 1926 figure is used for cols. (2) and (3).Notes:Standard errors are in parentheses. The dependent variable is the number of college students by stateof residence as a fraction of 18 to 21 year-olds in the state.Sources:College enrollment rate of state residents. 1897: Report of the Commissioner of Education 1897 (table 6, pp. 1657–1661); 1931: U.S. Department of the Interior, Office of Education (1934). The numerator is the totalnumber of state residents attending college anywhere in the United States. The totals for each state fromthese residence and migration surveys are adjusted upward, by the same proportion in each year, so thatthe national totals agree with those in Historical Statistics (1975), as adjusted by us (see notes to Figure2). The denominator is the approximate number of 18 to 21-year olds in the state (15 to 24-year olds10.4) from Historical Statistics (1975). It should be noted that the means overstate the actual collegeenrollment rates at the national level for the reasons given in the text.Agricultural income per agricultural worker, 1900: Kuznets, et al. (1960). The variable is agricultural serviceincome per agricultural worker.Per capita wealth, 1922: Statistical Abstract (1925). The variable used is state taxable wealth/state population.Fraction ú65 years old, 1900, 1920, 1930: Historical Statistics (1975, series A 195–209).Fraction Catholic, 1910, 1926: U.S. Department of Commerce (1930, vol. I, table 29).Per student fees in public institutions, 1930: Biennial 1928/30, tables 3b and 6b. The numerator is totalreceipts from all student fees (tuition, room and board, and other fees) of publicly-controlledinstitutions.The denominator is total enrollments (excluding duplicates) of publicly-controlled institutions.Public and private high school graduation rate, 1930: Goldin (1994). The numerator includes all students inpublic high schools, private secondary schools, and the preparatory departments of the nation’s collegesand universities. The denominator is the number of 17-year olds in the state.West: includes West North Central, Mountain, and Pacific census divisions.South: includes South Atlantic, East South Central, and West South Central census divisions.
58 Journal of Economic Perspectives
/ 300f ja03 Mp 58 Friday Dec 17 09:04 AM LP–JEP ja03
Figure 3Relationship between the College Enrollment Rate in 1931 and the Year of State-hood
Notes and Sources: See Table 3. The enrollment rate is the ratio of state residents in an institution ofhigher education anywhere in the United States to the estimated number of 18 to 21 year-olds in thestate (the number of 15 to 24 year-olds 1 0.4).
axes somewhat carefully, the states fall into essentially two quadrants, with a fewoutliers. Those that were early entrants had low levels of college enrollment.Among them are many in New England and the Middle West known for theirearly and strong commitment to primary education. The late entrants had highlevels of college enrollment and include those in the Great Plains and Far West.Many of these states were leaders in the high school movement, but the differ-ences in the case of college enrollment are more extreme. Not only did the late-entering states have a large proportion of their young population eligible toattend college, but they also funded higher education so well that they achieveda college-going rate about double that of the group in the other quadrant. Manyin the early-statehood quadrant also had a substantial proportion of their youthprepared to enter higher education—like Indiana, Maine, Massachusetts, NewHampshire and Ohio—but their state support of higher education was moremeager.
Concluding Remarks: Persistence of Change in Higher Education
Our interest in the history of higher education is motivated by its relevancefor understanding the patterns of today. Many of the key features of (four-year)higher education in the United States today—the large average size of its insti-
Claudia Goldin and Lawrence F. Katz 59
/ 300f ja03 Mp 59 Friday Dec 17 09:04 AM LP–JEP ja03
tutions; the coexistence of liberal arts colleges and research universities; thesubstantial share of enrollment in the public sector; the long-lived and vibrantprivate sector; and the differences in per capita resources provided by the vari-ous states—were shaped during a formative period from 1890 to 1940.
Indeed, it appears that patterns set in the early decades of the 20th century arepersisting today. States in which private institutions had a substantial presence in themore distant past, and in which higher education received scant public support, continueto exhibit similar patterns. Those that entered the union earliest had, in the early 20thcentury and continue to have today, lower public college enrollment rates and lowerstate subsidies for higher education. Even in 1994, the cross-state correlation of publiccollege enrollments per capita with year of statehood is 0.70. The 1994 level of in-statetuition at four-year public universities has a correlation of 00.59 with year of statehood.Similarly, the simple correlation of public college enrollments per capita in 1994 withprivate college enrollments per capita in 1900 is 00.56. That is, states with high privateuniversity enrollments around 1900 continue to provide less support per capita for publicinstitutions of higher education and have lower public college enrollment rates.16 Stateshaving high levels of public support per capita for higher education in the 1920s con-tinue to do so today. The cross-state correlation between (log) state and local governmentspending per capita on higher education in 1929 and that in 1994 is 0.44. The cross-state correlation between public college enrollments per capita in 1929 and that in 1994is 0.61. The weight of history appears to matter considerably in state-level indicatorsregarding higher education.
Data AppendixThe data used in this paper draws heavily upon three sources: the Annual
Report of the Commissioner of Education for 1897 (Report of the Commissioner ofEducation, 1897), and two Biennial Surveys done by the U.S. Office of Educationfor the years 1922–24 and 1932–34 (Biennial, 1922–24; Biennial, 1932–34). Each ofthe three sources contains relatively similar information on the number of studentsin various groups (for example, by sex; by level such as preparatory, undergraduate,and graduate; by type such as collegiate and professional) and revenue sources (forexample, student fees, government grants and private gifts). Total revenues do notinclude additions to endowment, which are listed separately. Students excludethose in summer school, correspondence courses, extension, and military drill.
Institution level data similar to those we have used are available in printedform for most years from 1890 to 1938. The 1934 data set includes 853 institutions,711 privately controlled and 142 publicly controlled. That for 1924 has 790, with677 private and 113 public. In the 1897 there were 534 universities and collegeslisted separately from professional and theological schools, and technical institutes.We added the last three groups, but only for institutions not on the original list.
16 Data on public college enrollments and in-state tuition levels for 1994 are from U.S. Department ofEducation (1996).
60 Journal of Economic Perspectives
/ 300f ja03 Mp 60 Friday Dec 17 09:04 AM LP–JEP ja03
(The added institutions have information on students and faculty only.) The final1897 sample contains 821 institutions, of which 717 were private and 104 public.We did not code institutions that were junior colleges in the given year. Separatelylisted independent teaching colleges and normal schools were not coded.
The 1924 listing contains the ‘‘date at first opening,’’ which can be differentfrom the date of founding, and was checked against the date of first instruction inAmerican Council on Education (1960). We linked the 1924 schools to those in1934 and used several other guides, such as The College Blue Book (1933), for thehistories of institutions that changed city or name, or merged with or split off fromothers. Of the 790 schools in 1924, 695 were linked to institutions on the 1934 list.Among those that were not theological seminaries and independent professionalschools in 1924, the linkage rate is 91.5 percent.
Except in the case of the historically-black institutions, we were able to findvirtually all—if not all—publicly-controlled institutions known to have existed ineach of the three years: 1897, 1924, and 1934. In both 1897 and 1924 many of thepublicly controlled, historically-black institutions of today were not listed, althoughsome were. We have traced the histories of these institutions and believe they wereomitted from the college list because they were correctly categorized as teachingcolleges or industrial institutes. Thus we are reasonably certain that the publicly-controlled sample is complete. We used the historical information in AmericanCouncil on Education (1960) for our institutional categorization and were helpedby the contemporaneous information in The College Blue Book (1933).
In the data underlying Figure 2, an attempt was made (by us and by the gov-ernment) to include the total number of regular, residential students at the collegelevel without duplication. That is, all collegiate, graduate, and professional students,but not preparatory students (nor summer school, correspondence school, andspecial students), should be in both the numerator and the denominator. The U.S.Department (Office) of Education appears to have revised its totals at various in-tervals. The totals that appear in Historical Statistics (1975, series H 706) are thosecorrected figures. The contemporaneous enrollment numbers for the publicly-controlled institutions appear to be correct. The implied data for the privately-controlled institutions (obtained by subtraction) are considerably less stable overtime than they probably were and we have therefore adjusted them by interpolation.These adjustments slightly affect some of the totals for 1897 to 1912. Publicly-controlled institutions include those at the state, city, and national levels.
j We acknowledge generous support from the National Science Foundation for our researchand from the Russell Sage Foundation and the Spencer Foundation for our 1997-98 academicleave. We thank Cheryl Seleski and Kerry Woodward for their superb assistance in the codingof the higher education data set. Conversations with Caroline Minter Hoxby, Andrei Shleifer,Marcus Stanley, and John Wallis helped us formulate some of the ideas in this paper, andAlan Krueger encouraged us to write this paper by commenting on an earlier version. Weacknowledge the comments of seminar participants at Queens College CUNY, the NBER HigherEducation Conference, and the NBER Summer Institute. We are particularly grateful to Sarah
The Shaping of Higher Education: The Formative Years 61
/ 300f ja03 Mp 61 Friday Dec 17 09:04 AM LP–JEP ja03
Turner, our discussant at the JEP Symposium on the Economics of Higher Education, forcomments and to Timothy Taylor for helping make the paper more readable and intelligible.
References
Note: We have used an abbreviated notation to refer tovarious U.S. government publications. These includethe Biennial Reports, the Reports of the Commissionerof Education (also called the Annual Reports), the Sta-tistical Abstract, Historical Statistics, and the EconomicReport of the President. In the case of the first three, weuse the date(s) of the report rather than the publicationdate of the document.
Abbott, Andrew. 1988. The System of Professions:An Essay on the Division of Expert Labor. Chicago,IL: The University of Chicago Press.
Allen, Garland. 1979. ‘‘The Transformation ofa Science: T. H. Morgan and the Emergence ofa New American Biology,’’ in The Organization ofKnowledge in Modern America, 1860–1920. Alex-andra Oleson and John Voss, eds. Baltimore,MD: Johns Hopkins University Press.
American Council of Learned Societies. 1996.American Council of Learned Societies Directory ofConstituent Societies, 1996–97. New York, NY:American Council of Learned Societies.
American Council on Education. 1960. Amer-ican Universities and Colleges. Mary Irwin, ed.Washington, D.C.: American Council on Edu-cation.
Bates, Ralph. 1965. Scientific Societies in theUnited States. Cambridge, MA: The MIT Press.
Biennial [years]. The full citation is generally:U.S. Bureau of Education. [years]. Biennial Surveyof Education [years]. Washington, D.C.: G.P.O.
Brubacher, John S. and Willis Rudy. 1958.Higher Education in Transition: An American His-tory: 1636–1956. New York, NY: Harper andBrothers Publishers.
College Blue Book. 1933. The 1933 College BlueBook. Huber William Hurt and Harriett-JeanneHurt, eds. Hollywood by-the-Sea, FL: The Col-lege Blue Book.
Economic Report of the President [year]. Thefull citation is: Council of Economic Advisors.[year]. The Economic Report of the President. Wash-ington, D.C.: G.P.O.
Gates, Paul W. 1968. History of Public Land LawDevelopment. Washington, D.C.: G.P.O.
Goldin, Claudia. 1994. ‘‘Appendix to: HowAmerica Graduated from High School: An Ex-ploratory Study, 1910 to 1960.’’ National Bureau
of Economic Research-Development of theAmerican Economy Working Paper, No. 57,June.
Goldin, Claudia. 1998. ‘‘America’s Graduationfrom High School: The Evolution and Spread ofSecondary Schooling in the Twentieth Century.’’Journal of Economic History. June, 58, pp. 345–74.
Goldin, Claudia and Lawrence F. Katz. 1997.‘‘Why the United States Led in Education: Les-sons from Secondary School Expansion, 1910 to1940.’’ National Bureau of Economic ResearchWorking Paper, No. 6144, August.
Goldin, Claudia and Lawrence F. Katz. 1998.‘‘The Shaping of Higher Education: The For-mative Years in the United States, 1890 to 1940.’’NBER Working Paper no. 6537, April.
Goldin, Claudia and Lawrence F. Katz. Forth-coming, 1999. ‘‘Human Capital and Social Cap-ital: The Rise of Secondary Schooling in Amer-ica, 1910 to 1940.’’ Journal of Interdisciplinary His-tory. XXIX, pp. 683–723.
Handlin, Oscar and Mary F. Handlin. 1970.The American College and American Culture. NewYork: McGraw Hill.
Hart, Oliver, Andrei Shleifer and Robert W.Vishny. 1997. ‘‘The Proper Scope of Govern-ment: Theory and an Application to Prisons.’’Quarterly Journal of Economics CXII, November,pp. 1127–1161.
Hight, Joseph E. 1976. ‘‘The Demand forHigher Education in the U.S. 1927–72; The Pub-lic and Private Institutions.’’ Journal of Human Re-sources. X, December, pp. 512–520.
Historical Statistics. 1975. The full citation is: U.S.Department of Commerce, Bureau of the Census.1975. Historical Statistics of the United States from Colo-nial Times to 1970. Washington, D.C.: GPO.
Hofstadter, Richard and C. DeWitt Hardy.1952. The Development and Scope of Higher Educa-tion in the United States. New York: Columbia Uni-versity Press.
Hoxby, Caroline M. 1997a. ‘‘The ChangingMarket Structure of U.S. Higher Education.’’Unpublished paper. Harvard University.
Hoxby, Caroline M. 1997b. ‘‘How the Chang-ing Market Structure of U.S. Higher EducationExplains College Tuition.’’ National Bureau of
62 Journal of Economic Perspectives
/ 300f ja03 Mp 62 Friday Dec 17 09:04 AM LP–JEP ja03
Economic Research Working Paper No. 6323,December.
Hoxby, Caroline M. 1998. ‘‘How Much DoesSchool Spending Depend on Family Income?The Historical Origins of the Current School Fi-nance Dilemma.’’ American Economic Review. May,88, pp. 309–14.
Jaffe, Adam B. 1989. ‘‘Real Effects of Aca-demic Research.’’ American Economic Review. De-cember, 79, pp. 957–70.
Kaplan, David L. and M. Claire Casey. 1958.Occupational Trends in the United States, 1900 to1950. Bureau of the Census Working Paper No.5. Washington, D.C.: G.P.O.
Kevles, Daniel. 1979. ‘‘The Physics, Mathemat-ics, and Chemistry Communities: A ComparativeAnalysis,’’ in The Organization of Knowledge in Mod-ern America, 1860–1920. Alexandra Oleson andJohn Voss, eds. Baltimore, MD: Johns HopkinsUniversity Press.
Kiger, Joseph C. 1963. American Learned Socie-ties. Washington, D.C.: Public Affairs Press.
Kiger, Joseph C. 1982. Research Institutions andLearned Societies. Westport, CT: Greenwood Press.
Kimball, Bruce A. 1992. The ‘‘True ProfessionalIdeal’’ in America: A History. Cambridge MA andOxford UK: Blackwell Publishers.
Kuznets, Simon, Ann Ratner Miller and Ri-chard A. Easterlin. 1960. Population Redistributionand Economic Growth: United States, 1870–1950.Vol. II. Analyses of Economic Change. Philadelphia,PA: The American Philosophical Society.
Levine, David O. 1986. The American College andthe Culture of Aspiration, 1915–1940. Ithaca, NY:Cornell University Press.
Nevins, Allan. 1962. The State Universities andDemocracy. Urbana, IL: University of Illinois Press.
Oleson, Alexandra and John Voss. 1979. TheOrganization of Knowledge in Modern America,1860–1920. Baltimore, MD: Johns Hopkins Uni-versity Press.
O’Neill, June. 1971. Resource Use in Higher Ed-ucation: Trends in Output and Inputs, 1930 to 1967.Berkeley, CA: Carnegie Commission on HigherEducation.
Poterba, James M. 1997. ‘‘Demographic Struc-ture and the Political Economy of Public Edu-cation.’’ Journal of Policy Analysis and Management.16, pp. 48–66.
Quigley, John M. and Daniel L. Rubinfeld.1993. ‘‘Public Choices in Public Higher Educa-tion,’’ in Studies of Supply and Demand for HigherEducation. Charles T. Clotfelter and MichaelRothschild, eds. Chicago, IL: University of Chi-cago Press.
Report of the Commissioner of Education[year]. Full citation is: U.S. Department of theInterior. Office of Education. [year] Report of the
Commissioner of Education for [year]. Washington,D.C.: G.P.O.
Rosenberg, Nathan and Richard R. Nelson.1993. ‘‘American Universities and Technical Ad-vance in Industry.’’ CEPR Publication No. 342,Stanford University.
Ross, Dorothy. 1979. ‘‘The Development ofthe Social Sciences,’’ in The Organization of Knowl-edge in Modern America, 1860–1920. AlexandraOleson and John Voss, eds. Baltimore, MD: JohnsHopkins University Press.
Rossiter, Margaret W. 1979. ‘‘The Organiza-tion of the Agricultural Sciences,’’ in The Orga-nization of Knowledge in Modern America, 1860–1920. Alexandra Oleson and John Voss, eds. Bal-timore, MD: Johns Hopkins University Press.
Starr, Paul. 1982. The Social Transformation ofAmerican Medicine. New York, NY: Basic Books.
Statistical Abstract [year]. The full citation is:U.S. Department of Commerce. [year] StatisticalAbstract of the United States. [year]. Washington,D.C.: G.P.O.
U.S. Bureau of Education. 1909. Statistics ofState Universities and Other Institutions of Higher Ed-ucation Partially Supported by the State for 1908. Bul-letin, 1908. No. 8. Washington, D.C.: G.P.O.
U.S. Bureau of Education. 1913. Statistics ofState Universities and Other Institutions of Higher Ed-ucation Partially Supported by the State for 1912. Bul-letin, 1912. No. 33. Washington, D.C.: G.P.O.
U.S. Department of Commerce. 1930. ReligiousBodies: 1926. Volume I: Summary and DetailedTables. Washington, D.C.: G.P.O.
U.S. Department of Education, National Cen-ter for Education Statistics. 1996. Digest of Edu-cation Statistics 1996. Washington, D.C.: G.P.O.
U.S. Department of Education, National Cen-ter for Education Statistics. 1998. The Conditionof Education 1998. Washington, D.C.: G.P.O.
U.S. Department of Health, Education, andWelfare. 1961. Opening (Fall) Enrollment in HigherEducation, 1960. Analytic Report by Edith M.Huddleston. Washington, D.C.: G.P.O.
U.S. Department of the Interior, Bureau ofEducation. 1924. Statistics of State Universities andState Colleges for 1923. Bulletin, 1924, No. 26.Washington, D.C.: G.P.O.
U.S. Department of the Interior, Bureau ofEducation. 1923. Statistics of Land-Grant Colleges byL. E. Blauch. Bulletin, 1922, No. 34. Washington,D.C.: G.P.O.
U.S. Department of the Interior, Office of Ed-ucation. 1934. Residence and Migration of CollegeStudents by Frederick J. Kelly and Betty A. Patter-son. Pamphlet No. 48. Washington, D.C.: G.P.O.
Veysey, Laurence R. 1965. The Emergence of theAmerican University. Chicago: The University ofChicago Press.

This article has been cited by:
1. Dongwoo Yoo. 2011. Height and death in the Antebellum United States: A view through the lens of geographically weightedregression. Economics & Human Biology . [CrossRef]
2. Cory Koedel. 2011. Higher education structure and education outcomes: evidence from the USA. Education Economics 1-20.[CrossRef]
3. Thomas Gould. 2011. Fear and Loathing in the Fog: The Perceived (and Persistent) Vagaries of Tenure Standards AmongMass Communication Professors. Publishing Research Quarterly 27:1, 36-53. [CrossRef]
4. John Bound, Sarah TurnerDropouts and Diplomas 4, 573-613. [CrossRef]
5. J. Stanley Metcalfe. 2010. University and Business Relations: Connecting the Knowledge Economy. Minerva 48:1, 5-33.[CrossRef]
6. A. Abigail Payne, Joanne Roberts. 2010. Government Oversight of Public Universities: Are Centralized Performance SchemesRelated to Increased Quantity or Quality?. Review of Economics and Statistics 92:1, 207-212. [CrossRef]
7. Richard E. Just, Wallace E. Huffman. 2009. The economics of universities in a new age of funding options#. Research Policy38:7, 1102-1116. [CrossRef]
8. William R. Johnson, , Sarah Turner, . 2009. Faculty without Students: Resource Allocation in Higher Education. Journal ofEconomic Perspectives 23:2, 169-189. [Abstract] [View PDF article] [PDF with links]
9. Clayne Pope. 2009. Measuring the distribution of material well-being: U.S. trends#. Journal of Monetary Economics 56:1,66-78. [CrossRef]
10. Alexis Walckiers. 2008. Multi-dimensional contracts with task-specific productivity: an application to universities.International Tax and Public Finance 15:2, 165-198. [CrossRef]
11. Dongbin Kim, John L. Rury. 2007. The Changing Profile of College Access: The Truman Commission and EnrollmentPatterns in the Postwar Era. History of Education Quarterly 47:3, 302-327. [CrossRef]
12. Scott E. Masten. 2006. Authority and Commitment: Why Universities, Like Legislatures, Are Not Organized as Firms. Journalof Economics <html_ent glyph="@amp;" ascii="&"/> Management Strategy 15:3, 649-684. [CrossRef]
13. Nicole M. Fortin. 2006. Higher-Education Policies and the College Wage Premium: Cross-State Evidence from the 1990s.American Economic Review 96:4, 959-987. [Abstract] [View PDF article] [PDF with links]
14. Kjetil Bjorvatn, Alexander W. Cappelen. 2006. Redistribution and the Nature of Altruism: Should Welfare Programs beCentralized or Decentralized?. Economics of Governance 7:2, 133-142. [CrossRef]
15. Bridget Terry Long. 2004. Does the Format of a Financial Aid Program Matter? The Effect of State In-Kind Tuition Subsidies.Review of Economics and Statistics 86:3, 767-782. [CrossRef]
16. R Ehrenberg. 2004. Econometric studies of higher education. Journal of Econometrics 121:1-2, 19-37. [CrossRef]
17. J Bound. 2004. Trade in university training: cross-state variation in the production and stock of college-educated labor. Journalof Econometrics 121:1-2, 143-173. [CrossRef]
18. JOHN LYNCH, GEORGE DAVEY SMITH, SAM HARPER, MARIANNE HILLEMEIER, NANCY ROSS, GEORGE A.KAPLAN, MICHAEL WOLFSON. 2004. Is Income Inequality a Determinant of Population Health? Part 1. A SystematicReview. The Milbank Quarterly 82:1, 5-99. [CrossRef]
19. Elizabeth Becker, Cotton M. Lindsay, Gary Grizzle. 2003. The derived demand for faculty research. Managerial and DecisionEconomics 24:8, 549-567. [CrossRef]
20. J. Lynch. 2003. Commentary: Plugging leaks and repelling boarders--where to next for the SS Income Inequality?.International Journal of Epidemiology 32:6, 1029-1036. [CrossRef]
21. Janet Currie, Enrico Moretti. 2003. Mother's Education and the Intergenerational Transmission of Human Capital: EvidenceFrom College Openings*. Quarterly Journal of Economics 118:4, 1495-1532. [CrossRef]
22. Marcus Stanley. 2003. College Education and the Midcentury GI Bills*. Quarterly Journal of Economics 118:2, 671-708.[CrossRef]
23. Tina Isaacs. 2001. Entry to University in the United States: The role of SATs and Advanced Placement in a competitivesector. Assessment in Education: Principles, Policy & Practice 8:3, 391-406. [CrossRef]