the shock and vibration bulletin - dticthe shock and vibration bulletin may 1982 h ai:ce-ion for-1...
TRANSCRIPT
l fILE COPYiBui s2(Part 1 of S Parts)
to
THESHOCK AND VIBRATION
BULLETIN
Part 1Welcome, Keynote Address,
Invited Papers, Rotor Dynamics and Machinery Vibration
MAY 1982I LTICNOV 19 8a
A Publication of S DTHE SHOCK AND VIBRATION L
INFORMATION CENTERNaval Research Laboratory, Washington, D.C.
OlilcOfThe Under Secretary of Defensefor Research and Engineering
Apprved for puMsi releaw. distrihutio unhited
87 10 28 1)k

·•·
THIS DOCUMENT IS BEST QUALITY AVAILABLE. THE COPY
FURNISHED TO DTIC CONTAINED
A SIGNIFICANT NUMBER OF
PAGES WHICH DO NOT
REPRODUCE LEGIBLYo

BLANK PAGES IN THIS DOCUMENT WERE NOT FILMED
SYMPOSIUM MANAGEMENT
THE SHOCK AND VIBRATION INFORMATION CENTER
u i Henry C. Pusey, DirectorRudolph H. Volin
J. Gordan ShowalterJessica Hileman
Elizabeth A. McLaughlin
Bulle. Prduction
Publications Branch. Technical Information Division,Naval Research Laboratory

Bulletin 52(Part 1 of 5 Parts)
THESHOCK AND VIBRATION
BULLETIN
Ai:ce-ion ForMAY 1982 H -1
NTIS CRA.&I
A Publication ofTHE SHOCK AND VIBRATION
INFORMATION CENTER I
Naval Research Laboratory, Washington, I).C. 0 .. '
1 1
IA-,I L
The 52nd Symposium on Shock and Vibration was held at the Montele-one Hotel, New Orleans, LA on October 26-28, 1981. The DefenseNuclear Agency, Washington, D.C. and the U.S. Army WaterwaysExperiment Station, Vicksburg, MS were Co-Hosts.
Office ofThe Under Secretary of Defensefor Research and Engineering

CONTENTSPAPERS APPEARING IN PART 1
Welcome
WELCOME ............... IColo0n el Ti f o Id (ke el, C omnduw r /D ire ct or, . Ar my Wa ter*wa *ys *K 'Iw Expermnt-Stati on, Vlckasbur MS8
KEYNOTE ADDRESS ... 3Marvin Atkins, Director. fesv n SaeSses Off"ic, of the Undtecetryof Defense*
Research Engineering, Departmnent of Defense, Washington, DC
'IQUIPMENT SURVIVAIITY ON THE R11TEGRATED BATTLEFIELD %.. ................... 5. Cals N. Davidson, Technical Director, U.S. Amy Nuclear and Chemical Agenvy, Sprinfil, VA
rNAVAL OPERATIONS IN A NUCLEAR ENVIRONMENT............................................... 11Captain Donald Aldurson, U.S.N., Acting Chief, Tactica! Nuclear Weapons, Pmoject Office (PM-U8)Department of the Navy, Washington, DC
SURVIVABILITY REQUIREMENTS FOR PFTURE AIR ]FORCE)WSTEMS............. ....... 3Henry F. Cooper, Deputy for Strategic and Space Bystoms, AssistantSera3>fthAiFoc(Research. Development and Logistics), Washington, DC
NUCLEAR MARDNESS*FALIDATION TESTING ..................................................... 1741 Edward Conrad, Deputy Director (Science ~iTcn~g). Delose Nuclear Agency, Washington, DC
ELIAS KLEIN MEMORIAL LECTURE - THE ~HNINGAGMSIONSAW QUALIFICATIONMET fUIG... ........ 835H. ormn AxamonVic-PrsidntEngleeingSciencea, Southwest Research Institute, San Anitonio, TX
REQUIRED DEVELOPMENTMST URUCTURALYNANICS ........................................... 49B en K. Wads, Jet Propulsion Laboratory, Puaedena CA
EFFECT Of hEALS ON ROTORAYWI'EMS ............................................... 5.k David P. Fleming. NASA, Lewis Research Center, Cleveland, OHl
MACHINERY VIBRATION 11VALUATION TWCHIQUES .............................................. 67R. L. Ehlean, The Vibration Institute, Clarendon Hills, IL
SHAFT VIBRATION MEASUREMENT AftD ANALYSIS T*IMNIQUES.................... 1Donald E. Bentdy, President, Bontdy Nevada Corporation, Minden, NV
4 Roter Dywomsic and Machinery Vibraion
SPIN TEST VIBRATIONS OF WENDULOUSLYAUPPORTEIWIUC/gYUNDER OTORS.;....................... 95- F. H. Wolff and A. J. Molna, Westinghouse Research and Development Canter, Pittsburgh, PA
MODAL ANALYSIS AS A TOOL IN THE EVA LUATION OIF A TURBINE WHEEL FAILURE................... 101.1A. L. Motta and R. L Leom, Franklin Research Center, Philadelphia, PA
CONTRIBUTION 7 TAE DYNAMIC 9EHAVIOUR oF FLEXIBLE uMA~iMSu .......... ........ 135Z. lesso, J. Dar Hagopian and M. Laane, Institut National des Sciences Appiquoes, llewbanfle, France
SELF-EXCITED VIBRATION OFA NONLINEAR SYSTEMWiIT RANDOM PARAMETERS ..................... 135R. A. Ibrahim, Toma Tech UnIve wity, Lubbock. TX
PAPERS APPEARING IN PART 2
bnted per
Spece filmtl. Load and Dynamics
SPACE SHUTTLE MAIN ENGINE (88ME) POGO TESTING AND RESULTSJ. R. Fenwick, Rockwell Interatioal, Rockedyne Division, CnoP Park, CA adJ. H. Jones aid R. E. Jewell, NASA, Marshall Spae. Flight Center, Huntsville, AL
SPACE SHUTTLE SOLID ROCKET BOOSTER WATER ENTRY CAVITY COLLAPSE LOADSR. T. Keefe and E. A. Rawls, Chryder Corporation. Rdl, LA andD. A. Krom, NASA, Marehall Spece Flight Center, Huntsville, AL
SPACE SHUTTLE SOLID ROCKET BOOSTER REENTRY AND DECELERATOR SYSTEMLOADS AND DYNAMICS
R. Moog, Martin Marietta/Denver Division, Denver, CO and D. Kros, NASA,Marshall Space Flight Center, Huntsville, AL
INVESTIGATION OF SIDE FORCE OSCILLATIONS DURING STATIC FIRING OF THESPACE SHUTTLE SOLID ROCKET MOTOR
M. A. Bebring, Thiokol Corporation/Wasetch Division, Brigham City, UT
Spe Shutsle Dab SpAems
DEVELOPMENT OF AN AUTOMATED PROCESSING AND SCREENING SYSTEM FOR THESPACE SHUTTLE ORBITER FLIGHT TEST DATA
D. K. McCutchen, NASA, Johnson Space Center, Houston, TX, J. F. Bross, Lockheed Engineering andManagement Services Company, Inc., Houston, TX and W. . Palm, McDonnell Douglas Corp., Houston, TX
DEVELOPMENT OF A VIBROACOUSTIC DATA BASE MANAGEMENT ANDPREDICTION SYSTEM FOR PAYLOADS
F. J. On, NASA, Goddard Spece Flight Center, Gr9enbet, MD andW. Hendricks, Lockheed Misdles and Space Company, Sunnyvale, CA
AUTOMATION OF VIBROACOUSTIC DATA BANK FOR RANDOM VIBRATION CRITERIA DEVELOPMENTR. C. Ferebee, NASA, Marshall Space Flight Center, Huntsville, AL
THE DEVELOPMENT AND VERIFICATION OF SHUTTLE ORBITER RANDOMVIBRATION TEST REQUIREMENTS
M. C. Coody, NASA, Johnson Space Center, Houston, TX, H. K. Pratt, Rockwell Intneational Corporation,Downey, CA and D. E. Newlough, Management and Technical Service. Corporation, Houston, TX
SPACE SHUTTLE ORBITER ACOUSTIC FATIGUE CERTIFICATION TESTINGR. A. Stevens, Rockwell International, Downey, CA
Spae Suttle Tham" Potecue systems
STRUCTURAL CHARACTERISTICS OF THE SHUTTLE ORBITER CERAMIC THERMAL PROTECTION SYSTEMP. A. Cooper, NASA, Langley Research Center, Hampton, VA
SHUTTLE TILE ENVIRONMENTS AND LOADSR. J. Muraca, NASA, Langley Research Center, Hampton, VA
DYNAMIC AND STATIC MODELING OF THE SHUTTLE ORBITERS THERMAL PROTECTION SYSTEMJ. M. Housner, G. L. Giles and M. Vallee, NASA, Langley Research Center, Hampton. VA
BUFFET LOADS ON SHUTTLE THERMAL-PROTECTION-SYSTEM TILESC. F. Coe, NASA, Ames Resew.h Center, Moffett Field. CA
UNSTEADY ENVIRONMENTS AND RESPONSES OF THE SHUTTLE COMBINED LOADS ORBITER TESTP. H. Schuetz, Rockwell International, Downey, CA andL. D. Pinson and H. T. Thornton, Jr., NASA, LAngley Research Center, Hampton, VA
kv

Spc Nue Main a f Dyamc
VIBRATION MATURITY OF THE SPACE SHUTTLE MAIN ENGINESR. W. Laon and B. Mogil, Rockwell Internationalltcketdlyue Division, Canoga Park. CA
STRUCTURAL RESPONSE OF THE S5ME FUEL FEEDLINE TO UNSTEADY SHOCK OSCILLATIONSE. W. Laron, G. H. Ratekin and G. M. O'Connor, Rockwell International/Rocletdyne Division, Canoga Park, CA
PAPERS APPEARING IN PART 3
hviromsai Testig ad Sisistio
DIGITAL CONTROL OF A SHAKER TO A SPECIFIED SHOCK SPECTRUMJ. F. Unruh, Southtweet Research Institute. San Antonio. TX
GUNFIRE VIBRATION SIMULATION ON A DIGITAL VIBRATION CONTROL SYSTEMJ. Cies, Hewlett-Packard Company. Pamus, NJ
MEASUREMENT OF ALL COMPONENTS OF STRAIN BY A 3-D FIBER OPTIC STRAIN GAGES. Edelman and C. M. Davis, Jr., Dynamic Systems, Inc., McLean. VA
REGISTRATION OF THREE SOIL STRESS GAGES AT 0 THROUGH 28 MW. (4000 psi)C. R. Welch, U.S. Amy Engbnee Waterways Experiment Station, Corps of Eaginears, Vicksburg, MS
CABLE PROTECTION FOR GROUND SHOCK INSTRUMENTATION IN SEVERE ENVIRONMENTS-RESULTS OF AN EVALUATION TEST
C. R. Welch, U.S. Army Eqnner Waterways Ezpariment Station, Corps of Engineer. Vicksburg, MS
STRUCTURAL RESPONSE OF HEPA FILTERS TO SHOCK WAVESP. R. Smith, New Mexico tae University, La. Cruces, NM and W. S. Gregory, Los Ama.c National Laboratory,La. Mlamo NM
A TECHNIQUE COMBINING HEATING AND IMPACT FOR TESTING REENTRY VEHICLE IMPACTFUZES AT HIGH VELOCITIES
R. A. Benham, Sandia National Labaratlee N1Abuquerque, NM
USE OF A DROPPED WEIGHT TO SIMULATE A NUCLEAR SURFACE BURSTC. R. Welch and S. A. Eiger, U.S. Amy Engineer Waterways Experiment Station,Corps of Enginers Vicksburg, MS
ANALYSIS AND TESTING Of A NONLINEAR MISSILE AND CANISTER SYSTEMR. G. Benson, A. C. Deerhake and G. C. McKinnis, General Dynamics/Convair Division, San Diego, CA
BIO.DYNAMIC RESPONSE OF HUMAN HEAD DURING WHOLE-BODY VIBRATION CONDITIONSB. K. N. Roo, Birmlnghim Polytechnic, Perry Bear, England
rdo aseboesaf
YC.15 EXTERNALLY BLOWN FLAP NOISECapt. L G. Peck, Flight Dynamics Laboratory, Air force Wright Aeronautical Laboratories,
DETERMINATION OF THE DYNAMIC ENVIRONMENT OF THE F/FB-1I I TAIL POD ASSEMBLY
J. Chinn and P. Bols, Air Force Wright Aeronautical Laboratories, Wright-Patteriofl APB, OH
AN ASSESSMENT OF THE A-1l's CAPABILITY TO OPERATE ON ROUGH SURFACEST. G. Gerardi and D. L. Moris, Air Force Wright Aeronautical Laborsaries. Wright-Patterson AFB, OH
SUBCRITICAL FLUTTER TESTING USING THE FEEDBACK SYSTEM APPROACHC. D. Turner. North Carolina State University, Ralig, NC
TOMAHAWK CRUISE MISSILE FLIGHT ENVIRONMENTAL MEASUREMENT PROGRAMR. S. Itsn baur and F.L. Gloyna, General Dynsaics/Convair Division, San Diego, CA
TEST PROGRAM TO DEVELOP VIBROACOUSTICS TEST CRITERIA FOR THE GALILEO0 BUSD. L. Kern and C. D. Hayes, Jet Propulsion Laboratory, California Institute of Technology, Pedena, CA
SLV-3 FLIGHT VIBRATION ENVIRONMENTS. A. Palankaam, 0. Muthueman end P. Dlaclmniran, Aerospace SbuctUm Division,Vlkram Smrbbal Space Conta, Trivaenim, India
PAPERS APPAING IN PART 4
Fledg. end Random Loaing
FATIGUE LIFE PREDICTION FOR VARIOUS RANDOM STRESS PEAK DISTRIBUTlIONSIt. G. Imsbeut, General Dectric Company. Aiezaft Equipmnt Division, Utica NY
FATIGUE LIFE EVALUATION, STOCHASTIC LOADING AND MODIFIED LIFE CURVESM. A Menoufy, H. H. Z. Lsibos ad T. H. Topper, Univerity of Waterloo, Waterloo, Ontario, Canada
THE EFFECTS oF ENDURANCE LIMIT AND CuRES FACTOR ON TIME To FAILUREUNDER RANDOM WOADING
A. J; Coftis end S. M. Mat, Hghe Akcraft Company, Cuve Cty, CA
SINGLE POINT RANDOM MODAL TEST TECHNOLOGY APPLICATION TO0 FAILURE DETECTIONW. M. Wes., Jr., NASA Johnson Spent Center. Houston. TX
FORCED VIBRATIONS OF A LARGE DAMPED MECHANICAL SYSTEMD. W. Nidclson, Nava Sushes Weapons Canter, Whit COkOw Elvr i MD
INDIRECT FOURIER, TRANSFORM (1Ff) AND SHOCK, REfPONSE - A DETAILEDPRESENTATION OF BANC THEORY
C. T. Morrow. Raciadlea. CA
Ouea aslhim. mal Damping
ACTIVE VIBRATION CONTROL OF LARGE FLEXIBL STRUCTUREST. T. Soon and J. C. H. Clmeg. tate LWveri of Now York at Bodkn, Buffalo, MY
FORCE OPTIMIZED RECOIL CONTROL SYSTEMP. 1. Townsend, U.S. Army Aesmimu Reame end Devslapmont Commend, Dover, NJ,R. J. RaIldswica, U.S Army Armamnt Resarchaend Devdopent Comand, Rock Isend, IL andR. F. Gartner, Hoseywell, Inc., Eina. MN
PERFORMANCE ANALYSIS OF KIOH.WEE HYDRAULIC SUPENSION SYSTEMS INMULTIPLE WHEELE LAND TRANSPORTERS
P. Woods, Mdia 11t1t- Corpsoraton Denver, O
NONLINEAR ANALYSIS OF PNEUMATIC FORCE GENERATORS USED FOR VIBRATION CONTROLS. Saikar, Concerdia Univeraity, Most"ha, Quebe, Onimim, R. R. Ousmtur, Union College, Schenectady, NY.and S. G. Kalmber, Nlecon Asoclate, Inc., West Long kenc NJ
REDUCTION OF HYDRAULIC LINE OSCILLATING PRESSURES INDUCED BY PUMP CAVITATION0. Druhek P. Marino end M. Der- I , Grimmi Aereepace Corpormdion, Bethpae, NY
RUBBER ISOLATOUS FOR THE ADATS MISSILEJ. FrOtt, (kkonfi-Bubue ekmdlefbk Zurich, CHI endC. F. Ollsm, Msat M I --e Orlando Aerospace, OWlNdo, FL
TIME AND TEMPERATURE EFFECTS ON CUSHIONSG.5. Mustin, Neeal Sm Sysliem Command, Washinulon, DC
EXTRANEOUS EFFECTS IN DAMPING MEASUREMENTR. J. Hoohir, University of Quessudand. Quessniuid, Australia endS. Pmerini, Pince of son"kia veity, Heqal Thailand
DYNAMIC ANALYSIS oF A LARGE STRUCTURE WITH ARTIFICIAL DAMPINGQ. L. Than, D. X. Urn, Y. P.11 and D. F. Wang, Insttute of Mechanics,inlie tse Academy of Science, Bijing, China
AN EXPERIMENTAL ST'UDY OF THE NONLINEAR BEHAVIOUR OF A STRANDED CABLEAND DRY FRICTION DAMPER
C. S. Chang ad Q. Tien, InwiUte of Mechanics, The Chines Academy of Sciences, Deijfing, China
LMi
RESPONSE OF PNEUMATIC ISOLATOR TO STANDARD PULSE SHAPES
M. S. Hundid, The University of Vermont, Burlington, VT
PAPERS APPEARING IN PART S
DAMPED STRUCTURE DESIGN USING FINITE ELEMENT ANALYSISM. F. Kluesner and M. L. Drake, University of Dayton Research Inatiute, Dayton, OH
DETERMINATION OF NORMAL MODES FROM MEASURED COMPLEX MODESS. R. Ibrahim, Old Dominion University, Norfolk, VA
THE EFFECT OF JOINT PROPERTIES ON THE VIBRATIONS OF TIMOSHENKO FRAMESI. YaghmaL herlf University of Technology, Tehran, iran andD. A. Frohrib, Univerity of Minnesota, Minnapolls, MN
SOIL STRUCTURE INTERACTION AND SOIL MODELSJ. M. Ferritto, Naval Civil ngineering Laboratory, Port Hueneme, CA
FINITE ELEMENTS FOR INITIAL VALUE PROBLEMS IN DYNAMICST. Z. minsa, U.S. Army Armament Resarch and Development Commad, Watervliet, NY
A PROCEDURE FOR DESIGNING OVERDAMPED LUMPED PARAMETER SYSTEMSD. J. Inman, State University of New York at Buffalo, Buffalo, NY andA. N. Andry, Jr., Lockheed Cilfornia Company, Burbank, CA
ON THE OPTIMAL LOCATION OF VIBRATION SUPPORTSB. P. Wang and W. D. Pilkey, University of Vklbl, Otalottesvlle, VA
DYNAMIC BUCKLING OF PINNED COLUMNSJ. M. Rady, David W. Taylor Naval Ship Rseaerch and Development Canter, Sbtheda, MD
LARGE DEFLECTION RANDOM RESPONSE OF SYMMETRIC LAMINATED COMPOSITE PLATESK. R. Wentz and D. B. Paul, Air Force Wright Aeronautcal Laboratores, Wright-Patterson AFB, OH andC. Me, Old Dominion Univeuaty, Norfolk, VA
DYNAMIC CHARACTERISTICS OF A NON.UNIFORM TORPZDOL.IKE HULL STRUCTUREA. Hasni, Naval Underwater Syatms Center, Newport RI
VIBRATION AND ACOUSTIC RADIATION FROM POINT EXCITED SPHERICAL SHELLSE. H. Wong, Noval Ocean Systems Canter, San Diego, CA andS. 1. Hayek, The Pennsylvania State Univerity, Univerity hrk, PA
DAMPING OF SHALLOW-BURIED STRUCTURES DUE TO SOIL-STRUCTURE INTERACTIONF. S. Wong and P. Weldllnger, Weidlinger Amioctea, Menlo Park, CA and New York, NY
TITLES AND AUTHORS OF PAPERS PREZSTD IN THESHORT DISCUSSION TOPICS S8MSION
NOTE: Tme p prw onlyl pmmted at th. lmpodum. U. . not puWldwdin the 9u1.tin and ae ody IAd m an a oemaein".
TRANSFER FUNCTION ANALYSIS OF LARGE STRUCTURESH. J. Weaver, Lawrence Livermore National Laboratory, Livermore, CA
SIOCK HARDENED STRUCTURAL ATTACHMENTS FOR HONEYCOMB BULKHEADSP. W. Duarmnn, Gibbs & Coz, Inc., New York, NY
DISCOVIRING THE THIRD (AND SECOND) DIMENSIONB. Meker, Pacifle Mimile Teat Center, Point Mugu, CA
vii
A MICROPROCSOR BASED ADAPTIVE ISOLATION AND DAMPING OF A VIBRATING STRUCTUREA. S. R. Murty, Indian Institute of Technology, Kharagpur, India
HARMONIC RESPONSE OF A STRUCTURE INCLUDING A DRY FRICTION DAMPERJ. Der Hegopian and M. LaLanne, Institut National des Sciences Appliquees, Villeurbanne, France
RATIONALE FOR VIBRATION TESTING IN MI T -STD-S1OD (DRAFT)H. J. Caruso, Westinghouse Electric Corporation, Baltimore, MD
VIBRATION ISOLATION OF SENSITIVE IUS COMPONENTS REQUIRING THERMAL CONDUCTIONF. W. Spann, Boeing Aerospace Company, Seattle, WA
FINITE ELEMENT ANALYSIS OF SHOCK AND VIBRATION FIXTURESL. G. Smith, Hughes Aircraft Company, Fullerton, CA
A UNIQUE METHOD FOR VIBRATION TESTING FAR BELOW THE NORMAL AMBIENT NOISE LEVELOF ELECTRODYNAMIC SHAKERS
H. D. Camp, Jr., U.S. Army; ERADCOM, Fort Monmouth, NJ
DOLTS AND FASTENER TIGHTENING TO BROCHURE IDEALNESS THROUGH VIBRATION SIGNATURESA. S. R. Murty, Indian Institute of Technology, Kharagpur, India
COST EFFECTIVE METHODS OF INCREASING DATA RECORDING CAPACITYM. Dowling, Franklin Research Center, Philadelphia, PA
PIEZOELECTRIC FORCE GAUGE WITH HIGH SENSITIVITYR. R. Bouche, Bouche Laboratories, Sun Valley, CA
PYROTECHNIC SHOCK ENVIRONMENTS MEASURED ON INERTIAL UPPER STAGE (IUS)C. J. Beck, Jr., Boeing Aerospace Company, Seattle, WA
USE OF BAND-SELECTABLE HANNING SMOOTHING TO IMPROVE TRANSIENT WAVEFORMREPRODUCTION ON SHAKERS
D. 0. Smallwood and D. L. Gregory, Sandia Naional Laboratories, Albuquerque, NM
SHAKER SHOCK TEST DATA - BASED ON OPTIMIZED PRE AND POST PULSESR. T. Fandrich, Haiu Corporation, Melbourne, FL
PROGRESS ON THE EDESS MACHINESF. J. Sasama, Navel Surface Weapons Center, Silver Spring, MD
MULTI.AXIS RANDOM VIBRATION TESTER FOR AVIONICSD. Everett, Pacific Missile Test Canter, Point Mugu, CA and G. Greanias, UCLA, Los Angeles, CA
ACOUSTIC FACILITY FOR CRUISE MISSILE TESTING0. H. Moore, Jr., General Dynamics/Convair, San Diego, CA
EFFECT OF FRICTION AND MISTUNING ON THE RESPONSE OF A BLADED DISK DISCRETE MODELA. Muazynaka, Univerity of Dayton and Dently Nevada Corp., Minden, NV
CURRENT DEVELOPMENTS IN HUMAN VIBRATION RESEARCHJ. C. Guignard, Naval Biodynamics Laboratory, New Orleans, LA
vili
I

Ioaso
SESSION CHAIRMEN AND COCHAIRMEN520d Utock and Vibsatiom SymnposiumOctober 27.29,1981, New Ode..., LA
Date Sesson Title chaimen Cochairomn
Tuesday, 27 Oct. Opening linda. Dr. Eugene Satvin, Defense Nuclear Agency, Mr. Hemi C. Pussy, Shock and Vibration InformationA.M. Washington, DC Canter, Naval Research Laboratory, Washington. DC
Tuesday, 27 Oct. Rotor Dynamics Mr. Samuel Fnldmn, NKF Engineering Mr. Paul Mfedm. Westinghouse Electric corporation.PM. and Machinery Amsciatme Inc., Vienna, VA Philadelpia. PA
Vibration
Twesday. 27 Oct. Environmental Mr. David 0. Smallwod Sandi National Mr. lAOo n, Waterways Experiment station,P.M. Teuting and Laboratories Albtuquerque, NM Vicksburg, MS
simulation
Tuesday, 27 Oct. Space Shuttle Loads Mr. Donald C. Wade, NASA, Johnson Space Dr. Vernon Neubert, Pennaylvania State University,P.M. and Dynamics Center, Houston, TX University Park, PA
Wednesday, 28 Oct. Fatigue and Random Dr. Geoorge Morosow, Martin Marietta Dr. Gnat Gerhart, U.S. Amya Tank AutomotiveA.M. Loading Corporation, Denver, CO R&D Command, Warren, MI
Wednesdlay. 28 Oct. Spae Shuttle Data Mr. Dan K. MoCutchan, NASA, Johnson Mr. Jerome Pearson, Air Pore Wright AeronatuticaA.M. System Space Canter, Houston, TX Laboratories, Wright Patterson APE, OH
Wednesday, 28 Oct. Control, Iolation and Mr. MAid Nashif, Anatrol Corporation, Dr. John P. Henderson, Air Force Wright AeronauticalP.M. Diaping Cincinnati. OH Laboratories, Wright Plafterson AFB, OH
Wednesday, 28 Oct. Space Shuttle Thermal Mr. Joe Jones, NASA, Marshall Space Flight Mr. Uoyd Brooks, U.S. Amy Miol. Command,P.M. Protection system Center. Huntsville, AL Redstone Arsaa, AL
Thursday, 29 Oct. Mathematical Dr. Richard Skop, Naval Research Laboratory, Dr. Doad 1. G. Jones, Air Force Wright AeronauticalA.M. Modeling Washington, DC laboratories, Wright Patterson AFI, OH
Thursday, 29 Oct. Flight Envirnmewnts Mr. John Waffced, Aeronautical Systems Mr. Beant Masker, Pacific Missile Teat Center,A.M. Division, Wright Patterson API, OHf Point Mugu.CA
Thursday, 29 Oct. Strutural Dynamics Dr. James Richardson, U.S. Army Missle Dr. Nicholas Beedses, Office of Naval Rsearch,PM. Commnand, Huntsville, AL Arlington, VA
Thursday, 29 Oct. Short Discussion Mr. John Favour, The Dosing Company, Mr. Joseph Oaude, Sandmr Associates, Manchester, NH
P.M. Topics Seattle, WA

WELCOME
Colonel Tilford C. CreelCommander and Director
U.S. Army Engineer Waterways Experiment StationVicksburg. Mississippi
It is my pleasure to welcome you today on behalf of the these efforts we worked closely with the Naval OrdnanceDefense Nuclear Agency and the U.S. Army Engineer Water- Laboratory, the Air Force Weapons Laboratory, and Holmesways Experiment Station, who are co-hosts for this 52nd & Narver, Inc., of Los Angules, CA. We also became involvedShock and Vibration Symposium. in soil dynamics and the nucleus of engine s for this effort
was from the Soils Laboratory. We were fortunate to haveFifty-two (52) is also the number of yam the WES has availbe talented people to addrosm these new problems. The
been in existence; in 1929 the Waterways Experiment Sta. Director of WES in 1952 was Lt. Gen. Carroll H. DMnn, whotion was born and its mission was to conduct hydrauiic later became the Director of DNA. We value our close& mo-model studies aimed at making predictions so that flooding clation with DNA and hope it will continue.along the Miadasipi River could be controlled. In the be.ginning the engineering field of interest was hydraulics, Today we read in newspapers or hear over TV the con-which has been expanded over the yeam to include soils cern of protecting missile silos to overpressres in exceas ofand foundations. concrete, flexible pavements, weapons 1000's of psi. In 1955 the weapons effects community talkedeffects, mobility, environmental effects, geology, terrain about getting into the very high overpresare region of 200 psi.analysis, soil dynamics, rock mechanics, and structurts. We Theenvironment ofIntwes has certainly become moe severehave four laboratores to conduct our current mission, to my the last, and the design of systems to resit thesThes we the Hydraulics, Geotechnicel, Environmental, and hostile environments is a real challem . In our endeavors wethe Structures Laboratories. In recant years, it has been the have been not only keenly aware of the loading and responsepeople in the Structures Laboratory who have had the of system but also the importance of shock and vibrationclosest amociation with the Defense Nuclear Agency. Our effects. As an example, I remember reading a repor aboutfriendship tMcee beck through the time when the DNA was an aboveground reinforced concrete cubicle that was sub-the Defense Atomic Support Agency (DASA) to the time jected to airbiast gsnate by a nuclear detonation. Thewhen the organisation was known a the Armed Forces investigator stated the box successfually withstood the ir-Special Weapons Project (AFSWP). pond loads - only a few hairline cracks wene oserved; the
structure was distreased little. The he want on to my. "How-The initial effort, when DNA was AFUIW, began in ever, the cubicle was displaced 70 feet from its originalpoi-
1951 when we were tasked to conduct an investigtion to tion." I am not m that I would have enjoyed a ride in thatdetermine wate wave heights and water shock loads caused strueture or the opportunity to lan first hand about itsby underwater explosions. At that time it was believed the internal shock and vibration levels.way to dimupt this country would be to drop a nuclear bombin our waterways. The resulting crater would create a Imle Most of you we aware that the Corps of Engineerlip wround the periphery which would either elos up ports conducts both military and civil work and WES conductsor dam out mao atrawm. resultig in extensive flooding r eeAch In both the arenas. A helthy aspect of this dualand bringing naviption to a halt. The beginning was a natunal effort is that we are able to apply technology developed forsince WES had a hydraulic laboratory and a superb insdru- military purposes and apply it for civil purposes and vicementatin group- consequently, the first reerch toms at vane. In one study, before breching a model concrete gravityWES to do work for DNA w-s formed from a nucleus of rch dam, we conducted extensive vibration te a4 sub-hydraulic engineers and instrumentation specialists. Our jected te mode to simulated ertiqake motions.efforts wer extended to include underwater cratering andthe response of gravity dams to wate shock loadinp. Our We were not ivm permission to breach the prototypefeet experience in a full scale nuclear test occurred in but we were al to conduct vibration test and succeasfully1956-57 during Operation PLUMBDOB when we tested correlated the t wponse of the prototype and model throughbelow ground structures to the effects of blMt and shock this technique. In this study the effect of an earthquake onfrom an aboveground burst, such a dam was determined - a civil problem; also, the mini-
mum amount of eplosive in the resvor at the right placeWe were also involved in the underwater detonations to cwes the dem to brIk wam determined - a military
of this Operation HARDTACK series conducted in the problem.Marshall Islnds during 1968. Specifically. we analysed struc-turns remaining from the GREENHIOUSE seies of tests For the past 10 yeas we have been conducting studimand measured wate. shock in deep and shallow wme. In to define the eefleld environment s wel a tests of blast
1
L O4MM

effects on structures, both buried and above ground, to deter- when you have a chance. It has been my pleasure to welcomemine their vulnerability to nuclear and conventional weapons all of you on behalf of DNA and WES and I certainly hopeeffects. Such tests have been conducted with small charges that your visit will be interesting. After reviewing the lt of(up to 800 Ib) in test basins located near Vicksburg, with speakers and subjects for discussion, I am sure it will be. Acharges up to 5 tons at Fort Polk, LA; Fort Campbell, KY; number of our Project Investigators are on the technical pro-and Camp Shelby, MS. We have also participated in almost gram and you will be hearing more about our efforts fromevery major field test sponsored by DNA. them. Also, I hope you have a good time and are able to
enjoy New Orleans.I would like to remind you that WES is about 220 miles
up river from here, and I invite you to come visit with us
2
I
KEYNOTE ADDRESS
Dr. Marvin AtkinsDirector, Offensive and Space Systems, OUSDRE (8455)
Department of DefenseWashington, DC
It is a pleasure and a privilege to be able to address the program leading to a communications and control systemShock and Vibration Symposium. For my topic this morning, that would endure for an extended period beyond the firstI have chosen to discuss the new strategic Forces Moderniza- nuclear attack.tion Plan which was announced by the President on October2nd. This is an integrated plan for improvement of all of ourstrategic forces - C3 , Bombers, SLBM's, ICBM's and strategic BOMBER FORCESdefenses - which will affect the defense posture of the UnitedStates well into the next century. This plan will affect all of There is a general consensus on the need for new stra-us here in our lives as citizens, and will directly affect many tegic bombers to replace our aging B-52 force. We thereforeof the people in this Symposium because they will be doing plan on developing a variant of the B-1 bomber, the B-1B,important technical work which is vital in bringing this plan and will deploy 100 aircraft with the first squadron opera.to fruition. tional in 1986. We will also continue a vigorous research and
development program for an Advanced Technology Bomber(ATB), incorporating "stealth" technology, for deployment
COMMUNICATIONS AND CONTROL SYSTEMS in the 1990's.
Strategic communications and control systems are essen- Our two-bomber program is considered to be a reason.tial to the effective employment of our nuclear forces and, able approach to ensuring the continued viability of our stra-therefore, to the credible deterrence. Our modernization of tegic bomber force. The B-lB will restore our ability to pene-these systems in the past has not provided systems with the trate Soviet air defenses during the critical period of therequisite survivability and reliability to operate over an ex- 1980's and will make a good cruise missile carrier and con-tended period after a Soviet attack, if that proved to be nec- ventional bomber after the ATB is deployed and all B-52'sessary. We need communications and control systems which are retired in the 1990's. The ATB will provide us with highwill be as strong as the nuclear systems they support. This confidence that our strategic bomber force will continue torequires enhanced warning and attack assessment, mobile have the ability to penetrate Soviet air defenses into the nextcommand centers that could survive an initial attack, and sur. century.vivable communications links. In the near-term we will im-prove the survivability, performance, and coverage of radars Building the B-1B now will allow time to resolve tech-and satellites used to warn us of a Soviet missile attack and nical and operational uncertainties associated with the ATBasses its size and scope including deployment of mobile without undue pressures to acquire this bomber as soon aspround terminal, upgraded survivability and improved caps- possible. The B-1B will help to bolster our strategic TRIADbilities for our warning satellites, and the deployment of ad- in the 1980's while we take steps to strengthen our land-ditional PAVE PAWS surveillance radars. We will upgrade the based missiles. We cannot afford to wait until the ATB be-survivability and capability of command centers that would comes available. Finally, building two bombers will stimulatedirect US. strategic forces during a nuclear war including the competition and provide us the flexibility to adjust bomberdeployment of E4B airborne command posts to serve the procurement depending on future strategic needs.National Command Authorities in time of war, and enhanc-ing the C-135 airborne command posts serving military com- In the near-term we will modify our newer B-52's (Gmanders through the installation of upgraded satellite and and H models) to carry cruise missiles. The first squadron ofvery low frequency/low frequency communications and air- cruise missile equipped aircraft (B-52G's) will be operational
cathardening against nuclear effects. We will also deploy in 1982. Selected B-52's will be modernized to providesurvvability communications that link command centers added protection against the effects of nuclear explosionswith all three elements of the TRIAD. (particularly electromagnetic pulse effects) and to improve
their ability to survive against Soviet air defenses through in-In order to enhance our ability for long-term operation staflation of additional electronic countermeasures equip-
of our forces in s nuclear war environment, we will initiate a ment. We will disperse our alert 8-52's to more bases invigorous and comprehensive research and development peacetime in order to enhance their survivability. Older
3
B-52's (D model) will be retired in 1982 and 1983. Finally, and might well keep them from achieving a high confidenceexisting KC-135 aerial tankers will be outfitted with new counta-MX capability until the late-1980's, by which timeengines to increase airborne refueling capabilities. we will have a better system.
For long-term basing of MX we will initiate vigorousSEA-BASED FORCES research and development programs on three options. These
options are: Deep Underground Basing, deployment of MX inOur sea-based strategic forces currently represent the survivable locations deep underground; Continuous Airborne
most survivable element of our strategic TRIAD. We will fur- Patrol Aircraft, a survivable long-endurance aircraft thatther strengthen this force through continued construction of could launch MX; and Ballistic Missile Defense, active defenseTRIDENT submarines at a steady rate of one per year and of land-based MX missiles. We plan to choose among thesethrough development of a larger and more accurate TRI- long-term basing options as soon as sufficient technical infor-DENT II (D-5) missile. mation becomes available and in any event no later than 1984.
The TRIDENT 11 missile, scheduled for deployment in Finally, we will deactivate all aging Titan missiles as soonTRIDENT submarines beginning in 1989, will have the capa- as possible.bility of carrying more and/or larger warheads than the cur-rent TRIDENT I (C-4) missile thereby effectively utilizingthe growth room in the TRIDENT submarine missile tubes. STRATEGIC DEFENSEThe TRIDENT 1H missile will nearly double the capability ofeach TRIDENT submarine thereby avoiding a reduction in Due to a relatively lower priority assigned to our strategicsea-based capabilities in the 1990's when our current defense systems over the past decade we have not maintainedPOSEIDON submarines reach the end of their service lives the level of credibility appropriate to our national goals. Inand must be retired. The TRIDENT 1! missile will also have order to take the first steps toward restoring credible strategicmuch better accuracy than current sea-based missiles, thereby defensive forces the following programs will be pursued:providing our sea-based forces with the ability to effectivelyattack any target in the Soviet Union, including hard targets. 0 In coordination with Canada, upgrade the North Amer-
ican air surveillance network including some combin-In the near-term we plan to put cruise missiles on attack ation of new over-the-horizon backscatter (OTH-B)
submarines in order to deploy a force of highly accurate nu- radars and improve versions of today's pound radas.clear warheads at sea. Deployment of these missiles willstrengthen our strategic reserve and deter the use of nuclear * Replace five squadrons of aging F-106 interceptorsweapons against our naval forces worldwide. In s theater role, with new F-15's.they could also supplement the critical deployment ofGround-Launched Cruise Missiles and the PERSHING!1 bal- 0 Buy at least six additional AWACS airborne survel-listic missile in countering the massive Soviet buildup of lance aircraft for North American air defense to aug-theater nuclear forces in Europe. ment ground based radars in peacetime and to provide
surveillance and control of interceptors in wartime.
ICBM MODERNIZATION 0 Continue to pursue an operational antisatellite system.
The Multiple Protective Shelter basing scheme for the 0 A vigorous research and development program on bal-MX missile will be cancelled; however, we are still faced with listic missile defense for active defense of land-basedthe problem of the current vulnerability of our MINUTEMAN missiles. This program will include technologies forand TITAN force. We will continue to develop the MX missile space-based missile defense.and will deploy at least 100 missiles in a long-term basingoption in order to redress this problem. 0 An expanded, cost effective civil defense program will
be developed in coordination with the Federal Emer-Since the MX missile will be available in 1986, well gency Management Agency.
ahead of its long-term basing, initial deployment in existingsilos is the only way to avoid delaying the program. We can- In the years ahead we plan to continue our review ofnot afford to put off MX with its improved accuracy, in- strategic defense to determine what additional steps may becreased payload, and prompt counter-ICMB capabilities. We needed to achieve a credible strategic defensive force posture.will therefore deploy a limited number of MX missiles, assoon as possible, in TITAN or MINUTEMAN silos that will be In closing, I want to thank you again for inviting me toreconstructed by adding more steel and concrete in order to this Symposium, and I will look forward to the personal con-increase their hardnes to nuclear effects. This interim mea- tributions which you will be making to the modernization ofsure would force the Soviets to develop more accurate missiles our strategic forces.
4
INVITED PAPERS
EQUIPMENT SURVIVABILITy ON THE INTEGRATED BATFLEFIEWD
Dr. Chars N. DvidaonUS Army Nuclear and Chemical Agency
Springfield, VA
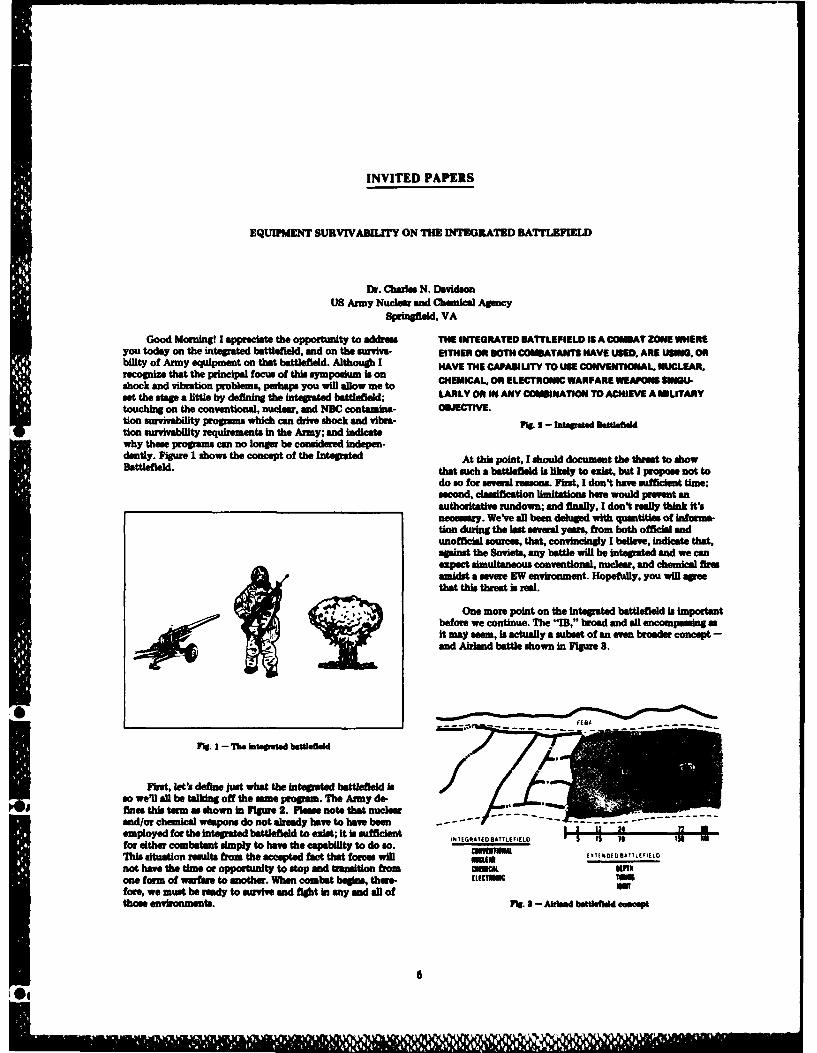
Good Morning! I appreciate the opportunity to address THE INTEGRATED BATTLEFIELD 1ISA COMSAT ZONE WHEREyou today 0n the integrated battlefield, and on the survive. EITHER OR BOTH COMBATANTS HAVE USED. ARE USING. ORbility of Army equipment on that battlefield. Although I HAVE THE CAPABILITY TO USE CONVENTIONAL, NUCLEAR.recognize that the principel focus of this sympoeium is onshock and vibration problems, perhaps you will allow me to CHEMICAL, OR ELECTRONIC WARFARE WEAPONS SINGU-set the stage a little by defining the integrgad battlfield; LARLY OR IN ANY COMBINATION TO ACHIEVE A MLITARYtouching on the conventional, nuclear, and NBC containn- OBJECTIVE.tion survivability progr~ams which can drive shock and vibra. Mg 2 - Intepr. ated flltion survivability requirements in the Army; and indicatewhy then pogam can no longer be considered indepen-dently. Figure 1 shows the concept of the Integrated A hspit!sol ouettetra oso
that such a battlefield is likely to exist, but I propose not todo so for seveal reasons. First, I don't have sufficient tine;second, classification limitations here would prevent an
___________________________ authoritative rundown; and finally, I don't really think it'snecessary. We've all been deluged with quantities of informtion during the lest seveal yars, from both official andunofficial sources, that, convincingly I believ, indicait that,against the Soviets, any battle will be integrated and we canezpect simultaneous conventional, nuclear, and chemical fireamiudst a severe 3W environment. Hopefully, you will wthat this threat is reel.
IMF One more point on the integrated battlefield is importantbfore we continue. The "IB." broad and all encompassing ss
it may seem, is actually a subset of an even broader concept -and Abiand battle shown in Figuresa.
reg. 1- 11. Iatepatsd batiefled
First, let's defin just what the integrated battlefield is Iso we'll all be talking off the asmes program. The Amy do-.3.,
4* ~fines this term nshown in FRem 2. Runas note that nuclear -
en/rchemical weapons do not already hae" to have been-emlydfor the integrated baefed to ezist; it is sufficientfo ihrcombaitant simply to have the capability to do so. It FAEATLFED i I 110 'i i(P~L
Tisiutoreutfrmteaccepted ftact forces will mama__nthvfttime or opportunity to sto end buwition frm Ka 'NIoefrofwarfaroe oter When cobtbegins, thee ILICI5S "MI
for, w mut b redyto urvveand fight ineny end all ofWthose environments. v3* - Airked battsffeld P IN e p
This concept extends the integrated battlefield deep into the. requirements have included criteria for surviving small arms fireenemy rear, provides, by engaging second echelon forces, and fragmentation munitions. Ths kind of survivability hastime and space for forward forces to conduct their portion of been with us for a long time and, when people in the sixtiesthe battle, and recognizes the joint Service nature of this ex- and before discussed equipment survivability on the battle-tended battlefield, field, they were talking about survivability on the conven-
tional battlefield. That was fine as long as we were fightingWe might summarize to this point by saying that we in Korea or Vietnam, but now we have to consider a different
have defined an integrated battlefield which recognizes no battlefield - the integrated battlefield - with all that is im-time or opportunity to transition from one form of warfare plied in NBC contamination and nuclear survivability. Let'sto another, and which, as a consequence, requires that we proceed, then, to look beyond conventional battlefield prob-ultimately consider system survivability from an integrated lens, as serious as they are, at two other proganms of majorstandpoint where synergisms may be very important. concern to the Army.
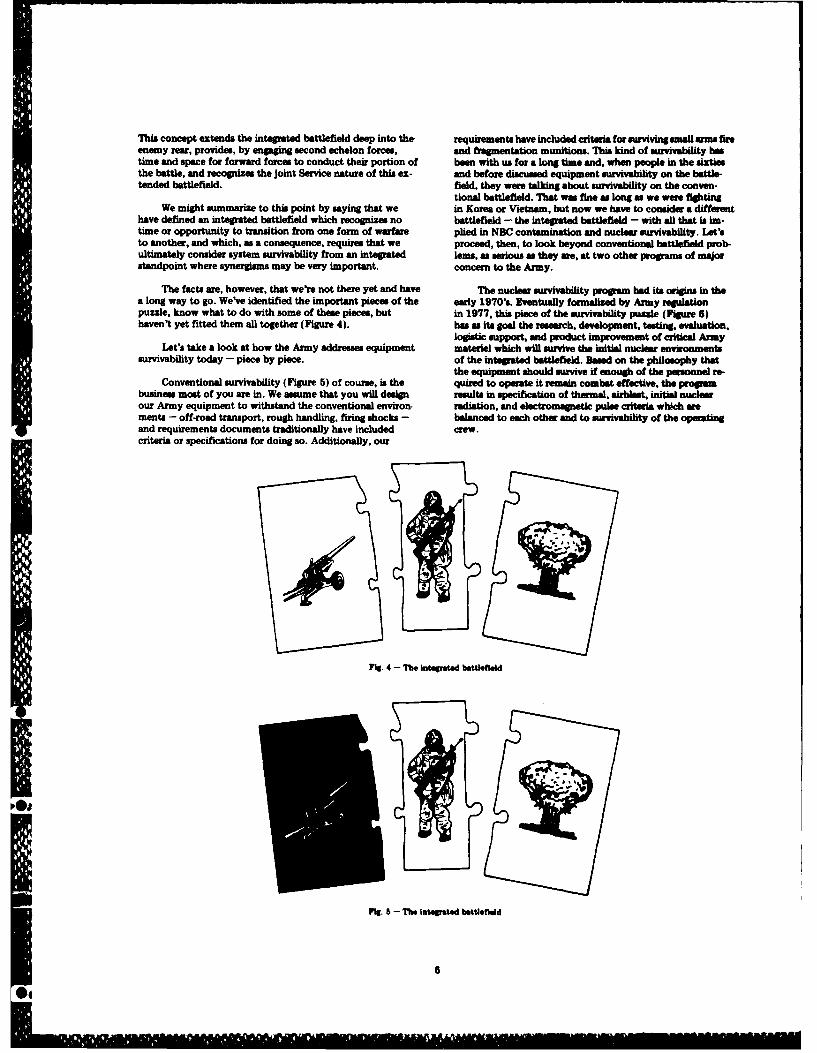
The facts are, however, that we're not there yet and have The nuclear survivability program had its origins in thea long way to go. We've identified the important pieces of the early 1970's. Eventually formalized by Army regulationpuzzle, know what to do with some of these pieces, but in 1977, this piece of the survivability puzzle (Figure 6)haven't yet fitted them all together (Figure 4). has as its goal the research, development, testing, evaluation,
logistic support, and product improvement of critical ArmyLet's take a look at how the Army addresses equipment materiel which will survive the initial nuclear environments
survivability today - piece by piece. of the integrated battlefield. Based on the philosophy thatthe equipment should survive if enough of the personnel re-
Conventional survivability (Figure 5) of course, is the quired to operate it remain combat effective, the progLmbusiness most of you are in. We assume that you will design results in specification of thermal, airblest, initial nuclearour Army equipment to withstand the conventional environ, radiation, and electromagnetic pulse criteria whAch mements - off-road transport, rough handling, firing shocks - balanced to each other and to survivability of the operatingand requirements documents traditionally have included crew.criteria or specifications for doing so. Additionally, our
Fis. 4 -l b intepated battlefield
i iVI. 6- T57 intgrated bmttlefild
6
rig. 6 - I%@ integrated battlefield
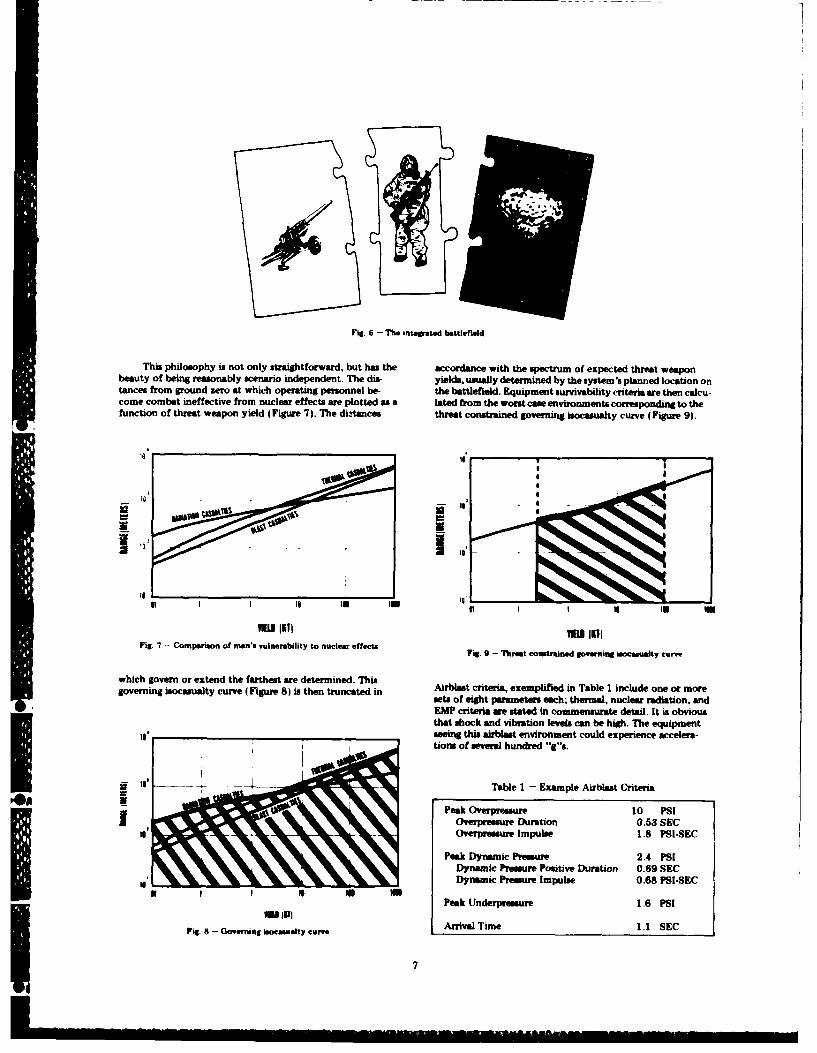
This philosophy is not only straightforward, but has the accordance with the spectrum of expected threat weaponbeauty of being reasonably scenario independent. The dis- yields, usually determined by the system's planned location ontances from pround zero at which operating personnel be- the battlefield. Equipment survivability criteria are then calcu-come combat ineffective from nuclear effects are plotted as a lated from the worst case environments corresponding to thefunction of threat weapon yield (Figure 7). The ditAsnces threat constrained governing isocasualty curve (Figure 9).
.7s
Fig. 7 - Comparison of man's vulnerability to nuclear effecta i.9-1ra osrie oenn os"t uv
which govern or extend the farthest are determined. Thisgoverning isocasualty curve (Figure 8) is then truncated in Airblast criteria, exemplified in Table 1 include one or more
set of eight parameters each; thermal, nuclear radiation, andEM? criteria are stated in commensurate detail. It is obviousthat shock and vibration levels can be high. The equipment
IS ________________________________ seeing this airblast environment could experience accelera-I tions of several hundred "C"s.
Table 1 - Example Airblaat Criteria
Peak Overpressure 10 PSIOverpressure Duration 0.53 SECOverpressure Impulse 1.8 PSI-SECI IPeak Dynamic Pressure 2.4 PSIDynamic Pressure Positive Duration 0.69 SECDynamic Pressure Impulse 0.68 PSI-SEC
Peak Underpreasure 1.6 PSI
Fi.8-CwrigioaulycreArrival Time 1.1 SEC
Pig - Goernig memuety crve7

Fig. 10 -l7b integrated battlefid
Every materiel requirments document now written THE ABILITY OF A SYSTEM TO KE RAPIDLY DECONTAMI-by the Army includes a statement regarding the need for NATED TO REDUCE THE HAZARD TO PERSONNEL OPERATING.nuclear survivability; if the item is critical to mission ac- MAINTAINING, AND REIRIPPLYING IT.complishment and will not exist in sufficient quantities for Fig. I-timely replacement of damaged items, a full balanced setof nuclear survivability criterial will be specified. Criticalsystems which are high density will have high altitude EMPcriteria only. Once these criteria have been specified, onlythe Army's Nuclear Survivability Committee, a general "fight dirty" concept of operations, some minimal dereeofficer group established by Army regulation, is empow- of equipment decontamination is required. For example,ered to modify or otherwise waive the criteria. Experienceshows that they have ipnted only two wavers in the four liuiud chenue agnt can breach the shield of the soldier'sshows tha theyp aveogrmante only two waersy efour- protective overgment in time and they must be removedyears of the program. and then only for clearly substan- where they present a contact hasard. To enhance an item'stiated technological design, operational degradation, or decontamnabity, one must, fit, consider use of mate-cost considerations. rials which do not absorb NBC contamination and which
Although there are still problems with the nuclear our- make easy its rapid removal with decontamiants readilyAlt rogrm partiulrobles it the leas hards wavailable on the battlefield. Second, one must incorporate
surance on the production line and hardnes maintenance designs which reduce or prevent accumulation of NBC con-sae oieldingIbelieve ths pro n le ad h reainenne tamination and make those areas which ae exposed readilyafter fielding, I believe this progra to be relatively well accessible for decontamination - in other words, get rid ofin hand. in addition to the Army regulation, other DA nooks wnd cannie. Third, one must employ devices andpolicy documents addr the nucem r survivabity of com- means which reduce the amount of contamination to bemon use equipment. The Army's Training and Doctrine removed, such as positive overpressure system for combatCommand (TRADOC), which acts the Amy's combe t vehicles, packaging for supplies, and protective covers. Finallydeveloper and requirtments writer, has issued excellent r - one needs to provide space and mounting brackets for imtal-plementin regulations. Further, U. Army's philosophy, lation of NBC detection, meamrement, and decontaminationmethodology, and data be e for developing nuclte suriv- devices, which will incre the operational effectiveness of
* ability criteria have been standardized among U.e Australian, contamination avokiace, control, and removal; and decon-
British, and Canedian forces as QSTAG 244, and among all tmination vic on
NATO nations as STANAG 4145. Don't be surprised to see
the same detailed nuclear survivability criteria in foreignequipment specifications as you would in US system! The second major element of NBC contamination our-
If we say that the nuclear survivability program devel- vivability is hardness, which is defined in Figure 12. In general,
oped in the seventies, the analogous program for equipment most materiel is sufficiently resistant, or "hard," to thesurvivability in chemical warfare environments is emerging effects of battlefield concentrations of NBC contamination -
in the eighties. Actaully, weve named this new program although t cannot be asumed and must be e."NBC contamination survivability," expanding it beyondchemical contamination to include biological contaminationand residual nuclear (such as fallout) contamination - well(Figure 10).
THE ABILITY OF A SYSTEM TO WITHSTAND THE DAMAGINGThis program is still in its infancy, although the concept EFFECTS OF NW CONTAMINATION AND ANY DECONTAM
is established and approved to include three major elements: NATION AGENTS A EOURES REGUIRED TO REMOVE IT.Decontaminability, hardness, and compatibility. We definedecontaminability a shown in Figure 11. Even under a P%. i2 -
--- - -- - - -

Invariably, the greatest damage occurs during the decontam- existing specifications for decontaminability, hardness, andination process. Current decontamination agents are notori- compatibility are interim and only qualitative. We are movingously caustic, removing paint, ruining seals and gaskets, cor- to develop these quantitative criteria with all possible speed,roding sensitive electronic components and plastics, and even however. As a result of an out-of-cycle fund request, a con-causing structural damage to aircraft. As a minimum, materiel tract was let by the Army just last month for a comprehensiveshould be hardened to the extent that none of the item's study to develop and recommend quantitative standards foressential characteristics or reliability, availability, and main- NBC contamination survivability, suitable for Army use astanability (RAM) requirements is adversely affected. criteria. Contract results are due in 11 months time; the
study effort is being guided by a group chaired at the two-Decontaminability and hardness are distinct qualities. star level. In addition, a four-nation ABCA special working
Standards for the former are expressed in terms of the resid- party has been established to provide Quadripartite inputs toual hazard to man, and for the latter in terms of materiel the study during its conduct. Exactly what form these quan-damage. Nevertheless, there is a strong interrelationship. titative criteria will eventually take we can't yet say, ofMateriel high on the decontaminability scale can reduce or course. Perhaps decontaminability relationships will lookeliminate the need for materiel-damaging decontaminating something like Figure 13. The decontaminability standardagents and procedures, which in turn reduces the need to then might state that, for a given equipment category, con-harden materiel solely to withstand their deleterious effects. tamination from agent A in the crew compartment must beOne thus hardens materiel to withstand the decontamination reducible from level X to level Z in 60 minutes using deconprocess and selects decontamination processes consonant procedure B (level of effort 3).with the materiel to be decontaminated; the two go hand-in-hand.
The third and final element of NBC contamination sur-vivability is termed compatibility. In this context, compati-bility means that the item is capable of being operated,maintained, and resupplied by personnel wearing the fullNBC protective ensemble, along with any other required t 5gear. Collective protection may be necessary to enable thecrew to operate more efficiently for a critical period of MI zMM I -----time without the encumbrance of the protective ensemble,or it may be necessary to improve decontaminability byreducing the amount of contamination to be removed. But 4 1collective protection, regardless of the system selected, is not I
a satisfactory substitute for compatibility. Crewmen must 1 2 3frequently exit and enter the vehicle and weapons must be tEVt N MIOUTI ffPresupplied. NBC contamination will inevitably be introducedinto the crew compartment, forcing assumption of a fully Fig. 13 - Decontsminability Standardprotected posture. Compatibility with the NBC protectiveensemble is essential.
A hardness relationship might look like Figure 14. SinceThus, for an item to be NBC contamination surviv- materiel is usually more susceptible to decontaminants than
able, it must be rapidly decontammnable, hardened to with- to the chemical contamination itself, the standard mightstand NBC contamination and the decontamination process, require that RAM not be degraded below level Y after theand compatible for use with the full NBC protective ensemble. equipment undergoes level of decontamination effort 2.
Applying the above concept of NBC contamination sur-vivability, the user must then ascertain whether it is requiredfor his system. The rationale is clearcut: if the item is mis-sion essential, it must be NBC contamination survivable. Un-like the rationale for nuclear survivability, neither system re-dundancy nor resorting to resupply provides a completely -acceptable alternative. Once a unit is subject to NBC con- si mtamination, the redundant and resupplied items will be-come contaminated in short order. 2
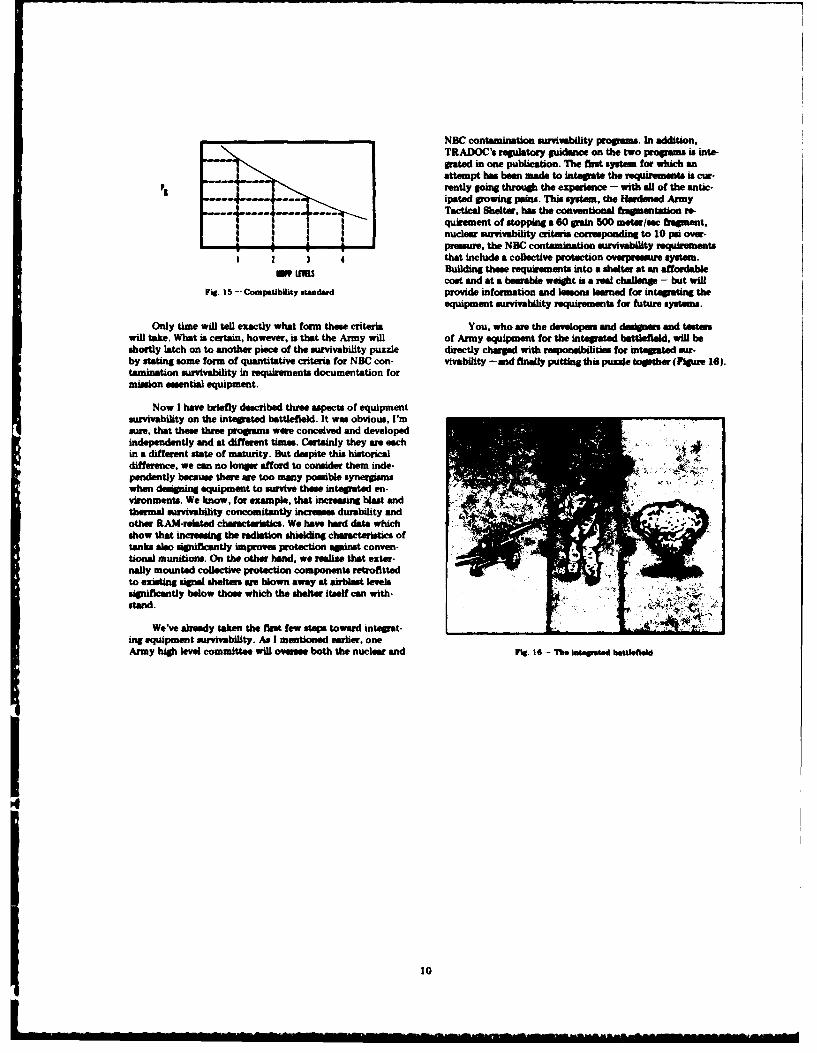
This concept for NBC contamination survivability is notonly US Army approved, but was also approved in May ofthis year by the Australian and United Kingdom armies and 1 I Iby the Canadian forces. A draft US Army regulation is cur- F/t x Uw IIII f[I!rently being staffed to formalize the program at Department Fig 14 - Hardnes standardof the Army level, which among other things, will give over-sight and criteria waiver responsibilities to the same generalofficer committee which oversees the nuclear survivabilityprogram. TRADOC has already published regulatory guidance And a compatibility relationship might be expressed asin this area for its requirements document writers. in Figure 15. In this cme, the standard for a weapon system
might require that system kill probability spinst enemyDespite these policy documents, the Army does not yet threats not be degraded below a certain value if the system
have quantitative criteria for NBC contamination survivability; operating crew is in mission oriented protective posture 4.
9
"6 . . . .. . . " . . .'I ' . ..'
NBC contamination survivability Propams. In addition,TRADOC's regulatory guidance on the two program is int-grated in one publication. The fit system for which anattempt has been made to integrate the requirements is cur-rently going through the experience - with all of the antic-ipated growing pains. This system, the Hardened ArmyTactical Shelter, has the conventional fragmentation re-quirement of stopping a 60 gain 500 meter/sec frarment,nuclear survivability criteria corresponding to 10 psi over-
- . . .pressure, the NBC contamination survivability equiements2 3 4 that include a collective protection overpremare system.,- It Building these requirements into a shelter at an affordablecost and at a bearable weight is a real challenge - but will
Fig. 15 -- Compatibility standard provide information and leons learned for integrating theequipment survivability requirements for future system.
Only time will tell exactly what form these criteria You, who are the developes and designers and testerwill take. What is certain, however, is that the Army will of Army equipment for the integrated battlefield, will beshortly latch on to another piece of the survivability puzzle directly charged with responsibilities for integrated sur-by stating some form of quantitative criteria for NBC con- vivability -and finally putting this puzzle together(rigum 16).tamrination survivability in requirements documentation form ion essential equipment.
Now I have briefly described three aspects of equipmentsurvivability on the integrated battlefield. It was obvious, I'msure, that these three programs were conceived and developedindependently and at different times. Certainly they are eachin a different state of maturity. But despite this historicaldifference, we can no longer afford to consider them independently because there are too many possible synergismwhen designing equipment to survive these integrated en-vironments. We know, for example, that mncreasing blast andthermal survivability concomitantly increases durability andother RAM-related characteristics. We have hard data whichshow that inceasing the radiation shielding characteristics oftanks also significantly improves protection against conven-tional munitions. On the other hand, we realize that exter-nally mounted collective protection components retrofittedto existing signal shelter are blown away at airblast levelssignificantly below those which the shelter itself can with-stand.
We've already taken the first few steps toward integrat- -
ing equipment sumvability. As I mentioned earlier, oneArmy high level committee will overs both the nuclear and id. te - 1%e imtasmetd btutleftld
I0
NAVAL OPERATIONS IN A NUCLEAR ENVIRONMENT
CaLDonald AldiesonThater Nuclear Warfare Project Office (PhS-23)
Deperteat of the NavyWaigion, D.C.
Doctor Sevin is entirely right, we are brand new. We some communication links to EM? on 51 classs of shlps;were charterd on 20 June 1981, and sine than we have we will also explore "chssp kill" hardsnlngf from convsn-been bringing our staff on board. I would like to acquaint tional weapons. We bave a start next year on a C3-EMpyou with the initiatives that have recsntly been taken in survivability progam and another new start next year onthe Naval Material Command and the way we intend to the non-EM? survivability of aircraft reulting from thoseapproach our responsibilities to improve the Navy's suzviv- effecta of nuclear detonations othar than EM?. These weability posture. thermal and air bea.
The Theater Nuclear Warfare Project Office (fld-23) has This is how we will approach the program. IFita wea three-fold responsibility: modeniae the Navy's theatre will focus on the mission critical functions within the con-nuclear weapons stockpile, oversight managamuent reaponelbil- text of these several survivability parameters; then we willities for survivability and combat effectiveness, and rebuilding consider alle- a Iet of survivability. What can sative andthe Navy's technology bowe to support these two efforts. pasive defenses contribute? Are there operational pro-
cedures. that mitigate the conequences? Fleet spacing isThe Charter raw, insibilities for survivability and an example. We hase finally anseed all of thos questons;
combat effectiveness run along classical line. The organiza- then what must be done to harden platforesad equipenst?tion we have structured for it is aclassical Naval Material Once the decision bs made to hesd.. for improved "mvlv-Command matrix management operation. The project ability, then I think out general approach will be similar tomanager is established asa Rar Admiral's billet. I am the the Army's approach which Dr. Davidson described. We willacting Project Manager at the present time. We plan to have establish hardening criteria, negotiate the waves monior61 people in this organization in the 1IO8 fiscal yew. We the impleementation of herdsningl, ve*if effectimesm byhave 18 people on board now, and virtually all maor posi- test, (the big problemt is that we do not have a final saeetions, except for the technical director, have en incumbent. for our progrm managers). and muse attention to lft
cycle surveillance aid hardnes maineac.I wait to talk about several dimensions of the approach
to survivability. First, enid perhaps the peatkest importance New constuction in another facet of the bardnesis for the Navy to consider those problem that will affect problem. There we have a chance to 1Wu in at the keel". Weits combat readiness, even though we are not directly can implement hard..,g at the platforn level. and weattacked - the very long range effects. should be able to cover all vital oprtaoa functions; it
seem to be cost effective, end it should mininnin validationCommunications bleck-out ina classical phenomenon and maintenance problesm.
ith the Navy's requirement for vary long haial communica-tions in many case, it cana affect us, but we can probably Majo functional rtet we stil another toat of thecompenate for it. Water a-ves, flesh blindness, fell-out aid hardness problem. The modal tha we will use in the back-satellite problem also affect the combat readiness of the fitting of the TOMAHAWK Cruine Missie into the DD963fleet. other local effect& exist. Air blast predominates in our elass desteroy It will beaa ajor fimetonal retroft andthinking. not to the exclusion of any other threats, but it is even thouga we may not be"l to provide berar amrnceour tbiggs- problem as we consider all of the local threats. for the total platicem, we intend to provide Iar I forThis as to illustrate a point that pertains to new contuction. that singl function. That is, we wsant to get off a plannedThere is a price to buy in on hadnes, with respect to any TOMAHAWK strike t spective of the neaure of theone threat, almost is espective of the level selected. There is dsnage to the red of 'be ship, provided it in still afloat anda reasonably paedusi and orderly growth from one leve to A4 can plovwd electrical power.the neat, and at that time other effects begin to predominae,and costs lend to sky-rocket. We think we know where the It ha been aid that if you want to look at the USbreak-points ar. Navy in the year 2000, go down to Norfolk ad look at it.
A Ilae tion of it in there. It has been a Frbie flII-gottiAnother asseassment and hadening prm Van in the aurvivesbility built into the Naevy. Many hboe solvad. "Why
FAANTAXL program which is acooperative progrm with should I do At for my ship cls whm the re of the NavyDNA. The object in to am the Ised of the FIA-la and will be soft?" We need to focas on vital functions consider
seelohe chuse of alicraf. We have a survivability the cost and Wie resseanig and do what we canimprovement po to explore functionally hardeing

Another problem in hardening shipboard systems is they several organizations. The Chief of Naval Operations staff istend to be reasonably large, very concentrated and quite responsible for setting sequirements. The platform sponsorcomplex. When a ship is built, the builder provides essentially within the Chief of Naval Operations makes the money avail-the ship, its propulsion and many of the combat systems. On able. The system maqgr who will actually build the plat-the other hand, much of the vital material is government- form, be it ship or aircraft, is also involved. PM23 is thefurnished equipment; it is either "off-the-shelf" or it is "broker" with the nuclear expertise operating in the midstprocured under a totally different system: getting hardness of this group of people. We have to find out how the con-specifications iwto the government-furnished equipment is a trols are defined. Are they fiscal controls? Are they pro-real challenge to us, and we believe it will take a long time. cedural controls? Is it a system such as the Army uses of a
flag officer end a general officer board that must pass onWe also need to do something for the existing fleet, waivers and accept the criteria, undefined for us as yet?
About a half year ago CINCLANTFLT asked us what we can Whatever it is, it must control the waiver process.do if we have some warning that a nuclear attack may beimminent. Or if a nuclear attack occurs, what can we do after We must do better. Nuclear survivability must get intothe fact to rapidly reconstitute our capability. We have teams the core of all programs. And finally, we must rebuild theout in Norfolk now doing a quick assessment. We hope to Navy's technology bass in the nuclear weapons effects areascome up with damage control procedures or readiness pro- in the Navy's laboratory structure. Constraints exist oncedures to either mitigate or help reconstitute our capability Program 6 funds within the Navy. We had fairly decentafter an attack. This is principally toward these far-reaching programs at one time, but we have a thirty percent cut ineffects. Program 6 funds. We need to use seed money in the systems
development community to encourae consideration ofWe are setting out to do this job now, and it is challeng- survivability. And finally, we believe DNA can and will help
ing. rhe structure we must develop, however, will involve us if the Navy program is well-supported.
a
12
%5WU

SURVIVABILITY OF REQUIREMENTS FOR FUTURE AIR FORCE SYSTEMS
Dr. Henry F. Cooper, Jr.Deputy for Strategic and Space Systems
Office of the Assistant Secretary of the Air Force for Research & LogisticsWashington, DC
The President's strategic package, announced on Octo- Over the pest decade we have developed impressive C3 Iber 2, proposes the most comprehensive program for strategic capabilities for peacetime use. However, we have not madeforce modernization since the Eisenhower years. it is corn- these systems as survivable as we would like, nor have weposed of: provided a reliable post-ttack C3 1 system. Thus, the
President's package assigned the highest priority to improve-" C3 I systems to assure communications with our stra- ments in our warning systems, command posts, and com-
tegic forces, even after nuclear attack, munications links, including the development of post-attackreconstruction capability to asure enduring CS 1. These im-
" Modernization of our TRIAD of bombers, SLBM's, provements are intended to ensure that we can effectivelyand ICBM's, and employ our nuclear forces throughout all stages of conflict,
which is essential to our maintaining a credible deterrent.* Improvements in Strategic Defense.
Modernization plans for our warning systems includeMajor portions of four of these five mutually reinforcing PAVE PAWS surveillance radars to detect SLBM launches,elements of the strategic program will be implemented by the OTH-B radars and additional AWACS aircraft to detectAir Force, and will be the subject of my discussion today. airborne threats, satellite improvements to provide betterBut, first, a word or two on the policy which motivates these missile warning, and mobile pound terminals to improveproposed programs. the survivability and endurance of satellite warning and com-
munication systems.The intent is for these strategic improvements to greatly
strengthen deterrence of nuclear war by denying the Soviets We plan to upgrade the survivability and operationalany realistic prospects, however, they may define them, of capability of the E4B and EC-135 airborne command posts.pining an advantage by initiating the use of nuclear weapons. Improvements include increased hardening to EMP effectsAs noted here, deterrence remains the centerpiece of our and upgraded satellite and LF/VLF communication capa-strategic policy. However, the evolving strategic realities of bilities. Alternate survivable command posts, such as groundthe last 10-15 years have led to serious doubts of the mobile command posts and deep underground posts, will alsoadequacy of our concept of Mutual Assured Destruction likely be considered.(MAD) in providing a stable deterrent. These doubts have ledto a monotone evolution of national policy over the last 10 Improvements in the communication links include a 500yeas, 0 enunciated in public explanations of NSDM-242 and node LF communication network to provide high confidencePD-59, toward emphasis on trans- and post-attack endurance, trans- and post-ttack communication capability. Thisthe ability to maintain effectiveness over a wide nmge of multiple-aimpoint system will be coupled with new LF/VLFoptions during a protracted war, the ability to deny coercion mini receivers for the bombers to ensure their timely recep-at any stage of conflict, and the capability to administer the tion of execution orders. As mentioned above, mobile roundultimate punishment if necesary. In other words, the trend is stations will also provide endurin capability. Finally, atoward developin an apparent war fighting capability, rather vigru R&D program leading to the capability to reconu-
than relying upon the threat of nuclear punishment for deter- tute an enduring CaI system will be undertaken. It is hard torence. Survivability and endurance are obviously key attri- make systems survivable in the face of highly accurate threatbutes of strategic systems responsive to this evolving policy weapons which m capable of destroying any target that isintended to support a protracted conflict in which nuclear identified and located. Thus, to assure systems that remainweapons ae used. capable post-attack, we ae compelled to think of ways of
reconstituting Capabilities... including forces, C31, andIn response to this evolving policy, the President's pro- logistics support.
gum stresses survivability and endurance of our strategicforces and their supporting C3 1, and the ability to hold at As has been recognised for at least a decade, improve-bk targets of stategic value to the Soviet Union. I will ments in Soviet ICBM accuracy have led to the situationreturn to this point as we discuss each of the Air Force where our land'bed ICBM's are potentially vulnerable to acomponents of the strategic pack ge. Soviet first strike. The Air Force's preferred response to this
13

threat, evolved over a like period of time, was to deploy the B-i's, the first squadron of which will be delivered by 1986,MX Multiple Protective Structures (MPS) system. However, will be capable of delivering ALCM's in a stand-off mission,after a review of basing alternatives, the President decided to or of penetrating Soviet Air Defenses into the 1990's, andreject the MPS system and to seek alternative more survivable will have reload and multimssion capabilities in protractedbasing modes for the MX missile. A decision was made to conflict scenarios. R&D will continue on the ATB which,proceed with full scale development of the MX missile and to under current plans, will be deployed in the 1990's.deploy it in either upgraded Minuteman or Titan silos until amore survivable basing mode is selected and deployed. The Over 3000 ALCM's will be deployed on the B-52G's,MX missile will provide the U.S. the capability of holding B-52H's, and B-i's. The first squadron of B-52 ALCM carriershardened Soviet systems at risk, and hopefully will motivate will be operational in 1982. KC-135's will be re-engined to in-them to spend money to rebase their ICBM's in a more sur- crease airborne refueling capabilities.vivable basing mode. The current program calls for an inten-sive evaluation of three basing alternatives: (1) a Continuous Finally, I would note that in our efforts to ensure thePatrol Aircraft (CPA) which is intended to fly on continuous capability of the bomber to play an important role in pro-airborne alert primarily over ocean areas; (2) the develop- tracted war scenarios, providing enduring logistics support isment of a deceptively based Ballistic Missile Defense (BMD) a major technical and management challenge.which would be employed to defend the silo based MX (andMinuteman missiles); (3) deep underground tunnels which While there are no major new shock and vibrationwould provide survivable storage of a secure reserve force, challenges offered by these developments of the Air Breath-The present program calls for a selection between these three ing leg of the TRIAD, the substantial modernization programalternatives by 1984. clearly will provide the motivation for improving the quality
and efficiency of the already well established technical baseThe technology requirements of interest to this audience in this area.
for the CPA and BMD are essentially the same as those con-sidered previously for similar systems. On the other hand, We have virtually ignored strategic defensive systemsthis is the first serious study of the engineering feasibility of for a decade. As a result, we have large gaps in radar coveragedeep basing, and consequentially, the program provides op- provided by the North American Air Defense Warning Net-portunities for novel developments. The deep basing concept work, our strategic air defense interceptors are obsolete, andassumes that missiles are stored at various points within an our anti-satellite and ballistic missile defense programs haveextensive tunnel complex a couple of thousand feet deep, lagged behind those of the Soviets. The President's programpreferably in mesas where horizontal tunnels can be drilled takes the first steps toward restoring credible strategic de-from the inside out, commencing at any time from imme- fensive forces. It provides for upgrading the North Americandiately following the attack until perhaps a year after initia- air surveillance network in coordination with Canada. Thetion of hostilities. Thus, there are requirements not only to plan includes some combination of over-the-horizon back-survive severe shock and vibration of the direct attack, but scatter (OTH-B) radars, AWACS aircraft, and improved ver-also to provide for the continuing operational capability, in sions of the ground radar systems that exist today. It alsoan uncertain post-attack environment, of a self-contained calls for replacing the aging five squadrons of F-106 inter-manned system over an extended period of time. Important ceptors with new F-15's. The additional AWACS aircraft willtechnical issues requiring study also include the development augment the ground based radars in peacetime and will pro-of more rapid egress than can be accomplished with normal vide surveillance and control for interceptors in wartime. Wedrilling procedures, and development of a means to avoid are also developing operational concepts by which warningdetection on drillout. and air defense capabilities can endure in a protracted conflict
involving nuclear weapons.In addition to these basing modes which will be con-
sidered for deploying the MX, we expect to continue our We also plan to continue to puruse an operational anti-investigation of alternate ICBM's and basing modes for future satellite system as a counter to the capability already demon-deployment. For example, smaller ICBM's, which might more strated by the Soviets.conveniently be based in mobile or other deceptive ways, willbe considered as a part of the Advanced Strategic Missile As mentioned earlier, the President's program calls forSystem (ASMS) program. a vigorous research and development program on ballistic
missile defense. The Army has the lead in pursuing alterna-The U.S must depend heavily on the survivability of tives that represent evolutionary improvements over BMD
our bombers (and sea based forces) in the 1980's while we concepts of the past. The Air Force will, of course, integratetake steps to improve the survivability of our land based mis- its programs with the Army's activities in order to assureses. Furthermore, the bomber is perhaps the most flexible effective coupling to BMD should that be the selection forand potentially endurable of our strategic forces. It can be improving the survivability of the land based ICBM's in 1984.launched and recalled, can serve as a launch platform for In addition, the Air Force will be conducting research onstand-off missiles (such as ALCM's) against fixed targets of space based lasers which might be viewed as a long termknown location, can be employed against targets of impre- potential solution for ABM.cise location, and can be recovered, reloaded and launchedagain. The President's plan calls for improvements to the Finally, it is noted that civil defense is getting a boostB-52, purchase of 100 B-i variants in the late 1980's, and the and the Defense Department will be exploring new programdevelopment of an advanced technology (Stealth) bomber alternatives in coordination with the Federal Emergency(ATB) in the 1990's. Management Agency which has the lead in the civil sector.
Survivability improvements of theB-52G and H force, I would like to close my discussion with a few com-which will be used as an ALCM launch platform into the ments of a general nature. These thoughts will reflect not1990's, include EMP, blast and shock and ECM upgrades. only my recent experience which has given me a broad viewThe older B-52D's will be retired in 1982 and 1983. The 100 of Air Force strategic systems, but also my previous more
14
i

narrow backround derived from my study of the survivability not appreciated. Such initiatives to minimize cost have onof strategic systems to nuclear blast and shock effects. some past systems severely constavined the ability of later
designers to cope with improvements in the accuracy ofThere is a continuing need to specify the best possible the nuclear criteria, except at geat expense. This classical
predictions of the nuclear environment and associated system design approach then can put us in the situation of beingresponse. Of particular interest are improved low-over pres- pennywise and pound-foolish. I would recommend thatsure contours which might affect our estimates of aircraft designers seriously consider innovative developments thatsafe escape; the dust environment as a function of tine fol- provide powth capabilities at the margin where criteria arelowing a major nuclear attack which may affect the endurance recognized as being very uncertain and where future researchand operational capabilities of various airborne systems; might substantially change current estimates. Similarly, itclose-in high intensity nuclear environments important to may be worth paying a little bit more for hardening tech-estimates of silo hardness and deep undergound system nologies which provide assurance that systems can be main-design. Of course there is the continuing requirement for im- tained in a hard configuration. Here, specifically, I am think-proving our theoretical models for system response to nuclear ing of various shielding approaches to the hardening ofeffects. Given the lack of direct nuclear experience for many electronics to EMP effects whether they be aboard aircraft,cases of interest and the unlikely possibility of future nuclear satellites, or on pound equipment. It often does not costtesting experience, there will be a continuing need to develop much to design in hardness initially, but we pay dearly toimproved simulation test capabilities for use in the design and retrofit.validation of systems. Finally, given the uncertainty inherentin this entire process, there is the need for the designer to be As noted previously, there are few new requirements foras creative as possible in designing to avoid suprises; that is, shock and vibration breakthroughs. On the other hand, theto design around potential but unknown problems. several major strategic program initiatives will undoubtedly
assure the continuation and enlargement of research, develop-Too often (in my view) the designer exercises great ment and testing activities of interest in this community. We
creativity in minimizing the cost to design to specifications solicit your active support to improve the quality, efficiencythat are given with preat precision but which are inherently and survivability of Air Force strategic systems.inaccurate due to uncertainties in specifying criteria. Noplace is this more evident than in designing systems to Thank you for your kind attention.withstand nuclear effects where the uncertainties are often
II

NUCLEAR HARDNESS VALIDATION TESTING
Dr. Edward ConradDeputy Director (Science and Technology)
Defense Nuclear AgencyWashington, D.C. 20305
It is a real pleasure for me to be here today. Although In the days of atmospheric testing, we defined many ofwe do many things at the Defense Nuclear Agency (DNA), the environments that are created by a nuclear detonation.I really consider the most important part of our work to be We tried to learn as much as we could in those days abouttechnology transfer. It is meetings such as this, where that blast, pound shock, thermal radiation and nuclear radiationtechnology transfer takes place. I am gratified that the such as the gamma radiation and the neutrons that eminatespeakers who preceded me this morning talked about what I from a nuclear weapon.am going to discuss. I feel it is very important that ourAgency should be in tune with the needs of all of the Depart- At high altitude there are ionization effects that occurment of Defense. Each of the speakers you heard this morn- in the ionosphere and at the high altitudes the rarity of theing is a close friend and colleague and I feel a strong respon- atmosphere makes the threat from the x-rays that emit fromsibility to support them in the requirements they stipulate. the nuclear weapon something that has to be addressed.
The first figure (Fig. 1) paraphrases the DNA research One example of these atmospheric effects is the STAR-and development mission and identifies the organizations FISH EVENT that occurred in 1962. It was a detonation thatwith which we interact. DNA is the corporation memory and took place at 400 kilometers in altitude. The ionization oc-the conscience of the DoD nuclear weapons effects data base curred over a very large volume in space. This disturbance -and expertise. In this area, we conduct all underground this ionized region - was five to ten thousand kilometers innuclear tests on nuclear weapons effects and we coordinate length and several thousand kilometers wide. I will return tothe research among the DoD Laboratories. The Director of the significance of this later on in my talk. Numerous eventsDNA reports to Dr. DeLauer, the Under Secretary for occur when a nuclear detonation takes place at high altitude.Research and Engineering, and also to the Chairman of the These are shown in Figure 4. When the radiation from thisJCS since DNA manages the logistics of the nuclear stock- detonation strikes.the upper edges of the atmosphere, itpile as well as conducts nuclear weapons effects research. releases a charge and as this charge moves in the magnetic field
of the earth, it develops an electromagnetic pulse that canFigure 2 shows some examples of the range of our move down to impinge on the surface of the earth. This is
activities. Everything you heard this morning from the pre- what we refer to as the EMP threat to communications andvious speakers appears somewhere on this chart. Figure 3 other pound systems on the surface of the earth. The x-rayscategorizes the activities we address in terms of strategic, from this detonation can move out to very peat distancestheater, enduring C3 , biomedical and physical security. In the striking space objects such as satellites, reentry vehicles, orstrategic systems our efforts include nuclear hardening missiles. When the x-rays strike a satellite, they release a chargesurvivability for land based missile systems including the EMP from the surface of the satellite and this creates a phenomenoneffects - that is the electromagnetic pulse that arises from referred to as system generated EMP (SGEMP). This effectezoatmospheric nuclear detonations. We also explore options can be highly damaging to satellites and we do investigationsfor basing, such as secure reserve force, and consider concepts to learn how to characterize this effect and mitigate it.for survivability in situations such as protracted warfare. DNAis also intemately involved in the modernization in our theater A collection of photographs of the various testing pro-nuclear forces. We provide research that supports the Office of grams DNA has conducted to simulate nuclear weaponsSecretary of Defense in the High Level Group deliberations effects is shown in Figure 5. Obviously, we no longer dowith our NATO Allies on the modernization of forces in atmospheric nuclear testing and so we have to provide meansEurope such as the long range forces, PERSHING, GLCM. We by underground nuclear testing or above pound simulationssupport the Navy in exploring problems of Maritime Theater to learn more about these effects on our systems.Nuclear Warfare. DNA is concerned with the endurance ofour command, control, and communication systems and we DNA conducts experiments to investigate the effects ofdo research on how to provide survivability and protection to the nuclear ionization when weapons are detonated in thethese systems. This not only includes the land lines but also atmosphere. This is shown schematically In Figure 6. Wesatellite communications and effects on the ionosphere that simulate this effect by the use of barium which is releasedoccur directly by exposure to nuclear detonations. With this at high altitudes and monitored by sending up soundingbrief overview of the DNA activities, I will now give you rockets in order to learn more about the chemistry that takesexamples of many of these programs in a technical discussion place in the environment. We also do transmission e.pesi-of the DNA efforts - especially in the arem related to the ments during this test in order to evaluate the effect of thesesubject of this symposium - shock and vibration. striations in producing disturbances on satellite transmission.
17
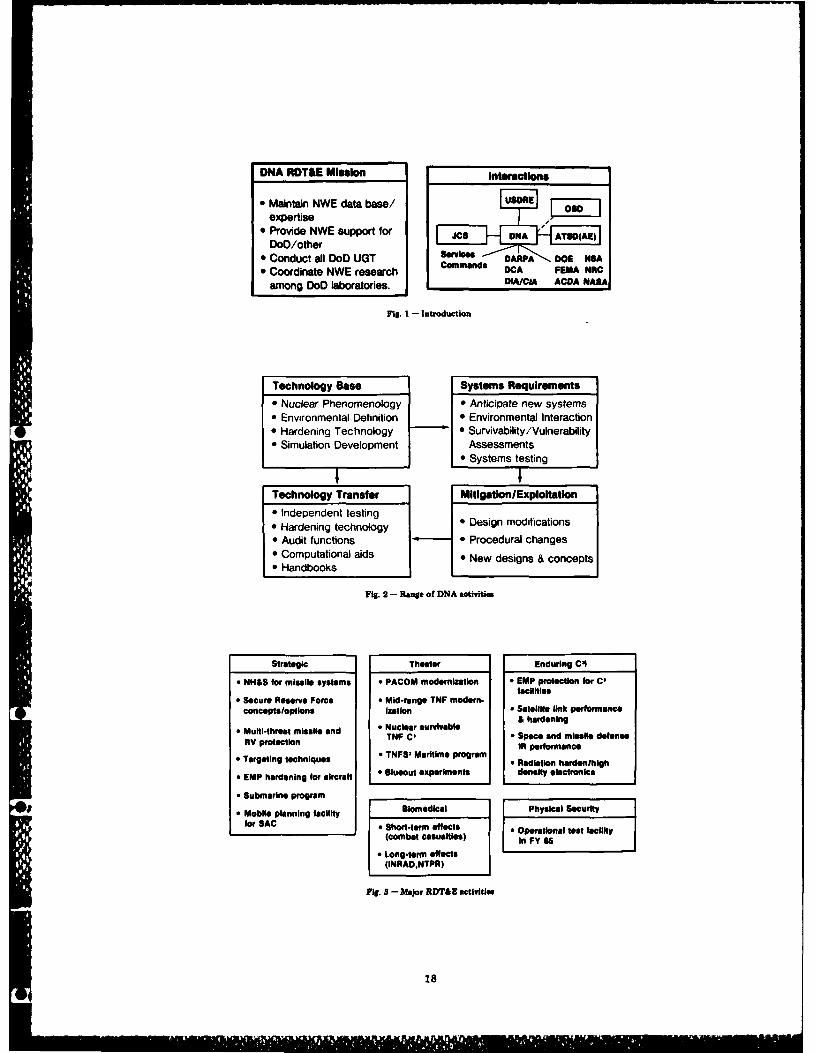
DNA RDT&E Mission Intsiractions
" Maintain NWE data base/ uSrn.expertise
* Provide NWE support for £5 DNA AO(EDoD/other
* Conduct all DoD UGT Srie DARPA DOE NSA* Coordinate NWE research Comnd OCA FE1MA NRIC
among DoD laboratories. DIA/CIA ACDA MASAI
Fig. I - Introduction
Technology Base Systems Requirements" Nuclear Phenomenology * Anticipate new systems* Environmental Definition * Environmental Interaction* Hardening Technoiogy 0 Survivability /Vulnerability* Simuiation Development Assessments
0Systems testing
Technology Transfer Mitigation/Exploitatlon" Independent testing *Dsg oiiain* Hardening technology *Dsg oiiain* Audit functions * Procedural changes* Computational aids * New designs & concepts* Handbooks
Fig. 2 - Range of DNA actimrtie
Strategic Theater Enduring C11
" NH&S for missile systems * PACOM modernization *EMP Protection for C'faclties,
" Secure Reserve Force * Mid-range TNF modern.conceptsloptions izallon *Satellite ltink performance
" Multi-threat missile and * Nuclsar survial &hrdnn
RV potecionTNF C' Space and missile defenseRV prtectoniO performance" Targeting techniques e TNFS) Maritime program Raito rdnhg
*EMP hardening for aircraft 1 0slueout experiments density electronics
*Submarine program ____________
*Mobile planning facility Biomedical physical Securityfor SAC 9 Short-term effects Opatnltetacit
(INRAD,NTPR)
Fig. 8 - Major RDT&E activitie
18
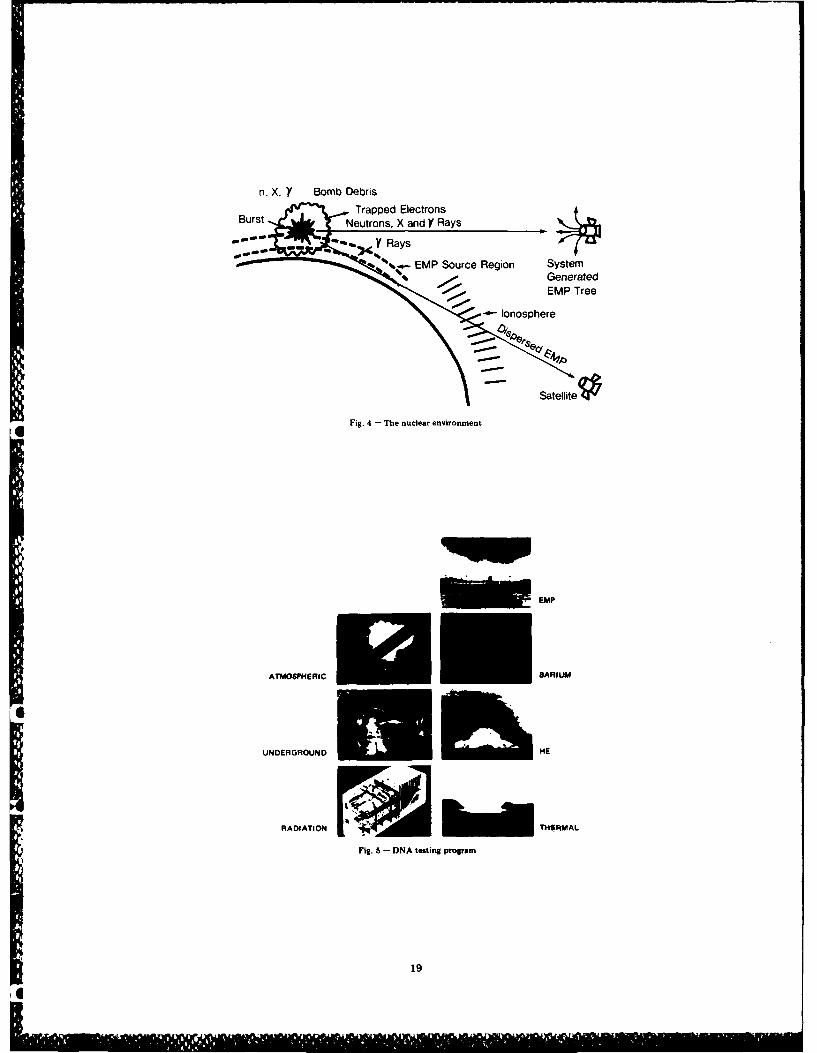
In. X, Y Bomb Debris
Fi.4Thaped nulertvronmen
SEMP Te
FAigA. 4 TTe uler nirnmn
Fig. 5 - DNA testing program
19

EXPERIT
LES 819
MODULATIONEXPERIMENT \BARIUM CLOUD
C-135
FPS-85RADAR
BEACO
PHOTOGRAPHY
Fig. 6 - Places experiment
As we propagate signals through it, we characterize this dis- the detonation. The large crater you see occurred becauseturbance on our communications, and develop codes for use after the detonation takes place, a large cavity is formed atin simulators as described on Figure 7. In this sort of simula- some depth below the ground and a the earth ultimatelytion we can use the transmitter receiver and the simulator on collapses into that cavity, a crater results. As a matter of factthe ground to perform experiments to learn how to properly you can see some other craten in this photograph from pre-modulate and key the signals to optimize the propagation vious shots. Obviously we didn't want to lose the experimentalthrough the disturbed medium. Detonations that occur in chamber and the test model and so it was pulled away fromspace not only produce disruption in communication, but ground zero prior to time when the ground subsidencethey also create an infrared background. Infrared is used for occurred. We were interested in recording the response of themany applications and it is important to understand both the model, not only during the detonation, but for some consider-natural background and that created by the detonation, able time thereafter. For this reason care had to be taken to
shock isolate the model within the chamber and you willIn Figure 8 we see a test being performed on an aircraft hear a presentation on how this isolation was accomplished
to assess the effects of EMP. The object above the aircraft later in the meeting.is an EMP simulator that develops an electrical pulse similarto that which would be seen from a nuclear detonation and I would now like to return to a consideration of the air-which provides a threat level electrical field. By repetitive blast and ground shock mechanical effects and Figure 12pulsing and continuous instrumentation monitoring at many illustrates the nature of the problem. It is necessary to con-points within the aircraft we can characterize what the EMP sider the combined effects of cratering, the direct induceddisturbance will be. One way to characterize the effects of stress wave and the airblast when evaluating ground shock.exoatmospheric radiation on satellites which produces system The airblast loading which induces ground shock also directlygenerated EMP, the SGEMP effect I told you about a moment applies a dynamic overpressure to object. on the surfaceago, is to use an underground test. which is complicated by multiburst effects, reflection factors,
and drag coefficients for the airburst and structural con.Figure 9 is a sketch of a test that was done sometime figurations being considered.
ago called HURON KING in which we examined the effectsof x-rays on a satellite-likelmodel. A vertical hole was drilled Figure 13 is an aerial photograph of a test called MISERSin the ground to a depth of about 1,000 feet and a nuclear BLUFF that was performed to gain information on airblastdevice was placed at the bottom of this hole. The trick of this and ground motion effects on a propoeed siting configuration
O experiment is to let the x-rays come up this pipe and impinge for the MX system. This test was conducted to explore whaton the satellite-like model and then choke the pipe off to the effects would be on a basing shelter of a missile if theprevent any debris from being released. You will notice the six nearest neighboring shelters were simultaneously targetedtrailers that contained extensive instrumentation which and introduced the complications of multiburst phenomenarecorded the satellite-like object response during the explosure. in airblast technology. This test was performed by the use ofAn enlarged view of the chamber that contained the satellite six one hundred and twenty ton high explosive shots and inmodel is shown in Figure 10. This chamber had to be used to this experiment we were able to learn how the effects fromprovide a background, in other words, an environment, to the six shots could be summed to determine the vulnerabilitymake the satellite think that it was truly in space. You will of the central shelter. In support of MX, we have also donenotice that there are tracks under this chamber and their experiments to help in the base line design of the variouspurpose is illustrated in Figure 11. This is a poet shot photo- shelters considered.graph of the experimental area showing what happened after
20
S
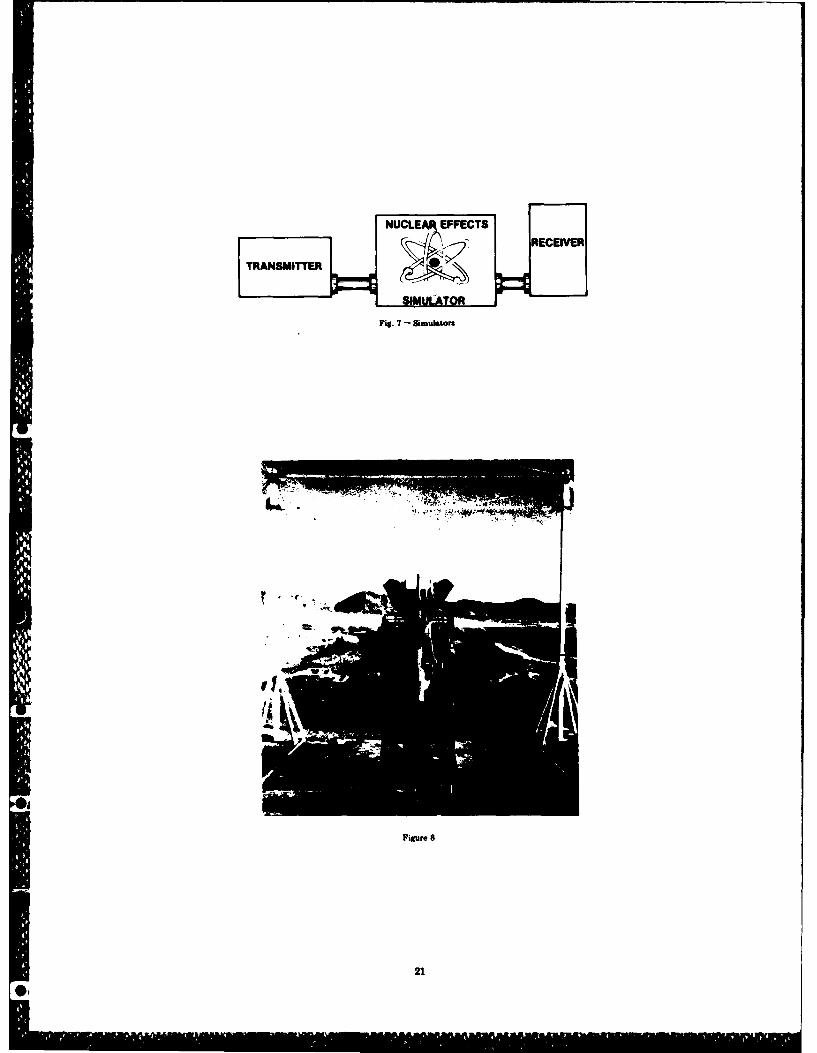
SIMUL ATOR
Fig. 7 - Saiulators
Figure 8
21

WHOLE
Pig. 10-Huo in xermn cnlurt
DRAG PLATE
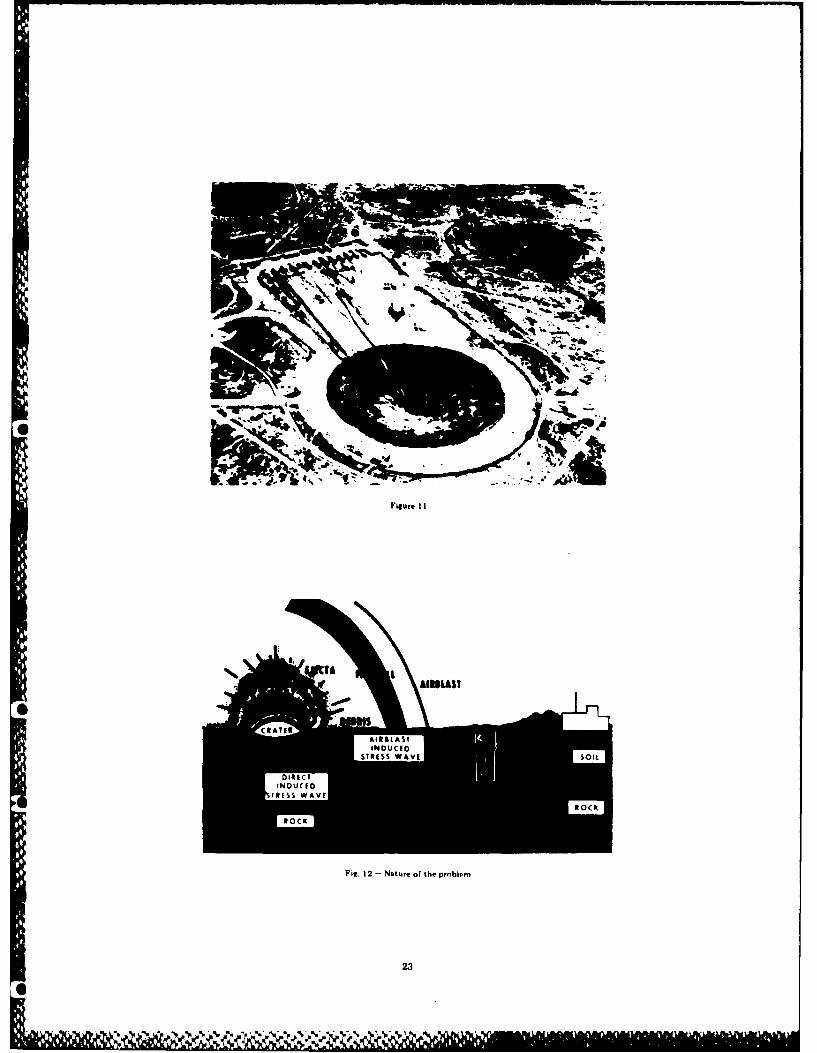
Figure 1
CRATER
AROCAS
Fig. 12 -Nature of the prnblem
23
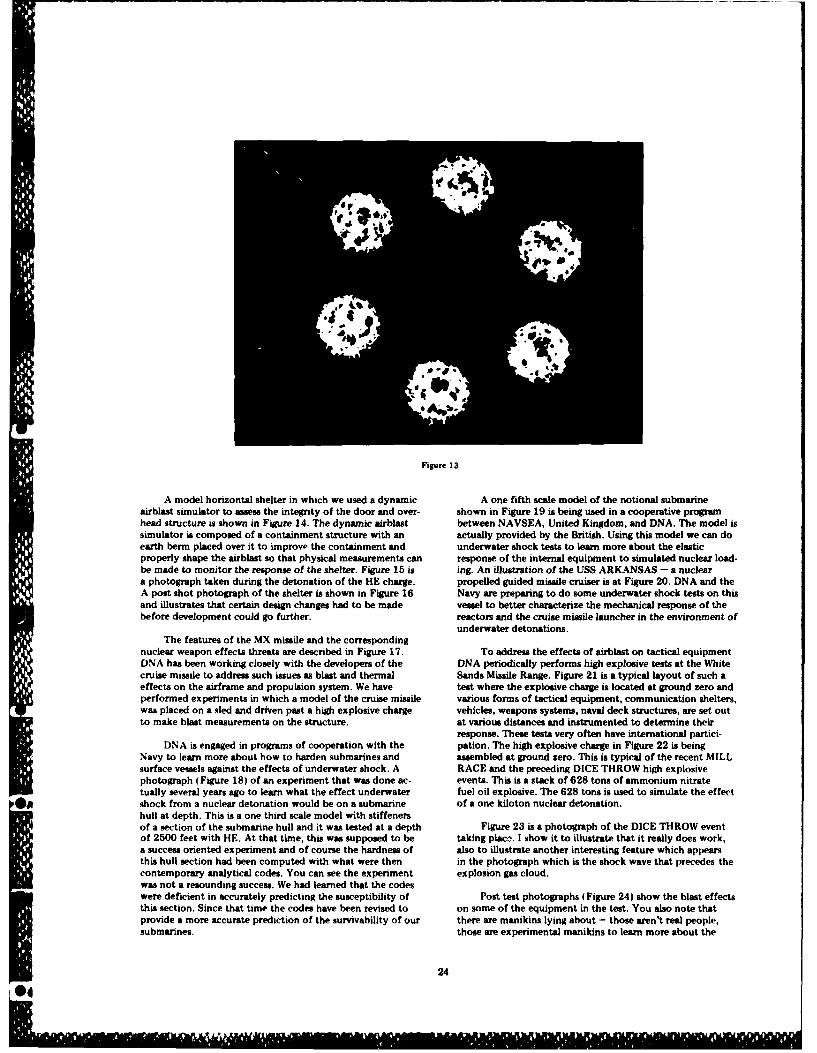
Figure 13
A model horizontal shelter in which we used a dynamic A one fifth scale model of the notional submarineairblast simulator to assess the integrity of the door and over- shown in Figure 19 is being used in a cooperative programhead structure is shown in Figure 14. The dynamic airblast between NAVSEA, United Kingdom, and DNA. The model issimulator is composed of a containment structure with an actually provided by the British. Using this model we can doearth berm placed over it to improve the containment and underwater shock tests to learn more about the elasticproperly shape the airblast so that physical measurements can response of the internal equipment to simulated nuclear load-be made to monitor the response of the shelter. Figure 15 is ing. An illustration of the USS ARKANSAS - a nucleara photograph taken during the detonation of the HE charge. propelled guided missile cruiser is at Figure 20. DNA and theA post shot photograph of the shelter is shown in Figure 16 Navy are preparing to do some underwater shock tests on thisand illustrates that certain design changes had to be made vessel to better characterize the mechanical response of thebefore development could go further, reactors and the cruise missile launcher in the environment of
underwater detonations.The features of the MX missile and the corresponding
nuclear weapon effects threats are described in Figure 17. To address the effects of airblast on tactical equipmentDNA has been working closely with the developers of the DNA periodically performs high explosive tests at the Whitecruise missile to address such issues as blast and thermal Sands Missile Range. Figure 21 is a typical layout of such aeffects on the airframe and propulsion system. We have test where the explosive charge is located at ground zero andperformed experiments in which a model of the cruise missile various forms of tactical equipment, communication shelters,was placed on a sled and driven past a high explosive charge vehicles, weapons systems, naval deck structures, are set outto make blast measurements on the structure. at various distances and instummented to determine their
response. These tests very often have international partici-DNA is engaged in programs of cooperation with the pation. The high explosive charge in Figure 22 is being
Navy to learn more about how to harden submarines and assembled at ground zero. This is typical of the recent MILLsurface vessels against the effects of underwater shock. A RACE and the preceding DICE THROW high explosivephotograph (Figure 18) of an experiment that was done ac- events. This is a stack of 628 tons of ammonium nitratetually several years ago to learn what the effect underwater fuel oil explosive. The 628 tons is used to simulate the effectshock from a nuclear detonation would be on a submarine of a one kiloton nuclear detonation.hull at depth. This is a one third scale model with stiffenersof a section of the submarine hull and it was tested at a depth Figure 23 is a photograph of the DICE THROW eventof 2500 feet with HE. At that time, this was supposed to be taking place. I show it to illustrate that it really does work,a success oriented experiment and of course the hardness of also to illustrate another interesting feature which appearsthis hull section had been computed with what were then in the photograph which is the shock wave that precedes thecontemporary analytical codes. You can see the experiment explosion gas cloud.was not a resounding success. We had learned that the codeswere deficient in accurately predicting the susceptibility of Post test photographs (Figure 24) show the blast effectsthis section. Since that time the codes have been revised to on some of the equipment in the test. You also note thatprovide a more accurate prediction of the survivability of our there are manikins lying about - those aren't real people,submarines, those are experimental manikins to learn more about the
24
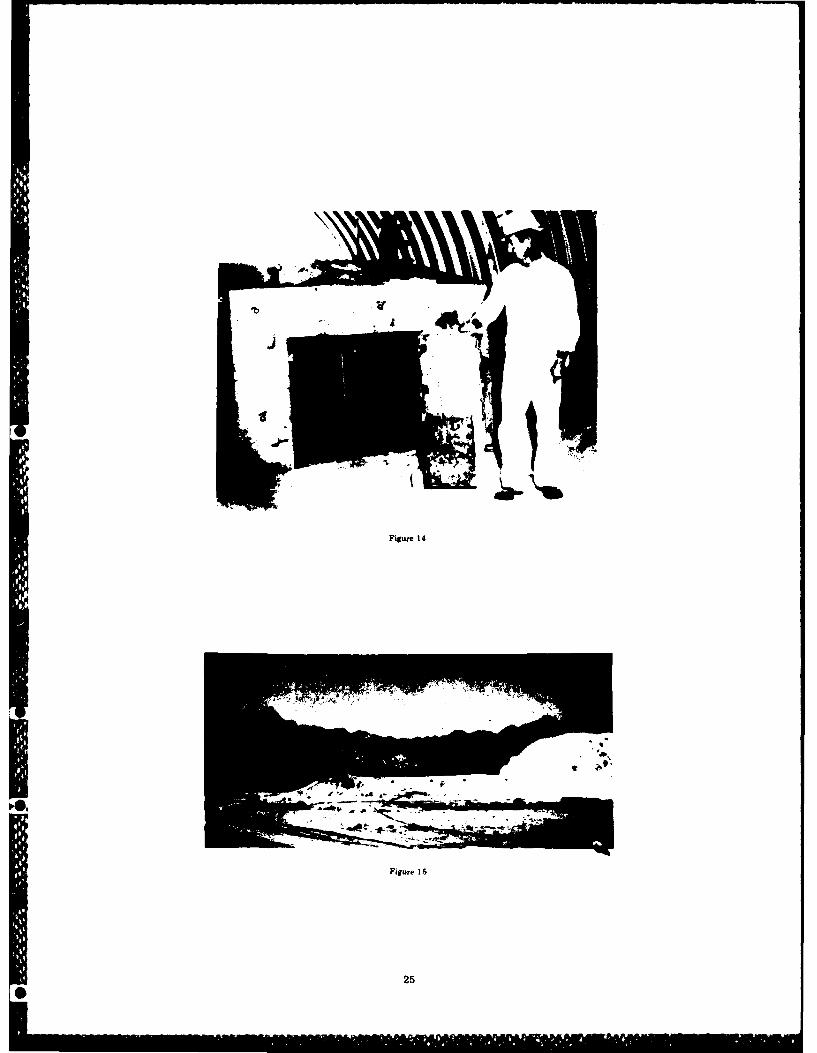
Figure 14
Figure ISr
25

Figure 10
IAX Vehicle
X4%ay EtI*cM: TheWfl Eflet:" Emaecioecs (IemptUAImp) * Soosw Exurgm Pvo"Pelmn" pfoSMSs Ouitlpbbgs. Mmmct:
* Uwrotd Malmorlits 0 sacsw, Ex"emal Protection
*11 -EacIte xtffigi P MWCtl" . Eaceter Slame94otag IV (POV~iExtm Proteonf , Shrowd MaterialInlawface
isg 17 -- NucI~mr hmrdn m t.'hnolomy
26
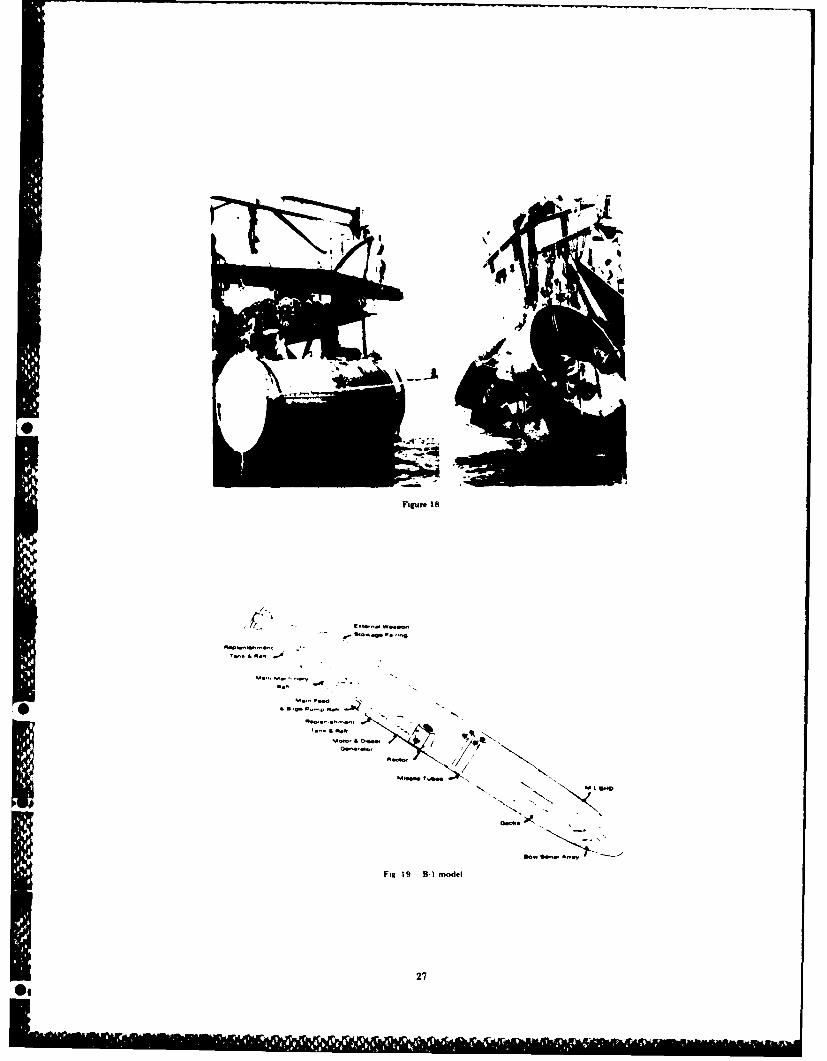
'4
I
U,
0
F pare 18
I-
*a0~~'~~',
'.'. S a~
a., ~ -
0 *~.." *ind
N
'.'. &e..~ N
Moo.&D~.. //
~~0t
M.g~ ?urn..
N N.
a-- SIt
F'. 19 B-I model
27
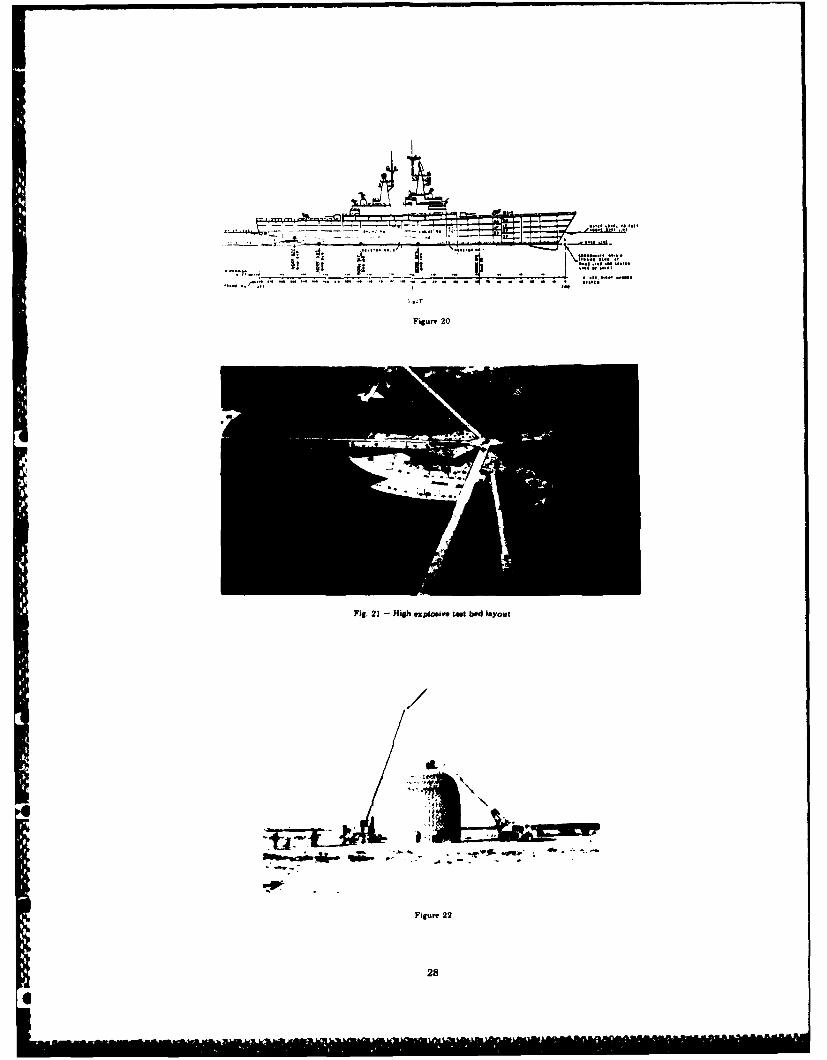
Figuro 20
Fig. 21 - High explosive tes bed layout
Figure 22
28
6. AmLi f
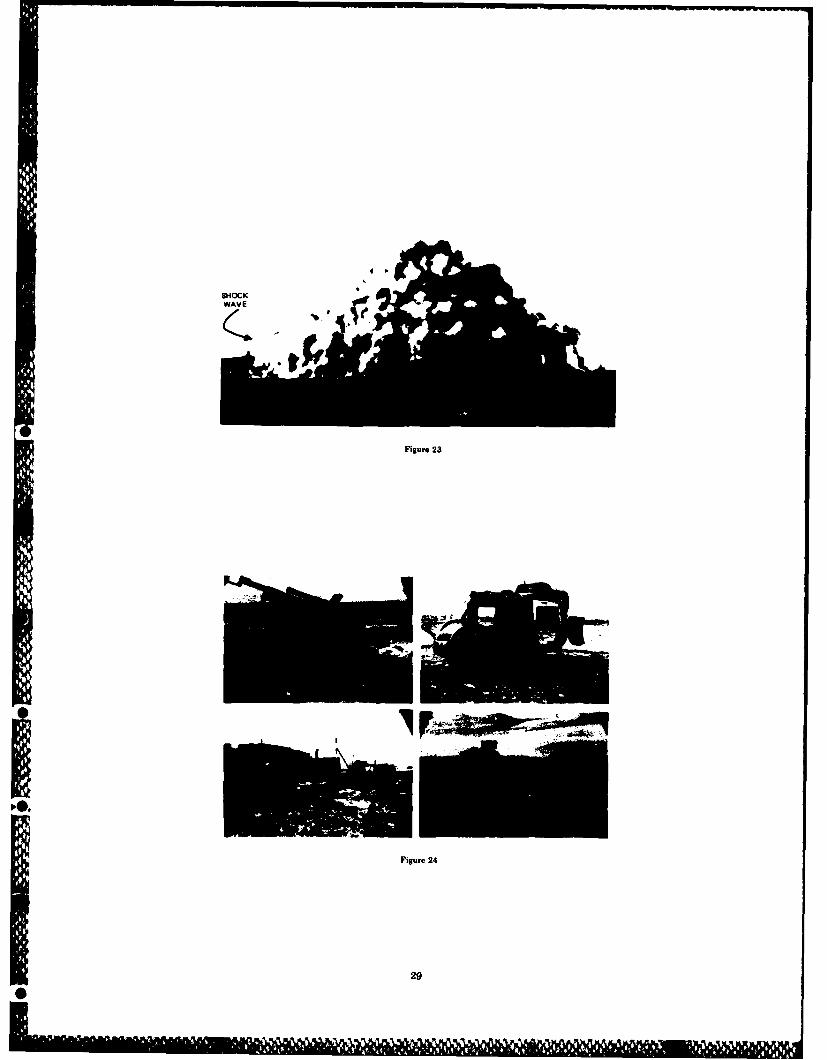
Figure 23
Figure 24
29
etect. of airblast on personnel. Obviously, we are every bit At the end of this tunnel we placed a nuclear deviceas much interested in what happens to our personnel, as we and by the use of evacuated pipes for the transmission ofare in what happens to our equipment. The Defense Nuclear x-rays for x-ray experiments or by side drifts to other tunnelsAgency conducts an elaborate program of research on the for structures experiments, we have been able to learn annuclear effects of personnel, including the effects of radiation awful lot about these effect.. The technique is not simple.as well as airblast. It requires many different types of closures to protect the
experimental objects so that we can properly make ourThe previous discussion and illustrations have addressed measurements and recover some of the experiments. The
airblast, thermal and, EMP effects but we also need to study instrumentation for some of these experiments is located inpound shock. I would now like to address that problem, side drifts in the tunnels. In other caes, we actually runFigure 25 illustrates a high explosive simulation technique cables up to the top of the mountain to a mesa where thefrequently referred to by the acronym HEST. It is a high trailers that include the instrumentation can be parked. Theexplosive simulator for producing airblast loads on surface complex of underground tunnels in Figare 29 is for the LOSflush or shallow buried structures. It is a technique that has test "DIABLO HAWK".been used since 1963 to test operational MINUTEMANfacilities and many scaled structures. In this simulation Over the years we have examined many different tech-technique the test object is placed in the earth either flush niques for producing underground structures - means ofwith its surface or at some distance below and layers of drilling them, excavating them and means of reinforcing themexplosives are placed over the top of the structure. The as illustrated in Figure 30. We have had an ongoing programexplosive array is then covered with an earth surchsrge as a aimed at examining the integrity of these structures in ancontainment mechanism to obtain the desired pressure time environment of nuclear produced ground motion.history. A photograph (Figure 26) of the experiment beingassembled shows the foam which forms the cavity dimensions. Over the years it has always been appealing to considerThe strips you see in between the foam are for the explosive other means of protecting our pround based strategic systemscharges and above this will be placed the surcharge. than the current use of silos. As missile accuracies increase, it
becomes more and more difficult to obtain basing modes thatAn illustration of a design to simulate the direct coupling are truly survivable to attack. I am sure you have often heard
of energy to the pound is shown in Figure 27. The test is reference to what is called a secure reserve force where somereferred to as MINE THROW. The test is designed by perform- assets could be protected over a long period of time to be useding calculations defining the pound motions from a nuclear in a protracted conflict. One such concept considered is deepburst in the hydrodynamic region. From these calculations we basing. In such concepts a series of missiles, launch controlindentify a contour of constant peaked stress selected to cor- centers, and all ancillary equipment would be housed under arespond with the contact premure between the explosive mountain or a mesa. The Defense Nuclear Agency is currentlyand the ground medium to be used in the simulation. At each studying this concept in cooperation with the Air Force andpoint along the contour, the pressme time history and the USDRE. There ae a number of critical problems which mustimpuhe is determined from the nuclear event calculation; be solved including the method of egre. If this reserve forcethen the explosive charge is shaped in such a way that it will should be housed for a number of weeks, when it is ultimatelyreproduce as nearly a is possible the pressure history at called upon there must be some means of getting it out of thespecific impule along the chosen contour. The charge is mountain. Many of these concepts are to be studied in detailignited in such a way as to attain the mine arrival of the so that we will have a plan that is backed by experimentaldetonation wave at the contour as the pround shock from validation so that if the decision is ever made to deploy suchthe nuclear event. Most of our previous tests have indepen- a system, we will have the technology at hand to proceed.dently tried to simulate the effects of crater induced poundmotion, upstream airblast induced pound motion, and local This is a small brush of things DNA is looking at today.airblest. We are devising experiments in the future that will We feel a very strong commitment to support the Services.combine theme effects by the combined use of simulators. We are not a management organization; DNA is a serviceThis is illustrated in Figure 28. organization. We are purple mited and take a serious view of
our responsibilities to all the people in the Department ofFor almost a decade we have been using the horizontal Defense we work for. It is certainly my intention to keep it
line-of-sight underground (LOS) test to do many of our that way.experiments in both shock x-ray effects and other phe-nomena related to nuclear detonations. In this experimentaltechnique we bore a tunnel into the side of a mountain forseveral miles.
300 1 . .. .I . . . .. ' . ... . .. .
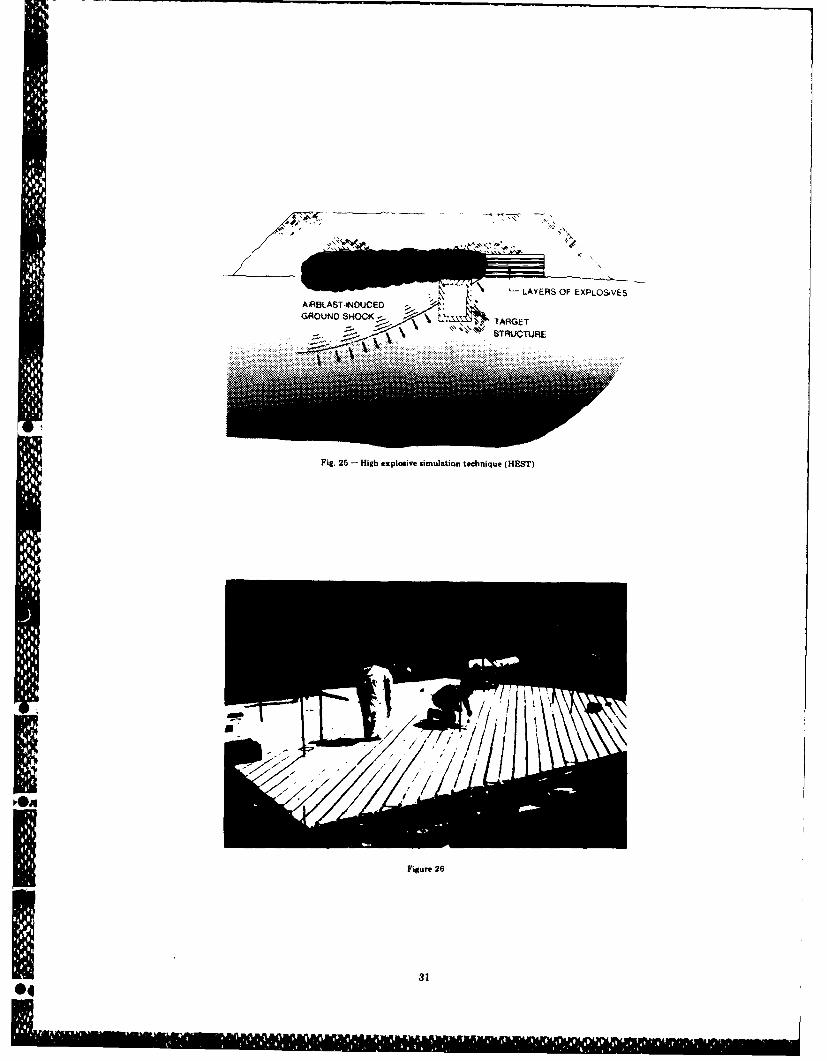
LAYERS OF EXPLOSIVESAiROLAST-WIJOUCEO . :GROUND SH~OCK TARGET
~ 8TRUCTUft
Fig. 25 - High explosive simulation technique (HEST)
KgI Figure 26
I 31
CENTRAL REFEREN4CE RACR
ANdFO CHARGE-CONdSTRUCTEDFROM io#UaO
2. FEEETVP
Fig. 27 - Miine throw event - conceptual design
LOCAL
AIRBLAST
C RTE R CrIzr-,nxScr
ground mcatur.
Fig. 28 - STP-3 combined effects test
Figure 29
32
UNINED LCL AVER UNLINED CYLINDER UNLINED C
* ~ , SLACI N I.CAV IIONDOt I DILL& BLAST ELVTD t R
PEXAVAEO DRIVER EARLNELD
-U I -R AT PILELR .IER RARD "AT PLDRVRE LY OS RECENt' A CURBETHO
IX-%ND.I I' IIRYIDR * ATRE YIDRO Y ITH DOMED,AD AixIROTE NT% D R O CK BIT ENWT ATRED GOUTED
%iNOOCR SUITS
IX s3~ tXTAVAVIDEE
01* < CONTROLLED RIASI
.',N XIA, DM RUtIICURN IS TELE DRAVE
* .1. 6 LIILLM RAST ,,S VAYI TIRN
XLI.% IMENNX .~ 5 L, ECAVATION 5 CONTROLLED BLAST* - . IT DRILL & RLALST 'DIYNJ# *ALPINE MINER IALI' PINE MINER
"AMD TAT CYLINDER, HAD HAT PILE DRIVER PLDRVRMIGHTY EPICI MET V EPIC DIABLO VAAR SPRtIEE MIIRT EjMYIPIC DIABLO HAWKDABL HWKR
Fig. 30 - Data bme rack opening reinforcement
33
THE ELIAS KLEIN MEMORIAL LECTURE
THE CHANGING DIMENSIONS OF QUALIFICATION TESTING
H. Norman AbramsonVice President, Engineering Sciences
SOUTHWEST RESEARCH INSTITUTE6220 Culebra Road
San Antonio, Texas 78284
INTRODUCTION unnecessary rejection of equipment that is specifically intendedto be of lightweight design;this would therefore imply that
Qualification testing is thought by many people to be a qualification tests for such equipment should be developed byrather routine endeavor, requiring only the application of some procedure that includes more directly relevant data.well established procedures and techniques. In actuality,however, qualification testing could hardly be more dynamic, In the nuclear power field the situation is quite differentrepresenting as it does an interface between a multitude of in that the government sets only guidelines or intentions andvendors, customers, testing facilities, regulatory agencies, etc., leaves the development of actual specifications to interestedeach of whom is striving - but in different ways - to deliver profemional organizations. The testing agencies (privatean acceptable product at minimal incremental cost. laboratories) then develop the relevant test procedures and
techniques and provide a service to vendors (whose equip-In the DOD field, these factors are ameliorated by the ment is being purchased by the A/E contractor responsible
fact that the specifications are essentially determined by the for designing and building a plant for operation by a utilitygovernment, as are the methods of testing to be employed - company). The government is required to make final judg-a stable situation, perturbed only (usually) by additional merts as to the validity of the qualification testing that hastechnical considerations arising during the qualification been conducted, but often these are not rendered until manytesting itself as a consequence of new design features of the months after completion - an unstable situation. The yen-product. Vendors account for the resulting additional devel- dors consider their products to be 'mature' and of provenopment costs in setting product prices. reliability (under normal conditions) and have accordingly
priced them to be as competitive as possible; expenses in-curred subsequently for qualification of seismic environments
QUALIFICATION TESTING FOR THE DOD are therefore to be minimized. Because this is a new industry,vendors (and even plant designers) sometimes have limited
Background knowledge of dynamic environments and responses.
The need for a representative form of test demonstration The purpose of this paper is to demonstrate, largely byof the capability of military hardware to meet the demands specific cases, the changing dimensions of qualification test-of field environments has been given serious engineering atten- ing in the interests of both the DOD and the nuclear powertion since World War 1I. 11] Even in the beginning, it was real. industry: In the one case the objective is "mission integrity"
* ized that various environmental parameters can influence this and is achieved principally through "generic" testing - thecapability (i.e., temperature, humidity, shock, vibration, etc.), environment is a "stable" one. In the other case the objectiveand so there has been pursued an almost continuous program is "operational reliability" and is achieved mostly throughof research and development aimed at establishing guidelines "custom" testing - the environment is an "unstable" one.for conducting appropriate qualification tests, and methodsfor specifying these tests, for equipment manufacturers. These MIL-STD 781C [3] also gives standard guidelines forefforts resulted in an extensive series of Military Standards vibration and other environmental testing where long term(MIL-STDS) which have been updated periodically. Several reliability is the prime concern.important concepts regarding test demonstrations haveevolved from this general activity, two of the most significant Unfortunately, it has become evident over the years thatbeing qualification (or proof) tests and reliability tests. the development of generic test procedures characterized by
MIL-SPECS and having the purpose of providing 'operational
MIL-STD 810 [21 has long been a most important source reliability' or 'mission integrity' has led in many instances toof guidelines for writing environmental test specifications. A high rejection rates and higher cost through overdesign. This,single failure during a qualification test usually constitutes in turn, has led to custom testing as a way to insure bettergrounds for rejection and subsequent redesign or other modi. products at lower cost. This is achieved by the developmentfication of the equipment. Often, such tests require time- of alternate methodologies for the development of test speci-accelerated procedures in which the environmental stress levels fications; the application of such methodologies, however,may be increased to compensate for reduced test durations. requires that vendors have good knowledge of the requirementsOn the other hand, data given in MIL-STD 810 is generally rec- and be able to employ to full advantage the advanced analysis/ognized to be quite conservative, and therefore can lead to measurement techniques required.
35
Methodologies for the Development of DOD Test (2) time averaged power spectra were a useful way ofSpecifications analyzing the data, again as shown typically in Figure 2.
Over the years, qualification and reliability tests havebeen conducted in both field and laboratory simulations, ineither case the attempt being that of duplicating the antici- - - .peed operational environments. Sometimes field simulations - -alone can give a reasonable representation, especially when -there is a substantial lack of knowledge about the significant - .-:environmental parameters. Such field simulations are, how-ever, usually quite expensive and therefore the trend has been-4more and more toward the development of improved labora-tory simulations. To provide simulations that include test -procedures that are even more representative of the antici- j "'pated operational requirement than are those of, say, MIL- '" .. ..ISTD-810 depends upon an improved data base. This in turn -requires the careful acquisition and and analysis of field dataunder representative operational procedures and the develop- .ment of new laboratory test criteria from those data. This .step is one of considerable complexity and requires consider- .able engineering judgment. The following examples are in- 17
tended to demonstrate the evolutionary nature of improvedMIL-STDS and customized qualification testing.
Early vibration qualification tests for most hardware Fig. 2- PS plot f data (roa accelerometer No.65were based on swept sine, and sine dwell tests whose specifi- inatomentation (code A)cations could be developed from MIL-STD 810. However,as one might expect, this type of test was particularly severeon systems having significant resonances, and failures oc- This data showed that vibrational energy was dominantly ap-curred. If it was suspected that the true environment was less plied at the rotor pmge frequency (11 Hz in this case) andsevere than the one specified (as was often the case), one was several of its harmonics. Results of this type led to sine dwellfaced with acquisition of field data and development of a tests applied only at these frequencies, rather than at reso-suitable alternate test. An example of such a procedure oc- nances of the specimen, and time duration of the dwells wascurred during qualification of the M200 Rocket Launcher made commensurate with the mission profile and a specifiedfor service on helicopter airframes. [41 It was first necessary number of minions. Ultimately, this work resulted in changeto acquire flight vibration data for these units, which also to recommended procedures for qualification testing of hel-required the development of a mission profile. Analog taped copter external stores when MILSTD-810B was revised toflight vibration data at anticipated critical locations were MIL-STD-810C; however, even these new procedures appearthen acquired for various maneuvers of this profile. Analysis to be still too conservative for more recent lightweight storeof these data led to two important conclusions: designs, and so the program has remained one of active
(1) data for some maneuvers were quite stationary (i.e., development.levels and frequency content were constant with Another similar example, but for a ground vehicle vibsa-time), while for others, such as turns and dives, the tion test specification development, was conducted for thedata were quite nonstationary, as shown in Figure 1 LANCE missile. 15,61 This specification included heating and
cooling as well as vibration tests. Originally, a swept sine testwas developed to represent the typical lifetime operational
.I6 I environment, but the vibration levels were complicated byi 'the different environments cased by mode of transportation,
UIVE & PULL-OUTJ terrain, speed, etc. (Figure 3), and which resulted in early.4 - -failures. Subsequently, the test was modified several times
: N vNOO and ultimately, a swept narrow bend random test was devel-
1.3 V - 18 V KN I IOTS oped which was shown to be more representative of the fieldO IN KNOTS environment. Based on additional field test data, a completely
different test was developed which included broad bend ran-V jk component represented eneargy input from the vehicle track
4 ~-iand varied with speed. Examples of power spectra from two-O . - -.... different carrier modes on a gravel road are shown in Figure 4
' 1;F iii for truck and aircraft environments. These spectra were then0 -* Is Is used as a criterion for a laboratory time4ccelerated test. An
example of a comparison of scaled field spectrum and labora-TIE (wc tory spectrum for one axis and terrain condition is shown in
Fig. 1 - Mean-quaro accelerationa from AH-G flight tets, Figure 5. Test durations were again tailored to the corre.vertical axia sponding service life.
36
" " . ... ..
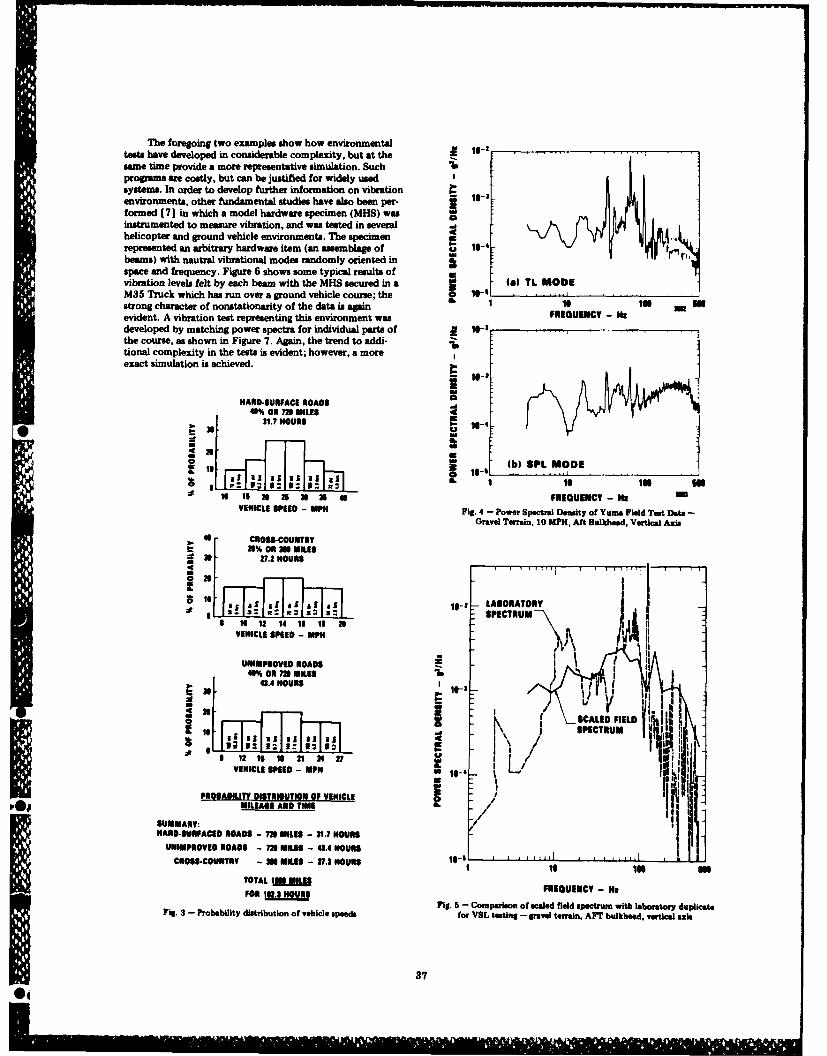
The foregoing two examples show how environmentaltests have developed in considerable complexity, but at the 10-.same time provide a more representative simulation. Such I,prorams are costly, but can be justified for widely usedsystems. In order to develop further information on vibrationenvironments, other fundamental studies have also been per- re 11-3formed [71 in which a model hardware specimen (MHS) wasinstrumented to measure vibration, and was tested in several .aa
helicopter and ground vehicle environments. The specimen -9represented an arbitrary hardware item (an assemblage of ubeams) with nautral vibrational modes randomly oriented in &Wspace and freluency. Figure 6 shows some typical results ofvibration levels felt by each beam with the MHS secured in a W.W TL MODSM35 Truck which has run over a ground vehicle course; the 0. liE--strong character of nonstationarity of the data is aain Is 1118 m Sevident. A vibration test representing this environment was FREGUENCY - NIdeveloped by matching power spectra for individual parts of U-
the course, as shown in Figure 7. Again, the trend to addi-tional complexity in the tests is evident; however, a moreexact simulation is achieved. ,-'
I-_i HAND-SURFACE ROADM
-% OR 72 MILES31.7 HOURS -
S (h11b SPL MODE
15 IS U 2 24X26 e FREQUENCY - HaVEHICLE SPEED - MPH Fig. 4 - Power Spectral Density of Yuma Field Test Data -
Gravel Terrain, 10 MPH, Aft Bulkhead, Vertical Axis
48 ROWSCOUNTRY21% OR M MILES
3- 27.2 HOURS-
* II
a : 1- - LABORATORYa.. IS-s: a:SPECTRUM-I 12 14 I6 10 2 \ _ MII
VEHICLE SPEED - MPH All I
UNIMPROVED ROADS46% ON 729 MILESis
-- 4.4 HOURS ie-'
•~0 ;I i // ALED FIELD
1| 12 1i 21 24 27VEHICLE SPEED - MPH IE
PROBABILITY DITRleUTiO OF VEICLE/i I l~~ILAGE AND TOMI /
SUMMARY: S
K1k HAND-SURFACID ROADS - MI MIE - 31.7 HOUSE;UIMEPROVED ROAD$ - 1 MILES - 4.4 HOURS
CROSS-COUNTRY - ME MILES - V.2 HOURSIEHARD-SPACED OA I=7 MILE$ 17 OR
TOTAL 1.HU FREQUENCY - Na
FIg. - Comparison of scaled field spectrum with laboratory duplicateFig. 3 - Probebility distribution of vehicle speeds for VSL testing - gravel terrain, AFT bulkhead, vertical si
37

P-PAVE0S 3. MPH 6-42AVIL W3 "There has also been considerable attention given to theEUMP3 MH ~2~ MINUAI -development of better laboratory systems for producing re-
33-SACED 9UPn1114 212IC AHNADIliability tests. For some time, there hss been an interest inUM11-11ADAL UASHB@AED 16 MPH[ 19-1111.61 KtOCK 20MPH I the Army Test Methodology program to develope a vibration'Hf1U.9 HE system capable of producing vibration along several axes
6 simultaneously, as is actually experienced by field hardware.Initially, the exact nature of the requirement for the multi-
-.. a, .L .132.4 HE axis shaker was unknown, so a typical radio specimen wasS - 'a, AA_ instrumented and flown in a helicopter under an appropriate
164.6 Ha operational plan. [81 Throughout these flights, excitationLH vibration analog tape data was acquired at three points on the
*-radio face (where it was attached to the instrument panel),mm and response data was acquired at one point on the back of~ 'H 75. Hzthe radio. From the input-output data, a mathematical model
* -iA of the radio was developed using power spectra and crossspectra. The mathematical model was then used to predict
48 HE1 radio responses for several different types of physical repre-A. '~aiaAi~k~ A sentation of the excitation. An example of some result com-
* parisons is shown in Figure 8. It was found that a triaxialjgg X.26 HEj system (three simultaneous independent orthogonal axes) for
~ ~ i1'~..4 il- '61 the shaker was most feasible. [ 9
Seer 27 2 H~ This development of a triaxial shaker system led to aLL - concurrent program which was aimed at acquiring reliability
8.6 HE
1 2 4 6 8 16 12 10-1TIME - MINUTES N KNOT HORIZONTAL FLIGHT
- 33 '2W G 1W2W UWFILTER BANDWIDTH, S 2.44 Hz22 'W 019'0 2 'W 6H DEGREES OF FREEDOn =64Fig. 6 - Aversge Strain Level Varistion with Time Run No. 2A MHiS DIGITAL ANALYSIS
Secured in Aft Cargo Ares M35 Truck - Field Dats lDMESOA
jg203-DIMENSIONALAVRG01-DIMENSIONAL AVERAGE
= ~a6-DIMENSIONAL RIGID BODY
SHAKER VERTICAL__ _ _ _
-2040
-4.A 10 i-4-40~
I I-I
PA36 TRUCK 0-~VERTICAL AX IS16
. ~A~~frv~i,4 T"U - -M -72 M N s 16 INT1
FREQUENCY, Hz 1061BW - 1.6 HE FREQUENCY, Hz
N=162 DEGREES OF FREEDOMFig. 8 - Longitudinal response amplitude (Y4 0 and simulations for
Fig. 7 - PS0 of M35 truck on 2-inch washhoard OH 58A helicopter
38
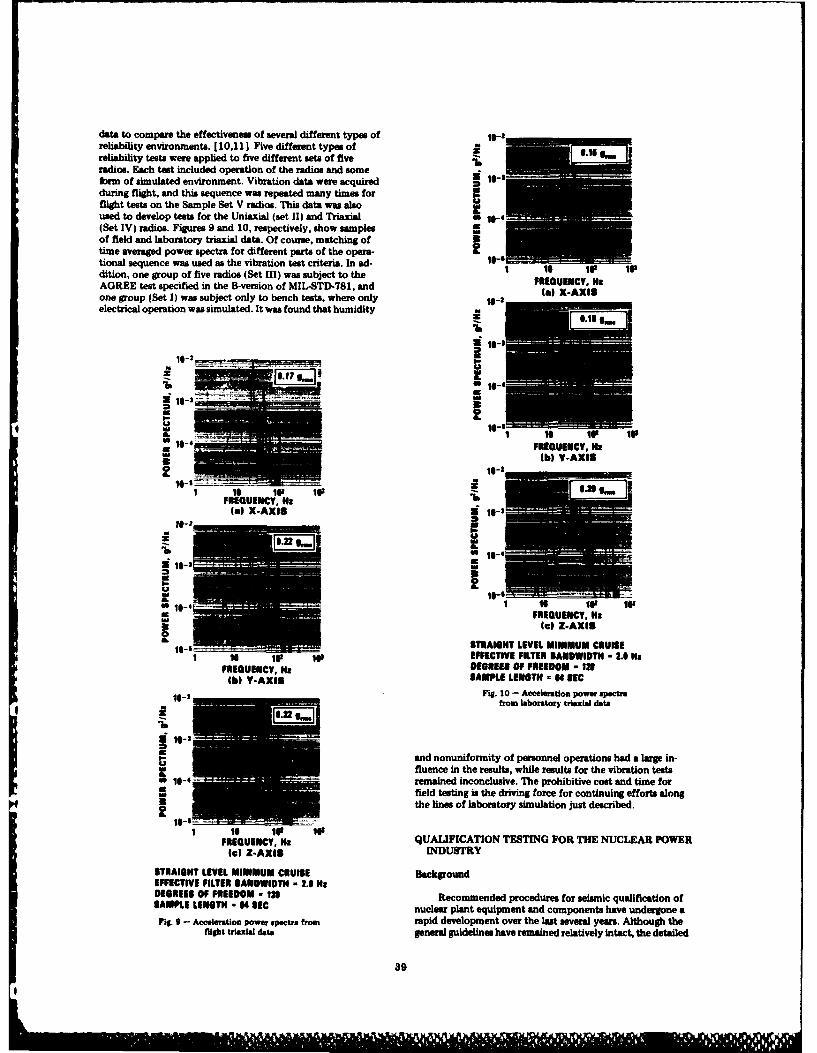
data to compare the effectiveness of several different types of I1-2reliability environments. 110,111 Five different types of .reliability tests were applied to five different sets of fiveradios. Each test included operation of the radios and someform of simulated environment. Vibration data were acquired is-during flight, and this sequence was repeated many times for UIiflight tests on the Sample Set V radios. This data was also iused to develop tests for the Uniaxial (set 11) and Triaxial a 1s-'(Set IV) radios. Figures 9 and 10, respectively, show samplesof field and laboratory triaxial data. Of course, matching oftime averaged power spectra for different parts of the opera-tional sequence was used as the vibration test criteria. In ad- 10-dition, one group of five radios (Set III) was subject to the Is10 IF IVAGREE test specified in the B-version of MIL-STD-781, and FREQUENCY, Isone group (Set I) was subject only to bench tests, where only 14- (electrical operation was simulated. It was found that humidity _U
.6
1 IV-a IV
j |I Y-AXle
-
ll-a 1
I IV.IVFREQUENCY, III
Is) X-AXIS l-'i* 10-~C - I
110
Mis
Is1-*1 1 IF 1IVFREQUENCY, Ha
to) Z-AXISoSTRAIGHT LEVEL MINIMUM CRUISE
is IF 113li EFFECTIVE FILTER BANDWIDTH - 2.0 HsFREQUENCY, H DEGREES OF FREEDOM - 1214b) -AXIS SAMPLE LENOIR = 64 SEC
IS_| Fig. 10 - Acceleration power spectra
i e-i
p- and nonunformity of personnel operations had a IM in-u fluence in the results, while results for the vibration tests
10-*remained inconclusive. The prohibitive cost and time fori ifield testng is the driving force for continuing efforts along= the line of laboratory simulation just described.
Is if I-FREQUENCY,14a QUALIFICATION TESTING FOR THE NUCLEAR POWERto) Z-AXIS INDUSTRY
STRAIGHT LEVEL MINIMUM CRUISE BackgproundEFFECTIVE FILTER BANDWIDTH - 2.0 HaDEGREE$ OF FREEDOM - 1211 Recommended procedures for seismic qualification ofSAMPLE LENIGTH - 64 SEC nuclear plant equipment and components have undergone a
Fig. 9 - Acceleration power spectra from rapid development over the last several years. Although theflight triaxial date general guidelines have remained relatively intact, the detailed
39
!a

procedures have changed significantly. These changes result accelerometers and three strain gage channels to measurelargely from reactions to individual problems that have arisen excitation and response data for the various tests. In prelim-spontaneously in the various test laboratories during actual inary tests, the cabinet natural modes were determined byqualification tests; unfortunately, the details are often buried resonance searches when mounted to the floor and whenin company proprietary test reports, and have rarely been mounted on a biaxial seismic simulator. Figure 12 showspublished for general evaluation. A major problem for seismic several of the prominent floor-mounted modes below 35 Hz.qualification testing is that there is no operational data base! Typical transfer functions for the simulator-mounted searches
are shown in Figure 13 from which it can be seen that someThis lack of data base information further aggravates differences in frequencies occurred for the two different
difficulties arising from the fact that many organizations are mounting methods. Procedures for handling these differencesinvolved in the total qualification process. (121 The vendor during qualification tests have evolved as a consequence ofissues a contract for testing of a specific hardware item, with this data.given test specifications, to a chosen test laboratory. Thespecifications are written by the A&E firm to whom the The cabinet was subjected to a series of qualificationvendor is a supplier. In turn, the A&E firm must satisfy its tests, including biaxial independent and biaxial dependentcontractual requirements with the utility company whose tests for typical ground level specifications. Both random andplant it is constructing; and, finally, the utility must satisfy earthquake signal sources were used to develop the drivelicensing requirements of the NRC. One of the few unifying signals for the simulator. Further, another series of tests, foraspects of this qualification process has been that many floor level specification, was also imposed that includedinterested members of these various organizations have served biaxial independent, uniaxial, sine beat, and sine dwell excita-on the IEEE committees that have actively developed the tions. Both random and earthquake signal sources were againguidelines for qualification. The NRC has, in turn, published utilized to produce a typical floor level test. Figure 14 showsstandards which either approve or supplement these guide- time histories for a typical biaxial independent randomlines. Unfortunately, the result of this somewhat convoluted ground level test run while corresponding required responseprocess is that there has been very little published research spectra (RRS) and test response spectra (TRS) are shown inevidence to support the test procedures that have evolved. Figure 15. These response spectra demonstrate a typical, and
very important, problem; both Figure 15a and 15b show anGeneral guidelines for the conduct of seismic qualifica- excessive test zero period acceleration (ZPA) compared with
tion tests are specified by the NRC in Standard Review Plans. the required value. This problem has been discussed at length(13,14] These quidelines require considerable supplemental in References 20, 21, 22, and appears to indicate over-conser-explanation and, therefore, rely on standards written by vatism in the test, resulting from a mismatch of the responsecommittees of the IEEE. For example, IEEE 323 [151 is a spectra. This discrepancy may be a consequence of an insuf-standard* which addresses general environmental require- ficient designation of tolerances required to achieve thements, while IEEE 344 [16] is a more detailed guideline proper ZPA, or can often occur because, indeed, no timefor seismic qualification of electrical equipment. It is further history can be generated that will match the RRS entirely!supplemented by NRC Reg. Guide 1.100 [171, which recog- In any event, the effects of this "apparent" overconserva-nizes the use of IEEE 344 for qualification of both electrical tism on test results needs to be evaluated.and mechanical components. Such documents are furthersupplemented by various other standards that apply to more Data from the individual runs during the various testsspecific equipment such as Valve Operators. [181 were correlated in terms of peak measured response (a;) as a
function of peak response (a1 ) predicted from the responseAlthough there has been little published hard data on spectrum. That is,
developments in seismic qualification, several review papershave appeared. [ 19,201 These were followed by a further a* = 20r [H3 1 (Wr)[airreview (211 of research needs, which was based on observa-tions during various seismic qualification tests. One researchprogram, that was based on experimental data throughout, where H3 1 is a transfer function and r is modal damping.and which sought out and identified specific problem areas, Examples of typical results are shown in Figure 16. Thisrecommended approaches for their solution and developed type of correlation indicates that reasonable agreement existsnew concepts for handling the qualification process, has also between measured responses and those predicted by shockbeen reported 1221. spectrum analysis. The principal discrepancy seemed to resultfrom nonlinearity of the transfer functions for the various
modes. A second type of correlation was developed in terms
Test Methods and the Response Spectrum Anomaly of average RMS response (i 3) as a function of average RMSexcitation (i 1 ). That is,
The following discussion is directed toward identifyingsome of the problem areas presently occurring in seismic ii = A31alqualification testing. The case to be reviewed involves anelectrical network control cabinet ( 22 1, although the resultsare applicable to both electrical and mechanical equipment, where A 31 is a constant. Correlations of this type are applica-in general, and to qualification by analysis as well as by test. tions of the equations developed for a general structural
system. [ 23] This also recognizes the RMS value as a usefulA typical electrical cabinet was subjected to a variety of measure of intensity, as has also been pointed out in Refer-
seismic tests that are currently recognized by IEEE 344-1975, ence 24. Examples of some of the results are presented inand furthermore, by Reg. Guide 1.100. The objective was to Figure 17. In general, it can be seen that less scatter of datadevelop data from which the responses to various tests could occurs for data of a given type of test run. Further, each testbe compared. Figure 11 illustrates the cabinet and instru- run having similar sustained damage potential falls on a cor-mentation locations, the latter involving three triaxial responding curve, which helps point to the development of a
parameter which describes an all-around damage severity of a*An updated version of this standard is NUREG 0588. given type of test. [ 251
40
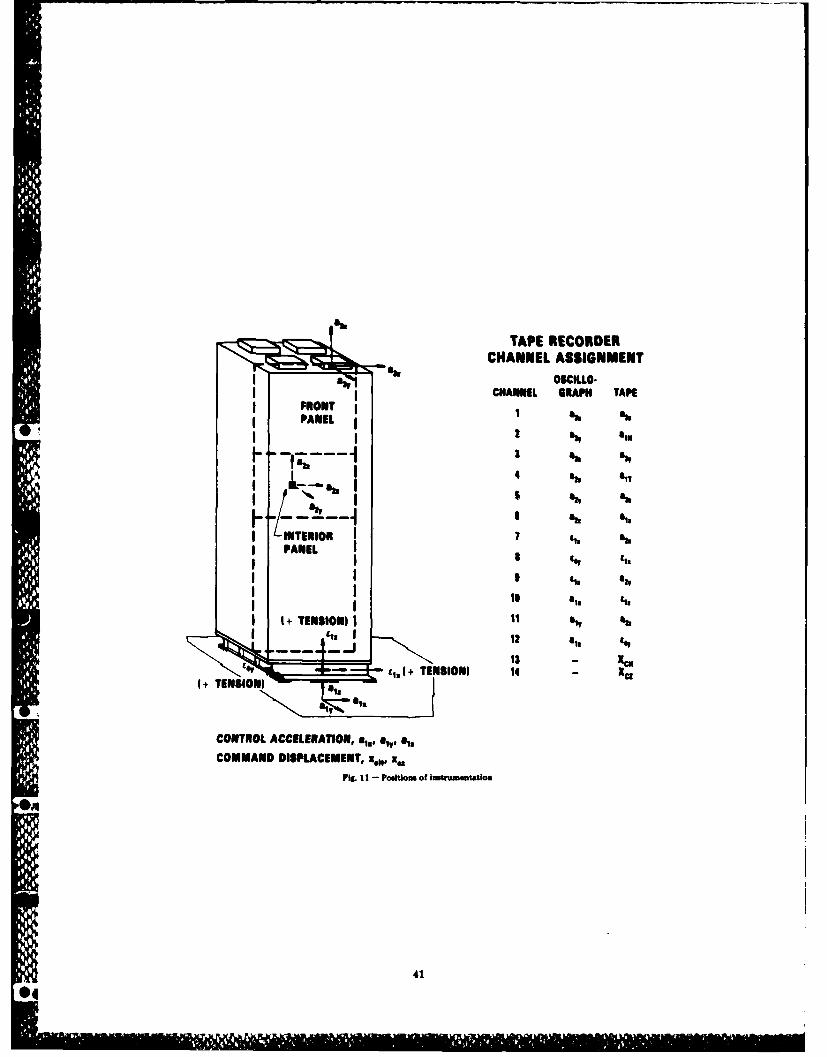
TAPE RECORDERCHANNEL ASSIGNMENT
4*41 OSCILLO.ICHANNEL GRAPH TAPE
FRN Ih
I PANEL
I4 Il
I I+ TENSION) 1 11 &IT s
'n12 all 4412
(+ ENIOtj ( + TENSIONI 14 - Xci
CONTROL ACCELERATION, as, I, alCOMMAND DISPLACEMENT, .0 . ~
Fig. I1I- Positions of iuntnamestion
41
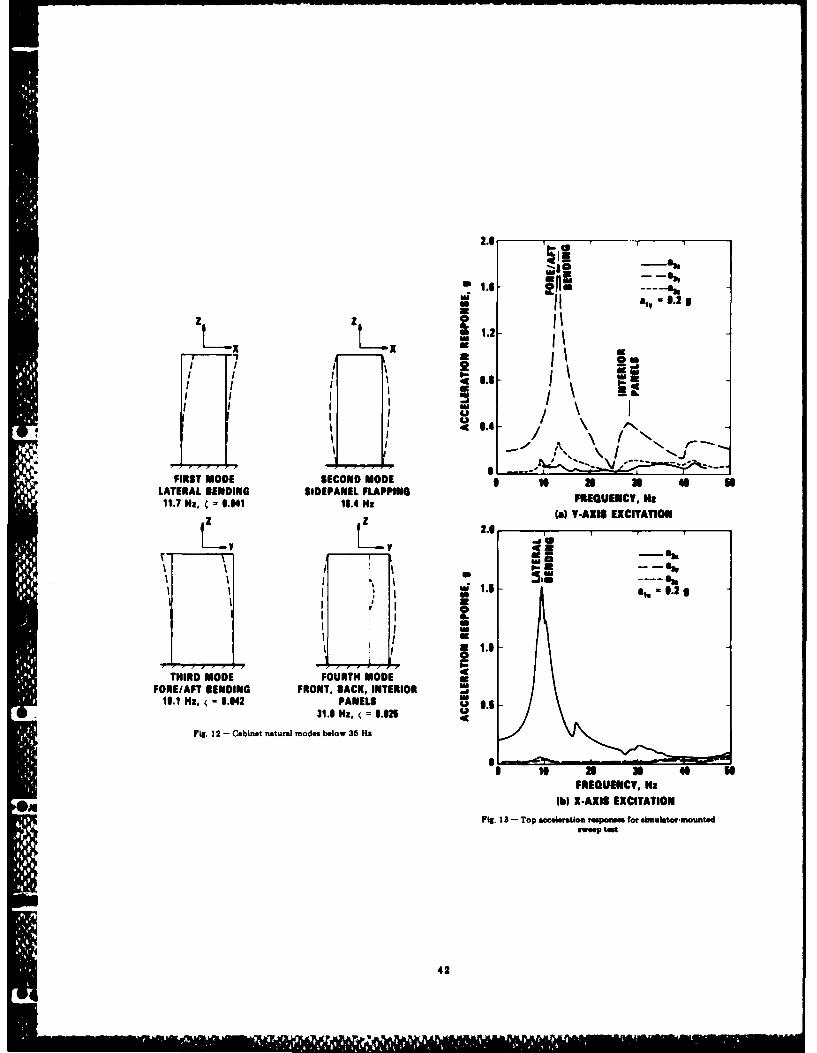
I a1, =8.a
16 2.
z za 1.2x Lx
0 I0
a 1.4-
-11 N.l- -FIRT MDE ECOD ODEI I 21 38 I
a - afA
41
FIRS MOD SEONDT MODE aLATERALT BENDING SFDENT BA LAPINEIO WQUN,
11.7 HaFREQUENC11.4HH11a1 X-AXIS EXCITATION
42
aft~i LAR
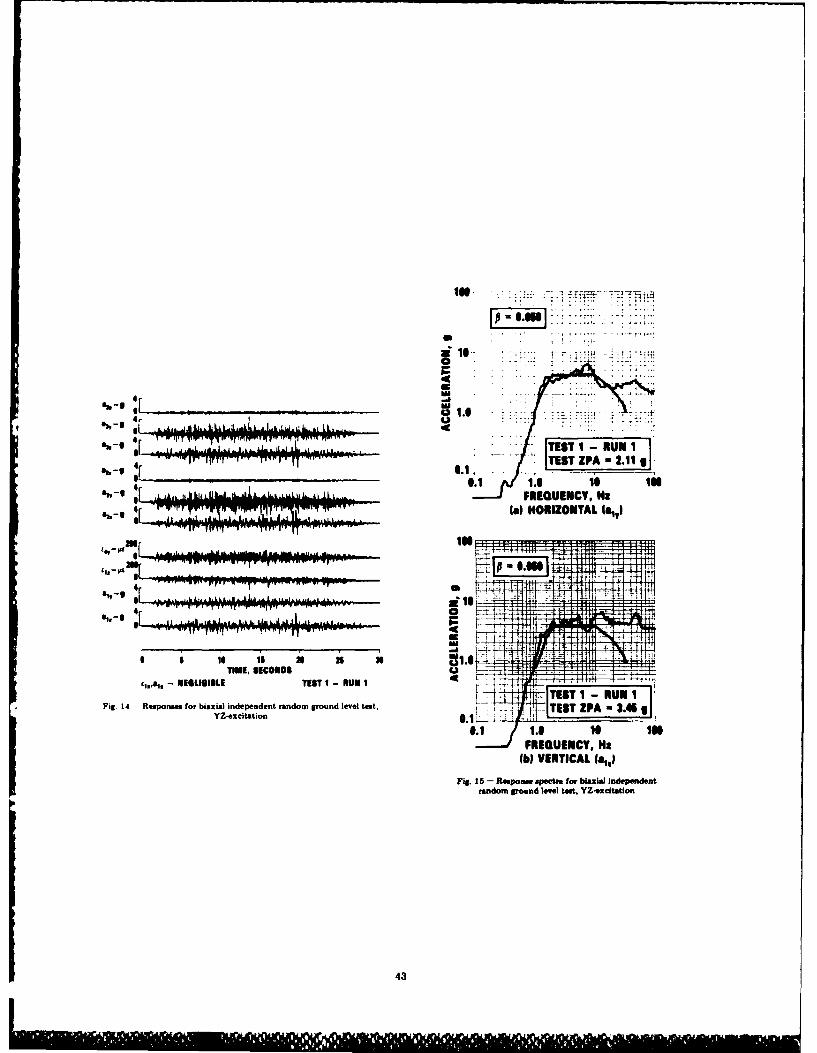
--- f 7 Tqi
...........
4[6Air
.1 FREQUENCY, Hz4 T' IS) HORIZONTAL I&%)
-A 1,440M-1jJ0 Nor 110 k LI.
S~~2 306 1 3 I
NEGLIGIBLE TEST I - RUN I EST__I_-__RUNI
Fig. 14 - Responses for biaxial independent random ground lee test,. TEST ZPA - 3.491
FREQUENCY, Hit(b) VERTICAL (a,.)
Fig. 15 - Reape... spectra for biaxial independentrndom pround level tat, YZezxcitatioj
43
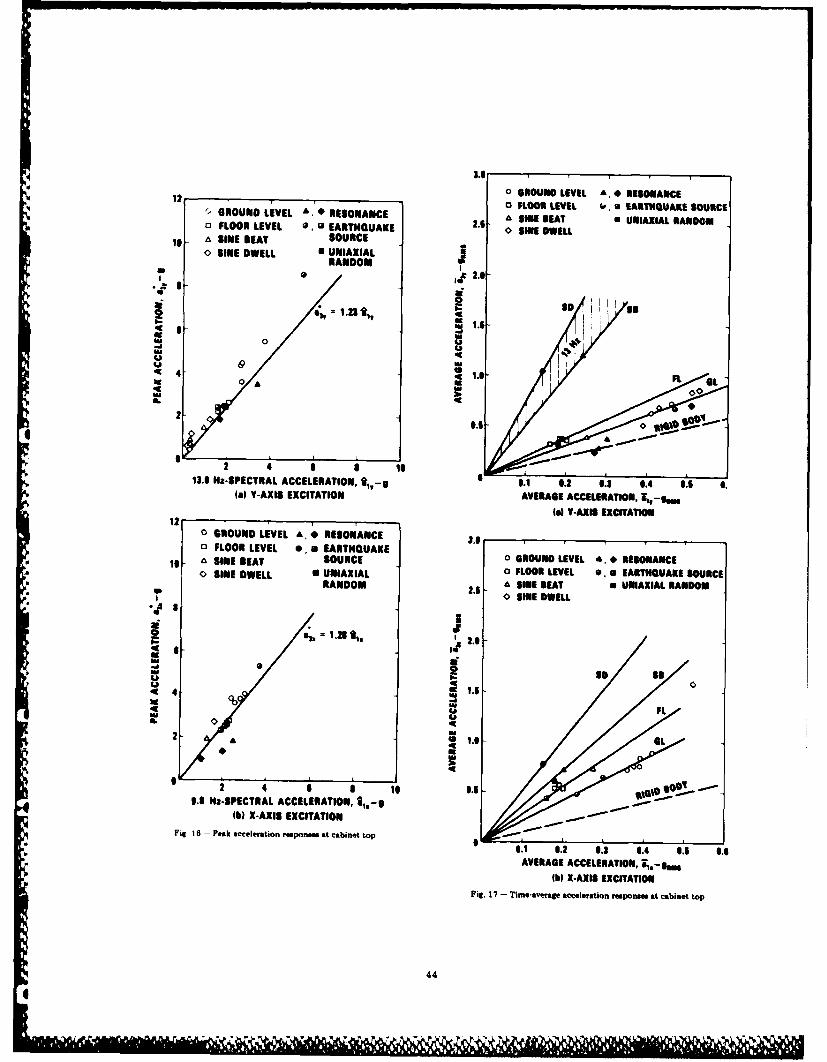
l I I ..... .. ... ....... . .. .. . ............. .. .. . . .. .... ......
3.112 0 GROUND LEVEL A,. RESONANCE12 ' 'o0 FLOOR LEVEL a, • EARTHQUAKE SOURCE
r, GROUND LEVEL "* RESONANCE A $11 BEAT N UNIAXIAL RANDOMa FLOOR LEVEL * 0 EARTHQUAKE 2. 0 0 SINE DWELL
SINE SEAT SOURCE0 SINE DWELL 1 UNIAXIAL
RANDOMSn U
32 'n4[ 1.S
4a 4U "aU 0
2* 1. -1 0
44
a- 4
2 4 5 S 1,13.1 Ma-SPECTRAL ACCELERATION, *,,-I 1 .1 6.2 1.3 6.4 6.6 6.
(a) Y-AXIS EXCITATION AVERAGE ACCELERATION, iv-ggg
fal V-AXIS EXCITATION12
0 GROUND LEVEL A # RESONANCE 3.13 FLOOR LEVEL *, a EARTHQUAKE
10 A SINE BEAT SOURCE 0 GROUND LEVEL A, R1SONANCE0 SINE DWELL 0 UNIAXIAL 0 FLOOR LEVEL , . a EARTHQUAKE SOURCERANDOM 2 A SINE BEAT a UNIAXIAL RANDOM* 2.5 0 SINE DWELL
2 o
0- I2Z
u1 .0
4 4m
I- N0. Q ,qo
9.1 Ni-SPECTRAL ACCELERATION, 1r-(I X-AXIS EXCITATION .
Fall 16 - Peak acceleration reponses at cabinet top
0.1 0.2 1.3 6.4 O.m
AVERAGE ACCELERATION,.-auAb} X-AXIS EXCITATION
L IFig. 17 - Time-averagie acceleration responses at cabinet top
44
;U
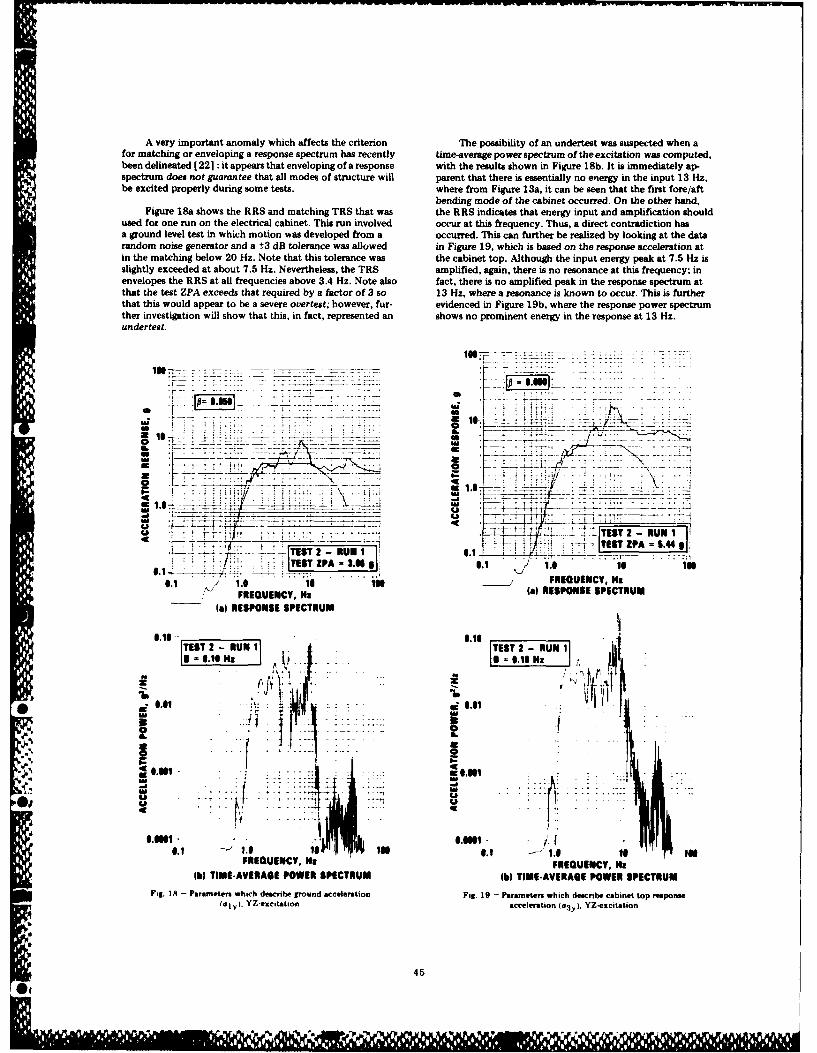
A very important anomaly which affects the criterion The possibility of an undertest was suspected when afor matching or enveloping a response spectrum has recently time-average powerspectrum of theexcitation was computed.been delineated [22]: it appears that enveloping of a response with the results shown in Figure 18b. It is immediately ap-spectrum does not guarantee that all modes of structure will parent that there is essentially no energy in the input 13 Hz,be excited properly during some tests, where from Figure 13a, it can be seen that the first fore/aft
bending mode of the cabinet occurred. On the other hand,Figure 18a shows the RRS and matching TRS that was the RRS indicates that energy input and amplification should
used for one run on the electrical cabinet. This run involved occur at this frequency. Thus, a direct contradiction hasa ground level test in which motion was developed from a occurred. This can further be realized by looking at the daterandom noise generator and a ±3 dB tolerance was allowed in Figure 19, which is based on the response acceleration atin the matching below 20 Hz. Note that this tolerance was the cabinet top. Although the input energy peak at 7.5 Hz isslightly exceeded at about 7.5 Hz. Nevertheless, the TRS amplified, again, there is no resonance at this frequency; inenvelopes the RRS at all frequencies above 3.4 Hz. Note also fact, there is no amplified peak in the response spectrum atthat the test ZPA exceeds that required by a factor of 3 so 13 Hz, where a resonance is known to occur. This is furtherthat this would appear to be a severe overtest; however, fur- evidenced in Figure 19b, where the response power spectrumther investigation will show that this, in fact, represented an shows no prominent energy in the response at 13 Hz.undertest.
.. • _7 6 - ____
, 16 -
It,. _ _ _ .. ,+ ..
:1.6I11 - __ "" -t IUll _______,
~ .i.. J .TEST 2 - RUNmI I
fII - IfI.I lRUN 16. -- .1
F~~~~KP 6.44~.N a. . 6
.. I FREQUENCY,, N1 T -E 16ETU Isl RESPONSE SPECTRUM
1a) RESPONSE SPECTRUM
6.16 6.16 I0iTEST 2 --RUN 11TEST 2 -RUN 1I"a is 6.6H.18 It
I Is
FRQENY Hi FRQUNY.
+:Fig , I1h - Parameters which describe ground acceleration Fig. 19 - Paratmeters which dtenbe cabinet top reponse+ {a I y I YZ-excitation acceleration (a3y), YZ-excitation
- MI
0.1 '1 .,1 '16 O
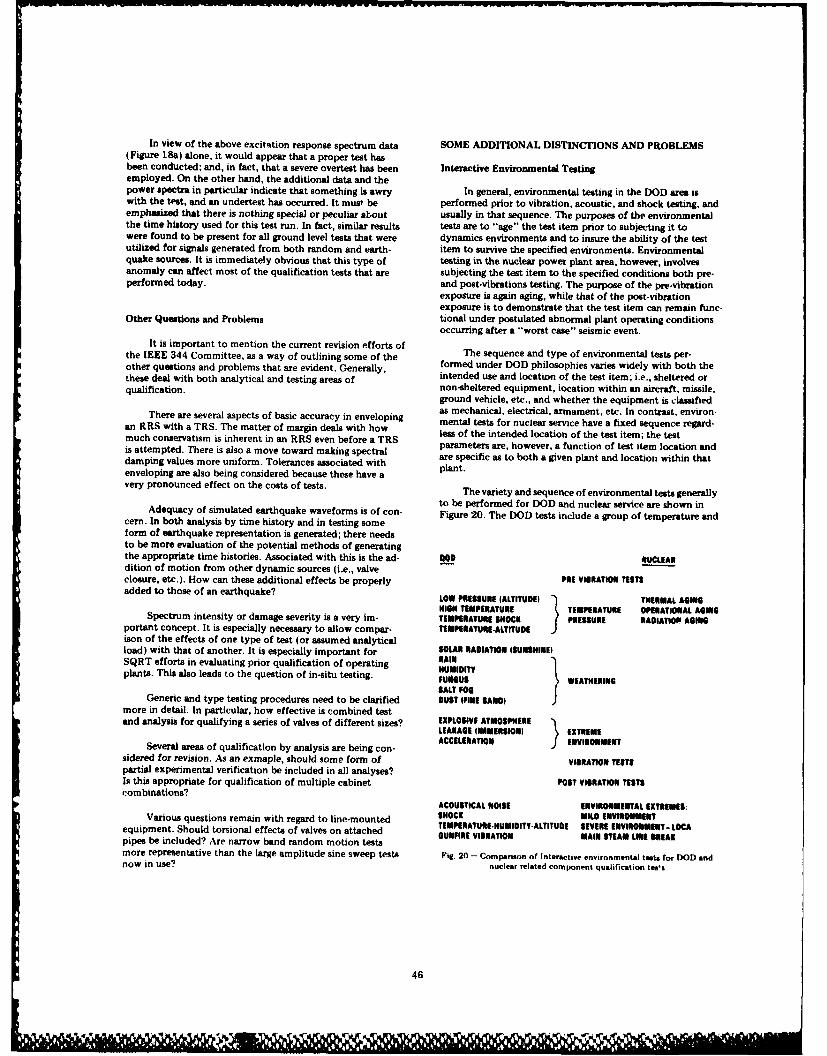
In view of the above excitation response spectrum data SOME ADDITIONAL DISTINCTIONS AND PROBLEMS(Figure 18a) alone, it would appear that a proper test hasbeen conducted; and, in fact, that a severe overtest has been Interactive Environmental Testingemployed. On the other hand, the additional data and thepower spectra in particular indicate that something is awry In general, environmental testing in the DOD area iswith the test, and an undertest has occurred. It must be performed prior to vibration, acoustic, and shock testing, andemphasized that there is nothing special or peculiar about usually in that sequence. The purposes of the environmentalthe time history used for this test run. In fact, similar results tests are to "age" the test item prior to subjecting it towere found to be present for all ground level tests that were dynamics environments and to insure the ability of the testutilized for signals generated from both random and earth- item to survive the specified environments. Environmentalquake sources. It is immediately obvious that this type of testing in the nuclear power plant area, however, involvesanomaly can affect most of the qualification tests that are subjecting the test item to the specified conditions both pre-performed today. and post-vibrations testing. The purpose of the pre-vibration
exposure is again aging, while that of the post-vibrationexposure is to demonstrate that the test item can remain func-
Other Questions and Problems tional under postulated abnormal plant operating conditionsoccurring after a "worst case" seismic event.
It is important to mention the current revision efforts of The sequence and type of environmental tests per-the IEEE 344 Committee, as a way of outlining some of the fr e un e d lpe vieswmel thth theother questions and problems that are evident. Generally, formed under DOD philosophies varies widely with both thethese deal with both analytical and testing areas of intended use and location of the test item; i.e., sheltered orqualification. non-sheltered equipment, location within an aircraft, missile,
ground vehicle, etc., and whether the equipment is classifiedas mechanical, electrical, armament, etc. In contrast, environ-There are several aspects of basic accuracy in enveloping mental tests for nuclear service have a fixed sequence regard-
an RRS with a TRS. The matter of margin deals with how less of the intended location of the test item; the testmuch conservatism is inherent in an RRS even before a TRS parameters are, however, a function of test item location andiare specific as to both a given plant and location within thatdamping values more uniform. Tolerances associated with plant.enveloping are also being considered because these have avery pronounced effect on the costs of teats. The variety and sequence of environmental tests generally
to be performed for DOD and nuclear service are shown inAdequacy of simulated earthquake waveforms is of con- Figure 20. The DOD tests include a group of temperature andcern. In both analysis by time history and in testing someform of earthquake representation is generated; there needsto be more evaluation of the potential methods of generatingthe appropriate time histories. Associated with this is the ad- ROD NUCLEARdition of motion from other dynamic sources (i.e., valveclosure, etc.). How can these additional effects be properly PRE VIBRATION TESTSadded to those of an earthquake? tOW PRESSURE (ALTITUDEl THERMAL AGING
HIGH TEMPERATURE TEMPERATURE OPERATIONAL AGOGSpectrum intensity or damage severity is a very im- TEMPERATURE SIOCK PRESSURE RADIATIO. AGEGportant concept. It is especially necessary to allow compar- TEMPERATUR.ALTITUDEison of the effects of one type of test (or assumed analyticalload) with that of another. It is especially important for SMA RADIATION ISUNSHINEISQRT efforts in evaluating prior qualification of operating RAIDTV
HUMIDITYplants. This also leads to the question of in-situ testing. FUNGUS WEATHERINGSALT FOG
Generic and type testing procedures need to be clarified DUST (FINE &AND)more in detail. In particular, how effective is combined testand analysis for qualifying a series of valves of different sizes? EXPLOSIVE ATMOSPHERE
LEAKAGE IIMMERSION EXTREMEACCELERATION J ENVIRONMENT
Several areas of qualification by analysis are being con-sidered for revision. As an exmaple, should some form of VISATION TESTSpartial experimental verification be included in all analyses?Is this appropriate for qualification of multiple cabinet POST VIBRATION TS STScombinations?
ACOUSTICAL NOISE ENVIRONMENTAL EXTREMES:Various questions remain with regard to line-mounted SHOCK MILD ENVIRONMENTTEMPERATURE-HUMIDITT-ALTTUDE SEVERE ENVIRONMENT- LOCAequipment. Should torsional effects of valves on attached GUNFIRE VIBRATION MAIN STEAM LINE OREAK
pipes be included? Are narrow band random motion testsmore representative than the large amplitude sine sweep tests Fig. 20 - Comparison of Interactive environmental tests for DOD andnow in use? nuclear related component qualification tea's
46
pressure extremes, a group which can be said to be related to iterative procedures in addition to the FFT and inverse trans-weathering or outdoor environments, and a group of other form algorithms employed in linear control systems. Therespecialized conditions; all of these precede the group of tests are several digital control system techniques now developedcharacterizing dynamic environments. The nuclear environ- for shock spectrum enveloping. [26]mental tests are intended to produce long term aging charac-teristic of a 40-year service life and primarily in controlled Vibration test levels representative of operational DODindoor environments. Extreme condition testing is then con- environments are often now specified in terms of an accelera-ducted after the dynamic testing to simulate abnormal oper- tion power spectrum (recall that the PSD spectrum is theating conditions in the plant. time average rms acceleration levels taken from stationary
random response time histories). The response spectrum forearthquake simulation, on the other hand, is the peak re-
Frequency Range sponse of a series of single degree-of-freedom oscillators to anonstationary random time history input. During the strong
Vibration testing typical of DOD requirements involves portion of an earthquake event, a duration of approximatelyfrequency ranges representative of the environment produced 15 seconds, the time history is for the most part stationary.by vehicles such as fixed and rotary wing aircraft, ground Using these facts, trends are underway in the nuclear industryvehicles, and ships. The frequency ranges to be used in vibra- to employ a mapping between the two spectrum representa-tion testing are specified in a few standards (MIL-STD 810C, tions. [27] This would allow methods for correcting anMIL-STD 167, Ships) and are of the order 10-103 Hz. elevated spectrum for known levels of overtest and combin-
ing response spectrum on an energy basis. The nuclear in-On the other hand, nuclear related vibration testing is dustry is historically response spectrum oriented; however,
relatively more complex because the frequencies depend there are studies in progress to supplement the specificationsheavily not only on the seismic event itself (1-35 Hz), but with corresponding strong motion PSD spectra.on the attenuation or amplification of the dynamic environ-ment provided by the response of the building structure in It is rather interesting to consider where in the DOD andwhich the equipment is located. Other dynamic events, such aerospace areas the power/response spectrum specificationas the activation of steam relief valves, response of pipelines would be appropriate as well. One might consider those por-to internal flow conditions, etc., may therefore extend the tions of a maneuver spectrum where a nonstationary vibra-frequency range of interest up to the order of 102 Hz. There tion response would occur, for example, during a transitionare no general standards available to provide guidance in from one maneuver to another or during deployment ofnuclear qualification testing, and therefore test conditions weaponry from a flight vehicle. The importance of suchare defined by the many different A/E firms responsible for considerations stems from the fact that in a PSD spectrumplant design. There are very wide differences resulting from the expected peak acceleration to overall rms level is usuallysite specific considerations and even from differences in about 3.0 while values on the order of 5 to 7 can actually beengineering judgment as to what constitutes conservatism, experienced in a nonstationary input such as in the earth-After-the-fact evaluation and judgment as to the adequacy of quake event.the testing procedures greatly aggravates the cost of com-ponent qualification.
ACKNOWLEDGMENTSEqualization and Control in Dynamic Testing I wish to express my gratitude to my colleagues R. L.
Probably the oldest vibration test procedure adopted Bessey, J. C. Simonis, and J. F. Unruh for several interestingeither by the DOD or the nuclear industry is the sinusoidal discussions, and especially to D. D. Kana on whose work this
test. While this general test method is quite useful for deter- paper is mostly based.
mining system characteristics such as resonant frequenciesand damping, its use as a generic qualification procedure islimited and often unsatisfactory because it generally results REFERENCESin highly overdesigned equipment. A similar generic test
* developed specifically for the nuclear industry is called the 1. Pusey, H. C., "Shock and Vibration - An EssentialRIM (Required Input Motion) test. This test specifies a dwell Technology," National Defense, Sept.-Oct. 1975,(or beat) at the equipment resonant frequency at a base g pp. 124-126.level equal to the maximum expected peak in the earthquaketransient, i.e., a dwell at the ZPA level, Unfortunately, even 2. Environmental Test Methods, MIL-STD-810C, Depart-for the lightest weight equipment, this test is so demanding ment of Defense, Washington, D.C.of the test facilities that it is rarely attempted.
3. Reliability Design Qualification and Production Accep-An alternative form of dynamic testing involves the ap- tance Tests: Exponential Distribution, MIL-STD-781C,
plication of a specified transient (shock) or continuous Department of Defense, Washington, D.C., 21 Octoberrandom waveform time histories (PSD) to linear systems. 1977.There are stand-alone digital based equalization and controlsystems readily available that can reproduce these inputs on 4. Storey, B. M., Kana, D. D., and Cox, P. A., "Evaluationelectromagnetic exciters which are linear with respect to ac- Program of the Vibration Environment of Armamentceleration control. On the other hand, electrohydraulic actu- Systems Externally Mounted to Army Helicopters,"ators which are nonlinear with respect to acceleration control Rpt. No. RT-TR-69-34, U.S. Army Missile Command,(linear with respect to displacement control) often require Redstone Arsenal, Alabama, December 1969.
47
i 1

5. Crosewhite, B. L., Kana, D. D., and Cox, P. A., "Vibra- Stations," 1974, Institute of Electrical and Electronicstion Testing of the LANCE Missile System-Part I, Engineers.Engineering Development and Contractor QualificationTests," Project No. DA-1X222251D231, U.S. Army 16. "IEEE Recommended Practices for Seismic Qualifica-Missile Command, Redstone Arsenal, Alabama, tion of Class 1E Equipment for Nuclear Power Generat-November 1972. ing Stations," Standard 344-1975, The Institute of
Electrical and Electronics Engineers, Inc., New York,6. Crosswhite, B. L., Kana, D. D., Cox, P. A., and Scruggs, January 31, 1975.
M. S., "Vibration Testing of the LANCE Missile System-Part I, Engineering Tests/Service Tests," P-.ject No. 17. U.S. NRC Regulatory Guide 1.100, "Seismic Qualifica-DA-1X222251D231, U.S. Army Missil, c:(-nmand, tion of Electrical Equipment for Nuclear Power Plants,"Redstone Arsenal, Alabama, August 19'1. Revision 1, August 1977.
7. Kana, D. D., and Scheidt, D. C., "Fatigue Damage 18. "Draft American Standard, IEEE Trial Use Guide forEquivalence of Field and Simulated Vibrational Environ- Type Test of Class 1E Electric Valve Operations forments," Final Report, Contract No. DAAD05-74-C-0729, Nuclear Power Generating Stations," Standard IEEESouthwest Research Institute, San Antonio, Texas, 382, Draft 3, Rev. 6, The Institute of Electrical andNovember 1974. Electronics Engineers, New York, November 1978.
8. Kana, D. D., Huzar, S., and Bessey, R. L., "Simulation 19. Skreiner, K. M., and Test, L. D., "A Review of Seismicof the Vibrational Environment Affecting Reliability of Qualification Standards for Electrical Equipment,"Avionics Equipment Onboard U.S. Army Helicopters," Journal of Environmental Sciences, May/June 1975,Final Report, Contract No. DAADO5-70-G-0271, pp. 13-17.Southwest Research Institute, San Antonio, Texas,1 May 1971. 20. Skreiner, K. M., Fitzgerald, E. M., and Test, L. D.,
"Seismic Qualification of Class 1E Equipment Today,"9. Edgington, F.M., "Development of a Simultaneous Journal of Environmental Sciences, January/February
Three-Axis Vibration System," TECOM Project 1978, pp. 19-23.7-CO-RD5-WS1-081, U.S.A. White Sands Missile Range,New Mexico, December 1976. 21. Bessey, R. L., and. Kana, D. D., "Some Research Needs
for Improved Seismic Qualification Tests of Electrical10. Kana, D. D., "A Comparison of Reliability Tests for and Mechanical Equipment," Paper JP/2, Structural
Avionics Equipment Onboard U.S. Army Helicopters," Mechanics in Reactor Technology Conference - IV,Final Report, Contract No. DAAD05-72-C-0228, South- San Francisco, California, August 1977.west Research Institute, San Antonio, Texas, April 1975.
22. Kana, D. D., "Seismic Qualification Tests of Nuclear11. Kana, D. D., and Dunn, B. H., "A Comparison of Plant Components - Damage Severity Factor Concept,"
Field and Laboratory Reliability Tests for Helicopter Nuclear Engineering and Design, 59, pp. 155-170, 1980.Radio Equipment," Final Report, Contract No.DAAD05-76-C-0769, Southwest Research Institute, 23. Singh, M. P., and Chu, S. L., "Stochastic ConsiderationsSan Antonio, Texas, June 1977. in Seismic Analysis of Structures," Earthquake Eni-
neering and Structural Dynamics, Vol. 4 (1976), pp.12. Hadjian, A. H., Jan, H. W., and Linderman, R. B., "The 295-307.
Seismic Environment for Nuclear Power Plant Com-ponents - An Interface Problem," ASME Paper No. 24. Earthquake Engineering, edited by R. L. Wiegel, Ch. 4,75-DE-53, American Society of Mechanical Engineers, Prentice-Hall Inc., New Jersey, 1970.New York.
25. Kana, D. D., "Consideration of a Unified Single-Param-13. U.S. NRC Standard Review Plan, Section 3.9.2, eter Measure of Fragility," Proceedings of Seminar on
"Dynamic Testing and Analysis of Mechanical Systems Extreme Load Design of Nuclear Power Plant Faciities,and Components," U.S. NRC NUREG 75/087, Nov- Berlin, Vol. I, pp. 117-120, August 1979.ember 24, 1975.
26. Unruh, J. F., "Digital Control of a Shaker to a Specified14. U.S. NRC Standard Review Plan, Section 3.10, "Seismic Shock Spectrum," 52nd Shock and Vibration Sympo-
Qualification of Category I Instrumentation and Elec- sium, New Orleans, October 27-29, 1981.trical Equipment," Revision 1, U.S. NRC NUREG75/087. 27. Unruh, J. F., and Kana, D. D., "An Iterative Procedure
for the Generation of Consistent Power/Response15. IEEE Std. 323-1974, "IEEE Standard for Qualifying Spectra," Nuclear Engineering and Design, 66, 1981
Class 1E Equipment for Nuclear Power Generating (in press).
48
4
REQUIRED DEVELOPMENTS IN STRUCTURAL DYNAMICS
Ben K. WadsJet Propulsion Laboratory
Pasadena, California
INTRODUCTION
First, you have to understand my background so when I we can take advantage of those to develop new areas ofcover the topics that require developments in structural dy- structural dynamics which would be contributory.namics, you know from what viewpoint I am approaching it.
The other thing that I noticed was that, generally, manyI developed much of the information from my associa- of the developments were conceived by theoreticians. The
tion with NASA for the past 20 years; I spent the last 15 programmers develop programs, the experimentalists developyears participating in discussions on structural dynamics needs experimental techniques, and the educators instruct students.of NASA. About four or five years ago, NASA Headquarters When completed, they have looked at it from their ownformed a team comprised of various members from the perspective, and not from the engineer's point of view.NASA Centers, and we visited many organizations in an Frequently the engineers are forced to use the products thatattempt to find out what industry felt were some of the these individuals developed. Today the developments are sopressing needs in the area of structural dynamics. We visited expensive, like the development of the NASTRAN program,a representative number of military aircraft, commercial for example, that it is very difficult to start over or totransport aircraft, helicopter, and aircraft engine organiza- reformat the resulting product. It is becoming very expensive,tions. We obtained a broad perspective of the needs from not only from the point of view of the total dollars spent,industry, but also from the length of time it requires to develop some
of these tools. We estimate anywhere from one hundred toAs expected, each particular type of industry had certain five hundred million dollars per year being spent on structural
unique requirements. However, rather than to cover the dynamics at the current time. Many commercial firms whounique requirements and needs of the various industries, I sell computer time estimate anywhere from 30%-50% of theirdecided to cover subjects which would interest the broad total revenues come from structural dynamics or structures-majority of the people here, not specific interests to indi. type analyses, so a lot of money is involved. Also, the soft-vidual companies. I will talk about what I feel are some of ware is frequently fixed, again, because of the tremendousthe current and future needs of the vast engineering com- investment. There are many organizations, including JPL,munity from an engineering point of view. that are not in a position to maintain their own software
programs because of the expense. So, we rely on commercialIn order to project the future requirements, I tried to firms which have a wide base of users to help support the
determine what some of the key developments were in the maintenance of some of these programs; this is a trendstructural dynamics area in the past 15 to 20 years which toward better control of their tools.
* significantly affected the engineers. There were only abouttwo, three or possibly four areas where I feel significant Many companies indicated difficulty in obtaining cor-developments have occurred, and where the engineers can use rect solutions. An engineer must have a good idea of the finitethe output by-products. They were really determined, not by element method, to be able to take a blueprint and properlynew developments in the area of applied mechanics, but by model, to eliminate numerical round-off and convergencedevelopments in other fields which allow the use of some of errors. Many companies are finding that they have a very dif-the information we already had. ficult time finding people whose answers they would believe.
In fact, many companies said, "Yeah, we have one or twoIlon At the risk of contradiction I will name those two or guys that we trust to get the right answers." They might have
three developments; and again, this is strictly my opinion. 12 others who are just developing numbers, but that is under-One was the finite element method which came out 20 years standable. We have structural dynamicists who know aboutago, and it was linked to the development of computers D-map statements and the like, but they have very littlewhich aided the engineers. Another development which feeling for what a structure is.might fall in that category is the model component synthesis.With the development of computers you suddenly had a In the future, the feeling is that getting correct answersmassive number of modes which had to be truncated in order will be one of the key items. In fact, if you look at one of theto obtain solutions in a reasonable time. I think the third ars new requirements, nonlinear analysis will be very significant,is in the ares of testing using the Fast Fourier Transform the reason being they are beginning to push the technologypackages which allow you to extract the mode shapes and the areas and the structures are beginning to interact more withnatural frequencies from test data. I am trying to project the their environment. Consequently, many more nonlinearfuture developments that might exist in other fields, and how influences tend to be significant. This is not a situation where
49
0 = -
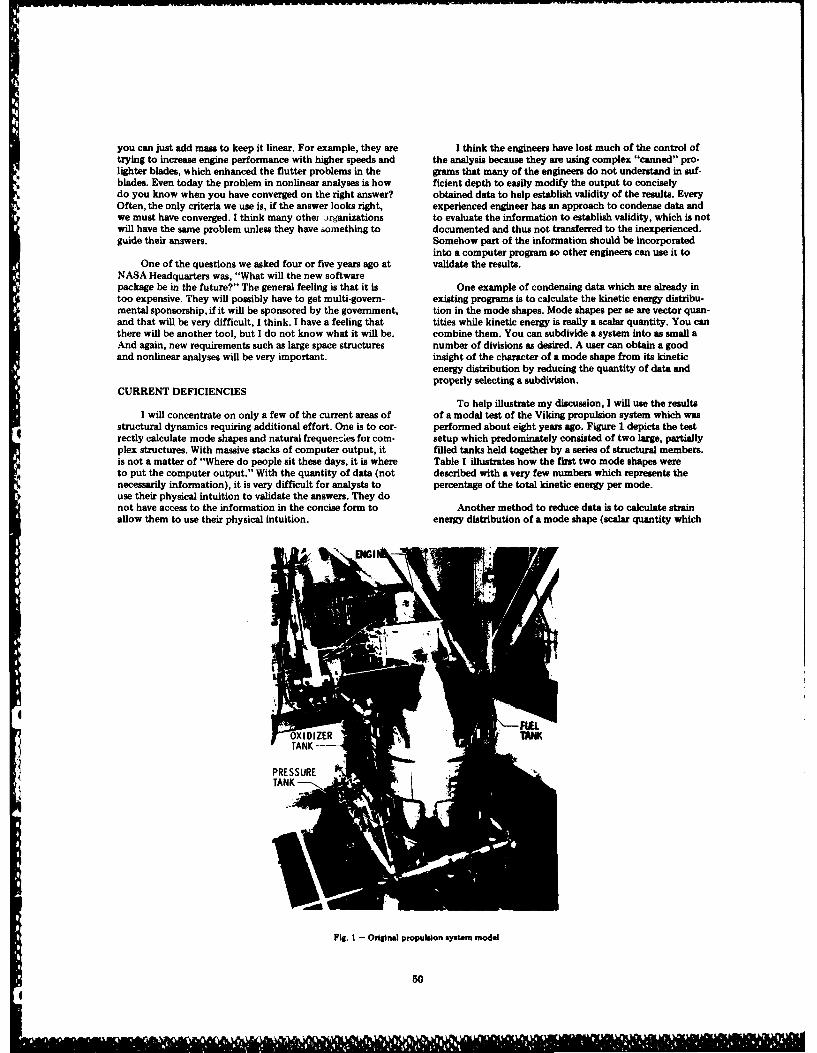
you can just add mass to keep it linear. For example, they are I think the engineers have lost much of the control oftrying to increase engine performance with higher speeds and the analysis because they are using complex "canned" pro-lighter blades, which enhanced the flutter problems in the grams that many of the engineers do not understand in suf-blades. Even today the problem in nonlinear analyses is how ficient depth to easily modify the output to conciselydo you know when you have converged on the right answer? obtained data to help establish validity of the results. EveryOften, the only criteria we use is, if the answer looks right, experienced engineer has an approach to condense data andwe must have converged. I think many othei organizations to evaluate the information to establish validity, which is notwill have the same problem unless they have something to documented and thus not transferred to the inexperienced.guide their answers. Somehow part of the information should be incorporated
into a computer program so other engineers can use it toOne of the questions we asked four or five years ago at validate the results.
NASA Headquarters was, "What will the new softwarepackage be in the future?" The general feeling is that it is One example of condensing data which are already intoo expensive. They will possibly have to get multi-govern- existing programs is to calculate the kinetic energy distribu-mental sponsorship, if it will be sponsored by the government, tion in the mode shapes. Mode shapes per se are vector quan-and that will be very difficult, I think. I have a feeling that tities while kinetic energy is really a scalar quantity. You canthere will be another tool, but I do not know what it will be. combine them. You can subdivide a system into as small aAnd again, new requirements such as large space structures number of divisions as desired. A user can obtain a goodand nonlinear analyses will be very important. insight of the character of a mode shape from its kinetic
energy distribution by reducing the quantity of data andproperly selecting a subdivision.
CURRENT DEFICIENCIESTo help illustrate my discussion, I will use the results
I will concentrate on only a few of the current areas of of a modal test of the Viking propulsion system which wasstructural dynamics requiring additional effort. One is to cor- performed about eight years ago. Figure 1 depicts the testrectly calculate mode shapes and natural frequencies for com- setup which predominately consisted of two large, partiallyplex structures. With massive stacks of computer output, it filled tanks held together by a series of structural members.is not a matter of "Where do people sit these days, it is where Table I illustrates how the first two mode shapes wereto put the computer output." With the quantity of data (not described with a very few numbers which represents thenecessarily information), it is very difficult for analysts to percentage of the total kinetic energy per mode.use their physical intuition to validate the answers. They donot have access to the information in the concise form to Another method to reduce data is to calculate strainallow them to use their physical intuition. energy distribution of a mode shape (scalar quantity which
PRESSURETANK
Fig. I - Original propulsion system model
50
.. 4
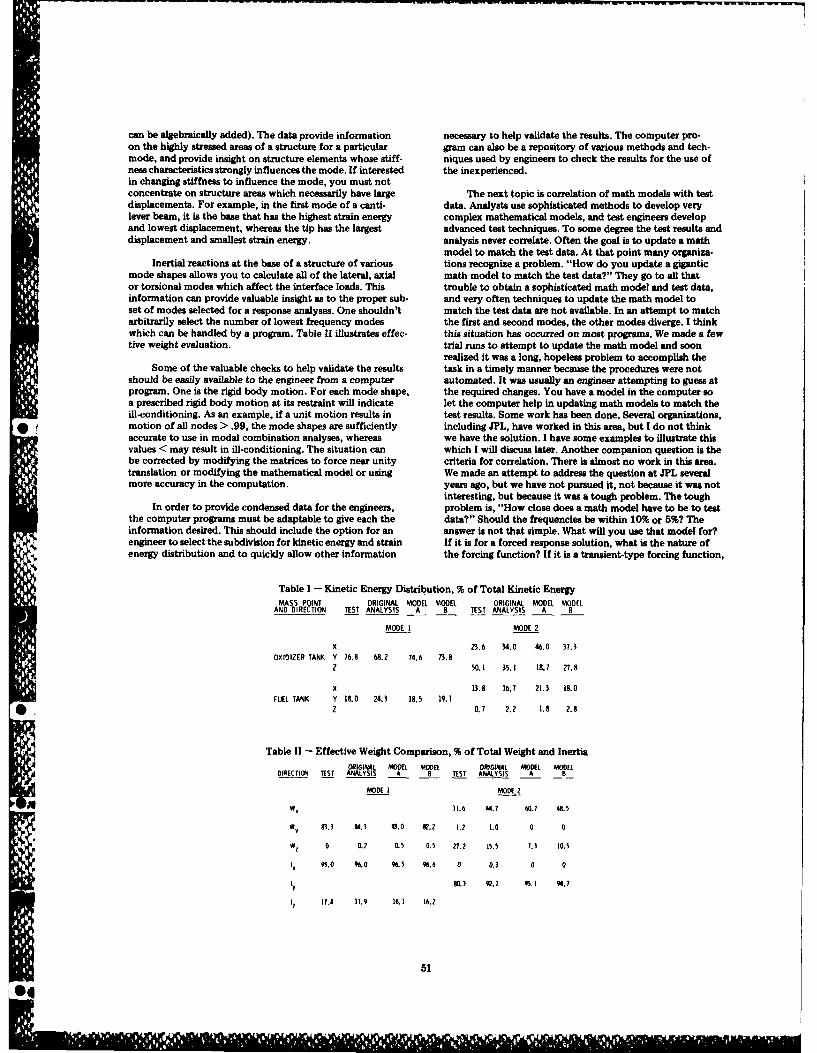
can be algebraically added). The data provide information necessary to help validate the results. The computer pro-on the highly stressed areas of a structure for a particular gram can also be a repository of various methods and tech-mode, and provide insight on structure elements whose stiff- niques used by engineers to check the results for the use ofness characteristics strongly influences the mode. If interested the inexperienced.in changing stiffness to influence the mode, you must notconcentrate on structure areas which necessarily have large The next topic is correlation of math models with testdisplacements. For example, in the first mode of a canti- data. Analysts use sophisticated methods to develop verylever beam, it is the base that has the highest strain energy complex mathematical models, and test engineers developand lowest displacement, whereas the tip has the largest advanced test techniques. To some degree the test results anddisplacement and smallest strain energy. analysis never correlate. Often the goal is to update a math
model to match the test data. At that point many organiza-Inertial reactions at the base of a structure of various tions recognize a problem. "How do you update a gigantic
mode shapes allows you to calculate all of the lateral, axial math model to match the test data?" They go to all thator torsional modes which affect the interface loads. This trouble to obtain a sophisticated math model and test data,information can provide valuable insight as to the proper sub- and very often techniques to update the math model toset of modes selected for a response analyses. One shouldn't match the test data are not available. In an attempt to matcharbitrarily select the number of lowest frequency modes the first and second modes, the other modes diverge. I thinkwhich can be handled by a program. Table 1I illustrates effec- this situation has occurred on most programs. We made a fewtive weight evaluation, trial runs to attempt to update the math model and soon
realized it was a long, hopeless problem to accomplish theSome of the valuable checks to help validate the results task in a timely manner because the procedures were not
should be easily available to the engineer from a computer automated. It was usually an engineer attempting to guess atprogram. One is the rigid body motion. For each mode shape, the required changes. You have a model in the computer soa prescribed rigid body motion at its restraint will indicate let the computer help in updating math models to match theill-conditioning. As an example, if a unit motion results in test results. Some work has been done. Several organizations,motion of all nodes > .99, the mode shapes are sufficiently including JPL, have worked in this area, but I do not thinkaccurate to use in modal combination analyses, whereas we have the solution. I have some examples to illustrate thisvalues < may result in ill-conditioning. The situation can which I will discuss later. Another companion question is thebe corrected by modifying the matrices to force near unity criteria for correlation. There is almost no work in this area.translation or modifying the mathematical model or using We made an attempt to address the question at JPL severalmore accuracy in the computation. years ago, but we have not pursued it, not because it was not
interesting, but because it was a tough problem. The toughIn order to provide condensed data for the engineers, problem is, "How close does a math model have to be to test
the computer programs must be adaptable to give each the data?" Should the frequencies be within 10% or 5%? Theinformation desired. This should include the option for an answer is not that simple. What will you use that model for?engineer to select the subdivision for kinetic energy and strain If it is for a forced response solution, what is the nature ofenergy distribution and to quickly allow other information the forcing function? If it is a transient-type forcing function,
Table I - Kinetic Energy Distribution, % of Total Kinetic EnergyMASS POINT ORIGINAL MODEL MODEL ORIGINAL MODEL MODEL
AND DIRECTION TEST ANALYSIS A B TEST ANALYSIS A B
MODE 1 MODE 2
X 23.6 34.0 46.0 37.3OXIDIZER TANK Y 76.8 68.2 74.6 73.8
Z 50.1 35.1 18.7 27.8
X 13.8 16.7 21.3 18.0
FUEL TANK Y 18.0 24.3 18.5 19.1Z , 0.7 2.2 1.8 2.8
Table II - Effective Weight Comparison, % of Total Weight and InertiaORIGINAL 6O80L MOOEL ORIGINAL MODEL MODEL
DIRECTION TEST ANALYSIS A 8 lTEST ANALYSIS A B
MODE I MODE 2
W, 31.6 44.7 60.7 48.5
WV 3.3 4.3 83.0 8.2 1.2 1.0 0 0
W, 0 0.2 0.5 0.5 27.2 15.5 7.3 10.5
1, "5.0 0 98.5 96.6 0 0.3 0 0
ly OD.3 92.1 95.) 9 .7
17 17.4 11.9 16.1 16.2
51
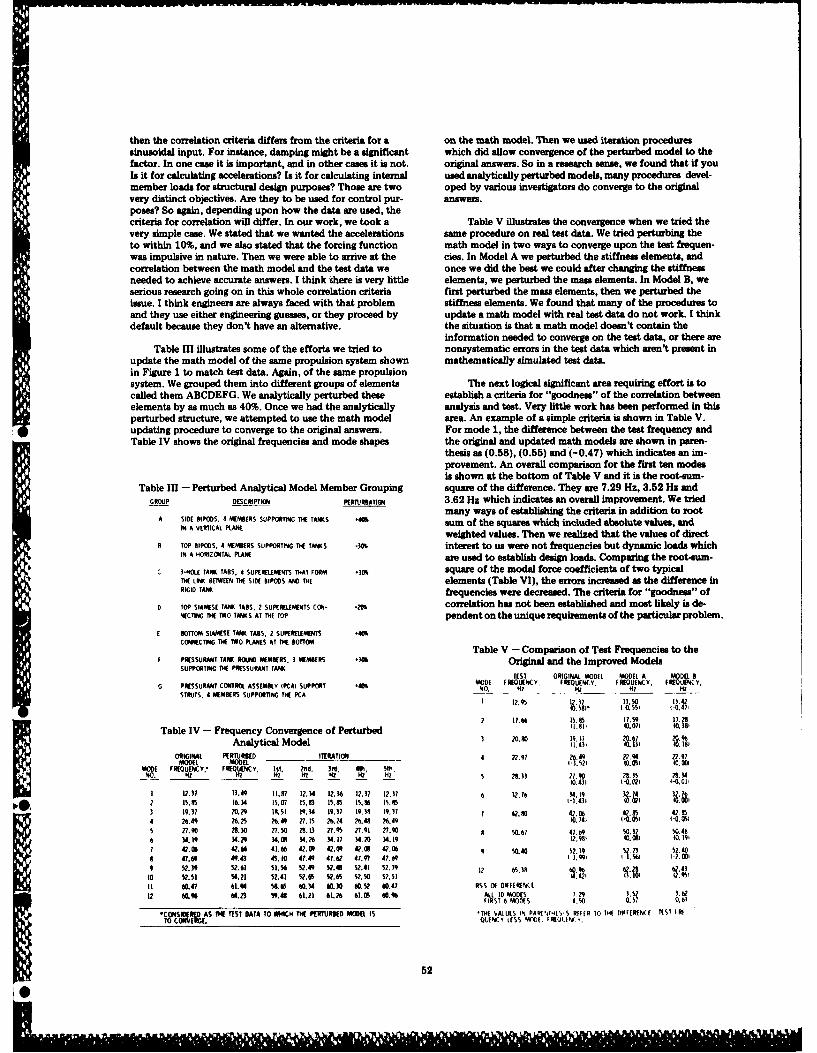
then the correlation criteria differs from the criteria for a on the math model. Then we used iteration proceduressinusoidal input. For instance, damping might be a significant which did allow convergence of the perturbed model to thefactor. In one case it is important, and in other cases it is not. original answers. So in a research sense, we found that if youIs it for calculating accelerations? Is it for calculating internal used analytically perturbed models, many procedures devel-member loads for structural design purposes? Those are two oped by various investigators do converge to the originalvery distinct objectives. Are they to be used for control pur- answers.poses? So again, depending upon how the data are used, thecriteria for correlation will differ. In our work, we took a Table V illustrates the convergence when we tried thevery simple case. We stated that we wanted the accelerations same procedure on real test data. We tried perturbing theto within 10%, and we also stated that the forcing function math model in two ways to converge upon the test frequen-was impulsive in nature. Then we were able to arrive at the cies. In Model A we perturbed the stiffness elements, andcorrelation between the math model and the test data we once we did the best we could after changing the stiffnessneeded to achieve accurate answers. I think there is very little elements, we perturbed the mass elements. In Model B, weserious research going on in this whole correlation criteria first perturbed the mass elements, then we perturbed theissue. I think engineers are always faced with that problem stiffness elements. We found that many of the procedures toand they use either engineering guesses, or they proceed by update a math model with real test data do not work. I thinkdefault because they don't have an alternative, the situation is that a math model doesn't contain the
information needed to converge on the test data, or there areTable III illustrates some of the efforts we tried to nonsystematic errors in the test data which aren't present in
update the math model of the same propulsion system shown mathematically simulated test data.in Figure I to match test data. Again, of the same propulsionsystem. We grouped them into different groups of elements The next logical significant area requiring effort is tocalled them ABCDEFG. We analytically perturbed these establish a criteria for "goodness" of the correlation betweenelements by as much as 40%. Once we had the analytically analysis and test. Very little work has been performed in thisperturbed structure, we attempted to use the math model area. An example of a simple criteria is shown in Table V.updating procedure to converge to the original answers. For mode 1, the difference between the test frequency andTable IV shows the original frequencies and mode shapes the original and updated math models are shown in paren-
thesis as (0.58), (0.55) and (-0.47) which indicates an im-provement. An overall comparison for the first ten modesis shown at the bottom of Table V and it is the root-sum-
Table III - Perturbed Analytical Model Member Grouping square of the difference. They are 7.29 Hz, 3.52 Hz andGROUP DESCRIPTION PERURRATION 3.62 Hz which indicates an overall improvement. We tried
many ways of establishing the criteria in addition to rootA SIDE B PLNOS. 4 OERS SUPPORnG TIe TANKS '4 sum of the squares which included absolute values, and
weighted values. Then we realized that the values of directa TOP IPOS. 4 MEMBERS SUPPORTING TIE TAWS -309 interest to us were not frequencies but dynamic loads which
IN A HORIZONTAL PLANE are used to establish design loads. Comparing the root-urn-
C 3-HOLE TANK TABS. 4 SUPERELEMENTS THAT FORM -301 square of the modal force coefficients of two typicalTHE LIE BETWEEN THE SIDE BIPODS AND THE elements (Table VI), the errors increased as the difference inRIGID TANK frequencies were decreased. The criteria for "goodness" of
D TOP SIAMSE TAW TABS SUPENEGLENTS CON- -2 correlation has not been established and most likely is de-; CTING THE TWO TAWS AT TE TOP pendent on the unique requirements of the particular problem.
I BOTTOM SIAMESE TANK TABS, 2 SUPE ELEMENTS *4%
CONECTING TIE TWO PLANES AT TIE BOTTOMTable V - Comparison of Test Frequencies to the
PUESSURANT TAWT ROUHNDEERs. 3 MERS M301 Original and the Improved ModelsSUPPORTING THE PRESSURANT TAWT
TEST ORIGINAL MODEL MODEL A MODEL BMODE FREQUENCY. FREQUENCY FREQUENCY. I 4SUENC Y,0 PRESSURANT CI)RTRTEi ASEA6BI.Y IPCA) SUPPORT *410 NO, Hr H ' Hz HZ
STRUTS. 4 MEMBERS SUPPORTING THE PCA ---- ___
I 12.95 12.17 13.50 13.4210.58)" 0.551 (-0.47'
2 11.0 15 II 1 .5"9 17Table IV - Frequency Convergence of Perturbed II1, I.0, 1.1,
Analytical Model 4 . D8, 181LORIGINAL PERETR5ED ITERATION 4 7.97 26.4 2.4 22.97
MMODEL ODEL 1-3.,21 (0.011 10. 001MOD[ FREQUENCY," F ENCY. lol. 2nid, 3§V, ft. WI.
l z Hz RZ Hz I Hz 5 28.0 ?7.90 n2. )5 8. 34- 0.431 (-0. 0 , 4'0.01,
1 12.37 13.49 11.87 12.34 12.36 12.37 12.37 A 32.76 M.19 3.14 )2.762 15.85 i6.4 15.07 15.19 15.85 15.9, 15.95 (-1.431 I .0I 10.00,3 19.37 20.29 19.51 19.34 19.37 19.18 19.31 7 42.80 ,42, 06 42.85 12.95
6 34.19 34.29 )4.0 34.26 M4. 17 4.20 34.19 02.981 (0. 09, 10.19,
8 0.0 49.6 4 5 . 0 4T.40 47.,? 41.99 47.9 1 ).99 1q 'S6 2.00
52.39 52.61 51.56 52.08 52.48 S2.41 52.39 12 65.38 60% 62. 4310 W2.51 5.21 52.41 5.65 W.5 5.50 52.51 4.42,
11 6047 61.1 58.65 60.34 .40.30 60.3 80.47 RSS OF DIFFERENCE
2 A.96 64.23 ".4 61.21 61.26 61.05 60.% AL 1 MODES 4. 0.57 9.1fItSt 6 MODES 4.50 0.57 0.50
'R"TS( IAS TIM TEST DATA TO WHICH TI PERTURBED MODEl IS "THE VALUES i PA 0T-[S.- 5 R F1 TO Ill F DFRNCE TEST I 9QINCY LESS MOGII ,0Q01N( .
52

Table VI - Force Coefficients, Newtons
MODE NO.MEMBER
NO. TEST vs ANALYSIS 1 2 3 4 5 RSS
4 TEST -2527.5 343.0 -1183.7 -237.1 -194AORIGINAL ANALYSIS -2548.4 502.2 -1055,6 -491.5 -186A 327MODEL A -2977.8 768A -5355 -321.2 -437.1 932MODELS -2930.6 689.4 -896.8 -307.2 -324.9 622
3 TEST -297.1 -387.4 379A 402.6 327.ORIGINAL ANALYSIS -328.3 -488.0 323A 552.0 433.7 219MODEL A -303.7 -619.8 77.0 345.2 543.1 442MODEL 8 -332.0 -629.1 1871 354.5 486.5 352
For the lack of time, I will briefly touch upon other that will always be available. So in essence, we are going toareas. The next topic is modal synthesis. There are computer computer centers to buy our NASTRAN, ANSYS, and otherprograms, like NASTRAN, one can use for modal synthesis, programs because it is just too expensive for us to developOne of the problems is that in order to use the modal computing capability and maintain the software. What is thesynthesis technique, unlike the finite element method, engi- next NASTRAN? Nobody knows, but I think more sophis-neering judgement must be used, and it is very easy to make ticated tools will be required. The problems will be moreundetectable errors. The correct displacement functions must complex and there will be many more analysts attempting tobe selected; if you add erroneous displacement functions, solve these very complex problems. The lack of engineersthey may unduly constrain a structure which can't be easily today to obtain solutions to complex problems will bedetected. If you include dependent modes, the matrices enhanced in the future years.become singular; there are many engineering errors that canbe made that go undetected. I believe that very few engineers One of the future requirements will be much morehave sufficient insight to the analysis process to get good reliance on analysis than there is today. One reason is testingsolutions using modal synthesis. Many of the "learned" is extremely expensive and becoming more complex. Struc-process and check procedures should be incorporated as part tures that interact more with their environment will be moreof a computer program to document the experience, prominent in thp future because of the trend toward higher
pertormance or a high area to density ratio. NonlinearitiesAnother topic is the accuracy of the response calcula- will become more significant to the design resulting in test
tions. Difficulty exists in approximately calculating the least difficulties because of the difficulty in separating the causeupper bound of the loads within the structure subjected to and the effect. Large space structures will be anothera dynamic forcing function. This situation exists in attempt- problem because they cannot be tested on earth. Six yearsing to evaluate spacecraft loads from the launch vehicle (or ago JPL worked on a solar sail concept for propulsion. TheShuttle) as the dynamic characteristics of the spacecraft are concept was to build a 0.35 square mile 1/10 mil Kaptonmodified. sail and use the solar pressure for propulsion. One reason
the concept was eventually eliminated is that the dynamicAnother very important problem requiring work is the analysis performed without a system test was not adequate
"inverse" problem of determining the forcing function from to commit the solar mail for a mission. A system test couldn'tthe response data. Although the mathematics of the solution be performed on earth. Thus I foresee requirements forare not difficult and the "inverse" solution has been shown higher confidence analyses of large complex structures, testto be valid on mathematically simulated cases, the procedure verified subsystems which are mathematically integrated intohas not resulted in satisfactory answers using real flight or a larger structure, requirements that are insensitive totest data. I think the primary reason for failure is that the structural characteristics of the characteristics.frequencies and impedances of the math model did notadequately represent the real structure. I see a large number of problems and a number of dif-
ferent hardware and software tools available to the engineerfor solving them. The engineers will select the appropriate
FUTURE set of tools to solve a problem with the help of a controlactivity to increase efficiency and accuracy. Preliminary
At JPL we ask, "What are the trends?" We are looking efforts to evaluate the cost is under study at Duke Universityat this, and we are trying to determine where we should do to simulate the cost of parallel processing computation versusour research, and in what areas we should invest some of our serial processing computation for user defined problems.research funds. One trend is toward distributed computing. Other objectives are to establish the cost advantage of paallel
lop We feel computing is going toward the small mini computers processing and to evaluate the potential cost savings of nu-spreadthroughout various facilities, and the big central comn- merical algorithms developed specifically for parallel process-
puting facilities are beginning to disappear. One of the activ- ing. An example may be the introduction of the relaxationities at JPL is to develop a VLSI for finite element compute- method of solving a series of linear equations.tion in conjunction with parallel processing using our ownlarge integrated circuit design and fabrication facility. The We feel that artificial intelligence techniques, or someobjective is to increase the speed and accuracy for computa. way of feeding back information to provide solution gu".tion to prepare for the future needs. Again, the hardware ance to the engineers about their proposed solution tech.spreadve thogou in riuse facitispee and therac big ctaom-e wa lo r eeithm deek specifai call fotorle processol-ongud
costs are decresing, and software costs are increasing, both nique, or methods to help assure accuracy of the results,for its development a.d its raintenance. We cannot afford must be provided with the analyses tools to solve the moreto maintain NASTRAN; we need experienced programmers complex problems with a larger arsenal of solution tools.
53
We have helped develop a program by which an engineer want to knovr a prescribed value and properly put it into thecan interactively try different displacement functions to design, you wiU have a very difficult time predicting it. Yes,describe a finite element to help establish the impact of the it is important, uut I feel there is little that can be doneassumption, except to use good engineering judgment plus past experience
to guess at some of the numbers.In summary, I tried to cover briefly what I feel the cur-
rent problems are in structural dynamics from an engineer's Mr. Himelblau: Then why are we spending literally mil-point of view. Using history as a guide, major future contri- lions of dollars to develop computer codes to determinebutions in structural dynamics will be closely related to mode parameters, with one exception, and why don't we putdevelopments in allied fields. We must provide the engineers any research money into the one factor that we recognize iswith added tools and proper information with adequate one of the major deficiencies?feedback and flexibility to allow use of good engineeringjudgement and intuition. Engineering judgement will still be Mr. Wada: I don't give out the money, but when youvital to obtaining answers in the future, spend money, you are looking for the return on the invest-
ment. If I look at damping, the return of research is verysmall or zero.
DISCUSSIONMr. Himelblau: How large was the investment that you
Mr. Himelblau (Rockwell International Corp.): You gave for that return?mentioned two of the more serious problems that we currentlyface; one is the accuracy in response calculations and the Mr. Wada: It doesn't matter. If the return is zero, Isecond, as you call it, is the inverse problem of determining don't think you should invest any money, but that is aloads from response. But the real key is the lack of infor- personal feeling. There are specific special purpose dampers,mation on damping, and I think this has been an issue that and there are many organizations that provide them. But Ihas not been faced in the last 20 years or more with possibly think you are asking for research to predict modal damping,one exception. It appears to me on the basis of all of the and we tried it. We tested riveted and bolted joints, and wefuture trend prognostications that I've seen, including your found their damping was a function of manufacturing and aown, that that issue is still going to remain unfaced. I'd like function of amplitude. There are so many variables that weyour reaction. couldn't even determine a trend. If you plot damping versus
design, it is just like a big shotgun blast, and the general feel-Mr. Wada: I know how Harry feels. My feeling is that it ing was that it is so manufacturing-dependent that research
is very difficult to predict damping beforehand. You can do in that area just didn't seem to make any sense.all the analysis you want, but from everything I have seendamping is governed by factors such as joint slippage that Mr. Himelblau: So, you are saying that if we reallycan't be predicted. So, even if you did a million degrees of can't get a handle on it, we should just try to ignore it.freedom finite element analysis to predict damping you willnot get a better answer. I think it is the sort of situation Mr. Wada: No. No. No. You can't ignore it. You have towhere unless you actually build a damping device where you use your engineering judgement.
0.
0..
54
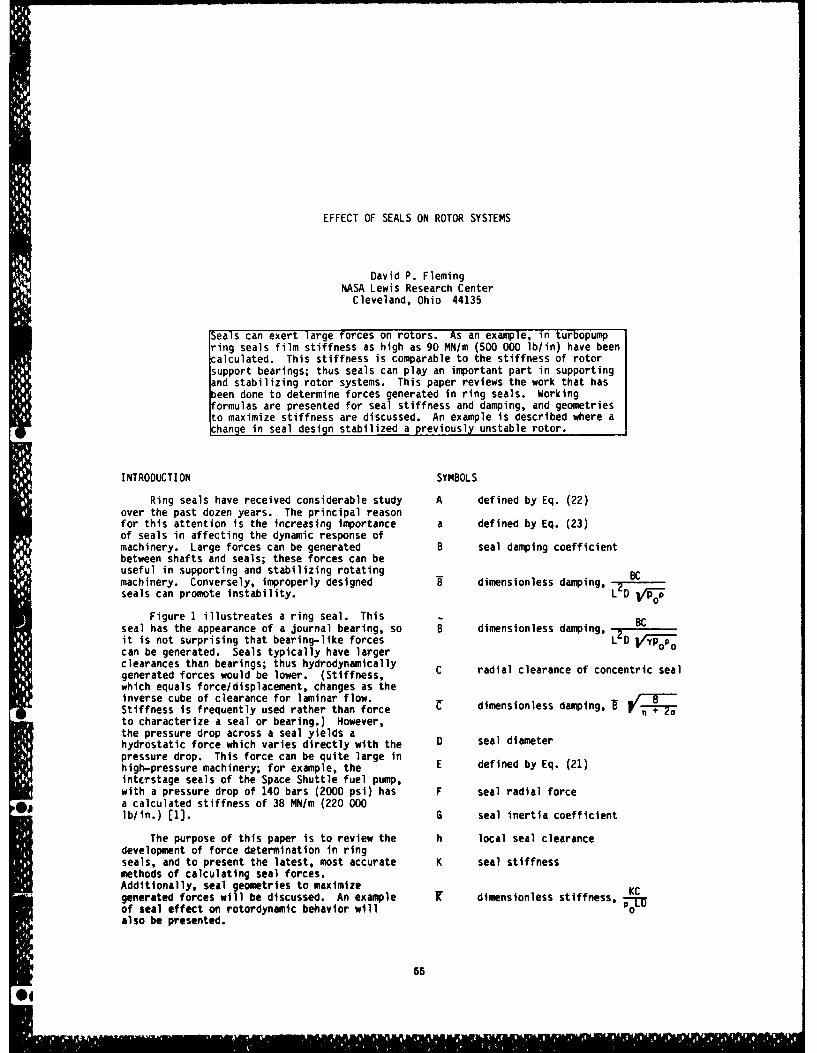
EFFECT OF SEALS ON ROTOR SYSTEMS
David P. FlemingNASA Lewis Research Center
Cleveland, Ohio 44135
Seals can exert large forces on rotors. As an example, in turbopumpring seals film stiffness as high as 90 MN/m (500 000 lb/in) have beencalculated. This stiffness is comparable to the stiffness of rotorsupport bearings; thus seals can play an important part in supportingand stabilizing rotor systems. This paper reviews the work that hasbeen done to determine forces generated in ring seals. Workingformulas are presented for seal stiffness and damping, and geometriesto maximize stiffness are discussed. An example is described where akhange in seal design stabilized a previously unstable rotor.
INTRODUCTION SYMBOLS
Ring seals have received considerable study A defined by Eq. (22)over the past dozen years. The principal reasonfor this attention is the increasing importance a defined by Eq. (23)of seals in affecting the dynamic response ofmachinery. Large forces can be generated B seal damping coefficientbetween shafts and seals; these forces can beuseful in supporting and stabilizing rotatingmachinery. Conversely, improperly designed B dimensionless damping, Zseals can promote instability. L D Vp-j-p
Figure 1 illustreates a ring seal. This BCseal has the appearance of a journal bearing, so B dimensionless damping, 2it is not surprising that bearing-like forces L D V/yppcan be generated. Seals typically have largerclearances than bearings; thus hydrodynamicallygenerated forces would be lower. (Stiffness, C radial clearance of concentric seal
which equals force/displacement, changes as theinverse cube of clearance for laminar flow. CeStiffness is frequently used rather than force dimensionless daming,to characterize a seal or bearing.) However,the pressure drop across a seal yields ahydrostatic force which varies directly with the D seal diameterpressure drop. This force can be quite large inhigh-pressure machinery; for example, the E defined by Eq. (21)intcrstage seals of the Space Shuttle fuel pump,with a pressure drop of 140 bars (2000 psi) has F seal radial forcea calculated stiffness of 38 MN/m (220 000lb/in.) []. G seal inertia coefficient
The purpose of this paper is to review the h local seal clearancedevelopment of force determination in ringseals, and to present the latest, most accurate K seal stiffnessmethods of calculating seal forces.Additionally, seal geometries to maximize KCgenerated forces will be discussed. An example [ dimensionless stiffness, -of seal effect on rotordynamic behavior will a-0also be presented.
55

L seal length 1. The sealed fluid is incompressible.
M leakage flow 2. Effects of rotation are neglected.
p pressure 3. Fluid flow is one-dimensional in theaxial direction, that is, any circumferential
q Rw/U flow is neglected.
R seal radius 4. The eccentricity is small compared withthe seal concentric clearance.
Re Reynolds number, 2CpU/v5. The fluid friction factor is constant
throughout the seal.ReI0 "sonic" Reynolds number, 2C V, P°POpUO 6. All flow is steady state.
u local fluid velocity 7. Entrance losses can be accounted for bya suitable choice of loss coefficient.
U u for centered seal8. There is no pressure recovery at the
V swirl velocity seal exit.The analysis begins with the continuity and
W swirl ratio V/Rw momentum equations. These are given in [2] andfor invariance with time are
x,y transverse coordinates du
z axial coordinate
seal taper half-angle 1 d 2 du-X + u(2)
y specific heat ratio - TT u
e eccentricity ratio e/c The boundary conditions are
n total entrance loss factor 1 + P = PO - npu22 at z -0 (3)
X friction factor
U fluid viscosity p = 0 at z - L (4)
entrance loss factor where n is the total entrance loss factor. Itis the sum of the pressure drop, pu /2, that
p fluid density occurs due to Bernoulli's principle, and thepressure drop due to the developing velocity
o dimensionless seal length AL/C profile in the fluid. The value of n is 1.65for laminar flow [3] and drops to near I for
angular velocity highly turbulent flow [4)
Subscripts: The solution to Eq. (1) is
0 upstream stagnation region u - constant (5)
1 seal entrance and to Eq. (2)
2 seal exit . .2p l p(z l 0) -z (6)
ANALYTICAL PRINCIPLESApplying the boundary conditions,In the earliest analyses numerous
simplifying assumptions were made. Later work ( , _Lremoved some of these assumptions. In order to po . pu2 + (7)aid in understanding how a high-pressure sealoperates, it is useful to go through the mostelementary analysis. For this analysis the list PO (L A . L(of assumptions is, of course, the longest and P o - z (8)reads
The total restoring force on the seal can be
found by integrating the restoring component ofpressure over the seal area
56
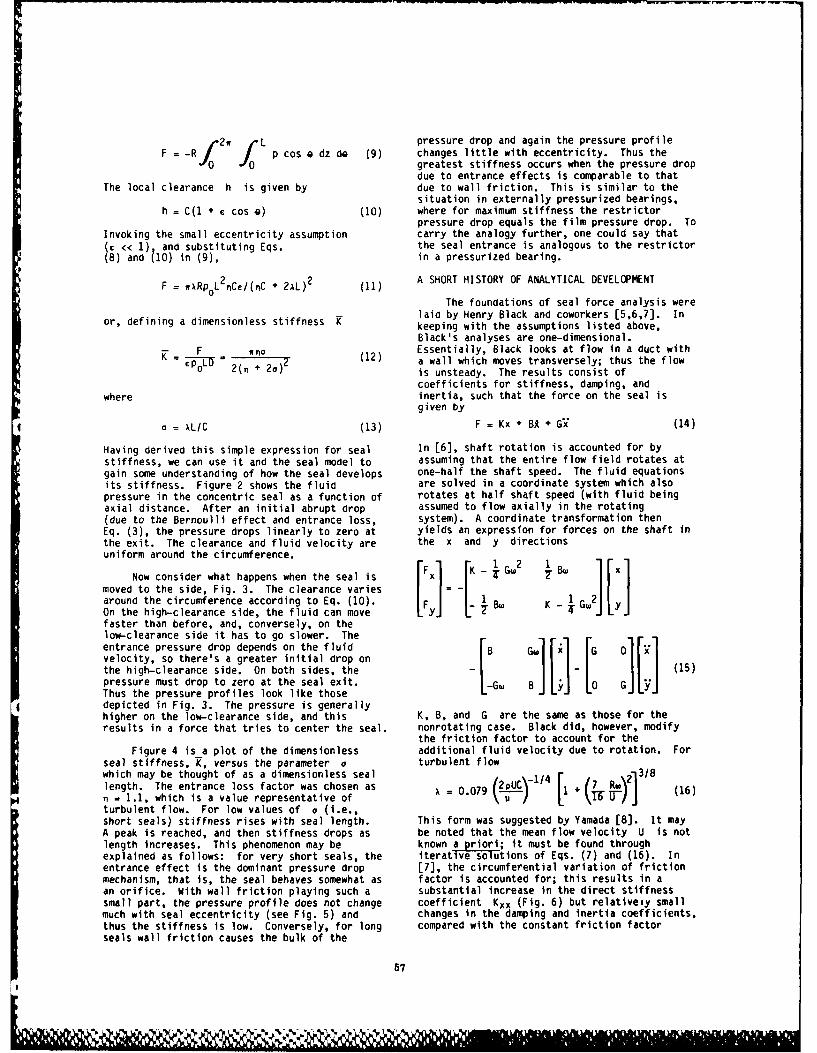
2 w f L pressure drop and again the pressure profileF = -R p cos a dz do (9) changes little with eccentricity. Thus the
JO greatest stiffness occurs when the pressure dropdue to entrance effects is comparable to that
The local clearance h is given by due to wall friction. This is similar to thesituation in externally pressurized bearings,
h = C(I + c cos a) (10) where for maximum stiffness the restrictorpressure drop equals the film pressure drop. To
Invoking the small eccentricity assumption carry the analogy further, one could say thatc << 1) and substituting Eqs. the seal entrance is analogous to the restrictor8) and 110) in (9), in a pressurized bearing.
F = wiRp0 L2 nCcI(nC + 2AL)
2 (11) A SHORT HISTORY OF ANALYTICAL DEVELOPMENT
The foundations of seal force analysis werelaio by Henry Black and coworkers [5,6,7]. In
or, defining a dimensionless stiffness keeping with the assumptions listed above,Black's analyses are one-dimensional.
K Ia F Essentially, Black looks at flow in a duct withna 2(12) a wall which moves transversely; thus the flow-- L 2(n + 2a) is unsteady. The results consist of
coefficients for stiffness, damping, andwhere inertia, such that the force on the seal is
given by
4 = xL/C (13) F = Kx + BA + Gl (14)
Having derived this simple expression for seal In [6], shaft rotation is accounted for bystiffness, we can use it and the seal model to assuming that the entire flow field rotates atgain some understanding of how the seal develops one-half the shaft speed. The fluid equationsits stiffness. Figure 2 shows the fluid are solved in a coordinate system which alsopressure in the concentric seal as a function of rotates at half shaft speed (with fluid beingaxial distance. After an initial abrupt drop assumed to flow axially in the rotating(due to the Bernoulli effect and entrance loss, system). A coordinate transformation thenEq. (3), the pressure drops linearly to zero at yields an expression for forces on the shaft inthe exit. The clearance and fluid velocity are the x and y directionsuniform around the circumference.
Now consider what happens when the seal is Fx [K - 2]lx
moved to the side, Fig. 3. The clearance varies = -around the circumference according to Eq. (10). F Bw K G.][On the high-clearance side, the fluid can move Y
faster than before, and, conversely, on thelow-clearance side it has to go slower. Theentrance pressure drop depends on the fluid~velocity, so there's a greater initial drop onthe high-clearance side. On both sides, the o n (15)
pressure must drop to zero at the seal exit. -G. GThus the pressure profiles look like those
depicted in Fig. 3. The pressure is generallyhigher on the low-clearance side, and this K, B, and G are the same as those for theresults in a force that tries to center the seal. nonrotating case. Black did, however, modify
the friction factor to account for the
Figure 4 is a plot of the dimensionless additional fluid velocity due to rotation. Forseal stiffness, K, versus the parameter a turbulent flowwhich may be thought of as a dimensionless seal 2PU0\ 1/4 7 6 213/8length. The entrance loss factor was chosen as = 0.079, 1 (16)n - 1.1, which is a value representative of T)1turbulent flow. For low values of a (i.e.,short seals) stiffness rises with seal length. This form was suggested by Yamada [8). It mayA peak is reached, and then stiffness drops as be noted that the mean flow velocity U is notlength increases. This phenomenon may be known a priori; it must be found throughexplained as follows: for very short seals, the iterative-soutions of Eqs. (7) and (16). Inentrance effect is the dominant pressure drop [7], the circumferential variation of frictionmechanism, that is, the sea] behaves somewhat as factor is accounted for; this results in a
an orifice. With wall friction playing such a substantial increase in the direct stiffnesssmall part, the pressure profile does not change coefficient Kxx (Fig. 6) but relativeiy smallmuch with seal eccentricity (see Fig. 5) and changes in the damping and inertia coefficients,thus the stiffness is low. Conversely, for long compared with the constant friction factorseals wall friction causes the bulk of the
57
mffi

solution. As Fig. b shows, the rotational 4. Entrance losses can be accounted for byvelocity affects the results; stiffness rises as a loss coefficient.rotational speed increases ano, as shown in [7],damping decreases. 5. There is no pressure recovery at the
seal exit.The works cited up to now have all used a Childs results [10] for direct and cross-coupled
small eccentricity analysis and presented stiffness and damping are given for turbulentresults for small perturbations about a centered flow by lextended the analysis to obtain results for a 5= E 1
perturbation about a finite eccentricity xx yy n 2a ti o(k D) 2_
position. They employed numerical integration 2Wto obtain stiffness, damping, ano total load 2W1 - a)E -a i acapacity for various seal eccentricities. In E a + (I - e- ) - + e-another departure from earlier analyses, the Kauthors of [2] neglected the time variation offluid velocity in the governing equations. This (17)change simplifies the solution procedure butinevitably introduces some inaccuracy in thecalculated damping coefficient (the stiffness is - vaLqunaffected). In [1] this inaccuracy was found xy= -yx 20) 1to be no more than 16 percent, with thesimplified solution overestimating the damping.
The results of the finite eccentricity + + - e- a ) + +
calculations showed that, in general, sealstiffness and damping are not much affected byeccentricity (Figs. 7 and 8). The exception is (18)the damping in the direction of displacement,where, as would be expected, the dampingcoefficient increases considerably as the seal E o + A(I + 6E (19)journal approaches the side wall. Seal rotation xx yy T7 (was not considered in [2].
Effect of inlet swirl. - As noted above,Black 16] accounted for seal rotation by = Z V/wLqassuming that the fluid circumferential velocity xy yx Dis one-half of the shaft speed throughout theseal. Actually, the fluid velocity onlyapproaches this limit asymptotically as it 2W1 [ a(e -aproceeds through the seal. In applications +-T- ( 1 e_ ) (20)such as centrifugal pump interstage seals, the afluid may enter the seal with little or norotational velocity. Furthermore, if the seal nlength is short, fluid rotational speed may E -2(n + Ba)(differ appreciably from the half-shaft-speedasymptotic value even at the seal exit. Thusseal dynamic properties are likely to vary with A =1 + 3 (22)the amount of inlet swirl present. The effect qz + 4of inlet swirl has been investigated in twopapers, one by Black, Allaire, and Barrett [9]and one by Childs [10]. The analysis in [10] is 0.75 2the more comprehensive, as it solves the a = a + - (23)short-bearing turbulent lubrication equations of q +4Hirs [11,12]. Since several of the assumptionslisted in the Analxsis section need no longer be Also, q is defined as the ratio of journalmade, it is worthwhile to list those assumptions rotational speed to mean axial velocity,still required by [10].
Rw1. The sealed fluid is incompressible. q = (24)
2. Pressure-induced circumferential flow is The initial swirl ratio W1 is the ratio ofneglected (the "short bearing" approximation circumferential fluid velocity at the seal[13]). entrance to the journal speed.
3. The eccentricity is small compared with VIthe seal concentric clearance. W1 IF (25)
58
rilld11,M ,

The swirl ratio approaches 112 as the fluidproceeds through the seal; W1=1/2 implies the KI K1 Jhalf-journal speed assumption of Black and [BhJenssen [6]. tB inite B hort 1 ' 0.6
While the expressions above appear EXPERIMENTAL CORRELATIONcomplicated, they can be programmed on a pocketcalculator or digital computer in a Experimental data, particularly dynamicstraightforward manner. Figure 9 shows the data, are very sparse. Black and Jenssen showresults of the calculations. The seal used for results of experiments in [6] and [7] for axialthese calculations has a length to diameter Reynolds numbers up to 20 000 and rotationalratio of 1/2; the circumferential journal speed Reynolds numbers (based on half journal speed)is 1/2 that of the mean axial fluid velocity, up to 14 000. Both unidirectional and rotating
load (due to unbalance) tests were run. In bothAs expected, preswirl has a stronger effect papers, agreement between analysis and
for small values of a, the dimensionless seal experiment is shown as close, although thelength. The larger the initial value of analysis of [7] employed the local frictioncircumferential fluid velocity, the smaller is factor effect while that of [6] did not. Childsthe direct stiffness and the larger the and Dressman [16] have presented preliminarycross-coupled stiffness and damping, while results which show that measured directdirect damping is completely unaffected, stiffness is generally a good deal higher thanCross-coupled stiffness is usually viewed as predicted by [10] (to 90 percent) while directpromoting instability. Small values of preswirl damping is much lower than predicted.reduce Kxy and thus would appear to bestabilizing. The authors of [9] point out that OPTIMUM GEOMETRIESnegative preswirl - the fluid revolving oppositethe direction of shaft motion - can result in Thus far it has been tacitly assumed thatnegative Kxy and thus counteract the seal clearance is constant in the axialwhirl-producing forces elsewhere on the shaft, direction; in other words the seal has a
straight bore. From physical reasoning it isState of the art. - This term is used with easy to see that the direct stiffness would be
some misgivings, as ring seals continue to higher if the clearance at the fluid exit werereceived intensive study and new publications less than at the entrance. In [17) Flemingappear frequently. calculated stiffness for seals with stepped and
tapered bores (Fig. 10) and determined optimumEquations (17) to (20) presented above geometries to maximize either the stiffness K
appear to be the most comprehensive available to on the ratio of stiffness to leakage K/M. Thiscalculate seal stiffness and damping, requiring was followed with calculations for damping inthe fewest simplifying assumptions and tapered bore seals [1]. Figure 11 shows thatpresenting results in explicit form. Results substantial increases in stiffness are possibleare limited to small displacements from the with an optimum taper configuration. Thecentered position, but, as shown in [2], seal stiffness increase is obtained with only astiffness and damping are largely insensitive to moderate leakage penalty. The inlet-to-outletseal eccentricity. The source of Eqs. (17) to clearance ratio for the maximum K/M seal is(20), [10), also presents expressions for nearly constant over the entire range ofinertia coefficients, but these are usually of dimensionless seal lengths (a) shown in Fig. 11minor importance. having a mean value of 1.9. Direct damping is
lower in tapered seals as shown in Fig. 12.Recently two authors have investigated This is principally because of the tapered seals
seals of finite length (thereby eliminating the larger average clearance (tapered and straightshort seal assumption) . In [14 the turbulent bore seals are compared using the minimumReynolds equation was solved numerically for clearance in the seal). More recently Childsfinite eccentricity ratios, using the finite extended his solution of Hirs' lubricationelement method. Childs, in [15), starts with equations to tapered bore seals [18]. HisHirs' bulk flow equations [11,12], transforms results agree qualitatively with those of [1)them to ordinary differential equations by small and [17). Childs considers variable inlet swirleccentricity assumptions, and integrates and rotational effects within the constraint ofnumerically. Both references report that the the short bearing approximation; thus greatershort seal solution overestimates the seal accuracy would be expected.coefficients with the error increasing forlonger (LID) seals. SEALS FOR COMPRESSIBLE FLUIDS
In this connection, Black and Jenssen [6] The flow of a compressible fluid (mostproposed correction factors for finite length commonly a gas) differs from that of anseals based on an approximate analysis. The incompressible fluid in that changes in pressureresults of [14] and [15] indicate that these are accompanied by changes in pressure andfactors result in overcorrection. A more temperature. For flow through a seal - usuallyaccurate formula would seem to be approximated as adiabatic - as the pressure
drops along the flow path the density and
I9
temperature also drop, and the velocity tapered seal was no higher than that of theincreases. Except for the special case of a straight seal. Physical reasoning leads one toconverging-diverging channel, the maximum fluid question this conclusion.speed is limiteO by the speed of sound. Thusfor some ratio of upstream to downstream In work by Burcham and Diamond £21] thepressure the flow will become choked and hence tapered bore seal was far superior to anunaffected by further decreases in downstream alternative seal, a Rayleigh lift pad design.pressure. Both were floating ring seals, and the objective
was to determine the endurance of the sealsFluid compressibility has a large effect on while maintaining satisfactory leakage control
the forces generated in seals. Stiffness and (i.e., minimizing wear). No internal pressuredamping coefficients are calculated for both measurements or force measurements were made.straight bore and tapered-bore seals in [4] and In this type of test, the seal having a higher[19]. All of the assumptions listed in the stiffness (higher centering force) can betteranaly section apply, except, of course, that minimize the rubs which cause wear. Thecompressibility is allowed; the fluid is assumed investigators noted that there was less sealto be a perfect gas. Figure 13 shows stiffness wear when sealed pressure was higher. This isof straight seals and optimum tapered seals for in agreement with the analysis, which shows thatchoked flow. The abscissa is the seal a higher sealed pressure produces higher sealclearance-to-length ratio C2 /L times a stiffness.Reynolds number Reo formed using the speedof sound for conditions upstream of the seal. SEAL EFFECT ON ROTOR DYNAMICS
Red = 2CP oPo/10 When significant forces (or equivalently,stiffnesses) are generated by seals, the effect
* * The curves on the left are for laminar flow. on the shaft-rotor system is the same as if aThe nearly horizontal curves on the right are bearing of that stiffness were placed on thefor turbulent flow; there is a separate curve shaft. Consequently, changes in dynamicfor each value of C2/L. The left end of the response can be expected as a function of sealcurves for turbulent flow corresponds to a stiffness.Reynolds number in the seal passage of 3000;this is generally considered the lowest value An example of seal forces being exploitedfor which one can be assured of turbulent flow. to favorably influence rotor dynamic response isA Reynolds number of 2300 is usually taken as the high pressure fuel pump for the spacethe upper limit for laminar flow. Points where shuttle main engine. The rotor of this pump isRe = 2300 are shown for various C2 /L values shown schematically in Fig. 15. Threeon the laminar flow curves, centrifugal pump stages are driven by a
two-stage axial turbine. The rotor is supportedThe surprising feature of the results is on two duplex ball bearings. Ring seals are
the negative stiffness predicted for low values used between pump stages. Originally, theseof C2 /L. This is analogous to the lockup seals were of serrated design (Fig. 16) tophenomenon observed in pressurized deliberately reduce the forces produced, as itgas-lubricated bearings. Negative stiffness was believed the cross-coupled stiffness wouldcould cause rapid failure of floating ring seals promote instability. In fact, other excitingand would rarely be beneficial even for rigidly forces produced a subsynchronous instabilitymounted seals. Tapered seal stiffness is always which began as the pump speed passed twice thepositive and generally much higher than straight first critical speed. Various modificationsseal stiffness. The optimum clearance ratio is were tried to eliminate the instability. Therenear 1.9 for most conditions, as it is for was little success until the serrated seals wereincompressible fluids, replaced with smooth-bore seals [22]. With this
change the pump could be run to full speedDamping is shown in Fig. 14. As for without exhibiting signs of instability. The
stiffness, laminar flow curves are on the left conclusion drawn was that the higher directand turbulent-flow curves (a separate one for stiffness of the smooth seals was largelyeach C2/L) are on the right. Again, as for responsible for the stabilization and that theincompressible fluids, damping is lower for benefit of higher direct stiffness overshadowedtapered seals. Damping is minimized for the deleterous effect of the higherclearance-to-length ratios of 0.002-0.005 and is cross-coupled stiffness. The effect ofhigher for ratios outside this range. higher-stiffness seals can be quantified in one
respect by determining the effect onExpermental data are again sparse, resonances. This is shown in Fig. 17 where
Hendricks [20] obtained pressure measurements resonant frequency is plotted as a function ofalong the length of straight and tapered bore interstage seal stiffness for a rotative speedseals in the concentric and fully eccentric of 37 000 rpm, the normal operating speed. Thepositions. Because of the small number of stiffness of the original serrated seals is notpressure taps he did not attempt to determine a known precisely; however seal stiffness hasnet force generated by the seal; however, he little effect on resonant frequency for lowestimated that the overall stiffness of the values of stiffness. The first and second
resonances are 9500 and 19 800 cpm,
60
4
p p ~p *~....' N" .. .tili

respectively. When the serrated seals are 8. Yutaka Yamada, "Resistance of a Flowreplaced by smooth-bore seals, the resonances through an Annulus with an Inner Rotatinghave risen to 13 500 and 23 000 cpm. Further Cylinder." Bulletin of JSME, Vol. 5, No.increases occur if optimum tapered-bore seals, 18, 1962, pp. 302-310.described earlier, are used. The two resonancesthen are 16 000 and 28 000 cpm. These 9. H. F. Black, P. E. Allaire, and L. E.frequencies are 70 and 40 percent higher, Barrett, "Inlet Flow Swirl in Shortrespectively, than the resonant frequencies with Turbulent Annular Seal Dynamics."the original serrated seals. Presented at Ninth Int. Conf. on Fluid
Sealing, BHRA Fluid Engineering,CONCLUDING REMARKS Leeuwenhorst, Netherlands, 1981.
Significant forces can be generated by ring 10. D. W. Childs, "Dynamic Analysis ofseals; film stiffnesses as high as 90 MNi Turbulent Annular Seals Based on Hirs'(500000 lb/in.) have been calculated for Lubrication Equation.' To be published inturbopump ring seals. These forces have been J. Lubrication Technology.effectively utilized to support and stabilizeshaft-rotor systems. This paper has presented a 11. G. G. Hirs, "Fundamentals of a Bulk-Flowsummary of work that has been done to determine Theory for Turbulent Lubricant Films."forces generated in ring seals. Both Doctoral Thesis, Delft Univ. Technology,compressible and incompressible fluids were 1970.considered; working formulas were presented tocalculate seal stiffness and damping. Seal 12. G. G. Hirs, "A Bulk-Flow Theory forgeometries to maximize stiffness were Turbulence in Lubricant Films." J.described. An example showed the effect seals Lubrication Technology, Vol. 95, No. 2,can have on the dynamic behavior of rotor April 1973, pp. 137-146.systems; use of high-stiffness seals raised therotor critical speeds by nearly 50 percent. 13. George B. DuBois and Fred W. Ocvirk,
"Analytical Deviation and ExperimentalREFERENCES Evaluation of Short-Bearing Approximation
for Full Journal Bearings." NACA Rep.1. David P. Fleming, "Damping in Tapered 1157, 1953.
Annular Seals for an IncompressibleFluid." NASA TP-1646, 1980. 14. Richard H. Schmaus, 'Static and Dynamic
Properties of Finite Length Turbulent Flow2. P. E. Allaire, C. C. Lee, and E. J. Annular Seals." MS Thesis, Univ. Virginia,
Gunter, "Dynamics of Short Eccentric Plain 1981.Seals with High Axial Reynolds Number." J.Spacecraft, Vol. 15, No. 6, Nov.-Dec. 1978, 15. D. W. Childs, "Finite Length Solutions forpp. 341-347. Rotordynamic Coefficients of Turbulent
Annular Seals." Submitted to J.3. D. P. Fleming and E. M. Sparrow, "Flow in Lubrication Technology.
the Hydrodynamic Entrance Region of Ductsof Arbitrary Cross Section." J. Heat 16. Dara W. Childs, John B. Dressman, and S.Transfer, Vol. 91, Aug. 1969, pp. 345-354. Bart Childs, "Testing of Turbulent Seals
for Rotordynamic Coefficients." Paper in4. David P. Fleming, "Stiffness of Straight Rotordynamic Instability Problems in High
and Tapered Annular Gas Path Seals." J. Performance Turbomachinery, NASA CP-2133,Lubrication Technology, Vol. 101, No. 3, 1980, pp. 121-138.July 1979, pp. 349-355.
17. D. P. Fleming, "High Stiffness Seals for5. H. F. Black, "Effects of Hydraulic Forces Rotor Critical Speed Control." ASME Paper
in Annular Pressure Seals on the Vibration 77-DET-10, 1977.of Centrifugal Pump Rotors." J. MechanicalEngineering Science, Vol. 11, No. 2, 1969, 18. D. W. Childs, "Convergent-Tapered Annularpp. 206-213. Seals: Analysis for Rotordynamic
Coefficients." Symposium volume,6. H. F. Black and 0. N. Jenssen, "Dynamic Fluid/Structure Interactions in
Hybrid Bearing Characteristics of Annular Turbomachinery, ASME Winter Annual Meeting,Controlled Leakage Seals." Proc. Inst. 1981, pp. 35-44.Mech. Engineers, Vol. 184, Part 3N,1969-1970, pp. 92-100. 19. David P. Fleming, "Damping in Ring Seals
for Compressible Fluids." Paper in7. H. F. Black and D. N. Jenssen, "Effects of Rotordynamic Instability Problems in High
High Pressure Ring Seals on Pump Rotor Speed Turbomachinery, NASA CP-2133, 1980,Vibrations.m ASME Paper 71-WA/FE-38, Nov. pp. 169-188.1971.
61
III ..
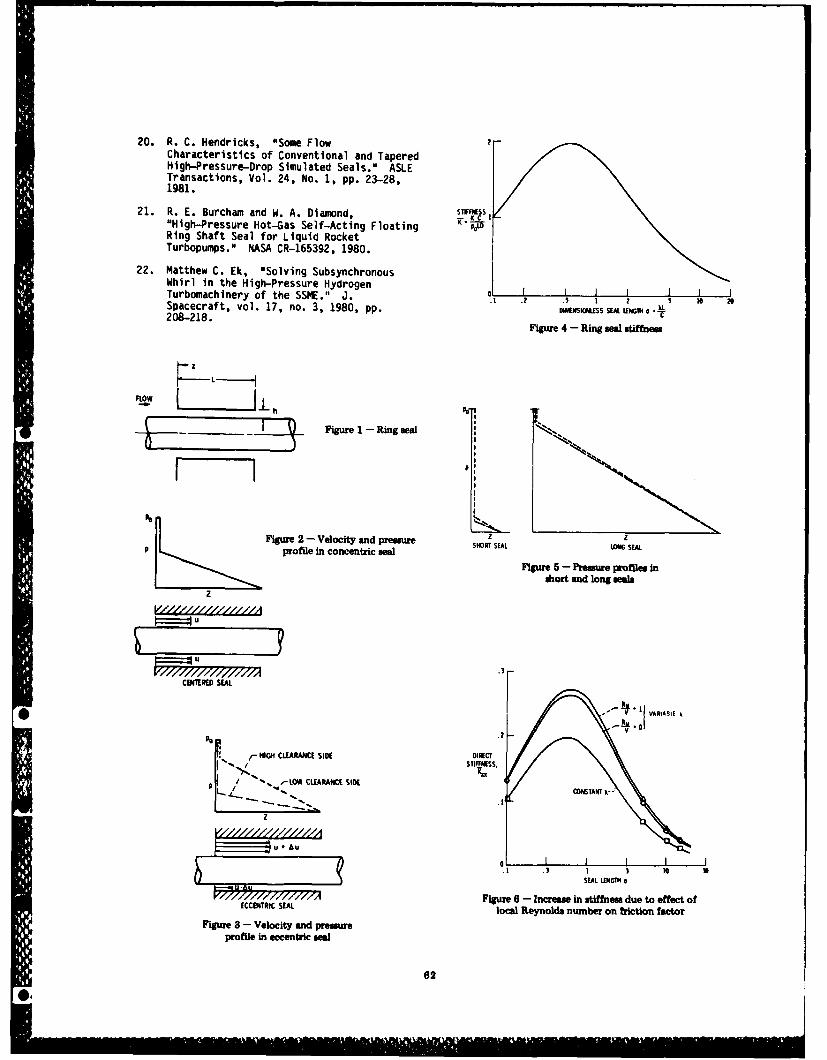
20. R. C. Hendricks, "MSomte Flow2Characteristics of Conventional and TaperedHigh-Pressure-Drop Simulated Seals."M AS.ETransactions, Vol. 24, No. 1, pp. 23-28,1981.
21. R. E. Burcham and W. A. Diamond, TRO
"High-Pressure Hot-Gas Self-Acting Floating PRing Shaft Seal for Liquid RocketTurbopumps. M NASA CR-165392, 1980.
22. Matthew C. Ek, "Solving SubsynchronousWhirl in the High-Pressure Hydrogen II ITurbomachinery of the 55ff.11 J. 1 .2 .5 1 2 5 10 20Spacecraft, vol. 17, no. 3, 1980, pp. MM S EAUX oX208-218.T
Figure 4 -Ring seal stiffness
- Figure 1 - Ring meal
z zFigur 2 -Velocity and pressure SHORY SEAL LONG SEALP profile in concentric seal
Figure 56- Pressure profiles inshort and long seas
z
ZIjIIyyCEDMRED SEAL
0 ~!. 1(VARIAS11 A
/-M 1GM4 CLEARANCE SIDE GladY
/ I " ,O CLEARANCE SIDE OSAx-
S EAL LEIIGI40ECCETRICFigure 6 - Increase in stiffness due to effect ofECCETRICSEALlocal Reynolds number on friction factor
Figure 38- Velocity and pressureprofile in eccentric seal
62
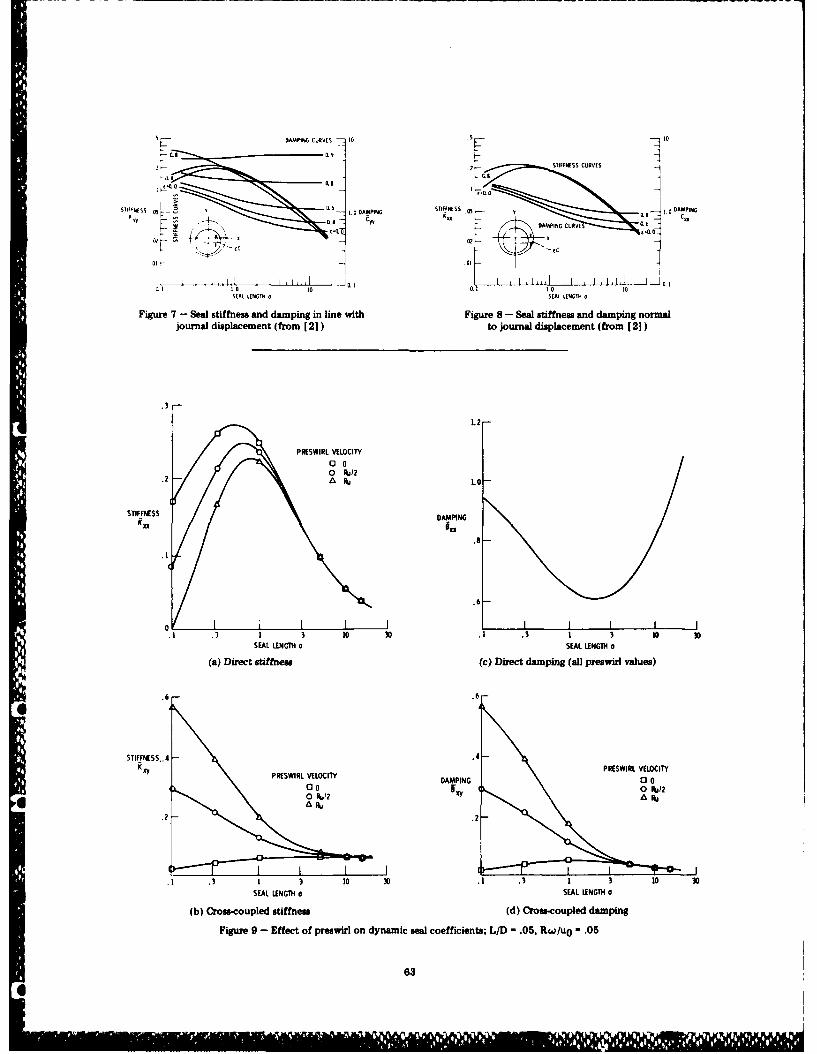
DAMPING CURVES j- 10 .5 .. 1IPS CA0l
IGONfs0- AMPING STIF 04- M1 DAMPING
L ~DAMPING CUVEfl...aI~Ovaf 0
5.-- /. 1c
QI1 0 0. 1 0 10
01SEAL LENGTH a S EAL LEGT
Figure 7 -Seal stiffness and damping in line with Figure 8 - Seal stiffness and damping normaljournal displacement (from [2]) to journal displacement (from [21)
.3
1.2
PRESWIRI VELOCITY
0 'N12.2 - 4 10
STIFFIESS DAMPINGKx e'
.6
0 1____________ 1 1 1 1 I.1 .3 1 3 10 .01 .3 1 3 10 30
SEAL LENGTH a SEAL LENGTH o
(a) Direct stiffness (c) Direct damping (all preswirl values)
.6 -. 6
STIFFNESS., 4 -. 4 -
XYPRESWIRL VELOCITY DAMPING PRSIR 0ELCT
(00 6 Y 10 Fb/,2
0OPV2 Asay
.2 .2
.1 .3 1 3 10 0 .1 .3 1 3 10 30SEAL LENGTH a SEAL LENGTH a
(b) Cross-coupled stiffness (d) Cross-coupled damping
Figure 9 - Effect of preswirl on dynamic seal coefficients; LID - .05, Rw/uo - .05
63

zTAPERED .6MAX KIM
FLW h1r1- I h2 x-. 0 Re23110FORGIVEN C211- .20 /0.02
'z ~STPPED.02FLWW-h1 LU' -Lh2
-011 ALL C2IL-, 0 T./ . 3D5-
Figure 10 - Tapered and stepped annular seals 0 '112
10 100 1100SEAL PARANeEUR~b
-TAPERED SEAL.tMAY1MUM K im Figure 13 - Stiffness of straight and tapered seals;
4 - -STRAIGHT SEL choked compressible flow
.36 STIFFNESS,
- D 16-CTAIH
.3 .2 .4 .6.3 1 2 4 6 310 20 1. 4 IINHRAIO-SEAL LENGTH, 0 - XIC2 (?,I
Figure 11I- Stiffness of tapered and straight seals x0 V-
L2 -TA TPERED SEAL -.
DAMPING6. 1. II4 6cto 0 Al FORm IM
4 -Figure 14 - Damping in ring mias;choked compressible flow
.2
.1 .2 .4 .6.8 1 2 A 65810 20SEAL LEN4GTH. o - II/C2 MAGSEL
Figure 12 - Damping in tapered and straight seals BL AO
PUPIMPELLER TURBINE STAGES
Figure 15 - Turtsopump rotor
64
61)N
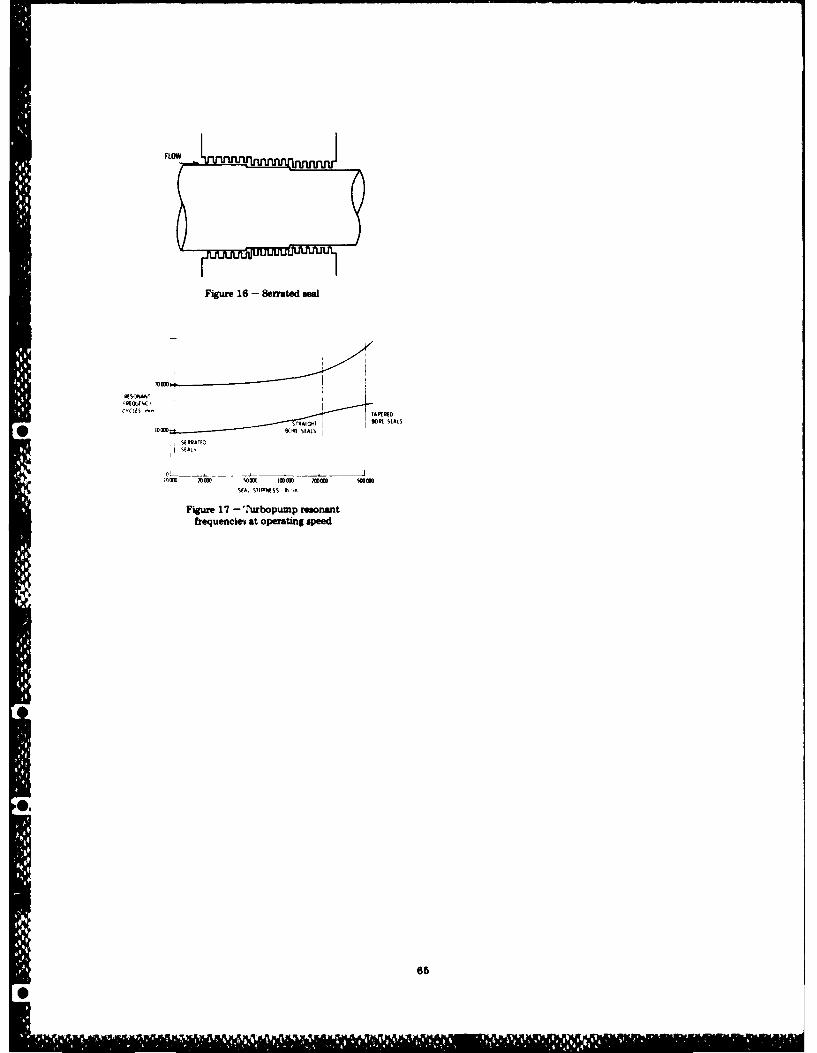
FLOW m u ulnnii J
Figure 16 - Serrated seal
STIAIQT SARISEAAS
SI RATIDf
lom 200W SliI 100m WM smoSEA, S'IIPESS m '
Figure 17 - Turbopump resonantfrequenciei at operating speed
65

MACHINERY VIBRATION EVALUATION TECHNIQUES
Ronald L. EshlemanVibration Institute
Clarendon Hills, Illinois
Direct frequency analysis of vibration signals iscommonly used to evaluate the condition of machinery.This paper is concerned with this technique, its vari-ations, and many other techniques available for ma-chinery vibration evaluation. The techniques describedand illustrated in this paper involve the time and fre-quency domains, orbital motions, transient tests, andparameter analyses -- either calculated or measured.
INTRODUCTION TIME DOMAIN ANALYSIS
The evaluation of machinery vibra- Until recently wave analyzers andtions involves a knowledge of equipment fast fourier transform computers were indesign parameters, testing and/or compu- such widespread use that diagnosticianstational techniques, and appropriate tended to rely solely on the frequencytest equipment. domain (vibration amplitude vs fre-
quency) for vibration analysis. How-To conduct an effective analysis of ever, valuable information can be ob-
a machine's problems it is essential to tained from the time domain (vibrationhave a thorough knowledge of the equip- amplitude vs time); fortunately, itsment design characteristics, its instal- advantages are becoming more widelylation state, and its environment. The recognized. Direct differential timeforcing frequencies that result from measurement is given as a digital read-equipment wear, faulty installation or out on some of the new analyzers andmanufacture, and design are required. oscilloscopes. Such readouts allowThe mass, elastic, damping characteris- accurate identification of the period oftics that affect natural frequencies, vibration events. In the discussionmode shapes, instabilities, and thermal that follows, examples of both steadyand structural response enable in-depth and transient vibrations are given toanalyses. These parameters and condi- illustrate some of the uses of the timetions should be obtained prior to ma- domain.chine evaluation.
Vibration events that are eitherThe development of sophisticated synchronous or nonsynchronous with
electronics, practical mathematical speed can be observed and analyzed inalgorithms, and reliable transducers the time domain. An example of a non-has provided the tools for machinery synchronous vibration signal is avibration analysis. In fact, the avail- second harmonic of line frequency in anability of machinery vibration evalua- electric motor. It will move graduallytion parameters, techniques, and equip- with respect to the fundamental oper-ment raises machinery vibration analysis ating frequency of the motor in the timefrom an art to a science. domain. Misalignment and other common
mechanical problems are synchronous withThis paper is concerned with ma- shaft frequency. The nonsynchronous
chinery vibration evaluation techniques. harmonic can be evidence of environ-The techniques descussed in the paper mentally-induced vibration from adjacentare summarized in Table 1. equipment.
67
..
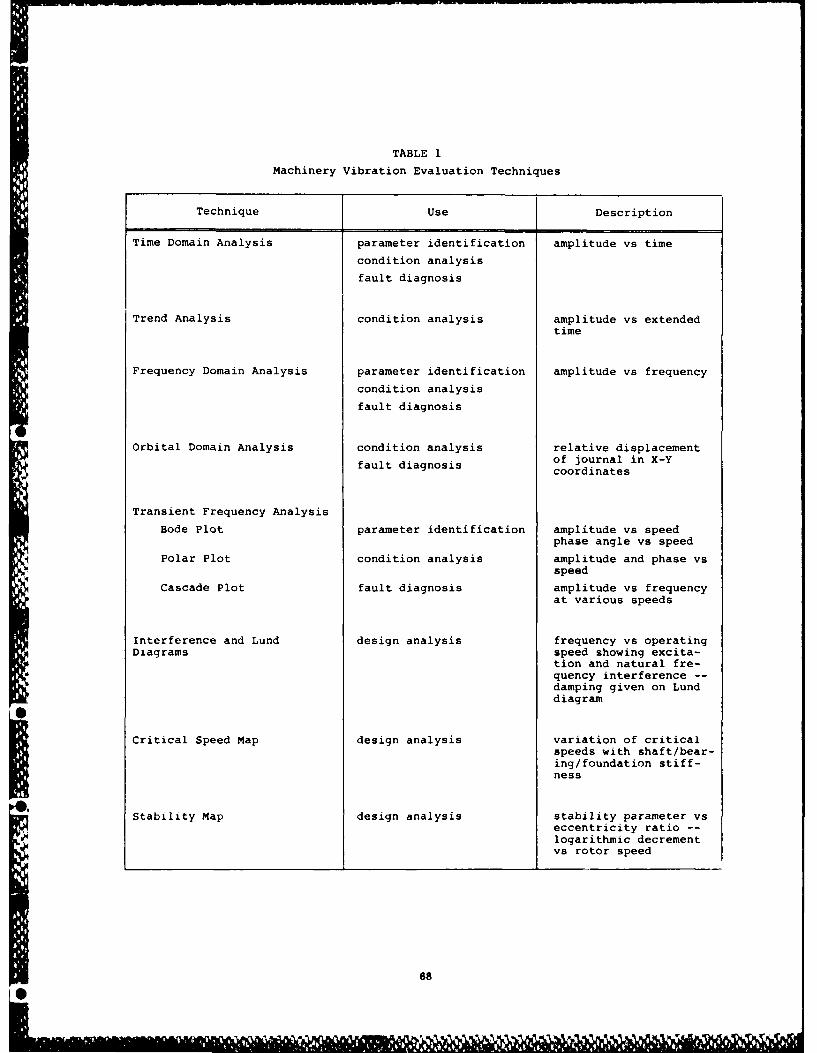
TABLE 1
Machinery Vibration Evaluation Techniques
Technique Use Description
Time Domain Analysis parameter identification amplitude vs time
condition analysis
fault diagnosis
Trend Analysis condition analysis amplitude vs extendedtime
Frequency Domain Analysis parameter identification amplitude vs frequency
condition analysis
fault diagnosis
Orbital Domain Analysis condition analysis relative displacementof journal in X-Y
fault diagnosis coordinates
Transient Frequency Analysis
Bode Plot parameter identification amplitude vs speedphase angle vs speed
Polar Plot condition analysis amplitude and phase vsspeed
Cascade Plot fault diagnosis amplitude vs frequencyat various speeds
Interference and Lund design analysis frequency vs operatingDiagrams speed showing excita-
tion and natural fre-quency interference --damping given on Lunddiagram
Critical Speed Map design analysis variation of criticalspeeds with shaft/bear-ing/foundation stiff-ness
Stability Map design analysis stability parameter vseccentricity ratio --logarithmic decrementvs rotor speed
68
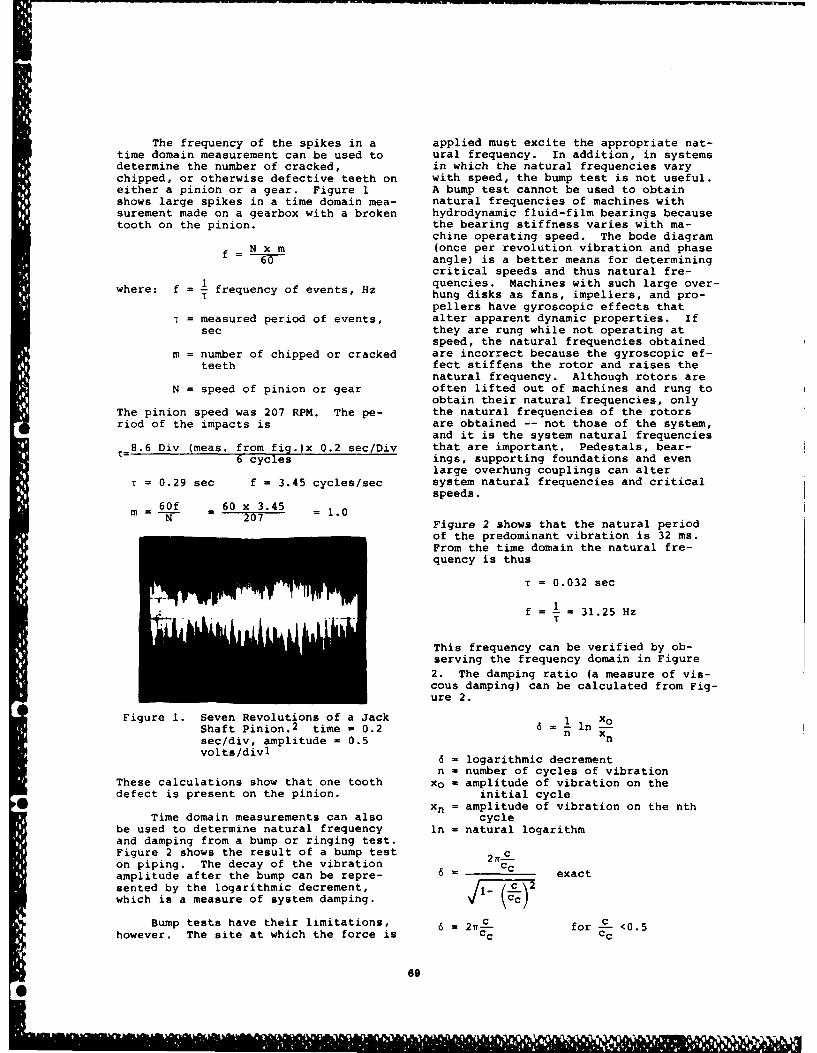
The frequency of the spikes in a applied must excite the appropriate nat-time domain measurement can be used to ural frequency. In addition, in systemsdetermine the number of cracked, in which the natural frequencies varychipped, or otherwise defective teeth on with speed, the bump test is not useful.either a pinion or a gear. Figure 1 A bump test cannot be used to obtainshows large spikes in a time domain mea- natural frequencies of machines withsurement made on a gearbox with a broken hydrodynamic fluid-film bearings becausetooth on the pinion, the bearing stiffness varies with ma-
chine operating speed. The bode diagramN x m (once per revolution vibration and phase
= 0 angle) is a better means for determiningcritical speeds and thus natural fre-
= frequency of events, Hz quencies. Machines with such large over-where: f hung disks as fans, impellers, and pro-
pellers have gyroscopic effects thatT = measured period of events, alter apparent dynamic properties. If
sec they are rung while not operating atspeed, the natural frequencies obtained
m = number of chipped or cracked are incorrect because the gyroscopic ef-teeth fect stiffens the rotor and raises the
natural frequency. Although rotors areN = speed of pinion or gear often lifted out of machines and rung to
obtain their natural frequencies, onlyThe pinion speed was 207 RPM. The pe- the natural frequencies of the rotors
Sriod of the impacts is are obtained -- not those of the system,and it is the system natural frequencies
T= 8.6 Div (meas. from fig.)x 0.2 sec/Div that are important. Pedestals, bear-6 cycles ings, supporting foundations and even
large overhung couplings can alterT = 0.29 sec f = 3.45 cycles/sec system natural frequencies and critical
speeds.
M 0f 60 x 3.45 1.0N Figure 2 shows that the natural period
of the predominant vibration is 32 ms.From the time domain the natural fre-quency is thus
T = 0.032 sec
- =1 31.25 Hz
This frequency can be verified by ob-serving the frequency domain in Figure2. The damping ratio (a measure of vis-cous damping) can be calculated from Fig-ure 2.
Figure 1. Seven Revolutions of a Jack inShaft Pinion.2 time - 0.2 6 = n Insec/div, amplitude = 0.5 n
volts/divl 6 = logarithmic decrementn - number of cycles of vibration
These calculations show that one tooth xo = amplitude of vibration on thedefect is present on the pinion, initial cycle
* Xn = amplitude of vibration on the nthTime domain measurements can also cycle
be used to determine natural frequency in = natural logarithmand damping from a bump or ringing test.Figure 2 shows the result of a bump test 2 c-c_on piping. The decay of the vibration ccamplitude after the bump can be repre- cc exactsented by the logarithmic decrement, 1 Cwhich is a measure of system damping. 3c)
Bump tests have their limitations, 6 2 7- for c "however. The site at which the force is cc cc
69
'01

-v1*, 16 "11,,t - 1 2 32
ftxvq~sv 1 1.25 N.
28um
tI 8 "l
Frequenoy, Hz
Figure 2. Bump Test on Line Shaft Turbine Piping(courtesy of James I. Taylor)
6 = logarithmic decrement such as hours, days, weeks, or months.It can be continuously or periodically
= damping ratio recorded. Information on time to fail-ure is obtained by extrapolating the re-corded data. Generalized techniques for
If c/cc = 1, the system is crit- extrapolation of data have not been de-ically damped and no vibration will veloped due to the complexity of ma-occur. If c/cc = 0, no damping is ob- chines and their installations. Suc-tained. Some typical damping values cessful trendinq results from knowledqe
of the wear-vibration characteristicsare: rubber = 0.05, steel = 0.001, and o pcfcmcie.Fgr hwfluid film bearings = 0.1 to 1. of specific machines. Figure 3 shows
an example trending chart for the degra-
The logarithmic decrement for the dation of babbitt in a bearing undergo-piping example shown in Figure 2 is ing electrical erosion.
=1 286 l~in T = 2.33
FREQUENCY DOM4AIN ANALYSISc_ 6c = 0.37 Frequency analysis techniques have
provided a well used means for identifi-The damping ratio of 0.37 indicates a cation of vibration faults since themoderately damped system that will be development of tunable analyzers withresponsive to a forcing function, band pass filters. These techniques
have been extended from direct singlefrequency identification to sum and dif-
TREND ANALYSIS ference frequency analysis as a resultof the evaluation of real time analyzers
The trend display is an extended with zoom or translator capability. Thetime display of a key measured parameter zoom feature provides the expansion ofsuch as average, peak, or rms vibration the frequency domain so that sidebandsvelocity or acceleration, peak to peak can be resolved.displacement, temperature, or pressure.Trend data is obtained from monitoringand recording data at specific intervals
70
04
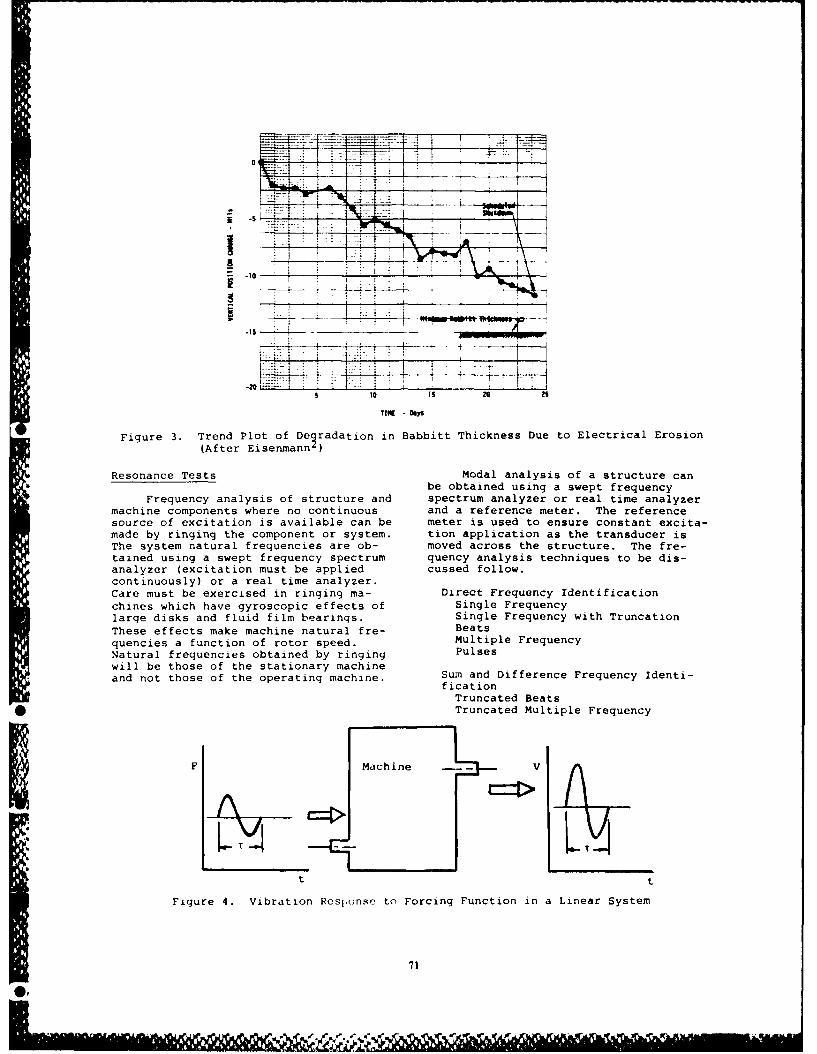
S 10
-op" isen n
-20111 _____
510 Is 20 26
T1OW - ys
Figure 3. Trend Plot of Deyradation in Babbitt Thickness Due to Electrical Erosion(After Exsenmann2
Resonance Tests Modal analysis of a structure can
be obtained using a swept frequency
Frequency analysis of structure and spectrum analyzer or real time analyzermachine components where no continuous and a reference meter. The referencesource of excitation is available can be meter is used to ensure constant excita-made by ringing the component or system. tion application as the transducer isThe system natural frequencies are ob- moved across the structure. The fre-tained using a swept frequency spectrum quency analysis techniques to be dis-analyzer (excitation must be applied cussed follow.continuously) or a real time analyzer.Care must be exercised in ringing ma- Direct Frequency Identificationchines which have gyroscopic effects of Single Frequencylarge disks and fluid film bearings. Single Frequency with TruncationThese effects make machine natural fre- Beats
quencies a function of rotor speed. Multiple FrequencyNatural frequencies obtained by ringing Pulseswill be those of the stationary machineand not those of the operating machine. Sum and Difference Frequency Identi-
ficationTruncated BeatsTruncated Multiple Frequency
F Machine V
Figure 4. Vibration Response to Forcing Function in a Linear System
71
@,
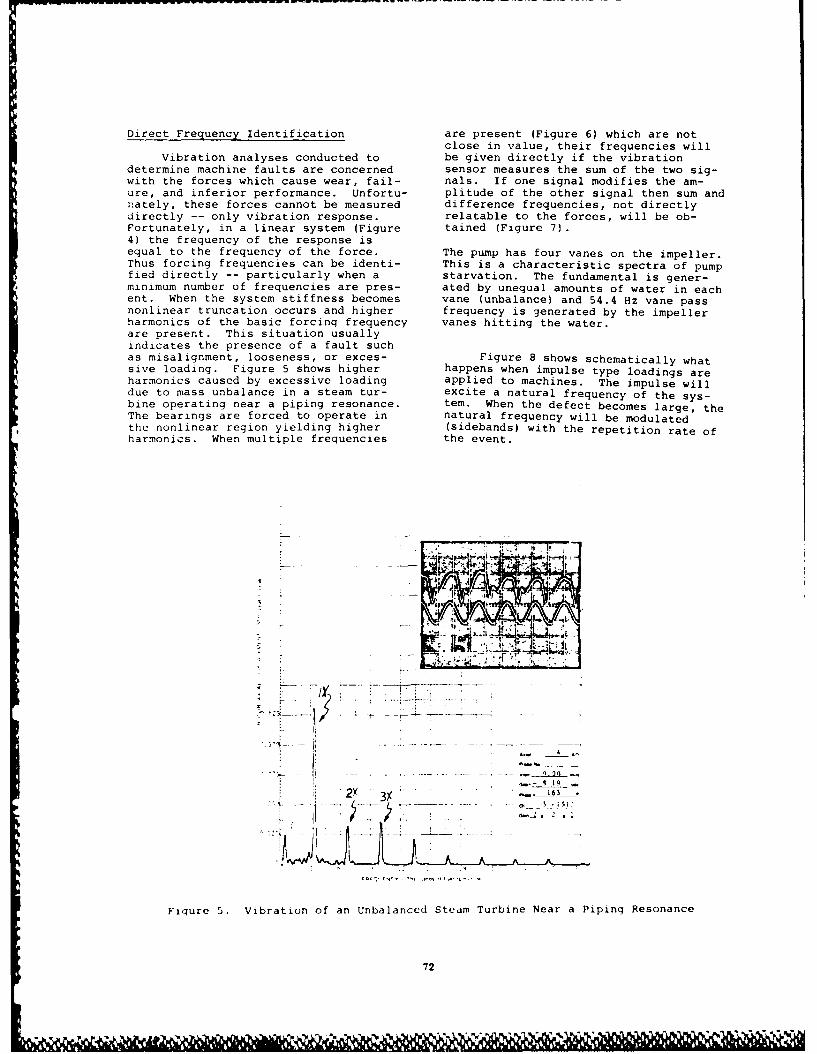
Direct Frequency Identification are present (Figure 6) which are notclose in value, their frequencies will
Vibration analyses conducted to be given directly if the vibrationdetermine machine faults are concerned sensor measures the sum of the two sig-with the forces which cause wear, fail- nals. If one signal modifies the am-ure, and inferior performance. Unfortu- plitude of the other signal then sum andnately, these forces cannot be measured difference frequencies, not directlydirectly -- only vibration response. relatable to the forces, will be ob-Fortunately, in a linear system (Figure tained (Figure 7).4) the frequency of the response isequal to the frequency of the force. The pump has four vanes on the impeller.Thus forcing frequencies can be identi- This is a characteristic spectra of pumpfied directly -- particularly when a starvation. The fundamental is gener-minimum number of frequencies are pres- ated by unequal amounts of water in eachent. When the system stiffness becomes vane (unbalance) and 54.4 Hz vane passnonlinear truncation occurs and higher frequency is generated by the impellerharmonics of the basic forcinq frequency vanes hitting the water.are present. This situation usuallyindicates the presence of a fault suchas misalignment, looseness, or exces- Figure 8 shows schematically whatsive loading. Figure 5 shows higher happens when impulse type loadings areharmonics caused by excessive loading applied to machines. The impulse willdue to mass unbalance in a steam tur- excite a natural frequency of the sys-bine operating near a piping resonance. tem. When the defect becomes large, theThe bearings are forced to operate in natural frequency will be modulatedthe nonlinear region yielding higher (sidebands) with the repetition rate ofharmonics. When multiple frequencies the event.
-,-
A
2Y 1 -
--L.A,~
Figure 5. Vibration of an Unbalanced Steam Turbine Near a Piping Resonance
72
- ., -

4Z4
0 2 :
Frequency (Hz)
Figure 6. The Frequency Spectrum From
a aioj)8 RPM Pump (After
.5
":.4 - 50
=3x43 Line Shaft Turbine
Inlet Steam Pipe
.2
L J3.,.-35100-2(.2 -wi)
Zw2- 8 3w,-
1 2 9 lSO-
3(w:-wi) 22'16
Frequency (Hz)
Figure 7. Frequency Domain Record of Line Shaft Turbine Piping Vibration* (courtesy of James I. Taylor)
f V
Figure 8. Response of Mechanical System to Impulse Type Excitation
73
6M 6Arj-j
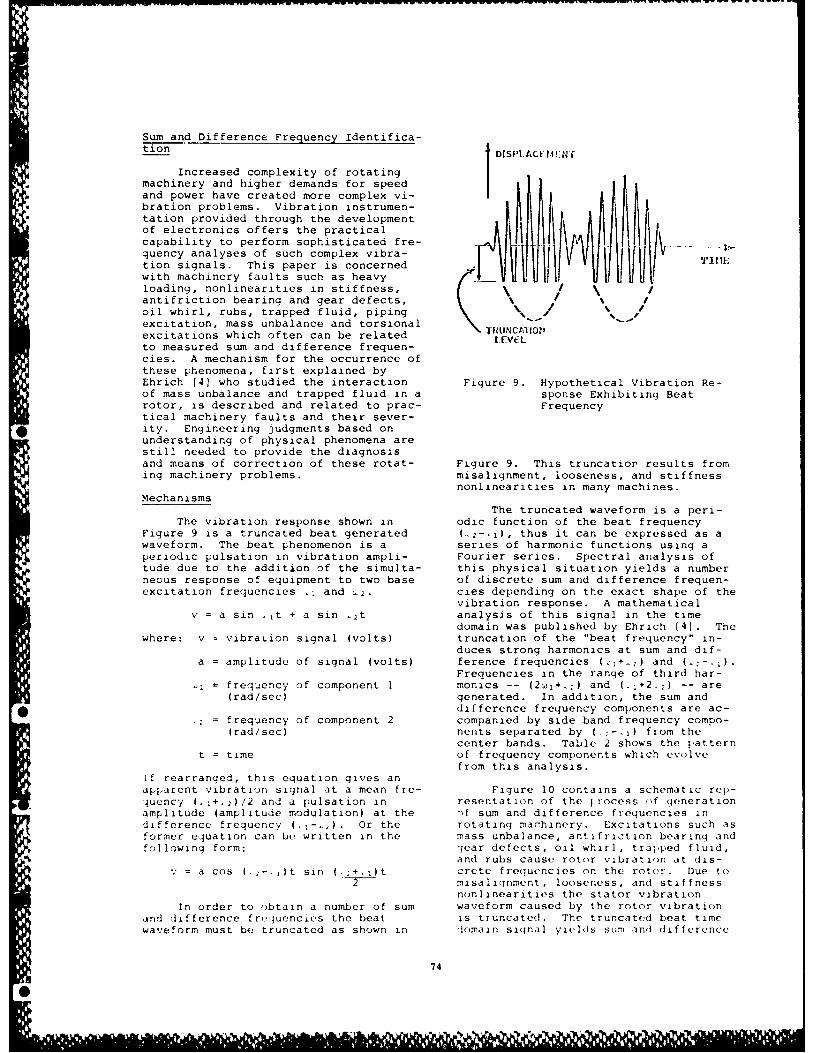
Sum and Difference Frequency Identifica-tion DISilLACE MEN f
Increased complexity of rotatingmachinery and higher demands for speedand power have created more complex vi-bration problems. Vibration instrumen-tation provided through the developmentof electronics offers the practicalcapability to perform sophisticated fre-.quency analyses of such complex vibra- -Iition signals. This paper is concernedwith machinery faults such as heavyloading, nonlinearities in stiffness, I Iantifriction bearing and gear defects, %oil whirl, rubs, trapped fluid, piping \ /excitation, mass unbalance and torsional 1 IONCA1O0Jexcitations which often can be related LEVELto measured sum and difference frequen-cies. A mechanism for the occurrence ofthese phenomena, first explained byEhrich [4] who studied the interaction Figure 9. Hypothetical Vibration Re-of mass unbalance and trapped fluid in a sponse Exhibiting Beatrotor, is described and related to prac- Frequencytical machinery faults and their sever-ity. Engineering judgments based onunderstanding of physical phenomena arestill needed to provide the diagnosisand means of correction of these rotat- Figure 9. This truncatior results froming machinery problems. misalignment, looseness, and stiffness
nonlinearities in many machines.Mechanisms
The truncated waveform is a peri-The vibration response shown in odic function of the beat frequency
Figure 9 is a truncated beat generated (-2-1), thus it can be expressed as awaveform. The beat phenomenon is a series of harmonic functions using aperiodic pulsation in vibration ampli- Fourier series. Spectral analysis oftude due to the addition of the simulta- this physical situation yields a numberneous response of equipment to two base of discrete sum and difference frequen-excitation frequencies .1 and 2. cies depending on the exact shape of the
vibration response. A mathematicalv = a sin .It + a sin -2t analysis of this signal in the time
domain was published by Ehrich [4]. Thewhere: v = vibraLion signal (volts) truncation of the "beat frequency" in-
duces strong harmonics at sum and dif-a = amplitude of signal (volts) ference frequencies ( ,+_) and -
Frequencies in the range of third har-= frequency of component I monics -- (
2(+,;) and (.1+2.;) -- are
(rad/sec) generated. In addition, the sum and*difference frequency components are ac-
= frequency of component 2 companied by side band frequency compo-(rad/sec) nents separated by (.-)from the
center bands. Table 2 shows the patternt = time of frequency components which evolve
from this analysis.If rearranged, this equation gives anapparent vibration signal at a mean fre- Figure 10 contains a schematic rep-quency (..+.2)/2 and a pulsation in resentation of the p.rocess -f generationamplitude (amplitude modulation) at the rf sum and difference frequencies indifference frequency ( -.. ) . Or the rotating machinery. Excitations such asformer equation can be written in the mass unbalance, antifriction bearing andfollowing form: gear defects, oil whirl, trapped fluid,
and rubs cause rotor vibration at dis-v = a cos (. -. )t sin (.;+. )t crete frequencies on the rotor. Due to
misallqnment, looseness, and stiffnessnonlinearities the stator vibration
In order to obtain a number of sum waveform caused by the rotor vibrationand difference frequencies the beat is truncated. The truncated beat timewaveform must be truncated as shown in domain siqnal yields sum and difference
74
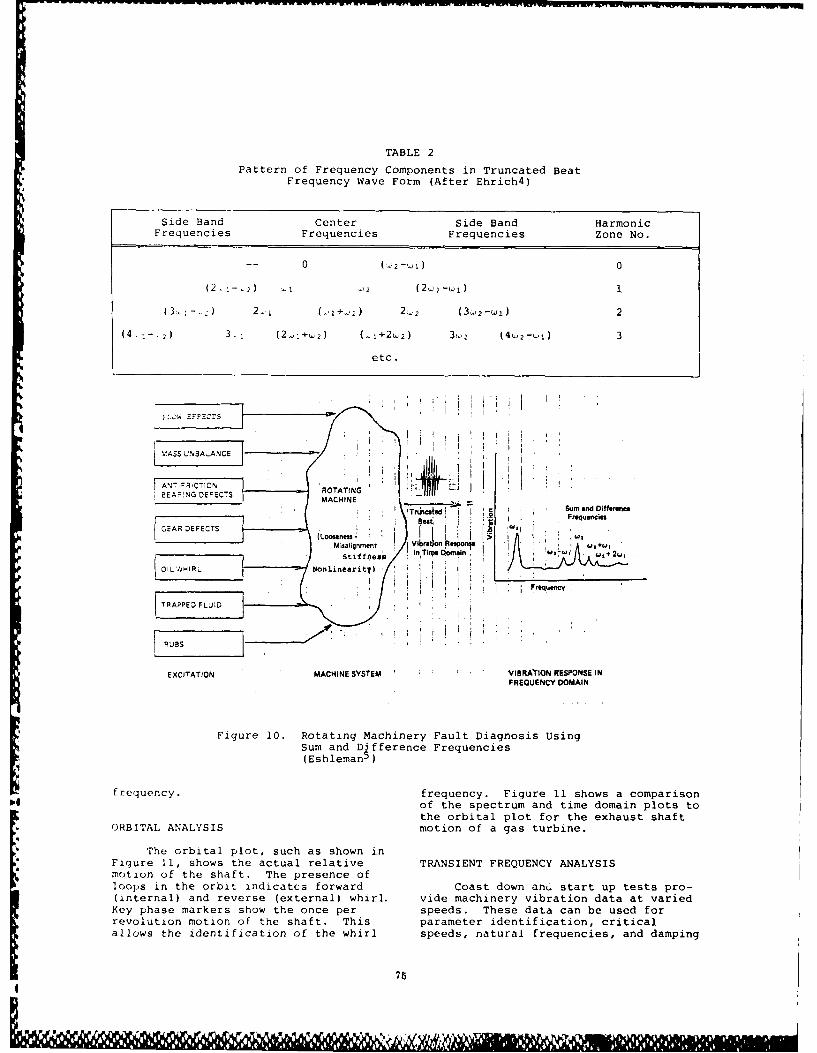
TABLE 2
Pattern of Frequency Components in Truncated BeatFrequency Wave Form (After Ehrich4)
Side Band Center Side Band HarmonicFrequencies Frequencies Frequencies Zone No.
-- 0 (2-J1) 0
(2. :- 2 ) ' 1 -.2 (2
2 -t ) 1
(3. -:. 2 (1+ 2) 2-2 (3W 2- i ) 2
(4,:-,z) 3.1 (2 .+"2) (-1+2W2) 3w2 (4W2-,)1) 3
etc.
iAN 9EFCTS 7
BEAR:NG DE ECT ROTATING
LCSum and Diffrence
rca I ',Frequencies
Misalignment IV ration.Rs? -
EXC TATION MACHINE SYSTEM ' ; VIBRA'TION RESPONSE IN
Figure 10. Rotating Machinery Fault Diagnosis UsingSum and Difference Frequencies(Eshleman 5I)
Irequency. frequency. Figure 11 shows a comparison
of the spectrum and time domain plots tothe orbital plot for the exhaust shaftORBITAL ANALYSIS motion of a gas turbine.
The orbital plot, such as shown in
Key ~ ~ ~ ~ ~u phsaakrsso h nce per ernc spee. cTesedtcabeudfo
Figure 1,
shows the actual relative TRANSIENT FREQUENCY ANALYSISoftion of the shaft. The presence of
loops in the orbit indicates forward Coast down anu start up tests pro-(internal) and reverse (external) whirl. vide machinery vibration data at variedKey phase markers show the once per speeds. These data can be used for
revolution motion of the shaft. This parameter identification, criticalallows the identification of the whirl speeds, natural frequencies, and damping
75I ll~i
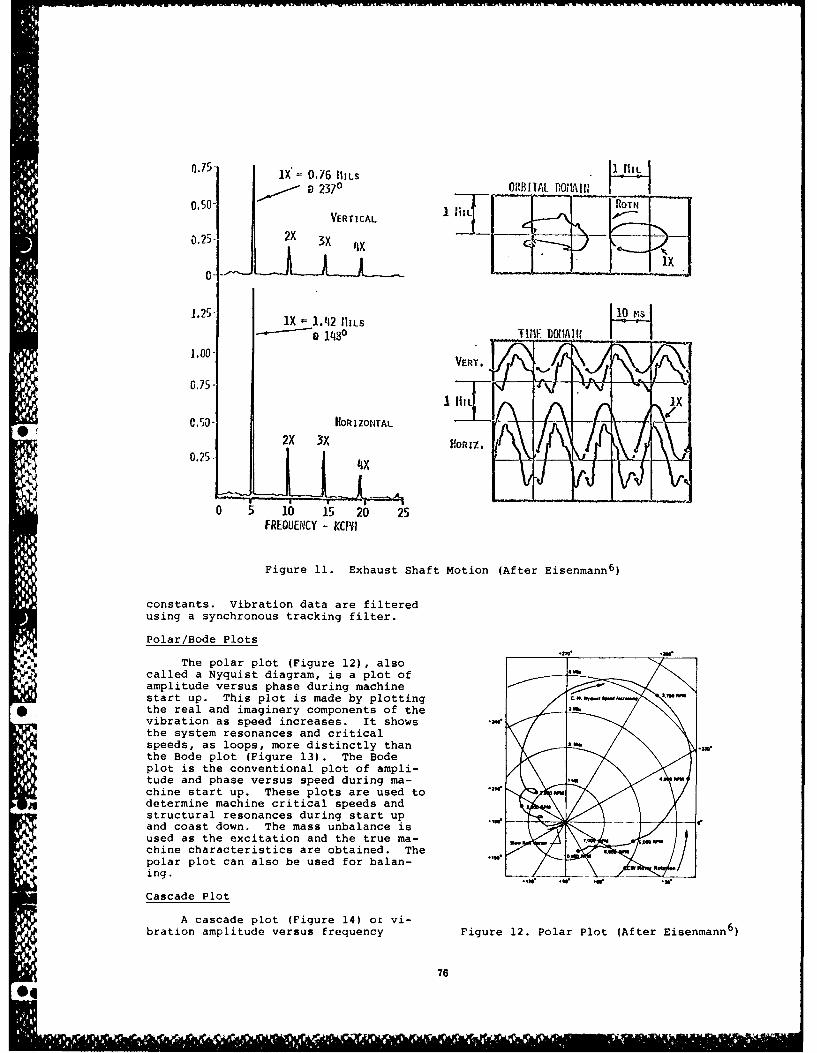
--- --- --
27 0 SORBITAL POrlAIr
0 9 2370 ROTNVERTICAL I---l
0.25 2X 3X 4X
0-
1.25 -X 1.42 f1ILS
l8 ° j'I 0 .1WIE DOMtAII I I
1.00- VERT.
Ix*0.50- 2 XHORIZONTAL V RZ2X 3X IAORIZ.
0.25- 4
0 5 10 i5 20 25FREQUENCY - KCPN
Figure 11. Exhaust Shaft Motion (After Eisenmann 6)
constants. Vibration data are filtered
using a synchronous tracking filter.
Polar/Bode Plots
The polar plot (Figure 12), alsocalled a Nyquist diagram, is a plot ofamplitude versus phase during machinestart up. This plot is made by plotting
* the real and imaginery components of thevibration as speed increases. It showsthe system resonances and criticalspeeds, as loops, more distinctly thanthe Bode plot (Figure 13). The Bodeplot is the conventional plot of ampli-tude and phase versus speed during ma-chine start up. These plots are used todetermine machine critical speeds andstructural resonances during start upand coast down. The mass unbalance isused as the excitation and the true ma-chine characteristics are obtained. Thepolar plot can also be used for balan-ing.
Cascade Plot
A cascade plot (Figure 14) or vi-bration amplitude versus frequency Figure 12. Polar Plot (After Eisenmann 6 )
76
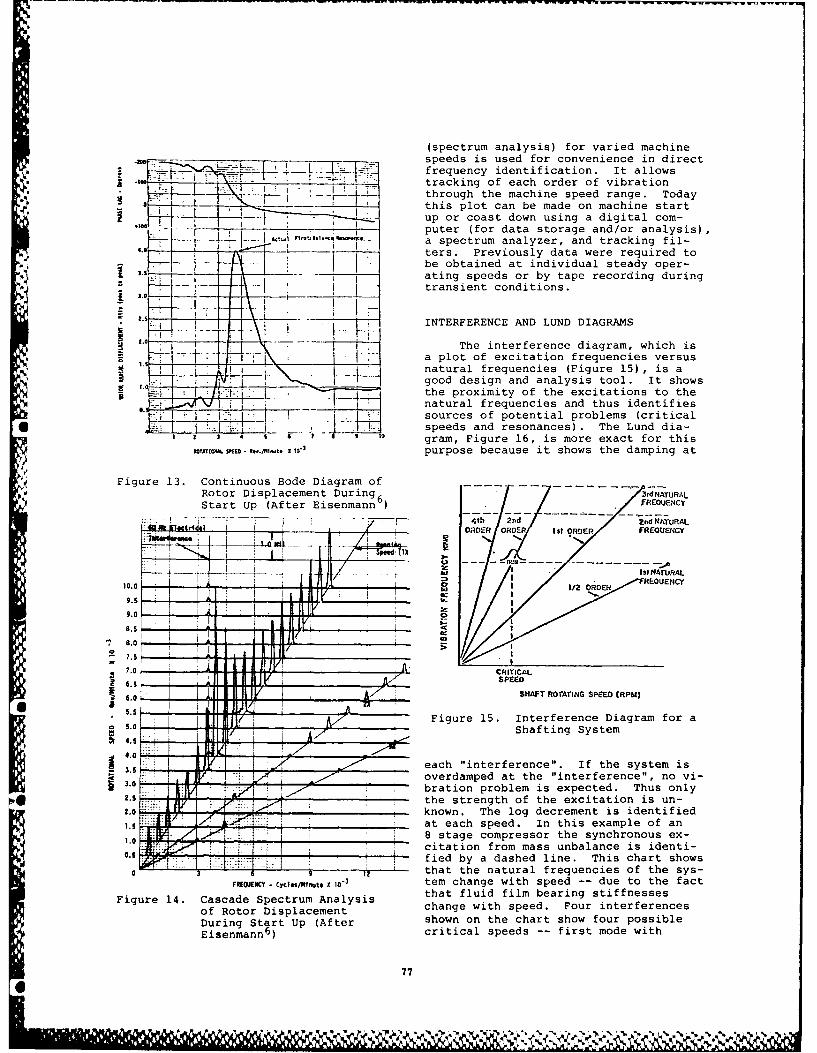
(spectrum analysis) for varied machinespeeds is used for convenience in direct
"----I I 7 14 frequency identification. It allows£ IC Ll i " ltracking of each order of vibration
through the machine speed range. Today.-i _. l.i . .' I| ' j .this plot acan onbe made on machine start--- -up or coast down using a digital com-
puter (for data storage and/or analysis)a spectrum analyzer, and tracking fil-
l- T I ters. Previously data were required to-- _+_- -1 - I I be obtained at individual steady oper-
S.'ating speeds or by tape recording duringZ4 - - transient conditions.
.\INTERFERENCE AND LUND DIAGRAMS
... -- ,i...... L -i " ' . ... "1The interference diagram, which isa plot of excitation frequencies versusnatural frequencies (Figure 15), is agood design and analysis tool. It shows
the proximity of the excitations to thenatural frequencies and thus identifies
0.--_- _ .... sources of potential problems (critical* i -iW i. speeds and resonances). The Lund dia-
1 0 $ - - - gram, Figure 16, is more exact for thisT ,Tnt g-.,.,l, ,e
IIV purpose because it shows the damping at
Figure 13. Continuous Bode Diagram ofRotor Displacement During6 3r-rAT URLStart Up (After Eisenmann ) FREQUENCY
f 4th 2nd Znd NATUPALtrdl 1ORDER ORDER Ist ORDER FREOIUECY
9. 1 1 I
I ,1
"I E i
9.0 - 0
8.5 1- F
a.0
.0 A.CRITICALa16 I SPEED
6. 11 A A SHAFT ROTATING SPEED (RPNI)
6 -~___ __I Figure 15. Interference Diagram for a, * Shaftinq System
3each "interference". If the system is....0 . 1 overdamped at the "interference", no vi-
-. -, bration problem is expected. Thus onlyS-the strength of the excitation is un-2.0 ... _ known. The log decrement is identified
- at each speed. In this example of an. . - ,8 stage compressor the synchronous ex-
citation from mass unbalance is identi-0.5 - fied by a dashed line. This chart shows
_.. ._.._.._.__ _1__ that the natural frequencies of the sys-
FREQUEKNC- Cycln/R/nut X0-3 tem change with speed -- due to the fact
Figure 14. Cascade Spectrum Analysis that fluid film bearing stiffnessesof Rotor Displacement change with speed. Four interferences
During Start Up (After shown on the chart show four possibleEisenmann 6 ) critical speeds -- first mode with
77
0 " - ','% "'. ."' ." 5' ,' . ,
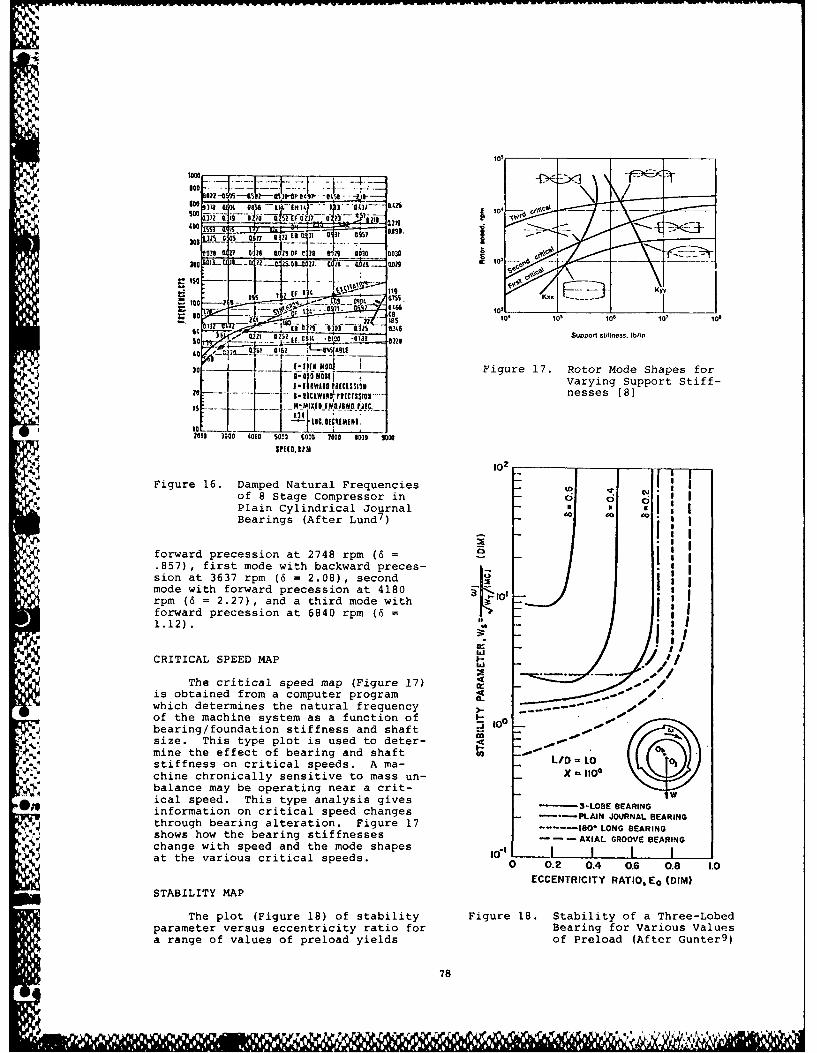
400
179 Z7 0 06 1ZOF C0 28 29 9030 U030 Io S IN200 iol.- A- -of2 Lz ZSL"U1. a9 UZ 0 9 (96009-
-497 OL6 to"S tO, to log lo l (,
6C 1%, b '- .- ij 912,5 034Ku Lut16 421.._OZ2 E CO4 -1CO -011 0211Support stAifnss. in~
2 9 1 0190 i U'sltO[9r --- 7- - -r--
_0__os Figure 17. Rotor Mode Shapes for-. Ji~0WIBFIC9SI03Varying Support Stiff-
S.0~wurl -~o-- nesses [8]-- I4H-MI9I IWO19WOlPaC.
lo00 1000 COCO 9000 0000 7000 6000 1000
102
* Fiqure 16. Damped Natural Frequenciesof 8Stage Compressor in
-* ~Plain Cylindrical Journal *~ I:Bearings (After Lund7 ) to t
forward precession at 2748 rpm (6=.857), first mode with backward preces-sion at 3637 rpm (6 =2.08), second_ :mode with forward precession at 4180rpm (6 = 2.27), and a third mode with oforward precession at 6840 rpm (6 =.
80.7 ~CRITICAL SPEED MAP -II
The critical speed map (Figure 17)-is obtained from a computer program at-which determines the natural frequency 01 . .of the machine system as a function of -bearing/foundation stiffness and shaft -0size. This type plot is used to deter-amine the effect of bearing and shaft )LD Ostiffness on critical speeds. A ma- L/ 00 0Ochine chronically sensitive to mass un- (O110balance may be operating near a crit-ical speed. This type analysis gives -3-LOSE SEARINGinformation on critical speed changes --- PAIN JOURNAL BEARINGthrough bearing alteration. Figure 17 ----- lao. LONG BEARING
* S. ~shows how the bearing stiffnesses--AILROE AINchange with speed and the mode shapes -- -i XILGOOEBERN
at the various critical speeds. 0- 0.2 0. 0. 0.1 .
ECCENTRICITY RATIO. E0 (DIM)
STABILITY MAP
The plot (Figure 18) of stability Figure 18. Stability of a Three-Lobedparameter versus eccentricity ratio for Bearing for Various Valuesa range of values of preload yields of Preload (After Gunter9 )
78

data on the zones of machine operation 5. Eshleman, R.L., "The Role of Sum andwhere stability problems might be en- Difference Frequencies in Rotatingcountered. This type analysis almost Machinery Fault Diagnosis, "Proceed-requires a map for each individual ma- ings of the Second Internationalchine because it is dependent on bear- Conference on Vibrations in Rotatinging configuration and shaft flexibility. Machinery, Cambridge, UK, September,The plot shown in Figure 19 shows a 1980, Mechanical Engineering Publica-stability map (logarithmic decrement vs tions, Ltd., Bury St. Edmunds, Suf-rotor speed) for stiffness supports and folk, UK, pp 145-149.cross coupled stiffnesses. A logarith-mic decrement denotes instability. 6. Eisenmann, R., "Shaft and CasingNote that the absence of negative cross Motion of Large, Single Shaft, Indus-coupling leads to a stable machine, trial Gas Turbines," Proceedings of
Machinery Vibration Monitoring andAnalysis Seminar, Vibration Institute,April 1979.
7. Lund, J.W., "Stability and DampedCritical Speeds of a Flexible Rotorin Fluid Film Bearings," ASME Paper
I5 s No. 73-DET-103, ASME Vibrations Con-S 1 10.9w rpm I iference, 1973.
0.3 8. Jackson, C. and Leader, M., "RotorCritical Speed and Response Studies
Increaingl in Equipment Selection," Vibration
stable Institute Machinery Vibration Moni--14 . "Sf°ct Opntoring and Analysis Seminar, April
0.0 -1979.
01 couplin I-- 9. Gunter, E.J., "Rotor-Bearing Stabil-i
i i "Unsable,
-0L2 I ity," Proceedings of the First8 .000 9.000 10.000 11.000 12.000 13.000 14,000 15.000 Turbomachinery Symposium, Texas A&M
Rotorspeed.rpm University, October 1972.
Figure 19. Stability Map for 8-StageCentrifugal Compressor [81
REFERENCES
1. Taylor, J.I., "Identification ofGear Defects by Vibration Analysis,"Proceedings of Machinery VibrationMonitoring and Analysis Seminar,Vibration Institute, April 1979.
2. Eisenmann, R., "Data PresentationTechniques for Trend Analysis andMalfunction Diagnosis," VibrationInstitute Machinery Vibration Mon-itoring and Analysis Seminar,February 1978.
Po- 3. Taylor, J.I., "Evaluation of"M Machinery Condition by SpectralNAnalysis," Proceedings of Machinery
Vibration Monitoring and AnalysisSeminar, Vibration Institute,April 1980.
4. Ehrich, F.F., "Sum and DifferenceFrequencies in Vibration of HighSpeed Rotating Machinery," J. Eng.Ind., Trans ASME, 94 (1) pp 181-184, Feb. 1972.
79

SHAFT VIBRATION MEASUREMENT
AND ANALYSIS TECHNIQUES
Donald E. Bently, PresidentBently Nevada Corporation
Minden, Nevada, USA
The use of electronic instrumentation for the measurement and analysisof rotating machinery has advanced greatly over the last fifteen years.Of the available vibration measurement transducers, the displacementproximity probe is most widely used on critical equipment. However,there are still some applications for the case-mounted transducers,velocity sensors, and accelerometers. For the purpose of machinery
4 analysis, several hard copy data presentations are available. Data0 formats for steady-state machine conditions include oscilloscope time
base waveforms and orbits and frequency spectra. For data from ma-chines under transient conditions, the formats include Polar, Bode',cascade or waterfall plots, and change in average shaft centerlineposition.
The use of electronic instrumentation for to assess a machine's mechanical condition.measuremcnt and analysis of rotating ma- Data formats for steady-state measurementschinery has advanced greatly over the last include oscilloscope time base waveforms andfifteen years. In today's market, the old- orbits and vibration frequency spectra.time vibration measurement techniques using Transient formats include Polar, Bode', andscrewdrivers, balancing coins on edge, and cascade or waterfall plots, and change inusing the human senses of sight, sound, and average shaft centerline radial position.touch, are rarely used. Most critical ma-chines have electronic sensors permanently TRANSDUCER CONSIDERATIONSinstalled with continuous readout and alarm(or shutdown) monitoring systems. Less cri- Proper instrumentation must begin with thetical machines may be observed with scanning- correct choice of measurement transducers.type microprocessors, or checked periodically The three basic dynamic motion (vibration)with portable instrumentation, transducers are the accelerometer, velocity
transducer, and displacement proximity probe.Whenever a vibration measurement indicates a Of these, the proximity probe can also bemachine problem, a separate array of instru- used for static (or average) position
* mentation is available to specially condition measurements. The choice of which transducerthe vibration signal for analytical eval- to use must be based on many factors. Amonguation of the machine's dynamic behavior, these are the characteristics related toIn addition to vibration amplitude (which is electronic design such as physicalthe parameter measured by conventional moni- environment, frequency response, engineeringtoring systems), these special instruments units of measurement, signal conditioning,evaluate vibration phase angle, frequency, and signal-to-noise ratio. However, a moretime base waveforms, shaft orbits, and mode important consideration is the desired typeshapes. Machines can be analyzed in a of measurement, from a mechanical standpoint,steady-state (constant speed, load, pressure, based on the behavior of the particularflow, etc.) or transient condition (changing machine. There is a basic mechanical dif-speed or other variables). ference between transducer types, and this
difference should be a primary factor inThe end result of any data acquisition proce- determining the choice of transducer.dure on rotating machinery must involve the Accelerometers and velocity transducersdocumentation of information processed by the measure machine housing motion with respectinstrumentation into various hard copy to free space (seismic or inertiallyformats. It is this hard copy documen- referenced); proximity probes measure rela-tation that the mechanical engineer must use tive motion and position, typically shaft
81

relative to bearing or bearing housing. When mounted to observe the shaft radially,it measures both radial vibration and average
The choice of transducer type usually depends shaft radial position relative to the journalon which part of the machine will provide the bearing clearance; an axially installed probemost reliable information for machine malfunc- measures axial vibration as well as axialtion diagnosis, the shaft or the housing. The shaft position with respect to the thrustmost frequently occurring malfunctions are bearing clearance. Proximity probes, whenshaft related. These include unbalance, observing a once-per-turn shaftexternal and internal preloads such as discontinuity, can also be used to measuremisalignment, axial thrust action, surge, shaft rotative speed and provide a referencecavitation, radial and axial rubs, thermally for measuring vibration phase angle. Aand mechanically bowed rotors, coupling radial probe mounted some lateral distanceproblems, gear wear, self-excited mechanisms, away from the bearing can measure the amountlubrication loss, electrical problems in of shaft bow or eccentricity at shaft slowmotors and generators, and cracked shafts, roll speeds.blades, and impellers. Generally, housingrelated malfunctions occur less frequently and Since the most common machinery vibrationinclude bearing support failure, excessive problems are shaft related (unbalance, rubs,piping forces, housing and foundation misalignment, etc.), shaft measurements areresonances, insufficient foundation support, generally more reliable for overall machineloose structural components, foundation protection monitoring systems or periodicmaterial failure, and thermal warpage of the machine measurements and provide morehousing or baseplate. Most machine problems, meaningful information for machine malfunc-therefore, are manifest as a change in shaft tion diagnosis. Many rotating machines, par-rather than housing motion. ticularly those with fluid film bearings,
generate much more shaft motion relative toSometimes shaft-generated motion may be suf- the bearing or bearing housing than absoluteficiently transmitted for measurement on the bearing housing or machine casing motion.housing. How much shaft motion energy istransmitted to the housing is a function of The only major limitation when using proxi-the mechanical impedance of the shaft/bearing/ mity probes concerns the quality and naturehousing system. Mechanical impedance is of the shaft surface to be observed by thedetermined by the system stiffness, damping probe. Ideally, the probe should observe aand mass relationships of the rotor/support surface equal in finish to the shaft bearingsystem. In some situations, both shaft motion journal. Surface imperfections such asrelative to the housing and housing motion scratches, dents, rust, and out-of-roundnessrelative to free space may be significant. In produce mechanical runout (Glitch) whichthese cases, a proximity probe and a seismic appears as a noise component on the outputtransducer should be used in the same plane of signal of the Proximitor. In addition, themeasurement, proximity transducer system is affected by
changes in magnetic and conductive propertiesIf a machine is equipped with permanently of the shaft surface material. "Spotinstalled monitor system, and if the trans- magnetism", a concentrated magnetic field atducers used for monitoring have been properly one point on the shaft circumference, mayselected, then they should be suitable for produce a false signal output from theanalytical measurements also. However, the Proximitor (electrical runout). If surfaceanalysis of some machines and/or certain conductive (resistivity) properties changemalfunctions may require different transducers significantly from one point on the shaftin addition to those used with the monitor circumference to another, this may also causesystem. Transducers selected for a monitor electrical runout.system are intended to indicate the presenceof only the most frequently occurring poten- Such changes in surface resistivity may ori-tial malfunctions. If this situation can be ginate from metallurgical changes, surfaceanticipated, it is much better to have the hardness variations, heat treatments, certaintransducers permamently installed or at least grinding or finishing techniques, and platinghave permanent provisions for installation on or spray metalizing processes. Some shaftthe machine. No transducer can provide surface treatment techniques, such asmeaningful data if the installation technique burnishing, have been used effectively foris questionable. the reduction of electrical runout.
Displacement Proximity Probe Velocity Transducer
A proximity probe (Figure 1) measures relative Velocity transducers (Figure 2) are ofmotion displacement and is typically installed seismic design and are thus used to measureto measure shaft motion with reference to the machine housing and structural vibration.bearing or bearing housing. The typical frequency response is from 15 Hz
to 2 kHz. Velocity is also a function ofThe typical frequency response is from zero Hz frequency so the velocity transducer may tend(dc) to 10 kHz, thus it measures static (or to emphasize higher frequency motions andaverage) position as well as dynamic motion, overlook lower frequency vibrations. For
82I

lower frequency applications, integrating the accelerometers. mlso, because accelerometersvelocity signal to displacement may help this have such a broad frequency response, it issituation. For measurements at very low usually necessary to use a filter(s) forfrequencies, particular attention should be meaningful vibration signal analysis.paid to the amplitude and phase errors of the Frequency spectrum analysis is often man-transducer at the frequency of interest. datory when using accelerometers. Likewise,Machine housings undergo vibration from when used with a monitor system, filtering isstructural excitations and resonances as well sometimes required in the monitor.as shaft-transmitted motion. Many differentfreqLencies may be present in the overall Dual Probesignal so that frequency measurement orspectrum presentations are often required for The dual probe (Figure 4) is a combinationanalysis. relative proximity probe and seismic velocity
transducer mounted at the same radial andIf a particular machine exhibits significant lateral location on a machine. Ideally, thehousing motion which is transmitted from the seismic transducer is mounted to the sameshaft, then a velocity transducer may be use- reference position on the machine structureful for the measurement of overall machine as the relative proximity probe. In thisvibration. It may be useful to integrate the installation, the seismic transducer measuresvelocity signal to displacement for this vibration associated with the structure uponapplication. Also for this application, the which the proximity probe is installed. Thevelocity transducer is generally more resulting information from this transducersuitable than an accelerometer, provided the arrangement consists of: (1) Shaft motionvibration frequencies do not exceed its relative to the bearing housing, (2) Averagecapabilities. The only major disadvantage is radial shaft position relative to the bearingthe mechanical (spring/mass/damper) construc- housing, (3) Absolute bearing housing motiontion of the transducer. Some deterioration and (4) Shaft absolute motion. The first twocan be expected over a period of time even measurements are those normally associatedduring normal use, so a velocity transducer with the use of a proximity probe transducerusually requires a calibration check more system. The third measurement is that whichoften than most types of accelerometers, is normally associated with a velocity trans-
ducer system mounted on the bearing housingAccelerometer or probe support structure. The fourth
measurement is obtained by electronicAccelerometers (Figure 3) are inertially integration of the velocity signal toreferenced transducers, and as such, measure displacement, and a vectorial summation ofabsolute machine housing or structural motion the dynamic signals from the proximity proberelative to free space. lhe typical frequency and integrated velocity transducer. Thisresponse is from 5 Hz to 20 kHz and sometimes vectorial summation consists of the shaft tohigher for special models. At first, this may bearing housing relative dynamic motion andseem like such a broad frequency range that an the bearing absolute dynamic motion andaccelerometer could be used for all machine yields a signal representative of the shafthousing vibration applications. In fact, this absolute motion, or shaft dynamic motion withis not the case because acceleration is a respect to free space.function of frequency squared, and at low fre-quencies of vibration the amplitudes of acce- The dual probe is somewhat analogous to theleration are very small. The amplitudes may shaft rider transducer. A shaft rider con-be so small that the signal will be lost in sists of a mechanical rod which is placed inthe noise level of the transducer. For contact with the shaft member and is directly
* example, if a 9o0 rpm fan has a synchronous attached to a velocity transducer. The shafthousing vibration of 5 mils peak-to-peak rider provides a direct measurement of shaftdisplacement, this yields about 0.05 g's zero- motion with respect to free space, or shaftto-peak acceleration. At a typical accelero- absolute vibration. The dual probe, however,meter sensitivity of 100 mV/g zero-to-peak, is much more than a shaft rider. A shaftthe signal output amplitude would be only 5 rider provides a measurement of shaft abso-millivolts zero-to-peak. However, at high lute motion only, whereas the dual probe pro-frequencies, even low displacement amplitudes vides this measurement in addition to the
0* produce high acceleration amplitudes. Thus, other three measurements listed above. Also,accelerometers have some difficulty measuring the shaft rider suffers from two mechanicallow frequency motion, but are often best for systems, the shaft rider itself which mustvery high frequency vibration. Therefore, it transmit shaft energy directly to the trans-is difficult to apply accelerometers as the ducer, and the mechanical spring/mass/damperonly transducer type used for overall eval- system associated with a velocity pickup.uation of machine vibration characteristics. The Dual probe contains only one of these
mechanical systems, that associated with theAccelerometers can be used quite effectively velocity transducer. For these reasons, thefor the exclusive measurement of high fre- dual probe technique is replacing the shaftquency vibrations. The measurement of most rider systems on most machines which requirevibrations above 3 kHz require the use of shaft absolute motion measurement.
83
I

Applications suitable for the use of a dual at IX, the Bode' plot is sometimes called anprobe are those in which there is both signi- "unbalance response plot". The Bode' plotficant shaft motion relative to the machine reveals information related to several fun-housing and machine housing motion relative damental rotating machinery characteristics.to free space. On some machine designs, the Among these are":majority of shaft dynamic motion is greatlyattenuated by the time the energy reaches the 1. The overall response of the rotor tomachine housing. In this case, there will be unbalance forces from zero rpm up tosignificant shaft motion relative to the operating speed.housing and very little housing motion rela-tive to free space. In other machine 2. The extent of rotor bow by measuringconfigurations, the majority of shaft dynamic amplitude and phase at slow roll speeds.motion is transferred directly to the machinehousing. In this case, there may be very 3. The definition of actual balance resonantlittle shaft motion relative to the housing frequency (critical speed) by determiningand more significant housing motion relative the rotor speed at which an amplitudeto free space. The above two cases may be peak and phase shift occur.satisfactorily measured with a proximityprobe in the first case, and a velocity 4. The available system damping by measuringtransducer in the second case. However, some the height of the amplitude peak atmachine designs produce shaft dynamic motion resonance.and machine housing motion which are bothsignificant in magnitude. For these A similar XY plot can be made using thesituations, shaft relative, bearing housing Digital Vector Filter in the direct orabsolute, and, therefore, shaft absolute unfiltered mode. This plot represents ampli-motion should be measured. It is for these tude of the overall composite (including alltype of applications that the dual probe is frequency components) vibration signal as aintended, function of rpm. Comparing this to the Bode'
plot will reveal the presence of any vibra-A brief summary of the basic advantages and tion frequency components which are not atdisadvantages of each of the three types of shaft rotative speed.transducers is provided in Table I. Themajority of these considerations relate to The Polar plot (Figure 6), as the namethe electronic (or mechanical) design of the implies, is on polar format and is obtainedtransducer itself. However, remember that from the same data as the Bode' plot (rpm, 1Xthe most important considerations when amplitude, and phase). The difference isselecting a specific transducer type is what that the Polar plot represents this infor-mechanical measurement is most desirable on mation as vector quantities, which they arethe machine. To determine this, machine on the actual working machine. The distaebehavior must be evaluated (or estimated) in from any point on the plot (length of vector)terms of shaft and housing vibrations under represents the vibration amplitude; the angu-both normal operating and malfunction lar position of any point on the plotconditions. (direction of vector) represents the phase
angle. The Polar plot reveals the sameTRANSIENT DATA information listed above for the Bode' plot
and, in addition, it provides:Typically, transient data is acquired duringmachine start-up or coastdown when rotor 1. A clearer picture of the changing vector
* speed is changing as a function of time. Two response of a rotor through a resonantof the data formats in this category, Polar speed region. (Certainly, the approxi-and Bode' plots, display synchronous (X) mate 180 degree phase shift is easier tovibration amplitude and phase angle versus see on Polar format.)rotor speed. This information is availablethrough the use of a once-per-revolution 2. The effect of any slow roll vector, asshaft reference (Keyphasor) probe. The from shaft bow, on the measured response.transducer input signals can be from any one (the slow roll vector can be easilyof the three types, but proximity probes pro- subtracted from any point on the plot byvide the best data, since the measurement graphical vector methods).represents actual shaft dynamic motion.
3. The presence of any structuralThe Bode' plot (Figure 5) is on an XYY' resonances, which appear as inside loopsCartesian format with one X variable (rotor on the plot.speed) and two Y variables (amplitude andphase). The amplitude is determined using a 4. The phase relationship of rotor responsesynchronous tracking Digital Vector Filter, through two or more resonant speedwhich measures amplitude at shaft rotative regions.frequency (iX) only and discards all otherfrequencies. Since one of the basic rotormalfunctions, unbalance, produces vibration
84
I I
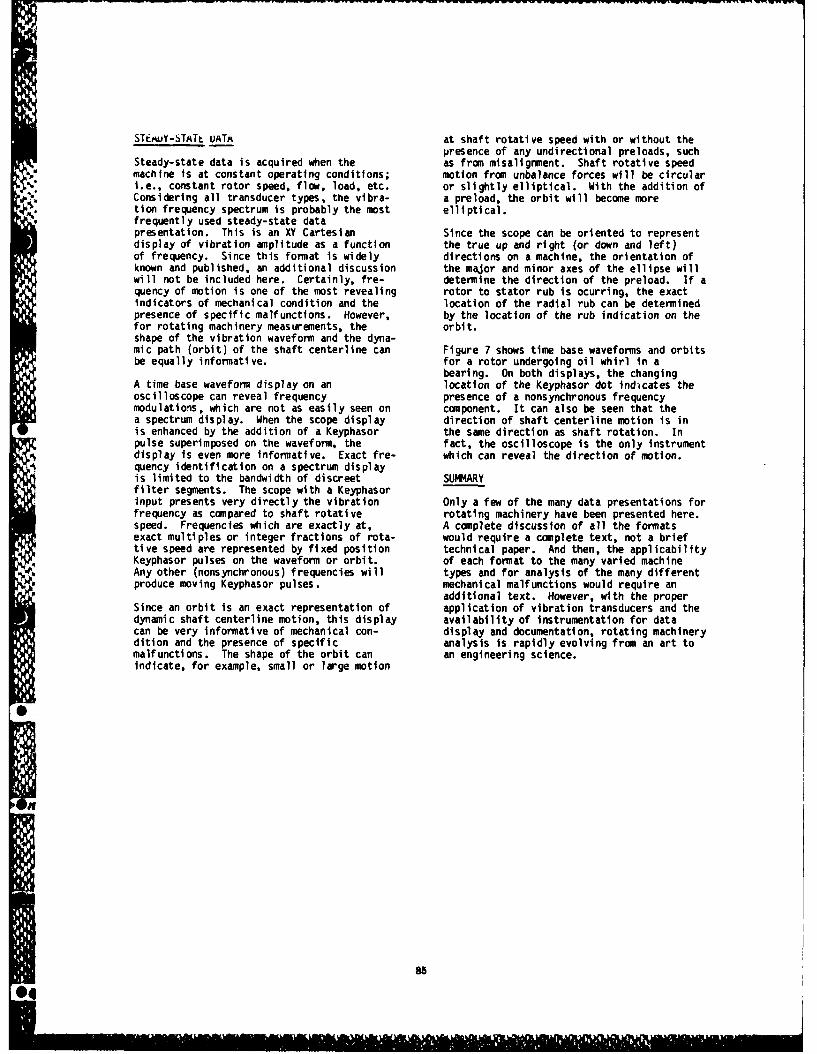
STEwuY-STATt UATA at shaft rotative speed with or without thepresence of any undirectional preloads, such
Steady-state data is acquired when the as from misalignment. Shaft rotative speedmachine is at constant operating conditions; motion from unbalance forces will be circulari.e., constant rotor speed, flow, load, etc. or slightly elliptical. With the addition ofConsidering all transducer types, the vibra- a preload, the orbit will become moretion frequency spectrum is probably the most elliptical.frequently used steady-state datapresentation. This is an XY Cartesian Since the scope can be oriented to representdisplay of vibration amplitude as a function the true up and right (or down and left)of frequency. Since this format is widely directions on a machine, the orientation ofknown and published, an additional discussion the major and minor axes of the ellipse willwill not be included here. Certainly, fre- determine the direction of the preload. If aquency of motion is one of the most revealing rotor to stator rub is ocurring, the exactindicators of mechanical condition and the location of the radial rub can be determinedpresence of specific malfunctions. However, by the location of the rub indication on thefor rotating machinery measurements, the orbit.shape of the vibration waveform and the dyna-mic path (orbit) of the shaft centerline can Figure 7 shows time base waveforms and orbitsbe equally informative, for a rotor undergoing oil whirl in a
bearing. On both displays, the changingA time base waveform display on an location of the Keyphasor dot indecates theoscilloscope can reveal frequency presence of a nonsynchronous frequencymodulations, which are not as easily seen on component. It can also be seen that thea spectrum display. When the scope display direction of shaft centerline motion is inis enhanced by the addition of a Keyphasor the same direction as shaft rotation. Inpulse superimposed on the waveform, the fact, the oscilloscope is the only instrumentdisplay is even more informative. Exact fre- which can reveal the direction of motion.quency identification on a spectrum displayis limited to the bandwidth of discreet SUMMARYfilter segments. The scope with a Keyphasorinput presents very directly the vibration Only a few of the many data presentations forfrequency as compared to shaft rotative rotating machinery have been presented here.speed. Frequencies which are exactly at, A complete discussion of all the formatsexact multiples or integer fractions of rota- would require a complete text, not a brieftive speed are represented by fixed position technical paper. And then, the applicabilityKeyphasor pulses on the waveform or orbit, of each format to the many varied machineAny other (nonsynchronous) frequencies will types and for analysis of the many differentproduce moving Keyphasor pulses. mechanical malfunctions would require an
additional text. However, with the properSince an orbit is an exact representation of application of vibration transducers and thedynamic shaft centerline motion, this display availability of instrumentation for datacan be very informative of mechanical con- display and documentation, rotating machinerydition and the presence of specific analysis is rapidly evolving from an art tomalfunctions. The shape of the orbit can an engineering science.indicate, for example, small or large motion
S
04
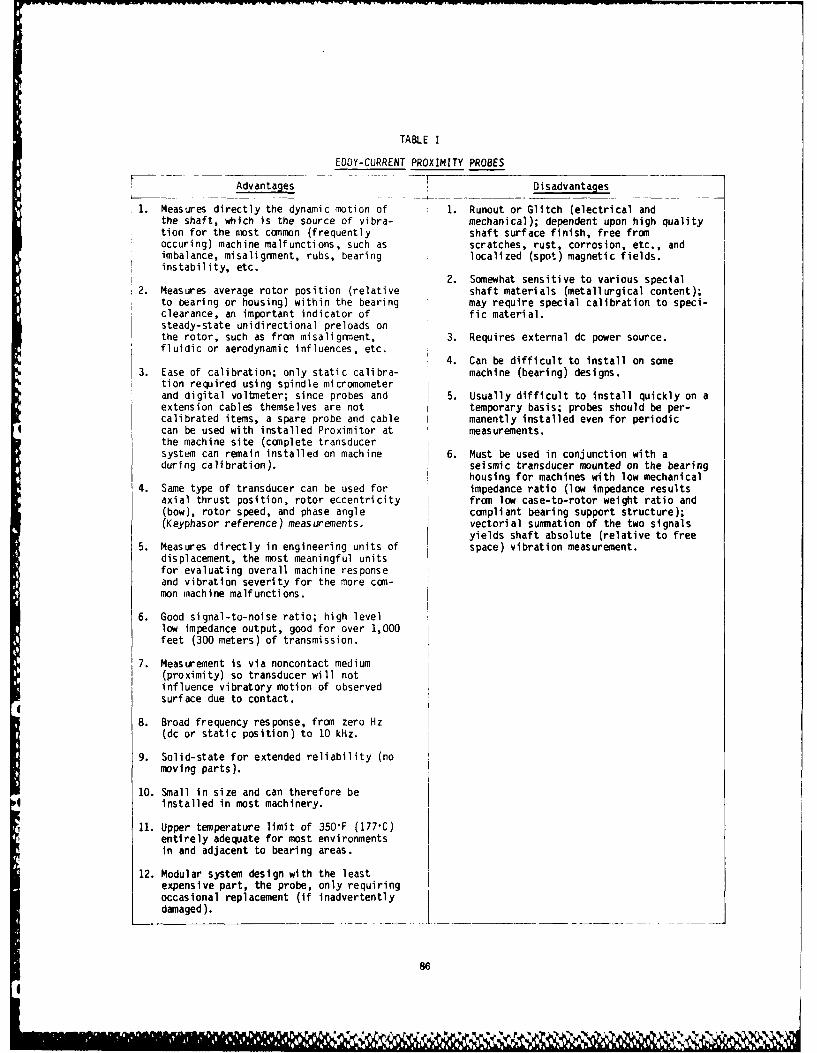
TABLE I
EDDY-CURRENT PROXIMITY PROBES
Advantages T Disadvantages
1. Measures directly the dynamic motion of 1. Runout or Glitch (electrical andthe shaft, which is the source of vibra- mechanical); dependent upon high qualitytion for the most common (frequently shaft surface finish, free fromoccuring) machine malfunctions, such as scratches, rust, corrosion, etc., andimbalance, misalignment, rubs, bearing localized (spot) magnetic fields.instability, etc.
2. Somewhat sensitive to various special2. Measures average rotor position (relative shaft materials (metallurgical content);
to bearing or housing) within the bearing may require special calibration to speci-clearance, an important indicator of fic material.steady-state unidirectional preloads onthe rotor, such as from misalignment, 3. Requires external dc power source.fluidic or aerodynamic influences, etc.
4. Can be difficult to install on some3. Ease of calibration; only static calibra- machine (bearing) designs.
tion required using spindle micromometerand digital voltmeter; since probes and 5. Usually difficult to install quickly on aextension cables themselves are not temporary basis; probes should be per-calibrated items, a spare probe and cable manently installed even for periodiccan be used with installed Proximitor at measurements.the machine site (complete transducersystem can remain installed on machine 6. Must be used in conjunction with aduring calibration). seismic transducer mounted on the bearing
housing for machines with low mechanical4. Same type of transducer can be used for impedance ratio (low impedance results
axial thrust position, rotor eccentricity from low case-to-rotor weight ratio and(bow), rotor speed, and phase angle compliant bearing support structure);(Keyphasor reference) measurements. vectorial summation of the two signals
yields shaft absolute (relative to free5. Measures directly in engineering units of space) vibration measurement.
displacement, the most meaningful unitsfor evaluating overall machine responseand vibration severity for the more com-mon machine malfunctions.
6. Good signal-to-noise ratio; high levellow impedance output, good for over 1,000feet (300 meters) of transmission.
7. Measurement is via noncontact medium(proximity) so transducer will notinfluence vibratory motion of observedsurface due to contact.
8. Broad frequency response, from zero Hz(dc or static position) to 10 kHz.
9. Solid-state for extended reliability (nomoving parts).
10. Small in size and can therefore beinstalled in most machinery.
11. Upper temperature limit of 350F (177,C)entirely adequate for most environmentsin and adjacent to bearing areas.
12. Modular system design with the leastexpensive part, the probe, only requiringoccasional replacement (if inadvertentlydamaged).
86
,%

TABLE II
VELOCITY TRANSDUCERS
Advantages Disadvantages
1. Ease of installation in that it is 1. Provides only limited information aboutmounted on external (housing) machine shaft dynamic motion (for overall eva-components. luation of machine vibration), requires
that the machine have low mechanical2. Strong signal in the mid-frequency ranges impedance.
(30 Hz to 1 kHz).2. Since mounting is on external machine
3. Self-generating, no external power source components, measurement can be influencedrequired. by vibrations transmitted to the machine
housing from the surrounding environment,
4. Can measure shaft absolsute (relative to e.g., piping, foundation, adjacentfree space) vibration when mounted to a machinery, etc.; mounting location shouldshaft rider or "fishtail". be carefully selected so measurement will
accurately reflect only vibration of the5. Adequate frequency response for overall machine itself, with minimal outside
evaluation of machines in the mid-speed influences.range.
3. Mechanical design (spring/mass/damper)
* 6. Can be temporarily installed with reaso- dictates that performance will degradenable success using a magnetic base. somewhat over a period of time under nor-
mal use.7. Some models are available for moderately
high temperatures. 4. Unit construction means that any trans-ducer fault requires replacement of
8. Velocity is relatively easy to integrate complete transducer assembly.to displacement, which is a more meaning-ful engineering unit of measurement for 5. Difficult calibration; requires removaloverall evaluation of machinery from the machine and a shaker table.vibration.
6. Amplitude and phase errors introduced atlow frequencies.
7. Cross axis sensitivity problems at highamplitudes.
__m 8. Rather large and heavy.
I
87
04
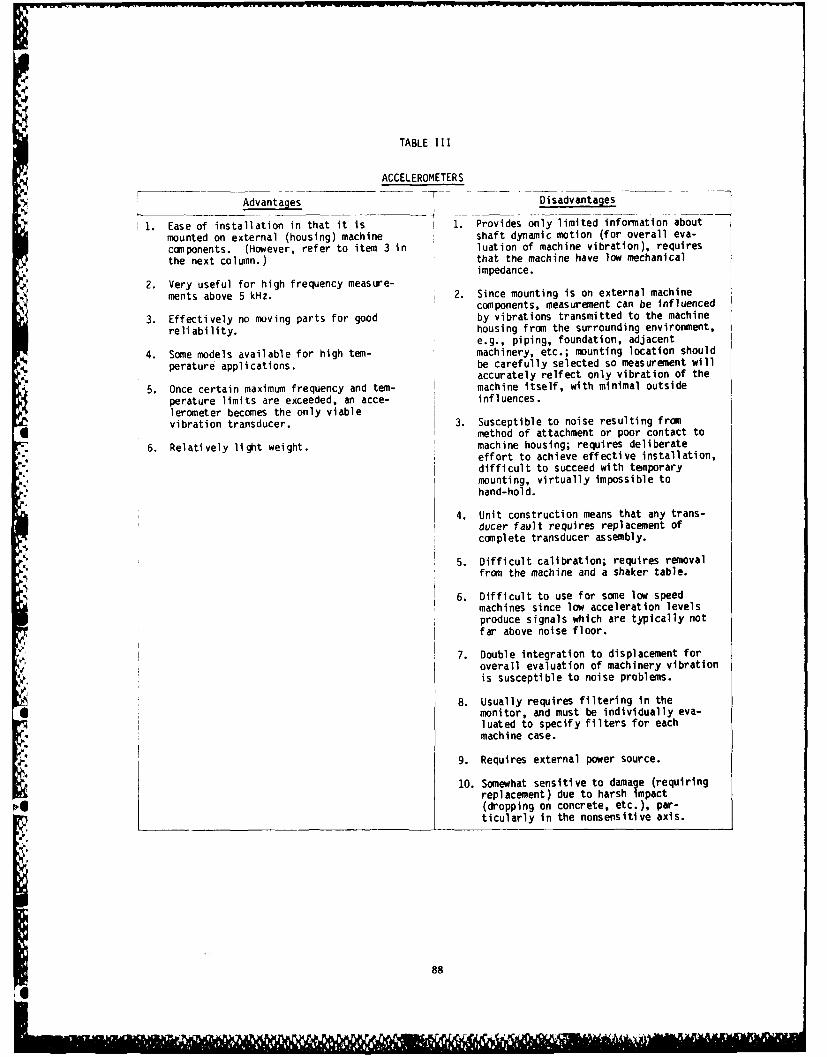
TABLE III
ACCELEROMETERS
Advantages Disadvantages
1. Ease of installation in that it is 1. Provides only limited infomation aboutmounted on external (housing) machine shaft dynamic motion (for overall eva-components. (However, refer to item 3 in luation of machine vibration), requiresthe next column.) that the machine have low mechanical
impedance.2. Very useful for high frequency measure-
ments above 5 kHz. 2. Since mounting is on external machinecomponents, measurement can be influenced
3. Effectively no moving parts for good by vibrations transmitted to the machinereliability, housing from the surrounding environment,
e.g., piping, foundation, adjacent4. Some models available for high tem- machinery, etc.; mounting location should
perature applications, be carefully selected so measurement willaccurately relfect only vibration of the
5. Once certain maximum frequency and tem- machine itself, with minimal outsideperature limits are exceeded, an acce- influences.lerometer becomes the only viablevibration transducer. 3. Susceptible to noise resulting from
* method of attachment or poor contact to
6. Relatively light weight. machine housing; requires deliberateeffort to achieve effective installation,difficult to succeed with tenporarymounting, virtually impossible tohand-hold.
4. Unit construction means that any trans-ducer fault requires replacement ofcomplete transducer assembly.
5. Difficult calibration; requires removalfrom the machine and a shaker table.
6. Difficult to use for some low speedmachines since low acceleration levels
produce signals which are typically notfar above noise floor.
1 7. Double integration to displacement foroverall evaluation of machinery vibrationis susceptible to noise problems.
8. Usually requires filtering in themonitor, and must be individually eva-luated to specify filters for eachmachine case.
9. Requires external power source.
10. Somewhat sensitive to damage (requiringreplacement) due to harsh impact(dropping on concrete, etc.), par-ticularly in the nonsensitive axis.
88! F

la. System Components:Proximitor, Extension Cable, Probe
16 -1
4 -4
X Sh
2 -0
0 L/
25 50 15 100 0 2 0 7 0
PROBE CAP -Is PROBE GAP-1
l b. Typical Signal Output 1 c. Effect of Static GapCharacteristic of Change on OutputProximitor
16~
14
12
kM V . 10
A 4 9-
-0
S 6-01
0 215 4040 6 0
in1d. Effect of Dynamic Gap 45 7 52 2
Output
Figure 1. Displacement Proximity Probe Transducer System
89
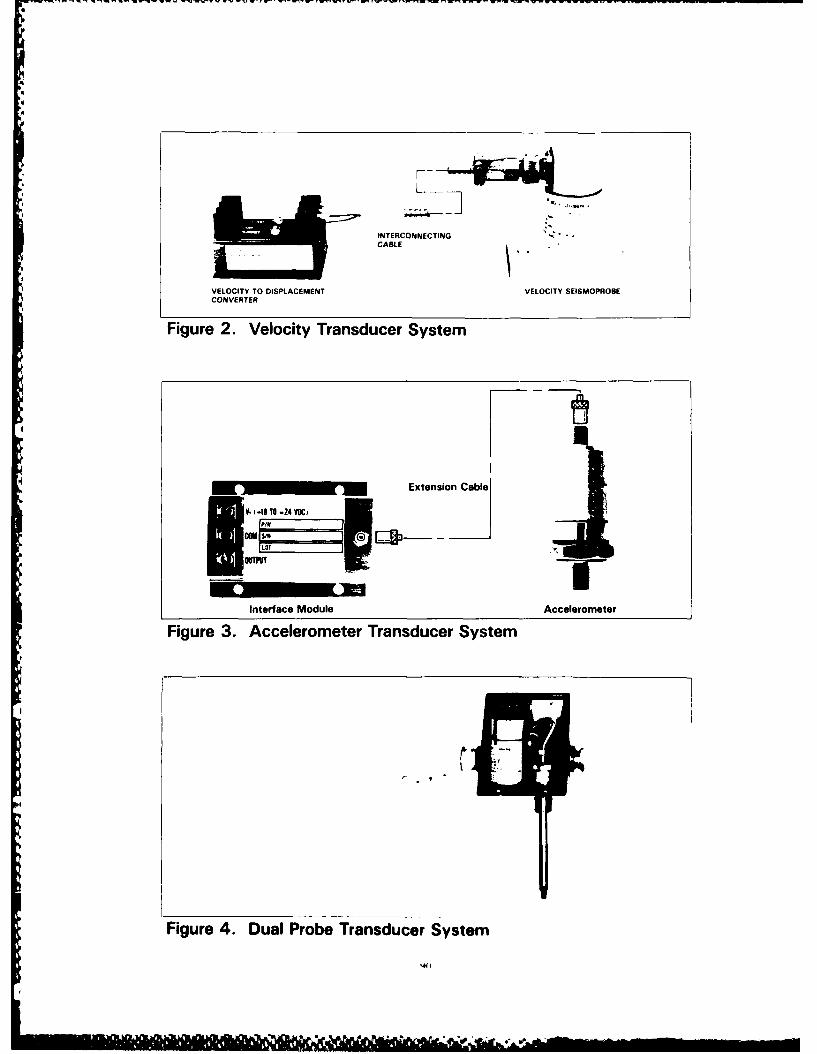
CAL
VELOCITY TO-DISPL.ACEMENT VELOCITY SEISMOPROBECONVERTER
Figure 2. Velocity Transducer System
Extension Cable
V, 18T0O-24 WK j
Interface Module Accelerometer
Figure 3. Accelerometer Transducer System
Figure 4. Dual Probe Transducer System
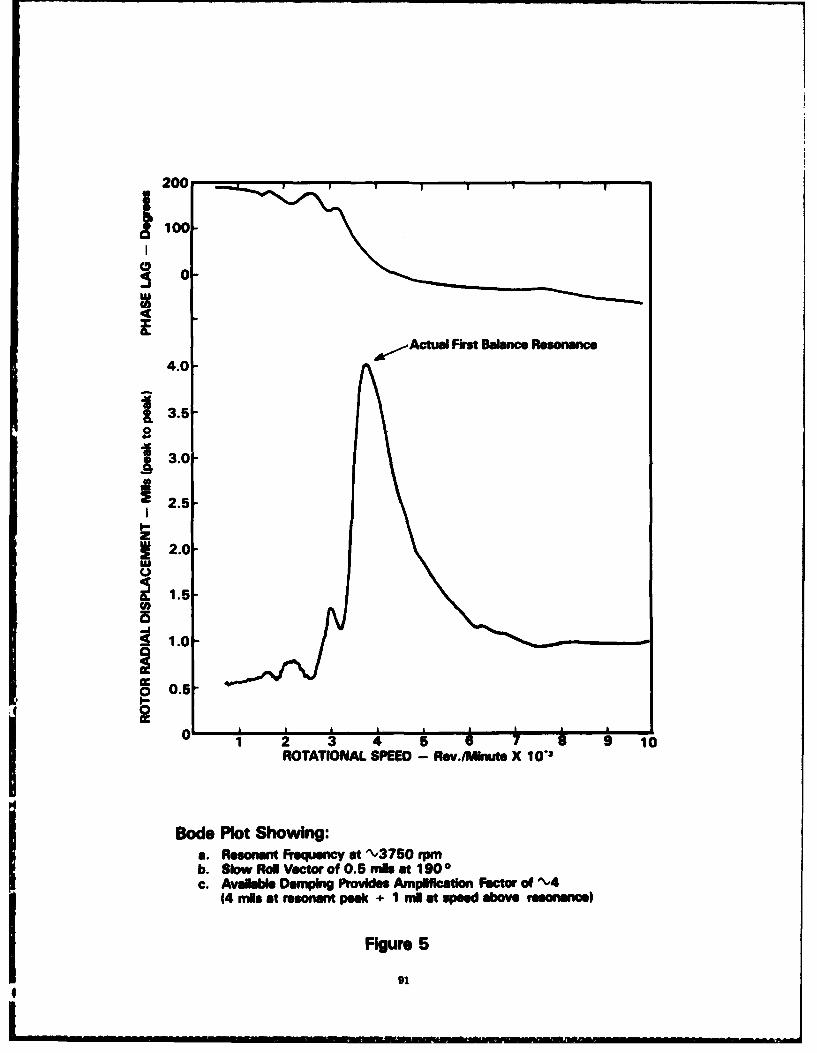
200
100-
4.0- ,,.Actual Firmt Balance Resonance
[3.5-
3.0
2.5
23.0-
12.5-
12.0-
0 .55
01 2 3 4 9 1
0 ROTATIONAL SPEED - Rev./Mlnute X 1023
Bode Plot Showing:
a. Resonant requency at "-3750 rpmb. Slow RoUVctorof 0.5 mleat 1900c. Avelable Damping Prvdes Amplification Factor of ^-4
Figure 5
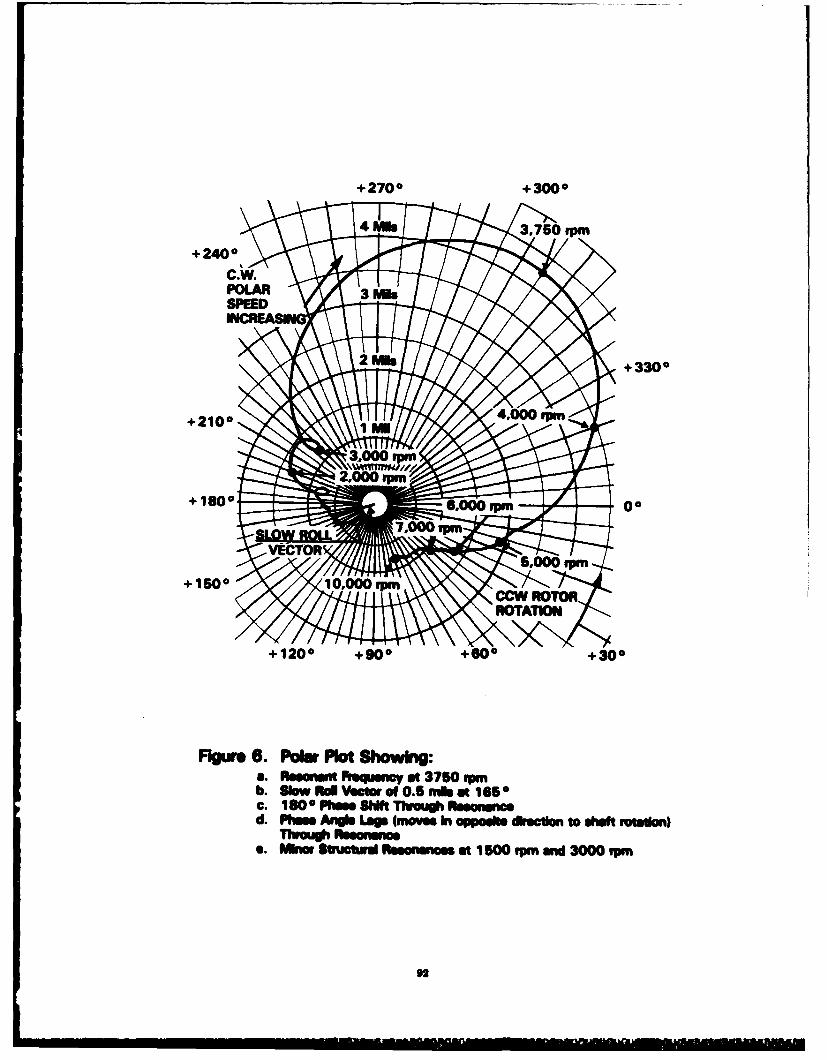
+2700 +3000
IN2+3300
+2100 wl0p1
3,1500p
+180°..2 0000 rpm 0
- VWTlOR
+1500 " 10,000 rmCCWROR
ROTATIO
+1200 +900 +600 +300
Figtw 6. Parw Plo Showing:a. Rasonm Ruqumicy at 3750 rpmb. Slow Roll Vector of 0.5 mle at 165c. SO60 Pha.. Shft Through Resona.ad. Phas. Auge Lag (mows I uppa'm dln d toa ro~tao)
Throg ft aw ce. Mino Suturd Resnancas at 1500 im and 3000 rpm
92
el
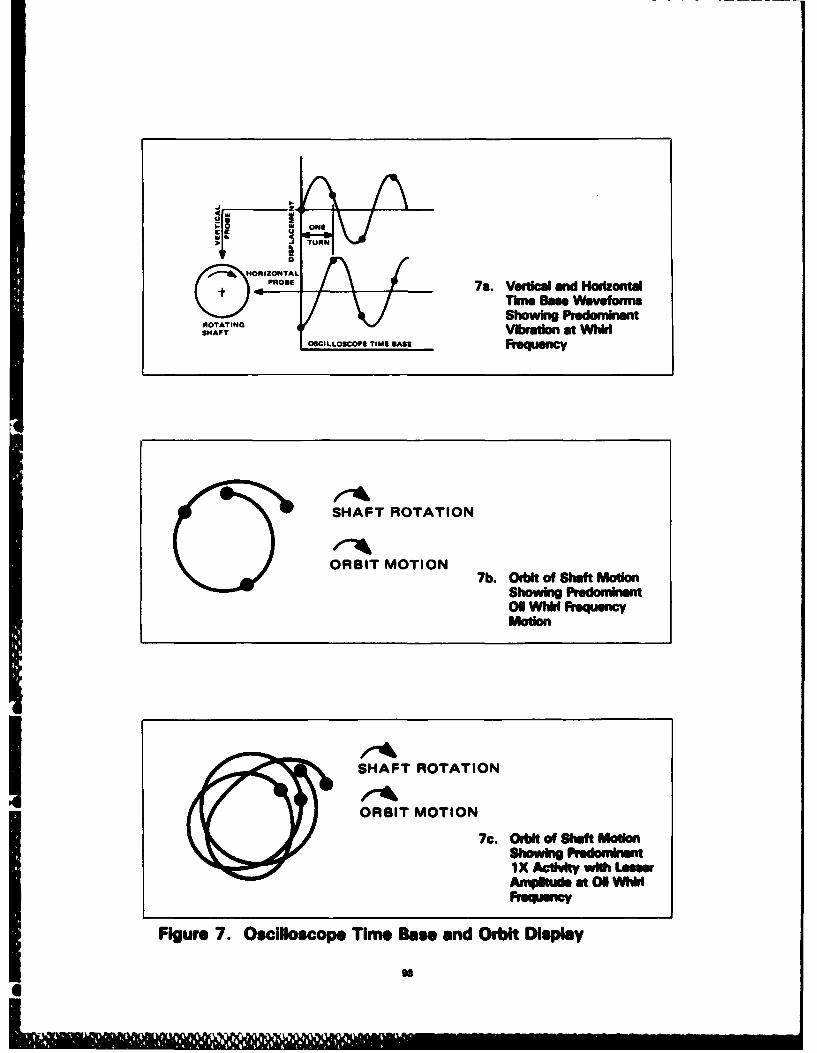
0KTAIG Shwn Ueonn
OSILOCP TURN" teieec
SHAF ROTTAO
SHAFT ROTION
7b. Orbit of Shaft MotiShowig Predomninant01 Whil requencyMotion
SHAFT ROTATION
ORBIT MOTION
7c. Orbit of Shaft MoionShwn PiefoninantI X Activity with Laerw
Ampftid. atO01WhWr
Figure 7. Oscilloscope Time Seas and Orbi Disply
ROTOR DYNAMICS AND MACHINERY VIBRATION
SPIN TEST VIBRATIONS OF PENDULOUSLY
SUPPORTED DISC/CYLINDER ROTORS
F. H. Wolff and A. J. MolnarWestinghouse R&D CenterPittsburgh, Pennsylvania
Forced vibration levels of disc and cylindrical shapedrotors as they are brought up to speed are calculated.The danger of spinning a pendulously supported rotorwhose polar and diametral mass moments of inertia arenearly equal is analyzed and explained.
INTRODUCTION have been derived in the literature[1,2,3], however, for completeness they
To design pendulously supported will be summarized. From Fig. 1A thehigh speed rotors, several vibration beam deflection (n) and slope (0) ataspects must be considered - instabili- the disc can be expressed as a functionties, unbalance vibrations, etc. Low of unbalance force (P) and moment (M).frequency whirl instabilities caused byinsufficient external (bearing) damping, n ( 11 P + a 1shaft hysteresis, and looseness of mating 1 )12 (1)rotor components must be avoided. e P + MPrevious works [1,2] which addressed the = c 1 2 2 2instability problem demonstrate how toanalyze a pendulously supported disc where the flexibility influence coeffi-system to ensure a successful design. cients of a beam of length (L), with
infinitely stiff end (A), and rigidityA disc shaped rotor has the (EI) are
property that its ratio of polar momentof inertia (Ip) to moment of inertia 1 3 _2X I 2about a diameter (Id) is 2: i.e., THE + -T-a = Ip/Id = 2. If external damping issufficient, the unbalance vibration dueto passing through the critical speeds _2 + t (t=L-X)as the disc is brought up to speed will 12 2E + Ebe small. However for some specimens,the rotor configuration appears more alike a cylinder than a disc; i.e., the a22 = Elratio of inertias decreases. Ifa = 1 or Ip = Id, the system will prob- The unbalance force andably fail as it is brought up to speed. moment can be written as 11,2,3] func-Previous failures have occurred, but tions of disc translation (r) and rota-have not been documented. The objec- tion (8)tive of this study was twofold: toexplain the failure mechanism and to P = w c2r (2)develop a program to calculate vibrationamplitudes of proposed designs. and
EQUATIONS OF MOTION FOR STEADY STATE M = - I 2- 1) (3)UNBALANCE d Id W
Equations which describe the where m is the disc mass (lb sec 2/in),motion of a pendulously supported disc w is the whirl speed (rad/sec), Q is
to

F = m C1A2 Sinlt (7)
0 C l i@P F= 9 II aSin at
H 2 T=A le E 0Sin ait
P. M Adn ddI nM. Gunl ,A as I ,MgU MosMuum amoltiw
f o Mic Whirl
Fig. 1 - Dynamic model of spin test Fig. 2 - Eccentricity of mass center (G)system (disc-shaft-bearing from geometric center whichsystem) creates force(F) and moment
unbalance T)the disc polar mass moment of inertia(in-lb-sec2 ), and Id is the disc diame- and a dynamic unbalance moment (T)tral mass moment of inertiaUn-lb-sec2 ) . T - m cI 2Q2 Sinflt (8)
To find the damped steadystate response of the disc mass due to centrifugal loads. Hence, theunbalance, complex notation (-) is used. total unbalance force and moment areThe bearing translation (Z) as a func-tion of unbalance force is P m 2 + F (9)
k+iB( and
ki BW W5 2Id2 (a 2 - 1) i + T (10)
k 2 (Bw) 2 k2+ (Bw) 2
for a = Ip/Idwhere i is imaginary (-l), k is the
bearing stiffness (lb/in), and bw is Combining equations (5) throughthe bearing damping (lb/in). The total (10) into matrix form givesdisc deflection (F) is
+ 511 C 12]k'22 11 F 22 []k 2 +(BP) 2 ( 2 1 2Lk(cm)k 2+ (D ) 2L J(11)
while the slope () is L01l2 L22J m £1C 2 0 Sinilt
am 12 + a22 (6)
whereEccentricity (Fig. 2) of the
disc center of mass gives a static ( _k .2+ . B M ~ 2unblance force (2) +(Bl -2-
9
-~IIMI .... M M :. : , ,%: r l" /, , : , ..
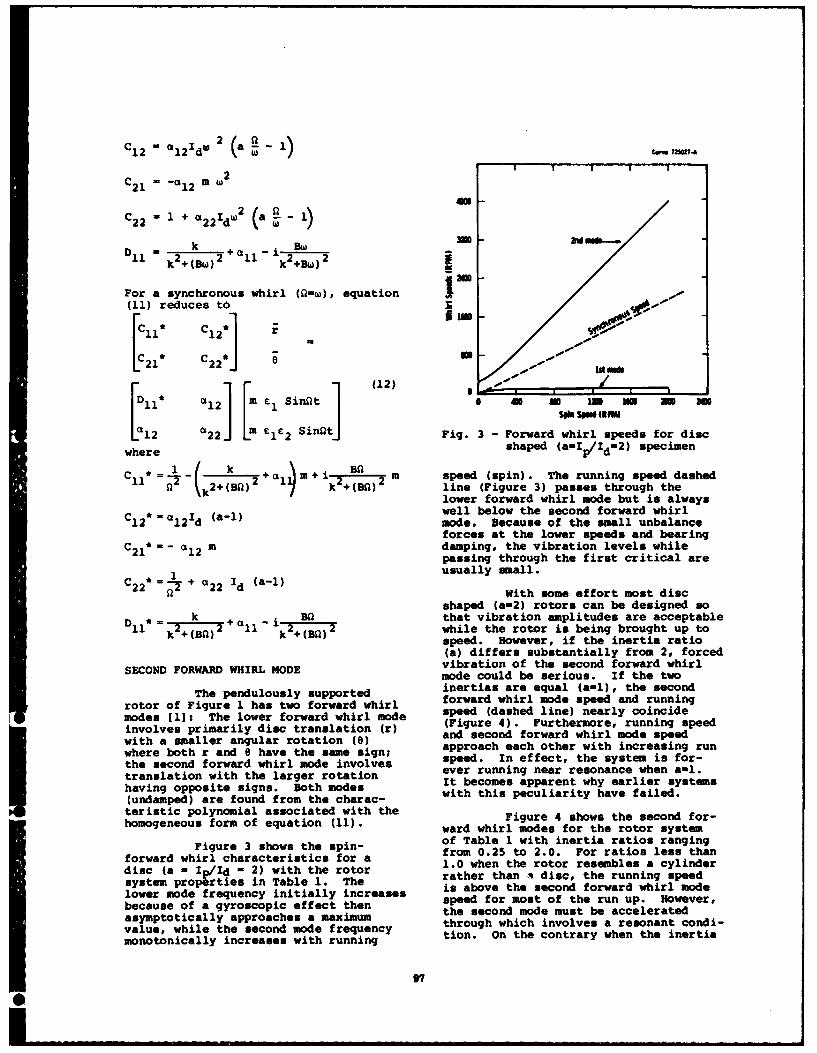
C1 CL 2 (a 2 u, 207
I I I
C2 1 = "i12 m W2
C 2 1 + CLI 2 (a2.-)
D 2k 2 +a11 '2 2 12k +(Bw) k +Bw)
For a synchronous whirl (9-w), equation 1(11) reduces to
[ 1 C1 2" r
C C - -.__ _
C2 1 .2 2 .. m(12) O _ • _ _ _ _ _ _ _ _
11 a2 mE1Sinflt 0 M M wi u
wL12 1 22 ] mlc2 Sint Fig. 3 Forward whirl speeds for discwhere shaped (a-Ilpd-2) specimen
Cl* =- k2 + l B2 m speed (spin). The running speed dashed9line (Figure 3) passes through the
lower forward whirl mode but is always(-1)well below the second forward whirl
C12 *= c1 2Id amode. Because of the small unbalanceforces at the lower speeds and bearing
C21 - 12 m damping, the vibration levels whilepassing through the first critical areusually small.
C2 2 = + 22 d With some effort most disc
shaped (a-2) rotors can be designed so
D = k + i that vibration amplitudes are acceptable11D k 2+(B)2 11ll k2+(BO)2 while the rotor is being brought up tospeed. However, if the inertia ratio
(a) differs substantially from 2, forced
SECOND FORWARD WHIRL MODE vibration of the second forward whirlmode could be serious. If the two
The pendulously supported inertias are equal (a-l), the second
rotor of Figure 1 has two forward whirl forward whirl mode speed and runningmodes 11]: The lower forward whirl mode speed (dashed line) nearly coincideinvolves primarily dictasain() and second forward whirl mode speedinvlve prmarly isctraslaion(r) (Figure 4). Furthermore, running speed
with a smaller angular rotation (0) and ec h other whir easpeed
where both r and 8 have the same sign; approach each other with increasing run
the second forward whirl mode involves speed. In effect, the system is for-
translation with the larger rotation ever running near resonance when a-l.having opposite signs. Both modes It becomes apparent why earlier systems(undamped) are found from the charac- with this peculiarity have failed.
teristic polynomial associated with the Figure 4 shows the second for-homogeneous form of equation (11). ward whirl modes for the rotor system
Figure 3 shows the spin- of Table 1 with inertia ratios rangingwire hw t he s in- from 0.25 to 2.0. For ratios less thanforward whirl characteristics for a 1.0 when the rotor resembles a cylinderdisc (a - Ip/ld - 2) with the rotorra h r t n di c t e ru i g sp d
system properties in Table 1. The rather than s disc, the running speed
lower mode frequency initially increases ss above the second forward whirl modebecause of a gyroscopic effect then speed for most of the run up. However,asymptotically approaches a maximum the second mode must be accelerated
value, while the second mode frequency through which involves a resonant condi-monotonically increases with running tion. On the contrary when the inertia
97
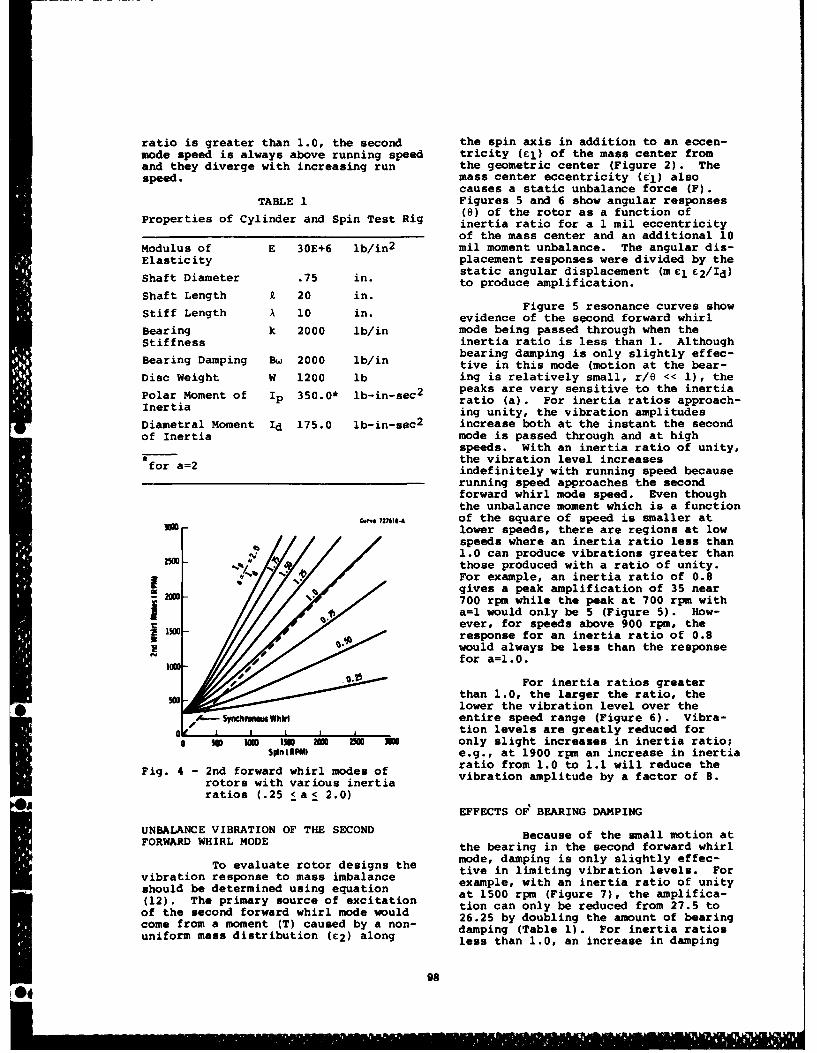
ratio is greater than 1.0, the second the spin axis in addition to an eccen-mode speed is always above running speed tricity (El) of the mass center fromand they diverge with increasing run the geometric center (Figure 2). Thespeed. mass center eccentricity (tl) also
causes a static unbalance force (F).TABLE 1 Figures 5 and 6 show angular responses
(8) of the rotor as a function ofProperties of Cylinder and Spin Test Rig inertia ratio for a 1 mil eccentricity
of the mass center and an additional 10Modulus of E 30E+6 lb/in 2 mil moment unbalance. The angular dis-Elasticity placement responses were divided by the
Diameter .75 in. static angular displacement (m £1 E2/Id)Shaft Dto produce amplification.Shaft Length . 20 in.
Figure 5 resonance curves showStiff Length X 10 in. evidence of the second forward whirlBearing k 2000 lb/in mode being passed through when theStiffness inertia ratio is less than 1. Although
bearing damping is only slightly effec-Bearing Damping Bw 2000 lb/in tive in this mode (motion at the bear-
Disc Weight W 1200 lb ing is relatively small, r/6 - 1), the
Polar Moment of Ip 350.0* lb-in-sec2 peaks are very sensitive to the inertiaIneoa n ratio (a). For inertia ratios approach-Inertia ing unity, the vibration amplitudesDiametral Moment Id 175.0 lb-in-sec 2 increase both at the instant the secondof Inertia mode is passed through and at high
speeds. With an inertia ratio of unity,* the vibration level increasesfor a=2 indefinitely with running speed because
running speed approaches the secondforward whirl mode speed. Even thoughthe unbalance moment which is a function
c... nsie-A of the square of speed is smaller atlower speeds, there are regions at lowspeeds where an inertia ratio less than1.0 can produce vibrations greater than
W0 - those produced with a ratio of unity.For example, an inertia ratio of 0.8gives a peak amplification of 35 near
M -00 700 rpm while the peak at 700 rpm witha=l would only be 5 (Figure 5). How-ever, for speeds above 900 rpm, the
- response for an inertia ratio of 0.8would always be less than the responsefor a=l.0.
For inertia ratios greaterthan 1.0, the larger the ratio, thelower the vibration level over the
100, A--SynchMnosWhirl entire speed range (Figure 6). Vibra-_ 1 1 A_ I A_-_ tion levels are greatly reduced for
0 so w ISO urn rn uO only slight increases in inertia ratio;SonlIM e.g., at 1900 rpm an increase in inertia
Fig. 4 - 2nd forward whirl modes of ratio from 1.0 to 1.1 will reduce the
rotors with various inertia vibration amplitude by a factor of 8.
ratios (.25 <a< 2.0)
EFFECTS OF BEARING DAMPING
UNBALANCE VIBRATION OF THE SECOND Because of the small motion atFORWARD WHIRL MODE the bearing in the second forward whirl
To evaluate rotor designs the mode, damping is only slightly effec-vibration response to mass imbalance tive in limiting vibration levels. Forvibraion bedeereoned t ssg ib n example, with an inertia ratio of unityshould be determined using equation at 1500 rpm (Figure 7), the amplifica-(12). The primary source of excitation tion can only be reduced from 27.5 toof the second forward whirl mode would 26.25 by doubling the amount of bearingcome from a moment CT) caused by a non- damping (Table 1). For inertia ratios
-- uniform mass distribution (C2) alongdapn(Tbe1.Frirtaaioudnless than 1.0, an increase in damping
98
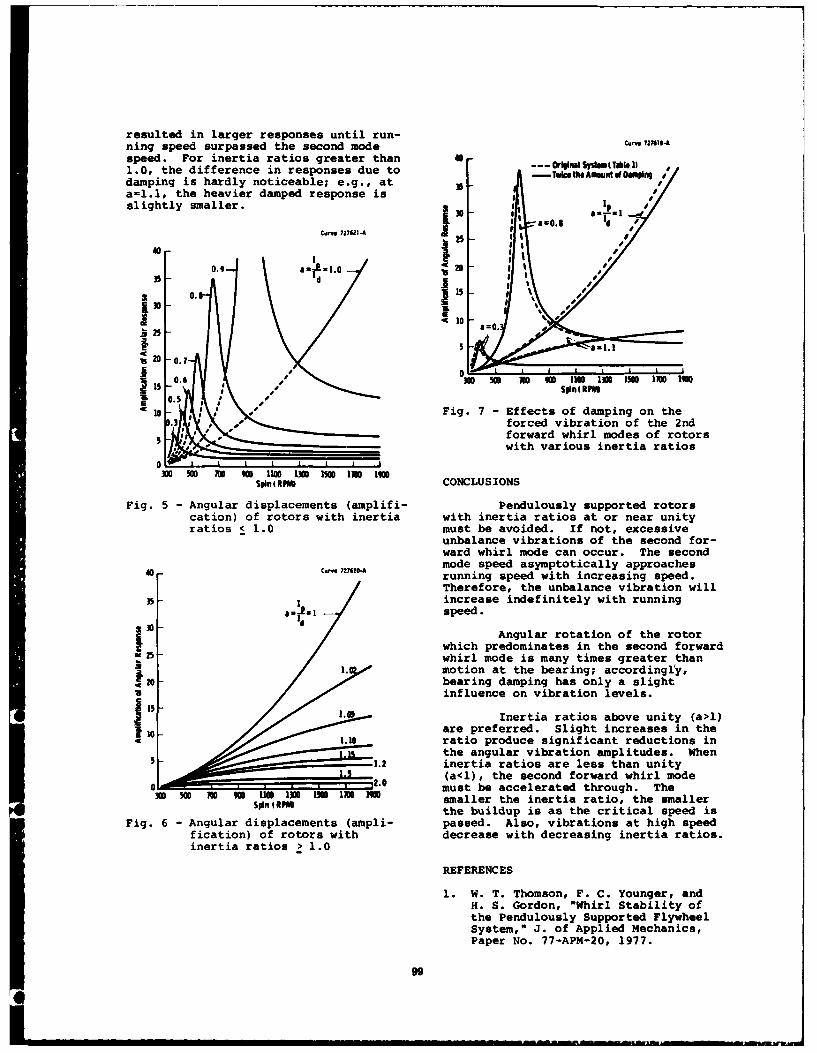
resulted in larger responses until run-ning speed surpassed the second modespeed. For inertia ratios greater than 401.0, the difference in responses due to --TntheAmdm(l.n Ddamping is hardly noticeable; e.g., at 35 t/
a=1.l, the heavier damped response isslightly smaller., " /
I I
0.9 a=k1.0 - 2
20 .
j3 IL
15 Io
J11 13MI Is i n I WO
10 / Fig. 7- Effects of damping on the.3 ,forced vibration of the 2nd5 forward whirl modes of rotors
- with various inertia ratios
0300 9W 11W0 130 Ism !0
Spn I RPM) CONCLUSIONS
Fig. 5 - Angular displacements (amplifi- Pendulously supported rotorscation) of rotors with inertia with inertia ratios at or near unityratios < 1.0 must be avoided. If not, excessive
unbalance vibrations of the second for-ward whirl mode can occur. The secondmode speed asymptotically approaches
a0 c.-.. 7fl6~o- running speed with increasing speed.Therefore, the unbalance vibration will
35 increase indefinitely with runningaz~eslspeed.
Angular rotation of the rotorwhich predominates in the second forward
25 whirl mode is many times greater than1. motion at the bearing; accordingly,
F20 bearing damping has only a slightinfluence on vibration levels.
1.03 Inertia ratios above unity (al)
1 - are preferred. Slight increases in the0.10 ratio produce significant reductions in
the angular vibration amplitudes. When51.2 inertia ratios are less than unity
(a<l), the second forward whirl mode00 must be accelerated through. The
W s no 9W 11M In I 135 19M smaller the inertia ratio, the smallerson I RPA4 the buildup is as the critical speed is
Fig. 6 - Angular displacements (ampli- passed. Also, vibrations at high speedfication) of rotors with decrease with decreasing inertia ratios.inertia ratios > 1.0
REFERENCES
1. W. T. Thomson, F. C. Younger, andH. S. Gordon, "Whirl Stability ofthe Pendulously Supported FlywheelSystem," J. of Applied Mechanics,Paper No. 77-APM-20, 1977.
99

2. P. H. Wolff, A. J. Molnar,G. 0. Sankey, and J. H. Bitzer,"Lateral Instability During SpinTests of a Pendulously SupportedDisc," Shock ai l Vibration Bulletin,No. 50, 1980.
3. J. P. Den Hartog, "MechanicalVibrations," 4th ed., McGraw-HillBook Co., New York, 1956.
100
I 4 ' ' '" "'''""l T ' ' ... r .. r " !
MODAL ANALYSIS AS A TOOL IN THE EVALUATION
OF A TURBINE WHEEL FAILURE
Anthony L. Hoffa Robert L. Leon
Franklin Research Center Franklin Research Center
Philadelphia, PA Philadelphia, PA
Modal Analysis can be a viable tool in the This paper follows these guidelines, andinvestigation of turbine wheel failures. With illustrates by techniques, examples, and actualthe advent of the portable dual channel analyzer, test data how modal analysis can play an im-and impact excitation techniques, modal data can portant part in failure evaluation.be accurately and easily taken right at the plantsite. Armed with this additional information, a 1. MODAL ANALYSIS TECHNIQUEbetter estimate of the actual failure mode canbe made. A standard impact modal technique is em-
ployed. First, one or two response acceler-Following a turbine failure, the system is ometers are applied to the structure. Just one
taken out of service, the failed parts are metal- will be used, the other serving only to insurelurgically analyzed, and the turbine is either that no potentially important modes are beingrepaired or replaced. It is during this often missed. The structure is then impacted at sev-lengthy time period that modal testing can be eral different points in orthogonal directions,performed and its evaluation used to aid in the and for each case, a frequency domain transferfailure analysis. function is determined relating the response to
the force. The natural frequencies, mode shapes,The following guidelines will be helpful in and damping factors are determined from these
this endeavor. transfer functions. Typically the modes are notwidely spaced, and some curve fitting capability
a. The modal test should be performed on is required to properly isolate them. This ca-the failed wheel, and on an unfailed pability is available in many of today's dualspare or sister wheel if possible, channel analyzers. Some also provide special
windowing for the force and response waveforms,b. The resulting mode shapes should be and in addition, many can display animated mode
compared to the actual failure, shapes viewed from any direction.
c. A review of the system excitation To illustrate the technique, we discuss thesources should be made. test of a failed control stage of the high pres-
sure turbine shown in Figure 1. The wheel isd. An investigation of turbine running composed of 36 blades, shrouded in groups of 3.
data for the possible detection of The failure, which is shown, is such that 2suspected modal frequencies should blades, the shroud and a section of the wheelbe performed. failed completely. Two other blades were
cracked at the blade root, These failuresa. Finite element and fatigue life started from the exhaust side, and analysis of
analyses should be conducted, the completely failed sections was indicativeof fatigue.
f. All the above information should bereviewed before final conclusions The frequency range of interest shouldare drawn, include as a minimum up to twice nozzle or blade
pass frequency relating to the failed stage.
101
For our example this frequency would be equal to It is possible for a test of the nature4320 Hz (36 blades x60x2). just described to be completed within a 3 to 5
day period in the field. The next phase is toSince the frequency range is broad, the review the modal data in light of the available
modal test will reveal many natural resonances. excitation sources and the actual failure mode.In order to accurately describe these differentmodes, it is necessary to allow a minimum of 12 2. EXCITATION SOURCESfrequency points within 3 dB of the peak foreach mode of interest. This procedure es- The turbine system must be reviewed totablishes the zoom ranges in which transfer determine which excitation frequencies couldfunction data is to be gathered. cause resonance of the various modes. All
stages of the turbine should be reviewed sinceIn addition, sufficient impact points must resonance of a mode at one stage can come from
be established on the structure so that accurate an excitation at another. The excitationmode shapes can be determined. For blade modes, sources for the example high pressure turbinethe size and construction of the blade will help are listed in Table 2.determine the number of impact points. Bladesshould be impacted on both the immission 3. MODE SHAPE COMPARISON TO FAILURE(leading) edge and exhaust (trailing) edge in twoorthogonal directions. If the blades are shroud- All the mode shapes should be reviewed anded into groups, all the blades within each group identified as to their type. Some of the typ-should be impacted. ical mode shapes for turbine wheels are listed
in Table 3. After the mode shapes are deter-Wheel modes are identified by their node mined they can be compared to the actual wheel
lines. In order to accurately find the nodal failure. Table 4 lists the actual modes for ourpositions, a sufficient quantity of impact example, their frequencies, and possible exci-points need to be spaced circumferentially tation sources.around the wheel. The number of impact pointsshould be at least twice the maximum number of Figures 3 through 7 illustrate some of thenodes to be detected. With this approach ali- mode shapes obtained from the analyzer. Theseasing of mode shapes still occurs for wheel plots form the basis for describing each mode.modes which have more nodal diameters than the The figures shown identify a 4 node mode.maximum we are prepared to detect. To help (Mode #4 of Table 1). The location of theovercome this problem each wheel mode must be nodes can be accurately determined relative toidentified in sequence. Figure #2 shows those a reference point on the wheel.impact points which were selected for our ex-ample. Figure 8 shows a comparison of Mode #4 to
the actual failure. Figure 9 shows a comparisonWith the use of an exponential response of Mode #5 to the actual failure. it is possi-
window in the dual channel analyzer, fewer ble that either mode could have caused theaverages are required, and usually good co- failure assuming that the stresses at the nodeherence can be obtained by impacting each point and antinode points were high enough such thatonly three times. Transfer functions formed in if the mode were excited, fatigue could resultthis manner are not truly accurate since they over an extended time period. A finite elementcontain added damping, however this is auto- analysis of the rotor section can be conductedmatically taken into account by the analyzer to help identify the maximum stress areas per-later on in the determination of the modal pa- taining to each mode shape.rameters.
Both tolerances and environment can causeTo save field time, it is desirable to pre- the modal frequencies and mode shapes to differ
program the analyzer as much as possible prior from those established by the test. Manufac-to the test. The most time saving suggestion is turing tolerances can lead to variations betweento pre-model the wheel and blade system in the corresponding wheels on two different rotors.analyzer using the selected impact points. The difference depends upon the accuracy ofChanges to this program can be made in the field construction and the material consistency.rather easily. Usually, the shape and frequency differences
for a given mode are small, but the position ofOnce the data have been recorded, the ana- the wheel node lines can be substantially dif-
lyzer will curve fit and analyze the transfer ferent.functions for each indicated natural frequency.Since all analyzers are memory limited, be sure The operating environment can have a sig-to keep the number of modes to be reviewed within nificant effect on the modal frequency, but athe capacity of the analyzer. smaller effect on its shape. Modal frequencies
vary with temperature due to modulus changes.A typical frequency and damping table is Figure #10 illustrates the effect of temperature
shown in Table 1. Also, the analyzer develops on frequency for three types of materials.a residue table for each mode. These residuesdefine the mode shape and specify the full dis- Additionally, centrifugal force tends toplacement positions in the animated display. stiffen the wheel and the blades, and also
102
I

results in an increase in the modal frequency The final necessary ingredient for highand a possible change in its mode shape. The amplitude resonance is an effective finalincrease in frequency depends on the mode shape, forcing mechanism to excite the mode. One suchbut typically blade modes are affected more than possible mechanism results from the kick eachwheel modes. blade receives as it passes each nozzle. A
blade group sees the summation of this effectIt is important to estimate the effect of from all the blades in the group, and a wheel
the above operational factors. In our example, sees the total effect from all of its blades.if the wheel material is an ascoloy, we can In all of these cases, the nozzle passing fre-anticipate a 9% reduction in the modal frequency quency is the number of nozzles in the stageif the wheel operates at 10000 F (see Figure 10). times rotational speed when evenly spacedHowever, the effect of the centrifugal force on nozzles fill the circumference. But when somethe wheel frequency is less, and can be neg- nozzles are missing, or not on, as in a controllected by comparison. stage, the true nozzle passing frequency is
determined by the nozzle spacing. This can beApplying the temperature effect to Modes 4 seen by reviewing Figures 11 through 16. Fig-
and 5, we found that these frequencies were re- ure 11 shows a simulated time plot of 32 evenlyduced to 1854 and 1956 Hz respectively. We then spaced nozzles in a 50 Hz turbine. Figure 12compared these temperature compensated fre- shows the spectrum, with as expected a 1600 Hzquencies to the excitation sources and found nozzle passing frequency along with its har-that an excitation existed on the impulse wheel monics. Figures 13 and 14 show the same twoat 1920 Hz due to nozzle pass, and from the #6- plots after the elimination of six nozzles, and#10 stages of the rotor due to blade pass. This Figures 15 and 16 after the elimination of fif-1920 Hz excitation source is very close to Mode teen nozzles. Note that in all cases, the 1600#5 (1956 Hz). Hz nozzle passing frequency along with its har-
monics remains. The added sideband energy in4. MODE SHAPE EXCITATION AND ITS AMPLIFICATION the latter two cases ia a result of the rota-
tionally repeated amplitude modulation (on orFor a particular mode of vibration to cause off) pattern of the nozzles.
fatigue failure it must be excited sufficientlyto cause high amplitude cyclic stresses. In Nozzle passing frequency, or one of itsorder for this to occur, it must have low harmonics, can usually excite a matching bladedamping, the natural frequency and driving fre- mode. But for wheel modes, which are subjectquency must be very close, and the forcing mech- to excitation by many nozzles at any one time,anism must be such as to be able to drive the it is important to determine whether they mightmode effectively. be effectively working against each other in
this endeavor. If they are, it will be dif-Thus, the mere proximity of a natural fre- ficult to excite the mode.
quency to an excitation frequency is not auto-matically a problem. In our example for in- In addition to nozzle passing frequency,stance, the control stage nozzle passing fre- blade passing frequency can be another sourcequency at 1920 Hz does not necessarily imply of excitation. Assume for the moment, only onesevere resonance of Modes 4 or 5. nozzle. As each blade passes this nozzle, it
receives a kick. Blade pass is obviously equalFirst, it is important to know the damping to the number of blades times rotational speed.
ratios. Table 1 indicates damping ratios of Though each individual blade does not see this0.215% for Mode 4, and 0.107% for Mode 5. If blade passing frequency, the wheel does. Andexcited right at their natural frequencies, in fact, the wheel sees the totality of all thethese modes would exhibit very large amplifi- blades passing all the nozzles. Thus bladecation factors, Q, equal to 232 and 466 re- passing frequency as well as nozzle passing fre-spectively. But Table 5 shows Q's of 14.3 and quency acts on the wheel. However the excita-25 for the two modes when driven at the 1920 Hz tion frequencies from these two sources have anozzle passing frequency. Here, Mode 4 was subtle difference.assumed to have a temperature corrected naturalfrequency of 1854 Hz, and Mode 5 had a temp- To best understand this difference considererature corrected natural frequency of 1956 Hz. two simplistic cases. In the case of nozzle
passing frequency, picture one blade on theTable 5 shows the effect on Q if these wheel and many evenly spaced nozzles, while in
natural frequencies were only slightly different, the case of blade passing frequency, pictureNote how a small decrease in the natural fre- many blades and one nozzle. In the first case,quency of Mode 5 from 1956 Hz to 1920 Hz would the force at the nozzle passing frequency isresult in a nearly twenty-fold increase in amp- acting on a point fixed in the wheel as thelification factor. Turning this around, if the blade passes each nozzle. In the second case,natural frequency and excitation frequency are the force at blade passing frequency is sta-not extremely close, severe resonance probably tionary, acting on the wheel at the fixed noz-will not occur. The fatigue stresses gen- zle position. To a point fixed on the wheel,erated in the wheel are greatest when the ex- however, this excitation is rotating around atcitation source and natural frequency are rotational speed. Since wheel modes are almostclosest, always fixed with respect to the rotating wheels
103
themselves, this latter condition causes blade 5. OPERATIONAL MEASUREMENTS AND ANALYSESpassing excitation frequencies to differ fromthe natural frequencies of the wheel modes The question arises as to whether, in athey excite. This concept is described in sister turbine or following repair, resonancereference 1. of any of the blade or wheel modes during op-
eration can be detected by accelerometersThe conclusions of the referenced paper show mounted on the bearing caps of the turbine.
that a given wheel mode can be excited by astationary source at two specific excitation To answer this question, one must firstfrequencies. These are dependent upon the wheel look into how the resonant blade or wheelspeed, natural frequency and mode shape ac- motion would translate into motion at thecording to the equation bearing caps. Any mode that would tend to
either bend the shaft or move it axially shouldhave some effect at the journal and thrust
F ef- F ± N F (1) bearings respectively. Obviously, symmetrice n r wheel modes fall into neither category, but
actual modal testing shows that these modes areFe = excitation frequency necessary to not always so symmetrical. For example, a 2
excite the mode nodal diameter mode instead of its radii beingseparated by 900 might actually have separation
F = natural frequency of wheel mode angles of 1050, 840, 96° , and 760. This meansthat in one half of the vibrational cycle, more
N = number of nodal diameters in the wheel mass is moving toward one end of themode shape turbine, and it reverses in the other half cycle.
This would result in both an axial and bendingF = wheel running speed effect fixed with respect to the rotating wheel.
It is important to note that just non-If we relate this to our example, the sta- symmetrical nozzle spacing can result in shaft
tionary blade passing frequencies necessary to berical noxe spct co resuoting
excite modes 4 and 5 with the wheel rotation bending, fixed with respect to the rotatingat 6 would be as follows: system. Figure 17 shows a wheel with 48 bladesat 60 Hz wand 6 unequally distributed nozzles. The blade
pass frequency is equal to 48/rev while nozzleMode Fn Temperature Compensated Fe (stationary) pass is 8/rev based on nozzle spacing (450
nuatbetween nozzles).
4 1854 [2 nodal diameters] 1854 ±(2) 60 As the wheel rotates through one revolution
- 1974 and we sum the forces on one half the wheel and1734 Hz subtract this force from the su-mation on the
other wheel half and we obtain an amplitude5 1956 [3 nodal diameters] 1956 ±(3) 60 versus time wave form similar to Figure 18.
- 2136 and The frequency spectrum of this waveform is
1776 Hz shown in Figure 19. This is the frequencycontent of the wheel vibration due to bendingthrough one shaft revolution. Note how onlyodd harmonics are generated. This is due toif one compares the 2160 Hz blade passing the mirror symmetrical nature of the waveform.
frequency to the excitation frequencies Mode 5, Also note though the dominance of the 5, 7,
which requires an excitation of 2136 Hz, could
be resonantly excited with an amplification and 9 per rev and the 47 and 49 per rev con-
factor of approximately 48. In this case, the ponents, these surrounding the 6, 8 and 48 peractual vibration frequency of the wheel, as rev frequencies one might have initially ex-actul vb train fqen fof iste wel as pected. The fact that all these order relatedSsensed by a strain gage for instance, would be components exist complicate the detection of~(2160 - 180) Hz or 1980 Hz.
any existing forced resonance.
Similar to the nozzle passing case, themultiplicity of nozzles results in additional Order related vibration components will
cancellatory effects, and blade passing fre- exist on the bearing caps due to the presencequency may be able to excite only some of the t t and t ation plan es n ther
above modes in an effective manner. tating and stationary planes but also othersources of excitation which effect the sta-
Steam flow noise can excite the free vi- tionary plane.
bration nodes of the blades and the wheel.Since the excitation is of a random nature, at co ntstwhichhesult orence
one cannot consider it to be a major source of lated components which result from resonance
failure. However, this effect may be useful in it is possible for the blades and wheels toidentifying natural frequencies during op- ring at their free vibration natural fre-eration.rigathifrevbainntrlr-etnquencies in response to random steam flow noise.
104
i I i lI 4irlllti

These frequencies are not order related and excessively in resonance.they do not show up as discrete frequencies ina spectrum. This is true because they are 6. FINITE ELEMENT ANALYSIS AND FATIGUE LIFErandomly amplitude modulated in the analysiswindow, which results in a smeared sideband If time and money permit, a finite elementeffect. Figure 20 shows this effect for the analysis can be performed which will identifyfirst bending natural frequency of a large fan the maximum stress points present in the discrotor. This frequency, which exists slightly for certain mode shapes. These points can beabove running speed, is being excited by flow compared to the failed sections. In addition,turbulence. the finite element analysis can be used with
fatigue life data to establish modal amplitudesThe same condition can and does exist in necessary to generate the stresses required to
turbines. In order to identify it however, one cause fatigue.must realize that any vibration, fixed along
one direction in the rotating frame will appear The stress levels that cause fatigue reduceto be translated by plus and minus rotational as the operating temperature increases. Thesespeed when viewed by a stationary sensor. This levels are reduced still further if coupled tois discussed in detail in reference (2). The a static tensile stress such as can be caused
concept is illustrated in Figure 21. Here a 3 by centrifugal acceleration.per rev vibration, fixed in a shaft, appear as2 per rev and 4 per rev vibrations to a sta- If we assume a certain mode to be the
tionary proximity probe, failure cause, by knowing the time of turbine
operation we can establish the number of cyclesFigures 22 and 23 show the spectra of an of stress reversal which caused the fatigue
actual free vibration mode fixed in the ro- failures. We can then relate this to an op-tating system as sensed by an axial accel- erating stress by referring to data relatingerometer at the thrust bearing. Here, both the stress, temperature, and the number of fatigueuntranslated and translated components appear; cycles.
the former because the axial components are nottranslated by rotation, and the latter because This stress can then be input into thethe radial motion is coupled to axial motion by finite element analysis to determine the amp-the support structure. Note from the two plots litudes of vibration necessary to generate the
the advantage of using order analysis to pick required fatigue stress.up discrete order components even when speed is
changing. 7. CONCLUSIONS
Order analysis might also enable one to o Modal testing is practical in the fielddetermine true operational natural frequencies with proper pre-planning.
by spotting when an excitation order such asnozzle pass, which is normally above a given o If there is a possibility that a turbinenatural frequency, excites it on start up. In blade or wheel failure can be a result
our example, Mode 4 at high temperature should of resonant excitation of a natural
be approximately 1854 Hz. The nozzle passing mode, the modes of the failed system
frequency (32/rev) goes through this frequency should be investigated.
when the turbine is running at 3,476 rpm o Analysis of this type should include:(57.93 Hz). If excitation of this mode occursduring startup, we can observe the 32/rev com- a. establishment of the mode shapesponent during startup from an axial probe b. comparison to the failure(31/rev and 33/rev from a radial probe), and c. investigation of excitation sourceslook for sudden changes in magnitude and phase. d. identification of mode frequencyBy noting the exact turbine speed at which this changes due to environmentaloccurs, one could more closely pinpoint the conditionstrue operational natural frequency of the sus- e. investigation of major stress areaspected mode. and life expectancy
Review of the accelerometer data as dis- o Analysis of running vibration data could
cussed above may be helpful in gaining a better show the existence of the suspected mode
understanding of the actual failure mode, but or modes, but it becomes a very diffi-
unfortunately due to the many order related cult task to identify them. This is
frequency components that exist, this may not of data which emnstes both from ro-
be conclusive in terms of detecting and de-
fining a resonance condition during actual op- tating and stationary sources. The
eration. However. FRC is developing a tech- relationship which exists between a ro-nique aimed at doing just that (3). This tech- tating vibration source and the identi-
nique, which will not be discussed here, uses a fication of this source from a sta-
stationary dynamic pressure transducer down- tionary plane makes the analyses even
stream of the suspect wheel and through complex more complex.
signal enhancement procedures is capable of de-tecting and locating any blades vibrating
105
=

REFERENCES:
1. Homer, J.E., HacBain, J.D., Stange, W.A.,"Vibratory Response of a Rotating DiskIncorporating .Image Derotation Techniquesand Holographic Interferometry," TechnicalReport AFAPL-TR-78-62, September 1978.
2. Benko, G.B., "Notes on the Measurement ofVibrations on Rotating Systems," VibrationsIn Hydraulic Pumps and Turbines, The In-stitution of Mechanical Engineers, Pro-ceedings 1966-67, Vol. 181, Part 3A,pp. 50-54.
3. Leon, R.L. "A Doppler Technique For Detec-ting and Locating Excessively VibratingBlades In A Running Turbine," Reliability,Stress Analysis and Failure PreventionMethods in Mechanical Design, Intl. Conf.,Aug. 1980, ASNE: 1980, pp. 59-66.
Typical Impulse Wheel
36 Blades12 Groups of 3 Shroaded
D 60" I
10 6
23 14
24 11
220 19 17 16
Figure I
106

Modal Test IMPact Po1Is
Accelerometer
24 32
35022 *2 16 t
320
20 19 is I
2p io4 Ap24 u 14
p4? pt.
sidgur 2lo
107

ANIMATED WHEEL
MAX AMPLITUDE -U'4
FMOW
2.04K
215 m
x I,
WHEEL REFERENE POINTF Figure 3
ANIMATEJ1 WHEEL
MAX AMPLITUDE4
FRED OMZ)
V R P 2.04K
DAMP (%)
215m
z
x y
o HWEEL REFERENCE POINT Figure 4
108
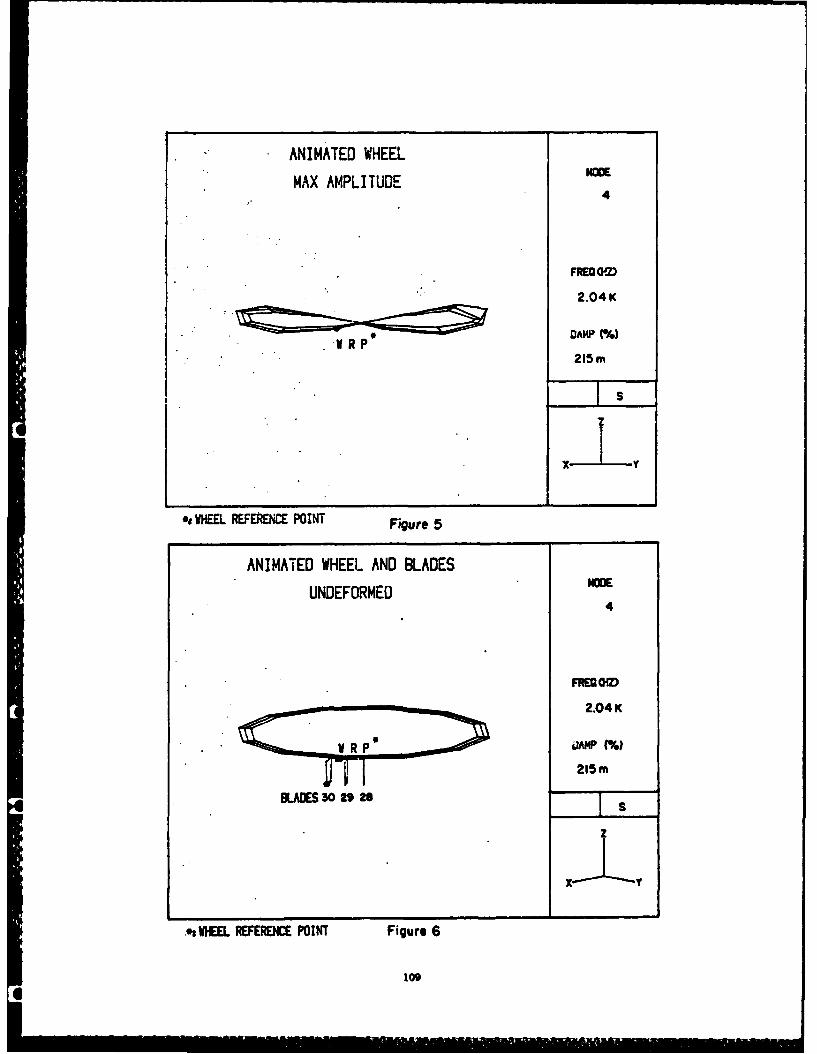
*ANIMATED WHEEL
MAX AMPLITUDE4
FRED OMZ
2.04 K
215mr
ot WEEL REFERENCE POINT Figure 5
ANIMATED WHEEL AND BLADES
UNDEFORMED MG4
FREDGM
2.04 K
V R JAWP M%
F 1 215 m
SAMS 30 29 28I
z
x VL
..,WIEEL REFERENCE POINT Figure 6
1o9

ANIMATED WHEEL AND BLADES
MAX AMPLITUDE-4
FREG GOZ
V R P2.04K
MAE30 9 2DAMP(%BLDs30a215m
*.VHEEL REFERENCE PON Figure 7
110
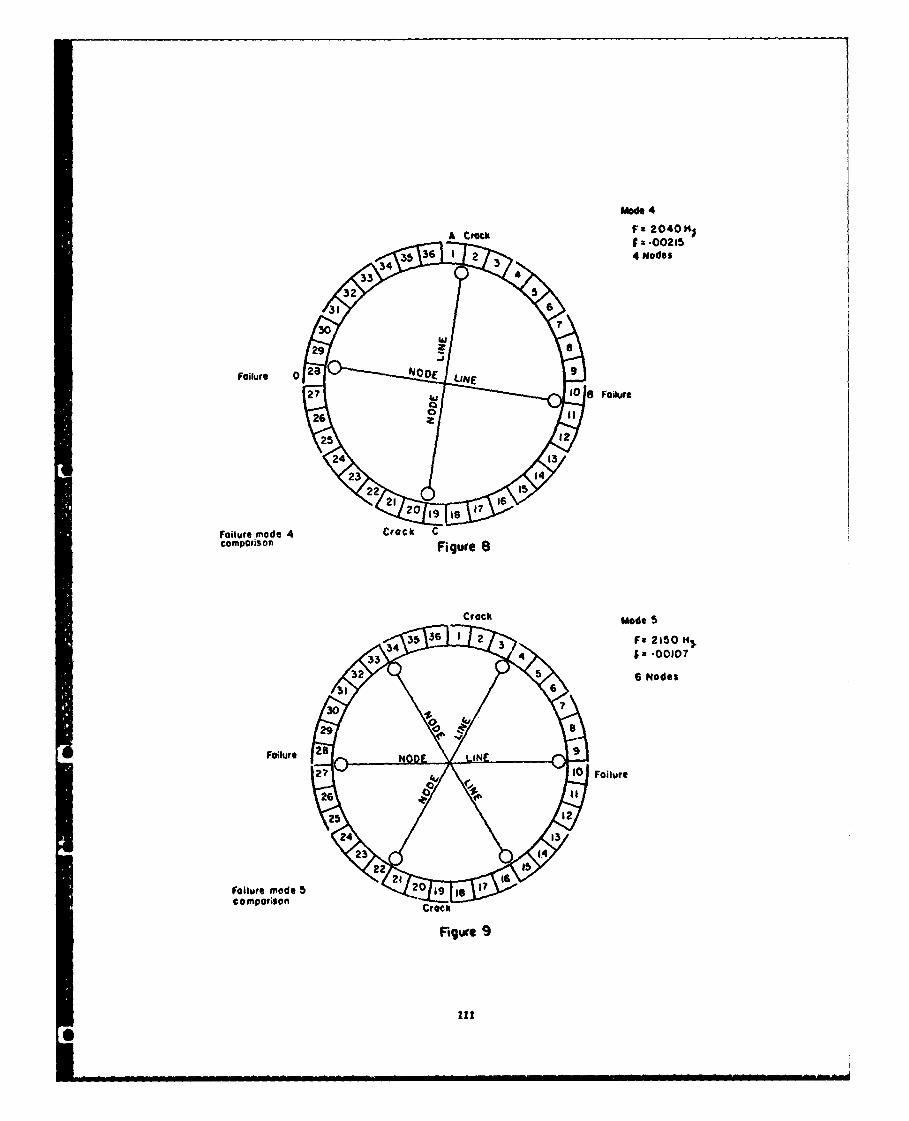
Mode 4
A Croth F 2040 M
34 3536 1 3 4 OOGIS
324 33 5
2399
Failure od 4 8 CrODE LIE
2F Failur
Fa26r moe
failureFgur 9oe4Crc
compotison iue
Crc md

K-S55378-27
10,
TII
CURVE I AVG. OF DATA FOR 871320A, 850AI25C AND 850AI25ESATISFACTORY FOR MONELS - B14 H2 AND B814 H25 TO 5000FREFERENCE FOR ASCOLOYS -M-9634 148, 156 B 157REFERENCE FOR MONELS -CH-9634035 B 038
CURVE 2 TYPE 347 STAINLESS -REFERENCE CH -8214683CURVE 3 AVG. OF DATA FOR TITANIUM FORGINGS. COMMERCIALLY PURE
To 100A B, To 15O A - REFERENCE - CH-9634077, 129, 5 162THESE CURVES ARE BASED ON CORRECTED RESULTS ISSUED BY R.F BALDWIN
ON NO. 11,1952(COPIED FROM of.-931945)
a ________IVIBRATION FREQUENCY CORRECTIONr-I FOR TEMPERATURE EFFECT
r~j ~53 78 -27
T3 Figure 10
112
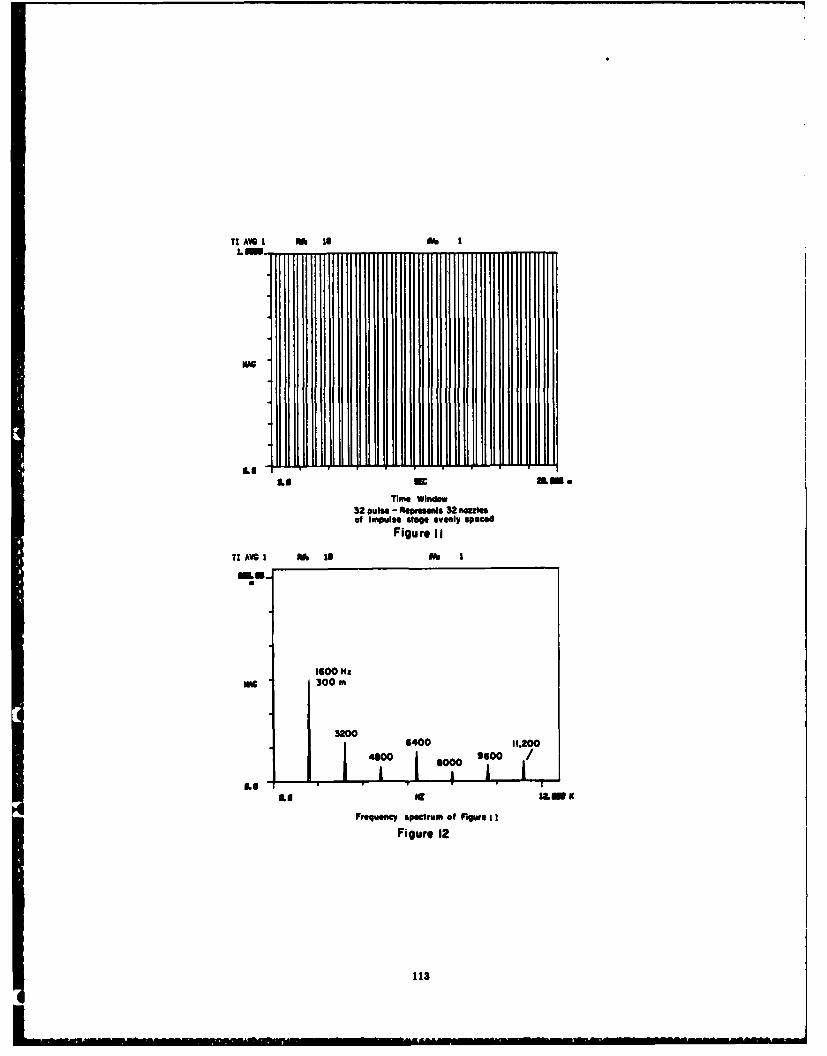
TIAVGI , ti I
NoB
II -
Ll VI " ' ' '
Time Window32 pulse - Represorus 32 notesof Impulse sloge evenly spaced
Figure I I
TI AVG I m 0 diOf I
1600 It:_ 300 m
3200 6400 11.300
4000 s0 9600
LI i A T. ;
Frequency spectrum of PIgre I i
Figure 12
113
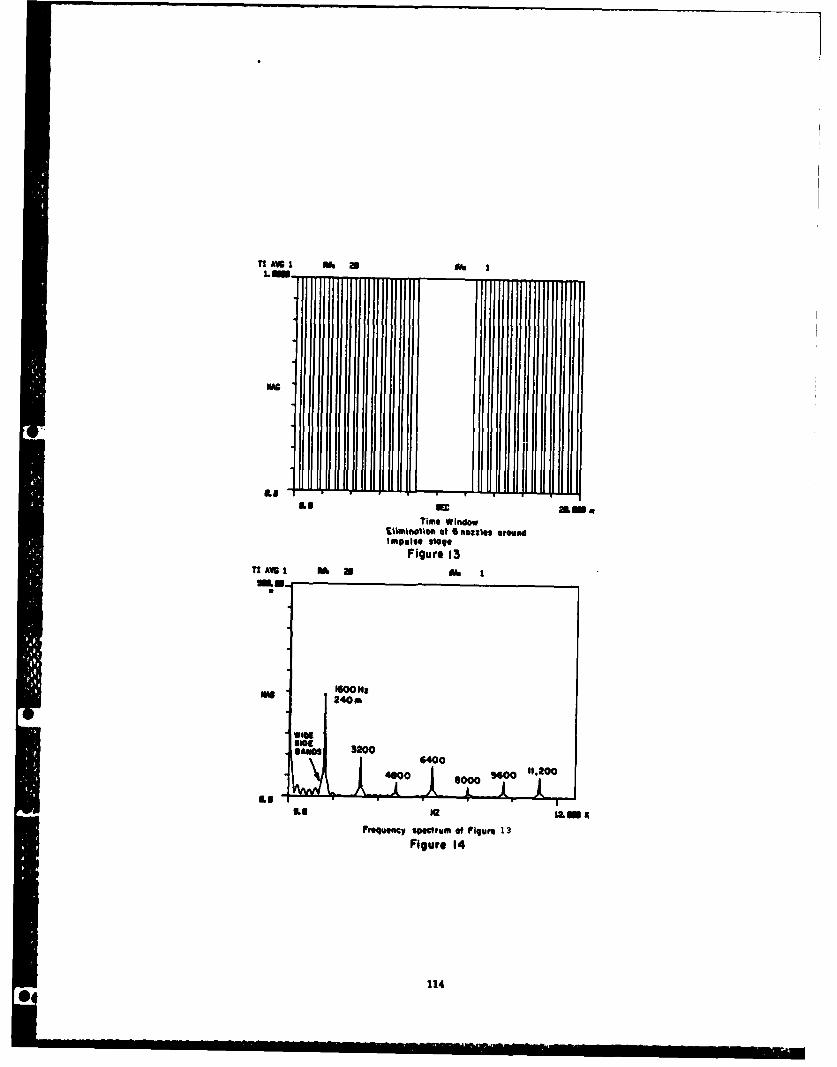
TI AVG PA a.
LinL
Tim* Windowiinotioe of 6 nozzles otvnd
impulse stageFigure 13
TIAVG 1 111 aA
Man-
mmm
WA 240.
SAWOS.2006000090
L8 off00 0 1,0
Frequeacy spectrumn of Figure Fi1r3
114

T1 AVGI Rb z1 Oh I
Time. WindowElIminaton of 5 nozzles arInImpulse stoge
Figure 15
Tl AVG 1 0 21 I
1600155 m IGO m
NK DISCRETE1550 SIDE
60. IG5 SANDSt32006040
460 1 00 140 11.20?
Frequency spectrum of Figure 15
Figure 16
115

1111se S"eg lH* Pressure Turbine
No
MeNzzlzo*%fio
6 16
4
41 NozzFeigoretio
1161
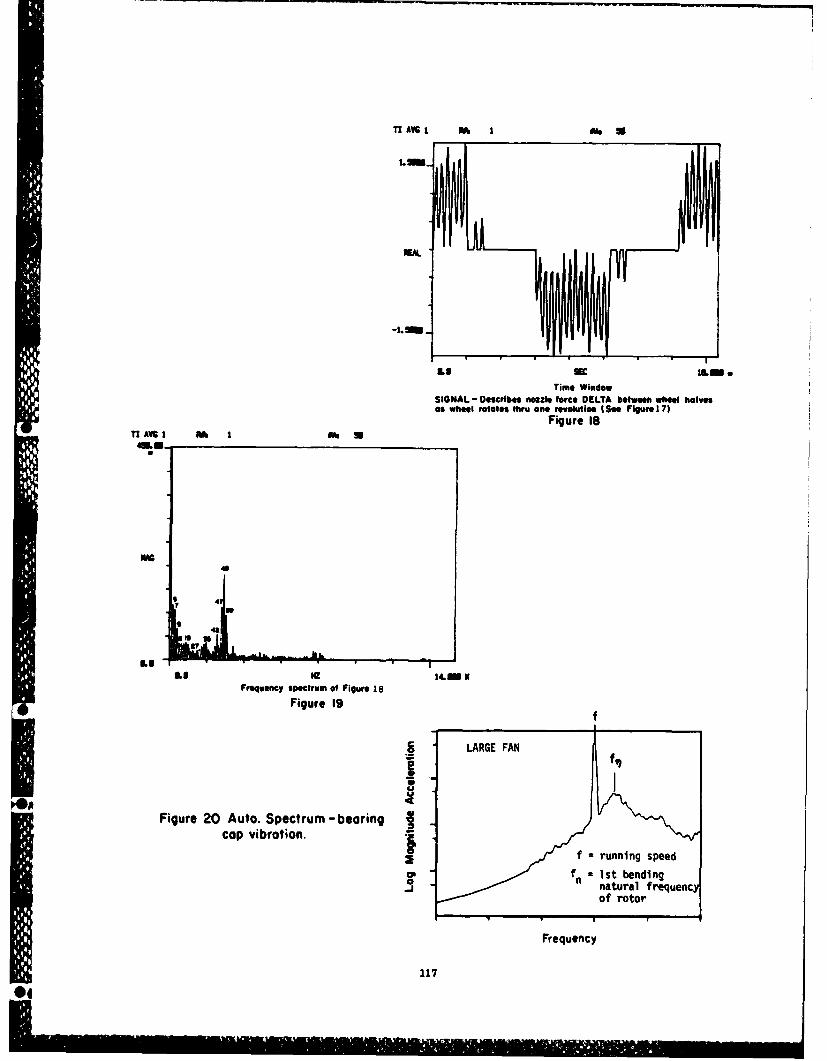
TZ AVG I p Iei
Time WindowSIGN4AL - Describes nozzle force DELTA between wheel halvesas wheel rotaes thru on* revolution (See Figure 173
Figure 18TI AVGI ph I U
A
5 40
4
31.
Frequency spectrum of figure 18a
Figure 19f
LARGE FAN
Figure 20 Auto. Spectrum - bearingcap vibration.-
f - running speed
-j natural frequencyof rotor
Frequency
117
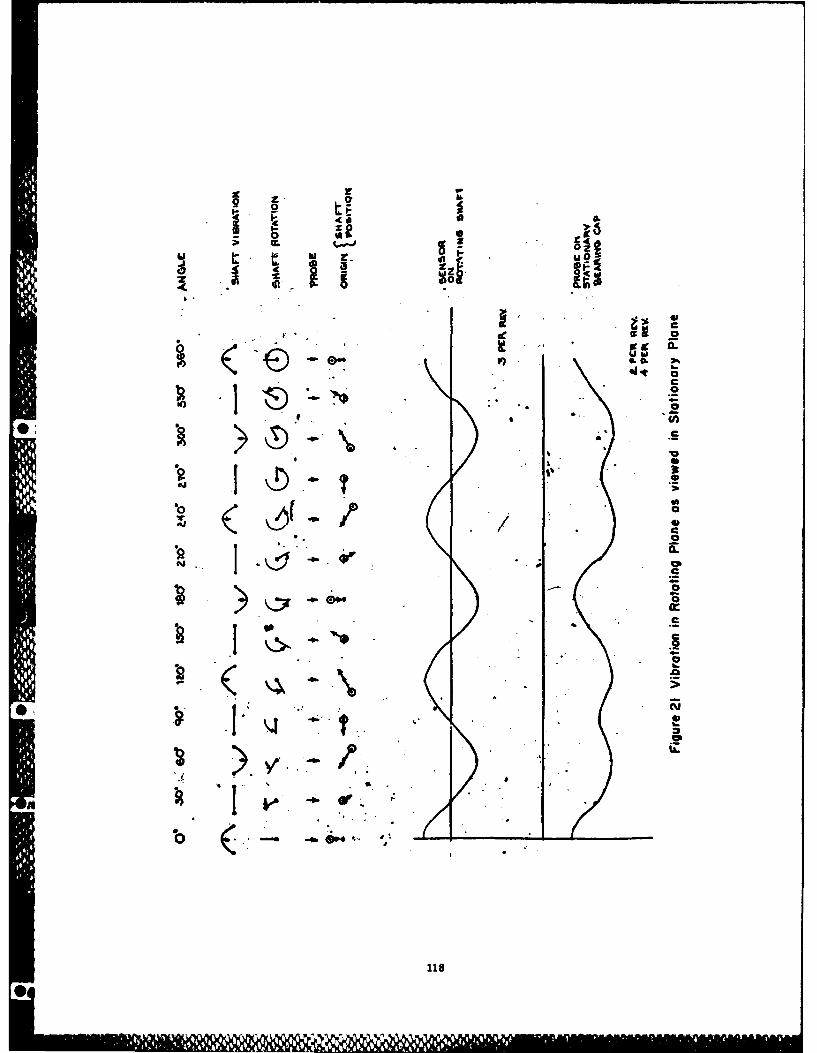
a ~ '0
c40
00CP
S
1181
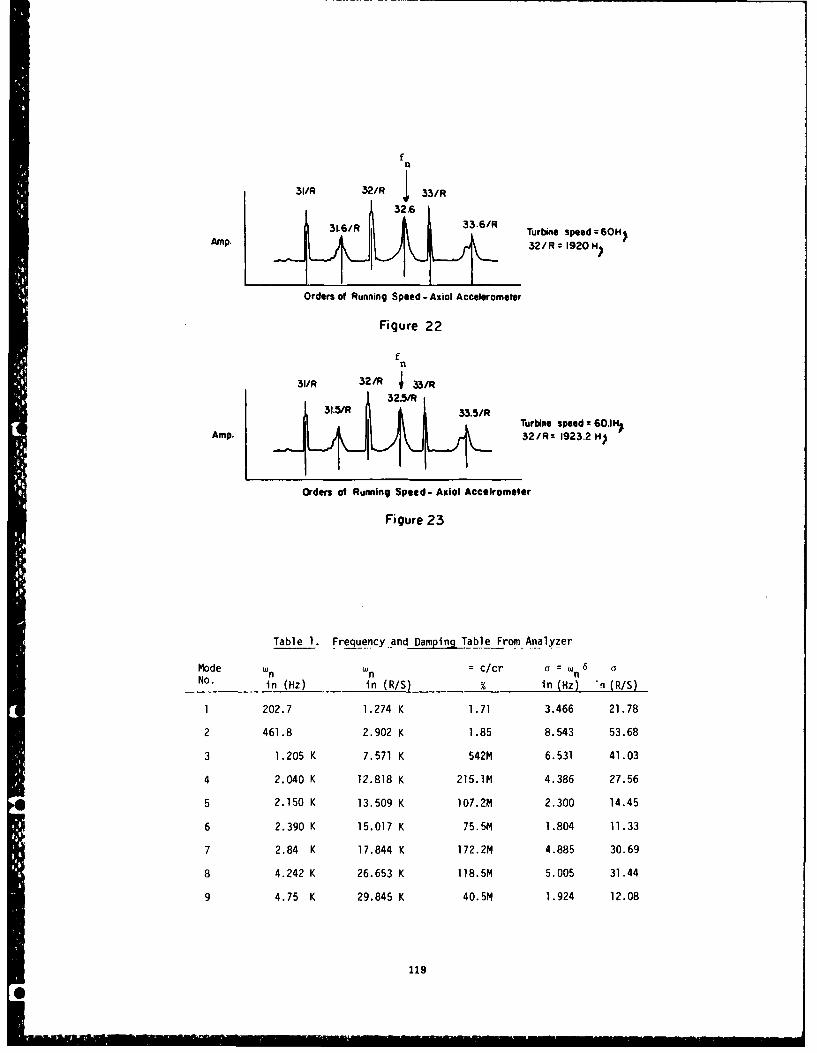
fn
31/R 32/R I 33/R
32.6S33.6/R Turbine speed :60;
Amp. 32/R 2 1920 )
Orders of Running Speed- Axial Accelerometer
Figure 22
fn
31/R 32/R j 33/n32"5/
Amp.Turbine speed = 60.1l,)31.5/R 33.5/R
Amp. 32/R: 1923.2 H)
Orders of Running Speed- Axiol Accelrometer
Figure 23
Table 1. Frequency and Damping Table From Analyzer
Mode wn W n c/cr C=wn aNo. in (Hz) in (R/S) % in (Hz) "q (R/S)
1 202.7 1.274 K 1.71 3.466 21.78
2 461.8 2.902 K 1.85 8.543 53.68
3 1.205 K 7.571 K 542M 6.531 41.03
4 2.040 K 12.818 K 215.1M 4.386 27.56
5 2.150 K 13.509 K 107.2M 2.300 14.45
6 2.390 K 15.017 K 75.5M 1.804 11.33
7 2.84 K 17.844 K 172.2M 4.885 30.69
8 4.242 K 26.653 K 118.5M 5.005 31.44
9 4.75 K 29.845 K 40.5M 1.924 12.08
119
S , . r,- i .... Ii. ... "" . . . .
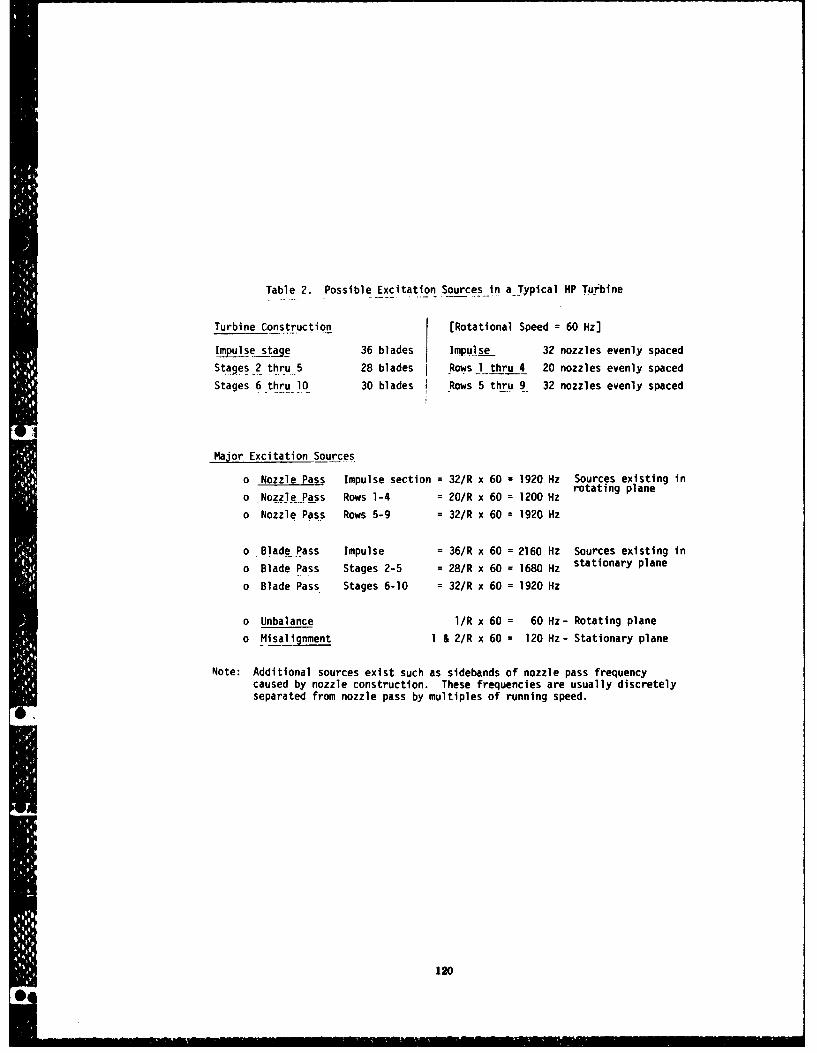
Table 2. Possible Excitation Sourcesin aTypical HP Turbine
Turbine Construction [Rotational Speed = 60 Hz]
Impulse stage 36 blades Impulse 32 nozzles evenly spaced
Stages 2 thru.5 28 blades Rows 1 thru 4 20 nozzles evenly spaced
Stages 6 thru 10 30 blades Rows 5 thru 9 32 nozzles evenly spaced
Major Excitation Sources
o Nozzle Pass Impulse section = 32/R x 60 = 1920 Hz Sources existing in
o Nozzle Pass Rows 1-4 = 20/R x 60 = 1200 Hz rotating plane
o Nozzle Pass Rows 5-9 = 32/R x 60 = 1920 Hz
o Blade-Pass Impulse = 36/R x 60 = 2160 Hz Sources existing in
o Blade Pass Stages 2-5 = 28/R x 60 = 1680 Hz stationary plane
o Blade Pass Stages 6-10 = 32/R x 60 = 1920 Hz
o Unbalance 1/R x 60 = 60 Hz- Rotating plane
o Misalignment 1 & 2/R x 60 = 120 Hz- Stationary plane
Note: Additional sources exist such as sidebands of nozzle pass frequencycaused by nozzle construction. These frequencies are usually discretelyseparated from nozzle pass by multiples of running speed.
120

Table 3. Typical Mode Shapes
1. Blade Mode azcL .
a. Circumferential
b. Axial
c. Twisting
d. Combination
2. Disk Wheel Modes
a. Stiff (Rocking)
b. Stiff (Axial) F----
c. Oil can
d. Node
2
4
6
3. Combination Disk & Blade
1216I
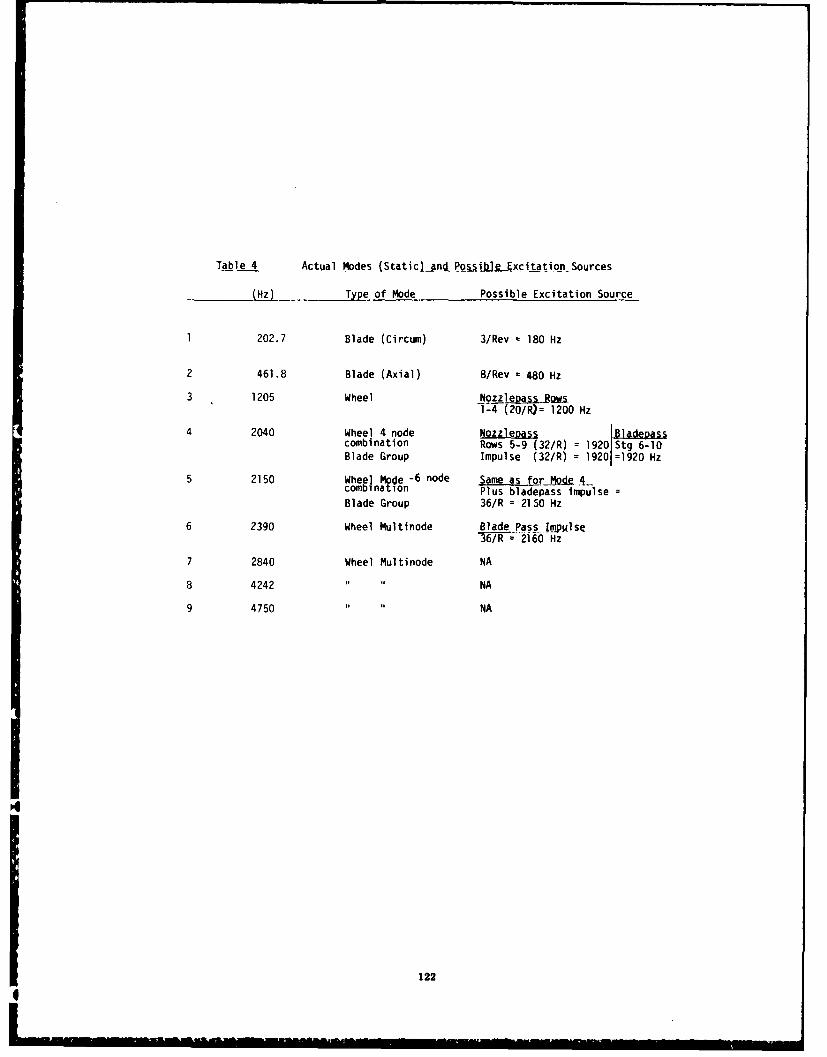
Table 4 Actual Modes (Staticlno.PoisiblE xcitation Sources
(Hz) Type of Mode Possible Excitation Source
1 202.7 Blade (Circum) 3/Rev = 180 Hz
2 461.8 Blade (Axial) 8/Rev = 480 Hz
3 1205 Wheel Nozzlenass RQw.1-4 20/R)= 1200 Hz
4 2040 Wheel 4 node Nozzleoass Bladepasscombination Rows 5-9 (32/R) = 1920 Stg 6-10Blade Group Impulse (32/R) = 19201 =1920 Hz
5 2150 Wheel Mode -6 node Same as forMode4-
combi nation Plus bladepass impulse
Blade Group 36/R = 2150 Hz
6 2390 Wheel Multinode BladePass_Ipmouse36/R = 2160 Hz
7 2840 Wheel Multinode NA
8 4242 NA
9 4750 NA
122
I
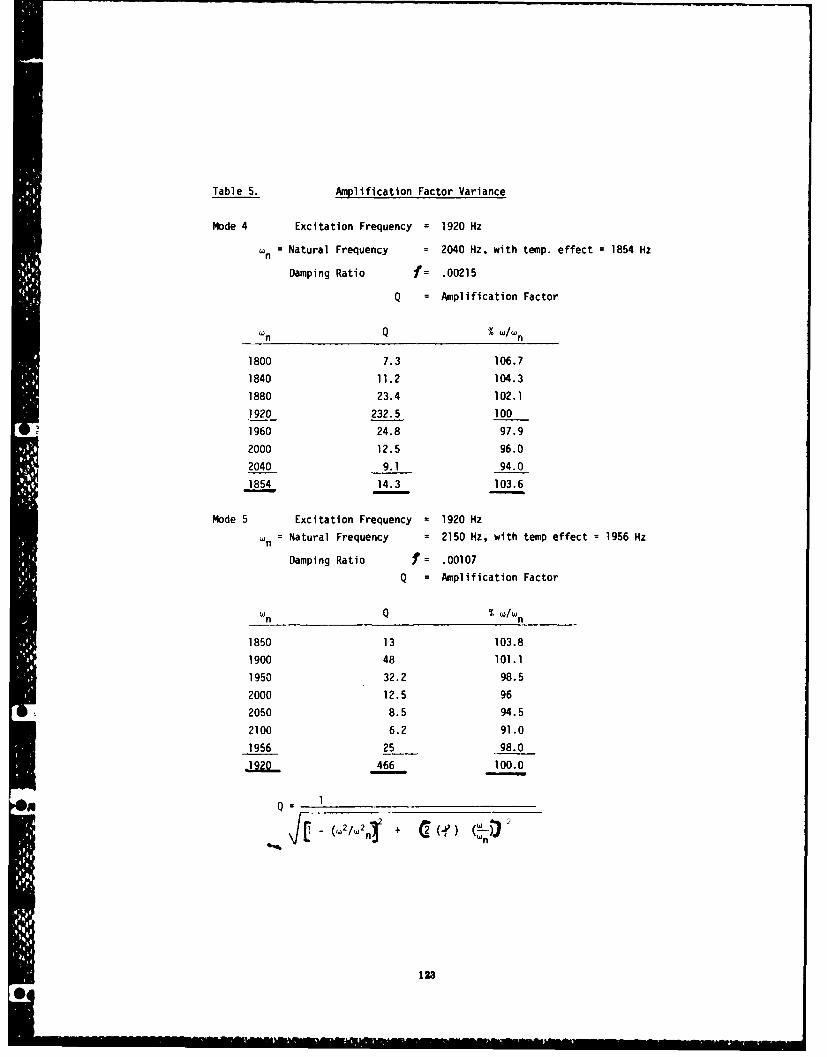
Table 5. Amplification Factor Variance
Mode 4 Excitation Frequency = 1920 Hz
W n = Natural Frequency = 2040 Hz, with temp. effect 1854 Hz
Damping Ratio f= .00215
Q = Amplification Factor
n % W/Wn
1800 7.3 106.7
1840 11.2 104.3
1880 23.4 102.1
1920 232.5 100
1960 24.8 97.9
2000 12.5 96.0
2040 9.1 94.0
1854 14.3 103.6
Mode 5 Excitation Frequency = 1920 Hz
Wn Natural Frequency = 2150 Hz, with temp effect 1956 Hz
Damping Ratio 7 = .00107
Q = Amplification Factor
W Q % W/Wn
1850 13 103.8
1900 48 101.1
1950 32.2 98.5
2000 12.5 96
2050 8.5 94.5
2100 6.2 91.0
1956 25 98.0
466 100.0
Q1
•123
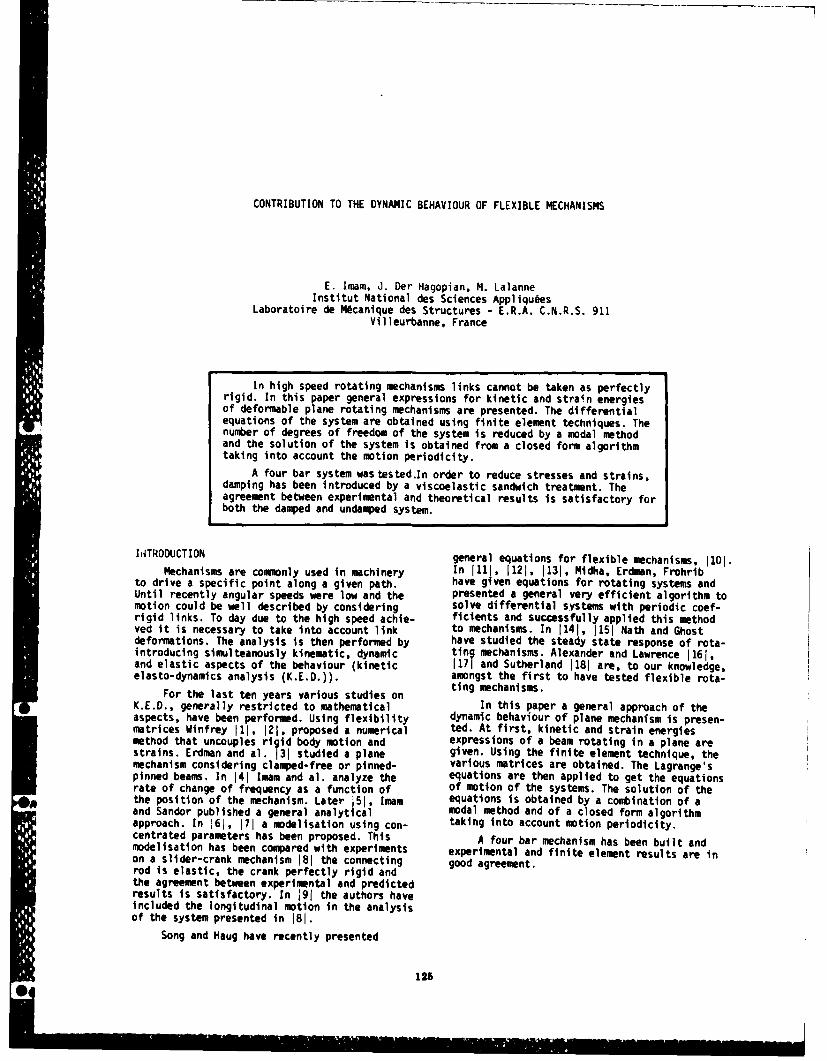
CONTRIBUTION TO THE DYNAMIC BEHAVIOUR OF FLEXIBLE MECHANISMS
E. Imam, J. Der Hagopian, M. LalanneInstitut National des Sciences Appliqu~es
Laboratoire de Mdcanique des Structures - E.R.A. C.N.R.S. 911Villeurbanne, France
In high speed rotating mechanisms links cannot be taken as perfectlyrigid. In this paper general expressions for kinetic and strain energiesof deformable plane rotating mechanisms are presented. The differentialequations of the system are obtained using finite element techniques. Thenumber of degrees of freedom of the system is reduced by a modal methodand the solution of the system is obtained from a closed form algorithmtaking into account the motion periodicity.
A four bar system was tested.In order to reduce stresses and strains,damping has been introduced by a viscoelastic sandwich treatment. Theagreement between experimental and theoretical results is satisfactory forboth the damped and undamped system.
INTRODUCTION general equations for flexible mechanisms, 1101.Mechanisms are commonly used in machinery In 1lj, 1121, 1131, Midha, Erdman, Frohrlb
to drive a specific point along a given path. have given equations for rotating systems andUntil recently angular speeds were low and the presented a general very efficient algorithm tomotion could be well described by considering solve differential systems with periodic coef-rigid links. To day due to the high speed achie- ficients and successfully applied this methodved it is necessary to take into account link to mechanisms. In 1141, 1151 Nath and Ghostdeformations. The analysis is then performed by have studied the steady state response of rota-introducing simulteanously kinematic, dynamic ting mechanisms. Alexander and Lawrence 1161,and elastic aspects of the behaviour (kinetic 1171 and Sutherland 1181 are, to our knowledge,elasto-dynamics analysis (K.E.D.)). amongst the first to have tested flexible rota-
For the last ten years various studies on ting mechanisms.K.E.D., generally restricted to mathematical In this paper a general approach of theaspects, have been performed. Using flexibility dynamic behaviour of plane mechanism is presen-matrices Winfrey 1I, 121, proposed a numerical ted. At first, kinetic and strain energiesmethod that uncouples rigid body motion and expressions of a beam rotating in a plane arestrains. Erdman and al. 131 studied a plane given. Using the finite element technique, themechanism considering clamped-free or pinned- various matrices are obtained. The Lagrange'spinned beams. In 141 Imam and al. analyze the equations are then applied to get the equationsrate of change of frequency as a function of of motion of the systems. The solution of thethe position of the mechanism. Later 15J, Imam equations is obtained by a combination of aand Sandor published a general analytical modal method and of a closed form algorithmapproach. In 161, 171 a modelisation using con- taking into account motion periodicity.centrated parameters has been proposed. This A four bar mechanism has been built andmodelisatlon has been compared with experiments experimental and finite element results are inon a slider-crank mechanism 181 the connecting good agreement.rod is elastic, the crank perfectly rigid andthe agreement between experimental and predictedresults is satisfactory. In 191 the authors haveIncluded the longitudinal motion in the analysisof the system presented in 181.
Song and Haug have recently presented
126
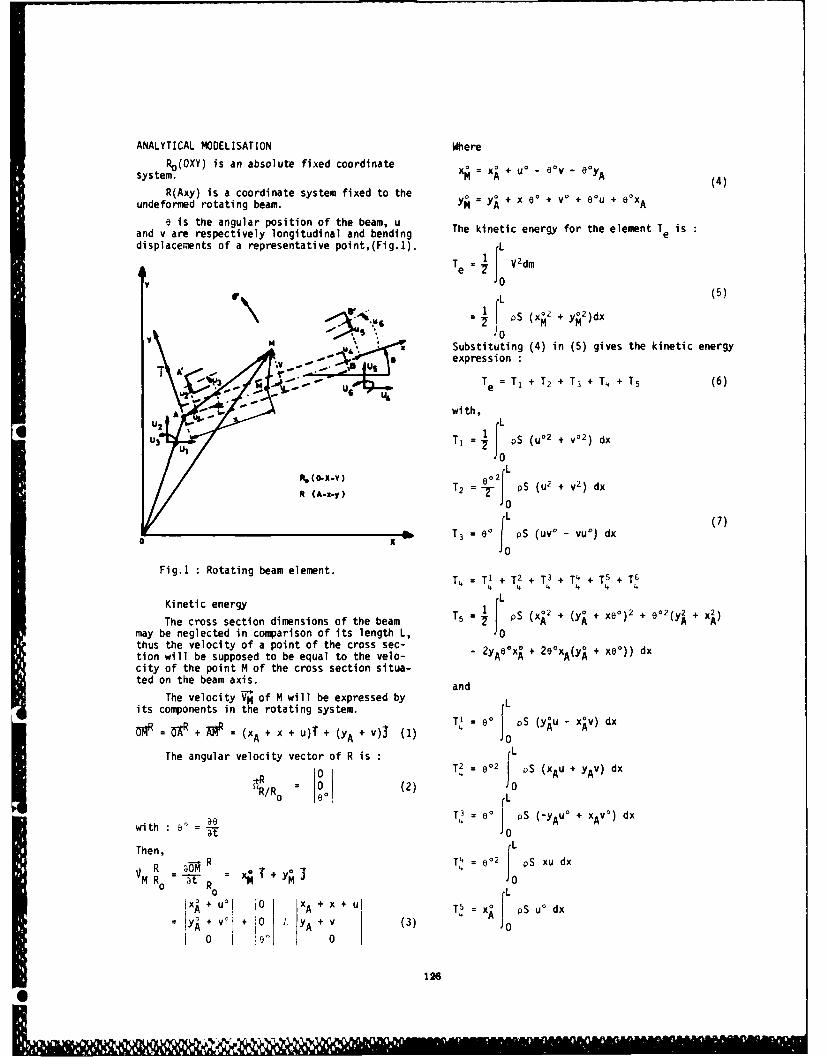
ANALYTICAL MODELISATION Where
seRo(OXY) is an absolute fixed coordinate oa XA + UO - eOv - eyJr system. XM A x+u ° -ev-oy A (4)
R(Axy) is a coordinate system fixed to theundeformed rotating beam. YM = YO + x A + vo + eou + 60x A
a is the angular position of the beam, u The kinetic energy for the element T isand v are respectively longitudinal and bending edisplace-ments of a representative point,(Fig.1). T L
Te 1 V2dm
SL (5)II
1..= f (X2 + y 2)dx(
M , ' Substituting (4) in (5) gives the kinetic energy
,v . u' eexpression
Te =T 1 + T2 + T3 + T + T (6)
A with,
0 I3 T, = 1 { pS (u 2
+ v02) dx
(O-X-Y)002 rLIt (A-x-y) T2 = PS (u
2 + V2) dx
T3 = 0° pS (uv° - vu°) dx
Fig.1 Rotating beam element. T. = TI + T2 + T3 + T4 + T5 + T6
4 4 4 4 4 4
Kinetic energy 1LT5 = PS (yxe 0 (O ~
The cross section dimensions of the beam TA = S (xR2 + Ax0)Z + +may be neglected in comparison of its length L, 10thus the velocity of a point of the cross sec- 2 + xe°)) dxtion will be supposed to be equal to the velo- YON +
2 0 xA(Y x dcity of the point M of the cross section situa-ted on the beam axis. and
The velocity rj of M will be expressed by Lits components in the rotating system. T' = 80° pS (y ,u - x~v) dx
= R+ -= (xA + x + u)T + (YA + v)t (1) T 0
The angular velocity vector of R is : = L4= 02 pS (xAu + yAv) dx
0RR o (2) 00TR 3
= 0 L
Do ,. = PS (-yA u ° + XAV° ) dwith a' = -t 0
Then, T ILo2Then -o R P z 0
2 LpS xu dx
R= 0
Ax 0uo o A+x+ T5 z x* PS u' dx=Io .+v' + 0o+ v (3) 4 Aj
00
1-6

L Strain energy
= JIt is obtained from the classical expres-T6 -- PS (y* + x e°)v* dx (8) sin:
L rLClassical displacement functions are then = El (v) dx + 1 j ES (.LM) dx '17'
used for the finite element modelisatlon : e 7 " ax2 7 0
u(x) = ' - X IU1 = 01(x).ul + i(x).u. Where El, ES are respectively the bending andiu the longitudinal stlffnesses. With (9) and (10),
(17) becomes:
v(x) = - 3x2 + 2x3 ; x - 2x_ + X3 (1 t (18L2 L 3 L L2 Ve 6 k 6 (18)
3x 2x* + x. u, (9) Where k is the classical stiffness matrix 1191.L2 L3 L L2 u5
U6
= t2 (X)U2 + ;)(x)u 3 + 05 (X)U5 + 06(x)u6 System equation
A convenient set of generatized independant
From (9) coordinates U1, -.. U6 is used and
0 ~d = =N6 (10) A0 00 U
IV =10 0 0 0 Uwith 6 = 0 0 1 0 0 0 U3 .8.U. (19)
6 = ju1, u2, u3, u4, us, u6 1 (11) 0 0 0 X 4 0 U4
Then 0 0 0 -W X 0 U5
T, = I 6 t m 60 (12) 0 0 0 0 0 1 U6
Where m is the classical mass matrix including Where x = Cos e , u = Sin e
longitudinal and bending motion 1191. Using (19) equations (12), (13), (14), (16),(18) become :
T2 = - 6 m 6 (13) T1 = . B m B U0 - Ut N U0 (20)
T= - e0 ot C 6 (14) T 2 = 02 Ut Bt m B U = 802 Ut M U (21)
Where c is the antisymetric Corlolis matrixwhose tirms are zero except for: T 3 - -e. UOt 8
t cc B U - - Ut Cc U (22)
- 7PSL r 3S4 C12 C21 -- C42 C24 5P T IF, + F2 + F4it B U + IP3 + P + 6 t B U0
cpSL2 PL2 (23)c l = - Cc 1 - C4 3 -Cc34 1 IU t B(2 )(15) Ve kBU-UtKU (24)
cpci - -= L Applying Lagrange's equations
C C1 c" -SL Cc = -"S'L" dc4 = - 1- - 2 - + a'-s ( 5
pS1 -SC dt aqi aqit~6-C - -c trbtlnofa.leetCaCb6ail btie
T., may be written Where qi are generalized coordinates and Qi are
generalized forces (zero in this case) the con-T, IF, + F2 + F.jt +F +s+ 1t 60 tribution of an element can be easily obtained
6 + IF3 + P5 + 61t from (25), (20), (21), (22), (23), and (24).(16) It must be noted that as the transformation
where F1, F2 , F3, F,, F5, F6 are given in the matrix B is a function of the angular positionappendix. T5 is not taken into account because e, which Is itself a function of the time t,it only gives rigid body motion, some of the matrices defined above are not cons-
tant.
127
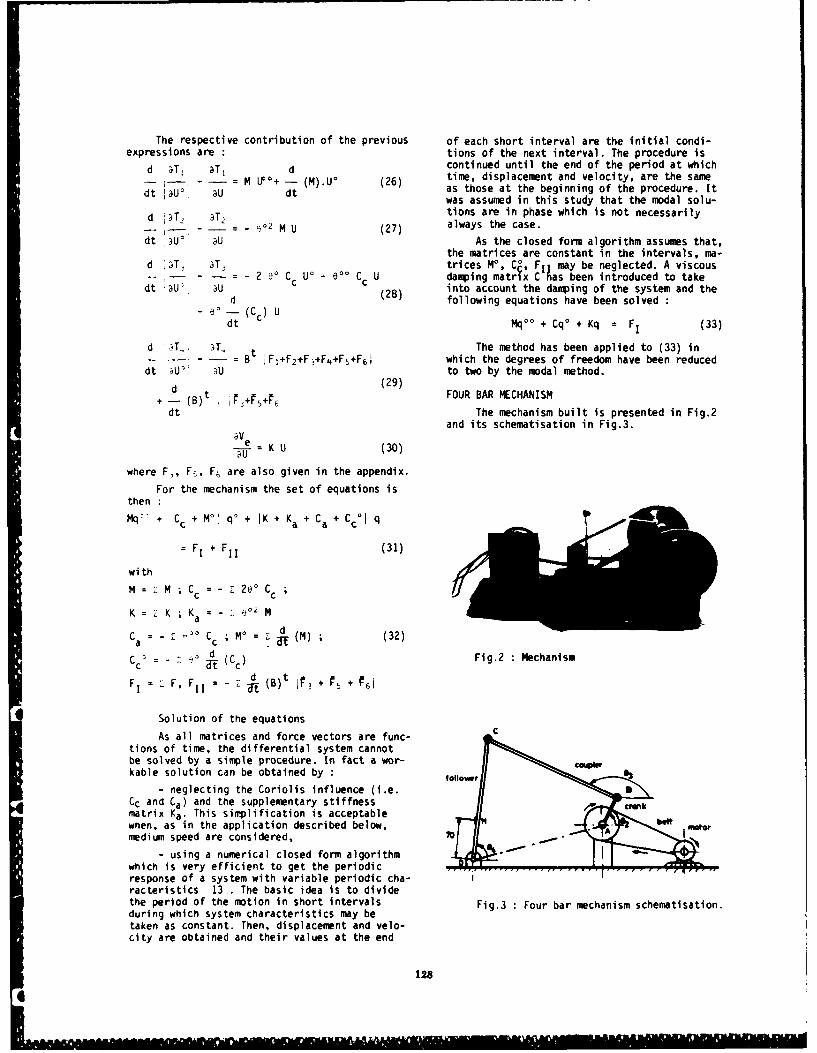
The respective contribution of the previous of each short interval are the initial condi-expressions are : tions of the next interval. The procedure is
d aT4. aTj d continued until the end of the period at which- = M UL°+ - (M).U ° (26) time, displacement and velocity, are the same
dt Ui aU dt as those at the beginning of the procedure. Itwas assumed in this study that the modal solu-
d )2 3T2 tions are in phase which is not necessarily- -.. . ° MU (27) always the case.
dt 3U au As the closed form algorithm assumes that,the matrices are constant in the intervals, ma-
d )T,' 3T. trices M, Co, FIt may be neglected. A viscous-- ; - ....- 2 eo Cc U0 .e 0 Cc U damping matrix C Nas been introduced to takedt 3U , aU (28) into account the damping of the system and the
d (28following equations have been solvede°-(Cc) udt Mq 0° + Cq0 + Kq = FI (33)
d )T, t The method has been applied to (33) in-T. - - Bt F,+F 2+F.+F 4 +Fb+F 61 which the degrees of freedom have been reduced
dt U to two by the modal method.
d (29)+ - (B)t FOUR BAR MECHANISM
dt The mechanism built is presented in Fig.2and its schematisation in Fig.3.av
eT K U (30)
where F,., F5. F6 are also given in the appendix,
For the mechanism the set of equations isthen :
Mq- + Cc + M" qO + 1K + Ka + Ca + C°Jq
F F + F (31)
with
M = z M ; Cc = - 2 2 ° Cc cK =2zK ;K = -2 0 2 M
Ca - "-° Cc ; M° = Z i (M) ; (32)
Cc=- : d (Co) Fig.2 Mechanism
FI =2 F, F11 = - a (B)t
1r, + F
+ rr1
Solution of the equations
As all matrices and force vectors are func-
tions of time, the differential system cannotbe solved by a simple procedure. In fact a wor-ka b le so lu t io n c a n be o b ta in e d by : to 0%o, r
Cc and Ca) and the supplementary stiffnessmatrix Ka. This simplification is acceptablewhen, as in the application described below, be rt
medium speed are considered, .0
- using a numerical closed form algorithm _which is very efficient to get the periodicresponse of a system with variable periodic cha-racteristics 13. The basic idea is to dividethe period of the motion in short intervals Fig.3 Four bar mechanism schematisation.during which system characteristics may betaken as constant. Then, displacement and velo-city are obtained and their values at the end
128
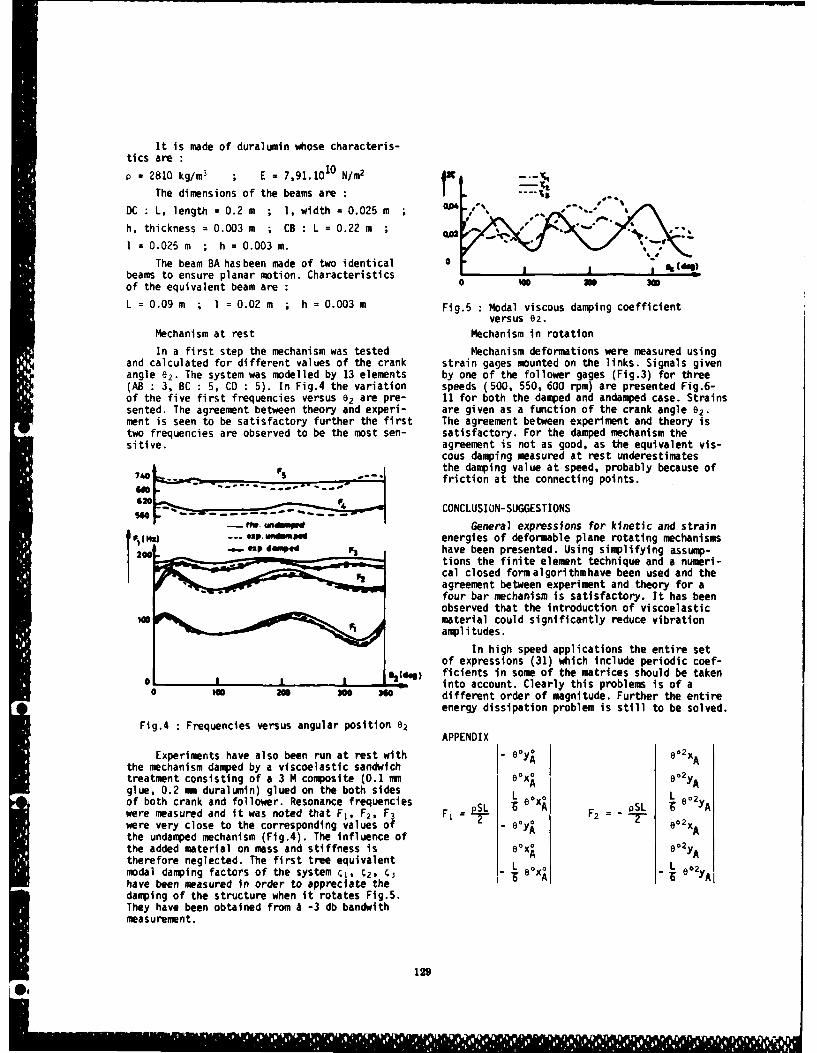
It is made of duralumin whose characteris-tics are :
p= 2810 kg/m 3 ; E = 7,91.1010 N/m2
The dimensions of the beams are
DC: L, length =0.2m ; 1, width 0.025 mh, thickness = 0.003 m ; CB : L = 0.22 m W2
1 =0.025 m ; h = 0.003 m.
The beam BA has been made of two identical 0 a ".beams to ensure planar motion. Characteristicsof the equivalent beam are : 0 2 3
L = 0.09 m ; 1 = 0.02 m ; h = 0.003 m Fig.5 : Modal viscous damping coefficient
versus e2.
Mechanism at rest Mechanism in rotation
In a first step the mechanism was tested Mechanism deformations were measured usingand calculated for different values of the crank strain gages mounted on the links. Signals givenangle 02. The system was modelled by 13 elements by one of the follower gages (Flg.3) for three(AB : 3, BC : 5, CD : 5). In Fig.4 the variation speeds (500, 550, 600 rpm) are presented Fig.6-of the five first frequencies versus 62 are pre- 11 for both the damped and andamped case. Strainssented. The agreement between theory and experi- are given as a function of the crank angle 62.ment is seen to be satisfactory further the first The agreement between experiment and theory istwo frequencies are observed to be the most sen- satisfactory. For the damped mechanism thesitive. agreement is not as good, as the equivalent vis-
cous damping measured at rest underestimates70 Fs , -the damping value at speed, probably because of
- -. . - friction at the connecting points.
S .. CONCLUSION-SUGGESTIONS
--W. General expressions for kinetic and strainF, esp .. und pd energies of deformable plane rotating mechanisms
2 *zp doe F3 have been presented. Using simplifying assump-zw tions the finite element technique and a numeri-
cal closed form algorithmhave been used and theagreement between experiment and theory for afour bar mechanism is satisfactory. It has beenobserved that the introduction of viscoelastic
100 material could significantly reduce vibrationamplitudes.
In high speed applications the entire setof expressions (31) which include periodic coef-
o* __ _ __ |2(0_) ficients in some of the matrices should be takeninto account. Clearly this problems is of a
0 n 300 30 different order of magnitude. Further the entireenergy dissipation problem is still to be solved.
Fig.4 : Frequencies versus angular position e2APPENDIX
Experiments have also been run at rest with - e0yo e 2xAthe mechanism damped by a viscoelastic sandwich
treatment consisting of a 3 M composite (0.1 mm 6Ox0 e2y
glue, 0.2 mm duralumin) glued on the both sides A L A
of both crank and follower. Resonance frequencies L 60 0 - L 60Awere measured and it was noted that F1 , F2 , F3 F =RL r A F2 = -
were very close to the corresponding values of -0yO eo2xAthe undamped mechanism (Fg.4). The Influence of A A
the added material on mass and stiffness is ex0 02yAtherefore neglected. The first tree equivalent A 60
modal damping factors of the system ;1', L B3 L e " 2YAhave been measured in order to appreciate thedamping of the structure when it rotates Fig.5.They have been obtained from A -3 db bandwlthmeasurement.
129
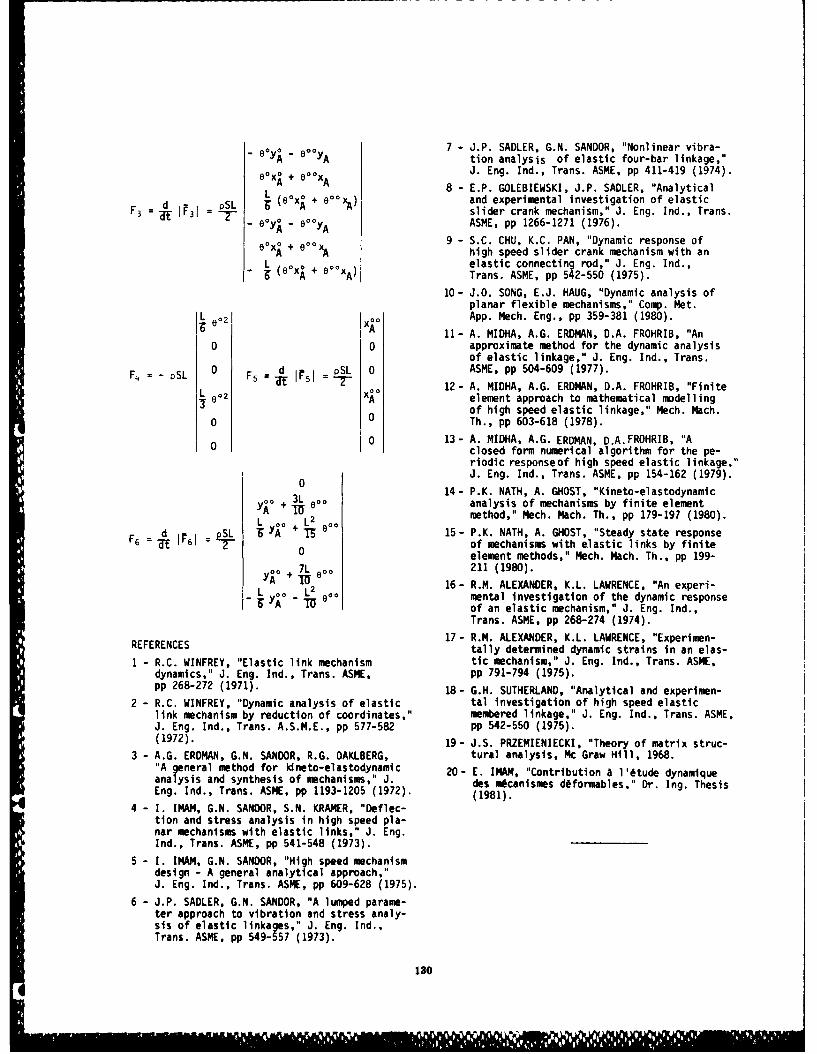
_ y 7 - J.P. SADLER, G.N. SANDOR, "Nonlinear vibra-
-e0yA tion analysis of elastic four-bar linkage,"
e0 x* + e00xA J. Eng. Ind., Trans. ASME, pp 411-419 (1974).
L + A 8 - E.P. GOLEBIEWSKI, J.P. SADLER, "Analyticald_ - S (e~x +XA and experimental investigation of elastic
F3 = IF31 = slider crank mechanism," J. Eng. Ind., Trans.-60yA- °yA ASME, pp 1266-1271 (1976).
eOx0 + exA 9 - S.C. CHU, K.C. PAN, "Dynamic response ofhigh speed slider crank mechanism with an
L BOX* + elastic connecting rod," J. Eng. Ind.,6 X( A xA) Trans. ASME, pp 542-550 (1975).
10- J.O. SONG, E.J. HAUG, "Dynamic analysis ofplanar flexible mechanisms," Comp. Met.
L eo21 x0 App. Mech. Eng., pp 359-381 (1980).
11- A. MIDHA, A.G. ERDMAN, D.A. FROHRIB, "AnO 0 approximate method for the dynamic analysis
of elastic linkage," J. Eng. Ind., Trans.
F=- oSL 0 F5 d I pSL 0 ASME, pp 504-609 (1977).12- A. MIDHA, A.G. ERDMAN, D.A. FROHRIB, "Finite
62 A element approach to mathematical modellingof high speed elastic linkage," Mech. Mach.
0 0 Th., pp 603-618 (1978).
0 13- A. MIDHA, A.G. ERDMAN, D.A.FROHRIB, "A0 Iclosed form numerical algorithm for the pe-
riodic responseof high speed elastic linkage,"J. Eng. Ind., Trans. ASME, pp 154-162 (1979).
0 14- P.K. NATH, A. GHOST, "Kineto-elastodynamicS Le analysis of mechanisms by finite element
LA 0 L method," Mech. Mach. Th., pp 179-197 (1980).
d PSL S YA+T 0 15- P.K. NATH, A. GHOST, "Steady state responseof mechanisms with elastic links by finite
0 element methods," Mech. Mach. Th., pp 199-
00 + 7L e00 211 (1980).16- R.M. ALEXANDER, K.L. LAWRENCE, "An experi-
y0 _ L2 000 mental investigation of the dynamic responseA m of an elastic mechanism," J. Eng. Ind.,
Trans. ASME, pp 268-274 (1974).
17- R.M. ALEXANDER, K.L. LAWRENCE, "Experimen-REFERENCES tally determined dynamic strains in an elas-
1 - R.C. WINFREY, "Elastic link mechanism tic mechanism," J. Eng. Ind., Trans. ASME,dynamics," J. Eng. Ind., Trans. ASME, pp 791-794 (1975).pp 268-272 (1971). 18- G.H. SUTHERLAND, "Analytical and experimen-
2 - R.C. WINFREY, "Dynamic analysis of elastic tal investigation of high speed elasticlink mechanism by reduction of coordinates," membered linkage," J. Eng. Ind., Trans. ASME,J. Eng. Ind., Trans. A.S.M.E., pp 577-582 pp 542-550 (1975).(1972). 19- J.S. PRZEMIENIECKI, "Theory of matrix struc-
3 - A.G. ERDMAN, G.N. SANDOR, R.G. OAKLBERG, tural analysis, Mc Graw Hill, 1968."A general method for kineto-elastodynamtc 20- E. IMAM, "Contribution a 1 'etude dynamiqueanalysis and synthesis of mechanisms," J. des micanismes deformables." Dr. Ing. ThesisEng. Ind., Trans. ASME, pp 1193-1205 (1972). (1981).
4 - I. IMAM, G.N. SANDOR, S.N. KRAMER, "Deflec-tion and stress analysis in high speed pla-nar mechanisms with elastic links," J. Eng.Ind., Trans. ASME, pp 541-548 (1973).
5 - I. IMAM, G.N. SANDOR, "High speed mechanismdesign - A general analytical approach,"J. Eng. Ind., Trans. ASME, pp 609-628 (1975).
6 - J.P. SADLER, G.N. SANDOR, "A lumped parame-ter approach to vibration and stress analy-sis of elastic linkages," J. Eng. Ind.,Trans. ASME, pp 549-557 (1973).
130

Pm Im- exp.
300 the.
200
I lo
0 imlm - exp.
300 the.
-200-
Fig.6 :Strains versus 02 at 500 rpm (undamped mechanism).
-- -- Yml ---- exp.-- 300-- the.
I ODie
IS. ",
.00 -- vv " va ij "v '
-200
Fig.7 Strains versus 92 at 500 rpm (damped mchanism).
181
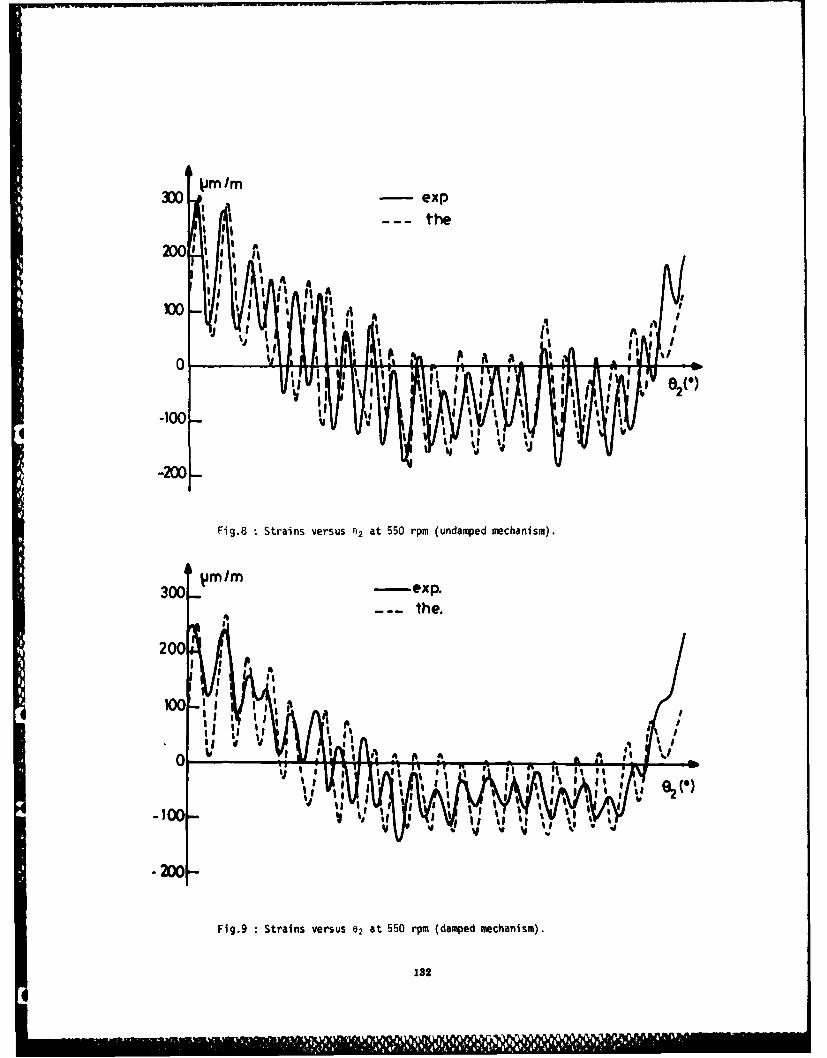
300 -M/ exp
--the
Iiit
It
JIlk
0 l
-100-I
-200
Fig.8 Strains versus 92 at 550 rpm (undamped mechanism).
300 M -exp.-- the.
200
it !kII
0 l. Strin vesu It at50rm(apesehns)
132s
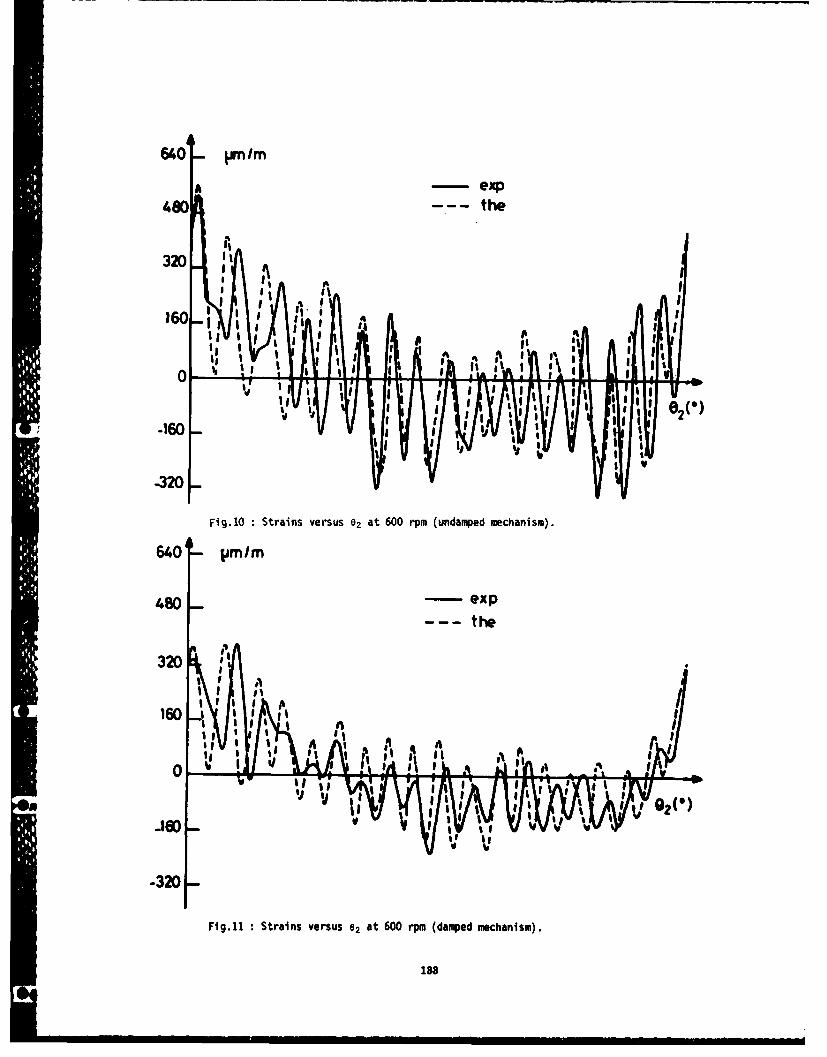
640- pm Im
A - exp
480 -- the
320
160i
4I IVI II I 2*
.160
-320
Fig. 10 Strains versus e2 at 600 rpm (undamped mechanism).
640 PMlm
460 - expthe
A
320
0 Z "AI pV
I " ~'ij02(~
-320-
Fig.11 Strains versus e2 at 600 rpm (damped mechanism).
188

SELF-EXCITED VIBRATION OF A NONLINEAR
SYSTEM WITH RANDOM PARAMETERS
Raouf A. IbrahimAssistant Professor
Department of Mechanical EngineeringTexas Tech UniversityLubbock, Texas 79409
This paper deals with the dynamic behavior of a non-linear single degree-of-freedom system with negativelinear damping and subjected to broad band random exci-tations. The system response is analyzed by using twodifferent approaches: the Stratonovich stochasticaveraging method, and the Ito stochastic calculustogether with the Gaussian closure. Closed-form solu-tions of the stationary responses are obtained. It isshown that the two methods provide solutions whichbifurcate from two different points for all the casesconsidered except at one point where the parametricexcitations and the nonlinear restoring force areremoved. It is concluded in this analysis that theGaussian closure may be regarded as a linearizationtechnique.
The nontrivial stationary response suggests that thesystem can achieve a stable limit cycle provided apositive nonlinear damping is included. Unlike theGaussian approximation, the influence of the nonlinearrestoring force is not manifested in the averagingmethod results.
1. INTRODUCTION tion with forced vibration [21 andwith parametric vibration [31. In
Simultaneous occurrence of these studies, it was shown that theself-excited and random parametric inclusion of nonlinear damping forcevibrations may be encountered in causes the system to reach a limitseveral structural systems, such as cycle for which the stability "in themachine tools and water-lubricated large" was the main concern of thesebearings. These types of vibra- studies. It was also indicated thattions are not desirable and may for systems with a nonlinearendanger the safe operation and restoring force, the response isreliability of mechanical systems. manifested in the phase plane as anIt is the purpose of this paper to unstable limit cycle which separatesinvestigate the dynamic response the regions of the domains of attrac-
* and stability of such structural tion. The domains of attraction aresystems. those boundaries between the regions
of initial conditions leading to dif-The dynamic behavior of non- ferent steady stable solutions.
linear systems, including sourcesof self-excited vibrations, is In most cases, however, theinvestigated in depth by Tondl [1). actual time variation in damping orIn two other monographs, Tondl exa- in stiffness parameters is notmined the deterministic problems of periodic. In order to obtain a moreinteraction of self-excited vibra- realistic description of the behavior
185
of such systems, these parametric system is found to be capable ofexcitations should be modeled by ran- achieving a stable limit cycle.dom processes. In an effort towardsthat regard, several investigatorsconsidered a number of problems per- 2. STOCHASTIC DIFFERENTIAL EQUATIONStaining to parametric and autopara- OF THE SYSTEMmetric systems under stochasticexcitations (see, for example, the The dynamic behavior of a nonli-two review articles [4,51). near single degree-of-freedom systemRecently, the author has investigated as described in the introduction canthe random parametric excitation of a be modeled by the dimensionless dif-nonlinear single degree-of-freedom ferential equation:system with positive linear damping[6,7]. The statistical moment 9
equations of the system response were [2(obtained by using two approaches:the Fokker-Planck equation [61 and 2the Ito stochastic calculus [71. The + [l+YX -_W2(T)IX - 0two approaches led to the same set ofmoment equations, which were found toform an infinite hierarchy set. A where X is the displacement, ; is thenumber of trunction schemes have been damping ratio of the negative dampingused in the past as closure approxi- force, B is the coefficient of posi-mation for this type of equations. tive nonlinear damping, and y is theThese schemes are usually based on coefficient of the nonlinear stiff-the assumption that the probability ness. 11(T) and W2(t) are indepen-distribution of the response is dent, "physical," broad band random"nearly" Gaussian. With this assump- processes describing the timetion, higher order moments are variation in damping and stiffnessrelated to lower order moments coefficients. respectively. Thesethrough one of the schemes discussed parametric excitations are assumed toin reference [5]. These approximate have zero means and stationarymethods have no rigorous mathematical Gaussian distributions with smoothbasis, but satisfactory results have spectral densities D1 and D2 , suchbeen obtained [4]. On the other that their correlation time is veryhand, the methods may lead to invalid small compared with the time scale ofsolutions which do not preserve the system oscillations.moments properties (6], or they maynot depict the proper nonlinear beha- The response parameters of thevior of the system [8,9]. Ariaratnam system (1) can be regarded as effec-[91 has shown that the stationary tively Markovian if the two processesresponse of a nonlinear system bifur- 1I(T) and 12(T) are approximated ascates from a point different from the white noise processes in the physicalone obtained by the Gaussian closure. sense interpreted by Gray and Caughey
[10]. Accordingly, equation (1) mayIn this paper the stationary be written in the state vector form,
response of a nonlinear system con- with X1 - X, and X1 - X2:taining a source of self-excitedvibration, and subjected to wide bandrandom parametric excitations is ana-lyzed. Two analytical approaches 1 2will be considered: the Stratonovichstochastic averaging, and the It16 (2 2 3 (2)stochastic calculus together with the 2 (2CX2 -X 1 -OX1 X2-YX ) )Gaussian closure of the momentequations of the system response. + X WComparison of the results obtainedfrom the two methods reveals a numberof differences in addition to thosefound by Ariaratnam [9]. It is found It is customary to regard WI(T)that the moment equations derived by and W2(T) as the "formal" derivativesthe averaging method do not involve of the Brownian motion processes as:the effects of the nonlinearrestoring force, although the momentequations become identical if oneremoves that force from the systemequation. With the inclusion of apositive nonlinear damping force, the
186
dBl(0) obtained when the random excitation- al d, ( appears as the coefficient of the
(3) next to highest derivative in thedB 2(T ) differential equation [14-163. The
0 It6 stochastic equations of the2( ') -°2 dT system may be written in the form:
where dBI(T) and dB 2 (T) are two inde-pendent Brownian motion processes dX 1 . X2dTwith unit variance parameters, and-- =2 a1X2-BX1X 2-yX1)dta and a2 are the spectral densities dX2 (20X 2 -Xl+ 2
where a 2= 2D 1 , and 2 =22D 22 It is + OX dBl(T) (7)01 02 22 121
assumed that WI(T) and W2(0) have + o2 X dB2 (r)zero cross correlation. It is con-venient to rewrite equations (2) interms of the differentials:
The stationary response of thedX 1 = X2 dT system will be determined by con-
sidering equations (4) and (7).2 3
dX 2 - (2c X2-XI-OXI2X 2-YXI3)dl (4)2 1 1 3. STRATONOVICH AVERAGING APPROACH
+ o1X2 dB1 (T) + o2 XIdB2 (T) In order to apply theStratonovich averaging method, thesystem equations (4) are considered.
Since Wi(t) and 2() represent The method requires the introductionthe limiting case of smooth, wide- of new variables describing the
band processes, the system equations amplitude and the phase as:
(4) should be interpreted as
stochastic differential equations of X1 = AcosStratonovich type corresponding tothe general form (11,121: X2 - - Asine , (8)
dX( f(,T)dT e = +(T)
N+ JEl Gij(Xj,)dei(r), Equations (4) become:
i-l-,2,...,n dA - (2CAsine-BA3cos2esine
Equations (4) may in turn be -A3cos30)sinedTtransformed into stochastic equationsof the Ito type: + alAsin 2 edBl(,)
dXi - [f i (IT) - o2AsinecosGdB2()
+ i N ]dT (6) (9)
N do - (2esine-0A 2cos2 esine+ E (1,-r)dB (.0
JMl GijX d r- yA2cos3o)cosed
Comparison of the system alsin~cos~dl(r)
equations (4) with Ito's equation - *2cos2edB2(T)(6) reveals that, for the system con-sidered, the Ito correction term,which is sometimes known as the Wong A and 0 may also be approximated by aand Zakai correction term [131, Is vector-Markov process. Carrying outI 2 X Such a correction term is the stochastic averaging of
Stratonovich [7 to equations (9),
the following Itl equations areobtained:
137

dA 1 23 2 A The mean and mean square of the16 1 2d8 response amplitude A are:
+ (2)1/2 0 AdB() -n]= ~*~28+ ()/°dI(1 E[A) - 2-n[I-(3Dl
- (1)1/ 2 o2AdB2 () (14)(10) + D2 )1/ 2 r(2n)/r 2 (n)
A2 2 1do = -(0-3y) dT E[A 2] = 1 (4+D+D2 ) (15)
+ (.1)1/20ldBl(T)
)1/2, For the case D1=0, the mean- ( 2 dB 2 (T) square (15) becomes identical to that
obtained by Schmidt 181 andAriaratnam [91 if c is replaced by
Since the first equation in (10) -;. For the purpose of comparison
is independent of the phase 0, the with the results of the next section,
amplitude A(T) constitutes a Markov the differential equation of the
diffusion process by itself [8,9]. second moment of p(A) is derived fromThe probability density function the Fokker-Planck equation (11) as:
p(AT) should satisfy theFokker-Planck equation: d E[A2 1 (2+2D +D2)E[A21 (16)
22 Ht[ 2~2 1 D[ 1 (163 3A ( 1(5D+3D2 )+C -E[A 4 1
-A 2Ap] + .1 (3D +D2 ) (114
It is seen that the above resultsa (A 2 are independent of y. Figure (1)3A shows the mean and the root mean
square of the amplitude A as functionof the excitation spectral density of
Here D1 2 is set to zero since it ha damping variation (D1 /2;) with D2 -0.as It is clear that these amplitude
been assumed that both random excita- parameters are monotonicallytions are uncorrelated. It is not para s aie monotontmlypossible to obtain a closed-form ana- X1, the mean square of X.,lytical solution for the transition tprobability of equation (11). X , m -E[X 1, is illustrated inHowever, one can obtain a stationary 1 20solution by setting the left-hand figures (2) and (3) by solid lines.side of equation (11) to zero, as:
CA 2n-1.e- D A 2 (1) 4. GAUSSIAN CLOSURE OF MOMENTEQUATIONS
where 4.1 Dynamic Moment Equations
A set of differential equationscin (n)[ l n of the response joint moments of the
2(3Dl+D2 ) probability density function p(X,T)can be derived by using the method of
D - 2 (3D1 +D2 )- 1 (13) stochastic calculus [12] which
( 1 2)requires the introduction of the
scalar-valued real function:
n - (D 1 +D2 +4C)/(3DI+D2 )
. - (XkX 1 (17)
and the joint moment of the systemresponse of order N=k+4
18s

<A> IIII!
0 20 52 1 1
161
14
12
10 2 2
6
4
2
0 2 4. 6 8 10 12 14 16 0 2
FIG (1) Mean and Root-Vean-Square of the Amplitude as Function of the ExcitationSpectral Density According to Stratonovich Averaging Method
k E[XkX E(01 Equation (20) represents a system(18) of linear first order differential
equations of the system moments= x2P(kxp,)dXldX2 response. Inspection of equation
(20) shows that the inclusion ofdamping and stiffness nonlinearitiescauses the system (20) to form anThe two-dimensional process func- infinite hierarchy of moment
tion 4 possesses a stochastic dif- equations. This, of course, createsferential, and according to the Ito serious difficulties in determiningtheorem, d4 takes the form [12): the system response or stability cri-
teria "in the large." In order to
T obtain solutions for a finite set ofd* = {a-- {dX i moments, equation (20) must be trun-°i cated. Most of the available closure
schemes 151 assume Gaussian distribu-1/2 Trace Ia tion of the response joint moments.
/ e G]Q[G]Ta ax]dT This is valid for linear systems
described by differential equationswith constant coefficients. On thecontrary, for linear systems under
where rQdr] = E({dBi)(dBiTJ parametric excitations as well asnonlinear systems, it is known that
Substituting the corresponding the response is not Gaussian distri-expressions of [G], [QdT] from buted if the excitation is Gaussian.equations (7) into equation (19), However, for systems with very smallthen taking expectation and dividing nonlinearities, the joint distribu-both sides by dr gives: tion functions of the response may
f 2 kmknot deviate significantly fromk"- 1 +1 j+2 1 "',L- +1,+1-- Gaussian form. The validity of such
approximation must be examined bycomparison with the exact solution orwith experimental results. In this
(20) paper the first alternative will be+tDlmkl+DL(-l)mk, followed.
+D 2&('-1)mk+2,1_2
139
4.2 Stationary Responses 4.2.1 Null Solution
The stationary responses of the It is seen that equation (24) aresystem may be described adequately in satisfied by the trivial solution:terms of first and second momentsbecause higher moments have no physi- mlO - m20 - m02 - 0 (25)cal meaning and the physicalinterpretation of higher moments sta- This solution describes thebility would be difficult. The first equilibrium position of the systemmoment equation can be written and can be obtained from the lineardirectly from equation (20) by theory. The stability "in the small"setting k-l, L-0, and k-0,1-l: in terms of first and second moments
;. 0can be determined by employing the
in 0 =m01 Routh-Hurwitz criteria. Introducing
(21) small perturbations 6 kX to the null
solution, the following stability0 2cml-m1 0 -8m 2 1 -Ym 3 0 Dlm0 1 criteria are obtained:
Similarly, the second order i. Stability of the first moments
moment equations are: can be determined by examining the
ioet equations20 am 31associated characteristic equation:ml= m0 2+2¢mll-nm20-Sm3 1
412-(2 D1) 1 = 0 (26)
Equation (26) indicates that the
i 2 0 = 2m 1 1 (22) system is unstable in the mean.
S2ii. Stability of the second momentsi 0 2 = 02-22Dl202 can also be obtained from the charac-
teristic equation:
+ 2D2 n20 -2ym 3 1
13_ 6+D) 2 +4c2 +C D2+kThe stationary solutions of 1()2+4(¢2+3CDI D1 I) (27)
equations (21) and (22) may be
obtained by setting the left-hand -4(24 D2+2D 1 ) = 0
side of these equations to zero. The2
first equation in (21) and the second It is obvious that the system isSequation in (22) give: unstable in the mean square.
mo1 = mil - 0 (23)
This result indicates that the 4.2.2 Zero Mean Solution
displacement and velocity of the Equations (24) give the followingsystem are uncorrelated. To completethe solution, the third and fourth semi-trivial solution:
order moments in equations (21) and(22) will be replaced by first and Ml0 0 mll - 0
second order moments by using thecumulant truncation scheme [5]. This i D (8
process will result in the following 20 1 (28)algebraic equations:
2.2+ D 2 1/2)mlo(l+3ym 20 -2ym 1 0 ) -0 + (1+ - 3y4
0 m 3ym 2 +2yin4 M 0 (24) m02 - m20(i+3lm2o)m02- 20-3 20+210l
The dependence of the mean square
2 20 0 + 2 2 0 of the displacement m20 upon the
02 -n 2 0 m0 2 + 1M02+ 2 20 ' excitation parameter D2/24 is shownby the dotted curves in figures (2)
Three possible solutions of (24) and (3), for the two values ofwill be examined. n1/24 - 0,2, and for three values of
y - 0.01, 0.05 and 0.1. It is seen
140

that m20 is diminishing as the Inspecting the coefficients bi fornonlinear restoring force parameter particular values of the solutionis increasing. The influence of the (28) yields positive values.nonlinear parameters y and B are exa- Furthermore, the minor determinantsmined separately: of the Routh-Hurwitz array are found
i. For Y - 0 and B 0, the solu- positive. This result indicates thattion o (4 becomes: 0, sthe solution (28) is stable "in thetion of (24) becomes: large." It also suggests the
existence of a stable limit cycleM 20 - m 02 (2c+2D1 +D 2 ) (29) provided the system possesses a posi-
tive nonlinear damping. This result
This solution is represented by confirms Tondl's findings for a simi-
the dotted straight lines in figures lar deterministic system 131.
(2) and (3). 4.2.3 Nonzero Mean Displacement
ii. For B = 0 and y 0 0 equations Solution(24) give the solution:
For the case of mlo 0 0,(2€+2D1 +D 2 ) equations (24) indicate that M1 0 isM ( -D- ) I coupled with the second moments. The
20 6y(C+D1) solution of these coupled equations(30) is:
i 0 2 = m 2 0 (1+3ym 20 ) 1 1/2
This solution is invalid since it 2 m20 )(34)gives negative mean squares. The 1 2invalidity of this solution may be m 2 - (1 + 4m 2 0 +3ym2 0 )attributed to a number of sources; 2
these could be the inaccuracy and m20 is given by the solution ofincurred by using the Gaussian clo- the cubic equation:sure scheme, or the system may notbe able to reach a stationary 3 2response. This point will be + !(discussed In detail in section 5.
The stability "in the large" of +1 + (35)the mean squares can be examined in Y
the neighborhood of the stationarysolution (28). Introducing small 2 ( D + C )
-perturbations 6kt to that solution 3y 2 1
as:
It is clear that this solution0 k e violates the moments properties since
S= inkt+ 6kte (31) it gives negative mean squares. It
3 2 is also noticed from equations (24)A +b 2 A +blA+b o - 0 (32) that the coupling between the first
and second order moments depends on
where the presence of the nonlinearrestoring force.
2 5Bm 0 -6-5D1 5. DISCUSSION OF RESULTS AND
CONCLUSIONSb 2(2+2D1-m2 0 )(2+Dl-3Bm20 ) Figures (2) and (3) illustrate
the stationary mean square response+ 2(2+7ym20) (33) of the displacement m20 as obtained
by the averaging method (solid lines)and the Gaussian approximation scheme
- 4[ Cm0 2 +(l+6mM0 ) (dotted curves). Comparison of theresults of the two approaches can becarried out by dr2pping the nonlinear
(Bm20 -2c-2D 1 )-D2J stiffness term yXJ from the system
141

fn 2 0 11 11
50-------Gaussian closure Ay--Stochastic averaging - - -' -
40 =02 -----
30
20 -
0
FIG (2) Displacement Mean-square Response (Di /2r 0)
S2 0 - - - -- - - - Gaussiani closure -
- Stochastic averaging -
100--
602
so
60
400 5
04
FIG (3) Displacement Mean-square Response (D)1/2 2)
142

equation (1). It is seen that the properties of the parametric excita-two methods give different results, tions, the Gaussian approximationexcept at one point D2 /2i=D1 /2 -0, leads to zero means of the response.shown in figure (2). The mean square On the other hand, the averagingm2o of the Gaussian approximation is method gives a finite value for thealmost twice the result of the mean amplitude response, equationaveraging process. This difference (14), although the result would agreemay be due to mainly the closure with the Gaussian closure if one con-approximation of replacing higher sidered the mean m1 - E[Acose]. Itorder moments by first and second is also seen that the result obtainedmoments. A similar situation was by the averaging method is indepen-first noticed by Ariaratnam [8,9]. dent of y. In connection with thePrevious studies [18,191 of linear effect of y alone, the averagingsystems, with positive linear damping method fails to give a closed formand excited parametrically by the solution and the Gaussian approxima-white noise W2(T), have shown that tion gives invalid results.such systems are stable in the mean Stability study of the stationarysquare if the condition D2 /2c(l is response, as obtained by the Gaussianmet. On the other hand, when the closure, shows that the inclusion ofsame system includes a nonlinear a positive nonlinear damping isdamping force, the averaging leads to essential to guarantee a stable limitthe condition D2 /2C(2, [91, while the cycle; otherwise, the system isGaussian approximation gives a result unstable "in the large."identical to that of the lineartheory [6]. The Gaussian closure can The author strongly recommendsthen be regarded as a linearization experimental investigations toprocedure of the nonlinear system. establish the validity of the analy-Therefore, one may conclude that the tical results presented in thisclosure techniques based on Gaussian paper.distribution of the response mayannihilate the inherent dynamic REFERENCEScharacteristics of certain nonlinearsystems, especially those under para- 1. Tondl, A., Self-Excitedmetric excitations. However, these Vibration, National Researchapproximations have shown to be very Institute for Machine Design,powerful tools for other types of Bechovice, Prague, Monograph No.nonlinear systems under random forced 9, 1970.excitations [20,21). The mainfeatures of the dynamic behavior of a 2. Tondl, A., On the Interactionnonlinear system with autoparametric Between Self7-Ex--ted and Forcedcoupling [211, examined by using the Vibrations, National ResearchGaussian approximation, were con- Institute for Machine Design,firmed by Schmidt [8] who investi- Bechovice, Prague, Monograph No.gated a similar system by employing 20, 1976.the averaging method. To theauthor's knowledge, the discrepancy 3. Tondl, A., On the Interactionresulting in using the Gaussian clo- Between Self-Excited andsure techniques has to date been Parametric Vibrations, Nationalfound to occur in problems with para- Research Institute for Machinemetric excitations. In that regard, Design, Bechovice, Prague,it is recoimmended that a nonGaussian Monograph No. 25, 1978.closure of the type outlined by 4. Ibrahim, R. A. and Roberts, J.Crandall [22], or by Robson [231, be W., "Parametric Vibration, Partconsidered since the resulting rela- V: Stochastic Problems," Thetions between the response moments Shock and Vibration Diget7Vol.are dependent upon the system nonli- -9 p.near coefficients. Notice that theGaussian closure gives truncated 5. Ibrahim, R. A., "Parametricrelations as mN+l-F(mN,mN_l,...,ml), Vibration, Part VI: Stochasticwhile the nonGaussian closure leads Problems(2)," The Shock andto relations of the type mN+ Vibration Disiet VoT-.lW,-No.F(y,6,mN,...). 9, 1981.
As a consequent result of themoment truncation, and because of the
148
6. Ibrahim, R. A., "Stationary 15. Ariaratnam, S. T. and Tam, D. S.Response of a Randomly F., "Random Vibration andParametric Excited Nonlinear Stability of a LinearSystem," Journal of Aplied Parametrically ExcitedMechanics, Trans. ASME, Series Oscillator," Zeitschrift furE, Vol. 45, No. 4, 1978, pp. Angewandte Mathematik und910-916. Mechanik, Vol. 59, 1979, pp.
79-84.7. Ibrahim, R. A. and Roberts, J.
W., "Broad-Band Random 16. Lin, Y. K., Fujimori, Y., andParametric Excitation of a Ariaratnam, S. T., "Rotor BladeNonlinear System," Proceedings Stability in Turbulentof the VIIIth International Flows-Part I," AmericanConference on Nonlinear Institute of Aeronautics andOscillations, Prague, 1978, pp. Astronautics Journal, Vol. 17,355-360. No. 6, 1979, pp. 545-552.
8. Schmidt, G., "Probability 17. Stratonovich, R. L., Topics inDensities of Parametrically the Theory of Random Noise, Vol.Excited Random Vibrations," in II, Gordon 'and Breach, New York,Stochastic Problems in Dynamics, 1967.Editor B. L. Clarkson, Pitman,London, 1977, pp. 197-213. 18. Ariaratnam, S. T., "Dynamic
Stability of a Column under9. Ariaratnam, S. T., "Bifurcation Random Loading," Procens of
in Nonlinear Stochastic the International Conference onSystems," in New Approaches to Dynamic Stability of Structure,Nonlinear Problems in n 1965, Editor G. Heran,
Editor P. J. Holmes,:SIA, Pergamon Press, 1967. pp.Philadelphia, 1980, p. 470-474. 255-265.
10. Gray, A. H. and Caughey, T. K., 19. Mitchell, R. P. and Kozin, F.,"A Controversy in Problems "Stability of a Simply SupportedInvolving Random Parametric Rod Subjected to a RandomExcitation," Journal of Longitudinal Force,"Mathematics and Physics, Vol. NASA-CR-98016, 1968.44, No. 3, 1965, pp. 288-296.
20. Newland, D. E., "Energy Sharing11. Arnold, L., Stochastic in Random Vibration of
Differential Equations: Theory Nonlinearly Coupled Modes,"and Application, John Wiley & Journal of the Institute ofSons, New York, 1974. Mathematics and Applications,
Vol. 1, No. 3, 1965, pp.12. Jazwiniski, A. H., Stochastic 199-207.
Processes and Filtering Theory,Academic Press, New York, 1980. 21. Ibrahim, R. A. and Roberts, J.
W., "Broad Band Random13. Wong, E. and Zakai, M., "On the Excitation of a
Relation Between Ordinary and Two-Degree-of-Freedom SystemStochastic Differential with Autoparametric Coupling,"Equations," International Journal of Sound and Vibration,Journal of Engineering Science, V ol.44, No. 3, 1.7-6, pp.Vo7.2- n55, pp. 213-229. 335-348.
14. Mitchell, R. P. and Kozin, F., 22. Crandall, S. H., "NonGaussian"Sample Stability of Second Closure for Random Vibration ofOrder Linear Differential Nonlinear Oscillators,"Equations with Wide Band Noise International Journal ofCoefficients," SIAM Journal of Nonlinear Mechanics, Vol. 15,Applied Mathematics, Vol. 27, 1980, pp. 303-313.No. 4, 94pp -605.
23. Robson, J. D., "A SimplifiedQuasi-Gaussian Random ProcessModel Based on Nonlinearity,"Journal of Sound and Vibration,Vol. 76, No. 2, 19T, pp.
169-177.
144