the significance of ifpug base functionality types in effort estimation - an empirical study...
TRANSCRIPT

www.eng.it
An Empirical Study (Revised) The Significance of IFPUG Base Functionality Types in Effort
Estimation
25°International Workshop on Software
Measurement (IWSM) and 10th International
Conference on Software Process and Product
Measurement (MENSURA)
Krakow (Poland) - October 5-7, 2015
PIFs for Projects
(PifPro’15)
Luigi Buglione
Cigdem Gencel
www.eng.it
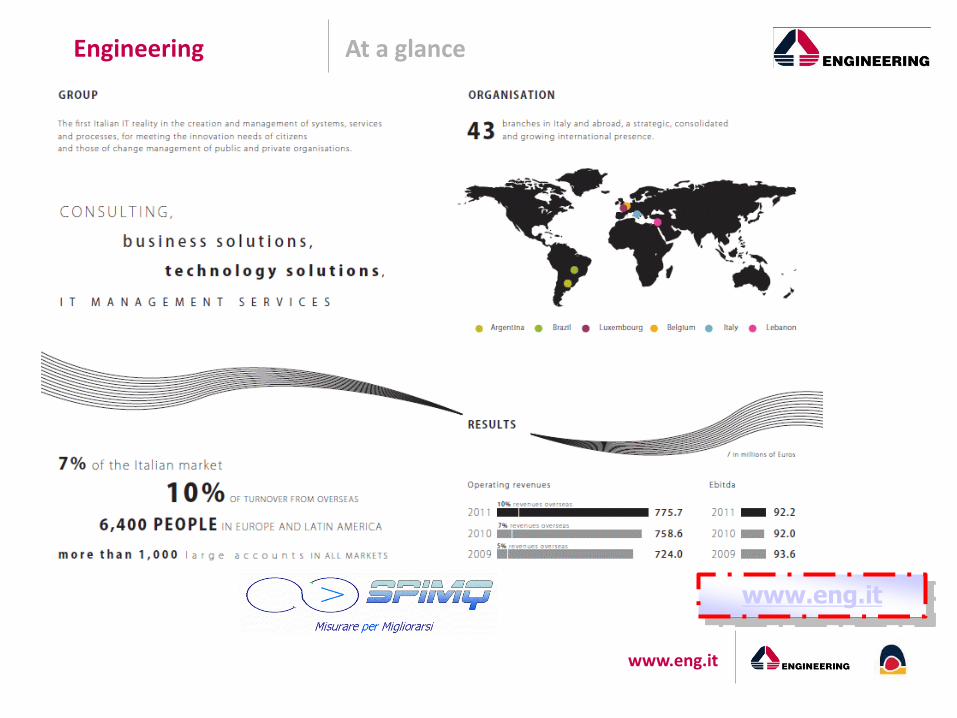
Engineering At a glance
www.eng.it
www.eng.it 4 PifPro’15– Krakow, Oct 5 2015 – © 2015 L.Buglione, C.Gencel
BFC Types Goals of the presentation
G1. Help project managers and estimators to obtain better estimates using the same historical data
G2. Propose a list of filtering criteria helping in obtaining better homogeneous clusters for data analysis and process improvements
G3. Identify and manage 'not visible' outliers in your own historical data
G4. Go into a deeper detail when gathering more granular data in your historical database, that help in consolidating CMMI ML2 goals and achieving faster ML3 ones with better PALs (Process Asset Libraries)
G5. Stimulate improvements in your organization supporting more and more experience by quantitative data depicting projects’ profiles
www.eng.it 5 PifPro’15– Krakow, Oct 5 2015 – © 2015 L.Buglione, C.Gencel
BFC Types Agenda
• Introduction
– A FSM History
– Estimation Techniques
– Top 10 Measurement problems
– Estimation and SPI
• Related works
• Empirical Study
– Data Collection
– Data Preparation
– Statistical Analysis & Results
• Conclusions & Prospects
• Q & A

www.eng.it 6 PifPro’15– Krakow, Oct 5 2015 – © 2015 L.Buglione, C.Gencel
Introduction Why profiling?

www.eng.it 7 PifPro’15– Krakow, Oct 5 2015 – © 2015 L.Buglione, C.Gencel
Introduction A FSM History
Source: FSM webpage: http://www.semq.eu/leng/sizestfsm.htm
www.eng.it 8 PifPro’15– Krakow, Oct 5 2015 – © 2015 L.Buglione, C.Gencel
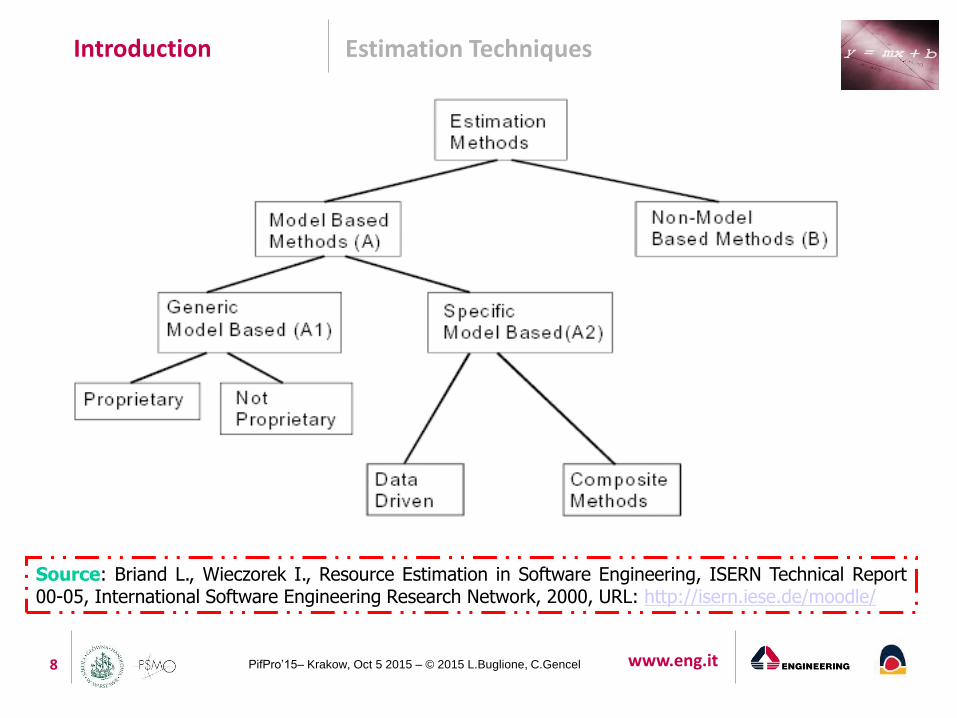
Introduction Estimation Techniques
Source: Briand L., Wieczorek I., Resource Estimation in Software Engineering, ISERN Technical Report 00-05, International Software Engineering Research Network, 2000, URL: http://isern.iese.de/moodle/

www.eng.it 9 PifPro’15– Krakow, Oct 5 2015 – © 2015 L.Buglione, C.Gencel
Introduction Top-10 Problems in Measurement
1. Betting the Measurement Program on a Single Metric; 2. Trying to Find a Single Metric that Solves All Problems and Has No Evils 3. The Quest for an Industry Standard Set of Measures 4. Not Linking Measures to Behaviour; Failing to Realize that the
Measures Are the System 5. Assuming that One Set of Measures Will Be Good for "All Time" 6. Measuring the Wrong IT Output 7. Measuring in Business Terms, but the Wrong Business Terms 8. Failure to Quantify in Business Terms; Failure to Plan for Benefits 9. Neglecting the Full Range of IT-Related Outcomes 10. Lack of Commitment; Treating Measurement As a Non-Value-Added
Add-On
Source: Rubin H.A., The Top 10 Mistakes in IT Measurement, IT Metrics Strategies, Vol.II, No.11, November 1996, URL: http://goo.gl/YhRBos

www.eng.it 10 PifPro’15– Krakow, Oct 5 2015 – © 2015 L.Buglione, C.Gencel
Introduction Estimation and SPI (CMMI-DEV, ML2)
MA – Measurement & Analysis PP – Project Planning
PMC – Project Monitoring & Control REQM – Requirement Mgmt
SG1 Establish
Estimates
SG2 Develop a
Project Plan
SG3 Obtain
Committment
to the Plan
Measurement Data
An agreed-to set of requirements
Planning Data
Project Plans

www.eng.it 11 PifPro’15– Krakow, Oct 5 2015 – © 2015 L.Buglione, C.Gencel
Introduction Estimation and SPI (CMMI-DEV, ML3)
Senior Management
Project Mgmt, Support &
Engineering PAs
OT Org.
Training
OPF Org.
Process Focus
OPD Org.
Process
Definition Improvement Information (e.g. lessons learned, data, artifacts)
Process Improvement proposals; participation in definining, assessing, and
deploying processes
Resources and Coordination
Std processes and other assets
Training for projects and support groups in std process and assets
Organization’s business objectives
Std process, work
environment std, and other assets

www.eng.it 12 PifPro’15– Krakow, Oct 5 2015 – © 2015 L.Buglione, C.Gencel
Introduction Estimation and SPI (CMMI-DEV, ML3 - OPD)
Create Org.
Process Assets
SP1.2 Establish lifecycle model
descriptions
SP1.3 Establish Tailoring Criteria &
GL
Make Supporting Process Assets
Available
SP1.4 Establish
Org. Meas. Repository
SP1.5 Establish Org. PAL
SP1.6 Establish
Work Env. Std
Lifecycle models
Org. Standard Processes
Org. Measur. Repository
Org. Library of Process Doc
Tailoring Guidelines
SP1.1 Establish Standard Processes
www.eng.it 13 PifPro’15– Krakow, Oct 5 2015 – © 2015 L.Buglione, C.Gencel
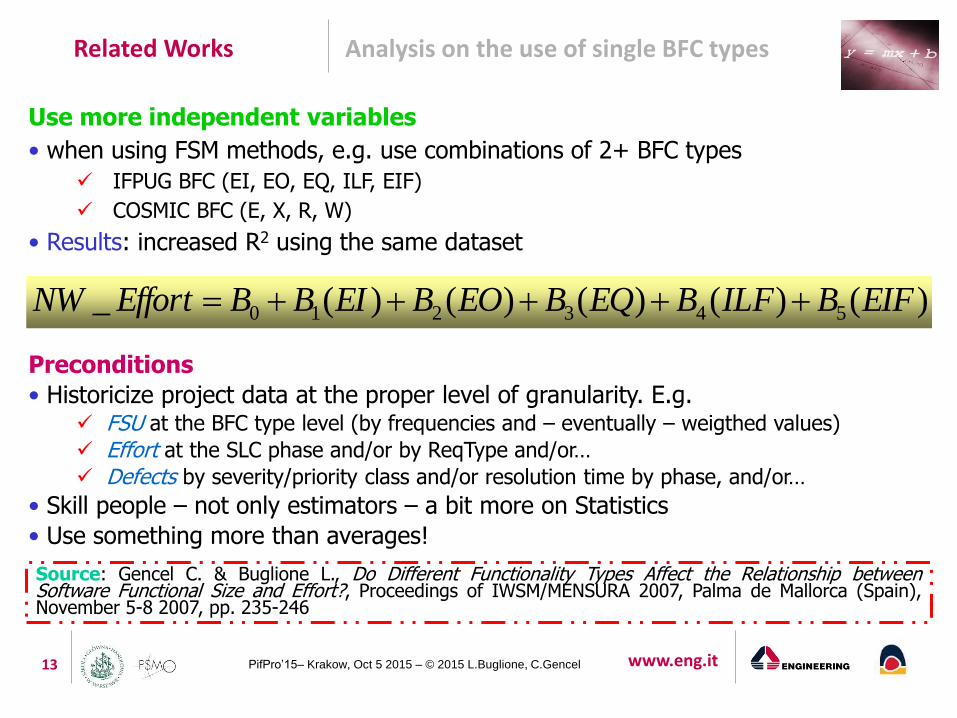
Source: Gencel C. & Buglione L., Do Different Functionality Types Affect the Relationship between Software Functional Size and Effort?, Proceedings of IWSM/MENSURA 2007, Palma de Mallorca (Spain), November 5-8 2007, pp. 235-246
)()()()()(_ 543210 EIFBILFBEQBEOBEIBBEffortNW
Use more independent variables
• when using FSM methods, e.g. use combinations of 2+ BFC types
IFPUG BFC (EI, EO, EQ, ILF, EIF)
COSMIC BFC (E, X, R, W)
• Results: increased R2 using the same dataset
Preconditions
• Historicize project data at the proper level of granularity. E.g. FSU at the BFC type level (by frequencies and – eventually – weigthed values)
Effort at the SLC phase and/or by ReqType and/or…
Defects by severity/priority class and/or resolution time by phase, and/or…
• Skill people – not only estimators – a bit more on Statistics
• Use something more than averages!
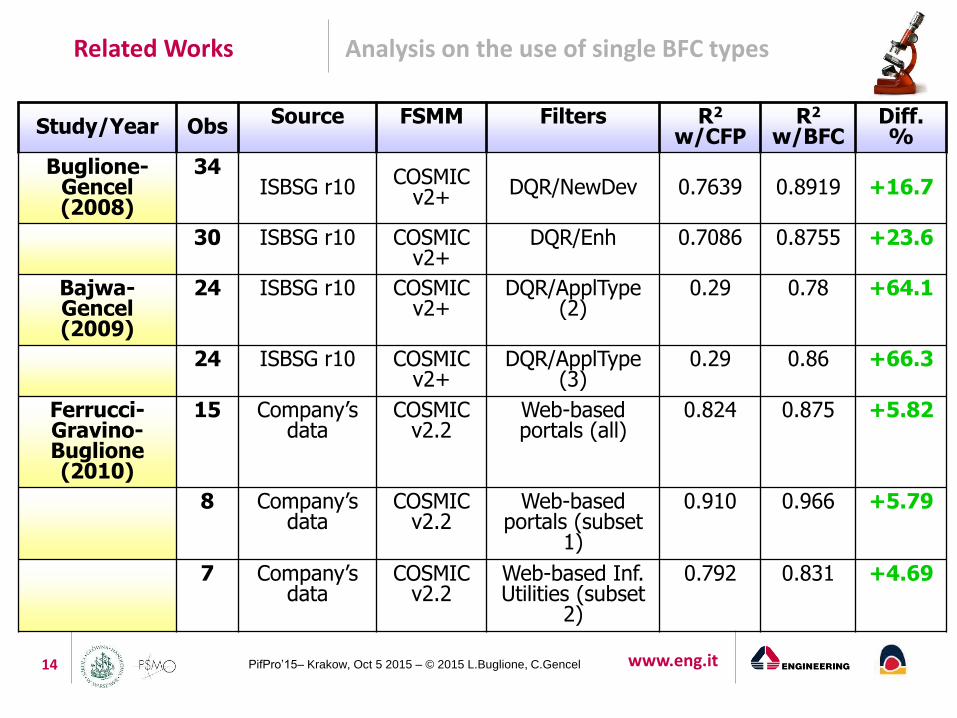
Related Works Analysis on the use of single BFC types
www.eng.it 14 PifPro’15– Krakow, Oct 5 2015 – © 2015 L.Buglione, C.Gencel
Related Works
Study/Year Obs Source FSMM Filters R2 w/CFP
R2 w/BFC
Diff. %
Buglione-Gencel (2008)
34 ISBSG r10 COSMIC
v2+ DQR/NewDev 0.7639 0.8919 +16.7
30 ISBSG r10 COSMIC v2+
DQR/Enh 0.7086 0.8755 +23.6
Bajwa-Gencel (2009)
24 ISBSG r10 COSMIC v2+
DQR/ApplType (2)
0.29 0.78 +64.1
24 ISBSG r10 COSMIC v2+
DQR/ApplType (3)
0.29 0.86 +66.3
Ferrucci-Gravino-Buglione (2010)
15 Company’s data
COSMIC v2.2
Web-based portals (all)
0.824 0.875 +5.82
8 Company’s data
COSMIC v2.2
Web-based portals (subset
1)
0.910 0.966 +5.79
7 Company’s data
COSMIC v2.2
Web-based Inf. Utilities (subset
2)
0.792 0.831 +4.69
Analysis on the use of single BFC types
www.eng.it 15 PifPro’15– Krakow, Oct 5 2015 – © 2015 L.Buglione, C.Gencel
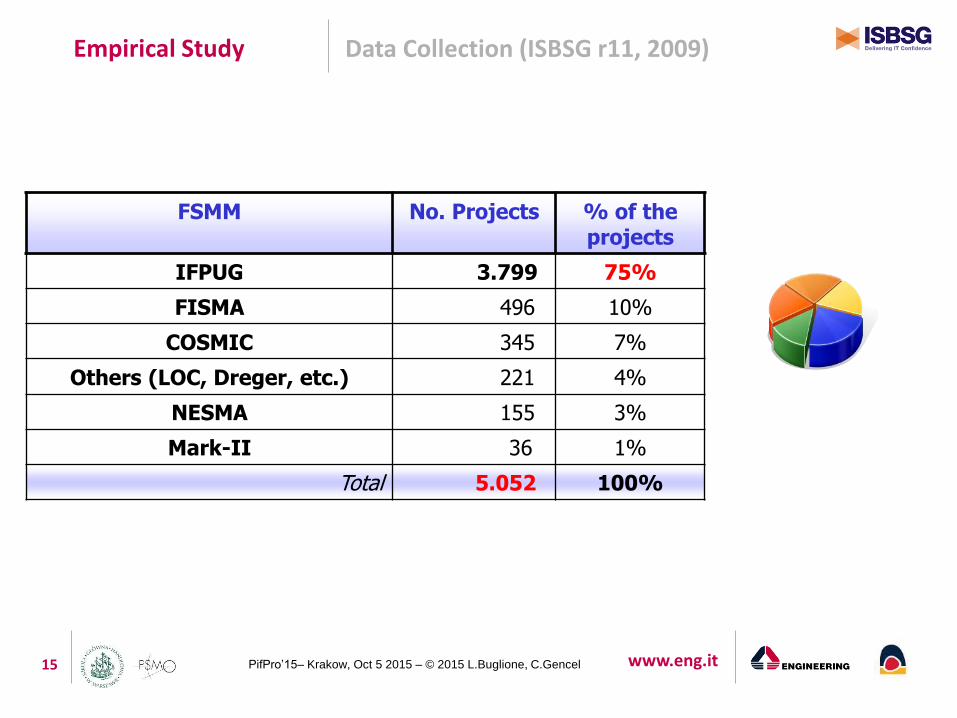
Empirical Study Data Collection (ISBSG r11, 2009)
FSMM No. Projects % of the projects
IFPUG 3.799 75%
FISMA 496 10%
COSMIC 345 7%
Others (LOC, Dreger, etc.) 221 4%
NESMA 155 3%
Mark-II 36 1%
Total 5.052 100%

www.eng.it 16 PifPro’15– Krakow, Oct 5 2015 – © 2015 L.Buglione, C.Gencel
Empirical Study Data Collection (ISBSG r11, 2009)
Entity Attribute Definition
Product Count Approach The description of the technique that was used to size the project (e.g. IFPUG, COSMIC, etc.)
Product Functional Size The count of unadjusted FP. The unit is based on the measurement method that is used to measure the functional size.
Product Application Type The type of the application (e.g. MIS).
Project Normalized Work Effort
The effort used during the full life cycle. For those projects that have covered less than a complete life cycle effort, this value is an estimate. For those projects covering the full life cycle and those projects whose development life cycle coverage is not known, this value and value of summary work effort is same.
Project Development Type This field tells that whether the development is new, enhanced or re-developed
Project Business Area Type
This identifies the subset within the organisation being addressed by the project. It may be different to the organisation type or the same. (e.g.: Manufacturing, Personnel, Finance).
Project Programming Language Type
The primary language used for the development: JAVA, C++, PL/1, Natural, Cobol etc.

www.eng.it 17 PifPro’15– Krakow, Oct 5 2015 – © 2015 L.Buglione, C.Gencel
Empirical Study Data Preparation
Step Attribute Filter Projects Excluded
Remaining Projects
0 --- --- --- 5052
1 Count Approach = IFPUG 1,253 3,799
2 Data Quality Rating (DQR) = {A | B} 3,799 3,614
3 Quality Rating for Unadjusted Function Points (UFP)
= {A | B} 3,614 2,879
4 BFC Types = {Not Empty} 1,482 1,397
Four subsets derived:
ID # projects
Dev Type
Application Type Bus. Type Prog.Lang.
1 37 NewDev Fin trans. Process/accounting Insurance All
2 14 NewDev Fin trans. Process/accounting Insurance COBOL
3 15 NewDev Fin trans. Process/accounting Insurance Visual Basic
4 16 NewDev Fin trans. Process/accounting Banking COBOL
www.eng.it 18 PifPro’15– Krakow, Oct 5 2015 – © 2015 L.Buglione, C.Gencel
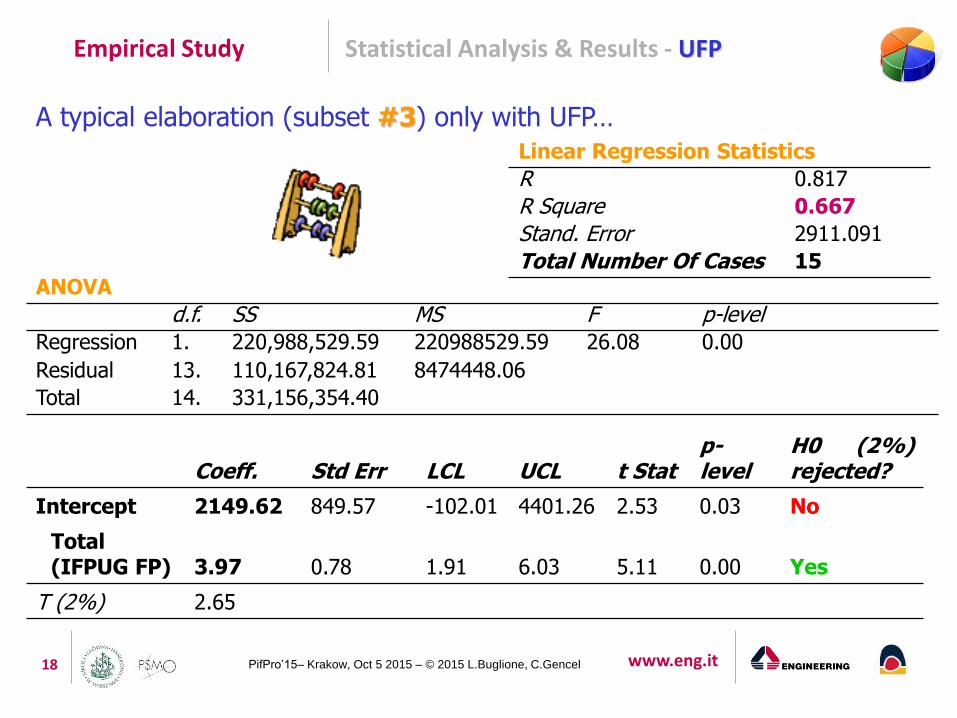
Empirical Study Statistical Analysis & Results - UFP
A typical elaboration (subset #3) only with UFP…
Linear Regression Statistics
R 0.817
R Square 0.667
Stand. Error 2911.091
Total Number Of Cases 15
ANOVA
d.f. SS MS F p-level
Regression 1. 220,988,529.59 220988529.59 26.08 0.00
Residual 13. 110,167,824.81 8474448.06
Total 14. 331,156,354.40
Coeff. Std Err LCL UCL t Stat p-level
H0 (2%) rejected?
Intercept 2149.62 849.57 -102.01 4401.26 2.53 0.03 No
Total (IFPUG FP) 3.97 0.78 1.91 6.03 5.11 0.00 Yes
T (2%) 2.65
www.eng.it 19 PifPro’15– Krakow, Oct 5 2015 – © 2015 L.Buglione, C.Gencel
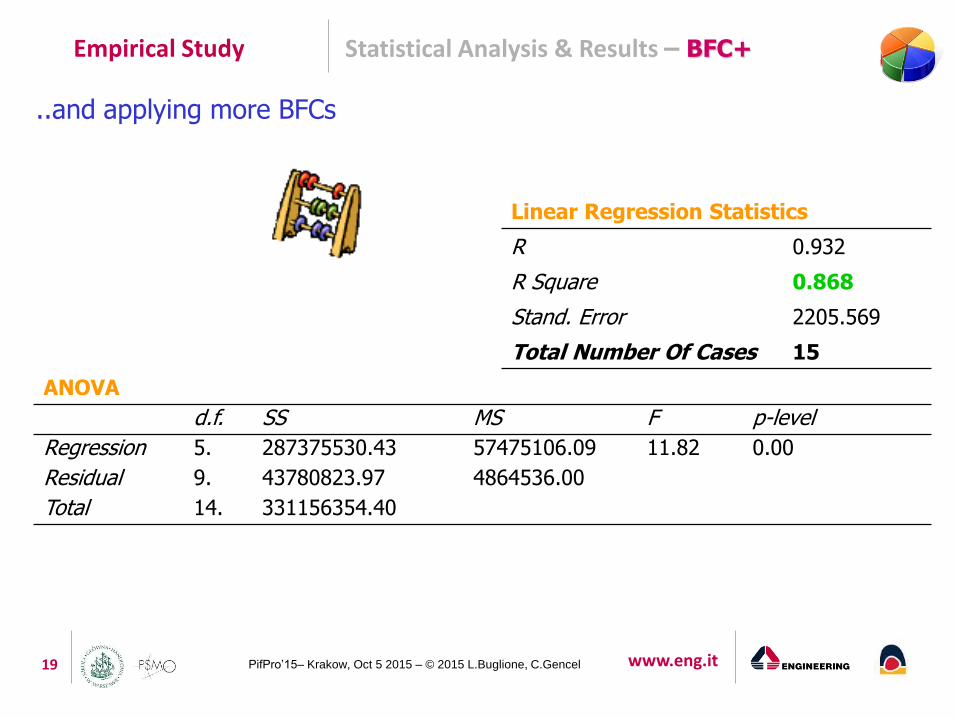
Empirical Study Statistical Analysis & Results – BFC+
..and applying more BFCs
Linear Regression Statistics
R 0.932
R Square 0.868
Stand. Error 2205.569
Total Number Of Cases 15
ANOVA
d.f. SS MS F p-level
Regression 5. 287375530.43 57475106.09 11.82 0.00
Residual 9. 43780823.97 4864536.00
Total 14. 331156354.40
www.eng.it 20 PifPro’15– Krakow, Oct 5 2015 – © 2015 L.Buglione, C.Gencel
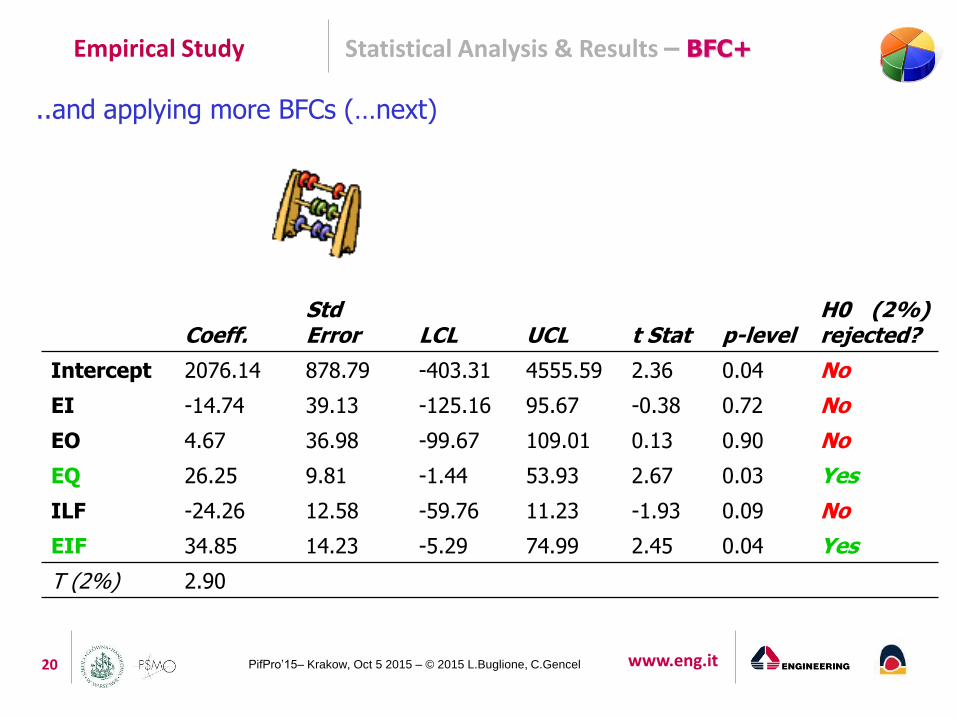
Empirical Study Statistical Analysis & Results – BFC+
..and applying more BFCs (…next)
Coeff. Std Error LCL UCL t Stat p-level
H0 (2%) rejected?
Intercept 2076.14 878.79 -403.31 4555.59 2.36 0.04 No
EI -14.74 39.13 -125.16 95.67 -0.38 0.72 No
EO 4.67 36.98 -99.67 109.01 0.13 0.90 No
EQ 26.25 9.81 -1.44 53.93 2.67 0.03 Yes
ILF -24.26 12.58 -59.76 11.23 -1.93 0.09 No
EIF 34.85 14.23 -5.29 74.99 2.45 0.04 Yes
T (2%) 2.90

www.eng.it 21 PifPro’15– Krakow, Oct 5 2015 – © 2015 L.Buglione, C.Gencel
Empirical Study Statistical Analysis & Results
Subset # prj R2
w/Total FP
Is Total FP significant?
R2 w/FP for each BFC Type
Diff% (R2)
Which BFC Types are
significant?
#1 37 0.290 Yes 0.369 +21% No
#2 14 0.057 No 0.838 +93% Yes (ILF)
#3 15 0.667 Yes 0.868 +23% Yes (EQ, EIF)
#4 16 0.720 Yes 0.893 +19% Yes (EO)
Data set # points EI EO EQ ILF EIF
Subset1 37 16.9% 24.6% 19.3% 21.7% 17.6%
Subset2 14 19.8% 39.0% 6.3% 14.4% 20.6%
Subset3 15 17.0% 21.6% 22.8% 23.4% 15.3%
Subset4 16 18.7% 31.0% 11.4% 27.7% 11.2%
% distribution of BFC types by value
Summary Data

www.eng.it 22 PifPro’15– Krakow, Oct 5 2015 – © 2015 L.Buglione, C.Gencel
BFC Types Conclusions & Perspectives • FSM Methods
Born with the goal to provide more objectivity in sizing FUR for a software system The IFPUG method has the heritage of the Albrecht’s FPA and evolves it from 1986 Current version is v4.3.1 (Jan 2010) and is also an ISO standard (20926:2009) Several methods have arisen and share common principles and background (ISO 14143-x)
• BFC Types Each FSM method has a series of basic countable elements contributing to the final fsu
value, generically called by ISO “BFC” IFPUG FPA has 5 BFC: EI, EO, EQ, ILF, EIF Regression analysis with ANOVA
Sizing & Estimation issues R2 values increased in 3 out of 4 cases (from +19% till +93%) Programming language (no set in subset #1) can impact in absolute terms on
predictability Some lessons learned
Positive Effects: using that approach yet at lower maturity levels (e.g. ML2) can improve significantly estimates, helping in saving resources to be reinvested in other project activities, anticipating also the achievement of ML3 concepts (e.g. PAL) functional profiles
Precondition: gather historical FSM data at that level of granularity …let’s remember when estimating anyway that any fsu is a product size for software FURs
(and not a project size) deal with NFR and their impact on the overall project effort within the defined project scope
New issues ISBSG D&E r13 increased the number of projects to 6670, more fields (also for Agile
projects) Same analysis (and profiles) can be investigated for nfsu (e.g. using non-functional
models/techniques) for depicting non-functional profiles

www.eng.it 23 PifPro’15– Krakow, Oct 5 2015 – © 2015 L.Buglione, C.Gencel
Lessons Learned... BFC Types
UR
L:
ww
w.d
ilbert
.com

www.eng.it 24 PifPro’15– Krakow, Oct 5 2015 – © 2015 L.Buglione, C.Gencel
Q & A
Dziękuję za uwagę!
Thanks for your attention!
BFC Types

www.eng.it 25 PifPro’15– Krakow, Oct 5 2015 – © 2015 L.Buglione, C.Gencel
Our Contact Data
Cigdem Gencel Deiser
Luigi Buglione
Engineering Ingegneria Informatica/ETS [email protected]
BFC Types