the sky did not fall: the pacific northwest’s response...
TRANSCRIPT

The Sky Did NOT Fall:The Pacific Northwest’sResponse to Logging
Reductions
ECONorthwest
99 W. Tenth, Suite 400Eugene, OR 97401
(541) 687-0051
Prepared for:
Earthlife Canada FoundationSierra Club of British Columbia
April 1999
© ECONorthwest, 1999
Ernie Niemi, Ed Whitelaw, and Andrew Johnston

i
Executive Summary
On May 29, 1991, Federal District Judge William Dwyer, ruling on alawsuit filed by environmental groups seeking to prevent the extinction ofthe northern spotted owl, banned new timber sales on 24 million acres in 17national forests in Oregon, Washington, and Northern California. Numerousearlier attempts to curtail logging had been dodged by the White House,Congress, and forest managers. This time, the decision could not besidestepped.
The injunction and related events reduced timber harvests in Oregon andWashington (the Pacific Northwest, or PNW) from a peak level of 15.7 billionboard feet (bbf) in 1988 to 8.3 bbf in 1996.
The reduction in logging triggered widespread fear of economiccatastrophe. Some predicted as many as 150,000 workers would lose theirtimber-related jobs, hundreds of communities would become economicwastelands, and the region as a whole would fall into a depression thatwould take years, if not decades, to reverse.
These dire predictions, however, did not materialize. Instead ofcollapsing, the region’s economy expanded. The PNW weathered virtuallyunscathed the national economic recession that occurred at about the sametime as Judge Dwyer’s ruling, and both Oregon and Washington haveconsistently outperformed the national economy throughout the 1990s.While timber harvests fell 86 percent on federal lands and 47 percent overallfrom their peak in 1988 to 1996, employment in the lumber-and-wood-products industry, which constitutes the bulk of the timber industry in thePNW, fell 22 percent. In contrast, total employment rose 27 percent.
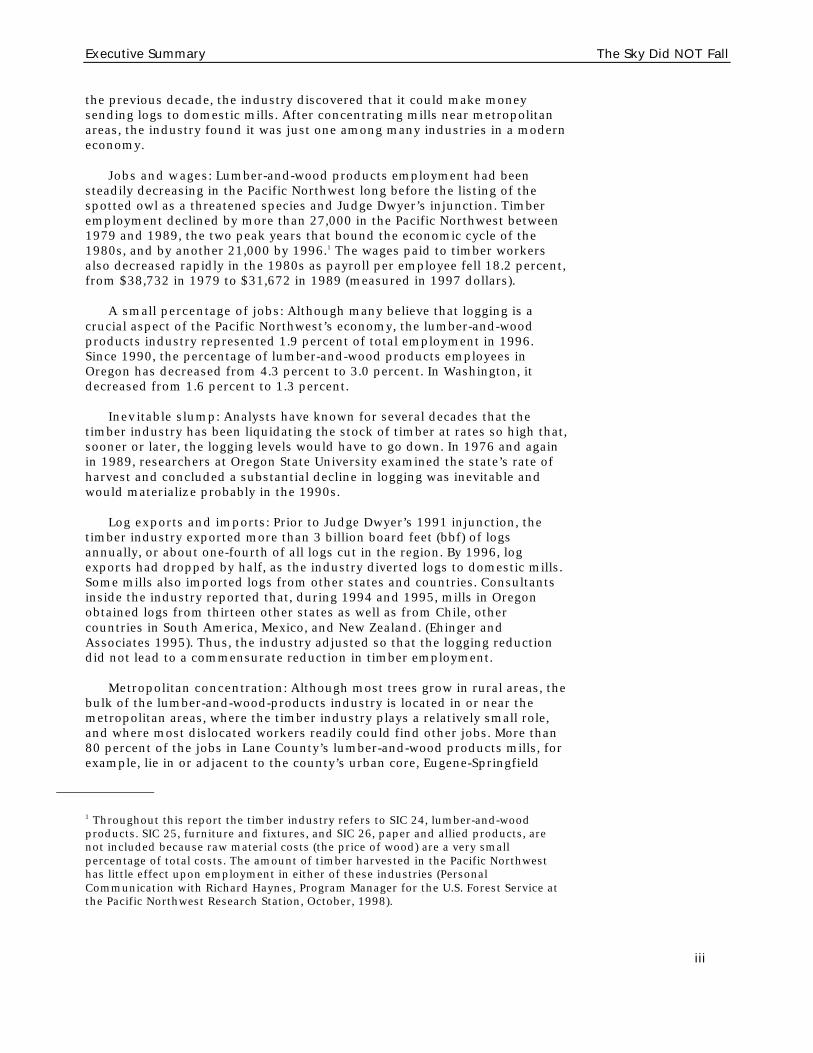
Why was the actual impact so much less than that predicted by so many?Figure E-1 summarizes the major reasons. They fall into two sets: logging’simportance to the economy had diminished markedly and, conversely,unlogged forests had become much more important by the beginning of the1990s.
Logging’s Economic Importance HasDiminished MarkedlyOnce the king of industries in the Pacific Northwest, by 1991 the timberindustry had lost its crown. As it responded to Judge Dwyer’s logging ban,the PNW found that it did not have to log massive acreages to prosper. Theindustry, itself, had made logging less important. After slashing jobs andwages in the 1980s, the industry provided only a small percentage of theregion’s jobs. After logging at unsustainable rates for decades, it faced aninevitable drop in logging. After exporting millions of logs to Asia during

Figure E-1: Major Factors Why Logging Reductions to Protect the EnvironmentDid Not Trigger Economic Calamity in the Pacific Northwest
Logging’s Economic Importance Unlogged Forests Became MoreDiminished Markedly Important to the Economy
Source: ECONorthwest.
The timber industry slashed jobsand wages in the 1980s.
By 1990, the timber industryprovided only 3.1 percent of alljobs in the region.
Unsustainable past logging levelsmeant logging had to decline in the1990s, regardless of spotted owls.
The industry responded to loggingreductions by reducing log exportsand increasing log imports.
Most jobs in the industry are in ornear metropolitan areas.
Nonextractive industries dominatethe PNW and generate most newjobs.
The services derived from healthyforests attract households andfirms to the region and create jobs.
Subsidies to logging have becomeintolerable.
Logging can force the eliminationof jobs in industries dependent onhealthy forest environments
The cost of cleaning up logging’smess is a burden on the entireregional economy.
Executive Summary The Sky Did NOT Fall
iii
the previous decade, the industry discovered that it could make moneysending logs to domestic mills. After concentrating mills near metropolitanareas, the industry found it was just one among many industries in a moderneconomy.
Jobs and wages: Lumber-and-wood products employment had beensteadily decreasing in the Pacific Northwest long before the listing of thespotted owl as a threatened species and Judge Dwyer’s injunction. Timberemployment declined by more than 27,000 in the Pacific Northwest between1979 and 1989, the two peak years that bound the economic cycle of the1980s, and by another 21,000 by 1996.1 The wages paid to timber workersalso decreased rapidly in the 1980s as payroll per employee fell 18.2 percent,from $38,732 in 1979 to $31,672 in 1989 (measured in 1997 dollars).
A small percentage of jobs: Although many believe that logging is acrucial aspect of the Pacific Northwest’s economy, the lumber-and-woodproducts industry represented 1.9 percent of total employment in 1996.Since 1990, the percentage of lumber-and-wood products employees inOregon has decreased from 4.3 percent to 3.0 percent. In Washington, itdecreased from 1.6 percent to 1.3 percent.
Inevitable slump: Analysts have known for several decades that thetimber industry has been liquidating the stock of timber at rates so high that,sooner or later, the logging levels would have to go down. In 1976 and againin 1989, researchers at Oregon State University examined the state’s rate ofharvest and concluded a substantial decline in logging was inevitable andwould materialize probably in the 1990s.
Log exports and imports: Prior to Judge Dwyer’s 1991 injunction, thetimber industry exported more than 3 billion board feet (bbf) of logsannually, or about one-fourth of all logs cut in the region. By 1996, logexports had dropped by half, as the industry diverted logs to domestic mills.Some mills also imported logs from other states and countries. Consultantsinside the industry reported that, during 1994 and 1995, mills in Oregonobtained logs from thirteen other states as well as from Chile, othercountries in South America, Mexico, and New Zealand. (Ehinger andAssociates 1995). Thus, the industry adjusted so that the logging reductiondid not lead to a commensurate reduction in timber employment.
Metropolitan concentration: Although most trees grow in rural areas, thebulk of the lumber-and-wood-products industry is located in or near themetropolitan areas, where the timber industry plays a relatively small role,and where most dislocated workers readily could find other jobs. More than80 percent of the jobs in Lane County’s lumber-and-wood products mills, forexample, lie in or adjacent to the county’s urban core, Eugene-Springfield
1 Throughout this report the timber industry refers to SIC 24, lumber-and-woodproducts. SIC 25, furniture and fixtures, and SIC 26, paper and allied products, arenot included because raw material costs (the price of wood) are a very smallpercentage of total costs. The amount of timber harvested in the Pacific Northwesthas little effect upon employment in either of these industries (PersonalCommunication with Richard Haynes, Program Manager for the U.S. Forest Service atthe Pacific Northwest Research Station, October, 1998).
The Sky Did NOT Fall Executive Summary
iv
(Niemi and Whitelaw 1994). Almost half of Washington’s timber jobs occur inthe Puget Sound area (Conway et al. 1991), and many of the remaining liewithin commuting distance of Olympia and Vancouver. The spotted-owlregion, concentrated west of the Cascades, contains 38 counties and ninemetropolitan areas. Several of these experienced year-to-year declines inemployment since 1990, but only two counties, containing a tiny percentageof the region’s overall employment, had fewer jobs in 1996 than in 1990, theyear before Judge Dwyer’s ruling. These two counties were adjacent tocounties experiencing rapid job growth.
Unlogged Forests Have Become MoreImportant to the Economy
While the timber industry’s importance to the PNW economy shrank, therest of the economy boomed. In effect, the vast majority of the economydecoupled itself from the timber industry. But the economy has notdecoupled itself from the forest. Indeed, the vitality of the region’s economydepends in no small part on the health and vitality of its forests. A standingforest often is now more valuable to the economy than a logged one.
Many firms locate in the PNW because it has a good workforce and manyworkers, in turn, are here because they cherish the quality of life. Healthyforests contribute far more to the quality of life than stumps do. In addition,residents of the region and the nation have learned more about the highcosts they bear to support the timber industry, costs that include subsidies,the loss of jobs in other industries, and the costs of cleaning up theenvironmental mess that logging leaves behind.
Nonextractive industries dominate the PNW: Whereas in the distantpast, regional economies grew largely by their ability to exploit their naturalresources, in today’s economy it is more important to have a skilled,productive workforce. Service industries now constitute the bulk of theeconomy and show the greatest ability to generate new jobs and higherincomes. Increasingly, the prosperity of the region and its communitiesdepends on the ability to attract and retain skilled workers.
Forest-related services attract households and firms: Forests can boostthe economy in two major ways: by providing commodities (logs) or services(recreational opportunities, clean water, etc.). As the timber industry shrinksand non-timber industries grow, the services become more important.Residents of the region derive numerous services from healthy forests. Theservices constitute, in effect, a second paycheck that complements the firstpaycheck they derive from their place of employment, pension program, andso forth.
Far more residents of the PNW receive a second paycheck than a firstpaycheck from the region’s forests. A 1997 analysis of federal lands in theColumbia River Basin between the Cascades and Rockies, for example, foundthat the services associated with unroaded areas, camping spots, fishingholes, and so forth, accounted for 89 percent of the total value of allcommodities and services derived from those lands in 1995. The value oftimber was only 11 percent of the total (Haynes and Horne 1997). The

Executive Summary The Sky Did NOT Fall
v
authors predicted that, by 2045, timber will have decreased to just 5 percentof the total.
Intolerable subsidies: At the end of the 1980s and into the 1990s criticsof logging on federal lands began to document the full costs such loggingimposed on taxpayers. They took these steps after finding that the agenciesadministering federal lands did not provide a full accounting of logging’scosts. Direct subsidies occur when federal agencies sell timber for a pricethat is lower than the agencies’ costs of making the sale. One analysis foundthat the national forests of Oregon and Washington lost nearly $178 millionin fiscal year 1995 (Wilderness Society 1997). Another subsidy materializeswhen firms in the timber industry fail to pay premiums covering the fullcosts of unemployment insurance, so that workers and business owners inother industries have to make up the difference. In Oregon alone, thissubsidy amounted to $192 million for the years 1980-90 (Niemi andWhitelaw 1995).
Cleaning up logging’s mess: Another form of subsidy is the cost thatsociety as a whole incurs to clean up the environmental and social mess thatremain after forests are logged. These costs have become far more clear asthe region has had to cope with the threat of extinctions for owls, salmon,marbled murrelets, bull trout, and other species. Logging is not the solecause of these threats, but it surely is a major contributor. The full cost ofcleaning up logging’s mess is not known. But there is a growing recognitionthat the cost is large enough to warrant preservation of forests.
Logging can eliminate jobs: The subsidies to timber extract money fromhouseholds and firms in other industries. In effect, they act like a punitivetax on non-timber economic activities, reducing the ability of firms in othersectors to grow and generate jobs. In addition, logging’s negative impact onfish populations has, in turn, had a negative impact on jobs in thecommercial and recreational fishing industries. An analysis early in thedecade estimated that as many as 60,000 fishing-related jobs were at risk(Oregon Rivers Council 1991).
The public’s recognition that logging can have a negative impact on jobsdramatically altered its response to logging reductions. Until then, JudgeDwyer’s injunction and related actions were cast as jobs vs. owls, i.e., acontest between the economy and the environment. Afterward, however, thepublic generally realized that the issues were far more complex. To someextent, the region has prospered despite the logging reductions simplybecause the timber industry is such a small portion of the regional economy.More important, though, the mounting evidence indicates the region hasprospered in part because of the logging reductions, insofar as they reducedthe subsidies, cleaning-up costs, and job losses that accompany logging.
ReflectionsResidents of the Pacific Northwest have learned a lot about themselves
and their economy since Judge Dwyer shut down the timber-sale program onnational forests with spotted-owl habitat. Contrary to expectations,quantifiable job losses following Judge Dwyer’s ban on new timber salesoccurred in only a few places and, with the exception of an even smallernumber of places, for only a short time. As a result, residents of the Pacific

The Sky Did NOT Fall Executive Summary
vi
Northwest have learned not to fear logging reductions, and they’ve learnedthis lesson so profoundly that it is difficult to remember how pervasive andintense was the fear back in May, 1991.
By losing their fear, Oregonians and Washingtonians have realized thatthe timber industry no longer drives the regional economy.
Residents of the Pacific Northwest also have come to appreciate theeconomic importance of healthy, standing forests that provide clean water, adiverse mix of species, recreational opportunities, and countless otherservices. The availability of these services contributes mightily to the qualityof life enjoyed by residents of the region and thereby increasing their overallstandard of living. The high quality of life attracts skilled workers to theregion, reinforcing its competitive edge relative to the rest of the nation andother countries, in an era of growing global competition.
The debate over how much forest to log, and how to log it, is not over. Asgrowth in consumers’ demand for services from the region’s forestscontinues to outstrip growth in their demand for timber, they will exert evermore pressure to reduce logging further. Some landowners, workers,communities, and political leaders who have invested heavily in timber willresist these economic pressures. If the past serves as a guide to the future,those who resist may themselves benefit in the short run but only as theyimpede the long-run expansion of the region’s overall economic prosperity.

vii
Contents
Executive Summary.................................................................................... i
Contents ......................................................................................................vii
Chapter 1: Reader's Guide To This Report......................................1What Is This Report? ............................................................................. 1Who Prepared This Report?.................................................................... 1How Can You Get Additional Information?.............................................. 2
Chapter 2: Timber and the Economy of the PacificNorthwest: a Brief History .....................................................................3
The Injunctions' Impacts on Timber Harvest........................................... 4Events Leading to the Injunctions .......................................................... 6After the Injunctions: The Northwest ForestPlan and Beyond ................................................................................... 9The Economy: Predictions of CatastropheDid not Materialize ............................................................................. 13Reflections ......................................................................................... 18
Chapter 3: The Response of the PNW’s Economyto Logging Reductions ......................................................................... 21
The Regional Economy's Response to Logging Reductions.................... 21Impacts on Counties and Metropolitan Areas ....................................... 26The Injunctions Caused How Many WorkersTo Lose Their Jobs?............................................................................. 30Reflections ......................................................................................... 36
Chapter 4: Explaining the Economy's Response:a Model that Does NOT Work ............................................................ 39
The Economic-Base Model ................................................................... 39Why the Economic Base Model Doesn't Work ........................................ 40Reflections ......................................................................................... 44
Chapter 5: Explaining the Economy's Response: a Model that DOES Work .................................................................... 45
Forests and the Economy: More Than Just Trees................................... 46The Competition for Forest Resources ................................................. 49Other Factors Influencing Forest-Resource Competition........................ 55Reflections ......................................................................................... 59
Chapter 6: Reexamining the Evidence:Why the Sky Did NOT Fall ................................................................... 61
The Economy Grew Despite Logging Reductions................................... 61The Economy Grew Because of Logging Reductions.............................. 64Reflections ......................................................................................... 72
References................................................................................................. 75

1
Chapter 1: Reader’sGuide to This Report
“The sky is falling down.”—Chicken Little
What Is This Report?In this report we describe the economy’s response to dramatic reductions
in logging that occurred in the Pacific Northwest during the 1980s and1990s. We describe the intense fears that accompanied the onset of thereductions, and explain why these fears did not materialize. In the process,we describe how the timber industry, itself, made logging less important tothe economy, and explain the logical errors of the economic-base models thatsupporters of logging use to exaggerate the timber industry’s importance. Wethen discuss the competing demands for forest resources in today’s moderneconomy and show how the demands for services—such as clean water, awide diversity of species, and recreational opportunities—is outstripping thedemands for logs.
Throughout the report, we highlight and discuss lessons from thisexperience that might be applicable outside the Pacific Northwest. Loggingreductions were inevitable. The inevitability arose from two sources. First,past policies and economic conditions provided strong incentives to log old-growth forests faster than the land could replace them, so that, ultimately,the logging boom had to bust. Second, the shift in consumers’ preferencesstrongly favored recreational and other forest services from healthy,standing forests over timber from logged forests. Workers, investors,communities, and regions that take advantage of these factors couldexperience logging reductions and prosper. Those who fought against themultimately will still experienced logging reductions, but at a potentially greatcost.
Who Prepared This Report?This report was prepared by Ernie Niemi, Ed Whitelaw, and Andrew
Johnston, of ECONorthwest, with support from the W. Alton JonesFoundation. We gratefully acknowledge the comments of Eban Goodstein,Lisa Matthaus, Richard Haynes, Tom Green, and Todd True, as well as theassistance of the many individuals who provided us with information andinsight. We, alone, however, are responsible for the report’s contents.
We have prepared this report based on our general knowledge of thetimber industry and the economy of the Pacific Northwest, and withinformation derived from government agencies, private statistical services,the reports of others, interviews of individuals, or other sources believed tobe reliable. ECONorthwest has not verified the accuracy of such information,however, and makes no representation regarding its accuracy or

The Sky Did NOT Fall Chapter 1
2
completeness. Any statements nonfactual in nature constitute the authors’current opinions, which may change as more information becomes available.
How Can You Get Additional Information?For further information regarding the contents of this report, please
contact:
Ernie NiemiECONorthwest99 West 10th AvenueEugene, Oregon 97401phone: 541-687-0051email: [email protected].

3
Chapter 2: Timber and the Economy ofthe Pacific Northwest: A Brief History
For many observers, May 29, 1991, marks a turning point in the timberindustry and its economic role in the Pacific Northwest (PNW). On that datein Seattle, Federal District Judge William Dwyer shut down virtually the entiretimber-sale program on nine national forests in Washington and Oregon1
until the U.S. Forest Service (USFS) and other federal resource-managementagencies could demonstrate that they had reversed “a remarkable series ofviolations of the environmental laws” (Dwyer 1991). In particular, JudgeDwyer issued an injunction forbidding the Forest Service from selling moretimber in suitable spotted owl habitat until it could provide assurance that itcould sell timber without significantly undercutting the continued survival ofthe northern spotted owl, a species threatened with extinction. Otherinjunctions extended the spotted-owl curtailment of timber harvests to coverother federal lands and other protected species.
The injunctions sparked widespread economic fear, fanned by numerousformal and informal predictions that they would cause economic collapse. Inthis chapter we describe the chain of events that reduced timber harvests inthe region, the actual changes in timber harvests that have accompaniedJudge Dwyer’s injunction and related decisions, and the range of economicpredictions that swept through the region over the past decade. The chapterhas five sections:
♦ The injunctions’ impacts on timber harvest.
♦ Events leading to the injunctions.
♦ The Northwest Forest Plan and other events that followed theinjunctions.
♦ Predictions of economic catastrophe that did not materialize.
♦ Reflections on the economic significance of the region’s response to theinjunctions.
1 The injunction applied to 17 national forests in Oregon, Washington, and NorthernCalifornia, but primarily to national forests in western Oregon and Washington. Wegenerally exclude Northern California from our discussion in this report because ofthe difficulty in assembling relevant data that are comparable to data for westernWashington and Oregon. Elsewhere (ECONorthwest 1996) we have examined theeconomy-forest relationship in Northern California and reached conclusions similarto those we describe here.

The Sky Did NOT Fall Chapter 2
4
The Injunctions’ Impacts on Timber HarvestJudge Dwyer’s ruling and the others that followed dominated news
headlines for months. Most reporters and editors focused on what theyunderstood would be the dramatic impact the injunctions would have on thetimber harvests from federal lands.
Judge Dwyer’s injunction immediately stopped the scheduled sale ofabout 1.5 billion board feet (bbf)2 per year.3 Other injunctions andadministrative actions preceding and following Judge Dwyer’s decisionreduced federal timber harvests in western Oregon and Washington from a1983-87 average of 3.8 bbf to less than 0.5 bbf in 1996 (see Table 2.1). Totalfederal harvests in the two states fell from 5.6 bbf to 0.9 bbf, and totalharvest from all lands dropped from 14.3 bbf to 8.3 bbf. During the period,westside federal harvests, total statewide federal harvests, and totalstatewide harvests fell 87, 84, and 42 percent.
Table 2.1: Change in Federal and Total Harvests from theMid 1980s to 1996
1983-1987 average 1996
AreaFederal
Harvest a,b
TotalHarvestb
Federal asa % of Total
FederalHarvest a,b
TotalHarvestb
Federal as a %of Total
Western OR & WA 3,787 11,212 33.8% 478 6,379 7.5%
Pacific Northwestc 5,558 14,304 38.9% 871 8,289 10.5%
Oregon 4,316 8,015 53.8% 690 3,922 17.6%
Westside OR 2,927 6,091 48.1% 444 3,091 14.3%
Eastside OR 1,389 1,924 72.2% 246 831 29.6%
Washington 1,242 6,289 19.8% 181 4,366 4.2%
Westside WA 860 5,121 16.8% 34 3,288 1.0%
Eastside WA 382 1,168 32.7% 147 1,078 13.7%a Federal harvests include only harvests from lands managed by the Forest Service and theBureau of Land Management.b Million board feet.c The Pacific Northwest includes state totals of Oregon and Washington.
Source: ECONorthwest with data from the Oregon Department of Forestry and the WashingtonDepartment of Natural Resources.
2 A board foot is an amount of wood fiber equivalent to a one-inch-thick board onefoot long and one foot wide. It takes about 7.5 thousand board feet to build anaverage home in America and a billion board feet of lumber is enough to support theconstruction of about 133,000 new homes. Old-growth, Douglas fir stands withspotted-owl habitat contain about 60,000-100,000 board feet per acre.
3The judicial ruling affected these national forests:Washington Westside: Gifford Pinchot, Mt. Baker-Snoqualmie, and OlympicNational ForestsWashington Eastside: Okanogan and Wenatchee National ForestsOregon Westside: Mt. Hood, Rogue River, Siskiyou, Suislaw, Umpqua , andWillamette National ForestsOregon Eastside: Deschutes and Winema National ForestsCalifornia: Klamath, Mendocino, Shasta-Trinity, and Six Rivers National Forests

Chapter 2 The Sky Did NOT Fall
5
Table 2.2: Federal Harvest As A Percent of Total Harvest,By County, 1989
a Federal harvests include only harvests from the land managed by the Forest Service and theBureau of Land Management .
Source: ECONorthwest with data from the Oregon Department of Forestry and the WashingtonDepartment of Natural Resources.
The potential impact was even more severe in some counties. Table 2.2shows the importance of federal harvests, relative to total harvest, for eachWestside county in Oregon and Washington. The spotted-owl injunctions offederal timber sales threatened to eliminate 31 percent of the total Westsideharvest in the two states—13 percent in western Washington and 47 percentin western Oregon. Josephine County in southern Oregon had the highest
CountyFederal Harvest a
(million board feet)Total Harvest
(million board feet)Federal Harvest as a Percent of Total
Benton 48 170 27.9%Clackamas 144 257 56.1%Clatsop 0 234 0.0%Columbia 1 265 0.5%Coos 144 486 29.6%Curry 126 167 75.3%Douglas 790 1,237 63.9%Hood River 36 65 55.0%Jackson 237 419 56.5%Josephine 148 172 85.8%Lane 712 1,275 55.8%Lincoln 116 333 35.0%Linn 211 464 45.6%Marion 67 116 58.1%Multnomah 14 27 50.8%Polk 12 145 8.5%Tillamook 86 170 50.6%Washington 3 85 3.2%Yamhill 31 146 21.3%Clallam 41 410 10.0%Clark 0 119 0.0%Cowlitz 9 527 1.8%Grays Harbor 46 751 6.1%Island 0 18 0.0%Jefferson 41 284 14.5%King 52 334 15.7%Kitsap 0 48 0.0%Lewis 188 749 25.1%Mason 26 387 6.8%Pacific 0 372 0.0%Pierce 28 229 12.2%San Juan 0 4 0.0%Skagit 18 271 6.8%Skamania 193 270 71.8%Snohomish 46 270 17.2%Thurston 0 195 0.0%Wahkiakum 0 108 0.0%Whatcom 18 144 12.4%Western Washington 708 5,492 12.9%Western Oregon 2,926 6,232 47.0%Western OR & WA 3,635 11,724 31.0%
The Sky Did NOT Fall Chapter 2
6
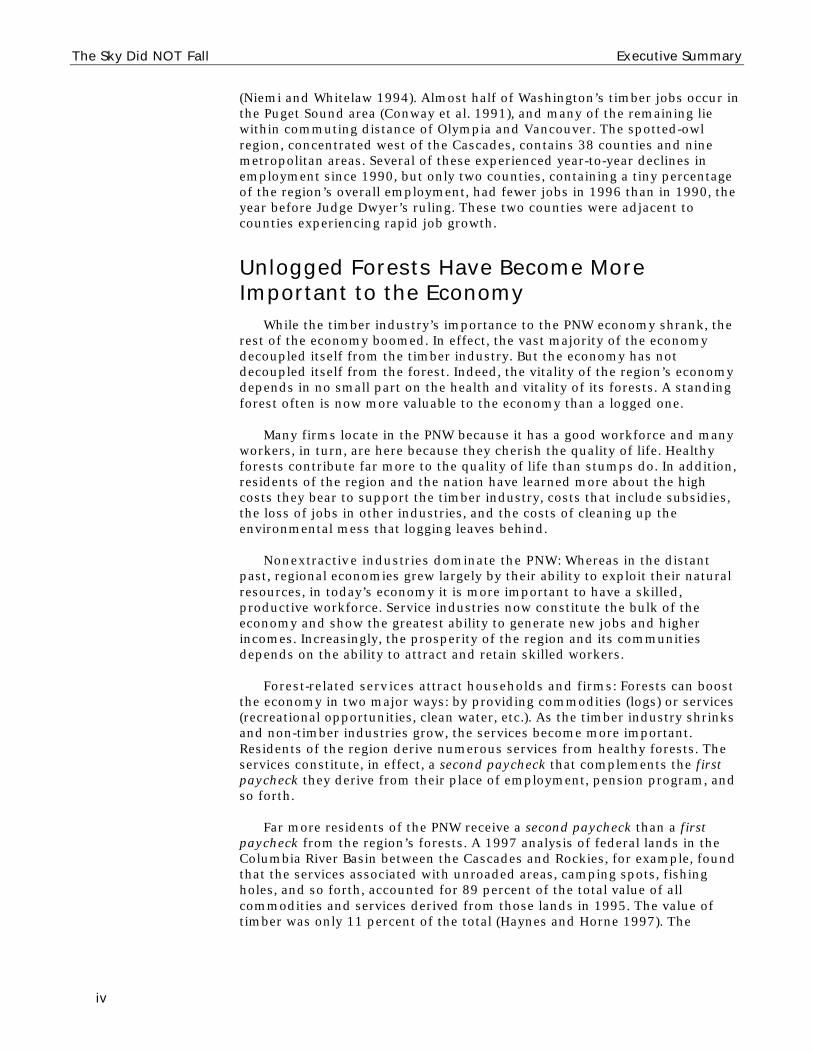
concentration of federal harvests and the injunctions affected 85.8 percentof the total harvest.
Table 2.3: Acreage in the Range of the Northern Spotted Owl
Federal Nonfederal
Washington 8,839,100 12,494,400
Westside 5,366,900 10,284,400
Eastside 3,472,200 2,210,000
Oregon 9,564,100 11,830,400
Westside 8,006,600 11,062,900
Eastside 1,557,500 767,500
California 5,856,800 8,416,700
Three-State Total 24,260,000 32,741,500
Source: ECONorthwest with data from FEMAT, Table II-1.
The northern spotted owl’s range encompasses about 57 million acres offorested and nonforested lands in Washington, Oregon, and California (seeTable 2.3). Of this total, about 24 million acres of the spotted owl range islocated on federally owned lands.
Events Leading to the Injunctions4
The injunctions against timber sales on federal lands were not entirelyunanticipated. Controversy over logging’s impact on the northern spottedowl and other species5 dependent on old-growth forests west of the Cascades(Westside) had been growing for more than 25 years and had erupted into afull-blown battle during the latter half of the 1980s. In 1972, researchersdocumented that northern spotted owls in Oregon seemed to locateprimarily in the Westside old-growth forests that are dominated by largeDouglas fir trees. By 1978, the research clearly indicated that eithercontinued logging of old-growth would jeopardize spotted-owl habitat and,hence, the viability of the existing population, or measures to accomplisheffective conservation of the owl would significantly reduce old-growthtimber harvests. By this time, most of the old-growth on private lands hadbeen logged, and it was apparent that most of the burden of owlconservation would fall on federal timberlands.
In 1981 the U.S. Fish and Wildlife Service concluded that the northernspotted owl did not warrant special protections associated with theEndangered Species Act, but observed that “the owls’ dependence on large
4 Most of the discussion in this section is from Thomas, et al. (1993), which describeshow spotted-owl issues evolved and impinged on forest-management policy until1993. Another useful history is Durbin (1996).
5 There are 1,116 terrestrial species closely associated with the late-successional andold-growth forests of the spotted-owl region (U.S. Department of Agriculture and U.S.Department of the Interior 1994, S-16).

Chapter 2 The Sky Did NOT Fall
7
areas of old-growth coniferous forest make them extremely vulnerable. Ifcurrent trends in old-growth timber harvest continue, the Northern SpottedOwl could become endangered in a relatively short time” (Thomas, et al.1993). Despite this warning and those of numerous studies, strategies, andplans, Congress and federal land administrators did not develop andimplement an effective conservation strategy. Instead, they stalled, unable orunwilling to accept the inevitable: that spotted-owl conservation wouldrequire marked reductions in timber harvests. They hoped that the problemwould go away or that they could push the problem onto future Congresses,future administrators, and future generations. Indeed, rather than heed the1981 warning from the Fish and Wildlife Service, the White House,congressional leaders and forest managers more-than-doubled federal timberharvests by the middle 1980s. Figure 2.1 shows the increase during 1982-88.
It is tempting, at first blush, to assign responsibility for the inactionsolely to the administrators of the Forest Service and BLM. Certainly, in theirzeal to maintain harvest levels and convert the federal old-growth forests tofarms of smaller, younger trees, they bear much of the blame (Yaffe 1994).They were not alone, however. Urged by lobbyists and major contributorsfrom the timber industry, leading senators and representatives from Oregonand Washington annually maneuvered Congress into setting high loggingquotas and insisted that the agencies meet them.6
Faced with continued inaction by Congress and forest administrators, in1987 an environmental group petitioned the U.S. Fish and Wildlife Service tolist the owl as an endangered subspecies under the Endangered Species Act.The agency denied the petition, saying that the owl population wassufficiently robust that the protections afforded by listing were notwarranted. Environmental groups quickly appealed, saying the agency’saction was motivated by political, not biological, considerations. A federaljudge agreed and ordered the Fish and Wildlife Service to reconsider. Theagency subsequently determined that the biological data did, indeed, supportlisting the owl as a species threatened with extinction.7 Members of Congress,at the urging especially of Senators Hatfield of Oregon and Adams ofWashington, attached Section 318,a rider, to an appropriations bill to protectthe timber industry.8 Setting aside the provisions of the Endangered SpeciesAct, Section 318 declared that current land-management plans andguidelines of the Forest Service and BLM were sufficient to allow timber salesthrough September, 1990.
6 For a larger discussion of the interconnection among the timber industry, Congress,and administrators, see O’Toole (1988) and Wondolleck (1988).
7 The Endangered Species Act allows for a species to be listed as “endangered” if it isin danger of extinction throughout all or a significant portion of its range. A speciesis listed as “threatened” if it is likely to become endangered in the foreseeable futurethroughout all or a significant portion of its range.
8 A rider is an amendment to a bill that has little, if any, bearing on the bill’s mainsubstance. The amendment often is not subject to hearings and other public reviewand sponsors of riders hope that the momentum of the central bill will carry the riderinto law. Members of Congress have often used this technique to avoid publicscrutiny of attempts to short-circuit environmental legislation.
In 1981 the U.S.Fish and WildlifeService concluded,“If current trends inold-growth timberharvest continue,the NorthernSpotted Owl couldbecomeendangered in arelatively shorttime.” Rather thanheed this warning,the White House,congressionalleaders, and forestmanagers more-than-doubledfederal timberharvests by themiddle 1980s

The Sky Did NOT Fall Chapter 2
8
Figure 2.1: PNW Timber Harvests on Federala Lands, 1971-1996
a Federal harvests include only harvests from the federal agencies affected by the northernspotted owl rulings, namely, the U.S. Forest Service, and the Bureau of Land Management.
Source: ECONorthwest with data from the Oregon Department of Forestry and the WashingtonDepartment of Natural Resources.
Section 318 also required the formation of an Interagency ScientificCommittee (ISC), whose charge was to assess the status of the northernspotted owl and “to develop a scientifically credible conservation strategy forthe northern spotted owl.” The Committee’s report (Thomas et al. 1990)called for complex conservation prescriptions on federal lands—includingthe reservation of 5.8 million acres of federal land not previously setaside—that would have the effect of reducing federal timber harvest byabout half. The ISC’s report received high acclaim from the scientificcommunity. The political mainstream, however, received the ISC report withwide-eyed incredulity. Even as they began to accept the reality of thescientific findings, many, if not most, political leaders in the regionconcluded that harvest reductions of this magnitude simply wereunacceptable.
In 1990, the Fish and Wildlife Service finally listed the owl as a threatenedspecies. The agency did not, however, comply with the Endangered SpeciesAct’s requirement that it identify the critical habitat necessary to arrest thereductions in owl populations and support population increases. Activitiesthat might degrade designated critical habitat could not be conducted withfederal funds, the direct participation of a federal agency, or a federalpermit. Environmental groups filed suit to compel the Fish and WildlifeService to designate critical habitat. After a federal judge agreed withplaintiffs, the agency initially proposed designating 11.6 million acres ofcritical habitat, which it later reduced to 6.9 million acres to minimize theinclusion of private lands.
In October, 1990, Section 318 expired, clearing the way for the lawsuitthat led to Judge Dwyer’s May, 1991, ruling. This suit focused not on theEndangered Species Act but on the Forest Service’s failure to comply with theNational Forest Management Act (NFMA). Regulations developed under NMFArequire that the Forest Service shall act so that “[f]ish and wildlife shall bemanaged to maintain viable populations of existing native and desired non-
0
1,000
2,000
3,000
4,000
5,000
6,000
1971 1973 1975 1977 1979 1981 1983 1985 1987 1989 1991 1993 1995
(mmbf)
Western OR Western WA Western OR and WA

Chapter 2 The Sky Did NOT Fall
9
native vertebrate species in the planning area [of a national forest]” (36 C.F.R.§ 219.19). To insure viability, the Forest Service must provide sufficienthabitat to support a minimum population of each species. Because it isinfeasible to monitor every species, the regulations require the agency tomonitor “indicator species,” one of which is the northern spotted owl.Plaintiffs in the lawsuit contended that logging and development hadreduced habitat for the owl to the point that continued logging wouldunreasonably jeopardize its viability.
After the Injunctions:The Northwest Forest Plan and Beyond
Judge Dwyer’s injunction might have induced Congress to change thelaws to allow logging, as it had done two years earlier with the Section 318rider. But several things were different in 1991. One was that Judge Dwyer, inhis ruling, documented prolonged, systematic violations of the law. Part ofthe ruling states:
“More is involved here than a simple failure by an agency to complywith its governing statute. The most recent violation of [the NationalForest Management Act] exemplifies a deliberate and systematicrefusal by the Forest Service and the [Fish and Wildlife Service] tocomply with the laws protecting wildlife. This is not the doing ofscientists, foresters, rangers, and others at the working levels of theseagencies. It reflects decisions made by higher authorities in theexecutive branch of government” (Dwyer 1991).
Another difference came through a broadening of the public’s perceptionof the problem. Judge Dwyer’s ruling allowed environmental groups to arguesuccessfully that the problem was not the owl, but illegal, rogue elementswithin the agencies managing federal lands. In addition, new researchsupported the view that the dispute was over much more than just owls vs.logging.
In May, 1991, Congress commissioned four highly esteemed scientists asthe Scientific Panel on Late-Successional Forest Ecosystems. Known as theGang of Four, their charge was to define and evaluate alternatives formanaging the spotted owl habitat on federal forests. Five months later, theypresented their findings. They concluded that continued logging of old-growth forests in the PNW threatened not just the spotted owl but othervertebrates, salmon, and the overall integrity of old-growth ecosystems(Johnson et al. 1991). Their findings significantly changed the politicalenvironment surrounding forest-management issues, as shown in Figure 2.2.
Each of the milestones shown in Figure 2.2 was important. The enlargedroles of scientists and members of Congress from outside the region erodedthe control that the region’s pro-timber interests had over federal forest-management policies. The Gang of Four showed extensive overlap betweenowl habitat and salmon habitat. This gave a large interest group—salmonsupporters—reason to become involved in the controversy and support owls.
Judge Dwyer, in hisruling, documentedprolonged,systematicviolations of thelaw... [His] rulingallowedenvironmentalgroups to arguesuccessfully thatthe problem wasnot the owl, butillegal, rogueelements within theagencies managingfederal lands.

The Sky Did NOT Fall Chapter 2
10
Figure 2.2: Milestones Associated with the Scientific Panel, 1991
Source: ECONorthwest
Scientists Have a Larger Role
From 1991 onward, scientists have had asmuch to say as bureaucrats and politicians indetermining the design and evaluating theconsequences of forest-management plansin the western U.S.
“Outsiders” Have an Interest
The involvement of Congressionalrepresentatives from outside the PNWreaffirmed the interest the rest of the nationhas in the management of PNW forests andin the administration of the nation’senvironmental laws.
Logging Can Jeopardize Salmon
Prior to this study, the controversy pittedloggers against environmentalists and a little-known and rarely-seen owl. Now, theScientific Panel established that, as loggingof old-growth forests had destroyed the owl’shabitat, it also had important negative effectson salmon habitat. This finding brought thecontroversy home to the large segment ofthe population concerned about salmon.
Forests Should Be Managed As Ecosystems
The Scientific Panel reinforced the messagethat had been bubbling up from the entirescientific community: forests should bemanaged as whole ecosystems, not simplyas stands of timber. As this message tookhold, it became increasingly difficult for theForest Service and BLM to defend timber-harvest programs as isolated from theconcepts of ecosystem management.
Scientific Panel on Late-Successional Forest
Ecosystems(“Gang of Four”)

Chapter 2 The Sky Did NOT Fall
11
Furthermore, the Gang of Four solidified the message that there is a high-ground from which forest managers, politicians, and the public as a wholeshould view forest management. Called ecosystem management, this newapproach involved “a strategy or plan to manage ecosystems to provide forall associated organisms, as opposed to a strategy or plan for managingindividual species” (Johnson et al. 1991). The idea had both scientific supportand intuitive appeal. It seriously undermined those who argued that thecontroversy, narrowly defined as a choice between owls and jobs, woulddisappear if only Congress would set aside environmental protections for theowls. Clearly, far more was at stake.
The Gang of Four’s themes have continued to resonate. Early in his newpresidency, Bill Clinton convened a Northwest Forest Summit in Portland andlistened to speakers representing nearly every side of the forest-managementcontroversy express their views. The President then set in motion a processthat assembled natural and social scientists, managers, and others into aForest Ecosystem Management Assessment Team (FEMAT) charged withdeveloping an integrated assessment of the ecological, economic, and socialissues. FEMAT delivered its report in July, 1993, and, by April, 1994, theprocess produced a forest-management plan—called the Northwest ForestPlan or the President’s Forest Plan—covering all federal forests in the spottedowl region (U.S. Department of Agriculture 1994). The government took thisplan to Judge Dwyer who, on December 21, 1994, found that it just barelysatisfied the conditions he set in 1991 and lifted his injunction on federaltimber sales.
The Northwest Forest Plan called for average annual timber harvests fromfederal lands in the spotted owl region of about 1.1 billion board feet9 (bbf)during the first decade of the plan’s implementation (U.S. Department ofAgriculture and U.S. Department of the Interior 1994, 2-78). This contrastswith harvests that averaged 4.5 bbf during the 1980s. The plan envisionedthat it would take about three years for the detailed scientific andadministrative work to be far enough along so timber harvests would reachthis level, but the work has proceeded more slowly10 Table 2.4 shows theannual targets and the actual performance. In 1995, for example, the actualharvest was about 80 percent of the target.
The adoption of the Northwest Forest Plan did much to diminish thecacophony surrounding forest issues in the Pacific Northwest, but thingshave not been totally silent. West of the Cascades, implementation of thePlan is being challenged by litigation claiming the level of logging is too high(Carrel 1998). To the east, the Forest Service adjusted downward its timber-sale targets. Several agencies initiated a review—the Interior Columbia BasinEcosystem Management Project (ICBEMP)—of ecological, economic, and socialissues associated with the management of 76 million acres of federal landsin the area roughly from the crest of the Cascades in Oregon and Washingtoneastward to the Rockies. The initial findings from ICBEMP have generally
9 Approximately 726 million board feet of this federal harvest will occur on NationalForest and BLM lands west of the Cascades in Oregon and Washington (U.S.Department of Agriculture and U.S. Department of the Interior 1994, 3&4-268).
10 The Northwest Forest Plan proposed that 60% of the timber sales needed to fulfillthe 1.1 bbf sustainable harvest level would be completed in 1995, 80% in 1996, and100% in 1997 (Tuchman et al. 1996, p. 102).
[The Gang ofFour’s report]seriouslyundermined thosewho argued thatthe controversy...[was] a choicebetween owls andjobs. Clearly, farmore was atstake.

The Sky Did NOT Fall Chapter 2
12
paralleled those from FEMAT. Many species and the overall integrity of manyecosystems are in jeopardy, and reducing the jeopardy will require curtailinglogging and other extractive activities, such as cattle grazing (ForestEcosystem Management Assessment Team 1993, IV-185, 186; Quigley andArbelbide 1997).
Table 2.4: Actual Federal Harvest Levels v. Federal TimberSales Proposed by the Northwest Forest Plan, 1994-1997
1994 1995 1996 1997
Northwest Forest Plan’s ProposedTimber Sale Levels 436 581 726
Actual Federal Timber Harvestsa
Western Oregon 339 323 444 331
Western Washington 114 79 34 61
Western OR and WA 453 402 478 392
Difference 34 103 334a Harvests from National Forests and BLM lands only.
Source: ECONorthwest with data from the Oregon Department of Forestry, Tuchman et al.(1996), USDA Forest Service and USDI Bureau of Land Management (1994) and the WashingtonDepartment of Natural Resources.
Other factors affecting timber production include increased pressure forprotecting streams and adjacent riparian areas, especially in response to thelisting of salmon and other fish as either threatened or endangered under theEndangered Species Act.11 The listing of the marbled murrelet as a threatenedspecies created additional protections for coastal old-growth trees. In 1995,Congress passed a rider—similar to Section 318 passed in 1989—declaring,in effect, that the environmental laws did not apply to salvage logging oftrees and using a broad definition of salvage to embrace virtually any standof trees, dead or alive. At the state level, pressures for tighter controls onprivate logging included a voter-initiated ballot measure in November, 1998,which would have essentially prohibited clearcutting on private and state-owned lands in Oregon. Although voters rejected the proposal, virtually allpolitical communities in the state expect better-crafted initiatives to be onfuture ballots.
In the midst of all this, local, regional, national, and global events far toonumerous to mention have influenced the behavior of landowners,millowners, and markets. The overall impacts on PNW timber harvests aresummarized in Table 2.1 and Figure 2.1. They show that, from the middle1980s to the middle 1990s, federal timber harvests have fallen 87 percent forthe region as a whole, and by 96 percent and 85 percent, respectively, forwestern Washington and western Oregon. It is against this backdrop that weevaluate the economic consequences.
11 In 1993 there were 314 “at risk” species in the spotted-owl region, 259 of whomwere located on federal lands (Forest Ecosystem Management Assessment Team 1993,V-10).
Chapter 2 The Sky Did NOT Fall
13
The Economy: Predictions of Catastrophe DidNot Materialize
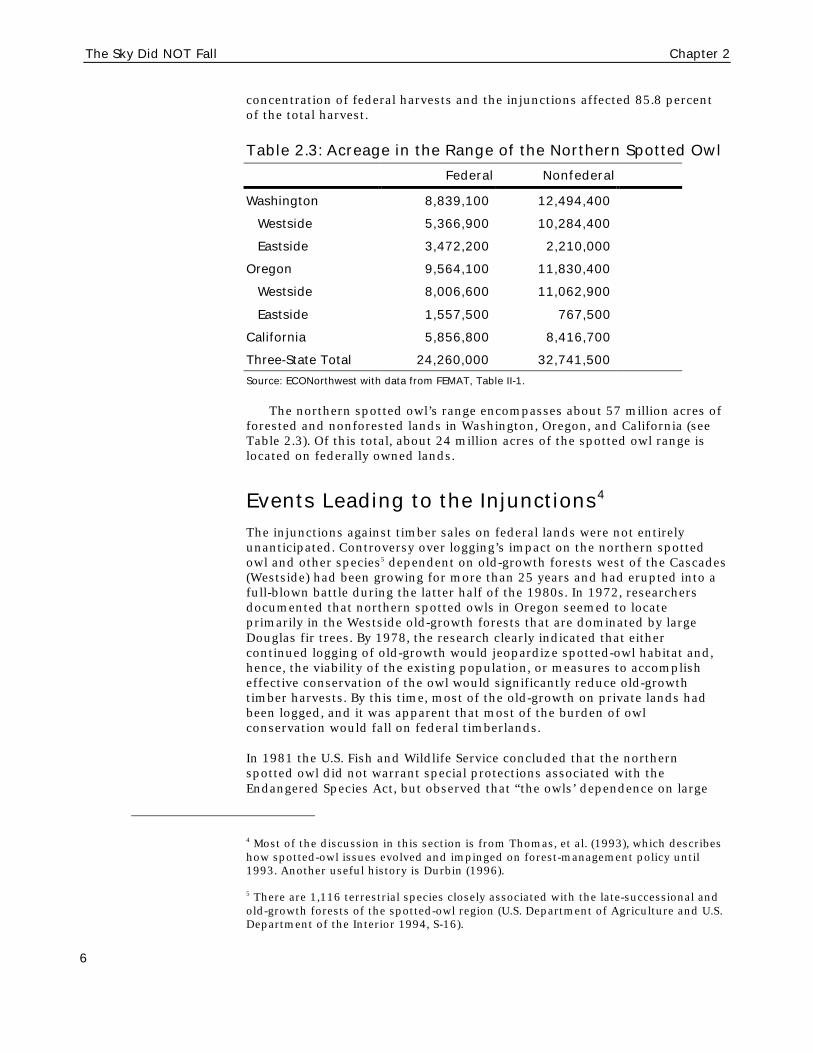
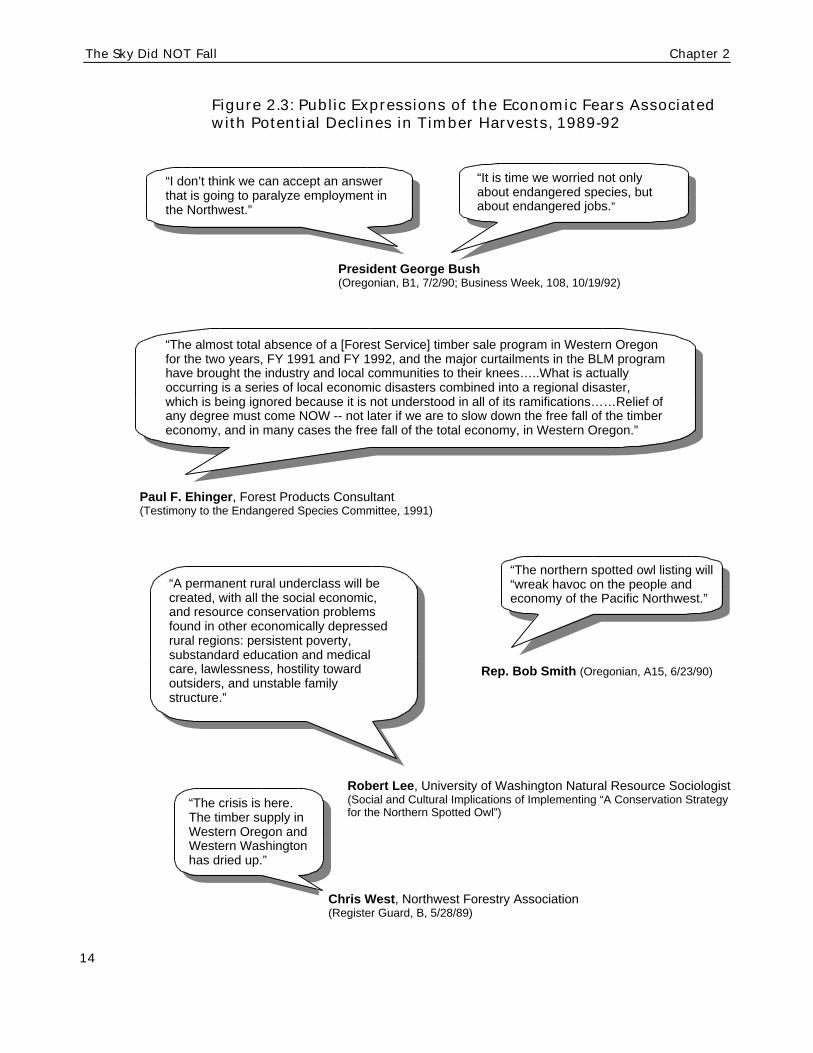
It is hard now to recall the intensity of the fear that accompanied JudgeDwyer’s injunction and the events that surrounded it. Workers feared losingtheir jobs, communities their very existence. Ignorance and propagandaincreased these fears. Few understood how the economy would respond to amajor, abrupt reduction in federal timber harvests. Such an event had neveroccurred before. Numerous groups, with their own agendas and uninhibitedby their ignorance, wildly predicted economic and social catastrophe. Table2.5 samples the predictions of direct, i.e., in the industry, and total job lossespublished between 1989 and 1991. Figure 2.3 shows representative publicstatements expressing fears, fanning them, or both.
Table 2.5: Predictions of Timber-Related Employment Losses, 1989-1991
Author/Sponsor Date Direct EmploymentLosses
Total EmploymentLosses
K.N. Johnson, J.F. Franklin, J.W.Ward, J. Gordon
October, 1991 -- 11,000-61,000 Jobsin the “Owl Region”
M. Rasmussen, W. Maki,D. Olson
1990 -- 109,466 jobs in the“Owl Region”
Institute of Forest Resourcesbased on studies at theUniversity of Washington,University of California, andOregon State University
September,1990
23,000 Jobs in the“Owl Region”
(midrangeassumption)
48,000 Jobs in the “Owl Region”
(midrangeassumption)
D. Olson, J. Beuter, W. Maki(various independent reports)
Summer, 1990 147,193 Jobs in the“Owl Region”
USDA Forest Service, USDIBureau of Land Management
May, 1990 25,409 Jobs in the“Owl Region”
Hamilton et al. 1990 28,165 Jobs in the“Owl Region” by the
Year 2000
Northwest Forest ResourceCouncil
May, 1989 131,400 Jobs inOregon andWashington
E.C. Waters, D.W. Holland, B.A.Weber
1990 16,000 Jobs in the“Owl Region”
37,100 Jobs in the“Owl Region”.
W.J. Mead, D.D. Muraoka, M.Schniepp, R.B. Watson
October, 1990 7,225 Jobs inOregon andWashington
10,000-20,000 Jobsin Oregon andWashington
Source: ECONorthwest with data from Beuter (1990), Hamilton et al. (1990), Institute of ForestResources (1990), Johnson et al. (1991), Maki (no date), Mead et al. (1990), Olson (1990), USDAForest Service and USDI Bureau of Land Management (1990), and Waters et al. (no date).
The Sky Did NOT Fall Chapter 2
14
Figure 2.3: Public Expressions of the Economic Fears Associatedwith Potential Declines in Timber Harvests, 1989-92
“A permanent rural underclass will becreated, with all the social economic,and resource conservation problemsfound in other economically depressedrural regions: persistent poverty,substandard education and medicalcare, lawlessness, hostility towardoutsiders, and unstable familystructure.”
“The crisis is here.The timber supply inWestern Oregon andWestern Washingtonhas dried up.”
“The northern spotted owl listing will“wreak havoc on the people andeconomy of the Pacific Northwest.”
“The almost total absence of a [Forest Service] timber sale program in Western Oregonfor the two years, FY 1991 and FY 1992, and the major curtailments in the BLM programhave brought the industry and local communities to their knees…..What is actuallyoccurring is a series of local economic disasters combined into a regional disaster,which is being ignored because it is not understood in all of its ramifications……Relief ofany degree must come NOW -- not later if we are to slow down the free fall of the timbereconomy, and in many cases the free fall of the total economy, in Western Oregon.”
“It is time we worried not onlyabout endangered species, butabout endangered jobs.”
Rep. Bob Smith (Oregonian, A15, 6/23/90)
President George Bush(Oregonian, B1, 7/2/90; Business Week, 108, 10/19/92)
Paul F. Ehinger, Forest Products Consultant(Testimony to the Endangered Species Committee, 1991)
Chris West, Northwest Forestry Association(Register Guard, B, 5/28/89)
Robert Lee, University of Washington Natural Resource Sociologist(Social and Cultural Implications of Implementing “A Conservation Strategyfor the Northern Spotted Owl”)
“I don’t think we can accept an answerthat is going to paralyze employment inthe Northwest.”

Chapter 2 The Sky Did NOT Fall
15
“If I read it correctly, it looks to me likeyou’re talking about thousands andthousands of jobs lost. I cannotcountenance that. It would be disastrous forSpringfield, Roseburg, and Grants Pass.”
Senator Bob Packwood, R-Ore. (Oregonian, A, 4/5/90)
“We’re looking at tens of thousands offamilies not knowing whether they’re goingto be able to make their mortgagepayments.”
Charlie Janz, owner of Janz Logging(Oregonian, A14, 6/23/90)
“Never in recorded history hasthere ever been a decisionregarding wildlife protection thathas threatened the livelihood ofupward of 50,000 people.”
John Hampton, President of the NorthwestForest Resource Council (Oregonian, A1, 6/23/90)
“We Oregonians have responsibly managed ourforests for 140 years, but here comes Vento and hisgroup of liberal, special interest organizations whowant to shut down Oregon…. Anti-timber groups likeEarth First!, the Sierra Club, the Wilderness Society,the Audobon Society, the Oregon Natural ResourcesCouncil and the National Wildlife Federation don’twant to understand how we live, work and raise ourfamilies in Oregon.”
Rep. Denny Smith, R-Ore. (Register Guard, 5B, 7/20/90)
Troy Reinhart,Douglas Timber Operators(Register Guard, A, 5/29/92)
“This decision (Dwyer’sdecision to keep the timbersales ban in place) will meanmore families will be torn apart,lose their homes and lose theirdreams.”
“If a major portion of the remaining woodproducts mill capacity is shut down in Oregon,Washington and northern California, whateconomic impact will this have aside from thepain and suffering in the communities wherethe closures occur? It is my judgement thatthe mill closures that will occur in 1992,on topof those that have already takenplace…..could have a profound effect on thenational economy and its prospects forrecovery from recession.”
Daniel L. Goldy, consulting economist(Testimony from the God Squad, BLM vs. U.S. Fish and Wildlife Service)
“Let me put the people dimension in this… Mill townsinto ghost towns- that’s what the Fowler Amendment(cuts budget for building logging roads) wouldcreate… It’s so easy to polarize the issues and forgetthe people.”
“If we cut off therenewable resourcefor homes, we areturning our backs onthe homelessness.”
Senator Mark Hatfield, R-Ore. (Oregonian, E15, 10/28/90)

The Sky Did NOT Fall Chapter 2
16
The predictions typically linked the anticipated collapse of smallcommunities to the prospect of massive unemployment. Many in the PNWfound this plausible. The fear of community instability often rested on thefear that actions to protect owls, salmon, and other species would causemassive unemployment.
Unemployment Predictions. The acme in unemployment predictionscame in 1990. The American Forest Resources Association, a timber-industrygroup, predicted that implementation of proposed owl protections wouldreduce total employment in Oregon by 102,000. At the same time, DougOlson, John Beuter, and Wilbur Maki—long-time advocates of the timberindustry’s paramount economic importance—predicted a loss of almost150,000 jobs.
These and most of the other prophets of economic disaster based theirjob-loss predictions on a simplistic model. The assumptions underlying thismodel systematically exaggerated the impacts of logging reductionsattributable to owl protections. The forecasts were way off the mark becausethey made assumptions that proved out of touch with economic reality. Wediscuss the assumptions at length in the next chapter. Here, it is enough tosay that the predictions were based on a simplistic model with the four stepsshown in Figure 2.4
♦ In Step 1, forecasters often assumed that high historical levels of timber-industry employment would continue, if only the owls, salmon, and otherspecies adversely affected by logging would disappear. This assumptionwas wrong for two major reasons. One, the timber industry already wasdramatically reducing the number of workers it took to process a givenamount of timber. Two, the industry had been logging at rates that theforest simply could not sustain, regardless of environmental concerns.
♦ In Step 2, forecasters often assumed that a reduction in timber fromfederal lands would abruptly leave a hole in the supply of timber thatcould not be filled, so that milling activity would decline proportionately.This outcome did not materialize as some nonindustrial landownersbegan selling timber in response to higher prices, some industriallandowners curtailed log exports or began rushing smaller logs to theirmills, and mills imported logs from other states and countries.
♦ In Step 3, forecasters often assumed that the economy was constructedlike a house, with the timber industry as the foundation, or economicbase, atop which the remainder of the economy rested. Hence, anycrumbling of the base would be multiplied in the superstructure.Although this model of economic structure may have had some meritdecades ago when local and regional economies were pretty simple. Butas economies become more diverse and dynamic, the model becomesincreasingly misleading.
♦ In Step 4, forecasters often assumed that workers, business owners, andothers would not, or could not, find ways to shrink the negative economiceffects of any logging reductions stemming from efforts to protect owls,salmon, and other species. In effect, they assumed that people in theregion were stupid, powerless, or both. In truth, they were neither. Mostdisplaced workers found new jobs and most firms held onto existingcustomers or cultivated new ones.
Forecasters oftenassumed ... thatpeople in theregion werestupid,powerless, orboth. In truth,they wereneither.

Chapter 2 The Sky Did NOT Fall
17
Figure 2.4: Analytical Steps Underlying Most Predictions ofHigh Unemployment
Source: ECONorthwest
Community-Instability Predictions. A similar evaluation applies to thevarious predictions about community stability. Numerous local officials,timber-industry advocates, political leaders, and social scientists argued thatthe spotted owl threatened to wreck the many communities they deemedtimber-dependent. The community-instability predictions often began withthe premise that historically high logging levels on federal lands producedstable communities. Absent the owl (and salmon, etc.), this golden age wouldcontinue. The forecasters often assumed that any reduction in federallogging would lead to proportionate reductions in stable employment,commercial activity, tax revenues, volunteerism, and other characteristics oflocal communities. The ability of private and public institutions to provideservices to workers, families, and firms in trouble would plummet, just asthe demand for these services would skyrocket. From this foundation, the
Step 1: Choose the Base Case
Pick some historical period with high levels of harvest andtimber-industry employment. Assume that, absent owl-relatedharvest reductions, the base case would continue into thefuture.
Step 2: Choose an Owl-Protection Scenario
Specify the drop in timber harvest attributable solely to owlprotection and assume that timber-industry employment willfall proportionately. If the projected decline in federal timberharvest equals 10 percent of the total harvest in the basecase, for example, conclude that timber-industry employmentwill fall by 10 percent.
Step 3: Choose a Total-Job Multiplier
Assume that, for every job lost in the timber industry, otherjobs will be permanently lost elsewhere in the economy asthere are fewer timber firms and workers to purchase goodsand services from other industries.
Step 4: Choose a Degree of Economic Rigidity
Specify the extent to which business owners and workers willadjust to the drop in timber harvests to open new lines ofbusiness and find new jobs. Most of these forecasterspredicted that the economy would be totally rigid, thatbusiness owners would permanently close shop and workerswould remain permanently unemployed.

The Sky Did NOT Fall Chapter 2
18
forecasters often predicted uncontrollable increases in homelessness,poverty, substance abuse, family violence, crime, and municipal bankruptcies(U.S. Department of Agriculture and U.S. Department of the Interior 1994;Forest Ecosystem Management Assessment Team 1993; Clinton and Gore1993).
Some social-science researchers and community officials extended thepredictions even further. They concluded that any reduction in logging fromfederal decisions to obey environmental laws would be especially damagingto community stability (Lee 1990). This conclusion rested on an assumptionthat timber workers, their families, and their neighbors believed the federalgovernment had promised to continue high levels of logging on federallands. Any reduction, therefore, would be seen as a betrayal. This sense ofbetrayal, it was argued, would have debilitating effects on workers, families,and the stability of communities that, in contrast, would have coped quitewell if logging reductions of similar magnitude had materialized from withinthe private sector.
In other words, the proponents of this argument concluded that loggingreductions stemming from environmental protections are especiallypernicious. If an industrial landowner closed mills after exhausting its timberby logging at an unsustainable rate or laid-off hundreds of workers afterinvesting in labor-saving machinery, the social trauma would have beenacceptable. But not if it originated from environmental protection efforts onfederal lands. The political winds behind this argument had considerablestrength in the region through the development of the Northwest Forest Plan.They have since waned as the predicted trauma failed to materialize and agrowing number of economic and political leaders recognized theconsiderable economic and social benefits derived from logging reductions.
As with the unemployment predictions, those that predicted widespread,permanent community instability fell far short of the mark, and for similarreasons. As we discuss in the next chapter, considerable research hasrevealed that high logging levels never produced the community stability thatadvocates promised. This was especially the case in the 1980s, as the timberindustry dramatically reduced its labor costs per unit of timber processedand permanently laid-off thousands of workers. Furthermore, the very notionof timber-dependent communities proved incorrect. Most of the millingcapacity had concentrated near diversified metropolitan centers. Even distantcommunities realized that they were comprised of much more than thetimber industry. As a consequence, communities throughout the spotted-owlregion demonstrated that they were far more capable of adjusting toreductions in federal logging than many forecasters had predicted.
ReflectionsJudge Dwyer’s order prohibiting new timber sales on the national forests
marked the first time environmental laws aimed at protecting species andthe integrity of ecosystems had dramatically arrested the behavior of a majorindustry covering a broad landscape. The region was moving throughuncharted waters, and it is no wonder that workers, business owners,families, and community leaders were frightened. In the ensuing years, asthey adjusted to the decisions of Judge Dwyer and others, the residents ofthe Pacific Northwest have learned a lot about who they are. They are notstuck in an economic backwater, out of the national and global mainstream,

Chapter 2 The Sky Did NOT Fall
19
and heavily dependent on the timber industry for their individual andcommunal well-being. Instead, throughout the region individuals andcommunities have demonstrated—perhaps discovered is more accurate—thatthey have tremendous economic and social strength.
Prior to May 29, 1991, American society had imposed environmental-protection burdens on industries primarily to prevent the emission ofnoxious and toxic materials that had a direct bearing on the health andwelfare of humans. Though contentious to be sure, whatever economictrauma the laws underlying improvements in air and water quality causedwas deemed necessary because it yielded improvements in other aspects ofhuman life. Jobs were traded for good lungs and other improvements inhuman health.12
The long history associated with the management of PNW forests toprotect spotted owls—and salmon, marbled murrelets, and other species,even the overall integrity of the forest ecosystem—represents a different sortof perceived tradeoff. Especially in the early years, many in the regionstruggled with how to weigh the continued existence of an owl against thelivelihoods of loggers and millworkers. There was no easy answer becausethe region, and, indeed, the nation, had never before confronted such aquestion with such harsh immediacy.
Thus, the story of PNW forests is interesting from an economicperspective because it reveals much about the economic consequences thatarise when society acts to protect species and ecosystems, with no directlinkage to protecting human health. As a result, it also helps everyoneunderstand the value of the species and ecosystems, themselves. We discussthese issues further in the next chapter.
12 Many researchers doubt whether even these environmental-protection efforts havehad a negative effect on jobs. See, for example, Meyer (1992), Goodstein (1995), andTemplet (1995).
The story of PNWforests...revealsmuch about theeconomicconsequences thatarise when societyacts to protectspecies andecosystems.

The Sky Did NOT Fall Chapter 2
20
21
Chapter 3: The Response of the PNW’sEconomy to Logging Reductions
The worst economic fears never materialized. Oregon and Washington(the Pacific Northwest, or PNW) avoided the widespread unemployment andcommunity collapse that many believed would accompany the loggingprohibitions to protect owls, salmon, and other species. Without doubt, somecommunities have had to cope with substantial, even wrenching, change.Some workers lost jobs that they otherwise would have had if Americansociety had abandoned its commitment to prevent the extinction of speciesand its expectation that federal land managers should obey the nation’senvironmental laws. But the PNW did not become an Appalachian-styleregion of entrenched poverty, as many had predicted. Instead, the region’seconomy has persistently outperformed the rest of the nation in terms ofgrowth in jobs and incomes.
In this chapter we describe how the economy responded to the loggingreductions. This description sets the stage for the next chapter’s explanationof why the actual response differed so markedly from what was predicted.
The Regional Economy’s Responseto Logging Reductions
In 1988, when logging peaked prior to the onset of actions to protectspotted owls and other species, 6.4 billion board feet (bbf) of timber were cuton the national forests in Oregon and Washington and 15.7 bbf were cut onall lands. Of the 3,045,584 workers employed in both states, 110,684 workedin the timber industry.1 The average per capita income was $21,775.
Figure 3.1 shows how each of these variables has changed through 1996,the last year for which complete data are available. In 1996, logging onfederal lands had fallen 86 percent from the 1988 level, overall logging haddeclined 47 percent and employment in the timber industry had dropped 22percent. In contrast, total employment and per capita income (adjusted forinflation) had grown 27 percent and 15 percent, respectively.
If logging on federal lands had driven overall employment and income inthe PNW, then, as logging declined, the others would have followed. They didnot. Instead, they moved in the opposite direction. This outcome and itsimplications are a dramatic departure from the fears of the late 1980s andearly 1990s. Limiting the industrial exploitation of forest resources did not,
1 Throughout this report the timber industry refers to SIC 24, lumber-and-wood-products. SIC 25, furniture and fixtures, and SIC 26, paper and allied products, arenot included because the amount of timber harvested in the Pacific Northwest haslittle effect upon employment in either of these industries (Personal Communicationwith Richard Haynes, Program Manager for the Forest Service at the Pacific NorthwestResearch Station, October, 1998).

The Sky Did NOT Fall Chapter 3
22
Figure 3.1: Logging, Employment, and Income in Oregon andWashington, 1988-1996
Source: ECONorthwest with data from the Oregon Department of Forestry (various years), the OregonEmployment Department (various years), the U.S. Department of Commerce, Bureau of EconomicAnalysis (1998), the Washington Department of Natural Resources (various years), and Washington StateEmployment Security (various years).
as many had predicted, cause widespread economic calamity. To thecontrary, the events of this decade clearly show that the timber industry isno more than a minor player in a diverse, powerful economy, an economythat easily accommodated logging reductions aimed at reversing theindustry’s considerable damage to the environment.
Furthermore, the timber industry’s importance to the overall economyundoubtedly will become even smaller in the foreseeable future. As Figure3.2 shows, employment in the timber industry, as a percent of totalemployment has declined for nearly three decades. The industry providedless than 2 percent of Oregon’s and Washington’s total employment in 1996.Table 3.1 shows that the timber industry’s percentage of total employment issmall enough that since 1994, the annual growth of jobs in the region hasexceeded the total number of timber jobs.
Timber Harvests (bbf)
7.00
9.00
11.00
13.00
15.00
17.00
1988 1990 1992 1994 1996
Per Capita Income ($1997)
21,000
22,000
23,000
24,000
25,000
26,000
1988 1990 1992 1994 1996
Timber Employment
85,000
90,000
95,000
100,000
105,000
110,000
115,000
1988 1990 1992 1994 1996
Total Employment
2,800,000
3,000,000
3,200,000
3,400,000
3,600,000
3,800,000
4,000,000
1988 1990 1992 1994 1996

Chapter 3 The Sky Did NOT Fall
23
Figure 3.2: Lumber-and-Wood-Products Employment as a Percentof Total Employment, Oregon and Washington, 1969-1996
0.00%
1.00%
2.00%
3.00%
4.00%
5.00%
6.00%
7.00%
8.00%
9.00%
1969 1971 1973 1975 1977 1979 1981 1983 1985 1987 1989 1991 1993 1995
Oregon Washington OR & WA
Source: ECONorthwest with data from the U.S. Department of Commerce, Bureau of Economic Analysis(1998).
The decline in timber’s importance to the overall economy is commonlyattributed to the declines in timber harvest, but a more fundamental reasonis the essential character of the industry itself. The industry is mature, withfew new products to excite consumers’ interest, and each firm has strongincentives to lower its costs if it is to remain competitive in a global market.The cost-cutting pressures have been especially strong in the Douglas firregion west of the Cascades (Westside) where, until the 1980s, the industrywas highly unionized and had high labor costs relative to competitorselsewhere in the nation. For a long while, the industry was able to live withthe higher costs because the lumber it produced came largely from old-growth trees with wood that had highly desired characteristics, such asstrength and aesthetic appeal. Consequently, the region’s mills were able tocommand a price premium relative to lumber produced elsewhere and usedpart of this premium to cover labor costs. As the supply of old-growth logsdwindled, so too did the price premium. At the same time, new technologies,such as highly computerized mills that could handle small logs with fewworkers, reduced the demand for labor.
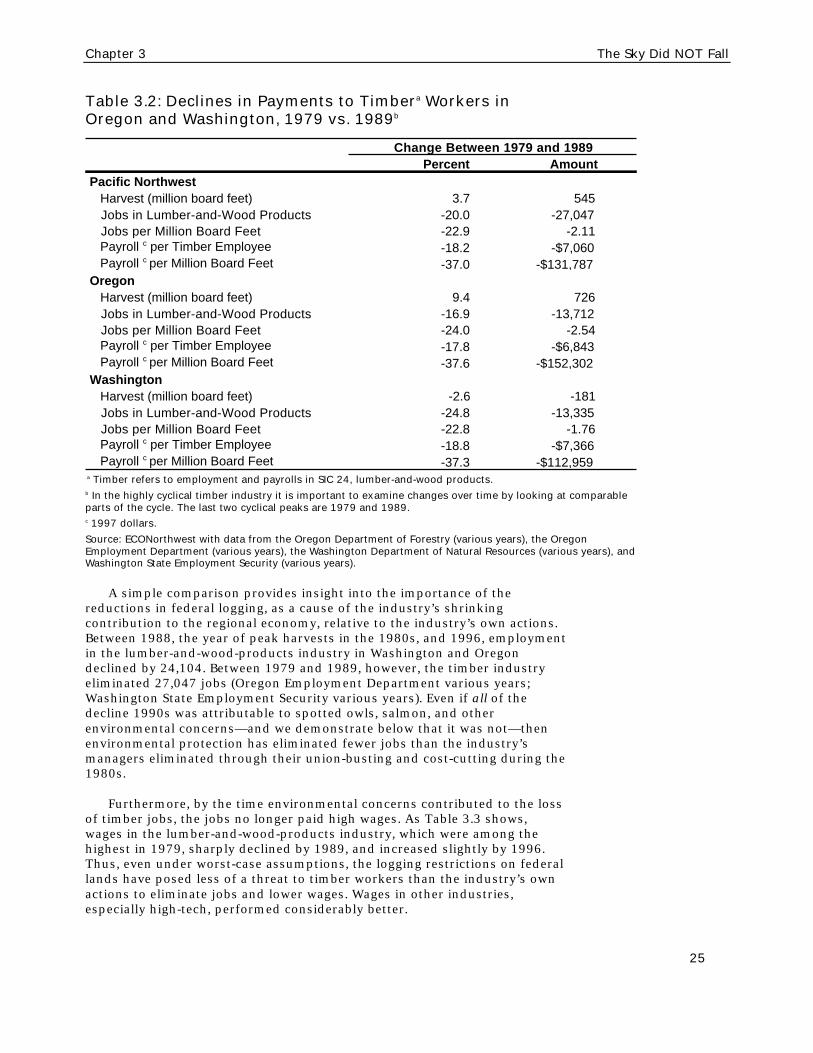
As a result, in the 1980s the industry broke the unions,2 laid offthousands of workers and reduced the pay of those that remained. Table 3.2compares two peak years, 1979 and 1989. Historically, timber has been ahighly cyclical industry and the number of workers per unit of timberprocessed varied widely from the cycle’s peak to trough. In 1989, eventhough the amount logged in Oregon was 9 percent higher than in 1979, thenumber of employees was 17 percent lower and the total payroll (adjusted
2 For additional discussion of the International Woodworkers of America and thestructure of collective bargaining the 1980s, see Widenor (1991; 1995).

The Sky Did NOT Fall Chapter 3
24
for inflation) was 32 percent lower. Washington’s experience was similar,though not as pronounced.
Table 3.1: Lumber-and-Wood-Products Jobs vs. Annual Growthin Total Jobs in Western Oregon and Washington, 1991-1996
1991 1992 1993 1994 1995 1996
Western Oregon
Lumber-and-Wood-Products Jobs 42,733 41,134 40,266 41,297 40,581 40,347
Annual Growth in Total Jobs -4,019 17,072 37,303 54,367 48,325 48,084
Western Washington
Lumber-and-Wood-Products Jobs 28,739 28,707 27,693 28,229 27,892 27,548
Annual Growth in Total Jobs 9,273 26,507 26,120 33,818 37,388 57,444
Total Western OR & WA
Lumber-and-Wood-Products Jobs 71,472 69,841 67,959 69,526 68,473 67,895
Annual Growth in Total Jobs 5,254 43,579 63,423 88,185 85,713 105,528
Source: ECONorthwest with data from the Oregon Employment Department (various years), and Washington StateEmployment Security (various years).
Through the 1980s, the industry lowered its payroll (adjusted forinflation) per unit of timber by more than one-third. In other words, for eachtruckload of logs in 1989, timber workers in the region, as a whole, receivedpaychecks that were less than two-thirds of those they had received ten yearsearlier.
This shift meant the industry, itself, markedly diminished its own role inthe economy during the lead-up to Judge Dwyer’s injunction and otheractions that reduced federal timber harvests. Nonetheless, many in theregion, including, ironically, the managers and workers in the industry whohad implemented and felt the brunt of the industry’s labor cutbacks, oftenfailed to acknowledge both the industry’s diminished role and the factorsthat brought it about. For example, Mike Draper, Executive Secretary, UnitedBrotherhood of Carpenters, Western Council of Industrial Workers, stated atthe 1993 Northwest Forest Conference, “Our workers deserve and need ahealthy forest products industry to maintain the economic stability andviability of the region.” (FEMAT, Appendix VII-A, p. 63.) This, and similarstatements ignored the historical facts that owners and managers hadestablished “a healthy industry” during the 1980s by eliminating jobs andreducing wages.
As the industry faces increasing competition from other regions andcountries, it will seek to lower its costs further. Besides coping with changesin the supply of large logs from federal lands, firms in the industry also facetighter restrictions on their access to capital from lending institutions thatsee the industry as risky relative to others (Greber 1991). In response tothese pressures, the industry is likely to continue squeezing payments toworkers, as it investigates ways to produce engineered wood products thatincrease the value of wood from smaller, less-desirable logs. The end result isthat the job prospects for unskilled workers, especially, are likely to becomedimmer and dimmer.
Chapter 3 The Sky Did NOT Fall
25
Table 3.2: Declines in Payments to Timbera Workers inOregon and Washington, 1979 vs. 1989b
a Timber refers to employment and payrolls in SIC 24, lumber-and-wood products.b In the highly cyclical timber industry it is important to examine changes over time by looking at comparableparts of the cycle. The last two cyclical peaks are 1979 and 1989.c 1997 dollars.
Source: ECONorthwest with data from the Oregon Department of Forestry (various years), the OregonEmployment Department (various years), the Washington Department of Natural Resources (various years), andWashington State Employment Security (various years).
A simple comparison provides insight into the importance of thereductions in federal logging, as a cause of the industry’s shrinkingcontribution to the regional economy, relative to the industry’s own actions.Between 1988, the year of peak harvests in the 1980s, and 1996, employmentin the lumber-and-wood-products industry in Washington and Oregondeclined by 24,104. Between 1979 and 1989, however, the timber industryeliminated 27,047 jobs (Oregon Employment Department various years;Washington State Employment Security various years). Even if all of thedecline 1990s was attributable to spotted owls, salmon, and otherenvironmental concerns—and we demonstrate below that it was not—thenenvironmental protection has eliminated fewer jobs than the industry’smanagers eliminated through their union-busting and cost-cutting during the1980s.
Furthermore, by the time environmental concerns contributed to the lossof timber jobs, the jobs no longer paid high wages. As Table 3.3 shows,wages in the lumber-and-wood-products industry, which were among thehighest in 1979, sharply declined by 1989, and increased slightly by 1996.Thus, even under worst-case assumptions, the logging restrictions on federallands have posed less of a threat to timber workers than the industry’s ownactions to eliminate jobs and lower wages. Wages in other industries,especially high-tech, performed considerably better.
Percent AmountPacific Northwest Harvest (million board feet) 3.7 545 Jobs in Lumber-and-Wood Products -20.0 -27,047 Jobs per Million Board Feet -22.9 -2.11 Payroll c per Timber Employee -18.2 -$7,060 Payroll c per Million Board Feet -37.0 -$131,787Oregon Harvest (million board feet) 9.4 726 Jobs in Lumber-and-Wood Products -16.9 -13,712 Jobs per Million Board Feet -24.0 -2.54 Payroll c per Timber Employee -17.8 -$6,843 Payroll c per Million Board Feet -37.6 -$152,302Washington Harvest (million board feet) -2.6 -181 Jobs in Lumber-and-Wood Products -24.8 -13,335 Jobs per Million Board Feet -22.8 -1.76 Payroll c per Timber Employee -18.8 -$7,366 Payroll c per Million Board Feet -37.3 -$112,959
Change Between 1979 and 1989
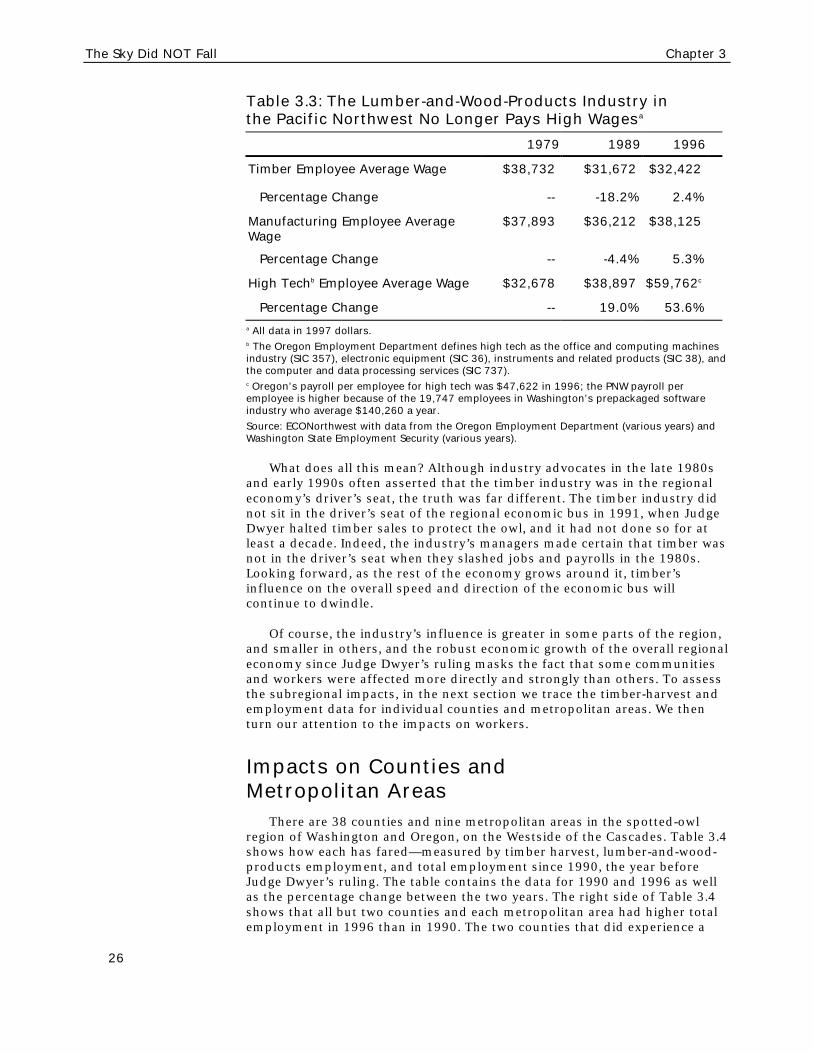
The Sky Did NOT Fall Chapter 3
26
Table 3.3: The Lumber-and-Wood-Products Industry inthe Pacific Northwest No Longer Pays High Wagesa
1979 1989 1996
Timber Employee Average Wage $38,732 $31,672 $32,422
Percentage Change -- -18.2% 2.4%
Manufacturing Employee AverageWage
$37,893 $36,212 $38,125
Percentage Change -- -4.4% 5.3%
High Techb Employee Average Wage $32,678 $38,897 $59,762c
Percentage Change -- 19.0% 53.6%a All data in 1997 dollars.b The Oregon Employment Department defines high tech as the office and computing machinesindustry (SIC 357), electronic equipment (SIC 36), instruments and related products (SIC 38), andthe computer and data processing services (SIC 737).c Oregon’s payroll per employee for high tech was $47,622 in 1996; the PNW payroll peremployee is higher because of the 19,747 employees in Washington’s prepackaged softwareindustry who average $140,260 a year.
Source: ECONorthwest with data from the Oregon Employment Department (various years) andWashington State Employment Security (various years).
What does all this mean? Although industry advocates in the late 1980sand early 1990s often asserted that the timber industry was in the regionaleconomy’s driver’s seat, the truth was far different. The timber industry didnot sit in the driver’s seat of the regional economic bus in 1991, when JudgeDwyer halted timber sales to protect the owl, and it had not done so for atleast a decade. Indeed, the industry’s managers made certain that timber wasnot in the driver’s seat when they slashed jobs and payrolls in the 1980s.Looking forward, as the rest of the economy grows around it, timber’sinfluence on the overall speed and direction of the economic bus willcontinue to dwindle.
Of course, the industry’s influence is greater in some parts of the region,and smaller in others, and the robust economic growth of the overall regionaleconomy since Judge Dwyer’s ruling masks the fact that some communitiesand workers were affected more directly and strongly than others. To assessthe subregional impacts, in the next section we trace the timber-harvest andemployment data for individual counties and metropolitan areas. We thenturn our attention to the impacts on workers.
Impacts on Counties andMetropolitan Areas
There are 38 counties and nine metropolitan areas in the spotted-owlregion of Washington and Oregon, on the Westside of the Cascades. Table 3.4shows how each has fared—measured by timber harvest, lumber-and-wood-products employment, and total employment since 1990, the year beforeJudge Dwyer’s ruling. The table contains the data for 1990 and 1996 as wellas the percentage change between the two years. The right side of Table 3.4shows that all but two counties and each metropolitan area had higher totalemployment in 1996 than in 1990. The two counties that did experience a

Chapter 3 The Sky Did NOT Fall
27
decline, Grays Harbor (WA) and Columbia (OR), represent less than onepercent of the region’s total employment. Only a few counties andmetropolitan areas experienced an increase in timber harvest and lumber-and-wood-products employment, but this did not mean that these countiesgrew faster than the others. In general, the metropolitan areas experiencedthe fastest growth in total employment. Although metropolitan areasaccounted for only 28 percent of the total harvests in the region in 1996,they accounted for 47 percent of timber employment and 73 percent of totalemployment.
It is possible, of course, that a county or metropolitan area showinggrowth in total employment by 1996 could have experienced downturns inthe intervening years. Table 3.5 provides data showing total employment in1990 and the annual changes for each following year. No metropolitan area,except for Eugene-Springfield and Medford in 1991, ever experienced adecline in total employment. Thirteen counties experienced a decline in 1991,seven counties experienced a decline in 1992, two counties experienced adecline in 1993, five counties experienced a decline in 1994, one countyexperienced a decline in 1995, and five counties experienced a decline in1996. With the exceptions of the Oregon counties in 1991 and ClallamCounty in 1996, each county that experienced a decline in total employmentwas adjacent to one or more that experienced an increase at least as large.
In other words, quantifiable job losses following Judge Dwyer’s ban ontimber sales occurred in only a few places and for only a short time.Moreover, the losses that did occur cannot all be attributed to Judge Dwyer’sdecision and related environmental-protection actions. The nation’s economyentered a recession soon after Judge Dwyer’s decision and, although the PNWregion as a whole generally shrugged off its effects, the recessionundoubtedly had a negative effect on jobs in some places. Many, if not most,of the job losses in 1991 may have been caused by the recession, not JudgeDwyer’s decision, insofar as the decision banned additional sales of timber,but did not keep logging companies from logging timber that they alreadyhad purchased from the federal agencies (Goodstein forthcoming). At the endof 1990, there was 6.5 bbf of federal timber that had been sold, but notlogged in Oregon and Washington (Warren 1994).
The limited spatial distribution and duration of the job losses alsoreflects the industry’s concentration near large urban centers. When JudgeDwyer prohibited timber sales on the national forests in 1991, the prevailingwisdom in the region was that the bulk of its economic effects would befallnumerous isolated, rural communities, where most of the lumber-and-wood-products industry was believed to be located. The prevailing wisdom waswrong. Although most trees grow in rural areas, the bulk of the lumber-and-wood-products industry is located in or near the region’s metropolitan areas.More than 80 percent of the jobs in Lane County’s lumber-and-woodproducts mills, for example, lie in or adjacent to the county’s urban core,Eugene-Springfield (Niemi and Whitelaw 1994). Almost half of Washington’stimber jobs occur in the Puget Sound area (Conway et al. 1991), and many ofthe remaining lie within commuting distance of Olympia and Vancouver.
In other words,quantifiable joblosses followingJudge Dwyer’s banon timber salesoccurred in only afew places and foronly a short time.Moreover, thelosses that didoccur cannot all beattributed to JudgeDwyer’s decisionand relatedenvironmental-protection actions.
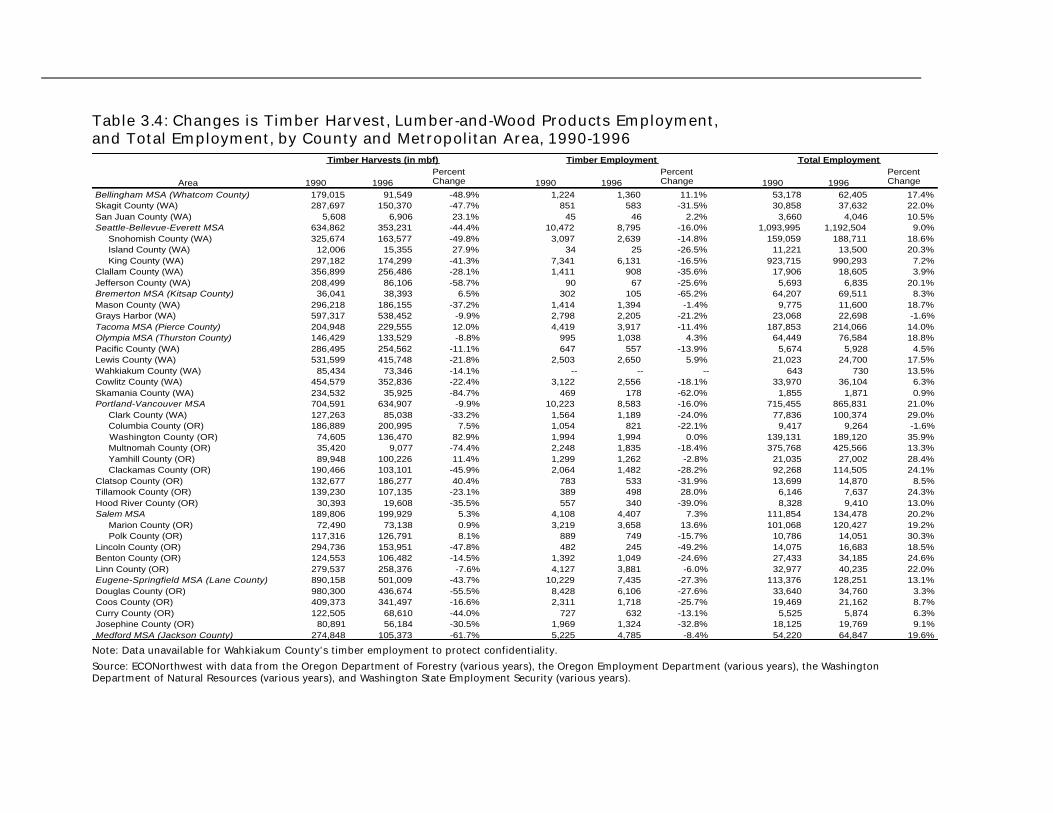
Table 3.4: Changes is Timber Harvest, Lumber-and-Wood Products Employment,and Total Employment, by County and Metropolitan Area, 1990-1996
Note: Data unavailable for Wahkiakum County’s timber employment to protect confidentiality.
Source: ECONorthwest with data from the Oregon Department of Forestry (various years), the Oregon Employment Department (various years), the WashingtonDepartment of Natural Resources (various years), and Washington State Employment Security (various years).
Area 1990 1996Percent Change 1990 1996
Percent Change 1990 1996
Percent Change
Bellingham MSA (Whatcom County) 179,015 91,549 -48.9% 1,224 1,360 11.1% 53,178 62,405 17.4%Skagit County (WA) 287,697 150,370 -47.7% 851 583 -31.5% 30,858 37,632 22.0%San Juan County (WA) 5,608 6,906 23.1% 45 46 2.2% 3,660 4,046 10.5%Seattle-Bellevue-Everett MSA 634,862 353,231 -44.4% 10,472 8,795 -16.0% 1,093,995 1,192,504 9.0% Snohomish County (WA) 325,674 163,577 -49.8% 3,097 2,639 -14.8% 159,059 188,711 18.6% Island County (WA) 12,006 15,355 27.9% 34 25 -26.5% 11,221 13,500 20.3% King County (WA) 297,182 174,299 -41.3% 7,341 6,131 -16.5% 923,715 990,293 7.2%Clallam County (WA) 356,899 256,486 -28.1% 1,411 908 -35.6% 17,906 18,605 3.9%Jefferson County (WA) 208,499 86,106 -58.7% 90 67 -25.6% 5,693 6,835 20.1%Bremerton MSA (Kitsap County) 36,041 38,393 6.5% 302 105 -65.2% 64,207 69,511 8.3%Mason County (WA) 296,218 186,155 -37.2% 1,414 1,394 -1.4% 9,775 11,600 18.7%Grays Harbor (WA) 597,317 538,452 -9.9% 2,798 2,205 -21.2% 23,068 22,698 -1.6%Tacoma MSA (Pierce County) 204,948 229,555 12.0% 4,419 3,917 -11.4% 187,853 214,066 14.0%Olympia MSA (Thurston County) 146,429 133,529 -8.8% 995 1,038 4.3% 64,449 76,584 18.8%Pacific County (WA) 286,495 254,562 -11.1% 647 557 -13.9% 5,674 5,928 4.5%Lewis County (WA) 531,599 415,748 -21.8% 2,503 2,650 5.9% 21,023 24,700 17.5%Wahkiakum County (WA) 85,434 73,346 -14.1% -- -- -- 643 730 13.5%Cowlitz County (WA) 454,579 352,836 -22.4% 3,122 2,556 -18.1% 33,970 36,104 6.3%Skamania County (WA) 234,532 35,925 -84.7% 469 178 -62.0% 1,855 1,871 0.9%Portland-Vancouver MSA 704,591 634,907 -9.9% 10,223 8,583 -16.0% 715,455 865,831 21.0% Clark County (WA) 127,263 85,038 -33.2% 1,564 1,189 -24.0% 77,836 100,374 29.0% Columbia County (OR) 186,889 200,995 7.5% 1,054 821 -22.1% 9,417 9,264 -1.6% Washington County (OR) 74,605 136,470 82.9% 1,994 1,994 0.0% 139,131 189,120 35.9% Multnomah County (OR) 35,420 9,077 -74.4% 2,248 1,835 -18.4% 375,768 425,566 13.3% Yamhill County (OR) 89,948 100,226 11.4% 1,299 1,262 -2.8% 21,035 27,002 28.4% Clackamas County (OR) 190,466 103,101 -45.9% 2,064 1,482 -28.2% 92,268 114,505 24.1%Clatsop County (OR) 132,677 186,277 40.4% 783 533 -31.9% 13,699 14,870 8.5%Tillamook County (OR) 139,230 107,135 -23.1% 389 498 28.0% 6,146 7,637 24.3%Hood River County (OR) 30,393 19,608 -35.5% 557 340 -39.0% 8,328 9,410 13.0%Salem MSA 189,806 199,929 5.3% 4,108 4,407 7.3% 111,854 134,478 20.2% Marion County (OR) 72,490 73,138 0.9% 3,219 3,658 13.6% 101,068 120,427 19.2% Polk County (OR) 117,316 126,791 8.1% 889 749 -15.7% 10,786 14,051 30.3%Lincoln County (OR) 294,736 153,951 -47.8% 482 245 -49.2% 14,075 16,683 18.5%Benton County (OR) 124,553 106,482 -14.5% 1,392 1,049 -24.6% 27,433 34,185 24.6%Linn County (OR) 279,537 258,376 -7.6% 4,127 3,881 -6.0% 32,977 40,235 22.0%Eugene-Springfield MSA (Lane County) 890,158 501,009 -43.7% 10,229 7,435 -27.3% 113,376 128,251 13.1%Douglas County (OR) 980,300 436,674 -55.5% 8,428 6,106 -27.6% 33,640 34,760 3.3%Coos County (OR) 409,373 341,497 -16.6% 2,311 1,718 -25.7% 19,469 21,162 8.7%Curry County (OR) 122,505 68,610 -44.0% 727 632 -13.1% 5,525 5,874 6.3%Josephine County (OR) 80,891 56,184 -30.5% 1,969 1,324 -32.8% 18,125 19,769 9.1%Medford MSA (Jackson County) 274,848 105,373 -61.7% 5,225 4,785 -8.4% 54,220 64,847 19.6%
Timber Harvests (in mbf) Timber Employment Total Employment

Chapter 3 The Sky Did NOT Fall
29
Table 3.5: Changes in Total Employment, by County andMetropolitan Area, by Year, 1990-1996 (declines in bold)
Source: ECONorthwest with data from the Oregon Employment Department (various years) andWashington State Employment Security (various years).
In sum, the western Oregon and Washington region never experienced adecline in employment and only 14 counties exhibited any reduction inemployment following the ban on logging on 24.5 million acres of federallands that Judge Dwyer’s ruling initiated. Of the 14 counties with jobreductions in 1991, all but Douglas (OR) and Grays Harbor (WA) counties sawgrowth in jobs within three years. Most of the job losses in the industry
Area 1990 1991 1992 1993 1994 1995 1996
Bellingham MSA (Whatcom County) 53,178 54,236 56,689 57,914 59,434 60,559 62,405Skagit County (WA) 30,858 32,392 33,250 34,179 35,786 36,575 37,632San Juan County (WA) 3,660 3,872 3,881 3,800 3,960 4,053 4,046Seattle-Bellevue-Everett MSA 1,093,995 1,095,255 1,109,030 1,118,311 1,126,600 1,147,288 1,192,504 Snohomish County (WA) 159,059 165,358 170,792 178,777 181,104 182,076 188,711 Island County (WA) 11,221 11,943 12,172 12,194 12,750 13,267 13,500 King County (WA) 923,715 917,954 926,066 927,340 932,746 951,945 990,293Clallam County (WA) 17,906 18,029 18,286 18,337 18,331 18,850 18,605Jefferson County (WA) 5,693 5,714 5,906 6,413 6,546 6,779 6,835Bremerton MSA (Kitsap County) 64,207 66,077 66,938 67,061 67,961 68,348 69,511Mason County (WA) 9,775 9,619 9,604 10,021 10,475 11,091 11,600Grays Harbor (WA) 23,068 22,663 23,181 22,488 22,441 22,883 22,698Tacoma MSA (Pierce County) 187,853 188,802 192,899 198,790 207,599 212,482 214,066Olympia MSA (Thurston County) 64,449 66,438 68,402 70,913 74,048 74,444 76,584Pacific County (WA) 5,674 5,718 5,742 5,803 5,786 5,976 5,928Lewis County (WA) 21,023 20,739 21,099 21,970 23,278 24,396 24,700Wahkiakum County (WA) 643 649 666 707 698 715 730Cowlitz County (WA) 33,970 34,669 33,122 33,541 34,704 36,106 36,104Skamania County (WA) 1,855 1,884 1,666 1,885 1,912 1,864 1,871Portland-Vancouver MSA 715,455 716,879 728,716 755,601 792,558 830,235 865,831 Clark County (WA) 77,836 78,160 81,062 85,410 91,802 96,340 100,374 Columbia County (OR) 9,417 9,712 9,363 8,740 8,665 8,913 9,264 Washington County (OR) 139,131 144,255 146,974 155,061 163,724 173,238 189,120 Multnomah County (OR) 375,768 369,348 373,059 381,842 396,726 415,113 425,566 Yamhill County (OR) 21,035 21,224 22,116 23,348 24,824 25,573 27,002 Clackamas County (OR) 92,268 94,180 96,142 101,200 106,817 111,058 114,505Clatsop County (OR) 13,699 13,262 13,587 13,734 14,197 14,636 14,870Tillamook County (OR) 6,146 6,483 6,504 6,640 7,069 7,319 7,637Hood River County (OR) 8,328 8,379 8,233 8,696 9,113 9,455 9,410Salem MSA 111,854 112,820 116,384 120,794 126,157 129,752 134,478 Marion County (OR) 101,068 101,962 105,090 109,233 114,017 116,830 120,427 Polk County (OR) 10,786 10,858 11,294 11,561 12,140 12,922 14,051Lincoln County (OR) 14,075 14,334 14,920 15,280 15,743 15,985 16,683Benton County (OR) 27,433 27,084 27,671 29,136 30,580 32,353 34,185Linn County (OR) 32,977 32,689 32,764 33,883 35,993 38,381 40,235Eugene-Springfield MSA (Lane County) 113,376 110,754 112,123 115,199 122,031 125,165 128,251Douglas County (OR) 33,640 31,702 31,456 31,893 32,915 33,871 34,760Coos County (OR) 19,469 19,405 19,423 19,769 20,310 20,648 21,162Curry County (OR) 5,525 5,549 5,374 5,478 5,765 5,792 5,874Josephine County (OR) 18,125 17,394 17,727 18,494 19,244 19,502 19,769Medford MSA (Jackson County) 54,220 53,893 55,719 57,655 61,336 62,780 64,847Western Oregon and Washington 2,792,129 2,797,383 2,840,962 2,904,385 2,992,570 3,078,283 3,183,811

The Sky Did NOT Fall Chapter 3
30
occurred in or near metropolitan centers, where the economy has been mostrobust and the opportunities for dislocated workers to find replacement jobshave been the greatest.
The Injunctions Caused How ManyWorkers To Lose Their Jobs?
Just how many timber workers lost their jobs because of the protectionsordered by Judge Dwyer’s injunction and subsequent actions? There are toomany holes in the relevant data to answer this question precisely, but herewe examine the available data and conclude that about 9,300—and perhapsfewer than 6,200— workers lost their jobs. In the next section we examinewhat happened to them.
Eban Goodstein (forthcoming) recently estimated that the job lossesthrough 1994 from logging reductions attributable to Judge Dwyer’sinjunction and subsequent actions were between 6,200 and 7,500. Insofar asfederal harvests have risen since 1994 (see Table 2.4) applying the sameestimation technique to subsequent years would yield smaller numbers.
We develop a separate estimate for two reasons. First, we want to checkthe reasonableness of Goodstein’s estimates. Using different assumptionsand data, we arrive at 9,300 lost jobs, a number only slightly higher than his.Second, we want to illustrate the major sources of the errors in the many direpredictions of the late 1980s and early 1990s. Hence, we follow the basicanalytical steps we outline in Figure 2.5 and describe in the previous chapter.The four steps are (1) Choose the Base Case; (2) Choose an Owl-ProtectionScenario; (3) Choose a Total-Job Multiplier; and (4) Choose a Degree ofEconomic Rigidity. In this instance, however, we proceed through the stepspaying careful attention to avoid the biases pervading the exaggeratedpredictions we described earlier and illustrated in Figure 2.4.
Step 1: Choose the Base Case. The first step entails determining what theemployment would have been, if not for the judicial and administrativedecisions since the late 1980s to protect owls, other at-risk species, and theintegrity of the forest ecosystem. The most common approach is to pick ayear, or set of years, and use this as the Base Case. Many studies, such as theFEMAT analysis that underlies the Northwest Forest Plan, have used somecombination of the years between 1983 and 1989.
We use the period 1983-87 as the Base Case so we can take advantage ofthe data in a major study that also used this period. We do not, however,simply assume that, in the absence of Judge Dwyer’s ruling and itsaftermath, timber harvests would have remained at the 1983-87 levelthroughout the 1990s. Instead, we adjust it to account for reductions inlogging that would have occurred because the industry has logged atunsustainable rates.
Analysts have known for several decades that the industry has beenliquidating the stock of timber at unsustainable rates so that, sooner or later,the cut would have to go down (Haynes 1991). This is just what happened onforest-industry lands in Oregon and Washington in 1983 (see Figure 3.3),when harvests began a decline that continues today. Researchers at Oregon

Chapter 3 The Sky Did NOT Fall
31
State University examined Oregon’s rate of harvest more broadly andreported this question and answer:
“Are We Currently Cutting More Than the Sustainable Harvest?
Answer: When 1983-87 is used as the frame of reference … theanswer is YES, both in cubic feet and board feet. … This suggeststhat a harvest decline is likely within the next decade” (Sessions et al.1990 p. 5) [emphasis in original].
They went on to explain that, throughout Westside Oregon, the largestocks of old-growth had, over the past few decades, been liquidated fasterthan replacement trees could produce new wood fiber. Hence, harvestswould have to drop. They estimated the size of the drop, assuming that itwould be determined solely by the reduced supply of wood fiber. Otherfactors, however, may exacerbate the drop. For example, the replacementtrees will be smaller and logs from them will be less desirable than thosefrom large, old-growth trees. Hence, for some of the replacements, thedemand may be too low to warrant logging.
If the logging had not been too extreme, the forests could have supportedan orderly decline to what foresters call the long-term sustained yield (LTSY),where the annual amount logged equals the amount of wood fiber added tothe forest each year. This option had been closed, however, as logging hadoccurred so rapidly that the current stock of trees big enough to log wouldbe exhausted before the young trees came of age.
Figure 3.3 shows the results of the analysis by Sessions and his co-authors. In 1983-87, the average Oregon harvest was 8,020 million board feet(mmbf). They determined that, to reach sustainable levels in the mostreasonable period of time, the harvest on Westside federal forests and forest-industry lands where logging had been most intensive during the previousseveral decades would have to decline in the 1990s by 829 mmbf, or 10.3percent of the 1983-87 average.3 Further declines would be required east ofthe Cascades but these, plus some of the Westside decline, would be offsetby increases in a few areas, especially the North Coast, where trees thatstarted to grow after extensive logging and the massive Tillamook Burn earlyin the century are becoming large enough to be logged.4 Overall, Sessions andhis co-authors determined that logging in Oregon in the 1990s would have tofall 8 percent below the 1983-87 average.
Absent a study in Washington comparable to the one in Oregon bySessions and his co-authors, we assume that this percentage applies toWashington as well. All else equal, lumber-and-wood-products employmentin the two states would have fallen by the same percentage. In other words,
3 This includes the national forests, with a reduction of 18 percent, BLM lands(increase of 7 percent), and forest industry (reduction of 28 percent). It excludes landsin the North Coast, all state lands (much of which are in the North Coast), and non-industrial lands.
4 Eastside forests are expected to decline by 12 percent; the North coast to increase by27 percent.

The Sky Did NOT Fall Chapter 3
32
the analysis by Sessions and his co-authors indicates that, because harvestshad to fall to compensate for past harvest levels that outstripped the forest’sability to sustain them, lumber-and-wood-products employment in the twostates would have fallen from the 1983-87 average, 103,600 (Warren 1995),by eight percent, to 95,300 throughout the 1990s.
Figure 3.3: Adjustments in Oregon’s Logging Levels:The 1990s vs. 1983-87
1983-87 Average Harvest8,020 mmbf
Total Decline (-8%)
Unavoidable Decline Due to Past Overcutting (-10.3%) 1990s Sustainable Harvest 7,378 mmbf Potential Offsetting Increase of Logging on Lands Logged or Burned Early This Century (2.3%) 7,194 mmbf
Source: ECONorthwest with data from Sessions, et al. (1990).
We use 95,300 as the Base Case level of lumber-and-wood-productsemployment for the PNW in the 1990s. This is a rough estimate that probablyoverestimates the industry’s employment in the absence of environment-related logging reductions. It does not, for example, take into account thelikelihood that the Base Case employment would have been lower becausethe demand for smaller logs might not be sufficiently strong to warrantlogging. Nor does it reflect the additional job losses that would materialize inresponse to labor-saving pressures. Arising as the region’s industrycontinually encounters competition from other regions and countries, thesepressures encourage firms to substitute capital for labor, and one highlyskilled worker for more than one worker with lower skills.
All these factors have lowered the industry’s demand for labor relative tothe conditions inherent in the analysis by when Sessions, et al. Nonetheless,using 95,300 as the Base Case provides a reasonable, upper bound estimateof what lumber-and-wood-products employment would have been in the PNWin the 1990s, absent decisions to protect at-risk species, such as spotted owlsand salmon, as well as the overall integrity of the forest ecosystem.
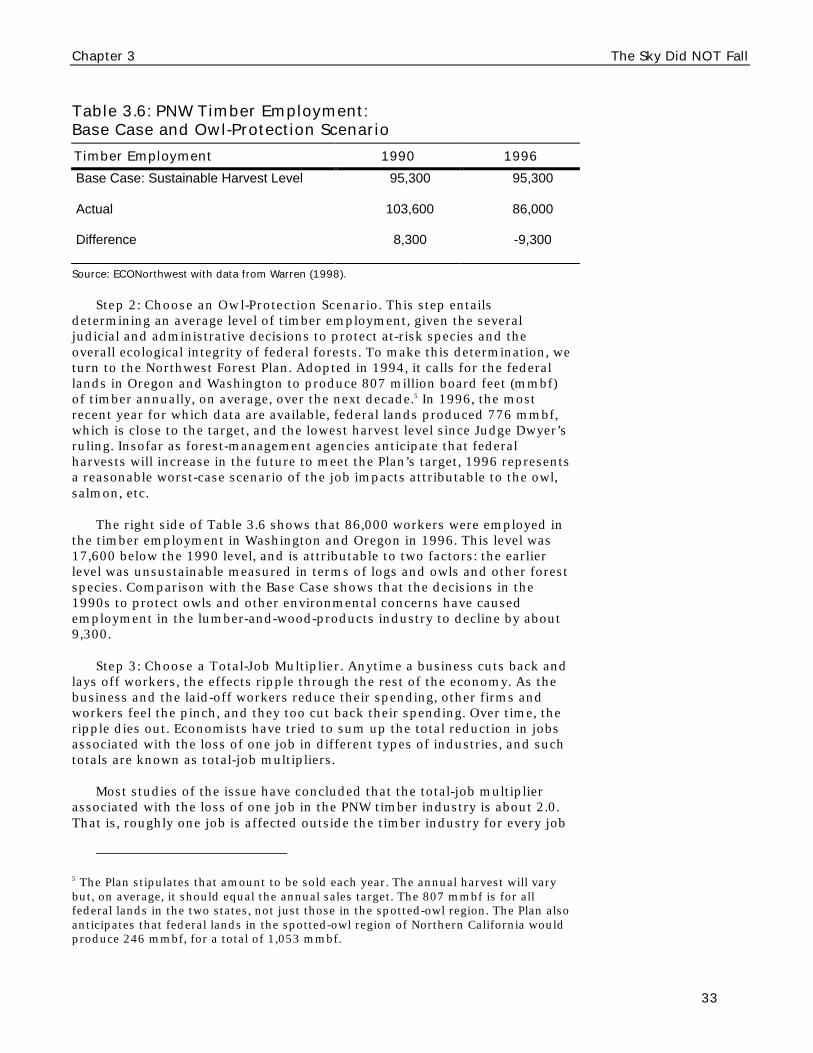
Chapter 3 The Sky Did NOT Fall
33
Table 3.6: PNW Timber Employment:Base Case and Owl-Protection Scenario
Timber Employment 1990 1996
Base Case: Sustainable Harvest Level 95,300 95,300
Actual 103,600 86,000
Difference 8,300 -9,300
Source: ECONorthwest with data from Warren (1998).
Step 2: Choose an Owl-Protection Scenario. This step entailsdetermining an average level of timber employment, given the severaljudicial and administrative decisions to protect at-risk species and theoverall ecological integrity of federal forests. To make this determination, weturn to the Northwest Forest Plan. Adopted in 1994, it calls for the federallands in Oregon and Washington to produce 807 million board feet (mmbf)of timber annually, on average, over the next decade.5 In 1996, the mostrecent year for which data are available, federal lands produced 776 mmbf,which is close to the target, and the lowest harvest level since Judge Dwyer’sruling. Insofar as forest-management agencies anticipate that federalharvests will increase in the future to meet the Plan’s target, 1996 representsa reasonable worst-case scenario of the job impacts attributable to the owl,salmon, etc.
The right side of Table 3.6 shows that 86,000 workers were employed inthe timber employment in Washington and Oregon in 1996. This level was17,600 below the 1990 level, and is attributable to two factors: the earlierlevel was unsustainable measured in terms of logs and owls and other forestspecies. Comparison with the Base Case shows that the decisions in the1990s to protect owls and other environmental concerns have causedemployment in the lumber-and-wood-products industry to decline by about9,300.
Step 3: Choose a Total-Job Multiplier. Anytime a business cuts back andlays off workers, the effects ripple through the rest of the economy. As thebusiness and the laid-off workers reduce their spending, other firms andworkers feel the pinch, and they too cut back their spending. Over time, theripple dies out. Economists have tried to sum up the total reduction in jobsassociated with the loss of one job in different types of industries, and suchtotals are known as total-job multipliers.
Most studies of the issue have concluded that the total-job multiplierassociated with the loss of one job in the PNW timber industry is about 2.0.That is, roughly one job is affected outside the timber industry for every job
5 The Plan stipulates that amount to be sold each year. The annual harvest will varybut, on average, it should equal the annual sales target. The 807 mmbf is for allfederal lands in the two states, not just those in the spotted-owl region. The Plan alsoanticipates that federal lands in the spotted-owl region of Northern California wouldproduce 246 mmbf, for a total of 1,053 mmbf.

The Sky Did NOT Fall Chapter 3
34
affected within the industry.6 One must use these numbers carefully,however. It is incorrect to conclude from them that, every time a timberworker loses his or her job another worker loses his or her job, so that thetotal loss is 2. If the decisions to protect owls and accomplish otherenvironmental objectives caused the loss of 9,300 timber jobs, as weestimated above, one should not apply the total-job multipliers and concludethat 18,800 was the total job loss.
Instead, a total-job multiplier does no more than provide a general senseof the maximum amount of adjusting that workers face following a giveneconomic shock, such as the closure of a sawmill. Far more important is theease with which the adjustment occurs. The adjustment can be easy, hard, oranywhere in between. As we demonstrate in the earlier sections of thischapter, most areas of the PNW adjusted quickly to Judge Dwyer’s decisionand its aftermath. In these areas, as a mill laid off workers and cut back itspurchases from vendors of electricity, trucking services, office supplies, andso forth, the vendors were able to find other, replacement customers. And, asthe laid-off workers cut back their purchases from the gas station,supermarket, and pharmacy, these firms found replacement customers. Sure,it didn’t always happen this easily, but the job-loss ripples coming from thetimber industry quickly were swamped by the job-creation ripples emanatingfrom the rapid economic growth taking place in non-timber sectors of theeconomy and the continuing, large influx of immigrants to most parts of thePNW.
Between Judge Dwyer’s injunction prohibiting timber sales on nationalforests in 1991, and his lifting of the injunction in response to the NorthwestForest Plan in 1994, much concern was voiced about how the ripple effectswould swamp small communities. In fact, though, the smaller thecommunity, the smaller the ripple effects. Most of the ripple effect—andmost of the total-job multiplier—materializes in the metropolitan areas,where most of the region’s economic activity occurs and where economicgrowth has been the most robust during the past decade.
Thus, if we went back to 1991 and looked at the prospect of losing about9,300 jobs in the timber industry, the estimates of total-job multiplierswould have led us to expect nontimber job losses of about the samemagnitude. But most of these nontimber losses never materialized. For thosethat did, the dislocated workers generally found replacement jobs quickly, sothat the ripple effect was far smaller than expected and it quickly peteredout.
Assume the Economy is Rigid. A common perception during the pastdecade’s intense controversy over forest management was that, once timberharvests declined and timber workers lost their jobs, the total number ofjobs in the economy would be permanently reduced and the dislocatedworkers would be permanently unemployed. This is a static, and thereforeincorrect, view of the economy. The real economy is far more dynamic. Few,if any, workers lost their jobs and remained permanently unemployed
6 Some analysts believe that the multiplier is considerably larger. Conway et al. (1991),for example, concluded that the multiplier for Washington was 5.1. We believe theseestimates are too high.

Chapter 3 The Sky Did NOT Fall
35
because of Judge Dwyer’s injunction and the other related decisions. Mostdislocated workers either retired from the workforce or found replacementjobs. To quantify this conclusion, we’d like to have information specific tothe work-histories of dislocated timber workers in Oregon and Washington.Unfortunately, such data do not exist, and, so, we cobble together what dataexist from the region with information derived from studies of dislocatedworkers elsewhere.
As we indicated above, most of the job losses arising fromenvironmental-protection decisions in the PNW’s forests have occurred in ornear metropolitan areas. Wherever they occur, though, the dislocatedworkers probably drew on unemployment-insurance benefits and whateversavings and other resources they had available to offset a portion of theirlost wages. Many had access to timber-retraining benefits, includingcommunity college programs, and other assistance programs such as thosecoordinated in the past few years by the Governor’s Timber Team inWashington (Governor's Timber Team 1993; Judd 1995). Most dislocatedworkers found replacement jobs, though the search for new employment wasnot without social, emotional, and economic cost to the workers and theirfamilies (U.S. Department of Labor 1993).
The impact on the individual who lost his or her job probably wasdifferent and more intense than those on the overall labor market. Someworkers undoubtedly experienced prolonged unemployment and severereductions in incomes, others experienced brief unemployment and limitedreductions in incomes, and still others moved quickly to equal- or higher-paying jobs. Of the workers nationwide who lost their jobs because of plantclosures or other mass layoffs in the 1980s, about half were unemployed lessthan 10 weeks and the percent remaining unemployed after twelve monthswas roughly the same as the rate of unemployment for the overall labor force(Power 1996). Washington state’s Timber Retraining Benefits Programreportedly had a high success rate of training dislocated timber workers forjobs in other fields (Seppanen and Bodeutsch no date). On average, 79percent of the 2,147 dislocated timber workers who participated in theprogram were employed 7 to 9 months after completing training. Those whograduated from vocational programs had an even higher employment rate of84 percent. Most graduates of the program also had a high wage-recoveryrate. On average, graduates earned 87 percent of their former wages.
The greater the distance between a dislocated worker’s residence and oneof the area’s metropolitan centers, the smaller the set of replacement-jobopportunities readily available to him or her. As we explain above, however,most of the workers dislocated by the environmental-protection decisionsresided in or near metropolitan centers, giving them access to a wide rangeof employment alternatives.
The greatest number of opportunities were open to those who fit intostructural changes taking place in the nation’s overall labor markets. Ingeneral, dislocated workers and their families who could draw on morefinancial and human capital (e.g., education and training) resources faced abrighter prospect of making the transition to a new job than workers andtheir families who lacked these resources. During the past fifteen years, thestructure of wages and earnings throughout the US has undergonepronounced changes. Among the most prominent are (1) a climb in the
Some workersundoubtedlyexperiencedprolongedunemployment andsevere reductionsin incomes, othersexperienced briefunemployment andlimited reductionsin incomes, and stillothers movedquickly to equal- orhigher-paying jobs.

The Sky Did NOT Fall Chapter 3
36
earnings of more-educated workers relative to the earnings of less-educatedworkers; and (2) a drop in the wages of younger workers who are not college-educated relative to the wages of older workers with similar education. Thereare multiple explanations for these phenomena, but the most importantappears to be a pervasive shift in the methods of production—coincidingwith explosive growth in the use of computers—that increases the demandfor workers with “relatively high intellectual as opposed to manual ability”(Bound and Johnson 1995). The supply of workers with the requisite skillshas not grown enough to keep pace with the increase in demand, and theresulting shortage has increased wages for this group. Conversely, the supplyof less-skilled workers has grown faster than demand, and wages for thisgroup have fallen.
All dislocated workers, no matter their levels of financial and humancapital, faced social, emotional, and economic costs in making the transitionto new employment. The longer a dislocated worker and his or her familydelayed in seeking new employment or training, the more they had to drawdown their financial resources, increasing the social and emotional costs offinding replacement employment.
In sum, the environmental-protection decisions of the 1990s have had aminimal long-run impact on labor markets, in large part because thesemarkets are not static but highly dynamic. Some workers lost jobs, and theyand their families incurred the intense distress that accompanies the loss ofa job. Most dislocated families, however, had access to assistance programsand found replacement jobs within a less than a year. Although no studytracked the experiences of dislocated timber workers, national studies havefound that dislocated workers typically find a replacement job paying about87 percent of the prior wage. This new job, though, may offer the prospectsof faster wage increases, insofar as wages in the lumber-and-wood-productsindustry have a pronounced history of stagnation and declines.
ReflectionsTo many, Judge Dwyer’s 1991 injunction banning timber sales on the
spotted-owl forests triggered an abrupt change of direction for the PNW’seconomy and the change was imposed on the region by the small group ofenvironmentalists who brought the lawsuit that led to the injunction. Neitherconclusion is correct. The change was neither abrupt nor imposed byenvironmentalists. Instead, we now can look back on the events thatpreceded and followed the injunction and see that change had been brewing,both in the timber industry and in the overall regional economy, for morethan a decade.
The timber industry had made change inevitable by rapidly liquidatingold-growth forests. Despite promises to the contrary, the industry had beencutting old-growth trees at unsustainable rates since at least World War II. Bythe mid-1970s, concern over the rate of logging had prompted a major studyof the outlook for logging in Oregon, and researchers at Oregon StateUniversity concluded that, absent major changes in forest-managementpolicies, the industry would exhaust the supply of old-growth timberavailable to it in the 1990s (Beuter et al. 1976). Thus, 15 years before Judge
To many, JudgeDwyer’s 1991injunction banningtimber sales onthe spotted-owlforests triggeredan abrupt changeof direction for thePNW’s economyand the changewas imposed onthe region by thesmall groups ofenvironmentalistswho brought thelawsuit that led tothe injunction...

Chapter 3 The Sky Did NOT Fall
37
Dwyer’s injunction and with no imposition by environmentalists, the timberindustry, itself, had made a slump in logging-related jobs inevitable.
Throughout the 1980s, the industry further exacerbated the impact onworkers by slashing jobs and the wages of remaining workers in the 1980s.In the process, it severed much of the industry’s links with the rest of theregional economy. By 1991, the industry’s total payroll (adjusted forinflation) per acre of timber logged was about half what it was in 1979.
Outside the timber industry, the rest of society was pressing for morerecreational and other services from the region’s forests. Moreover,increasing numbers of Americans were losing patience with the persistentsubsidies the industry, here and elsewhere, extracted from households andother industries, especially the subsidies associated with logging on thenational forests. Over time, it also became apparent that the timberindustry’s activities were having deleterious effects on jobs in other sectorsof the regional economy, especially on the jobs associated with commercialand recreational fishing. These effects became less acceptable as the publicrealized that it would have to foot much of the bill for coping with declinesin populations of salmon and other anadromous fish dependent on theforest habitat destroyed by logging and related activities.
By the early 1990s, the pressure these and similar long-run trendsexerted to reduce logging was climbing to levels never before seen.Nonetheless, elected officials and federal bureaucrats resisted the pressure,but found they could do so only by frantically finding ways to ignore andviolate the nation’s environmental and administrative laws. It was againstthis backdrop that environmentalists sued and Judge Dwyer ruled. Ratherthan being the source of change, Judge Dwyer’s injunction merely releasedthese pent-up pressures.
In the next two chapters we examine the nature of the economic forcesassociated with the pressures for logging reductions and the region’sadjustment to them. We first look at an economic model that does NOTexplain these economic forces well, a model that opponents of loggingreductions have often employed in their doom-and-gloom predictions. Wethen explain a model that does work.
...Neitherconclusion iscorrect. Thechange wasneither abrupt norimposed byenvironmentalists.

The Sky Did NOT Fall Chapter 3
38
39
Chapter 4: Explaining the Economy’sResponse—A Model thatDoes NOT Work
Why did the Pacific Northwest’s economy fail to exhibit the convulsionsthat so many had predicted? The answer lies in the flawed assumptions andlogic the doomsayers used.
In this chapter we present the model underlying the predictions andshow why it does NOT explain how reductions in logging and increases inenvironmental protection affect the economy. In the next chapter we presentan alternative analytical model that DOES.
Nearly every prediction—whether part of a formal study or an informaljudgment—that foresaw economic disaster from the logging cutbackstriggered by Judge Dwyer’s ruling in 1991, rested on a model known as theeconomic-base model. Because it is so frequently applied, and almost asfrequently yields results so misleading, we examine it in some detail. First webriefly describe it, and then we explain why it doesn’t work.
The Economic-Base ModelAn economic-base model divides the economy of an area into two
sectors: the export sector, which produces goods and services sold to buyersoutside the area, and the local sector, which sells its products within the area.Proponents of the economic-base model conclude that, because the exportsector brings in from the outside money that is spent and respent on localgoods, it is the “economic base” that “supports” the local sector. Because thetimber industry of the Pacific Northwest (PNW) typically exports its productsto other regions or countries, proponents of the timber industry frequentlyrely on the economic-base model to conclude that this industry supports—orplays the primary role in supporting—the PNW economy (Beuter 1995;Schallau 1994).
An economic-base analysis of the timber industry typically proceeds in astraightforward manner. The analyst first assumes that the export sectorconsists of just those industries with certain characteristics. Besides timber,they almost always focus on other resource-extraction or manufacturingindustries, although sometimes they include major industries in the serviceand trade sectors, such as tourism, universities, or a concentration ofgovernment agencies. After deciding which industries are included in theexport sector pie, the analyst then decides how big a slice to allocate to thetimber industry. This typically is done by looking at the percent of localemployment in each of the so-called exporting industries and comparing it tothe industry’s national percentage. The reasoning is that the more the localpercentage exceeds its national counterpart, the more the industrycontributes to the local economy’s total exports. Having determined that thetimber industry produces X percent of the total exports from the exportsector the analyst concludes that the industry supports the same percentageof the local sector.
The Sky Did NOT Fall Chapter 4
40
With this line of reasoning, economic-base studies have found that thetimber industry exerts tremendous leverage over the economies of the PacificNorthwest and its local communities. During the late 1980s and early 1990s,economic-base studies commonly concluded that the timber industry, whichdirectly employed about 5 to 10 percent of the workers in the region or inone of its subregions, supported 50 percent or more of the totalemployment. Often, these numbers were expressed by declaring that 50percent, or more, of the overall economy depended on the timber industry.Not surprisingly, with these results, both the analysts who applied suchmodels and the lay members of the community who accepted the reasoningof the economic-base model readily believed that any curtailment in loggingin the region would have devastating economic and social consequences.
Why the Economic-BaseModel Doesn’t Work
Several serious flaws in reasoning cause economic-base models to give ahighly inflated sense of the timber industry’s economic importance. It takesonly some common sense, plus a quick look at the region’s economic history,to expose these flaws.
The ultimate flaw, of course, is that the model gives the wrong answer. Ifthe ultimate test of a pudding is its taste, then the ultimate test of economic-base models applied to the timber industry is the accuracy of theirpredictions. Table 4.1 lists several economic-base studies of the PNW’stimber industry and shows their findings for the subject economy’s timberdependency, i.e., the percentage of total employment dependent on thetimber industry. Table 4.1 then shows the decline in employment that,according to each study, should have occurred following Judge Dwyer’s 1991ruling prohibiting timber sales on the spotted-owl national forests, andcompares this with the actual change in employment. In every case, theeconomic-base model predicted a decrease but total employment actuallyincreased.
It is nonsense to say that the timber industry is a substantial part of thePNW’s economic base when decreases in timber employment areaccompanied by increases in total employment. It is also nonsense to say thatthe economies of such areas depend on the timber industry. The disconnectbetween the PNW’s real economic landscape and the economic-base view ofthat landscape is so great that the only reasonable response is to sack theentire line of reasoning underlying the economic-base model. To help drivehome this message, in the following paragraphs we discuss some of theparticular flaws in this line of reasoning.
The initial steps of an economic-base analysis entail identifying theindustries included in the export sector and determining their relativestrengths. The typical approach is to look only at an area’s big industries,especially resource extraction and manufacturing, and to concentrate onthose whose percentage of the subject area’s total employment exceeds thecomparable, national percentage. Here’s how one such study explains theprocess:
“The primary wood products sector provides a telling example. Itmade up 4.18 percent of Oregon’s employment in 1990. However, itaccounted for .57 percent of the nation’s employment. The higher
It is nonsense tosay that thetimber industry isa substantial partof the PNW’seconomic basewhen decreases intimberemployment areaccompanied byincreases in totalemployment.

Chapter 4 The Sky Did NOT Fall
41
percentage for Oregon suggests that the wood products industry ispart of the state’s economic base. The difference between the stateand the nation, 3.61 percent is a relative index of how much ‘excess’employment Oregon has in the wood products industry. The sum ofthe comparable indices for all basic industry sectors in Oregon was9.75 percent. Thus, the relative importance of primary wood productsamong all of Oregon’s basic industrial sectors is estimated by thepercentage determined from the ratio 3.61/9.75, or 37 percent ….”Beuter (1995).
Table 4.1: Dependency Ratios from Timber-Related Economic-BaseModels Are Out-of-Touch with the Economy’s Actual Behavior
a To figure out the decline in employment predicted by each dependency ratio we multiplied thepercentage decline in timber employment between 1990 and 1996 by the dependency ratio and thenmultiplied that number by the total employment in the economy in 1990.b For this exercise we define the “Owl Region” as Western Oregon and Washington.
Source: ECONorthwest with data from Beuter (1995; 1998), Olson (1990), Schallau, Maki, and Beuter(1969), and US Department of Agriculture (1988).
This reasoning seems reasonable at first blush, until one considers theimplications. What happens, for example, if the economic mix of acommunity, state, or region exactly matches the national mix? In theeconomic-base framework, such an economy would be dead in the water,with no export sector, no economic base and, hence, nothing to support thelocal sector. Furthermore, even if one accepts all the rest of the economic-base reasoning, consider how it views an industry that exports all of its
StudyArea Covered
in StudyDependency
Ratio
Predicted Decline in Employment From 1990
Using the Dependency Ratio a
Actual Change in Employment from
1990 to 1996
Economic Impact Projections for Alternative Levels of Timber Production in the Douglas-Fir Region Schallau, Maki, and Beuter, 1969
Douglas-fir region (roughly
the total Spotted Owl
Region b) 44.8% -211,515 391,682
Final Supplement to the Environmental Impact Statement for an Amendment to the Pacific Northwest Regional Guide, Volume 1, Spotted Owl Region USDA Forest Service 1988
Oregon and Washington
44.0% in Oregon,
28.0 % in Washington
-102,991 for Oregon and -73,002 in Washington
229,833 for Oregon and 260,666 for
Washington
Economic Impacts of the ISC Northern Spotted Owl Conservation Strategy for Washington, Oregon, and Northern California D. Olson, 1990
Spotted Owl Region of
Washington, Oregon, and
California 20.5% -96,645 391,682
Legacy and Promise: Oregon's Forests and and Wood Products Industry Beuter, 1995 Oregon 33.0% -77,243 229,883
Legacy and Promise: Oregon's Forests and and Wood Products Industry (Revised and Updated) Beuter, 1998 Oregon 18.0% -42,133 229,883
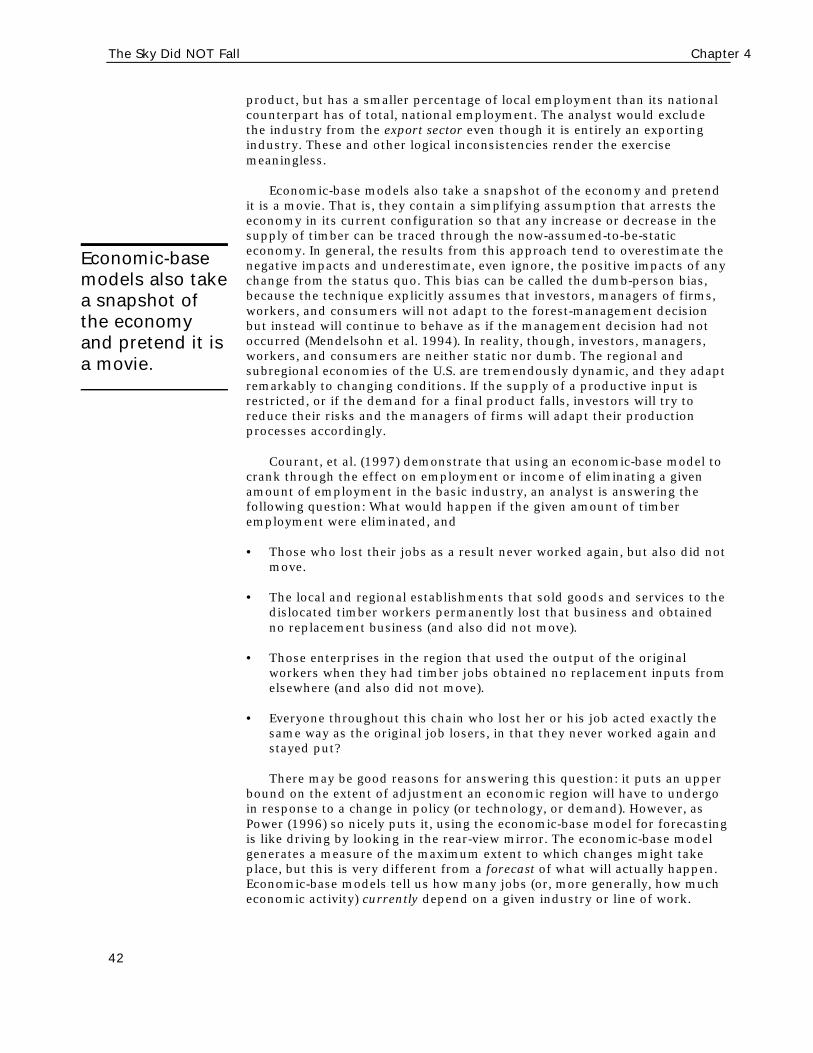
The Sky Did NOT Fall Chapter 4
42
product, but has a smaller percentage of local employment than its nationalcounterpart has of total, national employment. The analyst would excludethe industry from the export sector even though it is entirely an exportingindustry. These and other logical inconsistencies render the exercisemeaningless.
Economic-base models also take a snapshot of the economy and pretendit is a movie. That is, they contain a simplifying assumption that arrests theeconomy in its current configuration so that any increase or decrease in thesupply of timber can be traced through the now-assumed-to-be-staticeconomy. In general, the results from this approach tend to overestimate thenegative impacts and underestimate, even ignore, the positive impacts of anychange from the status quo. This bias can be called the dumb-person bias,because the technique explicitly assumes that investors, managers of firms,workers, and consumers will not adapt to the forest-management decisionbut instead will continue to behave as if the management decision had notoccurred (Mendelsohn et al. 1994). In reality, though, investors, managers,workers, and consumers are neither static nor dumb. The regional andsubregional economies of the U.S. are tremendously dynamic, and they adaptremarkably to changing conditions. If the supply of a productive input isrestricted, or if the demand for a final product falls, investors will try toreduce their risks and the managers of firms will adapt their productionprocesses accordingly.
Courant, et al. (1997) demonstrate that using an economic-base model tocrank through the effect on employment or income of eliminating a givenamount of employment in the basic industry, an analyst is answering thefollowing question: What would happen if the given amount of timberemployment were eliminated, and
• Those who lost their jobs as a result never worked again, but also did notmove.
• The local and regional establishments that sold goods and services to thedislocated timber workers permanently lost that business and obtainedno replacement business (and also did not move).
• Those enterprises in the region that used the output of the originalworkers when they had timber jobs obtained no replacement inputs fromelsewhere (and also did not move).
• Everyone throughout this chain who lost her or his job acted exactly thesame way as the original job losers, in that they never worked again andstayed put?
There may be good reasons for answering this question: it puts an upperbound on the extent of adjustment an economic region will have to undergoin response to a change in policy (or technology, or demand). However, asPower (1996) so nicely puts it, using the economic-base model for forecastingis like driving by looking in the rear-view mirror. The economic-base modelgenerates a measure of the maximum extent to which changes might takeplace, but this is very different from a forecast of what will actually happen.Economic-base models tell us how many jobs (or, more generally, how mucheconomic activity) currently depend on a given industry or line of work.
Economic-basemodels also takea snapshot ofthe economyand pretend it isa movie.
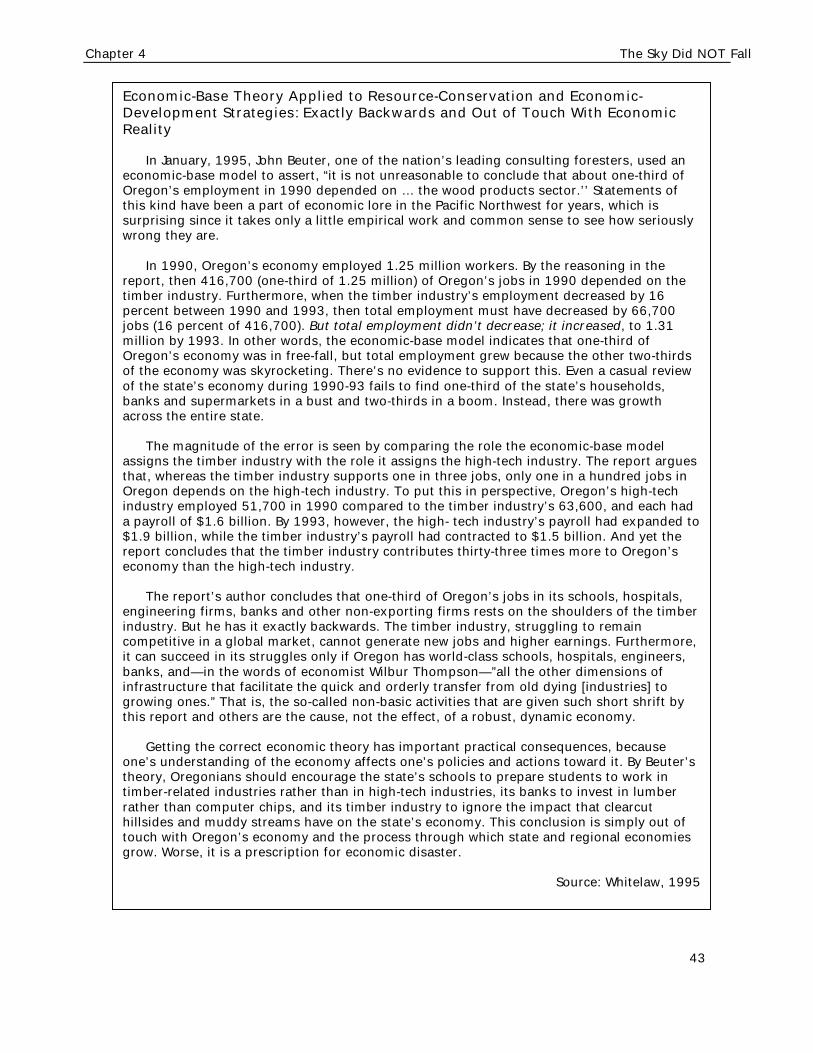
Chapter 4 The Sky Did NOT Fall
43
Economic-Base Theory Applied to Resource-Conservation and Economic-Development Strategies: Exactly Backwards and Out of Touch With EconomicReality
In January, 1995, John Beuter, one of the nation’s leading consulting foresters, used aneconomic-base model to assert, “it is not unreasonable to conclude that about one-third ofOregon’s employment in 1990 depended on … the wood products sector.’’ Statements ofthis kind have been a part of economic lore in the Pacific Northwest for years, which issurprising since it takes only a little empirical work and common sense to see how seriouslywrong they are.
In 1990, Oregon’s economy employed 1.25 million workers. By the reasoning in thereport, then 416,700 (one-third of 1.25 million) of Oregon’s jobs in 1990 depended on thetimber industry. Furthermore, when the timber industry’s employment decreased by 16percent between 1990 and 1993, then total employment must have decreased by 66,700jobs (16 percent of 416,700). But total employment didn’t decrease; it increased, to 1.31million by 1993. In other words, the economic-base model indicates that one-third ofOregon’s economy was in free-fall, but total employment grew because the other two-thirdsof the economy was skyrocketing. There’s no evidence to support this. Even a casual reviewof the state’s economy during 1990-93 fails to find one-third of the state’s households,banks and supermarkets in a bust and two-thirds in a boom. Instead, there was growthacross the entire state.
The magnitude of the error is seen by comparing the role the economic-base modelassigns the timber industry with the role it assigns the high-tech industry. The report arguesthat, whereas the timber industry supports one in three jobs, only one in a hundred jobs inOregon depends on the high-tech industry. To put this in perspective, Oregon’s high-techindustry employed 51,700 in 1990 compared to the timber industry’s 63,600, and each hada payroll of $1.6 billion. By 1993, however, the high- tech industry’s payroll had expanded to$1.9 billion, while the timber industry’s payroll had contracted to $1.5 billion. And yet thereport concludes that the timber industry contributes thirty-three times more to Oregon’seconomy than the high-tech industry.
The report’s author concludes that one-third of Oregon’s jobs in its schools, hospitals,engineering firms, banks and other non-exporting firms rests on the shoulders of the timberindustry. But he has it exactly backwards. The timber industry, struggling to remaincompetitive in a global market, cannot generate new jobs and higher earnings. Furthermore,it can succeed in its struggles only if Oregon has world-class schools, hospitals, engineers,banks, and—in the words of economist Wilbur Thompson—”all the other dimensions ofinfrastructure that facilitate the quick and orderly transfer from old dying [industries] togrowing ones.” That is, the so-called non-basic activities that are given such short shrift bythis report and others are the cause, not the effect, of a robust, dynamic economy.
Getting the correct economic theory has important practical consequences, becauseone’s understanding of the economy affects one’s policies and actions toward it. By Beuter’stheory, Oregonians should encourage the state’s schools to prepare students to work intimber-related industries rather than in high-tech industries, its banks to invest in lumberrather than computer chips, and its timber industry to ignore the impact that clearcuthillsides and muddy streams have on the state’s economy. This conclusion is simply out oftouch with Oregon’s economy and the process through which state and regional economiesgrow. Worse, it is a prescription for economic disaster.
Source: Whitelaw, 1995
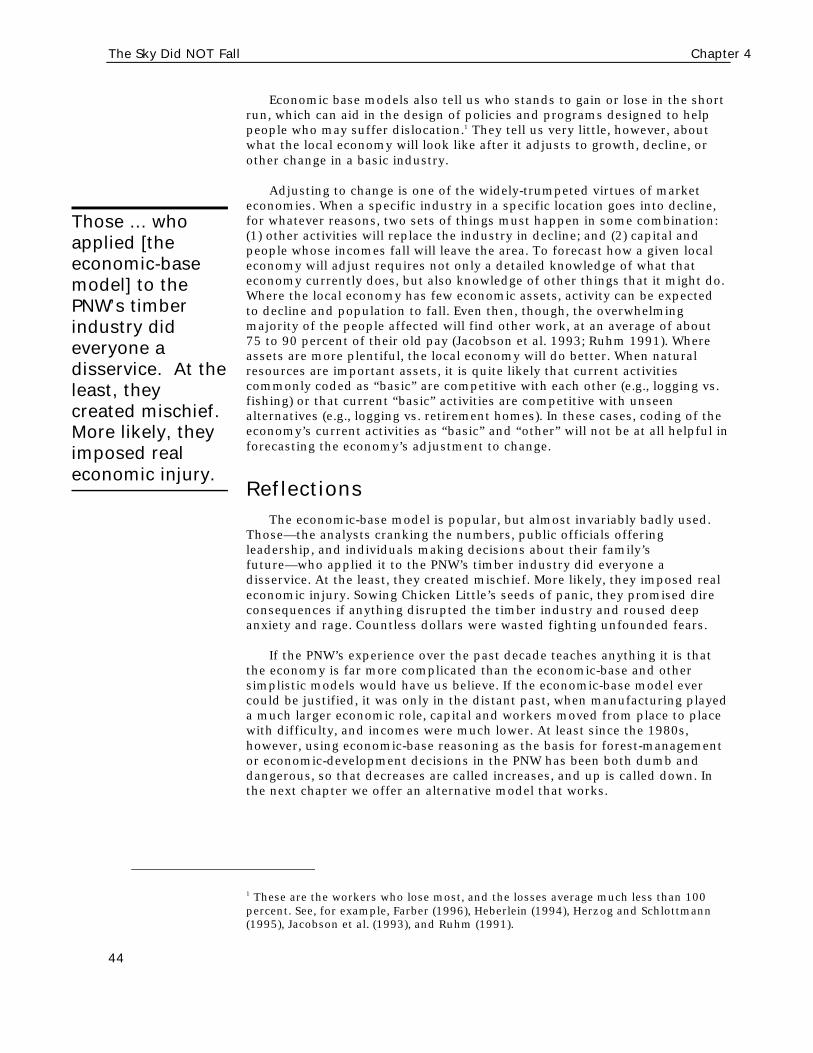
The Sky Did NOT Fall Chapter 4
44
Economic base models also tell us who stands to gain or lose in the shortrun, which can aid in the design of policies and programs designed to helppeople who may suffer dislocation.1 They tell us very little, however, aboutwhat the local economy will look like after it adjusts to growth, decline, orother change in a basic industry.
Adjusting to change is one of the widely-trumpeted virtues of marketeconomies. When a specific industry in a specific location goes into decline,for whatever reasons, two sets of things must happen in some combination:(1) other activities will replace the industry in decline; and (2) capital andpeople whose incomes fall will leave the area. To forecast how a given localeconomy will adjust requires not only a detailed knowledge of what thateconomy currently does, but also knowledge of other things that it might do.Where the local economy has few economic assets, activity can be expectedto decline and population to fall. Even then, though, the overwhelmingmajority of the people affected will find other work, at an average of about75 to 90 percent of their old pay (Jacobson et al. 1993; Ruhm 1991). Whereassets are more plentiful, the local economy will do better. When naturalresources are important assets, it is quite likely that current activitiescommonly coded as “basic” are competitive with each other (e.g., logging vs.fishing) or that current “basic” activities are competitive with unseenalternatives (e.g., logging vs. retirement homes). In these cases, coding of theeconomy’s current activities as “basic” and “other” will not be at all helpful inforecasting the economy’s adjustment to change.
ReflectionsThe economic-base model is popular, but almost invariably badly used.
Those—the analysts cranking the numbers, public officials offeringleadership, and individuals making decisions about their family’sfuture—who applied it to the PNW’s timber industry did everyone adisservice. At the least, they created mischief. More likely, they imposed realeconomic injury. Sowing Chicken Little’s seeds of panic, they promised direconsequences if anything disrupted the timber industry and roused deepanxiety and rage. Countless dollars were wasted fighting unfounded fears.
If the PNW’s experience over the past decade teaches anything it is thatthe economy is far more complicated than the economic-base and othersimplistic models would have us believe. If the economic-base model evercould be justified, it was only in the distant past, when manufacturing playeda much larger economic role, capital and workers moved from place to placewith difficulty, and incomes were much lower. At least since the 1980s,however, using economic-base reasoning as the basis for forest-managementor economic-development decisions in the PNW has been both dumb anddangerous, so that decreases are called increases, and up is called down. Inthe next chapter we offer an alternative model that works.
1 These are the workers who lose most, and the losses average much less than 100percent. See, for example, Farber (1996), Heberlein (1994), Herzog and Schlottmann(1995), Jacobson et al. (1993), and Ruhm (1991).
Those ... whoapplied [theeconomic-basemodel] to thePNW’s timberindustry dideveryone adisservice. At theleast, theycreated mischief.More likely, theyimposed realeconomic injury.

45
Chapter 5: Explaining theEconomy’s Response—AModel that DOES Work
Judge Dwyer’s 1991 prohibitions on new federal timber sales in thePacific Northwest (PNW) marked a turning point not just in the managementof the region’s forests but also in economists’ understanding of the differentroles forests play in the PNW’s local and regional economies. Prior to thistime, the prevailing view was that forests were important to the economyonly when they were logged. On the surface, this view seemed reasonable.Ever since settlers from other states came to the region, logging hadproduced wood-product commodities for consumers, and, in the process,contributed to the economic well-being of workers, communities, and theoverall region. Standing, unlogged forests, by contrast, produced none ofthese economic benefits. Besides, the apparent abundance of our forestsobscured the costs of logging them.
Following Judge Dwyer’s ruling, though, economists have taken a harderlook and found a different reality.1 They found that industrial timberproduction generates not just benefits for the economy but also costs.Furthermore, whereas the benefits accrue largely within a timber industrywith little or no prospects for expanding, the costs fall onto and inhibit theregion’s growth sectors. Rather than stabilizing communities, the timberindustry, with its dangerous work conditions, declining wages, and erratic,declining employment patterns, often does the reverse. Conversely,communities adjacent to forests protected from logging generally exhibitabove-average levels of prosperity and growth.
In this chapter we summarize a model of the forest-economy relationshipthat explains these and similar findings. It has three central premises:
(1) Forests are more than just trees. They are capable of producing not justlogs but myriad goods and services, including clean water and the habitatessential for the birth and growth of salmon and other fish and wildlife.
(2) The competition for forest resources is intense, so that any forest usegenerates benefits for some and costs for others. Some of thiscompetition manifests itself in markets, but most of it occurs throughpolitical and other nonmarket mechanisms. To understand the economicconsequences of logging restrictions that increase environmentalprotection, one must examine their effects on the competition for forestresources. In general, the level of services demanded from forestsexceeds and is growing faster than the volume of logs demanded.
1 In 1995, for example, more than 65 economists endorsed a brief paper (Power 1995)describing the shift in the economic roles of the region’s forests and other naturalresources.

The Sky Did NOT Fall Chapter 5
46
(3) Numerous factors other than decisions about logging levels affect thecompetition for forest resources. These factors tend to diminish theeconomic importance of logging relative to that of other forest uses.
This chapter discusses these three premises in more detail.
Forests and the Economy:More Than Just Trees
Forested ecosystems play important roles in the economy by producingthings that benefit humans, things that impose costs on humans, or both.2
They affect our well-being either along paths commonly associated with theeconomy and our standard of living—subsistence, commercial production,and property development—or along paths no less important economically,but associated with the quality of life in our communities—attractiveneighborhoods, recreation, and the presence of wildlife. In addition, there areimportant interactions with spirituality/religion, aesthetics, communitycomity, and the sense of obligation to future generations. In short, forestsare important to the economy because they can affect—and be affectedby—all types of human activity.
Production Amenities, Consumption Amenities,and Intrinsic Values
There are any number of ways to describe the forest’s many roles in thePNW’s economy. One especially useful way is illustrated in Figure 5.1. Itshows that the economy derives value from the region’s forests in threeways: production amenities to nearby public and private enterprises;consumption amenities to nearby households; and intrinsic values to those,both near and far, who cherish the forests themselves and the streams, flora,and fauna they support. The term, amenities, has a particular meaning in thiscontext. When a forest provides production amenities to an enterprise, itfacilitates the production process by lowering costs or increasing output.3 Insome instances, a forest resource is an essential element of the productionprocess, as when trees become lumber and a silicon-chip manufacturer useswater from forest streams in the production of silicon chips. Sometimes the
2 This formulation of the interaction between forests and the economy inherentlyviews forests as important only insofar as they affect the quality of life of humansociety, or parts thereof. We recognize that many find this anthropocentric view, atbest, incomplete. It ignores the biocentric view that a forest has value in and of itself.It also artificially views humans as exogenous to the forest. We narrow our scopebecause the focus on a forest’s contribution to human quality of life mirrors a centralconsideration underlying human actions affecting the forest. We take a broad view,however, of the ways in which the forest affects human standards of living andquality of life, including humans’ aesthetic, cultural, and spiritual values andmotivations.
3 Conversely, disamenities derived from the forest increase an enterprise’s costs orlower its output but, to conserve space, we focus the discussion on the amenities.Potential production disamenities include the presence of naturally-occurringpathogens in water supplies derived from forests, floods fed by forest streams, andair pollution from forest fires. Analogous disamenities exist for consumption andintrinsic values.

Chapter 5 The Sky Did NOT Fall
47
connection is less direct, as when urban developers earn a premium forhouses with good views of nearby forests.
Figure 5.1: Forests Make Many Contributions to the Economy
Source: ECONorthwest.
When a forest provides consumption amenities to a household, itincreases the quality of life of those in the household by lowering the cost orincreasing the availability of goods and services for consumption. Localresidents often enjoy these amenities inside the forest itself, through hiking,subsistence hunting, recreational driving on forest roads, and so forth. Theyalso may enjoy some amenities outside forest boundaries. This occurs, forexample, when urban dwellers have access to low-cost, high-quality,municipal water derived from forest streams or derive pleasure from seeingdistant forest vistas on their daily commute.
The term, intrinsic value, reflects the preference some people have forprotecting, preserving, or enhancing the intrinsic properties of the PNW’sforests, as well as the streams, flora, fauna and other forest components.Intrinsic values do not entail or arise from, an explicit current use of theforest.4 They arise, instead, whenever individuals place a value on
4 We use the phrase, intrinsic, because it is more accessible to a layperson thanequivalent phrases, such as passive nonuse value, that economists commonly employ.It refers to value separate from the current or expected use of a resource, includingboth consumptive and nonconsumptive use. Economists have devised severalapproaches for dividing the intrinsic value of a resource into component parts. Acommon approach is to distinguish between option value and existence value(Cicchetti and Wilde 1992). Option value is the value one derives from knowing thatthe resource will be available for one’s use in the future. Existence value can be eitherthe inherent value one places on the existence of the resource, itself, or the vicariousvalue of knowing that the resource is or will be available for others. The vicariousvalue of knowing that the resource will be available for future generations iscommonly called bequest value. For the purposes of this discussion it is notnecessary to examine these components separately. Some ecologists argue that none
PNW Forests
Production amenitiesfor nearby public and
private enterprises
Consumption amenitiesfor nearby households
Intrinsic values for localand nonlocalindividuals

The Sky Did NOT Fall Chapter 5
48
maintaining the existence of old trees, clean streams, a species, a scenicwaterfall, or some other forest resource, either for its own sake, or on theprospect that the resource will be useful in the future, even to futuregenerations. Actions that increase the robustness of the resources, forexample, by preventing degradation of critical habitat for an endangeredspecies or by ensuring the flow of a waterfall, increase the welfare of thoseconcerned about these issues, and actions that degrade the resourcesdecrease this welfare. One need not live near a forest to recognize theintrinsic values of forests in the PNW.
The relationships in Figure 5.1 lay the foundation for a model able toexplain the many, diverse, economic consequences of actions limiting logging
in the PNW to protect owls and accomplish otherenvironmental objectives. We dedicate the bulk ofthis chapter to elaborating the details of the model.Before turning to that discussion, however, webriefly describe how an alternative approach,derived from the ecologists’ perspective of forests,also yields the conclusion that there is more to theforest than trees.
The Ecological Perspective
The ecological approach focuses on threebuilding blocks: ecosystem goods and services,functions, and states (Quigley et al. 1996).5
Ecosystem goods and services are specificcomponents of ecosystems that might be extracted(e.g., timber or forage) or remain in situ, as whensections of a forest are used for recreational hiking,and a waterfall is a notable landmark. Ecosystemfunctions are processes, such as the stabilization ofsoils on upland slopes or a riparian zone’s filtrationof sediment in runoff from uplands. Ecosystemstates are systemic or integrated characteristics,such as those associated with old-growth forests,scenic landscapes, and watersheds with low floodrisk.
An ecosystem’s goods, functions, and states allcontribute to the economy. The adjacent text box,for example, illustrates some of the economicallyimportant goods and services from forestedwetlands and rivers. These are produced as theforested wetlands and rivers perform various
of these categories fully recognizes the value of the life-support services ecosystemsprovide that make the earth habitable (Baskin 1997). It could be argued that lifesupport services constitute a fourth category in Figure 5.1. On the other hand, a casecould also be made that without life-support services, public and private enterprises,and households would be faced with large problems. We do not debate the point herebut, instead, expand the category of intrinsic values to include this life-support value.
5 For a wide-ranging discussion, from a ecological perspective, of the economicimportance of ecosystems, see Daily (1997).
Economically Important Goodsand Services from Forested Wetlands
and Rivers
Water Supply forHousehold use (drinking, cooking, washing,waste disposal)Industrial use (production input, processmedium, heating and cooling)Irrigation (commercial agriculture,subsistence gardens, lawns and flowers, parksand golf courses)AquacultureAesthetics (fountains, swimming pools)
Goods Other than WaterAnimal products (fish, shellfish, fur-bearers)Plant products (cereals, landscaping)Mineral products (nutrients, gravel)
Nonextractive Goods and ServicesFlood controlSoil fertilizationAesthetics (scenery)Waterborne transportationHydroelectric generationRecreation (boating, swimming, fishing,wildlife viewing, hunting)Pollution control (dilution of effluent, removalof pollutants)
Source: Based on Postel (1997).

Chapter 5 The Sky Did NOT Fall
49
functions. The set of functions and their robustness are determined, in turn,by the state of the forested wetlands and rivers.
Looking at economic issues from the ecological perspective is usefulbecause it drives home the fact that a forested ecosystem and thesurrounding economy continuously interact with one another in many,complicated ways. Human activities associated with the production,distribution, and consumption of wealth derive many different goods andservices from the ecosystem but, in doing so, they alter the ecosystem’sphysical and biological characteristics. These changes, in turn, affect thestate of the ecosystem and the stock of goods and services available forenhancing human standards of living, thereby altering future humanactivities. So the cycle of interactions between the ecological system andeconomic system continues.
The ecological perspective makes clear that the evaluation of how loggingreductions affect the economy must embrace, at least in principle, acomplicated, dynamic exercise. This conclusion lies at the heart of our modeland stands in stark contrast with the simplistic economic-base model somany have used to predict the consequences of logging reductions.
The Competition for Forest ResourcesNo forest can satisfy the demands for all goods and services and so there
is competition for forest resources. This leads to an inescapable conclusion:it is impossible to understand the economic consequences of a forest-management decision without understanding how it affects the competitionfor forest resources.
This section describes the general categories of competing demands for aforest. The discussion is primarily intended for an audience with some basictraining in economics, particularly micro-economic analysis. For those moreskilled in economics, we recommend the more technical discussion inCourant et al. (1997). The discussion aims to demonstrate how forest-management decisions, such as a decision to restrict logging, can shift thecompetitive outcome by altering (1) the overall value of goods and servicesderived from the forest; (2) the mix of goods and services (holding the overallvalue constant); or (3) the distribution of goods and services among currenthuman groups or between this generation and future ones.
To categorize the competition we use a taxonomy that distinguishesamong four types of products derived from the goods and services forestsprovide. The four types of products are illustrated in Figure 5.2.6 The leftside of Figure 5.2 shows two types of demand for production amenities; theright side shows two types of demand for consumption amenities. Each typeof demand exists independently, but the competition among them is bestunderstood by assuming that one type (Type 1) prevails, and then looking atthe consequences for the others.
6 For a more thorough treatment of competitive products and the interactions amongthem, see Courant et al. (1997).
It is impossible tounderstand theeconomicconsequences of aforest-managementdecision withoutunderstandinghow it affects thecompetition forforest resources.

The Sky Did NOT Fall Chapter 5
50
Competition for Production Amenities
The most easily identifiable demands for productive amenities entail theextraction or development of forest resources. We use the term, extraction,to embrace activities, resource uses, and industries associated with cropproduction, grazing, timber production, mining, and other activities thatchemically, electrically, or physically remove one or more elements (flora,fauna, mineral, or energy) of the ecosystem from its source.
Figure 5.2: The Competing Demands for Forest Resources
Source: ECONorthwest.
We use the term, development, to refer to the occupation of a site byhuman structures, such as occurs during urbanization. Development alsoincludes intense human activity—draining a wetland, changing thecomposition of a forest’s floral community, concentrating off-road-vehicletraffic, and so forth—that substantially alters a forest’s ecosystem processes.Logging, mining, ranching, and development are the most important of thedemands for the production amenities of PNW forests, although there aremany others, including commercial fishing, and, to a certain extent, tourism.Demand for the productive amenities of a forested ecosystem comes from“private and public enterprises,” which we define broadly, to include
Competitionfor ForestResources
Amenities forConsumers
Amenities forProducers
Type 2 Demand:Competing
Commercial Uses
Products that incureconomic costs fromthe Type 1 activities
Type 4 Demand:Intrinsic Values
Intrinsic economicvalues derived fromthe forest resources
Type 1 Demand:Direct Commerical
Use
Products that benefitfrom extraction &development activitiesthat directly use theresources
Private & PublicEnterprises:
Type 3 Demand:Quality of Life
Elements of quality oflife, derived from theforest resources, thatinfluence household-location decisions
Consumers:

Chapter 5 The Sky Did NOT Fall
51
chartered institutions, such as private corporations, incorporated cities, andpublic agencies, as well as to households that farm land, build a house, andrecreate, and to other groups that sponsor extractive or developmentactivities.
Type 1 Products - Extractive and Development Activities. We separatethe demands for productive amenities into two groups. We first identify aspecific extractive or development product derived from a forest and call itType 1. Type 1 products have two important characteristics: they directly usenatural resources and they deplete the stocks of resources. The identificationof a particular product as Type 1 is arbitrary, but purposeful. This type ofdemand usually is associated with a familiar extractive industry, such asfarming, ranching, logging, or mining, or with common developmentactivities: developed recreation, urbanization, bridge construction, and thelike. In general, only one Type 1 product benefits from a particular use offorest resources, but sometimes there may be more than one. Theconstruction and operation of a dam may benefit irrigators, bargecompanies, and consumers of hydroelectricity, for example, or logging maybenefit the timber industry and some sectors of the recreation industry(Quigley et al. 1996).
Type 2 Products - Products Upon Which Type 1 Production ImposesCosts. After identifying the products that benefit from a specific resourceuse, we then identify those that incur costs from that use, and call theseType 2 products. We purposefully distinguish between Type 1 and Type 2products to drive home the message that there often is competition, withinthe extractive and development sectors, for forest resources. This message isimportant because, too often, the competition for forest resources ischaracterized as simply a jobs-vs.-environment contest between an industryseeking to use a resource as a productive input and those who want toprotect the environment. By highlighting products that incur economic costsfrom extractive and development activities, we emphasize the point that thepositive consequences arising from one set of extractive or developmentactivities frequently has negative effects on one or more others.
There are three mechanisms by which production of outputs associatedwith extractive and development activities (Type 1 products) can imposecosts on Type 2 products: direct displacement of resource-relatedproduction; displacement through the existence of negative externalities; andsubsidies. It is important to note that, although we discuss thesemechanisms here in the context of Type 1 products imposing costs on Type2 products, the same mechanisms apply to all types of products derived fromforest resources. It is only to conserve space that we do not repeat thediscussion as we subsequently address the remaining elements of Figure 5.2.
Direct displacement occurs when two or more enterprises competedirectly for a forest’s natural-resource amenities. An increase in the output ofa given Type 1 product, other things equal, will reduce the output of a Type 2product by reducing the supply of some ecosystem amenities for Type 2production. Direct displacement generally occurs through a formal orinformal competitive-bidding process. Through this process, a Type 1 use ofa resource decreases the resource’s availability for use in the production ofsome Type 2 product. As a result, the Type 2 product becomes either morescarce or more costly than would otherwise be the case. There currently isconsiderable concern in the Pacific Northwest, for example, about theimpacts of logging and related activities on the quality of surface water
The Sky Did NOT Fall Chapter 5
52
available downstream for municipal-industrial water use (Bernton 1996).With reductions in water quality, the affected water utility would have tocurtail production or incur additional costs to obtain water from othersources.
Displacement also occurs when the production of a Type 1 product isaccompanied by negative externalities.7 Negative externalities are ubiquitouswhen Type 1 activities affect the quality of air, water, habitat andlandscapes.8 Increased sedimentation from timber production, for example,can create additional costs for downstream fisheries, landowners, municipal-industrial water users, and public agencies (Meehan 1991; Reid 1993). Thesecosts arise not because of competitive bidding for the use of stream water,but because the downstream effects are external to the incentives facingupstream loggers. Externalities are an important source of market failure.Generally, solving market failures requires public policies that attempt tomake individual incentives compatible with collective objectives (Field 1997;Goodstein 1995; Tietenberg 1996).
The third mechanism by which a Type 1 use of forest resources canimpose costs on other producers comes into play when governmentsubsidies distort the prices or production levels of a Type 1 product. Similardistortions can arise from regulatory and other actions, such as trade policy,but, to conserve space, we lump them all under the rubric of subsidies.Subsidies draw money from, and thereby restrict the output and profits of,other producers, including some who have no other relationship to the Type1 product or its use of forest resources. Hence, subsidies are akin toexternalities.
Subsidies can arise in three ways. One entails subsidies to the Type 1product itself, for example, price-support payments for certain products foroverseas export (Environmental Working Group 1995; Offutt and Shoemaker1990). Another occurs through subsidies to the Type 1 use of a resource as aproductive input, for example, below-cost pricing for timber, forage,hydropower, and navigation derived from federal lands and facilities (Councilof Economic Advisors 1994; U.S. House of Representatives 1994). Subsidiesalso can be directed at labor, capital, or some other nonresource input to theType 1 production process (Black and Smillie 1988; Meyer and Rosenbaum1996; Nauth 1992).
7 In some cases externalities are positive. We include such cases as a part of the inputdemand.
8 There is an extensive literature regarding when a particular cost or benefit is or isnot an externality, or whether a particular price or production phenomenon stemsfrom displacement, an externality, or a subsidy. Baumol and Oates (1988, pp. 14-15),in an important text on environmental externalities, provide a useful backgroundregarding the vague boundaries among these:
“The externality is in some ways a straightforward concept; yet, in others, it isextraordinarily elusive. We know how to take it into account in our analysis,and we are aware of many of its implications, but, despite a number ofilluminating attempts to define the notion, [footnote omitted] one is left withthe feeling that we still have not captured all its ramifications. Perhaps thisdoes not matter greatly. … Ultimately, definitions are a matter of taste andconvenience.”
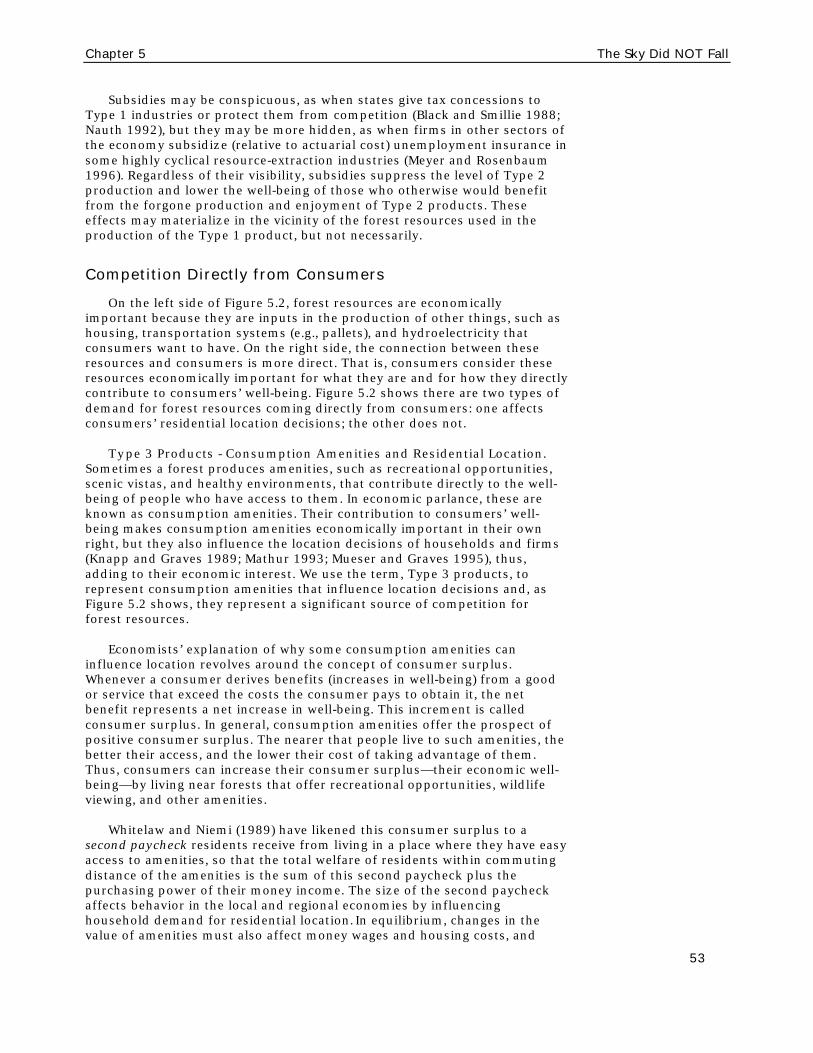
Chapter 5 The Sky Did NOT Fall
53
Subsidies may be conspicuous, as when states give tax concessions toType 1 industries or protect them from competition (Black and Smillie 1988;Nauth 1992), but they may be more hidden, as when firms in other sectors ofthe economy subsidize (relative to actuarial cost) unemployment insurance insome highly cyclical resource-extraction industries (Meyer and Rosenbaum1996). Regardless of their visibility, subsidies suppress the level of Type 2production and lower the well-being of those who otherwise would benefitfrom the forgone production and enjoyment of Type 2 products. Theseeffects may materialize in the vicinity of the forest resources used in theproduction of the Type 1 product, but not necessarily.
Competition Directly from Consumers
On the left side of Figure 5.2, forest resources are economicallyimportant because they are inputs in the production of other things, such ashousing, transportation systems (e.g., pallets), and hydroelectricity thatconsumers want to have. On the right side, the connection between theseresources and consumers is more direct. That is, consumers consider theseresources economically important for what they are and for how they directlycontribute to consumers’ well-being. Figure 5.2 shows there are two types ofdemand for forest resources coming directly from consumers: one affectsconsumers’ residential location decisions; the other does not.
Type 3 Products - Consumption Amenities and Residential Location.Sometimes a forest produces amenities, such as recreational opportunities,scenic vistas, and healthy environments, that contribute directly to the well-being of people who have access to them. In economic parlance, these areknown as consumption amenities. Their contribution to consumers’ well-being makes consumption amenities economically important in their ownright, but they also influence the location decisions of households and firms(Knapp and Graves 1989; Mathur 1993; Mueser and Graves 1995), thus,adding to their economic interest. We use the term, Type 3 products, torepresent consumption amenities that influence location decisions and, asFigure 5.2 shows, they represent a significant source of competition forforest resources.
Economists’ explanation of why some consumption amenities caninfluence location revolves around the concept of consumer surplus.Whenever a consumer derives benefits (increases in well-being) from a goodor service that exceed the costs the consumer pays to obtain it, the netbenefit represents a net increase in well-being. This increment is calledconsumer surplus. In general, consumption amenities offer the prospect ofpositive consumer surplus. The nearer that people live to such amenities, thebetter their access, and the lower their cost of taking advantage of them.Thus, consumers can increase their consumer surplus—their economic well-being—by living near forests that offer recreational opportunities, wildlifeviewing, and other amenities.
Whitelaw and Niemi (1989) have likened this consumer surplus to asecond paycheck residents receive from living in a place where they have easyaccess to amenities, so that the total welfare of residents within commutingdistance of the amenities is the sum of this second paycheck plus thepurchasing power of their money income. The size of the second paycheckaffects behavior in the local and regional economies by influencinghousehold demand for residential location. In equilibrium, changes in thevalue of amenities must also affect money wages and housing costs, and

The Sky Did NOT Fall Chapter 5
54
thereby the real wage. All else equal, if amenities in a region improve, peoplewill tend to move to that region, bidding housing prices up and wages down,until there is no net advantage from further migration. That location-specificconsumption amenities are an important influence in residential locationdecisions is well documented.9
Essentially all of the existing literature on the value of amenitiesimplicitly assumes that the amenity value is reflected in wages and prices inthe same county or city as the amenity itself. This view probably is toorestrictive. Natural-resource amenities a few hours drive from an urban areaalso will plausibly contribute to the quality of life in that area, showing up aslower wages and higher housing costs at locations that are some distancefrom the amenity itself. Furthermore, forest resources in one place canmaterially influence the quality and quantity of recreational opportunitiesand other amenities some distance away.
As pointed out by Roback (1988) and others, lower real wages that arisefrom consumption amenities act as a special type of production amenity forfirms that are able to reduce their costs by locating where wages are lower.This mechanism allows natural-resource consumption amenities to affectwhere goods and services are produced. Thus, the quantity and quality ofnatural resource amenities can affect the levels and types of jobs (andeconomic activities in general) throughout the local and regional economies,including sectors with no direct link to the use of ecosystem resources.
Type 4 Products - Intrinsic Economic Value. The Type 4 products shownin Figure 5.2 are ecosystem products people value for their intrinsicproperties. Intrinsic values, often termed “existence values,” do not entail anexplicit current use of the resource.10 They arise whenever individuals place avalue on maintaining the existence of a species, scenic waterfall, or otherresource for its own sake, or on the prospect that the resource will be useful,for example, to future generations. Actions that increase the robustness ofthe resources, for example, by preventing degradation of critical habitat foran endangered species or by ensuring the flow of the waterfall, increase thewelfare of those concerned about these issues, and actions that degrade theresources decrease this welfare.
Unlike the other three uses of ecosystem amenities that we havediscussed, Type 4 products, by themselves, are unlikely to have any manifest
9 The early contributions are Rosen (1979) and Roback (1982). For more recent workon this topic see Beeson (1991), Berger and Blomquist (1992), Blomquist et al. (1988),Brady (1995), Brown (1994), Browne (1984), Cooper (1994), Cromartie (1998), Cushing(1987), Figlio (1996), Gabriel et al. (1996), Gottlieb (1994), Greenwood et al.(1991), andSherwood-Call (1994).
10 Some argue that none of the intrinsic value categories fully recognize the value ofthe life-support services ecosystems provide that make the earth habitable (Baskin1997). Although some economists have attempted to include biological diversity intheir calculations of the value of life support services, they have not been able todirectly get at what it is worth to have species work together within ecosystems toprovide these services. It could be argued that they constitute a fifth type of demandin our typology. On the other hand, a case could also be made that without life-support services, Types 1−4 would be faced with large problems. We do not debatethe point here but, instead, expand the category of Type 4 products to include thislife-support value.

Chapter 5 The Sky Did NOT Fall
55
economic effect on jobs, income, or other indicators of economic activity.The forests of Washington and Oregon may be of intrinsic value to someresidents of Miami, Los Angeles, and other distant places, but the effect ofthis on economic activity in the PNW will be small unless it is articulatedthrough the political system. Still, the resource affects the real well-being ofreal people, and this well-being belongs in any comprehensive analysis of thevalue of the resource.11 For some environmental issues, such as maintainingthe biodiversity and integrity of ecosystems passed to future generations,Type 4 values may be very large.
Other Factors InfluencingForest-Resource Competition
The conceptual framework associated with Figures 5.1 and 5.2 brings intofocus several critical issues that inevitably arise whenever one is analyzingthe ecosystem-economy relationship for forest resources. For the purposesof this discussion, we focus on two of the most important ones:12
• Defining the spatial characteristics of the relevant economy.
• Selecting appropriate variables and time periods for measuring theeconomic consequences of ecosystem-management policies and activities.
The Relevant Economy
The competing demands for a forest’s resources generally do notoriginate from a common set of workers, households, firms, communities,and regions.13 Only by chance will all the competing demands for a forest’sresources share a common boundary. In most situations, the relevanteconomic landscape extends far beyond the forest itself.
A general, but typical, illustration reinforces this conclusion. In a givensituation, the competition for forest resources coming from those whobenefit from timber production (Type 1) might be concentrated on one sideof the forest, in nearby communities having both milling capacity andtransportation facilities appropriate for hauling heavy loads. If the timberproduction degrades salmon habitat and increases turbidity and flooding in
11 While there is general agreement on the statement in the text as a matter ofprinciple, the literature is sharply divided on the question of whether such value canbe accurately measured. See Arrow et al. (1993), Castle et al. (1994), Coursey et al.(1987), Eberle and Hayden (1991), Gregory et al.(1995), and Stevens et al. (1991).
12 In a more complete discussion of analytical issues, one should consider severaladditional issues. Foremost among these are (a) placing ecosystem-managementdecisions in the context of autonomous factors, such as the declining ability ofunskilled workers to earn high wages, (b) understanding concerns aboutsustainability, and (c) evaluating the interactions among economic values, impacts,and equity. For a discussion of these issues, see Courant, et al. (1997).
13 A particular individual, household, or community may, however, express all fourtypes of demand. A timber worker, for example, may lobby for more trees to be cut inpart of the forest, oppose logging elsewhere to reduce logging’s adverse effects on thequality of water his wife uses in her food-processing enterprise, live where he doeslargely to have easy access to unlogged-forest recreation, and place an intrinsic valueon protecting spotted owls.

The Sky Did NOT Fall Chapter 5
56
streams, the competition coming from those who incur these environmentalexternalities (Type 2) might encompass residents of the mill communities aswell as others living hundreds of miles downstream in the watershed. Thecompetition coming from those who see timber production as having anadverse impact on the quality of life (Type 3) might include residents of thewatershed, as well as residents who live nearby but are outside thewatershed. Those competing for forest resources because they place anintrinsic value on forest resources affected by timber production (Type 4)may live in the vicinity of the forest or far afield.
Even this casual view of the relevant economic region(s) has importantimplications for understanding the economic consequences of decisions torestrict logging and enhance the forest environment in the PNW. Many, if notmost, of the economic consequences have occurred away from the forest.This is true even if one looks at consequences associated with the timberindustry itself. Loggers in the Pacific Northwest often travel long distances tofind work and mills compete intensely for logs over distances of severalhundred miles (ECONorthwest 1996). Within this environment of area-widecompetition, employment reductions arising from a reduction in timberharvest in one locality are likely to occur at the least efficient sawmill in theentire area, rather than at the mill closest to the site of the reduced harvest.Similarly, the timber-harvest reduction might affect the paycheck, not of thelogger who lives nearby, but of the one who lives several hundred milesaway. In short, the distribution of economic impacts that follow from aspecific environmental-decision will generally be complicated and dispersed.
Incorporating metropolitan areas into the analysis is especiallyimportant. Forest-policy analysts often assume that the economic effects offorest-management decisions will impinge primarily on rural communities.They conclude that, because these communities are isolated, they arenecessarily dependent on the production of extractive products, primarilytimber, from the adjacent forest and, hence, they are especially fragile withrespect to changes in the flow of these products. Using this logic, thecommunity-impact section of the environmental impact statementaccompanying the Northwest Forest Plan, for example, focuses exclusively onthe region’s rural counties and communities and assesses the extent to whichreductions in timber production would place these communities “at risk”(U.S. Department of Agriculture and U.S. Department of the Interior 1994,3&4 p. 298).
This view is too simple. It sees the forest’s importance to the economyprimarily, if not solely, through its production of extractive and developmentproducts (Type 1 in Figure 2.2), overlooking the offsetting consequences forcompeting demands and products (Types 2−4). Further, it exaggerates theeconomic isolation of rural communities and the economy’s sensitivity tochanges in timber and other commodities.
A common denominator in these shortcomings is the failure toacknowledge the importance of metropolitan areas to the relationshipbetween forested ecosystems and the economy. The historical economicisolation of nonmetropolitan communities is diminishing and, in manyrespects, it has expired. Clearly, some communities are more isolated thanothers, and within a given community, some residents are more integratedthan others. But virtually all nonmetropolitan residents are getting closereconomically to metropolitan centers.

Chapter 5 The Sky Did NOT Fall
57
The timber industry, itself, illustrates this trend. Historically, mills werelocated near the woods to reduce log-transportation costs. Because oftechnological changes that both allow and require additional processing perunit of final output, however, raw materials are now a smaller component ofcosts for most final products, and many manufacturers seek to locate, notnear the raw material, but near large markets and large pools of qualifiedworkers (Duffy 1994).
Thus, in all respects, the notion that forests are economically importantonly to local communities is coming undone. To understand the fulleconomic consequences of logging reductions one must look farther afield,and especially to the metropolitan centers. Apart from the logging itself, theeconomic activity that flows from logging increasingly occurs in thesecenters. Many of the subsidies to logging are borne by city residents and,perhaps most important of all, the consumption amenities that we discuss asType 3 products may induce migration to cities that are near, but not directlypart of, the forest.
This broad spatial view of the forest-economy relationship isfundamental to explaining how the PNW’s economy responded to loggingreductions. Most of the doom-and-gloom predictions assumed that loggingreductions would generate only job losses and these would occur largely inisolated communities where dislocated workers had few options. In realitythe logging reductions caused job gains as well as losses, and both wereconcentrated in or near metropolitan areas.
Relevant Time Periods
Logging restrictions do not have a single, one-time-only impact on theeconomy. Instead, the economy’s response evolves over time. Whatever theinitial, adverse economic impacts, the economy attempts to mitigate.Whatever the initial positive impacts, it tries to accentuate.
The evolution occurs in four general stages, shown in Figure 5.3. In Stage1, a restriction on logging in the PNW is adopted and, in Stage 2, this actionsends economic signals to the local, statewide, regional, and nationaleconomies, indicating a change in the economic role of the PNW’s forestresources. The signals have four major destinations, represented by the fourtypes of competing demands for the forest resources, as indicated in Figure5.2. Although Figure 5.3 shows Stages 1 and 2 occurring as a single, abruptevent, they generally transpire over a longer period, especially for publiclands or whenever the forest-management decisions are subject to publicregulation.
Stages 3 and 4 of Figure 5.3 illustrate the dynamic character of theeconomy’s response to the adoption of the logging restriction. In Stage 3, theeconomy responds to the economic signals sent in the second stage throughchanges in prices or incomes or both. In Stage 4, prices and incomes reachtheir new levels, and the economy exhibits the long-run effects of theadoption of the forest-management decision. The long-run adjustment mayentail feedback loops, through which changes in prices and incomes mayinfluence future forest-management decisions.

The Sky Did NOT Fall Chapter 5
58
Figure 5.3: The General Transition Process by Which aLogging Restriction Leads to Changes in the Economy
Source: ECONorthwest.
Stage 1: Logging is restricted through a political, administrative, or judicial decision
Stage 2: The decision, and the process leading to it, sends signals to four groups:
Those who benefitfrom the dominant
extractive ordevelopment
activity (Type 1demand)
Those associatedwith enterprisesthat incur costs
from the dominantextractive ordevelopment
activity (Type 2demand)
Those whoexperience a
change in qualityof life from the
dominantextractive ordevelopment
activity (Type 3demand)
Those whoexperience achange in the
forest’s intrinsicvalue from the
dominantextractive ordevelopment
activity (Type 4demand)
Stage 3: The economy responds to the signals:
Prices change. Incomes change. Local quality of life changes. Buyers andsellers alter their consumption patterns. Firms and households alter their
locational patterns.
Stage 4: The economy reaches its long-run transformation:
Change ineconomicstructure
Change in totalemployment,income, etc.
Change indistribution ofemployment,income, etc.
Change ineconomicwelfare

Chapter 5 The Sky Did NOT Fall
59
The precise path through Stages 3 and 4—the transition—will depend,not just on the characteristics of the logging restriction, itself, but also onthe multiple economic forces and trends that are continuously altering andshaping the economy at all levels. Concern often is raised about the impactsof the transition on capital, property, and labor markets. Most marketsshould adjust quickly to the logging restriction, however, and they mayadjust fully in anticipation of the decision. The larger and more diverse theaffected economy, the smoother the transition.
How long does the transition take? There is no single, simple answer tothis question: both the nature and the duration of the economy’s responsedepend on many variables.
There are good reasons, however, to believe that many aspects of theeconomy are adjusting more quickly than in the past to changes in forest-management policy. For example, by the middle of 1997, lumber pricesthroughout the U.S. had stabilized in response to the April 1994 adoption ofthe Northwest Forest Plan. This was far quicker than many industry analystshad expected (Bernton 1997). Labor markets also are dynamic. Power (1996)reports that, of the workers nationwide who lost their jobs because of plantclosures or other mass layoffs in the 1980s, about half were unemployed 10weeks later and the percent remaining unemployed after twelve months wasroughly the same as the background rate of unemployment in the overalllabor force.
This is not to say that everyone adjusts this quickly, or that the costs ofadjusting to logging reductions are trivial. Instead, we are only pointing outthat adjusting to change is one of the widely-trumpeted virtues of marketeconomies. To understand the economic consequences triggered by JudgeDwyer’s injunction and the related restrictions on logging, one must take thisdynamism into account. Ignoring it invariably leads to exaggerated estimatesof job losses and unrealistic predictions of economic catastrophe.
ReflectionsThe forests of the Pacific Northwest are important to the economy
because they produce both goods, such as logs that are made into timber,and services, such as recreational opportunities. This fact was overlooked bythose who feared that the logging reductions triggered by Judge Dwyer’sinjunction and related decisions would decimate the economy. They believedonly the logs mattered, and downplayed the importance of the services.
They made at least three other critical errors. One, they forgot the factthat the industry had shrunk in importance. Two, they ignored themetropolitan areas and assumed that hundreds of smaller communities wereisolated from the metropolitan economies. Three, they turned a blind eye tothe economy’s ability to adjust quickly to mitigate the negative and enhancethe positive impacts of logging reductions.
The analytical model we describe here corrects these errors. In the nextchapter, we apply it to drive home the point that there is a sound economicexplanation for why the sky did not fall on the PNW’s economy when loggingdeclined in the late 1980s and early 1990s.

The Sky Did NOT Fall Chapter 5
60
61
Chapter 6: Reexamining the Evidence:Why the Sky Did NOT Fall
The economic sky over the Pacific Northwest (PNW) did NOT fall aslogging plummeted during the past decade. Federal timber harvest fell 5.5billion board feet (bbf) (86 percent) between 1988 and 1996, and the totalharvest fell 7.4 bbf (47 percent).1 At the beginning of the period many,perhaps most, in the region had no doubt: reductions of this magnitude musttrigger widespread, severe, unemployment. Instead, total PNW employmentincreased by 825,165 (27 percent).
How could this be? How could the regional economy expand whilelogging contracted? There are two possibilities:
1. The economy grew despite the decline in logging.
2. The economy grew because of the decline in logging.
In this chapter we use the model described in Chapter 5 to reexamine theevidence and conclude that both mechanisms have been in operation duringthe past decade. Implicit in the first explanation is the likelihood that thetimber industry has been too small to hold much sway over a dynamic andhighly adaptable regional economy. The second explanation recognizes thatlogging reductions have positive as well as negative economic effects. Webriefly address each of these explanations and conclude with a discussion ofwhat to expect in the future.
The Economy Grew DespiteLogging Reductions
Table 6.1 shows some of the most common, conventional measures ofthe timber industry’s importance to the regional economy and how theychanged from 1988, when logging peaked prior to the onset of actions toprotect the spotted owls and other species, to 1996, the most recent year forwhich data are available. The data in the table indicate that, given the generaleconomic conditions in the PNW during the period, drops over eight years of24,104 in timber employment, $774,000,000 in timber payrolls (1997dollars), $2,482,000,000 in timber output, and $1,056,000,000 in timberexports were insufficiently large to have a demonstrable, negative effect onthe comparable regional totals. Despite the timber-industry contractions, theregion’s performance in jobs and income exceeded the national average.Indeed, during this period the regional economy merely slowed for a bit andthen charged forward again, while the nation experienced a severe recession.
1 Federal timber harvests include harvests from National Forests and the Bureau ofLand Management. Harvests by the Bureau of Indian Affairs, National Parks, and otherfederal agencies were excluded.

The Sky Did NOT Fall Chapter 6
62
Table 6.1: Measures of the Timber Industry’s Importance to the PacificNorthwest Economy, During the Logging Reduction: 1988 to 1996
1988Lumber & Wood Products
PNW Total % of PNW
Total Timber Harvest (bbf) 15.66 15.66 100.0%
Federal Timber Harvesta 6.41 6.41 100.0%
Employment 3,045,584 110,684 3.6%
Payrollb 82,695 3,581 4.3%
Outputb 191,768 8,424 4.4%
International Exportsb,c 22,697 3,233 14.2%
1996Lumber & Wood Products
PNW Total % of PNW
Total Timber Harvest (bbf) 8.29 8.29 100.0%
Federal Timber Harvesta 0.87 0.87 100.0%
Employment 3,870,749 86,580 2.2%
Payrollb 111,325 2,807 2.5%
Outputb 251,580 5,942 2.4%
International Exportsb,c 36,150 2,177 6.0%
Change, 1988 to 1996PNW Lumber & Wood
Products
TotalChange
% Change TotalChange
% Change
Total Timber Harvest (bbf) -7.37 -47.1% -7.37 -47.1%
Federal Timber Harvesta -5.54 -86.4% -5.54 -86.4%
Employment 825,165 27.1% -24,104 -21.8%
Payrollb 28,630 34.6% -774 -21.6%
Outputb 59,812 31.2% -2,482 -29.5%
International Exportsb,c 13,453 59.3% -1,056 -32.7%
a Federal timber harvests only include harvests from National Forests and the Bureau of LandManagement.b Payroll, output, and international exports are all in millions of 1997 dollars.c International exports for lumber-and-wood-products include logs, pulpwood chips, lumber,plywood, and veneer.
Source: ECONorthwest with data from the Oregon Department of Forestry (various years), theOregon Employment Department (various years), the U.S. Department of Commerce, Bureau ofthe Census (various years), the U.S. Department of Commerce, Bureau of Economic Analysis(1998), Warren (various years), the Washington Department of Natural Resources (various years),and Washington State Employment Security (various years).

Chapter 6 The Sky Did NOT Fall
63
Across the measures of employment, payroll, output, and exports, Table6.1 indicates the timber industry represented about 3 to 14 percent of theregional economic pie that existed in 1988. Within the next seven years, theindustry’s decline removed a slice equal to about 1 to 8 percent of thateconomic pie, but, in the meantime, the remainder of pie had grown sorapidly the slice was hardly missed. Under the economic conditions of thetime, contractions of 21 to 33 percent in a timber industry with 2 to 6percent of the total economy were simply too small to exert much influenceover the regional economy.
Why was the economy so insensitive to the timber industry’s decline inthe late 1980s and early 1990s? To answer the question, one must look bothto the industry and to the surrounding regional economy.
The timber industry shrank in important ways during the 1980s,significantly reducing its employment and payroll per unit of timber logged(see the discussion in Chapter 3). This adjustment, though hard on workers,families, and communities, increased the competitiveness and adaptability oftimber firms throughout the region. Hence, as logging on federal lands beganto decline at the end of the 1980s, mills were more adept at securing logsupplies from elsewhere and getting more from each log.
The industry obtained new log supplies from lands outside the region aswell as within. Consultants inside the industry reported that, during 1994and 1995, mills in Oregon obtained logs from thirteen other states as well asfrom Chile, other countries in South America, Mexico, and New Zealand(Ehinger and Associates 1995).2 Within the region, mills looked to bothindustrial and nonindustrial lands for new log supplies. Increases indomestic prices caused logs that otherwise would have been exported to bediverted to mills in Oregon and Washington. Technological changes thatfacilitated the processing of small logs induced many industrial landownersto log second-growth trees that previously were considered too small. As aresult, log trucks that a decade earlier carried one, two, or three logs per loadnow carry scores of logs.
As log prices rose and mills put more effort into finding logs, loggingincreased on non-industrial timberland. Moreover, domestic mills beganoutbidding overseas competitors for logs that otherwise would have beenexported. By 1995, non-industrial logging in Western Oregon increased 103percent from the 83-87 average, from 275 to 559 million board feet (mmbf)(Lettman and Campbell 1997). During the same period, log exports declined44 percent, from 2.9 to 1.6 bbf (Warren 1994; 1998).
The industry also subjected the raw material that was available toadditional stages of manufacturing. As an indicator of this change,employment in the PNW’s secondary processing sector3 increased 14.8percent, from 23,192 in 1988 to 26,616 in 1996. This increase offset some ofthe employment reductions in the primary wood-processing section.
2 The states were Alaska, Arkansas, California, Colorado, Idaho, Louisiana, Montana,Nevada, New Mexico, Texas, Utah, Washington, and Wyoming.
3 Rufolo and Strathman (1990) identify the secondary processing sector as SIC 2431,2434, 2439, 244, 245, 2511, and 2541.
...contractions of21 to 33 percent ina timber industrywith 2 to 6 percentof the totaleconomy weresimply too small toexert muchinfluence over theregional economy.

The Sky Did NOT Fall Chapter 6
64
The changes in the timber industry seem to explain a lot of why thereduction in federal logging between 1988 and 1996 had such a negligibleeffect on the economy. Changes in the economy itself were also important.We describe some of the salient changes in the next section.
The Economy Grew Because ofLogging Reductions
At the core of the economic model described in Chapter 5 lies the strong,evolving competition for forest resources. There are four types of demand.Type 1, the dominant commercial use of forest resources competes withother commercial users that are adversely affected by logging (Type 2demand), consumers who base their household-location decisions on theflow of goods and services from the forest (Type 3 demand), and individualswho place an intrinsic value on the forest (Type 4 demand).
This model reveals that, as it generates benefits for itself and itsassociates, the timber industry imposes costs on other components of theeconomy of the Pacific Northwest. The timber-related benefits havedecreased, while the costs have increased, raising the probability that at leastsome logging has a net negative effect on the overall economy. Thus, thelogging reductions triggered by concerns about spotted owls, by preventingsuch logging, may have provided a regional economic stimulus.
The evidence we present below strongly supports this conclusion. Weorganize the evidence by looking in turn at each of the four types of demand.
Logging: the Dominant, but Shrinking, Commercial Use ofForest Resources (Type 1 Demand)
This type of demand has been weakening. That is, the industry no longercan make as strong a case as in the past to justify allocating forest resourcesto timber production rather than to alternatives uses. The timber industryonce could buttress its claim on forest resources by arguing that it producednot only valuable lumber-and-wood products but also many high-paying jobsand stable communities. All three elements of this argument havediminished. The lumber-and-wood products are not as valuable, relative toalternative supplies, the industry slashed jobs and wages, and researchershave documented widespread instability and social problems in communitiesclosely linked to the industry.
Murray and Wear (1998) examined the extent to which the lumber-and-wood-products industry of the Pacific Northwest is integrated with thenation’s other major producing area, the South. They found that, until about1988, prices in the PNW were generally not influenced by, but had adominant influence on, prices in the South. Afterward, the relationshipreversed itself. The authors suggest that the immediate trigger for thereversal was the listing of the northern spotted owl as a threatened species,but there were deeper contributing factors. One was the expiration of theprice premium PNW lumber once commanded. As we discussed earlier,lumber from old-growth Douglas fir has several superior characteristicsrelative to lumber from the South, but lumber from smaller and youngerDouglas fir does not. Hence, as the timber industry logged the old-growthforests to near exhaustion, its lumber-and-wood products became less
Chapter 6 The Sky Did NOT Fall
65
valuable, relative to products from the South, and the industry’s demands forforest resources became less compelling.
The industry’s demands weakened further as firms slashed jobs andpayrolls in the 1980s, as we discussed in earlier chapters. Between 1979 and1989, consecutive peaks in the national economic cycle, the industry reducedthe jobs per million board feet (mmbf) by 24 percent, from 10.6 to 8.0, andthe payroll per mmbf by 37 percent, from $405,170 to $252,868 (measuredin 1997 dollars). When one looks at the jobs and payroll per unit of landgiven to industrial timber production the declines are even more dramatic.Until recently, nearly all timber came from the land that was being logged forthe first time. In western Oregon and Washington, such land, on average,produces about 60 thousand board feet (mbf) per acre, whereas land beinglogged for the second time produces about 30 mbf per acre (Haynes 1986).This difference in yield per acre indicates that, all else equal, as the industryshifts from first to second harvest, the jobs and payroll per acre will fallabout 50 percent.
The industry’s behavior also undermines its claim to provide communitystability. A large body of research in the Pacific Northwest and California hasfound that, contrary to the industry’s assertions, communities with highconcentrations of timber-related activity do not exhibit stable employmentand high levels of prosperity. Instead, they typically have highunemployment levels and other indicators of social and economic distress(Cook 1995; Fortmann et al. 1991; Heberlein 1994; Hibbard and Elias 1993;Niemi and Whitelaw 1994). Past attempts by federal land-managementagencies to produce community stability and prosperity by selling high levelsof timber have failed repeatedly (Fortmann et al. 1989; Stewart 1993;Whitelaw 1992).
In sum, the timber industry’s own actions, and not owls, diminished thestrength of its claim that the forest must be logged to generate economicbenefits for the economy, good jobs for workers, and stable communities. Allof these actions were part of an evolution driven by ecological and economicrealities. Less than a year following Judge Dwyer’s 1991 prohibition ontimber sales from the spotted-owl national forests, Richard Haynes, theForest Service’s leading economist in the region, concluded that, “Oneconsequence of [this and related] events has been to compress changesexpected in timber harvests in another decade into this year and next year.Where the transition from an old growth to second growth industry, thoughtto be about half completed, was expected to continue through this decade itwill be mostly completed in the next 3-4 years” (Haynes 1991). Running outof old-growth trees and pressured to reduce costs, the industry’s economicimportance had to decline.
Thus, even if competing demands had remained unchanged, the reducedstrength of timber’s demand means that the economy would benefit fromfederal logging restrictions that shifted some forest resources targeted forlogging to alternative uses. As we discuss below, though, the competingdemands were growing, increasing the likelihood that the logging reductionsbenefited the overall economy.
...all else equal, asthe industry shiftsfrom first to secondharvest, the jobsand payroll per acrewill fall about 50percent.
The Sky Did NOT Fall Chapter 6
66
Logging Reductions Reduce Logging’s Adverse Effects onOther Commercial Users (Type 2 Demand)
Logging adversely affects other industries that would commercially useforest resources, largely by imposing costs on them through a widespreadnetwork of logging subsidies and environmental externalities. Together,these are called spillover costs.
Figure 6.1 identifies ten categories of spillover costs that were avoidedthrough reductions in logging. Most of the spillover costs shown in Figure 6.1stem from the impacts on streams of logging and related activities, such asroad construction. In general, these activities can alter streams by increasingthe level of sediment, raising the water temperature, and increasingstreamflows during some periods. In addition, they can alter riparianvegetation and the hydrologic structure of stream channels (Brown andBinkley 1994; Jones and Grant 1996; Meehan 1991; Reid 1993). Thesealterations, in turn, can degrade the productivity of fish habitat and reducefish populations (Beschta et al. 1995), which has an adverse impact on therecreational and commercial fishing industries.
Sediment in streams fills stream channels and increases costs totaxpayers, land owners, and water consumers who must pay to remove thesediment. Industries that use sediment-laden water in their industrialprocesses often incur additional costs to maintain their machinery, removethe sediment, or both. As sediment clogs stream channels, the risk offlooding increases for owners of adjacent land, and this risk is increasedfurther whenever logging leads to increases in runoff.
Although there is no study that estimates directly the spillover costsassociated with the lands affected by the reductions in logging in the PNW,there is evidence one can use to estimate the general magnitude of some ofthe costs. Of particular interest are the sediment-related costs. According toa study by the US Department of Agriculture (Ribaudo 1989) ), the off-siteeconomic costs imposed on others by the runoff of sediment in the Pacificstates averages $3.29 per ton of sediment (measured in 1993 dollars). Otherstudies, such as Grant and Wolff (1991) and Weaver and Hagans (1994) haveestimated the impacts of logging and related activities on the amount ofsediment in streams, and found that the impact varies from place to placeand according to the logging techniques that are employed. Based on 30years of data associated with a research forest, though, Grant and Wolffdetermined that clearcutting, alone, can generate an additional one ton, andclearcutting plus roads can generate 3.5 tons per acre per year for about 25years. These numbers indicate that the off-site spillover costs that loggingimposes on others because of sediment-related damage, alone, can be morethan $250 per acre.
With the Northwest Forest Plan, a total of 18.8 million acres are removedfrom logging. All else equal, this land area reduces the potential sediment-related costs imposed on the general economy by $4.7 billion over 25 years.This estimate does not take into account the potential threats logging-induced acceleration of landslides pose to human health. Such landslidesresulted in the death of four people in Oregon in 1996.
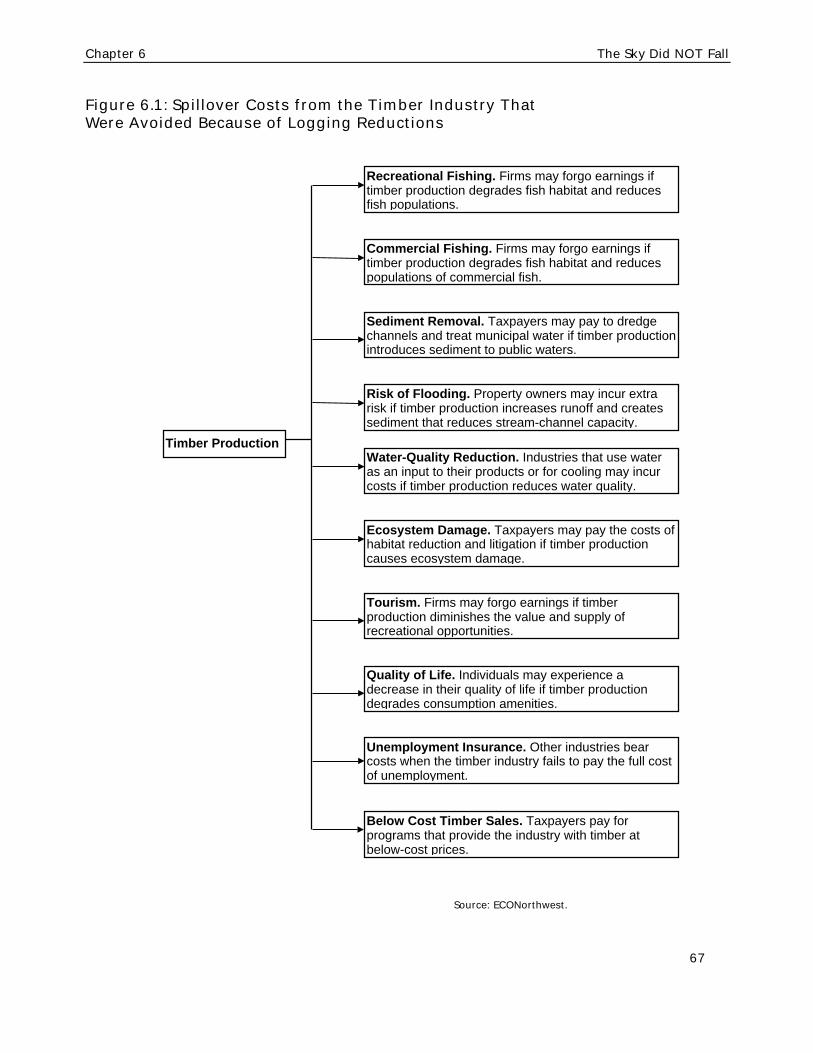
Chapter 6 The Sky Did NOT Fall
67
Figure 6.1: Spillover Costs from the Timber Industry ThatWere Avoided Because of Logging Reductions
Source: ECONorthwest.
Recreational Fishing. Firms may forgo earnings iftimber production degrades fish habitat and reducesfish populations.
Commercial Fishing. Firms may forgo earnings iftimber production degrades fish habitat and reducespopulations of commercial fish.
Sediment Removal. Taxpayers may pay to dredgechannels and treat municipal water if timber productionintroduces sediment to public waters.
Risk of Flooding. Property owners may incur extrarisk if timber production increases runoff and createssediment that reduces stream-channel capacity.
Water-Quality Reduction. Industries that use wateras an input to their products or for cooling may incurcosts if timber production reduces water quality.
Ecosystem Damage. Taxpayers may pay the costs ofhabitat reduction and litigation if timber productioncauses ecosystem damage.
Tourism. Firms may forgo earnings if timberproduction diminishes the value and supply ofrecreational opportunities.
Quality of Life. Individuals may experience adecrease in their quality of life if timber productiondegrades consumption amenities.
Timber Production
Unemployment Insurance. Other industries bearcosts when the timber industry fails to pay the full costof unemployment.
Below Cost Timber Sales. Taxpayers pay forprograms that provide the industry with timber atbelow-cost prices.

The Sky Did NOT Fall Chapter 6
68
The sediment-related costs would be magnified by the costs that arisebecause conventional logging and related practices increase the flow of floodwater from forest lands. From their review of 34 years of data from aresearch forest in the Oregon Cascades Jones and Grant (1996) found thatclearcut areas have higher peak discharges and greater volumes of storm-water runoff than forested areas, and that roads exacerbate these effects.The authors concluded that “Forest harvesting has increased peak discharges[of runoff water] by as much as 50% in [small] basins and 100% in largebasins over the past 50 years.” These effects persisted for 25 years after anarea was logged or roaded. Research to estimate the economic damagesassociated with such increases in runoff has not yet been completed.
Another spillover cost occurs when the timber industry fails to pay thefull costs of labor practices that yield high unemployment for the industry’sworkers. Virtually all employers must pay an annual premium to provideunemployment insurance for their employees. The unemployment-insuranceprogram, in concept, is designed so that, over time, each firm’s premiumswould balance the amount of unemployment-insurance benefits paid to itslaid-off workers. In the past, however, the amount of benefits paid toworkers in the timber industry have exceeded the amount of the industry’spremiums. For example, between 1980 and 1991 the unemployment-insurance benefits paid to workers laid off from Oregon’s lumber-and-wood-products industry exceeded the industry’s total premiums by more than$249 million (measured in 1997 dollars) (Clark 1994). Business owners inother industries, and their workers, bore the burden of making up thisdifference.
One element of logging’s spillover costs that has received a lot ofattention is the direct subsidies the timber industry has received from thefederal government. The Forest Service has never fully accounted for themonetary costs it has incurred to sell timber, let alone the nonmonetarycosts. The Wilderness Society and others have attempted to fill the void andconcluded that the timber-sale program consistently has not covered theagency’s monetary costs (Wilderness Society 1997; Wolf 1994). Wolfestimates that, between 1983 and 1994, the timber-sale programs of 20national forests in eastern Oregon, eastern Washington, and Idahoconsistently failed to yield a positive return to the Treasury. For the periodas a whole, the total appropriations exceeded returns to the Treasury by $1.3billion (measured in 1997 dollars). Businesses, investors, and workersoutside the timber industry bear nearly all the burden of these subsidies.
In sum, by reducing logging on federal lands, the decisions to protectowls, salmon, and other environmental concerns have reduced the logging-related spillover costs that otherwise would have accrued to firms in otherindustries and to workers and households. Firms that otherwise would haveborne these costs presumably increased their investment, hired additionalemployees, and paid owners higher profits. This has boosted the regionaleconomy insofar as the sectors that have benefited from the loggingreductions exhibit a far greater ability, relative to the timber industry, togenerate new jobs and higher incomes.
In sum, byreducing loggingon federal lands,the decisions toprotect owls,salmon, and otherenvironmentalconcerns havereduced thelogging-relatedspillover costs thatotherwise wouldhave accrued tofirms in otherindustries and toworkers andhouseholds.
Chapter 6 The Sky Did NOT Fall
69
Logging Reductions Reduce Logging’s Adverse Effects onLocal Quality of Life (Type 3 Demand)
The quality of life in the Pacific Northwest comprises the variouslocation-specific benefits and costs individuals enjoy or endure by living inthe area. The benefits include access to social, cultural, and environmentalamenities, and the costs include exposure to social, cultural, andenvironmental disamenities. As we describe in Chapter 5, if the net quality-of-life benefits are positive, they are analogous to a second paycheck eachresident receives, supplementing the first paycheck one receives from anemployer or other source of income. The sum of the first and secondpaychecks determines the overall standard of living for the area’s residents.Through its impact on local quality of life, the reduction in logging since1988 has affected the economic welfare of local residents by changing thecurrent and expected future values of the second paycheck.
The change in these values reflects changes in any or all of theenvironmental, social, and cultural aspects of the region’s quality of life. Themost direct effect would occur through the logging-reduction’s impact oncurrent and future residents’ access to the area’s forest amenities. Much ofthis access and use of forest amenities occurs through self-directedrecreation. Although logging can increase some types of recreation, notablymotorized sightseeing and exploring, the FEMAT report concluded that, atleast on the spotted-owl forests, “there is evidence that there is an excesssupply of these more developed, motorized forms of recreation” (ForestEcosystem Management Assessment Team 1993 p. VI-16). FEMAT researchersalso concluded that fishing is one of the highest-valued recreational activitiesin the Pacific Northwest, and that catch rates and angler days have declinedsignificantly from past decades. These declines are partly attributable toforest-management practices that degrade stream habitat (see, e.g., Meehan(1991)).
In short, logging reductions precluded the expansion of road-relatedrecreation opportunities but, because there are so many miles of forest roadsalready, the forgone value was negligible. In contrast, by avoiding adverseimpacts on streams, the logging reductions had a positive impact on high-value fishing recreation.
Insofar as the logging reductions reduced the amount of environmentaldegradation, the federal forests are producing a higher level of forest-resource amenities for residents of the Pacific Northwest than otherwisewould exist. Among the enhanced amenities are these:
♦ The visual aesthetics of riparian areas. In general, the more natural theappearance of these areas, the greater their aesthetic value. Insofar as thelogging reductions maintained the natural appearance, the forests havemaintained their amenity value.
♦ The visual aesthetics of some upland areas that otherwise would haveexperienced timber harvests. The logging reductions allowed these areasto retain their natural appearance.
♦ The aesthetics and water-related recreation associated with streams thatexperience improvements in water quality, including reductions insediment.

The Sky Did NOT Fall Chapter 6
70
♦ The aesthetics and recreational opportunities, e.g., whitewater rafting,associated with changes in the quantity and timing of water runoff sothat less runoff occurs as peak flow in the spring and more occurs asbase flow during the summer.
♦ The visual aesthetics and recreational opportunities associated withincreased populations of wildlife related to riparian areas.
It is important to recognize that the quality-of-life values supplement thebenefits residents and others derive from the actual recreational use of theseamenities. Economic convention ascribes the term, recreational use, tospecific trips made to use specific recreational resources. Usingappropriately labeled “travel-cost” methods, economists measure the valueof such trips by looking at consumers’ willingness to incur costs to travelfrom their homes to recreational sites, e.g., the fishing hole. Implicitly,economists assume that people decide where to live and work independentof the recreational resource. Hence, if one angler travels from her home inLos Angeles to fish for salmon on a river in western Washington, thesetechniques would conclude that she places a greater value on the salmonthan another who travels from his home in Portland because she incursgreater travel costs. Furthermore, they would conclude that a third angler,who has purchased a house on the river and fishes off the back porch, placesvery little value on the salmon because he incurs essentially no travel coststo go fishing.
Clearly, this reasoning overlooks the possibility that the third anglerplaces the greatest value on salmon and has based his residential-locationdecision on a desire to live next to the river. It also overlooks the possibilitythat the second angler also based his residential-location decision at least inpart on a desire to live near the salmon and, on balance chose to live inPortland rather than on the river, or in Los Angeles, or anyplace else. Boththe angler living on the river and the one living in Portland may haveaccepted a reduction in incomes, an increase in housing costs, or both to livecloser to the salmon.
How important are quality-of-life considerations in the Pacific Northwest?Although there is no comprehensive answer to this question, there is somestrong evidence.
Richard Haynes and other economists at the Forest Service (1992)assessed the economic effects of shutting down various recreation, timber,range, and mineral programs on nine national forests in the Snake RiverBasin (Oregon, Washington, and Idaho) to protect critical habitat forendangered sockeye salmon. They found that society valued the forgonerecreational resources 3-to-4 times more than the sum of the forgone timber,grazing, and mining. Haynes and a colleague, Amy Horne, subsequentlycompared the value of logs versus the value of services derived from federallands in the interior Columbia River Basin between the Cascades and Rockies(Haynes and Horne 1997). They found that the services associated withunroaded areas, camping spots, fishing holes, and so forth, provided 89percent of the total value of all commodities and services derived from thoselands in 1995. The value of timber was only 11 percent of the total. Theiranalysis indicated that, by 2045, timber will have decreased to just 5 percentof the total.
[Haynes and Horne(1997)] found thatthe servicesassociated withunroaded areas,camping spots,fishing holes, andso forth, provided89 percent of thetotal value of allcommodities andservices derivedfrom [federal landsin the interiorColumbia RiverBasin].

Chapter 6 The Sky Did NOT Fall
71
Numerous observers, including the Oregon Employment Division (1993),the Oregon Business Council (1993), the Washington Office of ForecastCouncil (1994), and various researchers, e.g., Johnson and Beale (1994), haveconcluded that quality-of-life factors play an important role in localeconomies. In the 1993 survey of in-migrants to Oregon, conducted by theOregon Employment Division, for example, most respondents said theymoved to Oregon not for direct economic reasons, such as to get a better job,but for quality-of-life reasons. A companion sentiment was expressed thesame by Oregonians in a survey conducted by a business group, the OregonBusiness Council. When asked if they thought tighter environmentalprotections would help or hurt the state’s economic outlook, three-quarterssaid it would help.
Without the logging reductions, federal forest resources would have beenused to give a short-run boost to the first paychecks of about 9,300 timberworkers in the PNW (see the discussion in chapter 3). They also would haveboosted the second paychecks for those who prefer the lifestyle associatedwith logging. With the reductions, the resources give a long-run boost to thesecond paychecks of everyone in the region who values living in proximity tounlogged forests. Insofar as this shift affects the locational decisions ofhouseholds, it also affects the size and skills of the region’s workforce, andthe number and diversity of the firms seeking to employ the workers and/orsell goods and services to the region’s households. On average, one shouldexpect that this second-paycheck mechanism favors sectors of the economywith the potential to create jobs and incomes faster than the timber industry.Hence, the net result is that the logging reductions, acting through thismechanism, have stimulated the regional economy.
Logging Reductions Reduce Logging’s Adverse Effects on theForest’s Intrinsic Value (Type 4 Demand)
Much of the rhetoric regarding the intrinsic values affected by loggingreductions on federal lands in the Pacific Northwest focused on preventingthe extinction of spotted owls. In truth, though, much more has been atstake. Economists from the U.S. Fish and Wildlife Service observed that thespotted owl …
“… is only one of several hundred vertebrate species occurring in thePacific Northwest. Among ecosystems in the United States andCanada, the Pacific Northwest has one of the highest numbers of birdspecies, the most bird families, the second highest number ofmammal species, and many endemic or relic amphibian species andmany unique species of birds, mammals, amphibians, arthropods, soilorganisms, plants, and fungi. Redwood and Douglas fir forestsaccumulate more biomass than tropical forests. Most of these speciesare dependent on forested habitats of the Pacific Northwest. Thisspecies richness and abundance of wildlife depends to a large extenton the presence of mature and older forests, and as forests decline insize or are further fragmented, additional species may becomethreatened or endangered. The forests also provide protection to thesoils, particularly on steeper slopes, and maintain higher water qualitywith lower sediment yield. The river systems draining thesewatersheds continued an abundance of salmonid species as well asother instream fauna and flora.”

The Sky Did NOT Fall Chapter 6
72
“Timber harvest followed by slash burning has resulted in a dramaticalteration of the natural system, changing the forest structure,function, and composition. … In an effort to promote maximum forestproduct yield, managed stands are scheduled for harvest every 50 to90 years, preventing the development of older forest characteristicsand maintaining early successional stages. … Managementstrategies designed to provide 50 to 90 year old trees for harvest onpublic lands in the Northwest are not likely to provide the samebenefits to regional biodiversity as would stands managed at longerrotation lengths, nor will they provide the same benefits that are foundin areas protected from clearcut techniques” (Schamberger et al.1992 pp. 71-72, citations deleted).
In short, the ecological stakes in the PNW forests are high. They havebecome even higher since Judge Dwyer’s ruling in 1991, as the region haslearned more about the significance of declining populations of salmon, bulltrout, marbled murrelets, and other species dependent on old-growth forests.
The ecological threats are important economically, and not just inside theregion. Swanson and Loomis (1993) demonstrate that essentially allAmericans place a high value on maintaining the viability of ecosystemsthroughout the country, even ecosystems far removed from their homes.Hagen, Vincent, and Welle (1992) tested this notion by conducting anationwide survey to determine the extent to which Americans will state thatthey are willing to pay money to protect the spotted-owl forests. The resultswere powerful. Respondents indicated they believed the benefits ofprotecting the old-growth, spotted-owl forests would be between 3.5 and14.1 times greater than the costs. This ratio has undoubtedly grown sincethen. When the survey was conducted, timber-industry supporters largelyheld the public-relations stage with their message of certain economiccalamity if decisions to protect spotted owls were sustained. Since then, theregion has demonstrated that the costs of logging reductions are muchsmaller than predicted, and the increasing peril to salmon and other specieshas accentuated the importance of taking actions to prevent ecologicaldeterioration.
ReflectionsMany things have changed in the PNW’s timber industry and regional
economy since the spotted owl flew into the region’s collectiveconsciousness. By the time Judge Dwyer prohibited timber sales on thespotted-owl national forests, the timber industry had nearly completed theshift from an industry with a surfeit of large, old trees enabling it to produceproducts and pay wages superior to those elsewhere, to an industry usingsmall trees, employing far fewer workers at lower wages, and encounteringstrong national and global competition. Despite this shrinkage in economicstature, the industry’s advocates clung to their memories. In their denial ofreality, they believed, often fervently, that the industry would reenter theGolden Age of abundant jobs and high wages, if only the Americanpeople—the owners of federal lands—would ignore the adverse economicand environmental consequences of logging and continue to allow high levelsof logging.
The juxtapositionof the changes inthe timberindustry withthose in theeconomy stronglysuggests that theeconomy nowderives morestrength from thevarious servicesprovided by theregion’s forestthan it derivesfrom logs.

Chapter 6 The Sky Did NOT Fall
73
The change in the regional economy has been no less profound than whatoccurred in the timber industry. Where business leaders and public officialsonce saw the necessity of developing more land and logging more trees toincrease prosperity and maintain interregional competitiveness, they nowspeak of curtailing growth, increasing education, and maintainingenvironmental quality as the keys to competing in a global economy. In 1989,the State of Oregon adopted a strategic plan focused on enhancingeducation, environmental quality, and international connections andaddressing concerns for the timber industry almost as an afterthought (Stateof Oregon 1989). A survey of in-migrants in Washington (Salant et al. 1996)found that more than 2,500 per year are engineers, writers, smallmanufacturers and others who bring their jobs with them and live whereverthey want. These so-called lone eagles—which, together, have economicimpacts equivalent to a new industrial plant with more than 2,500employees—are the most obvious segment of the population that chooses towork and live in the PNW based largely on quality-of-life considerations.
The juxtaposition of the changes in the timber industry with those in theeconomy strongly suggests that the economy now derives more strengthfrom the various services provided by the region’s forests than it derivesfrom logs. Clean water is more important to the region’s economic healththan streams muddied by logging roads, scenic vistas are more importantthan clearcuts, and ecosystem integrity is more important thanfragmentation.
Why Did Logging Reductions in the 1990s Have So Little EconomicImpact, Compared to Those in the Early 1980s?
The timber industry was smaller—it had slashed jobs and wages since 1979.
Instead of exporting logs, the timber industry processed them in PNW mills.
The timber industry increased imports of logs for processing in PNW mills.
The timber industry retooled so it could use the small logs available in the1990s.
The timber industry increased value-added manufacturing of raw material.
The timber industry was a smaller part of the 1990s’ larger, more diversifiedeconomy.
The timber industry could not provide stable communities.
The logging reductions stimulated some non-timber components of theeconomy:
♦ They increased the PNW’s quality-of-life attractions for many workers,business managers, and investors
♦ They reduced the spillover costs the timber industry imposes on businessand households
♦ They reallocated resources to industries that have a greater ability, relative totimber, to generate jobs and incomes

The Sky Did NOT Fall Chapter 6
74
Many remain uncomfortable with the notion that intangible forest-relatedservices are more valuable than tangible logs, however, and believe thesechanges are unique to one region and one point in time. Will other regionsnecessarily prefer logs to forest-related services? Will the Pacific Northwesteventually have to turn its back on logging-reduction decisions of the pastdecade and once again turn to the forests primarily for logs? No, and no. Theexperience of this region’s response to logging reductions is part of largerforces and trends:
♦ States with the best economic performance typically have the highestenvironmental quality (Meyer 1993; Templet 1995).
♦ States with the most stringent actions to protect threatened andendangered species typically have the best economic performance (Meyer1995).
♦ Counties with scenic and other natural-resource amenities typicallyexhibit stronger economic performance, in terms of jobs and incomes,than counties with concentrations of extractive industries, such aslogging, agriculture, and mining (Drabenstott and Smith 1996).
♦ Counties adjacent to wilderness typically exhibit stronger economicperformance, measured in of jobs and incomes, than others (Rudzitis andJohansen 1991; von Reichert and Rudzitis 1992).
♦ A tiny fraction of the workers affected by layoffs involving more than 50manufacturing workers are laid off for environmental reasons (Goodstein1995).
♦ Decisions to promote environmental quality have not created long-rununemployment in the U.S., caused plant shutdowns, or forced U.S. firmsto flee to developing countries with lax environmental regulations(Goodstein forthcoming).
Taken together, the information in this report tells us that the loggingreductions on federal lands in the Pacific Northwest are an integral part of,and not an impediment to, the region’s economic evolution. Althoughjudicial, administrative, and political processes triggered the loggingreductions, the reductions were manifestations of market forces. Thesealternative mechanisms were the only means available to respond to shifts inthe competition for forest resources. As the economic forces underlying therecent logging reductions push forward, they will continue to exert powerful,mounting pressure for additional reductions in the future.
Taken together,the information inthis report tells usthat the loggingreductions onfederal lands inthe PacificNorthwest are anintegral part of,and not animpediment to,the region’seconomicevolution

75
References
Anderson, H.M. and J.T. Olson. 1991. Federal Forests and the EconomicBase of the Pacific Northwest: A Study of Regional Transitions. TheWilderness Society. September.
Arrow, K., R. Solow, E. Leamer, P. Portney, P. Radner, and H. Schuman.1993. “Report of the NOAA Panel on Contingent Valuation.” Federal Register58 (10): 4601-4614.
Baskin, Y. 1997. The Work of Nature: How the Diversity of Life Sustains Us.Washington, D.C.: Island Press.
Baumol, W.J. and W.E. Oates. 1988. The Theory of Environmental Policy,Second Edition. New York: Cambridge University Press.
Beeson, P.E. 1991. “Amenities and Regional Differences in Returns toWorker Characteristics.” Journal of Urban Economics 30 (2): 224-241.
Berger, M.C. and G.C. Blomquist. 1992. “Mobility and Destination inMigration Decisions: The Roles of Earnings, Quality of Life, and HousingPrices.” Journal of Housing Economics 2: 37-59.
Bernton, H. 1996. “Survey Ties Some Slides to Roads, Clear-Cuts.”Portland, OR: The Oregonian, February 24. Page A1, A9.
Bernton, H. 1997. “Lumber Market Reaches New Equilibrium.” Portland:Oregonian, September 8. Page E1.
Beschta, R.L., J.R. Boyle, C.C. Chambers, W.P. Gibson, S.V. Gregory, J.Grizzel, J.C. Hagar, J.L. Li, W.C. McComb, T.W. Parzybok, M.L. Reiter, G.H.Taylor, and J.E. Warila. 1995. Cumulative Effects of Forest Practices in Oregon:Executive Summary. Oregon State University for the Oregon Department ofForestry. March.
Beuter, J.H. 1990. Social and Economic Impacts in Washington, Oregon,and California Associated With the Implementation of the ConservationStrategy for the Northern Spotted Owl: An Overview. Mason, Bruce, andGirard, Inc. July.
Beuter, J.H. 1995. Legacy and Promise: Oregon's Forests and WoodProducts Industry. Oregon Business Council and Oregon Forest ResourcesInstitute. January.
Beuter, J.H. 1998. Legacy and Promise: Oregon's Forests and WoodProducts Industry (Revised and Updated). Oregon Business Council and theOregon Forest Resources Institute.
Beuter, J.H., K.N. Johnson, and H.L. Scheurman. 1976. Timber for Oregon'sTomorrow: An Analysis of Reasonably Possible Occurrences. Oregon StateUniversity, School of Forestry. Research Bulletin 19. January.
The Sky Did NOT Fall References
76
Black, A. and J. Smillie. 1988. A Comparison of Non-Renewable NaturalResource Taxation in Colorado, Montana, North Dakota and Wyoming.Western Organization of Resource Councils. December.
Blomquist, G.C., M.C. Berger, and J.P. Hoehn. 1988. “New Estimates ofQuality of Life in Urban Areas.” American Economic Review 78 (1): 89-107.
Bound, J. and G. Johnson. 1995. “What Are the Causes of Rising WageInequality in the United States.” Economic Policy Review, Federal ReserveBank of New York 1 (1): 9-17.
Brady, P. 1995. Interregional Compensating Differentials and Incentives toMigrate: A Study of Locational Decisions by Young Adults. University ofWisconsin-Madison, Department of Economics. November 8.
Brown, R.J. 1994. “Do Locational Amenities Equalize Utility AcrossStates?” The Journal of Economics XX (1): 25-30.
Brown, T.C. and D. Binkley. 1994. Effect of Management on Water Qualityin North American Forests. U.S. Department of Agriculture, Forest Service,Rocky Mountain Forest and Range Experiment Station. General TechnicalReport. RM-248. June.
Browne, L.E. 1984. “How Different Are Regional Wages? A Second Look.”New England Economic Review (March/April): 40-47.
Carrel, C. 1998. “A Patchwork of Peace Unravels.” High Country News 30(22): 1, 8-12.
Castle, E.N., R.P. Berrens, and R.M. Adams. 1994. “Natural ResourceDamage Assessment: Speculations About a Missing Perspective.” LandEconomics 70 (3): 378-385.
Cicchetti, C.J. and L.L. Wilde. 1992. “Uniqueness, Irreversibility, and theTheory of Nonuse Values.” American Journal of Agricultural EconomicsDecember: 1121-1125.
Clark, M. 1994. Oregon Covered Employment and Payrolls. OregonEmployment Department.
Clinton, W.J. and A. Gore. 1993. “Forest Conference Proceedings.”Presented at The Forest Conference in Portland, OR.
Conway, R.S., G. Pascall, and D.H. Pedersen. 1991. The Forest ProductsEconomic Impact Study. Washington Forest Protection Association. March.
Cook, A.K. 1995. “Increasing Poverty in Timber-Dependent Areas inWestern Washington.” Society and Natural Resources 8: 97-109.
Cooper, J.M.R. 1994. “Migration and Market Wage Risk.” Journal ofRegional Science 34 (4): 563-582.
Council of Economic Advisors. 1994. Chapter 6: Economic Report of thePresident 1997. Washington, D.C.: U.S. Government Printing Office.

References The Sky Did NOT Fall
77
Courant, P.N., E. Niemi, and W.E Whitelaw. 1997. An Analytic Typology forExamining the Economic Effects of Ecosystem Management. University ofMichigan, School of Public Policy.
Courant, P.N., E. Niemi, and W.E. Whitelaw. 1997. The Ecosystem-EconomyRelationship: Insights from Six Forested LTER Sites. A Report to the NationalScience Foundation. Grant No. DEB-9416809. November.
Coursey, D.L., J.L. Hovis, and W.D. Schulze. 1987. “The Disparity BetweenWillingness to Accept and Willingness to Pay Measures of Value.” QuarterlyJournal of Economics : 679-678.
Cromartie, J.B. 1998. “Net Migration in the Great Plains IncreasinglyLinked to Natural Amenities and Suburbanization.” Rural DevelopmentPerspectives 13 (1): 27-34.
Cushing, B.J. 1987. “Location-Specific Amenities, Topography, andPopulation Migration.” The Annals of Regional Science XXI (2): 74-85.
Daily, G.C. 1997. Nature's Services: Societal Dependence on NaturalEcosystem. Washington, D.C.: Island Press.
Drabenstott, M. and T.R. Smith. 1996. The Changing Economy of the RuralHeartland. Federal Reserve Bank of Kansas City. April.
Duffy, N.E. 1994. “The Determinants of State Manufacturing GrowthRates: a Two-Digit-Level Analysis.” Journal of Regional Science 34 (2): 137-162.
Durbin, K. 1996. Tree Huggers: Victory, Defeat & Renewal in theNorthwest Ancient Forest Campaign. Seattle, WA: The Mountaineers.
Dwyer, W. (Federal District Judge). 1991. Seattle Audubon Society, et al. v.John L. Evans and Washington Contract Loggers Association, et al. May 29.
Eberle, W.D. and F.G. Hayden. 1991. “Critique of Contingent Valuationand Travel Cost Methods for Valuing Natural Resources and Ecosystems.”Journal of Economic Issues XXV (September): 649-683.
ECONorthwest. 1996. The Potential Economic Consequences ofDesignating Critical Habitat for the Marbled Murrelet: Final Report. US Fishand Wildlife Service, Portland Field Office. May.
Ehinger, Paul F. & Associates and Robert Flynn & Associates. 1995. ForestProducts Industry Report on Mill Closures, Operations, and Other RelatedInformation. March/April.
Environmental Working Group. 1995. Faking Takings: Farm Subsidies andPrivate Property in Perspective. Environmental Working Group. EWG PolicyMemorandum. February.
Farber, H.S. 1996. The Changing Face of Job Loss in the United States,1981-1993. National Bureau of Economic Research. Working Paper 5596.May.

The Sky Did NOT Fall References
78
Field, B.C. 1997. Environmental Economics, Second Edition Edition. SanFrancisco: McGraw-Hill Company, Inc.
Figlio, D.N. 1996. A Suggestion for an Amenity-Constant Inter-City Cost ofLiving Adjustment. Department of Economics, University of Oregon.February.
Forest Ecosystem Management Assessment Team. 1993. Forest EcosystemManagement: An Ecological, Economic, and Social Assessment. Forest Service,Fish and Wildlife Service, National Marine Fisheries Service, National ParkService, Bureau of Land Management, and Environmental Protection Agency.794-478. July.
Fortmann, K., J. Kusel, and S. Fairfax. 1989. “Community Stability: TheForesters' Fig Leaf.” In Community Stability in Forest-Based Economies. Editedby D. Le Master and J. Beuter. Portland, OR: Timber Press.
Fortmann, L., J. Kusel, Y. Kawamura, M. Olson, and C. Danks. 1991.“Effects of Forest Control and Use on County Well-being.” In Well-being inForest Dependent Communities. Edited by J. Kuse and L. Fortman. Berkeley:Department of Foresty and Resource Management, University of California.
Gabriel, S.A., J.P. Mattey, and W.L. Wascher. 1996. CompensatingDifferentials and Evolution of the Quality-of-Life Among the U.S. States.Federal Reserve Bank of San Francisco. June.
Goodstein, E. 1995. “Jobs and the Environment: The Myth of a NationalTrade-Off.” Challenge (January-February): 41-45.
Goodstein, E. 1995. “Jobs or the Environment? No Trade-Off.” ChallengeJanuary/February: 41-45.
Goodstein, E. 1995. Economics and the Environment. Englewood Cliffs,NJ: Prentice Hall.
Goodstein, E. forthcoming. What Tradeoff? Fictions and Facts About Jobsand the Environment.
Gottlieb, P.D. 1994. “Amenities As an Economic Development Tool: IsThere Enough Evidence?” Economic Development Quarterly 8 (3): 270-285.
Governor's Timber Team. 1993. Year-End Report 1992. Washington State.January.
Grant, G.E. and A.L. Wolff. 1991. “Long-Term Patterns of SedimentTransport After Timber Harvest, Western Cascade Mountains, Oregon, USA.”Presented at Sediment and Stream Water Quality in a Changing Environment:Trends and Explanation in Vienna. IAHS. 203.
Greber, B.J. 1991. Technological Change in the Timber Industries in thePacific Northwest: Historic Background and Future Implications. Oregon StateUniversity.
Greenwood, M.J., G.L. Hunt, D.S. Rickman, and G.I. Treyz. 1991.“Migration, Regional Equilibrium, and the Estimation of CompensatingDifferentials.” The American Economic Review 81 (5): 1382-1390.

References The Sky Did NOT Fall
79
Greenwood, M.J., G.L. Hunt, D.S. Rickman, and G.I. Treyz. Estimates of theDeterminants of Location Based on Interstate Migration Flows from 1970-1987. University of Colorado at Boulder, Regional Economic Models, Inc., andUniversity of Massachusetts.
Gregory, R., S. Lichtenstein, T.C. Brown, G.L. Peterson, and P. Slovic. 1995.“How Precise Are Monetary Representations of EnvironmentalImprovements?” Land Economics 71 (4): 462-73.
Hagen, D.A. 1992. “Benefits of Preserving Old-Growth Forests and theSpotted Owl.” Western Economic Association International X (April): 13-26.
Hamilton, T., J. Zimmer, P. Stanbro, M. Berg, D. Darr, B. Levere, R. Haynes,B. Lange, M. Skinner, D. Eagleston, and B. Biesterfeldt. 1990. The EconomicEffects of Implementing A Conservation Strategy for the Northern SpottedOwl: Report of the Interagency Economic Effects Team. Interagency ScientificCommittee.
Haynes, R.W. 1986. Inventory and Value of Old-Growth in the Douglas-FirRegion. U.S. Department of Agriculture, Forest Service, Pacific NorthwestResearch Station. Research note. PNW-437. January.
Haynes, R.W. 1991. Rebuttal Testimony of Richard W. Haynes, EndangeredSpecies Committee, U.S. Department of the Interior, Office of Hearings andAppeals, In the Matter of the Bureau of Land Management's Request forExemption.
Haynes, R.W. 1991. Testimony before the Endangered Species Committee,U.S. Department of the Interior, Office of Hearings and Appeals, in the Matterof Bureau of Land Management Request for Exemption under the EndangeredSpecies Act for 44 FY 1991 Timber Sales. 26 December.
Haynes, R.W. and A.L. Horne. 1997. “Chapter 6: Economic Assessment ofthe Basin.” In An Assessment of Ecosystem Components in the InteriorColumbia Basin and Portions of the Klamath and Great Basins, Volume IV.Edited by T.M. Quigley and S.J. Arbelbide. General Technical Report PNW-GTR-405. Portland, OR: U.S. Department of Agriculture, Forest Service, PacificNorthwest Research Station. June. Pgs. 1715-1869.
Haynes, R.W., N.A. Bolon, and D.T. Hormachea. 1992. The EconomicImpact on the Forest Sector of Critical Habitat Delineation for Salmon in theColumbia and Snake River Basin. U.S. Department of Agriculture, ForestService, Pacific Northwest Research Station. General Technical Report. PNW-GTR-307. November.
Heberlein, T.A. 1994. Social Trends and Forest Dependent Communities:Some Reflections on the Pacific Northwest (Preliminary Draft). Presented atthe Annual Meeting of the Rural Sociological Society in Portland, Oregon,August 11-14.
Herzog, H.W. and A.M. Schlottmann. 1995. “Worker Displacement andJob-Search: A Regional Analysis of Structural Impediments toReemployment.” Journal of Regional Science Vol. 35 (NO. 4): pp. 553-577.
Hibbard, M. and J. Elias. 1993. “The Failure of Sustained-Yield Forestryand the Decline of the Flannel-shirt Frontier.” In Forgotten Places: Uneven

The Sky Did NOT Fall References
80
Development in Rural America. Edited by T.A. Lyson and W.W. Falk.Lawrence, Kansas: University Press of Kansas. Pgs. 195-217.
Institute for Forest Resources. 1990. Three-State Impact of Spotted OwlConservation and Other Timber Harvest Reductions: A Cooperative Evaluationof the Economic and Social Impacts. University of Washington, University ofCalifornia, Oregon State University. September.
Jacobson, L.S., R.J. LaLonde, and D.G. Sullivan. 1993. “Earnings Losses ofDisplaced Workers.” The American Economic Review 83 (4): 685-709.
Johnson, K.M. and C.L. Beale. 1994. “The Recent Revival of WidespreadPopulation Growth in Nonmetropolitan Areas of the United States.” RuralSociology 69 (4): 655-667.
Johnson, K.N., J.F. Franklin, J.W. Thomas, and J. Gordon. 1991.Alternatives for Managment of Late-Successional Forests of the PacificNorthwest. Report to the U.S. House of Represenatives by The Scientific Panelon Late Successional Forest Ecosystems.
Jones, J.A. and G.E. Grant. 1996. “Peak Flow Responses to Clearcuttingand Roads in Small and Large Basins, Western Cascades, Oregon.” WaterResources Research 32 (4): 959-974.
Judd, D. 1995. Personal communication. Director of the Washington StateGovernor's Rural Assistance Team. March 28.
Knapp, T.A. and P.E. Graves. 1989. “On the Role of Amenities in Models ofMigration and Regional Development.” Journal of Regional Science 29 (1): 71-87.
Lee, R.G. 1990. Social and Cultural Implications of Implementing "AConservation Strategy for the Northern Spotted Owl". College of ForestResources, University of Washington. June.
Lettman, G.J. and D. Campbell. 1997. Timber Harvesting Practices onPrivate Forest Land in Western Oregon. Oregon Department of Forestry. May.
Maki, W. R. no date. Economic and Social Impacts of Preserving AncientForests in the Pacific Northwest. University of Minnesota.
Mathur, V.K. 1993. “The Role of Amenities in a General Equilibrium Modelof Regional Migration and Growth.” Southern Economic Journal 59 (3January): 394-409.
Mead, W.J., D.D. Muraoka, M. Schnlepp, and R.B. Watson. 1990. TheEconomic Consequences of Preserving Old Growth Timber for Spotted Owls inOregon and Washington. Community and Organization Research Institute,University of California. October.
Meehan, W.R., ed. 1991. Influences of Forest and Rangeland Managementon Salmonid Fishes and Their Habitats. American Fisheries Society SpecialPublication 19.

References The Sky Did NOT Fall
81
Mendelsohn, R., W.D. Nordhaus, and D. Shaw. 1994. “The Impact ofGlobal Warming on Agriculture: A Ricardian Analysis.” The AmericanEconomic Review 84 (4): 753-771.
Meyer, B.D. and D.T. Rosenbaum. 1996. Repeat Use of UnemploymentInsurance. National Bureau of Economic Research, Inc. NBER Working PaperSeries. Working Paper 5423. January.
Meyer, S.M. 1992. Environmentalism and Economic Prosperity: Testing theEnvironmental Impact Hypothesis. Massachusetts Institute of Technology,Department of Political Science. October.
Meyer, S.M. 1993. Environmentalism and Economic Prosperity: An Update.Massachusetts Institute of Technology, Department of Political Science.February.
Meyer, S.M. 1995. Endangered Species Listings and State EconomicPerformance. Massachusetts Institute of Technology. Working Paper. 4.March 1995.
Mueser, P.R. and P.E. Graves. 1995. “Examining the Role of EconomicOpportunity and Amenities in Explaining Population Redistribution.” Journalof Urban Economics 37: 176-200.
Murray, B.C. and D.N. Wear. 1998. “Federal Timber Restrictions andInterregional Arbitrage in U.S. Lumber.” Land Economics 74 (1): 76-91.
Nauth, Z. 1992. The Great Louisiana Tax Giveaway. Louisiana Coalitionfor Tax Justice, Louisiana Coalition, Inc.
Niemi, E. and E. Whitelaw. 1994. “The Potential Social and EconomicImpacts of Long-Rotation Timber Management.” Presented at High QualityForestry Workshop: The Idea of Long Rotations in Silver Falls State Park,Oregon. College of Forest Resources AR-10, University of Washington.
Niemi, E. and E. Whitelaw. 1995. The Full Economic Costs of ProposedLogging on Federal Lands (Preliminary Report). ECONorthwest. March.
Offutt, S. and R. Shoemaker. 1990. “Agricultural Land, Technology, andFarm Policy.” Journal of Agricultural Economics 41 (1).
Olson, D. 1990. Economic Impacts of the ISC Northern Spotted OwlConservation Strategy for Washington, Oregon, and Northern California.University of Minnesota. June, 20.
Oregon Business Council. 1993. Oregon Values and Beliefs: Summary.May.
Oregon Rivers Council. 1991. The Case for Protecting Riverine Habitat: APreliminary Analysis of the Economic Impact of Northwest Salmonid Fisheries.Draft.
O'Toole, R. 1988. Reforming the Forest Service. Washington, D.C.: IslandPress.

The Sky Did NOT Fall References
82
Postel, S. and S. Carpenter. 1997. “Freshwater Ecosystem Services.” InNature's Services: Societal Dependence on Natural Ecosystems. Edited by G.C.Daily. Washington, D.C.: Island Press. Pgs. 195-214.
Power, T.M. 1996. Lost Landscapes and Failed Economies: The Search for aValue of Place. Washington, D.C.: Island Press.
Power, T.M. et al. 1995. Economic Well-Being and Environmental Protectionin the Pacific Northwest. Economics Department, University of Montana.December.
Quigley, T.M. and S.J. Arbelbide. 1997. An Assessment of EcosystemComponents in the Interior Columbia Basin and Portions of the Klamath andGreat Basins: Volume I. U.S. Department of Agriculture, Forest Service, PacificNorthwest Research Station. General Technical Report. PNW-GTR-405. June.
Quigley, T.M., R.W. Haynes, and R.T. Graham. 1996. Integrated ScientificAssessment for Ecosystem Management in the Interior Columbia Basin andPortions of the Klamath and Great Basins. U.S. Department of Agriculture,Forest Service, Pacific Northwest Research Station. PNW-GTR-382.September.
Reid, L.M. 1993. Research and Cumulative Watershed Effects. U.S.Department of Agriculture, Forest Service, Pacific Southwest ResearchStation. General Technical Report. PSW-GTR-141.
Ribaudo, M.C. 1989. Water Quality Benefits from the Conservation ReserveProgram. U.S. Department of Agriculture, Economic Research Service.Agricultural Economic Report. 606. February.
Roback, J. 1982. “Wages, Rents, and the Quality of Life.” Journal ofPolitical Economy 90 (6): 1257-1278.
Roback, J. 1988. “Wages, Rents, and Amenities: Differences AmongWorkers and Regions.” Economic Inquiry 26: 23-41.
Rosen, S. 1979. “Wage-Based Indexes of Urban Quality of Life.” In CurrentIssues in Urban Economics. Edited by Peter Mieszkowski and MahlonStraszheim. Baltimore and London: John Hopkins Press. Pgs. 74-103.
Rudzitis, G. and H. Johansen. 1991. “How Important is Wilderness?Results from a United States Survey.” Environmental Management 15 (2):227-233.
Rufolo, A.M. and J.G. Strathman. 1990. “Secondary Wood Processing inthe Pacific Northwest: Defining the Economic Development Issues.” Presentedat Pacific Northwest Regional Economic Conference in Bellingham,Washington.
Ruhm, C.J. 1991. “Are Workers Permanently Scarred by JobDisplacements?” American Economic Review March: 319-324.
Salant, P., L.R. Carley, and D.A. Dillman. 1996. Estimating the Contributionof Lone Eagles to Metro and Nonmetro In-Migration. Social & EconomicSciences Research Center, Washington State University. Technical report. #96-19. June.

References The Sky Did NOT Fall
83
Schallau, C. 1994. The Contribution of the Forest Products Industry toRural Economies of the Southern Appalachian Region. Forest ResourcesGroup, American Forest & Paper Association. Technical Bulletin No. 94-4.June 22.
Schallau, C., W. Maki, and J. Beuter. 1969. “Economic Impact Projectionsfor Alternative Levels of Timber Production in the Douglas-Fir Region.”Annals of Regional Science 3 (1): 96-106.
Schamberger, M.L., J.J. Charbonneau, M.J. Hay, and R.L. Johnson. 1992.Economic Analysis of Critical Habitat Designation Effects for the NorthernSpotted Owl. U.S. Fish and Wildlife Service. 619-548/41381. January.
Seppanen, L. and G. Bodeutsch. no date. Outcomes and Impacts from theFirst Two Years of the Timber Retraining Benefits (TRB) Program. WashingtonState Employment Security Department.
Sessions, J., J. Beuter, B. Greber, K.N. Johnson, and G. Lettman. 1990.Timber for Oregon's Tomorrow: The 1989 Update. Forest Research Lab,College of Forestry, Oregon State University. May.
Sherwood-Call, C. 1994. The 1980s Divergence in Per Capita PersonalIncomes: What Does It Tell Us? Federal Reserve Bank of San Francisco. August15.
State of Oregon, Department of Forestry. various years. Annual Reports.Oregon Department of Forestry.
State of Oregon, Economic Development Department. 1989. OregonShines: An Economic Strategy for the Pacific Century. May.
State of Oregon, Employment Department. 1993. Oregon In-MigrationSurvey.
State of Oregon, Employment Department. various years. Oregon CoveredEmployment & Payrolls. Oregon Employment Department.
State of Washington, Department of Natural Resources. various years.Washington Timber Harvest. Department of Natural Resources, ResourcePlanning and Asset Management Division.
State of Washington, Employment Security. various years. Employmentand Payrolls in Washington State by County and Industry. Washington StateEmployment Security.
State of Washington. 1994. “Recent Migration Trends in WashingtonState.” Economic and Revenue Forecast XVII (2): 53-66.
Stevens, T.H., J. Echeverria, R.J. Glass, T. Hager, and T.A. More. 1991.“Measuring the Existence Value of Wildlife: What do CVM Estimates ReallyShow?” Land Economics 67 (4): 390-400.
Stewart, W.C. 1993. Predicting Employment Impacts of Changing ForestManagement in California. Strategic and Resources Planning Program,California Department of Forestry and Fire Prevention.

The Sky Did NOT Fall References
84
Swanson, C. and J. Loomis. 1993. Role of Nonmarket Economic Values inBenefit-Cost Analysis of Public Forest Management Options. Paper preparedfor the Forest Ecosystem Management Team.
Templet, P.H. 1995. “The Positive Relationship of Jobs, Environment andEconomy: An Empirical Analysis.” Presented at The Council of StateGovernments, "Jobs for a Healthy Environment/Economy" in Seattle,Washington. Louisiana State University Institute for Environmental Studies.
Templet, P.H. 1995. “The Positive Relationship Between Jobs,Environment and the Economy: An Empirical Analysis and Review.” Spectrum(Spring): 37-49.
Thomas, J.W., E.D. Forsman, J.B. Lint, E.C. Meslow, B.R. Noon, and J.Verner. 1990. A Conservation Strategy for the Northern Spotted Owl: A Reportof the Interagency Scientific Committee to Address the Conservation of theNorthern Spotted Owl. U.S. Department of Agriculture, Forest Service; U.S.Department of Interior, Bureau of Land Management; Fish and WildlifeService, National Park Service.
Thomas, J.W., M.G. Raphael, R.G. Anthony, E.D. Forsman, A.G. Gunderson,R.S. Holthausen, B.G. Marcot, G.H. Reeves, J.R. Sedell, and D.M. Solis. 1993.Viability Assessments and Management Considerations for Species Associatedwith Late-Successional and Old-Growth Forests of the Pacific Northwest. U.S.Department of Agriculture, National Forest System, Forest Service Research.March.
Tietenberg, T. 1996. Environmental and Natural Resource Economics,Third Edition. New York: HarperCollins.
Tuchman, E.T., K.P. Connaughton, L.E. Freedman, and C.B. Moriwaki.1996. The Northwest Forest Plan: A Report to the President and Congress. U.S.Department of Agriculture, Forest Service, Pacific Northwest ResearchStation. December.
U.S. Department of Agriculture, Forest Service and Bureau of LandManagement U.S. Department of the Interior. 1994. Final SupplementalEnvironmental Impact Statement on Management of Habitat for Late-Successional and Old-Growth Forest Related Species Within the Range of theNorthern Spotted Owl. Volume 1. February.
U.S. Department of Agriculture, Forest Service and U.S. Department of theInterior Bureau of Land Management. 1990. Economic Effects of Implementinga Conservation Strategy for the Northern Spotted Owl. May.
U.S. Department of Agriculture, Forest Service. 1994. Record of Decisionfor Amendments to Forest Service and Bureau of Land Management PlanningDocuments Within the Range of the Northern Spotted Owl: Standards andGuidelines for Management of Habitat for Late-Successional and Old-GrowthForest Related Species Within the Range of the Northern Spotted Owl. April.
U.S. Department of Agriculture. 1988. Final Supplement to theEnvironmental Impact Statement for an Amendment to the Pacific NorthwestRegional Guide, Volume 1, Spotted Owl Guidelines. Pacific Northwest RegionalOffice.

References The Sky Did NOT Fall
85
U.S. Department of Commerce, Bureau of the Census. various years.Statistical Abstract of the United States. Washington, D.C.:
U.S. Department of Commerce, Economics and Statistics Administration,Bureau of Economic Analysis. 1998. Regional Economic Information System1969-1996 (on CD-ROM). RCN-0191. May.
U.S. Department of Labor, Bureau of Labor Statistics. 1993. DisplacedWorkers, 1987-1991. Bulletin 2427. July.
U.S. House of Representatives. 1994. Taking from the Taxpayer: PublicSubsidies for Natural Resource Development. Subcommittee on Oversight andInvestigations of the Committee on Natural Resources. Majority Staff Report.August.
von Reichert, C. and G. Rudzitis. 1992. “Multinomial Logistical ModelsExplaining Income Changes of Migrants to High-Amenity Counties.” TheReview of Regional Studies 22 (1): 25-42.
Warren, D.D. various years. Production, Prices, Employment, and Trade inNorthwest Forest Industries. U.S. Department of Agriculture, Forest Service,Pacific Northwest Research Station.
Waters, E.C., D.W. Holland, and B.A. Weber. no date. Interregional Effectsof Reduced Timber Harvest: The Impact of the Northern Spotted Owl Listing inRural and Urban Oregon. Oregon Agricultural Experiment Station.
Weaver, W. and D. Hagans. 1994. “The Challenge of Protecting andRestoring Klamath River Watersheds from Sediment-Related Impacts.”Presented at Klamath Basin Fisheries Symposium in Eureka, CA. CaliforniaCooperative Fishery Research Unit, Humboldt State University.
Whitelaw, W.E. 1992. Testimony of W. Ed Whitelaw on Behalf of FWS in theMatter of Bureau of Land Management's Request for Exemption under theEndangered Species Act for 44 FY 1991 Timber Sales. Endangered SpeciesCommittee, U.S. Department of the Interior, Office of Hearings and Appeals.
Whitelaw, W.E. 1995. “Dubious Theory about Economy Leads us Astray.”The Register-Guard: May 28.
Whitelaw, W.E. and E. Niemi. 1989. “Money: The Greening of theEconomy.” Old Oregon 68 (3): 26-27.
Widenor, M.R. 1991. “Pattern Bargaining in the Pacific Northwest Lumberand Sawmill Industry: 1980-1989.” In Labor in a Global Economy: Perspectivesfrom the U.S. and Canada. Edited by S. Hecker and M. Hallock. Eugene,Oregon: Labor Education and Research Center, University of Oregon. Pgs.252-262.
Widenor, M.R. 1995. “Diverging Patterns: Labor in the Pacific NorthwestWood Products Industry.” Industrial Relations 34 (3): 441-463.
Wilderness Society. 1997. Financial Losses from Logging on NationalForests, FY 1995: Preliminary Summary. The Wilderness Society. January.

The Sky Did NOT Fall References
86
Wolf, R.E. 1994. Receipt Outlay Analysis of U.S. Forest Service Timber SalesProgram, 1983-1994.
Wondolleck, J.M. 1988. Public Lands Conflict and Resolution: ManagingNational Forest Disputes. Environmental Planning and Policy. Edited by L.Susskind. New York: Plenum Press.
Yaffe, S.L. 1994. The Wisdom of the Spotted Owl: Policy Lessons for a NewCentury. Covelo, California: Island Press.