the smarter scae equation - mckinsey on healthcarethe smarter scale equation however, the argument...
TRANSCRIPT
1
longer applies. This is not to say that M&A
should be avoided—it will still be the right
answer in many situations. However, a smart
er, more sophisticated scale equation should
be used today to evaluate potential value
creation. Before health system leaders rush
to pursue deals, they should outline what they
hope to achieve through scale and carefully
weigh the risks and benefits of various strate
gies. In particular, they should take care to
avoid overestimating the potential value
creation that can be gained through M&A and
underestimating the investments (in funding,
leadership bandwidth, other resources, etc.)
that will be required to realize value. In addition,
they should expand their thinking to consider
strategies other than M&A that might enable
them to achieve their scale goals, because
some of those strategies could entail less over
all risk and require less investment than M&A.
The resurgence in hospital M&A
The US hospital industry bears all the hall
marks of a sector in which scale should drive
performance. Inherent scale advantages are
usually present when a sector is fragmented
and has heavy capital requirements, over
capacity in many markets, differences in
execution ability that drive highly variable
operating performance, and major differences
in balance sheet health (rich, deep pockets
During times of upheaval (regulatory, econo mic,
or both), a kneejerk reaction in many industries
is to pursue mergers and acquisitions (M&A) in
hope of achieving economies of scale through
asset consolidation. His torically, the hospital
industry has been no different. In 2011 alone,
US health systems completed 90 deals involving
more than 150 facilities; the total transaction
value exceeded $8 billion (in comparison, there
were 52 deals involving 80 facilities in 2009).1
The consoli dation appears to signal providers’
quest to achieve scale benefits, especially in
the context of a recent decrease in their ability
to drive pricing—the lever the industry has
used for most of its growth in the past decade.
During that time, providers were able to realize
value primarily through increased contracting
leverage with payors. Today, this leverage is
disappearing, in part because the Federal
Trade Commission is scrutinizing deals more
frequently and closely, and blocking some
on the basis of their potential impact on price.
Now that their ability to create “quickwin”
value through M&A deals is limited, providers
must find and exploit other economies to
create value through those deals. The other
economies may require greater upfront
investment, however.
Thus, we believe that the current wave of
M&A is fundamentally different from prior ones
because the “traditional scale equation” no
The smarter scale equation
Given today’s realities, health systems must look beyond the traditional economies of scale if they want to reap the full benefits of M&A. They must consider other economies that M&A can offer, commit themselves fully to the effort, and execute flawlessly.
Rupal Malani, MD; Anna Sherwood; and Saumya Sutaria, MD
1 Health Care Services Acquisition Report, 17th edition. Norwalk, CT: Irving Levin Publishers; 2012.
2 The post-reform health system: Meeting the challenges ahead May 2013
population covered by ESI decreased to 58.3
percent in 2011, falling for the eleventh year in
a row (from 69.2 percent in 2000).3 ESI erosion
is forcing consumers to shoulder an increasing
portion of each healthcare dollar, which is lead
ing to greater price sensitivity and, often, to
lower provider volumes.
However, the mix of patients hospitals see is also
likely to shift away from the uninsured and those
with ESI toward those with individual insurance,
Medicaid, or Medicare.4 We believe that this
shift will, in the aggregate, put downward pres
sure on hospital margins; by our estimate, the
shift could negatively affect hospital EBITDA
by $15 billion to $25 billion annually by 2019.2
The pressures just described arose following
years of strong commercial pricing growth
for hospitals, which allowed many health sys
tems to put minimal emphasis on operating
cost discipline. Many providers were therefore
unprepared for the downturn and became
M&A targets. Smaller systems and community
hospitals, for example, often found that their
financial positions became untenable—they
lacked a strong balance sheet, treated a dis
proportionate share of governmentsubsidized
or uninsured patients, and were unable to
crosssubsidize with higherpaying commercial
volumes or a broader portfolio of care facilities.
Similarly, many notforprofit hospitals found
themselves in untenable financial positions
because of their dependence on endowments
and philanthropy, both of which were adversely
affected by the downtown.
The traditional argument for M&A
M&A and the scale economies it can bring
have often been viewed as a panacea for rising
may be found down the street from institu
tions on the brink of bankruptcy).
Under these conditions, financial or regulatory
disruptions in any sector often lead to industry
consolidation; this is particularly true when an
economic downturn and regulatory changes
collide. In the European banking industry, for
example, M&A activity has increased recently
as governments have sought to divest equity
stakes acquired in bailouts, banks have tried
to raise additional capital in response to regu
latory changes, and distressed assets have
become available at attractive prices.
The US hospital industry has proved to be no
exception. The past 25 years have seen sev
eral spikes in M&A activity following periods
of economic downturn, regulatory changes,
or both. In recent years, hospital M&A re
surged as the recession, healthcare reform,
and other trends (including population aging)
converged to place multiple financial pres
sures on US hospitals. For example, popula
tion aging has been causing Medicare ranks
to swell, and the elderly’s higher utilization
rates are signi ficantly altering the mix of pa
tients and having a disproportionate impact
on hospital economics. Planned cuts in Medi
care growth rates and proposed cuts in Med
icaid growth rates are likely to intensify pres
sure on provider economics, requiring them
to become more efficient and productive.
Our research suggests that, on average, US
hospitals that do not improve their operating
cost structure could face an average EBITDA
loss of more than $1,500 to $1,600 per Medi
care admission by 2019.2
In addition, the recession expedited the ongo
ing erosion in employersponsored insurance
(ESI) coverage. The share of the under65
2 McKinsey Provider Reform Impact and Stress-test Model, Center for US Health Reform.
3 Gould E. Employer-sponsored health insurance continues to decline in a new decade. Eco-nomic Policy Institute Briefing Paper No. 353. December 5, 2012.
4 For a closer look at how health-care reform should affect pa-tient volumes, see “The impact of coverage shifts on hospital utilization” on p. 73.

3The smarter scale equation
However, the argument for hospital M&A has
focused primarily on the value that can be
captured through traditional scale levers, such
as additional pricing leverage, better access
to capital, and classic cost economies. Histori
cally, this rationale for asset consolidation held
up well. A report by the Robert Wood Johnson
Foundation, for example, found that during
the consolidation wave of the 1990s, hospital
mergers raised inpatient prices by at least
5 percent and by up to 40 percent when the
merging hospitals were closely located.6
Updating the traditional M&A scale equation
The emphasis on using asset consolidation
to achieve the benefits of scale—which we
call the traditional scale equation—ignores
an important reality: M&A is fraught with
valuecreation challenges. A McKinsey analy
sis of healthcare M&A transactions (including
pharmaceutical and medical device companies)
shows that the deals created just 7percent
economic pressures. Indeed, evidence
suggests that scale does influence a health
system’s operating margins (Exhibit 1).
Once the recession began, a number of in
dustry observers, analysts, and banks (includ
ing Moody’s Investors Service, HealthLeaders
Media, Noblis Center for Health Innovation,
JP Morgan, and BMO Capital Markets)
predicted that hospital M&A activity would
increase. Several of them advocated the ben
efits of asset consolidation to capture scale
economies. Moody’s, for example, described
scale as an important driver of financial
success; it said that health systems earning
more than $3 billion in annual revenues expe
rience fewer ratings downgrades than smaller
systems do—and more than three times fewer
downgrades than systems with less than $500
million in annual revenues receive (Exhibit 2).5
Moody’s also noted that the average cost of
debt is consistently lower for systems with
over $5 billion in revenues than for systems
with under $1 billion in revenues.
EXHIBIT 1 Operating margin by health system scale1
> $5 billion$3 billion – $5 billion$1 billion – $3 billion< $1 billion
3.8
2.83.0
2.0
Annual revenues (%, 2010)
Since 2004, the operating margin differential for > $5B systems vs. < $1B systems has been ~2% points
The post-reform health system: Meeting the challenges ahead — April 2013
Health System Scale
Exhibit 1 of 9
1Historical data based on ~245 reporting systems; comparative data from Citi Growth Study. Health system data reflects the average for that category of revenues. Source: Citi Healthcare Investment Banking Group presentation to the Healthcare Financial Management Association (January 19, 2012)
5 Moody’s Investors Service, as cited in a Citi Healthcare Investment Banking Group presentation to the Center for Corporate Innovation (November 30, 2010).
6 Vogt WB, Town R. How has hospital consolidation affected the price and quality of care? Robert Wood Johnson Foun-dation, Research Synthesis Report No. 9. 2006.

4 The post-reform health system: Meeting the challenges ahead May 2013
Analysis of the recent provider M&A environ
ment confirms that acquisitions require
substantial upfront investment. Transaction
values have averaged 0.76 times revenues in
recent years; EBITDA multiples have averaged
9.5.8 On a perbed basis, transaction values
have averaged almost $450,000.
Furthermore, given today’s environment, pro
viders face two other significant challenges if
they pursue M&A on the basis of the traditional
scale equation. First, many of the traditional
scale levers, especially pricing and referral vol
ume, are unlikely to continue to serve as strong
sources of value creation. Greater consumer
average added value globally over the past 15
years. In addition, the acquirer may have over
paid in about 60 percent of healthcare deals.7
The challenges to value creation are many.
In any industry, pursuing M&A activity can
consume the lion’s share of management
attention—not only during the transaction
phase but also during the integration planning
and implementation phases. Pursuing M&A
activity also guarantees certain types of value
destruction, as illustrated in Exhibit 3. In our
experience, health systems often underesti
mate the cost of both pursuing an acquisition
and managing the postmerger integration.
EXHIBIT 2 Ratings agencies agree that scale is an important determinant of success
Number of health systems1 Average cost of debt2 (%)
The post-reform health system: Meeting the challenges ahead — April 2013
Health System Scale
Exhibit 2 of 9
Downgrades Upgrades Affirmations Top quartile < $1 billion Otherintegrated
Original (2003)>$5 billion group
Ratio of downgrades to upgrades (FY 2009 – 3Q 2010)
2001 ‘02 ‘03 ‘04 ‘05 ‘06 ‘07 ‘08 20090.75:1 1:1 0.8:1 2.7:1
1In the event of an upgrade/downgrade rating action and affirmation rating action within the same year, Moody’s accounted for the rating action as an upgrade/downgrade.2 Historical data based on ~245 reporting systems; comparative data from Citi Growth Study. Health system data reflects the average for that category of revenues. Source: Moody’s Investors Service; Citi Healthcare Investment Banking Group presentation to the Center for Corporate Innovation (November 30, 2010)
> $3billion
$1 billion to $3 billion
$500 millionto $1 billion
< $500million
198
57
84
1512
63
131322
43
21
5.5
5.0
4.5
4.0
3.5
3.0
7 McKinsey M&A Transaction Practice. Deal value added is defined as the combined (acquirer and target) change in market capitalization, ad-justed for market movements, from two days before to two days after the deal’s announce-ment, as a percentage of the transaction’s value.
8 Health Care Services Acquisition Report, 17th edition. Norwalk, CT: Irving Levin Publishers; 2012.
5The smarter scale equation
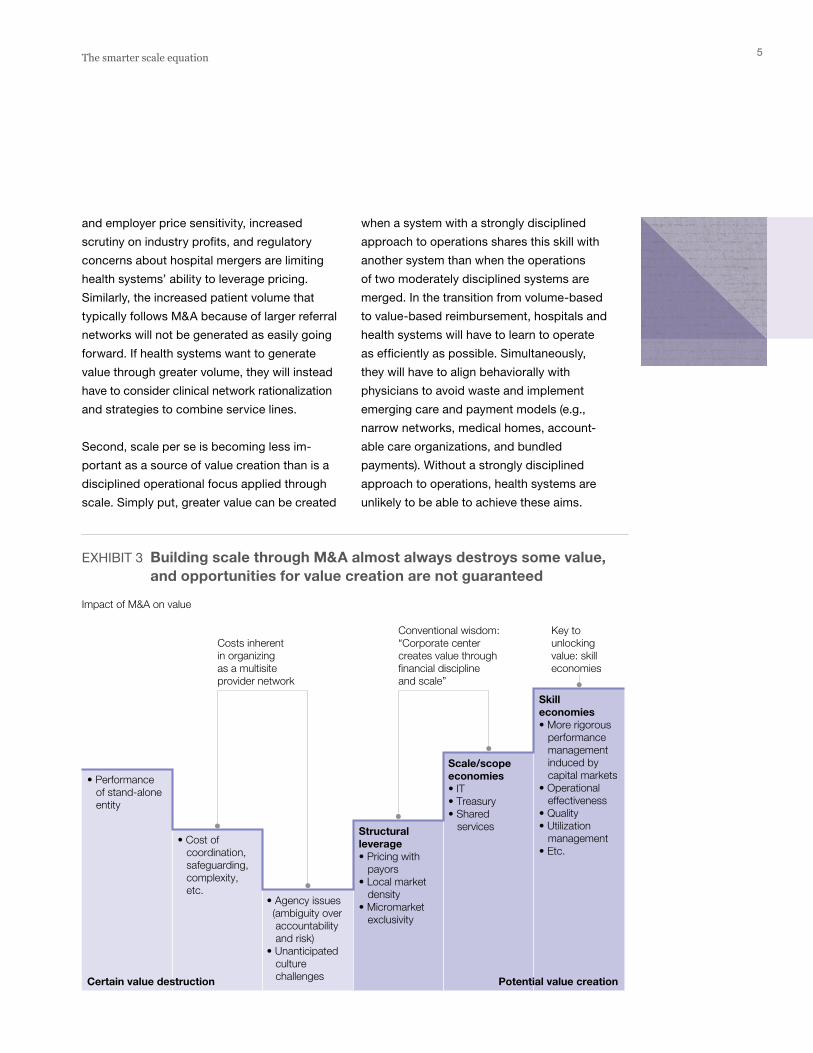
when a system with a strongly disciplined
approach to operations shares this skill with
another system than when the operations
of two moderately disciplined systems are
merged. In the transition from volumebased
to valuebased reimbursement, hospitals and
health systems will have to learn to operate
as efficiently as possible. Simultaneously,
they will have to align behaviorally with
physicians to avoid waste and implement
emerging care and payment models (e.g.,
narrow networks, medical homes, account
able care organi zations, and bundled
payments). Without a strongly disciplined
approach to operations, health systems are
unlikely to be able to achieve these aims.
and employer price sensitivity, increased
scrutiny on industry profits, and regulatory
concerns about hospital mergers are limiting
health systems’ ability to leverage pricing.
Similarly, the increased patient volume that
typically follows M&A because of larger referral
networks will not be generated as easily going
forward. If health systems want to generate
value through greater volume, they will instead
have to consider clinical network rationalization
and strategies to combine service lines.
Second, scale per se is becoming less im
portant as a source of value creation than is a
dis ciplined operational focus applied through
scale. Simply put, greater value can be created
EXHIBIT 3 Building scale through M&A almost always destroys some value, and opportunities for value creation are not guaranteed
Impact of M&A on value
Conventional wisdom:“Corporate center creates value through financial discipline and scale”
Key to unlockingvalue: skilleconomies
Costs inherent in organizing as a multisite provider network
The post-reform health system: Meeting the challenges ahead — April 2013
Health System Scale
Exhibit 3 of 9
• Agency issues (ambiguity over accountability and risk)• Unanticipated culture challenges
Structural leverage• Pricing with payors• Local market density• Micromarket exclusivity
Scale/scopeeconomies• IT• Treasury• Shared services
Skilleconomies• More rigorous performance management induced by capital markets• Operational effectiveness• Quality• Utilization management• Etc.
• Performance of stand-alone entity
• Cost of coordination, safeguarding, complexity, etc.
Potential value creationCertain value destruction
6 The post-reform health system: Meeting the challenges ahead May 2013
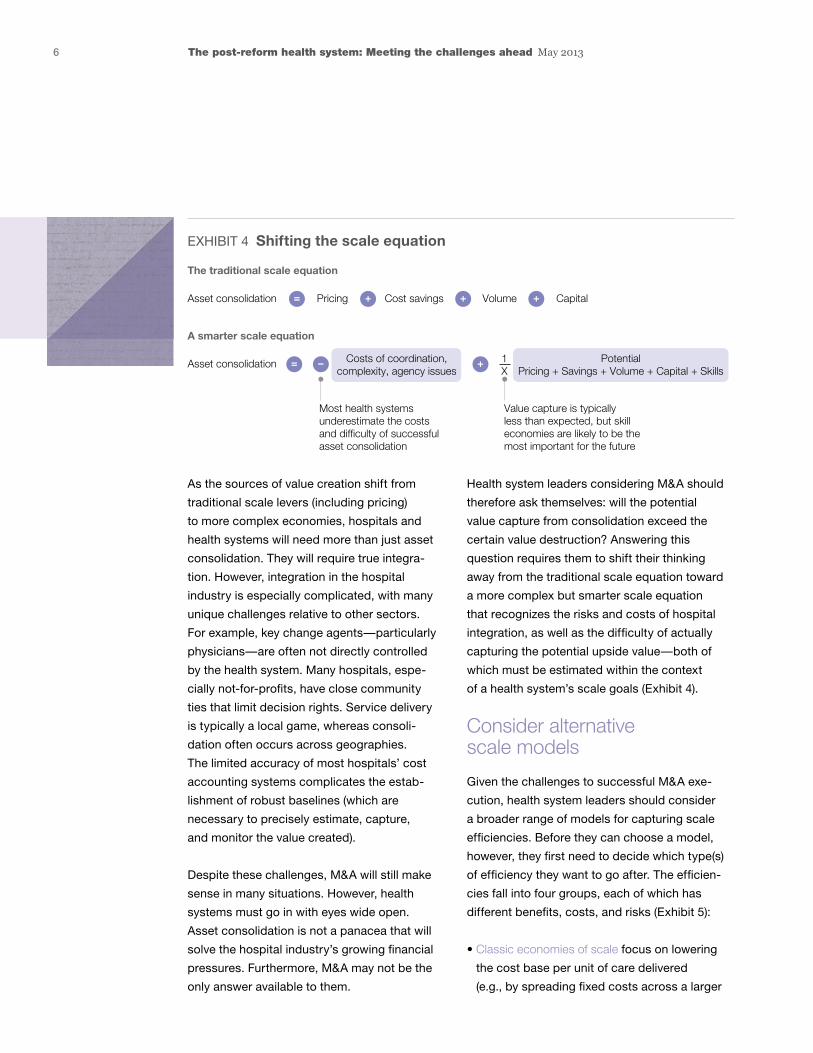
Health system leaders considering M&A should
therefore ask themselves: will the potential
value capture from consolidation exceed the
certain value destruction? Answering this
question requires them to shift their thinking
away from the traditional scale equation toward
a more complex but smarter scale equation
that recognizes the risks and costs of hospital
integration, as well as the difficulty of actually
capturing the potential upside value—both of
which must be estimated within the context
of a health system’s scale goals (Exhibit 4).
Consider alternative scale models
Given the challenges to successful M&A exe
cution, health system leaders should consider
a broader range of models for capturing scale
efficiencies. Before they can choose a model,
however, they first need to decide which type(s)
of efficiency they want to go after. The efficien
cies fall into four groups, each of which has
different benefits, costs, and risks (Exhibit 5):
• Classic economies of scale focus on lowering
the cost base per unit of care delivered
(e.g., by spreading fixed costs across a larger
As the sources of value creation shift from
traditional scale levers (including pricing)
to more complex economies, hospitals and
health systems will need more than just asset
consolidation. They will require true integra
tion. However, integration in the hospital
industry is especially complicated, with many
unique challenges relative to other sectors.
For example, key change agents—particularly
physicians—are often not directly controlled
by the health system. Many hospitals, espe
cially notforprofits, have close community
ties that limit decision rights. Service delivery
is typically a local game, whereas consoli
dation often occurs across geographies.
The limited accuracy of most hospitals’ cost
accounting systems complicates the estab
lishment of robust baselines (which are
necessary to precisely estimate, capture,
and monitor the value created).
Despite these challenges, M&A will still make
sense in many situations. However, health
systems must go in with eyes wide open.
Asset consolidation is not a panacea that will
solve the hospital industry’s growing financial
pressures. Furthermore, M&A may not be the
only answer available to them.
EXHIBIT 4 Shifting the scale equation
Asset consolidation Pricing Cost savings Volume Capital
Most health systems underestimate the costs and difficulty of successful asset consolidation
Value capture is typically less than expected, but skilleconomies are likely to be the most important for the future
The traditional scale equation
The post-reform health system: Meeting the challenges ahead — April 2013
Health System Scale
Exhibit 4 of 9
= + + +
Asset consolidation Costs of coordination,complexity, agency issues
PotentialPricing + Savings + Volume + Capital + Skills
A smarter scale equation
= – + 1X
7The smarter scale equation
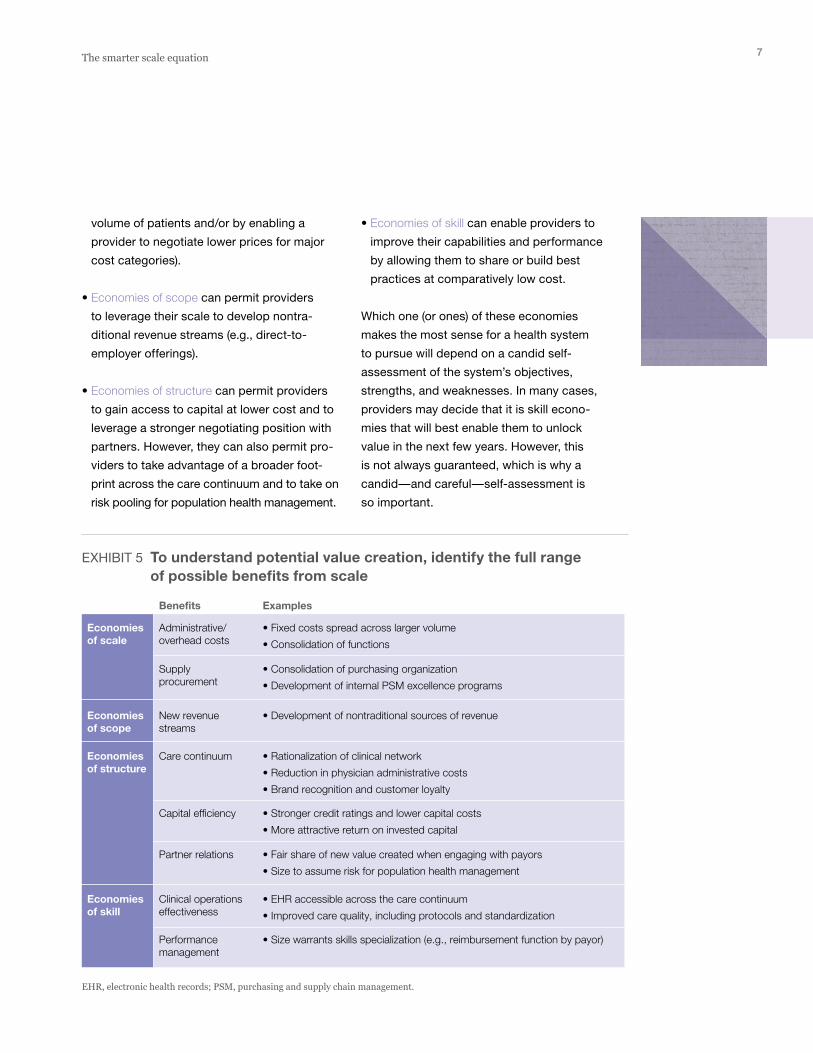
• Economies of skill can enable providers to
improve their capabilities and performance
by allowing them to share or build best
practices at comparatively low cost.
Which one (or ones) of these economies
makes the most sense for a health system
to pursue will depend on a candid self
assessment of the system’s objectives,
strengths, and weaknesses. In many cases,
providers may decide that it is skill econo
mies that will best enable them to unlock
value in the next few years. However, this
is not always guaranteed, which is why a
candid—and careful—selfassessment is
so important.
volume of patients and/or by enabling a
provider to negotiate lower prices for major
cost categories).
• Economies of scope can permit providers
to leverage their scale to develop nontra
ditional revenue streams (e.g., directto
employer offerings).
• Economies of structure can permit providers
to gain access to capital at lower cost and to
leverage a stronger negotiating position with
partners. However, they can also permit pro
viders to take advantage of a broader foot
print across the care continuum and to take on
risk pooling for population health management.
EXHIBIT 5 To understand potential value creation, identify the full range of possible benefits from scale
Administrative/overhead costs
• Fixed costs spread across larger volume
• Consolidation of functions
• Consolidation of purchasing organization
• Development of internal PSM excellence programs
• Development of nontraditional sources of revenue
• Rationalization of clinical network
• Reduction in physician administrative costs
• Brand recognition and customer loyalty
• Stronger credit ratings and lower capital costs
• More attractive return on invested capital
• Fair share of new value created when engaging with payors
• Size to assume risk for population health management
• EHR accessible across the care continuum
• Improved care quality, including protocols and standardization
• Size warrants skills specialization (e.g., reimbursement function by payor)
Supplyprocurement
New revenuestreams
Care continuum
Capital efficiency
Partner relations
Clinical operationseffectiveness
Performancemanagement
Benefits Examples
Economies of scale
Economiesof scope
Economiesof structure
Economiesof skill
The post-reform health system: Meeting the challenges ahead — April 2013
Health System Scale
Exhibit 5 of 9
EHR, electronic health records; PSM, purchasing and supply chain management.
8 The post-reform health system: Meeting the challenges ahead May 2013
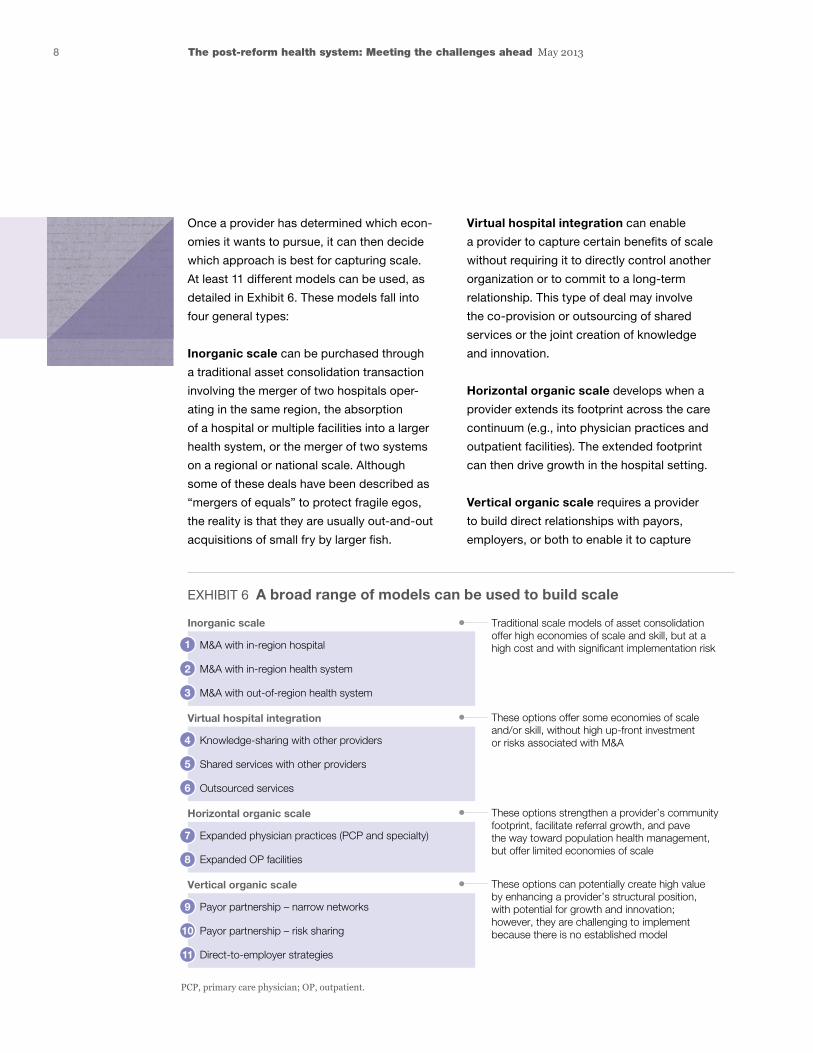
Virtual hospital integration can enable
a provider to capture certain benefits of scale
without requiring it to directly control another
organization or to commit to a longterm
relationship. This type of deal may involve
the coprovision or outsourcing of shared
services or the joint creation of knowledge
and innovation.
Horizontal organic scale develops when a
provider extends its footprint across the care
continuum (e.g., into physician practices and
outpatient facilities). The extended footprint
can then drive growth in the hospital setting.
Vertical organic scale requires a provider
to build direct relationships with payors,
employers, or both to enable it to capture
Once a provider has determined which econ
omies it wants to pursue, it can then decide
which approach is best for capturing scale.
At least 11 different models can be used, as
detailed in Exhibit 6. These models fall into
four general types:
Inorganic scale can be purchased through
a traditional asset consolidation transaction
involving the merger of two hospitals oper
ating in the same region, the absorption
of a hospital or multiple facilities into a larger
health system, or the merger of two systems
on a regional or national scale. Although
some of these deals have been described as
“mergers of equals” to protect fragile egos,
the reality is that they are usually outandout
acquisitions of small fry by larger fish.
EXHIBIT 6 A broad range of models can be used to build scale
M&A with in-region hospital
M&A with in-region health system
M&A with out-of-region health system
Traditional scale models of asset consolidation offer high economies of scale and skill, but at a high cost and with significant implementation risk
Inorganic scale
The post-reform health system: Meeting the challenges ahead — April 2013
Health System Scale
Exhibit 6 of 9
PCP, primary care physician; OP, outpatient.
1
2
3
Knowledge-sharing with other providers
Shared services with other providers
Outsourced services
Virtual hospital integration
4
5
6
Payor partnership – narrow networks
Payor partnership – risk sharing
Direct-to-employer strategies
Vertical organic scale
9
10
11
Expanded physician practices (PCP and specialty)
Expanded OP facilities
Horizontal organic scale
7
8
These options offer some economies of scale and/or skill, without high up-front investment or risks associated with M&A
These options strengthen a provider’s community footprint, facilitate referral growth, and pave the way toward population health management, but offer limited economies of scale
These options can potentially create high value by enhancing a provider’s structural position, with potential for growth and innovation; however, they are challenging to implement because there is no established model

9The smarter scale equation
What is the typical value capture potential? The value that any particular health system
can capture will depend on its specific
circumstances. Nevertheless, our experience
suggests that there is a range of typical
financial impact for each of the scale econo
mies discussed earlier. In the case of admin
istrative synergies and procurement benefits,
for example, the potential financial impact
increases in line with the size of the health
system (Exhibit 7). McKinsey’s hospital
consolidation model suggests that health
systems with less than $2 billion in revenues
greater patient volume. This approach can be
pursued in parallel with horizontal expansion,
parti cularly when the payor–provider collabo
ration aims to establish new care or payment
methods with a care management focus.
When deciding which model for capturing
scale they want to use, a health system
leader should consider two major questions:
First, how much potential value creation
is available with each model—and at what
cost? Second, does the proposed model
complement the system’s strengths, weak
nesses, and objectives?
EXHIBIT 7 Potential value from certain levers can vary, based on the degree of scale achieved
Administrative/overhead costs
Supplyprocurement
New revenuestreams
Care continuum
Capital efficiency
Partner relations
Clinical operationseffectiveness
Performancemanagement
Benefits Savings from scale and health system integration (examples)
The post-reform health system: Meeting the challenges ahead — April 2013
Health System Scale
Exhibit 7 of 9
AA, adjusted admission; NR, net revenue; SSC, shared service center; PCI, percutaneous coronary intervention; PSM, purchasing and supply chain management.
Economies of scale
Economiesof scope
Economiesof structure
Economiesof skill
• Best-practice benchmarks are typically 11–13% of NR (down to 9% for systems >$9 billion, up to 14% for systems <$2 billion), yet many health systems spend up to 20% of NR on administrative/overhead costs
• Overall administrative cost savings of 10–40%
— Typically, 10–20% in savings available from removal of duplicate functions across two health systems
— In addition, 10–25% savings from transformation to a shared service model: lean process improvements, demand management, optimized organization (e.g., centralization and consolidation into a single SSC)
• Supply cost ~$450/AA for 60,000 AA system
• Supply cost <$400/AA for 400,000 AA system
• In our experience, systems with over $2 billion in annual revenues are able to drive significant savings with their own PSM programs
• Systems with over ~$5 billion in annual revenues can consider independent business lines around PSM (consolidating sourcing with/for smaller systems)
• Cath lab example: minimum efficient scale of 200–400 PCI procedures per year to assure quality
10 The post-reform health system: Meeting the challenges ahead May 2013
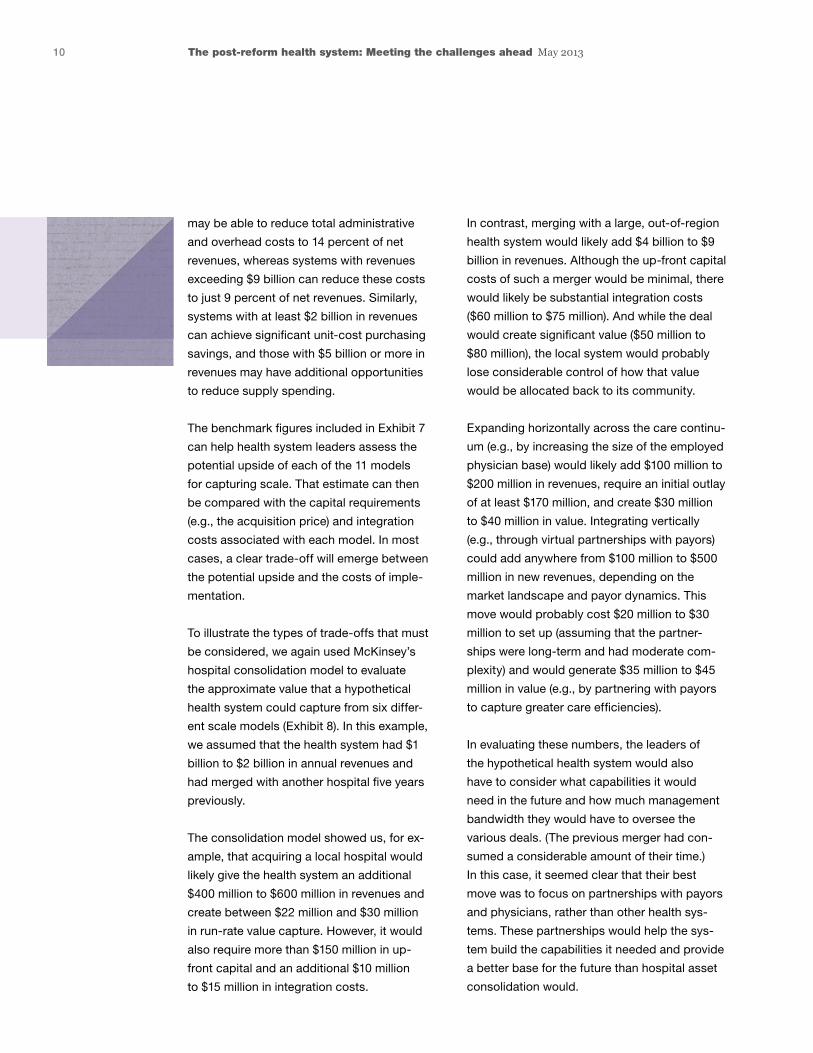
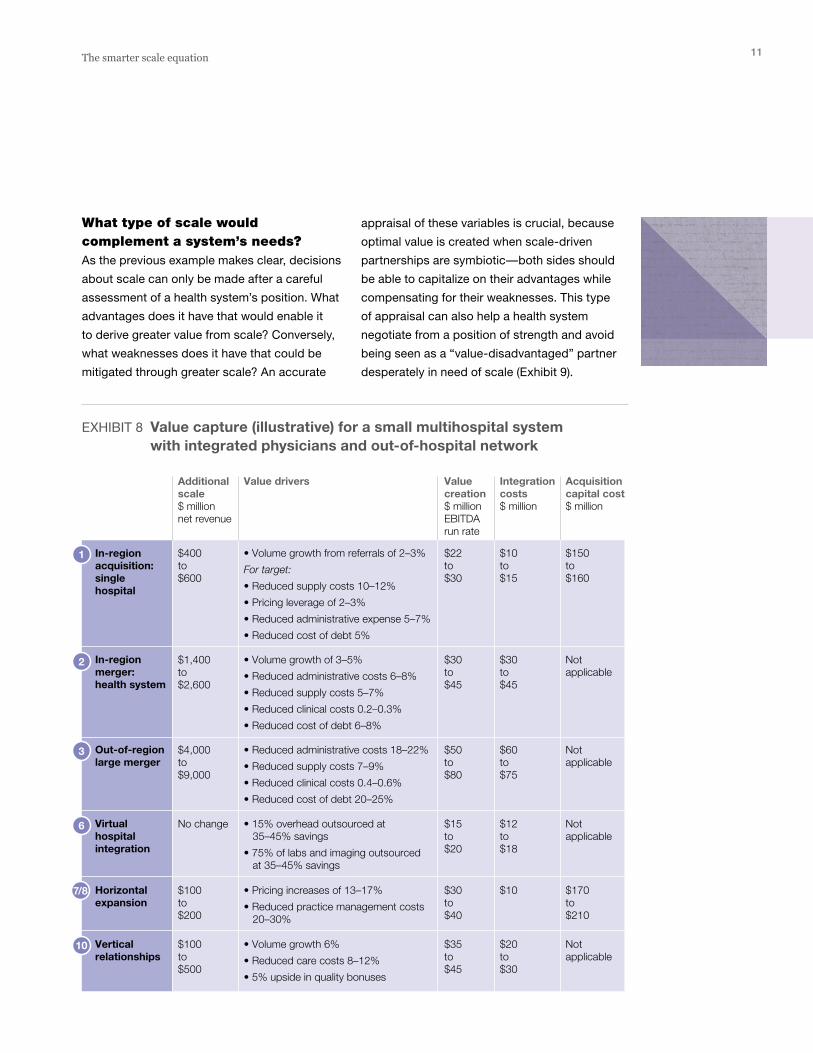
In contrast, merging with a large, outofregion
health system would likely add $4 billion to $9
billion in revenues. Although the upfront capital
costs of such a merger would be minimal, there
would likely be substantial integration costs
($60 million to $75 million). And while the deal
would create significant value ($50 million to
$80 million), the local system would probably
lose considerable control of how that value
would be allocated back to its community.
Expanding horizontally across the care continu
um (e.g., by increasing the size of the employed
physician base) would likely add $100 million to
$200 million in revenues, require an initial outlay
of at least $170 million, and create $30 million
to $40 million in value. Integrating vertically
(e.g., through virtual partnerships with payors)
could add anywhere from $100 million to $500
million in new revenues, depending on the
market landscape and payor dynamics. This
move would probably cost $20 million to $30
million to set up (assuming that the partner
ships were longterm and had moderate com
plexity) and would generate $35 million to $45
million in value (e.g., by partnering with payors
to capture greater care efficiencies).
In evaluating these numbers, the leaders of
the hypothetical health system would also
have to consider what capabilities it would
need in the future and how much management
bandwidth they would have to oversee the
various deals. (The previous merger had con
sumed a considerable amount of their time.)
In this case, it seemed clear that their best
move was to focus on partnerships with payors
and physicians, rather than other health sys
tems. These partnerships would help the sys
tem build the capabilities it needed and provide
a better base for the future than hospital asset
consolidation would.
may be able to reduce total administrative
and overhead costs to 14 percent of net
revenues, whereas systems with revenues
exceeding $9 billion can reduce these costs
to just 9 percent of net revenues. Similarly,
systems with at least $2 billion in revenues
can achieve significant unitcost purchasing
savings, and those with $5 billion or more in
revenues may have additional opportunities
to reduce supply spending.
The benchmark figures included in Exhibit 7
can help health system leaders assess the
potential upside of each of the 11 models
for capturing scale. That estimate can then
be compared with the capital requirements
(e.g., the acquisition price) and integration
costs associated with each model. In most
cases, a clear tradeoff will emerge between
the potential upside and the costs of imple
mentation.
To illustrate the types of tradeoffs that must
be considered, we again used McKinsey’s
hospital consolidation model to evaluate
the approximate value that a hypothetical
health system could capture from six differ
ent scale models (Exhibit 8). In this example,
we assumed that the health system had $1
billion to $2 billion in annual revenues and
had merged with another hospital five years
previously.
The consolidation model showed us, for ex
ample, that acquiring a local hospital would
likely give the health system an additional
$400 million to $600 million in revenues and
create between $22 million and $30 million
in runrate value capture. However, it would
also require more than $150 million in up
front capital and an additional $10 million
to $15 million in integration costs.
11The smarter scale equation
appraisal of these variables is crucial, because
optimal value is created when scaledriven
partnerships are symbiotic—both sides should
be able to capitalize on their advantages while
compensating for their weaknesses. This type
of appraisal can also help a health system
negotiate from a position of strength and avoid
being seen as a “valuedisadvantaged” partner
desperately in need of scale (Exhibit 9).
What type of scale would complement a system’s needs? As the previous example makes clear, decisions
about scale can only be made after a careful
assessment of a health system’s position. What
advantages does it have that would enable it
to derive greater value from scale? Conversely,
what weaknesses does it have that could be
mitigated through greater scale? An accurate
EXHIBIT 8 Value capture (illustrative) for a small multihospital system with integrated physicians and out-of-hospital network
Additional scale$ million net revenue
Value creation$ million EBITDArun rate
Acquisitioncapital cost$ million
Integration costs$ million
Value drivers
The post-reform health system: Meeting the challenges ahead — April 2013
Health System Scale
Exhibit 8 of 9
In-region acquisition:single hospital
$400to$600
$22to$30
$10to$15
$150to$160
• Volume growth from referrals of 2–3%
For target:
• Reduced supply costs 10–12%
• Pricing leverage of 2–3%
• Reduced administrative expense 5–7%
• Reduced cost of debt 5%
$1,400to$2,600
$30to$45
$30to$45
Not applicable
• Volume growth of 3–5%
• Reduced administrative costs 6–8%
• Reduced supply costs 5–7%
• Reduced clinical costs 0.2–0.3%
• Reduced cost of debt 6–8%
$4,000to$9,000
$50to$80
$60to$75
Not applicable
• Reduced administrative costs 18–22%
• Reduced supply costs 7–9%
• Reduced clinical costs 0.4–0.6%
• Reduced cost of debt 20–25%
No change $15to$20
$12to$18
Not applicable
• 15% overhead outsourced at 35–45% savings
• 75% of labs and imaging outsourced at 35–45% savings
$100to$200
$30to$40
$10 $170to$210
• Pricing increases of 13–17%
• Reduced practice management costs 20–30%
$100to$500
$35to$45
$20to$30
Not applicable
• Volume growth 6%
• Reduced care costs 8–12%
• 5% upside in quality bonuses
In-region merger:health system
Out-of-region large merger
Virtual hospital integration
Horizontal expansion
Vertical relationships
1
2
3
6
7/8
10

12 The post-reform health system: Meeting the challenges ahead May 2013
Although the current trend toward consolidation
is likely to continue, M&A is only one of several
levers that can be used to capture the benefits
of scale. Health system leaders should think
through their scale goals carefully and then
use a smarter scale equation to evaluate the
full range of available models. This broader
approach will enable them to achieve their
desired outcomes at an appropriate risk and
investment profile.
Rupal Malani, MD, an associate principal in
McKinsey’s Cleveland office (rupal_malani@mckinsey
.com), concentrates on scale strategies and operational
improvements for health systems. Anna Sherwood,
a principal in the San Francisco office (anna_sherwood@
mckinsey.com), leads the Firm’s West Coast provider
work and is an expert on innovative care and pay
ment models and scale strategies for health systems.
Saumya Sutaria, MD, a director in the Silicon
Valley office (saumya [email protected]), leads
the provider subpractice in McKinsey’s Healthcare
Systems and Services Practice in the Americas.
Historically, small and midsize health systems
have sought partners that could provide
access to capital, payor contracting strengths,
and physician alignment capabilities.9 Although
these factors will undoubtedly continue to
be important, a new capability focused on
healthcare value is likely to become top of
mind for many health system leaders as the
emphasis on total cost of care increases
and payment models shift away from fee
forservice arrangements. All health system
leaders should evaluate both their own
healthcare value capabilities and those of any
potential partners, and consider what sort of
skill base they need to build as part of their
scale strategy.
. . .Growing financial pressures on consumers,
employers, payors, and providers alike are
encouraging a renewed focus on M&A as
health systems seek to capture scale benefits.
9 McKinsey interviews with CEOs of small hospital systems, midsize hospital systems, ambulatory surgery centers, physician groups, and specialty care centers.
EXHIBIT 9 Value creation depends on whether the proposed scale partnership includes mutual complementarities
Each potential scale model should be evaluated based on mutual value creation
The post-reform health system: Meeting the challenges ahead — April 2013
Health System Scale
Exhibit 9 of 9
Low degree of value creation High degree of value creation
Hospital operationefficiency
Integration across care continuum
Financialperformanceand health
Structural position in market
Mission andorganizationeffectiveness(values, culture)
Value creation for partner from your strengths
Value creation for health system by mitigating weaknesses
Objectives for a scale strategy should be defined by your strengths and weaknesses:
• Understand your strengths and how they can be leveraged to add value to your partner
• Understand your weaknesses/gaps and how they can be mitigated by your partner