the social cost of gambling to victoria · the social cost of gambling to victoria browne et al....
TRANSCRIPT

responsiblegambling.vic.gov.au
November 2017
The social cost of gambling to Victoria
RESEARCH REPORT

vicrgf
responsiblegambling
Victorian Responsible Gambling Foundation
ResponsibleGambling
Our vision: A Victoria free from gambling-related harm
© Victorian Responsible Gambling Foundation, November 2017
This publication is licensed under a Creative Commons Attribution 3.0 Australia licence. The licence does not apply to any images, photographs, branding or logos.
This report has been peer reviewed by two independent researchers. For further information on the foundation’s review process of research reports, please see responsiblegambling.vic.gov.au.
This project was funded by the Victorian Responsible Gambling Foundation through the Grants for Gambling Research Program.
For information on the Victorian Responsible Gambling Foundation Research Program visit responsiblegambling.vic.gov.au.
DisclaimerThe opinions, findings and proposals contained in this report represent the views of the authors and do not necessarily represent the attitudes or opinions of the Victorian Responsible Gambling Foundation or the State of Victoria. No warranty is given as to the accuracy of the information. The Victorian Responsible Gambling Foundation specifically excludes any liability for any error or inaccuracy in, or omissions from, this document and any loss or damage that you or any other person may suffer.
Conflict of interest declarationThe authors declare no conflict of interest in relation to this report or project.
To cite this reportBrowne, M, Greer, N, Armstrong, T, Doran, C, Kinchin, I, Langham, E & Rockloff, M 2017, The social cost of gambling to Victoria, Victorian Responsible Gambling Foundation, Melbourne.
EnquiriesRosa Billi +61 3 9452 2625 [email protected]
Victorian Responsible Gambling FoundationLevel 6, 14–20 Blackwood StreetNorth MelbourneVictoria 3051
PO Box 2156Royal Melbourne HospitalVictoria 3050
Telephone: +61 3 9452 2600Facsimile: +61 3 9452 2660ABN: 72 253 301 291

The social cost of gambling
to Victoria
Matthew Browne Nancy Greer Tess Armstrong Chris Doran Irina Kinchin Erika Langham Matthew Rockloff
November 2017

The social cost of gambling to Victoria Browne et al.
Victorian Responsible Gambling Foundation Page ii
Table of contents
Table of contents ...................................................................................................................................... ii
List of figures ........................................................................................................................................... iv
List of tables .............................................................................................................................................. v
List of appendices .................................................................................................................................. vii
Key terms ............................................................................................................................................... viii
Executive summary .................................................................................................................................. 1
Phase 1: Systematic and targeted literature review ............................................................................. 4
Introduction ........................................................................................................................................... 4
Methods ................................................................................................................................................. 5
Systematic literature review search strategy ......................................................................................... 5
Targeted literature review search strategy ............................................................................................ 6
Results ................................................................................................................................................... 7
Systematic literature review................................................................................................................... 7
Targeted literature review .................................................................................................................... 13
Discussion ........................................................................................................................................... 23
Policy implications ............................................................................................................................... 25
Conclusion ........................................................................................................................................... 25
Phase 2: The social cost of gambling to Victoria ................................................................................ 26
Introduction ......................................................................................................................................... 26
Methodology ........................................................................................................................................ 27
Methodological considerations ............................................................................................................ 27
Cost of gambling framework ................................................................................................................ 28
Data sources ....................................................................................................................................... 29
Approach to cost calculations .............................................................................................................. 40
Results ................................................................................................................................................. 44
Total costs of gambling problems to Victoria, by gambling category .................................................. 44
Cost of gambling problems to Victoria, by cost category and PGSI.................................................... 47
Cost of gambling problems to Victoria, by bearer of cost and PGSI ................................................... 48
Financial costs ..................................................................................................................................... 49
Emotional and psychological harms .................................................................................................... 55
Relationships and family harms .......................................................................................................... 59
Productivity loss and work impact costs .............................................................................................. 67
Crime-related costs ............................................................................................................................. 74

The social cost of gambling to Victoria Browne et al.
Victorian Responsible Gambling Foundation Page iii
Cost to the Victorian Government ....................................................................................................... 76
Cost of YourPlay pre-commitment scheme ......................................................................................... 84
Comparing the costs of problem gambling to the VCEC and Productivity Commission estimates .... 85
Comparing the costs of gambling to the cost of alcohol, tobacco and illicit drug use ......................... 89
Discussion ............................................................................................................................................ 91
Limitations ........................................................................................................................................... 91
Conclusion .............................................................................................................................................. 93
References .............................................................................................................................................. 94
Appendix 1: Summary of systematic literature review ..................................................................... 107
Appendix 2: Understanding gambling harms questionnaire (Browne et al, 2016) ........................ 124
Understanding gambling harms: questionnaire ............................................................................. 125
Group A – Gamblers ......................................................................................................................... 125
Group B – Non-gamblers .................................................................................................................. 134
Group A and Group B ........................................................................................................................ 143
The social cost of gambling to Victoria Browne et al.
Victorian Responsible Gambling Foundation Page iv
List of figures
Figure 1: Systematic literature review selection log (PRISMA flow diagram) ........................................ 8
Figure 2: CQU approach to estimating the cost of gambling problems to Victoria............................... 41
Figure 3: Victorian gambling expenditure ($ million) Source: Australian Gambling Statistics
(AGS) 2013–14 figures (Queensland Treasury 2015) and Victorian Commission for
Gambling and Liquor Regulation for 2014–15 figure (VCGLR 2015). .................................................. 50

The social cost of gambling to Victoria Browne et al.
Victorian Responsible Gambling Foundation Page v
List of tables
Table 1: Estimated costs of gambling problems to Victoria (2014–15) ................................................... 2
Table 2: Harms excluded from costing analyses identified in impact frameworks according
to the Productivity Commission (1999) categorisation .......................................................................... 20
Table 3: Cost of gambling framework .................................................................................................... 28
Table 4: Prevalence of gambling in Victoria by problem gambling severity (PGSI) .............................. 30
Table 5: Prevalence estimates and data sources for cost items by problem gambling
severity (PGSI) ...................................................................................................................................... 31
Table 6: Definitions and data sources for cost items ............................................................................ 37
Table 7: Regression dominance analysis estimation of the relative contribution of emotional
or psychological harms to disability weights .......................................................................................... 43
Table 8: Cost of gambling problems to Victoria (2014–15) ................................................................... 44
Table 9: Cost of gambling problems to Victoria (2014–15) by cost category and PGSI ....................... 48
Table 10: Cost of gambling problems to Victoria (2014–15) by bearer of cost and PGSI .................... 49
Table 11: Share of gambling expenditure by problem gambling severity, Victoria (2014–15) .............. 51
Table 12: Details of calculations to infer excessive spend leading to financial deprivation or
opportunity costs by PGSI category* ..................................................................................................... 52
Table 13: Cost of excessive spend by gamblers, Victoria (2014–15) ................................................... 53
Table 14: Cost of bankruptcy due to gambling problems, Victoria (2014–15) –
administration and unpaid debts ........................................................................................................... 54
Table 15: Cost of depression due to gambling problems, Victoria (2014–15) ...................................... 56
Table 16: Cost of suicide attempts and ideation due to gambling problems, Victoria (2014–
15) .......................................................................................................................................................... 57
Table 17: Cost of emotional and psychological harms to gamblers, Victoria (2014–15) ...................... 59
Table 18: Cost of divorce and separation due to gambling problems, Victoria (2014–15) ................... 60
Table 19: Cost of experiences of violence due to gambling problems, Victoria (2014–15) .................. 62
Table 20: Cost of attempted suicide and fatality by suicide due to gambling problems on
affected others, Victoria (2014–15) ....................................................................................................... 63
Table 21: Cost of other emotional distress to affected others due to gambling problems,
Victoria (2014–15) ................................................................................................................................. 66
Table 22: Cost of loss of work productivity due to gambling problems, Victoria (2014–15) ................. 68
Table 23: Cost of job loss due to gambling problems, Victoria (2014–15) ............................................ 70
Table 24: Cost of absenteeism due to gambling problems, Victoria (2014–15) ................................... 71
Table 25: Cost of gambling-related crime to business, Victoria (2014–15) .......................................... 72
Table 26: Cost of fatality by suicide due to gambling problems, Victoria (2014–15) ............................ 73
Table 27. Cost of gambling-related crime to the Victorian justice system (2014–15) ........................... 75

The social cost of gambling to Victoria Browne et al.
Victorian Responsible Gambling Foundation Page vi
Table 28: Cost of gambling policy, regulation, research and treatment funding to the
Victorian Government (2014–15) ......................................................................................................... 78
Table 29: Cost to Victorian local government of responding to EGM applications (2014–15) ............. 79
Table 30: Cost of gambling problems to the Victorian health and human services sector
(2014–15).............................................................................................................................................. 81
Table 31: Cost of gambling problems to the Victorian mental health sector (2014–15)....................... 82
Table 32: Cost of homelessness services to the Victorian Government due to problem
gambling (2014–15) .............................................................................................................................. 84
Table 33: Cost of problem gambling to Victoria (2014–15) compared to VCEC and PC
(1999) updated estimates ..................................................................................................................... 86
Table 34: Total cost of drug abuse in Australia (inflated to 2014–15 dollars) ...................................... 89
Table 35: Cost of alcohol use to drinkers in Australia (Collins & Lapsley 2008) and others
(Laslett et al 2010) ................................................................................................................................ 90
The social cost of gambling to Victoria Browne et al.
Victorian Responsible Gambling Foundation Page vii
List of appendices
Appendix 1: Summary of systematic literature review 107
Appendix 2: Understanding gambling harms questionnaire (Browne et al, 2016) 124

The social cost of gambling to Victoria Browne et al.
Victorian Responsible Gambling Foundation Page viii
Key terms
Acronym Description
ABS Australian Bureau of Statistics
ACG Allen Consulting Group
AIHW Australian Institute of Health and Welfare
BoD Burden of Disease
CPGI Canadian Problem Gambling Index
CPI Consumer Price Index (ABS Catalogue No. 6401.1)
CQU Central Queensland University
CSF Community Support Fund
DALY Disability-Adjusted Life Years
DH Department of Health (Victoria)
DHHS Department of Health and Human Services
DHS Department of Human Services (Victoria)
DJR Department of Justice and Regulation (Victoria)
DOJ/DJR Department of Justice (Victoria), now the Department of Justice and Regulation
DSS Department of Social Services
DTF Department of Treasury and Finance (Victoria)
DW Disability Weight
EGM Electronic Gaming Machine
EGRL Experimental Gambling Research Laboratory
GDP Gross Domestic Product
HSP Homeless Support Program
ITSA Insolvency Trustee Service Australia
MAV Municipal Association of Victoria
NAHA National Affordable Housing Agreement
NPAH National Partnership Agreement on Homelessness
OLGR Office of Liquor, Gaming and Racing
PC Productivity Commission
PGSI Problem Gambling Severity Index
PIP Pre-commitment Implementation Project
SAAP Supported Accommodation Assistance Program
SOGS South Oaks Gambling Screen
VCAT Victorian Civil and Administrative Tribunal
VCEC Victorian Competition and Efficiency Commission
VCGLR Victorian Commission for Gambling and Liquor Regulation
VRGF Victorian Responsible Gambling Foundation
WHO World Health Organization

The social cost of gambling to Victoria Browne et al.
Victorian Responsible Gambling Foundation Page 1
Executive summary
The gambling industry generates economic activity, tax revenue and recreational benefits to
players. Nevertheless, it is well recognised that gambling can also result in diverse negative
consequences to at least some gamblers, as well as those around them (‘affected others’) and the
broader community. The present study aimed only to assess the costs associated with gambling.
A series of Australian studies have attempted to cost these negative outcomes in financial terms.
Total gambling expenditure1 in Victoria in 2014–15 was $5.8 billion, generating a total of $1.6
billion in taxes and levies. Gamblers are generally categorised in population surveys into four
categories based on the Problem Gambling Severity Index (PGSI; Ferris & Wynne 2001) scores:
non-problem (PGSI = 0), low-risk (LR, PGSI = 1 or 2), moderate-risk (MR, PGSI = 3–7) and
problem gambler (PG, PGSI = 8+). Spending by those with at least some gambling problems (i.e.
PGSI 1+) may account for up to 77 per cent of total gambling revenue2, which suggests that the
cost of gambling is significant relative to the size of the industry. The present report found that all
three PGSI 1+ categories (low-risk, moderate-risk and problem gamblers) contribute substantially
to the overall cost of gambling, although prior work has focused only on the costs associated with
problem gamblers.
The first phase of this project included a systematic and targeted review of the prior attempts to
quantify the cost of gambling and found that the four previous attempts in Australia largely followed
the framework developed by the Productivity Commission (PC) (1999). Costs associated with
gambling have been categorised into five parts:
financial costs
productivity and employment costs
crime and legal costs
personal and family costs
treatment costs.
In these prior studies, each cost was considered in terms of who was burdened by the cost: the
individual, the immediate family, or the community. Many of the prevalence estimates used to
establish the costs associated with harms were calculated by making assumptions from data
obtained via population prevalence studies or from reports by treatment-seeking gamblers at the
severe end of the problem gambling spectrum.
Previous costings have mainly excluded low-risk and moderate-risk gamblers and have been
limited by a lack of reliable or accurate data relating to the prevalence of harms, particularly those
experienced by affected others (Productivity Commission 1999, 2010; ACG 2011; VCEC 2012).
Because prior costing studies have tended to focus only on PGs, costs have not hitherto been
estimated for less severe but more prevalent aspects of gambling-related harm. The present study
revealed substantial harm (in aggregate) occurring among less-affected gamblers (LR and MR).
1 On EGMs, table games, wagering, racing, sports betting, lotteries, and Keno. 2 See Table 10.

The social cost of gambling to Victoria Browne et al.
Victorian Responsible Gambling Foundation Page 2
The second phase of this project estimated the costs of problem gambling to Victoria (2014–15) for
all gambling severity levels (LR, MR and PG), following a similar costing framework to previous
studies but utilising a more robust and representative source of prevalence figures of gambling-
related harm across the various costing items. Where possible, costs were estimated for gamblers
and affected others (which includes family, friends etc.) across the following categories: financial,
emotional and psychological, relationships and family, crime (cost to the Victorian justice system),
productivity loss and work impacts, and cost to the Victorian Government.
When considering costs arising from PGs only, and adjusting for inflation, we determined the cost
of gambling to be $2.4 billion, which is quite similar to prior estimates. However, we also
determined costs of $2.4 billion and $1.9 billion arising from lower risk categories (LR and MR), as
well as $0.3 billion in non-gambler specific costs. When these are included, the present analysis
arrives at a total cost of $7 billion – substantially higher than previous estimates. Thus, the
increased cost arrived at by the present study is attributable to costs associated with less severe
but more prevalent negative consequences of gambling, which were not included in previous
estimates. Given the size of these costs, it is not possible to ignore them in any reasonable and
complete accounting.
Table 1 summarises the estimated costs of gambling problems to Victoria in 2014–15. The total
costs include all levels of gamblers. A further breakdown by PGSI and cost subcategories is
provided in the Results section of this report.
Table 1: Estimated costs of gambling problems to Victoria (2014–15)
Category Low-risk gamblers
(PGSI 1–2)
Moderate-risk gamblers
(PGSI 3–7)
Problem gamblers (PGSI 8+)
Total cost to Victoria
(2014–15)
Financial $315,582,939 $337,505,836 $479,372,995 $1,348,095,911
Emotional and psychological
$815,133,289 $477,189,959 $300,633,433 $1,592,956,680
Relationships and family
$589,825,106 $585,809,945 $1,013,261,621 $2,188,896,672
Crime – Victorian justice system
$26,968,703 $31,229,297 $41,985,008 $100,183,007
Productivity loss and work impacts
$64,504,422 $195,190,478 $338,176,056 $597,870,956
Cost to the Victorian Government
$634,247,824 $275,246,025 $183,788,212 $1,145,477,560
Total cost $2,446,262,283 $1,902,171,540 $2,357,217,325 $6,973,480,7883
The major components of the cost of gambling are borne by gamblers themselves and those
around them. Of the $1.3 billion in financial costs, $1 billion could be attributed to direct financial
deprivation from excessive spend on gambling. However, problematic gambling also gives rise to
psychological impacts (e.g. loss of sleep due to worry, shame, stigma and distress), yielding costs
that go beyond the simple monetary value of gambling losses. We estimated that psychological
and emotional suffering by gamblers account for a further $1.6 billion of costs at the individual
level. Further psychological and emotional impacts on the families and social networks of gamblers
3 Total includes $267,829,640 costed in aggregate across all PGSI categories for subcategories: illegal offshore gambling; cost to Victorian state government in policy, regulation, research, and treatment; and the direct cost to local government in Victoria.
The social cost of gambling to Victoria Browne et al.
Victorian Responsible Gambling Foundation Page 3
are costed at $2 billion. Factoring in other minor costs, approximately 75 per cent of the total cost
of gambling is borne by gamblers, their families and their social networks.
Gambling involves a complex redistribution of wealth within society, at the individual, business and
government levels. The average non-problem gambler spends $670 per annum on gambling, while
the average gambler with some problems (PGSI 1+) spend an average of $5033 per annum on
gambling (Victorian Gambling and Health Study 2008, Hare 2009). Applying a conservative
discounting formula, we determined that excessive spend attributable to problematic gambling
accounts for at least $1 billion in direct financial deprivation costs to gamblers. This calculation
takes into account a generous assumption on the intentional and rational spending on gambling as
a recreational pursuit by both non-problem and problem gamblers. The amount of money
transferred from problem gamblers to operators is more than half the amount raised in taxes and
levies by government. This suggests that gambling taxation represents an inefficient and
inequitable means of raising funds for public expenditure.
Based on previous costings, alcohol and tobacco are each estimated to cost Victoria about $10
billion per annum. Therefore, gambling results in about 70 per cent of the cost of each of these
issues in monetary terms. Prior work (Browne et al 2016) has quantified harm from gambling and
alcohol in terms of health and wellbeing impact (years of life lost to disability – YLD). The ratio of
the two conditions in terms of YLD is 69 per cent. This illustrates a very close correspondence
between these two different methods of quantifying negative consequences from gambling – both
monetary and non-monetary.
A final assessment of the ‘net’ effect of gambling (benefits – costs) is beyond the scope of the
present study. Although the precise value of the ‘consumer surplus’ (entertainment benefit
exceeding expenditure) is uncertain, the $7 billion in annual costs resulting from gambling
calculated here can be compared to gross industry revenue of $5.8 billion. In our view, any
reasonable estimate of the consumer surplus of gambling would likely entail a neutral or (more
likely) negative net benefit to the Victorian community.

The social cost of gambling to Victoria Browne et al.
Victorian Responsible Gambling Foundation Page 4
Phase 1: Systematic and targeted literature
review
Introduction
In recent years, researchers and policy analysts have adopted a public health approach to
managing the impact of gambling (Productivity Commission 2010). This in turn has led to the
emergence of research focusing on definitions and conceptual frameworks of gambling-related
impact or harm (Abbott et al. 2013; Binde 2011; Blaszczynski 2009; Currie et al. 2006; Currie & et
al. 2009; Fearnley & et al. 2012; Langham et al. 2016; Young & Tyler 2008). The growing body of
gambling-related harm research highlights that gambling not only has negative impacts on
gamblers themselves, but also on others close to them (family, friends, colleagues) and the wider
community (Abbott et al. 2013; Langham et al. 2016; Li et al. & 2016; Productivity Commission
2010).
A recent study by Langham et al. (2016) conducted an extensive literature review and collected
data from gamblers experiencing harm, others affected by a gambler, and professionals in support
or treatment of those with gambling problems. They used this data to generate a definition,
conceptual framework and classification of gambling-related harms. For both gamblers and
affected others, gambling-related harm could be classified into eight domain types:
1. financial harm
2. relationship disruption, conflict or breakdown
3. emotional or psychological distress
4. decrements to health
5. cultural harm
6. reduced performance at work or study
7. criminal activity
8. life course or intergenerational harms (Langham et al. 2016).
Utilising the framework for gambling-related harms, Li et al. (2016) measured harms among both
gamblers and affected others and found their experiences of harm to be similar. Gamblers
appeared to ‘pass on’ approximately half of the harms they experienced from gambling to those
around them, and harms accrued with increasing levels of problem gambling severity (PGSI). A
public health approach to gambling-related harm was adopted by Browne et al. (2016) who
quantified the individual and community level impact of low-risk, moderate-risk and problematic
gambling on the quality of life. Their research found that low-risk gambling was about as harmful to
the individual as some musculoskeletal conditions (e.g. arthritis); that moderate-risk gambling was
on par with the mild alcohol use disorder; and that problem gambling was as harmful as bipolar
disorder and migraines (Browne et al. 2016). Furthermore, at the community level the study
showed that the aggregate years of healthy life lost each year due to gambling problems in the
Victorian population was 97,877 years, two-thirds of the impact of alcohol use or dependence or of

The social cost of gambling to Victoria Browne et al.
Victorian Responsible Gambling Foundation Page 5
major depression (Browne et al. 2016). The gambling harms identified and measured in these
studies (Browne et al. 2016; Langham et al. 2016; Li et al. 2016) are consistent with other
developed frameworks of gambling impacts or harm (Abbott et al. 2013; Binde 2011; Blaszczynski
2009; Currie et al. 2006; Currie et al. 2009; Fearnley et al. 2012; Young & Tyler 2008).
While the abovementioned research has substantially advanced our understanding of gambling
harm, attempts to estimate the aggregate costs caused by gambling harms on the individual,
affected others and the community provide methodologies that are inconsistent and incomplete
(Productivity Commission 1999, 2010; Victorian Competition and Efficiency Commission 2012).
For example, a recent analysis by the VCEC (2012) estimated the social and economic costs of
gambling to be between $1.5 billion and $2.7 billion a year VCEC (2012). That study’s estimate
was limited not only by the wide cost range nominated, but also because it focused only on costs
arising from problem gamblers, when recent research shows that financial and other impacts arise
also from gamblers at a lower risk of having gambling problems (Browne et al. 2016).
The Victorian Responsible Gambling Foundation (VRGF) has identified the need for a
comprehensive economic measure of the social cost of gambling. The objective of this research is
to estimate the current social cost of gambling in Victoria using all available information, including
recent findings on gambling harms. The purpose of this first stage of the study is to conduct a
systematic and targeted review of the literature on the social cost of gambling. Key considerations
are the types of impacts of gambling and the appropriate methodologies used to quantify social
costs of the impacts of gambling. In line with the Victorian Competition and Efficiency
Commission’s inquiry into the costs of problem gambling (2010), the current report considers only
the social impacts and costing methodologies related to the negative costs of gambling on the
individual, affected others and the wider community. While the Productivity Commission (1999;
2010) considered the benefits of gambling in terms of consumer surplus, tax revenue and social
community benefits, a full cost-benefit analysis is highly complex and beyond the scope of this
report.
Methods
Systematic literature review search strategy
The strategy utilised for the systematic review of peer-reviewed literature on gambling-related
harms and costs adopted the PRISMA (Preferred Reporting Items for Systematic Reviews and
Meta-Analyses) guidelines (Moher & et al. 2009). A librarian designed and carried out a
comprehensive search strategy for the systematic literature review. The following terms were
searched in the title or abstract, article or MESH heading of peer-reviewed papers and non-
reviewed reports:
1. gambling OR pathological gambling
2. cost* OR impact* OR social cost*
3. economic* OR socioeconomic*
4. AND/1–3.
The search was limited to studies published between 2010 and February 2016 (inclusive). A
comprehensive search of 11 databases was then conducted:

The social cost of gambling to Victoria Browne et al.
Victorian Responsible Gambling Foundation Page 6
Medline/Ovid
Embase/Ovid
PsycINFO/Ovid
EBM Reviews – Cochrane Database of Systematic Reviews/Ovid
The Campbell Library
APAIS-Health/Informit
CINAHL/Ebsco
Global Health/Ovid
EconLit/Proquest
Proquest Central/Proquest
Geobase/Elsevier.
Articles were limited to those written in English and available as full manuscripts of the original
research.
Article synthesis
Information was extracted from each paper on: author, year, country of data, objective,
methodology, gambling type, gambling harm level and type, key findings and general comments.
Greater attention was devoted to understanding and summarising research on gambling-related
harms and any reported social costs. Two review authors (IK, NG) extracted the information and a
third author (CD) checked the extracted data. Disagreements were resolved by discussion
between the reviewers (IK, CD, NG) and the lead investigator (MB).
Qualitative analysis
Narrative synthesis was used to analyse the studies, an approach consistent with the guidance
provided by Popay et al. (2006) This involved developing a preliminary synthesis of findings of the
included studies, exploring relationships in the data by textual descriptions, clustering, tabulation
and assessing the robustness of the synthesis product.
Targeted literature review search strategy
The targeted literature review was designed to consider publications not necessarily within the
scope of the systematic literature review that specifically detailed costing methodologies rather
than impact frameworks. Targeted literature included government reports, results from populations
studies or other forms of ‘grey literature’ that were not included within the systematic search.
Studies were identified by pursuing reports and articles presented on websites of known research,
department or government websites and by taking advantage of professional networks in the
industry to request potentially relevant documents from specific agencies and organisations. These
articles were restricted to those specifically discussing costing methods using an infinite timeline.

The social cost of gambling to Victoria Browne et al.
Victorian Responsible Gambling Foundation Page 7
Results
Systematic literature review
The systematic literature review search of 11 databases yielded a total of 173 citations of peer-
reviewed publications. The papers were then reviewed by an experienced librarian and lead
researcher (CD) and 112 exclusions were made based on the following criteria:
22 duplicates
90 records excluded with reason:
o theory or modelling paper (n = 31)
o risk-related behaviour (n = 29)
o not specific to gambling (n = 10)
o review papers (n = 7)
o on interventions (n = 2)
o protocol paper (n = 1)
o full text not available (n = 1)
o paper not translated into English (n = 1)
o paper was an introduction to a special journal issue (n = 1).
The remaining 61 articles were reviewed by three authors (NG, CD, IK) and two themes emerged.
The studies related to either:
the impact of gambling-related harms on individuals, affected others (e.g. family, friends),
or the community (n = 25) or
gambling industry impacts, predominantly at a community level (n = 36).
The flow diagram shown in Figure 1 summarises the search strategy results for the systematic
literature review.
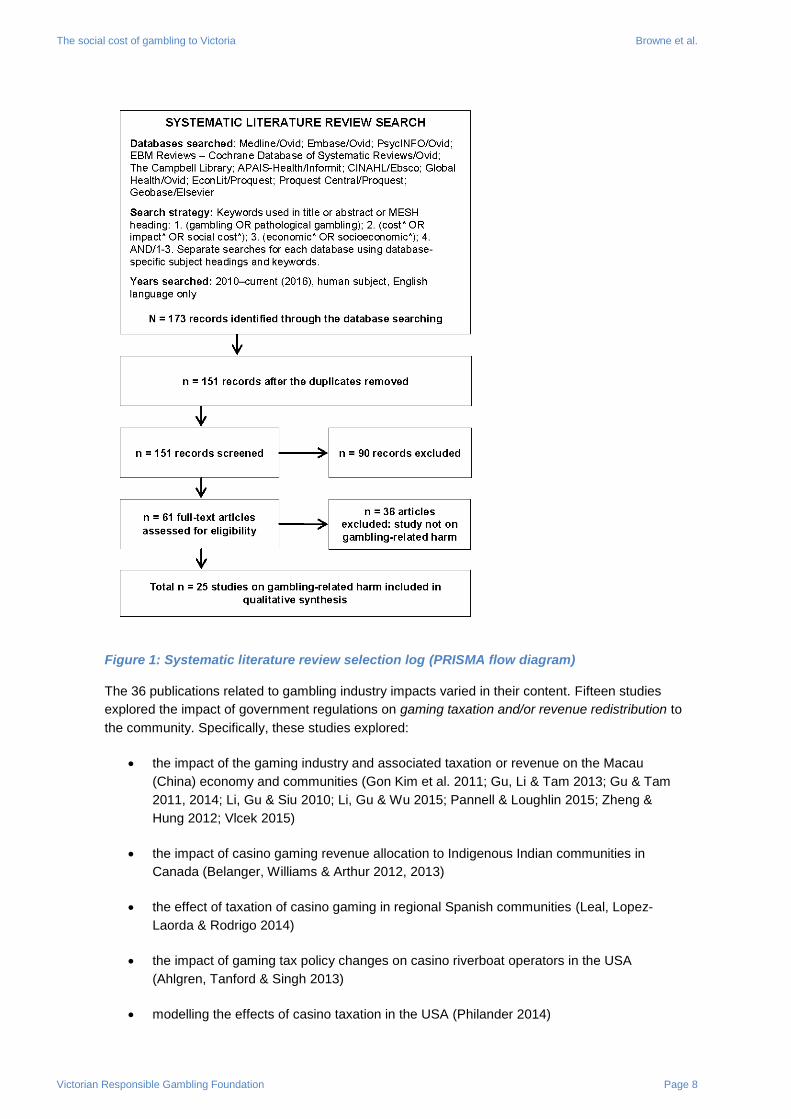
The social cost of gambling to Victoria Browne et al.
Victorian Responsible Gambling Foundation Page 8
Figure 1: Systematic literature review selection log (PRISMA flow diagram)
The 36 publications related to gambling industry impacts varied in their content. Fifteen studies
explored the impact of government regulations on gaming taxation and/or revenue redistribution to
the community. Specifically, these studies explored:
the impact of the gaming industry and associated taxation or revenue on the Macau
(China) economy and communities (Gon Kim et al. 2011; Gu, Li & Tam 2013; Gu & Tam
2011, 2014; Li, Gu & Siu 2010; Li, Gu & Wu 2015; Pannell & Loughlin 2015; Zheng &
Hung 2012; Vlcek 2015)
the impact of casino gaming revenue allocation to Indigenous Indian communities in
Canada (Belanger, Williams & Arthur 2012, 2013)
the effect of taxation of casino gaming in regional Spanish communities (Leal, Lopez-
Laorda & Rodrigo 2014)
the impact of gaming tax policy changes on casino riverboat operators in the USA
(Ahlgren, Tanford & Singh 2013)
modelling the effects of casino taxation in the USA (Philander 2014)

The social cost of gambling to Victoria Browne et al.
Victorian Responsible Gambling Foundation Page 9
the tax regulation impact of private versus government run casinos in the USA and
Canada (Chang, Lai & Wang 2010).
Nine studies explored the introduction and impact of casinos, including:
the relationship between casino adoption and political corruption in the USA (Walker &
Calcagno 2013)
the impact of casinos on quality of life and business productivity in the USA (Wenz 2014)
rent-seeking in the USA casino gaming industry (Mixon & Ressler 2014)
an international review of factors associated with decisions to legalise casino gambling
(Richard 2010)
perceptions of the impacts of casino development in Macau and Singapore (Wu & Chen
2015) and Hong Kong (Tam,Tsai & Chen McCain 2013)
modelling neighbourhoods around casinos in socio-demographic disadvantaged areas in
the USA (Conway 2015)
the impact of the introduction of the casino gaming industry to Indian nations (Conner &
Taggart 2013) and Tunica County in the USA (Long, Johnson & Oakley 2011).
Two Australian studies focused on electronic gaming machines (EGMs):
the relationship between EGM expenditure and the receivership of economic stimulus
cheques in Victoria, Australia (Buddelmeyer & Peyton 2014)
a discussion of the relationship between government regulation and accessibility of EGMs
in Australia and New Zealand on gambling consumption and harm (Livingstone & Adams
2011).
The remainder of the papers from the systematic literature review search examined:
motivations for gambling in an Australian sample (Francis et al. 2015)
problem gambling prevalence in Hungary (Kun et al. 2012)
the association between lottery sales and suicide numbers in Taiwan (Chen, Stewart &
Lee 2012)
a review of publically available gambling data sources in Australia and how these measure
gambling addiction (Farrell 2012)
a review of the impact of the legalisation of gambling in Germany (Ludwig et al. 2013)
modelling gambling participation and expenditure for economic growth versus recession in
Sweden (Rude, Surry & Kron 2014)
adolescent gambling frequency in a Norway population (Hansen & Rossow 2012)
The social cost of gambling to Victoria Browne et al.
Victorian Responsible Gambling Foundation Page 10
a commentary from a New Zealand author on the need for ‘industry addiction studies’ to
influence policy and regulation change on consumption of harmful products (Adams 2013).
In addition, only three of these 35 studies reported on costs: one in relation to annual casino
revenue (US$) allocated to community funds and charities (Belanger et al. 2013), another on the
expenditure on EGMs (A$) in a given period (Buddelmeyer & Peyton 2014) and the third which
cited figures from a 1999 US study on the annual and lifetime costs (US$) of gambling in the
aggregate (US$ 5 billion annual, US$ 40 billion lifetime) and per problem or pathological gambler
(Huberfeld & Dannon 2014).
These 36 studies were excluded from the qualitative analysis as they did not measure the direct
impact or social costs of gambling by the individual, but rather the impact of the gambling industry
overall and associated government regulation and taxation policies.
The 25 remaining publications on gambling-related harm studies were broadly grouped according
to their focus on three levels of harm:
the individual level (the gambler)
affected others (e.g. family, friends)
the community level (e.g. support services).
These are consistent with the gambling-related harms taxonomy proposed by Langham et al.
(2016) and quantified in subsequent studies at an individual and population level by Browne et al.
(2016). This approach to organising ‘levels’ of harm has previously been identified by Currie and
colleagues (2006, 2007, 2009). This framework provides a suitable means to develop a
methodology to measure the social costs of gambling by first identifying each gambling-related
harm and the aggregate impact to the population. The next section summarises these 25
publications at each gambling-related harm level. A full summary of the studies and their findings
are provided in Appendix 1.
Gambling-related harm articles
Out of 25 peer-reviewed publications on gambling-related harm, the largest proportion of research
was on gambling-related harm in the USA (n = 8) and Australia (n = 6). Other countries included
China (n = 3), New Zealand (n = 2), United Kingdom (n = 2), Czech Republic (n = 1), Denmark
(n = 1), Sweden (n = 1) and a combined USA and South Korean paper (n = 1). The largest gain in
the research output was observed between 2012 and 2014 with 19 publications (76 per cent).
Individual level harms
The majority of the studies identified were focused on the individual level harms to the gambler
(n = 21) across all harm domains identified by Langham et al. (2016): financial difficulties,
relationship conflict or breakdown, decrements to health, emotional or psychological distress,
reduced productivity or loss of work or study, and criminal activity. The individual level harms from
gambling identified in the systematically reviewed articles were: financial problems (Hing et al.
2012; Kerber et al. 2015; Svensson, Romild & Shepherdson 2013; Walker, Abbott & Gray 2012),
debt (Brown et al. 2012; Kerber et al. 2015) or personal bankruptcy (Grote & Matheson 2014),
impact on relationships (Black et al. 2012; Hing et al. 2012; Svensson et al. 2013; Walker et al.
2012), divorce (Black et al. 2012; Kerber et al. 2015), violence (Hing et al. 2012), substance use or
abuse (Cheung 2014; Hayatbakhsh et al. 2012; Larsen, Curtis & Bjerregaard 2013; Maierova,

The social cost of gambling to Victoria Browne et al.
Victorian Responsible Gambling Foundation Page 11
Charvat & Miovsky 2014; Najavits et al. 2011; Svensson et al. 2013), anxiety and depression (Hing
et al. 2012; Holtslag et al. 2008; Lindberg, Fernie & Spada 2011; Maierova et al. 2014; Svensson
et al. 2013), help-seeking behaviour (Gainsbury et al. 2014; Hing et al. 2012), suicidal thoughts
and/or attempts (Maierova et al. 2014), loss of employment (Kerber et al. 2015; Maierova et al.
2014), and criminal activity (Cheng, Smyth & Sun 2014; Cheung 2014; Hing et al. 2012). One of
the reviewed studies claimed a relationship between the opening of casinos and a 9.2 per cent
increase in fatal alcohol-related traffic accidents near the casino locations during a 10-year period
(Cotti & Walker 2010).
A study by Markham, Young and Doran (2014) tested the hypothesis that electronic gaming
machine (EGM) expenditure could predict gambling-related harm at the level of the EGM venue
(venue design). This is an emerging area of research that focuses on understanding how elements
of venue design induce specific behaviours in individual gamblers (Abbott et al. 2013). Results
revealed that after adjusting for venue type and number of EGMs, an increase in mean per capita
monthly EGM expenditure from A$10 to A$150 was associated with a doubling in the prevalence
of gambling-related harm from 9 per cent to 18 per cent in the adult population of the Northern
Territory, Australia (Markham et al. 2014).
Affected others harms
Of the 25 gambling harm studies, only one focused on the gambling-related harm to others close
to the gambler. Svensson et al. (2013) considered data from the Swedish Longitudinal Gambling
Study and found that 18.2 per cent of the Swedish population reported having someone close to
them who currently or previously had gambling problems. These ‘concerned significant others’
(CSOs) experienced similar negative consequences to gamblers, as they were significantly more
likely than the general population to experience poor mental health, risky alcohol consumption,
economic hardship and arguments with those closest to them. Gender differences were explored,
finding that males and females were just as likely to be CSOs and experienced similar problems;
women CSOs reported less social support and greater exposure to violence; and male CSOs
reported more legal problems and were more afraid of losing their jobs (Svensson et al. 2013). The
authors noted that the main limitation of the study was that the relationship between the CSO and
the person previously or currently experiencing gambling problems was unknown (Svensson et al.
2013).
The remainder of the papers reported the negative impacts on persons close to a gambler (i.e.
families, friends) as measured indirectly by the harms experienced by the problem gambler. These
include: divorce (Black et al. 2012), family or relationship problems (Black et al. 2012; Maierova et
al. 2014), seeking help from family or friends (Gainsbury et al. 2014; Hing et al. 2012), arguments
in the household (Hing et al. 2012) or related to gambling (Tu, Gray & Walton 2014; Walker et al.
2012), violence (Hing et al. 2012) and lower household income (Brown et al. 2012).
Community level harms
At the community level the studies arising from systematic literature review broadly analyse the
association between gambling participation, expenditure and access to gambling venues and
levels of household income (Brown et al. 2012; Moellman & Mitra 2013; Pickernell et al. 2013; Tu
et al. 2014), unemployment (Moellman & Mitra 2013; Pickernell et al. 2013), crime (Cheng et al.
2014; Cheung 2014; Humphreys & Soebbing 2014; Moellman & Mitra 2013), business bankruptcy
(Grote & Matheson 2014) and tourism (Pickernell et al. 2013).
Moellman and Mitra (2013) conducted an empirical analysis in the USA on the relationship
between gambling (measured as the number of gaming machines and tables), community welfare,

The social cost of gambling to Victoria Browne et al.
Victorian Responsible Gambling Foundation Page 12
household income, unemployment, violent crime and property crime. Gaming machines and tables
impacted the community negatively, with increases in levels of unemployment, violent crime and
property crime as the numbers of gaming machines and tables increased. Median household
income was negatively associated with the number of gaming machines but positively associated
with the number of gaming tables (Moellman & Mitra 2013). An Australian study by Pickernell et al.
(2013) found that EGM access (measured by the number of EGMs and venue size) was related to
higher expenditure on EGMs per adult and higher unemployment rates.
One of the USA studies found mixed results in the relationship between crime and gambling, in
that the access to video lottery terminals (VLTs) in clubs and bars was weakly associated with a
decrease in prostitution and shoplifting and an increase in credit card fraud (Humphreys &
Soebbing 2014). However, the presence of casinos was related weakly to an increase in robbery
and a decrease in shoplifting. No relationship was found between the introduction of VLTs and
casinos and breaking and entering, drug possession, or illegal gambling (Humphreys & Soebbing
2014).
Several studies identified in the systematic search focused on the impact of gambling within
indigenous communities (Hing et al. 2012; Wolfe et al. 2012; Young, Lamb & Doran 2011). Hing et
al. (2012) conducted a targeted survey of Aboriginal Australians living in NSW who gamble.
Seventy per cent of the Aboriginal gamblers spent more than $100 per week compared to 22 per
cent of non-Aboriginal gamblers, and the Aboriginal gamblers had higher rates of EGM use. The
Aboriginal sample reported harms including depression, financial problems and need for financial
assistance, family conflict, time away from work and study, and obtaining money illegally (Hing et
al. 2012). Another study conducted in three remote towns in the Northern Territory with a high
proportion of Aboriginal residents found a disproportionate distribution of EGM expenditure in
these areas, with two venues in the Aboriginal community accounting for over $100,000
expenditure per EGM (Young et al. 2011). Young and colleagues (2011) argue that the
redistribution of EGM revenue to the Community Benefit Fund, which aims to improve the negative
consequences of gambling, is not reaching the most disadvantaged Aboriginal communities
outside of town. The third study concerning indigenous communities and gambling found benefits
of tribal casino gaming on American Indians on income, indicators of health, health-related
behaviours and access to health care (Wolfe et al. 2012).
The perceptions of the positive benefits and negative impacts of casino gaming on the community
were reported in two studies (Lee, Kang & Reisinger 2010; Wan 2012). Lee et al. (2010) collected
data from two rural gaming locations in the USA and South Korea on the communities’ perception
of the impacts, benefits and support for casino gaming development. Via regression analysis the
authors extracted six factors surrounding their perceptions: negative social impacts with direct
gambling costs (e.g. gambling addiction, bankruptcy); negative environmental impacts (e.g. noise,
crowding); negative social impacts with indirect gambling costs (e.g. crime, divorce, alcohol and
drug problems); positive social impacts (e.g. traditional or cultural preservation, community spirit);
positive economic impacts (e.g. tourism, employment); and negative economic impacts (e.g. tax
burden, cost of living). Wan (2012) found that while community leaders’ perceived the introduction
of casino gaming in Macao to have positive social, economic and environmental contributions to
the community, there were resultant harms at the individual and family levels including problem
gambling, crime, school dropouts and family relationship problems.

The social cost of gambling to Victoria Browne et al.
Victorian Responsible Gambling Foundation Page 13
Targeted literature review
Quantifying the costs of gambling
A number of studies beyond the scope of the systematic review have determined a range of harms
associated with gambling (Anielski & Braaten 2008; Dickerson et al. 1998; Productivity
Commission 1999 2010; The Allen Consulting Group, Problem Gambling Research and Treatment
Centre (AGC) 2011; Victorian Competition and Efficiency Commission (VCEC) 2010).
As mentioned previously, one of the most comprehensive frameworks was developed by Central
Queensland University (CQU) and detailed gambling-related harm in Victoria (Browne et al. 2016).
Following Langham et al. (2016), the framework of harm used in that study incorporated eight
categories of harm: financial, relationships, emotional or psychological distress, health, cultural,
work or study performance, criminal activity, and life course or intergenerational harm. While the
gambling harms frameworks presented by Langham et al. (2016) and other publications detailed in
the systematic review have provided increased understanding of the harms resulting from
gambling, they fail to consider the resulting financial burden of gambling-related harm. Both
national and international organisations have attempted to put a figure on the cost of gambling
(Anielski & Braaten 2008; PC 1999, 2010; VCEC 2012). The most prominently cited methodology
used for quantifying the cost of problem gambling in Australia was developed by the Productivity
Commission (1999). The Productivity Commission (1999, 2010) included the benefits associated
with gambling in their costing frameworks. The current review will focus solely on the
methodologies used to calculate the adverse social costs associated with gambling. While
considering the benefits of gambling is important for a comprehensive understanding of the
broader impacts of gambling, calculating gambling-related benefits is challenging, as it requires
data from a number of unattainable sources and involves complex methodologies well beyond the
scope of this report. Accordingly, the following sections will detail how the adverse costs of
gambling have been quantified by the Productivity Commission (1999) and then consider how
other authors adapted this methodology to incorporate different harms or perspectives.
Productivity Commission 1999
The Productivity Commission (1999) used data from the National Gambling Survey 1999 and the
Survey of Clients of Counselling Agencies (SCCA) to provide an estimation of the cost of gambling
in the year 1997–98. Unless otherwise stated, the Productivity Commission used data from the
National Gambling Survey sourced from a general population of regular gamblers. To be
conservative, when using the SCCA, data was only included for gamblers who scored 10 or above
on the South Oaks Gambling Screen (SOGS; 47,000 people) rather than the estimated total
number of problem gamblers in the Australian population (293,000 people). It was expected that
those seeking treatment would be likely to experience more severe harms than a general
population sample of problem gamblers.
The Productivity Commission (1999) used a number of assumptions and parameters to deal with
variations in question framing, causality and comorbidity. The SCCA often asked participants about
adverse consequences as one-off events (i.e., have you ever …) rather than in reference to ‘the
last year’. For these questions, the commission estimated and converted isolated instances to an
annual figure based on an average lifespan of gambling problems of 8.9 years (generated from
SCCA data). The annual figure allowed for an annual cost to be estimated for impacts measured
as ‘one-off’ events.
The Productivity Commission (1999) also considered the issues of causality and the likelihood that
the gambler would have experienced the impact or harm in the absence of gambling. They met

The social cost of gambling to Victoria Browne et al.
Victorian Responsible Gambling Foundation Page 14
with prominent Australian gambling academics who agreed that for a number of outcomes related
to personal and family impacts, approximately 15–20 per cent would have experienced problems
regardless of the gambling problems. Financial burdens or consequences were considered to be a
direct derivative of gambling problems. In the absence of data relating to causality, the Productivity
Commission (1999) applied a 20 per cent reduction to the prevalence of personal and family harms
of problem gambling, thus only calculating a prevalence of 80 per cent for these impacts. They
acknowledge that the 20 per cent reduction estimate is in no way ideal, but does provide a useful
guide to reduce the risk of overestimating gambling costs.
Gambling is likely to result in many harms that co-occur. As with causality, failing to consider
comorbidity is likely to result in a significant overestimation of gambling costs. Many people who
report some adverse outcomes in one area would be likely to experience other, related harms. For
example, those who reported suicidal ideation are also likely to report depression. If unaccounted
for, this can result in double-counting of harms. Therefore, the Productivity Commission (1999)
would exclude the more ‘severe’ cases from estimates for the ‘less’ severe cases. For example,
the estimated number of people with suicidal thoughts would be excluded from the estimates of
those with depression.
The Productivity Commission grouped gambling-related costs into five categories: financial costs,
productivity and employment costs, crime and legal costs, personal and family costs, and
treatment costs. They included costs that were experienced by the gamblers, their families and the
broader community.
Financial costs
Financial costs included debts imposed on others, such as family and friends, financial institutions
and those obtained via informal sources such as loan sharks as a direct result of gambling as well
as the costs associated with bankruptcy. The annual cost of debt transfers resulting from problem
gambling was approximately $26 million. This figure was based on an average debt per person of
$10,044 derived from SCCA data and adjusted for sample and question phrasing. The cost of
bankruptcy was calculated based on the fee structure of the Insolvency and Trustee Service of
Australia ($4000) multiplied by the number of bankruptcies reportedly resulting from problem
gambling (317 per year), amounting to a total annual cost of $1.3 million. It should be noted that
this figure is likely to be unreliable given the legalities of declaring bankruptcy with a recent
gambling history. Furthermore, many bankruptcies are unlikely to generate a fee as they are self-
declared rather than imposed by a third party (PC 1999).
Productivity and employment costs
Productivity and employment costs included productivity loss in the workplace and at home and
the costs associated with changing a jobs as a result of gambling. Productivity loss was valued
based on the average weekly earnings per person per year ($748 per week, $38,600 per year).
This figure was then multiplied by the number of problem gamblers who reported workplace
productivity loss due to gambling in the past 12 months ‘often to always’ (7000 people) for the
lower cost estimate and ‘sometimes to always’ (49,200 people) for the higher cost estimate,
providing a range between $21 million and $51 million per year. As 30 per cent of gamblers were
unemployed, the Productivity Commission (1999) used the same method to determine loss of
productivity at home, providing an estimate of between $7 million and $50 million per year.
In the year 1997–98, 5600 problem gamblers reportedly changed jobs due to their gambling. Lost
income as a result of job change was calculated based on an average period of unemployment
between jobs of six weeks and the average weekly income per person, providing a total annual

The social cost of gambling to Victoria Browne et al.
Victorian Responsible Gambling Foundation Page 15
cost of $24 million. Based on the unemployment benefit payments at the time ($402 per fortnight
for nine weeks for approximately half of those who change jobs), approximately $4.1 million of this
cost was borne by the government4. The cost of job searches were calculated using an estimated
cost of $2357 per person (half the average cost of job searches by major firms) reported by
Dickerson et al. (1998). This provided a total annual cost of job searches resulting from gambling
of $13 million. Staff training and replacement costs were assumed to amount to 10 per cent of the
employer’s annual salary. Based on the average weekly income, staff replacement costs
amounted to a total annual figure of $22 million.
Crime and legal costs
Included in the Productivity Commission’s (1999) framework were the costs associated with theft,
court proceedings, police incidents and imprisonment. Theft was given a lower value of $500 and
higher value of $3225 per incidence based on figures provided by Walker (1997). Based on a
reported 9700 gamblers who committed gambling-related crime, this provided a range from $5
million to $31 million. A further 6300 people reported being involved in police incidents as a result
of their gambling. The cost of police incidents were valued at $510 per incident based on figures
provided by Dickerson et al. (1998), amounting to a total annual cost of $3.2 million. Approximately
700 gamblers reported having been involved in court proceedings as a result of their gambling. A
value of $8000 was given to each case, equating to a total cost of $5.6 million per year.
The final component of crime and legal costs was costs associated with incarceration. A total of
6.4 per cent of gamblers surveyed by the SCCA reported serving a jail term as a result of problem
gambling. After making adjustments for the sample, and assuming incarceration had only occurred
once in the 8.9-year period of gambling problems, the annual number incarcerated as a result of
problem gambling amounted to 336 people. Based on an average jail term of 3.4 months for non-
violent crimes, the Productivity Commission (1999) estimated a total annual cost of $5.1 million per
year.
Personal and family costs
Personal and family costs included the cost of emotional distress to immediate family and parents;
costs associated with depression, suicidal ideation and suicide attempts; financial costs of divorce
and separation; costs of emotional distress associated with relationship breakdown, divorce and
separation; and the cost of gambling-related violence. Values for emotional distress caused by
gambling were based on compensation payments for emotional harm. For minor cases, this
ranged from $5000 to $15,000 per person and from $30,000 to $50,000 per person for more
severe cases. To account for issues associated with causality, the Productivity Commission (1999)
applied a 20 per cent reduction in the number of people estimated to be affected by personal and
family impacts. To avoid double-counting for related impacts (i.e., depression and suicide), the
Productivity Commission (1999) excluded the more extreme group when calculating costing for the
broader category. For example: numbers for divorce and separation were excluded from the
numbers of relationship breakdown; numbers of people reporting suicidal thoughts were excluded
from the number reporting depression; and numbers of attempted suicides were excluded from the
number of people reporting suicidal thoughts.
Emotional distress to immediate family and parents was calculated using data from the SCCA and
therefore the necessary sample-based adjustments were applied, as well as adjustments for
causality (minus 20 per cent). The Productivity Commission (1999) also excluded cases reporting
4 This does not represent an additional cost but a transfer of income loss by the gambler to the government.

The social cost of gambling to Victoria Browne et al.
Victorian Responsible Gambling Foundation Page 16
relationship breakdown or suicide attempts. They then multiplied the remaining cases by average
family size (2.3 excluding the gambler) and average number of parents (1.8), equating to
approximately 151,100 immediate family members. From these calculations, 133,200 parents were
considered likely to have experienced emotional distress as a result of ’their offspring’s gambling.
For immediate family members, the Productivity Commission (1999) applied values based on the
lowest and highest compensation schedules ($5000 and $15,000 respectively), providing a costing
range of emotional distress from $756 million to $2.3 billion. For parents, they used only the lower
range schedule of between $0 and $5000. As the lower value given to emotional distress was
zero, the overall cost ranged from $0 to $666 million for parents.
The Productivity Commission (1999) used two levels of depression severity to determine the
costing range: ‘often’ (n = 49,400) and ‘always’ (n = 21,200). For those who reported experiencing
depression ‘always’, the number of people reporting suicidal thoughts were removed (n = 12,900).
Both calculations were based on a value range of $5000 to $15,000 and causality adjustments
were applied (20 per cent reduction). The two estimates were combined to generate a total annual
cost of gambling-related depression ranging from $231 million to $692 million. After adjusting for
causality and excluding suicide attempts, almost 8000 gamblers had suicidal thoughts caused by
gambling. Using a value range of $15,000 to $30,000, the cost of suicidal contemplation was $120
million to $239 million. The same method was used to determine the cost of suicide attempts
(2348). However, a range of $30,000 to $50,000 was applied. This provided an annual estimated
cost of suicide attempts of $70 million to $117 million. They further considered the impact of these
attempts on immediate family (multiplied by 2.3 and calculated using a range of $15,000 to
$30,000) and parents (multiplied by 1.8 and using a range of $0 to $5000). The cost of suicide
attempts caused by gambling for immediate family was $81 million to $161 million and for parents
ranged between $0 to $21 million.
To determine the number of people adversely affected by relationship breakdown, the Productivity
Commission (1999) excluded the number of divorces and separations (n = 3200) from those
reporting relationship breakdown (n = 39,200), made causality adjustments (20 per cent reduction)
and then doubled the number to account for the second party. This provided an overall figure of
57,600 people affected adversely by the breakdown of a relationship due to gambling. Using a
compensation range of $5000 to $15,000, the total annual cost of emotional distress caused by
gambling-related relationship breakdown ranged from $288 million and $864 million.
The same process was used in determining the cost of divorce and separation (n = 3200) but
figures were multiplied according to the average number of people in a household (3.3) and the
range used was between $15,000 and $30,000 for each affected person. This resulted in an
estimated annual cost of between $126 million and $253 million for emotional distress resulting
from gambling-related divorce and separation. Further, based on a figure of $1100 per case for
legal and procedural fees, the total annual financial cost associated with gambling-related divorce
and separation (n = 2560) amounted to $2.8 million.
The final component of personal and family costs considered by the Productivity Commission
(1999) was the cost of violence resulting from gambling. After making adjustments for sampling
from the SCCA, the average lifespan of problem gambling and causality (20 per cent reduction),
the annual number of violent gambling-related incidences was 551. Using a range of $5000 to
$15,000 to place a value on harm, the estimated cost of gambling-related violence was between
$2.8 million and $8.3 million.

The social cost of gambling to Victoria Browne et al.
Victorian Responsible Gambling Foundation Page 17
Treatment costs
The final category considered by the Productivity Commission (1999) in their costing framework
was costs associated with problem gambling treatment. Government contributions to the treatment
and counselling services for problem gambling were estimated to be $20 million in 1997–98.
Based on the above framework, the Productivity Commission (1999) reported a total annual cost of
problem gambling of between $1.8 billion and $5.6 billion each year (approximately $6000 to
$19,000 per problem gambler per year).
Productivity Commission 2010
The Productivity Commission (2010) sought to provide an ‘up-to-date’ aggregated cost-benefit
analysis of problem gambling in Australia using a similar framework for calculating the benefits and
costs as featured in the commission’s 1999 inquiry. They used data obtained in the 1999 report but
altered the values to account for changes in demand, the prevalence rate of problem gambling,
population growth, household income and inflation. Using the same costings framework as the
1999 inquiry, the social costs of problem gambling fell within the range of $10,000 to $30,000 per
problem gambler per year (excluding financial costs). When considered in conjunction with the
financial losses of problem gamblers (average problem gambling expenditure minus average
gambling expenditure at a level reflective of non-problem play), the overall cost of problem
gambling ranged from $4.7 billion to $8.4 billion. Based on their calculations and consideration of
the benefits, a 10 per cent reduction in the harm experienced by problem gamblers would be likely
to provide an average annual gain of around $470 million (PC 2010).
The Victorian Competition and Efficiency Commission 2012
The VCEC (2012) used a similar framework to that used by the Productivity Commission (1999) in
estimating the cost of problem gambling in Victoria, Australian in 2010–11. They categorised all
impacts as either economic (impacting resources) or social (impacting wellbeing) costs. Economic
costs included direct costs to government, indirect costs, costs to the justice system, costs to
business, and economic costs associated with excess expenditure. Social costs referred to those
associated with mental and physical wellbeing. Data was sourced from the Victorian Gambling
Study (Department of Justice 2009) (problem gamblers, PGSI 8+) and unpublished Gambler’s
Help Data provided by the Victorian Responsible Gambling Foundation. In the absence of Victorian
data, the VCEC (2012) used the Productivity Commission’s data from the 1999 National Gambling
Survey (regular gamblers) and the Survey of Clients of Counselling Agencies (problem gamblers
seeking help). To calculate the costs of each harm they used the same principles as the
Productivity Commission (1999); that is, the cost of the harm multiplied by the number of people
experiencing the harm.
Given that gambling regulation and policy is determined by each state, it was possible for the
VCEC (2012) to provide estimates of the direct costs of problem gambling for the Victorian
Government, local government and the Commonwealth Government rather than just overall
government treatment costs as seen in the Productivity Commission’s 1999 inquiry. The VCEC
used data from the Department of Justice and the Victorian Commission for Gambling and Liquor
Regulation. The total direct cost of gambling incurred by the Victorian Government was $42.1
million, $20 million of which was accounted for by services provided to problem gamblers, their
family and friends. Direct costs of gambling to the Victorian Government include the cost of policy
and regulation (beyond standard fairness and probity procedures), treatments and services for
problem gamblers and affected others; the cost of education and research initiatives; and other
regulatory or policy costs (such as employment for staff associated with problem gambling policy).

The social cost of gambling to Victoria Browne et al.
Victorian Responsible Gambling Foundation Page 18
Direct costs incurred by local government were those associated with policy and research
development, the cost of processing applications for increasing the number of gaming machines
due to consumer demand, and the costs associated with promoting alternative activities to
gambling. The direct cost of gambling to local government was between $0.3 million and $0.7
million. The figure provided for Commonwealth costs was based on predicted future spending for
problem gambling counselling services. The VCEC (2012) estimated the annual cost to the
Commonwealth in relation to Victorian problem gamblers to be $1.6 million.
The VCEC (2012) also considered the indirect costs of problem gambling on health and human
service systems and the justice system. Using human services outputs from the Victorian budget,
the VCEC (2012) identified multiple areas – such as mental health, public housing, homelessness,
child protection and disability services – that were likely to be affected by problem gambling. Based
on problem gambling prevalence in Victoria, the VCEC (2012) estimated the cost of problem
gambling for health and human service systems to be between $6 million and $79 million. The
lower figure was based on the total number of problem gamblers reporting a mental wellbeing cost
(0.05 per cent) and assumes that gamblers are no more or less complex to treat than anyone else.
The upper figure assumes that all problem gamblers have had at least some contact with human
service systems.
Other economic costs included by the VCEC (2012) were featured in the Productivity
Commission’s (1999) costing framework and the VCEC took the same approaches for calculating
their impact. Indirect costs considered were the costs of job change ($12 million), productivity loss
outside of work ($2 million to $4 million), bankruptcy costs ($0.5 million to $6 million), bad debt
costs ($3 million to $37 million) and the financial costs of divorce and separation ($1 million). Other
economic costs which also featured in the Productivity Commission’s (1999) framework were costs
to the justice system ($26 million), including court costs ($1.5 million), police incidents ($1.7
million) and corrections (23.1 million); and to business, including workplace productivity loss ($6
million to $39 million) and the cost of theft (transfer costs of $4 million to $5 million).
The VCEC (2012) incorporated the same harms and used the same approaches as the
Productivity Commission (1999) to calculate social and wellbeing costs. That is, they used the
same adjustments for causality (20 per cent reduction), average lifespan of problem gambling (8.9
years), average household sizes (2.3 excluding gambler) and number of parents (1.8) and the
same compensation schedules converted to 2010–11 prices. They also included the same impacts
to the gambler, immediate family members and parents (depression, suicide, relationship
breakdown including divorce and separation, and family violence). The total annual estimated
wellbeing costs of problem gambling in Victoria ranged from $400 million to $1.2 billion.
Approximately 90 per cent of the cost of emotional distress due to problem gambling is incurred by
immediate family ($340 million to $960 million) and parents (zero to $160 million).
After including the cost of excess spending by problem gambling that amounted to $1.4 billion in
2010–11, the total cost of problem gambling in Victoria in 2010–11 was between $1.5 billion and
$2.8 billion.
The Allen Consulting Group and Co.
The Allen Consulting Group (ACG) (2011) reported on the costs associated with Tasmania’s
gambling industry in 2011. Their methodology was largely consistent with previous attempts in
2008 (The South Australian Centre for Economic Studies 2008) that followed closely the
methodology used by the Productivity Commission (1999; 2010) in their costing frameworks. The
Social and Economic Impact Study of Gambling in Tasmania Survey 2011 was used by the ACG

The social cost of gambling to Victoria Browne et al.
Victorian Responsible Gambling Foundation Page 19
(2011) to determine the prevalence of problem gambling in Tasmania. Using the Problem
Gambling Severity Index (PGSI), the ACG (2011) separated gamblers into two groups: non-
problem/low-risk gamblers and moderate-risk/problem gamblers. Prevalence estimates of the
experience of harms were obtained from the Productivity Commission’s 1999 SCCA. In order to
provide a comprehensive estimation, they provided costings based on the assumption that all
prevalence rates of harm apply to all problem gamblers and gave three estimates based on
prevalence percentages of the experience of harm applying to moderate gamblers at 25 per cent
(narrow approach), 50 per cent (moderate approach) and 75 per cent (broad approach).
The ACG (2011) used the same categorisation as the Productivity Commission (1999) – financial
costs, effects on productivity and employment, crime and legal costs, personal and family impacts
and treatment costs – and measured the same harms as the Productivity Commission (1999)
under each category. These costs were again calculated by multiplying the estimated number of
people experiencing the harm by the estimated cost of the harm, and the same approaches were
used for causality, lifespan of gambling problems and double-counting. Where information specific
to Tasmania was not available, the ACG (2011) used the Productivity Commission’s (1999)
estimates but adjusted the cost to account for inflation to reflect 2011 prices. Based on the three
approaches to the experience of moderate gamblers, the ACG (2011) provided three costing
figures:
Narrow approach: The cost of gambling-related harms in Tasmania in 2011 based on all
problem gamblers and 25 per cent of moderate-risk gamblers experiencing harm was
between $37 million and $104 million.
Moderate approach: The cost of gambling-related harms in Tasmania in 2011 based on all
problem gamblers and 50 per cent of moderate-risk gamblers experiencing harm was
between $51 million and $144 million.
Broad approach: The cost of gambling-related harms in Tasmania in 2011 based on all
problem gamblers and 75 per cent of moderate-risk gamblers experiencing harm was
between $64 million and $184 million.
Around 85 to 90 per cent of these costs fall within the category of personal and family costs. In
particular, costs of emotional distress to parents and immediate family members account for
approximately half of total costs (around 47 to 60 per cent). While these estimates do consider the
cost of harm to those other than problem gamblers, it is difficult to determine which approach
(narrow, moderate or broad) paints the most accurate picture of the costs associated with
moderate-risk gambling.
International approaches
Efforts have been made in Canada and New Zealand to substantiate the costs associated with
gambling problems. In Canada, Anielski and Braaten (2008) developed ‘the ‘Socio-Economic
Impact of Gambling (SEIG) Framework’’. The SEIG framework includes the benefits and costs
associated with gambling problems under six categories – health and wellbeing; economic and
financial; employment and education; recreation and tourism; legal and justice; and culture – and
accounts for the varying levels of impact (individual, household and family, community, regional
and provincial level).
The major difference between the SEIG and the Productivity Commission (1999) costing analysis
is that Anielski and Braaten (2008) included cultural costs such loss of social cohesion (i.e. sense

The social cost of gambling to Victoria Browne et al.
Victorian Responsible Gambling Foundation Page 20
of community, social capital) in a community and accounted for the losses in income and
employment in other areas of entertainment due to legalised gambling development. Impacts such
as employment were argued by the Productivity Commission (1999) to reflect a transfer rather than
a cost or benefit. For instance, the loss of employment in other areas of entertainment would
represent an increase in employment opportunities in the gambling industry.
There have also been efforts made in New Zealand to determine the scope of impacts associated
with gambling problems, with a specific focus on the experience of harm beyond the gamblers
themselves to the community, children and elderly, and the different experiences of ethnic
populations (Centre for Social and Health Outcomes Research and Evaluation 2006, 2008; Wall,
Peter, You, Mavoa & Witten 2010). A methodological approach for quantifying harms to attempt to
establish a dollar value of gambling-related costs in New Zealand has yet to be explored.
What is missing?
It appears that the majority of Australian attempts to quantify the costs of gambling have largely
‘piggy-backed’ off the approaches developed by the Productivity Commission (1999) with only
minor departures or updates in response to new data sources. While consistency can provide the
benefit of being able to draw comparisons between costing outcomes, it does mean that efforts to
consider impacts beyond those traditionally incorporated in costing analyses are largely absent.
Many negative impacts associated with gambling problems have been excluded from a number of
the costing analyses discussed above presents harms within these costing frameworks that have
been identified as being associated with gambling problems but which were excluded from costing
analyses. The most commonly reported barrier to quantifying gambling-related costs is insufficient
data detailing the prevalence and extent of harms (Anielski & Braaten 2008; Dickerson et al. 1998;
PC 1999, 2010; AGC 2011; VCEC 2010). As a result, many harms that have been identified to be
associated with gambling problems are missing from costing analyses while others are calculated
based on assumptions regarding the extent of the harm or causality.
Table 2: Harms excluded from costing analyses identified in impact frameworks according
to the Productivity Commission (1999) categorisation
Category Excluded Impacts
Financial Lost earning or borrowing capacity
Money borrowed to finance spending
Bad debts and associated costs (transfers only)
Indirect costs of property sales
Productivity and employment
Consideration of who is burdened with the cost of productivity losses (employer, employees, colleagues)
Job loss
Crime and justice Costs associated with crime prevention
Personal and family Emotional distress to immediate family and parents caused by moderate problem gamblers
Medical costs associated with conditions
Physical wellbeing costs
Long-term effects on children as a result of family disharmony
Actual suicides
Mild depression (rarely to sometimes)

The social cost of gambling to Victoria Browne et al.
Victorian Responsible Gambling Foundation Page 21
Category Excluded Impacts
Regulation, policy and treatment
Treatment costs provided by voluntary agencies
Treatment costs of private sector treatment providers
Non-government contributions
Research funding
Education funding
Costs on businesses for implementation of gambling-related regulation and voluntary responsible gambling measures
Other Non-regular gamblers or low-risk, non-problem gamblers
Costs experienced in later years from a one-off event
Cultural harms
Sources: ACG 2011; Productivity Commission 1999, 2010; VCEC 2012.
Important methodological considerations
A number of methodological considerations were identified by those who attempted to develop a
framework to quantify the cost of gambling.
1. Comorbidity. Many harms experienced by gamblers as a result of gambling could also occur
due to an existing or subsequent comorbidity. Costings attempts to date have addressed
comorbidity issues by excluding the more ‘severe’ cases when calculating estimates for the ‘less’
severe (e.g., excluding the prevalence of suicidal thoughts from estimates of depression). While
this approach does avoid issues with double-counting, it is unlikely this all-or-nothing approach will
deliver an accurate depiction of gambling harms. Focusing on the total prevalence does not take
into account the relative degree or marginal effect of one harm on another. Such an approach is
likely to result in an overestimation of comorbidity and therefore an underestimation of the costs,
as harms that may only have limited comorbidity are excluded from the costing analyses.
2. Causality. Determining whether the harm was caused only by gambling problems is
challenging. Current methods of measuring harms often fail to establish causality due to the lack of
longitudinal data and dominance of cross-sectional survey methods. The high rate of comorbidity
associated with gambling, the dominant focus on only ‘clinical’ cases of ‘problem gambling’ and
methodological constraints in establishing the sequence of incidence make it difficult to determine
what proportion of the harm is attributable to gambling and what proportion may have been a result
of other, confounding issues (PC 1999, 2010; VCEC 2012).
In order to be considered a harm caused by gambling, it needs to be determined whether or not
the harm would have occurred in the absence of gambling. Failing to identify whether a harm pre-
dated the gambling behaviour is likely to contribute to an overestimation of gambling costs, as
impacts not caused by gambling are likely to be included (PC 1999). The 80 per cent estimate of
causality generated by the Productivity Commission (1999) has been adopted by others due to a
lack of an alternative. The VCEC (2012) states: ‘The feasibility of applying a more sophisticated
adjustment procedure was investigated, but a paucity of data precluded its application.’ (Appendix
B, p. 47).
The PC (1999) suggested many methods for establishing causation, none of which can be applied
retrospectively to pre-existing data on gambling-related harms. For instance, longitudinal studies of
gamblers would provide a more detailed account of the progression of the harms of gambling,
allowing researchers to track and explore how harms are developed or exacerbated over the
lifetime a gambling problem. However, such studies are costly and obtaining a large sample

The social cost of gambling to Victoria Browne et al.
Victorian Responsible Gambling Foundation Page 22
representative of a general population of gamblers is impractical and prone to significant attrition
rates.
Self-assessment methods are likely to be the most efficient and practical way of measuring
causality. However, harms resulting from gambling are at risk of being underreported due to the
stigma associated with gambling problems, and there is also a need for gamblers to be self-aware
of how and when harms were first experienced in relation to comorbidities and other social
determinants of health. Causality is a major limitation associated with any costing methodology
and significant resources are required to investigate an alternative approach to that adopted in
current costing attempts.
3. Self-report measures. Costing methodologies to date have relied largely on self-report
measures that are notoriously unreliable, given the tendency for people to exaggerate, forget or
misjudge the severity of their experiences of harm. Misrepresentation of causation or the sequence
of events, or underreported consequences experienced as a result of gambling (due to the stigma
associated with gambling) are all likely to impact the accuracy of costing estimates (PC 1999).
The Productivity Commission (1999) reported that prior to seeking help, problem gamblers indicate
that they would be unlikely to answer a survey honestly. Thirty-eight per cent believed they would
answer honestly compared to forty-five per cent who indicated they would hide their problem to
some extent. When dealing with vulnerable groups that are engaging in what may be considered
by others as ‘deviant’ or ‘unacceptable’ behaviours, it is necessary to consider the issues of stigma
and social desirability and the impact this is likely to have on results.
4. Focus on problem gambling. Costing frameworks that focus solely on the reports of problem
gamblers disregard the harms experienced by those who may be moderate- or low -risk gamblers.
While the Productivity Commission (1999) used a general population sample of regular gamblers,
this technique does not allow for discussion of the unique contributions of varying levels of
gambling severity. Recently, a strong case has been made for the position that harm is not
experienced only by those experiencing a clinical level of gambling problems (Browne et al. 2016).
The Productivity Commission (1999) suggests that while the severity or prevalence of harm may
be lower in non-problem gambling populations, the total number of people experiencing some
harm is in the tens of thousands of people. It is therefore likely that costing frameworks that do not
include non-problem, low-risk and moderate-risk gamblers are significantly underestimating the
overall social and economic costs of gambling.
5. Assessing the severity of gambling. Several authors noted that different measures of
gambling severity are likely to influence prevalence rates of problem gambling and therefore alter
the prevalence of impacts included in the cost analysis (PC 1999, 2010; VCEC 2012). The
Productivity Commission (2010) specifically drew comparisons between the SOGS and the
Canadian Problem Gambling Index (CPGI), as it was suggested that the SOGS classifies more
people as problem gamblers than the CPGI. The Productivity Commission (1999, 2010) further
suggested that the extent of harm experienced by those who meet the criteria for problem
gambling on the SOGS but not the CPGI would be more likely to experience less harm than those
who met the CPGI alone. Similar issues were raised by the VCEC (2012) regarding the PGSI
generating false positive and false negative problem gambling classifications. The overall cost
analysis would therefore differ depending on which measure was used. To counteract these
issues, costing analyses have focused predominantly on those scoring at the severe end of
problem gambling measures in order to minimise the likelihood of false positives.

The social cost of gambling to Victoria Browne et al.
Victorian Responsible Gambling Foundation Page 23
6. Cultural differences. It has been shown that different cultural groups experience harm differently and to different extents due to cultural values and practices, socioeconomic and political status within society, and acculturation and migration processes that have contributed to deprivation and a lack of representation (Clarke et al. 2006; Raylu & Oei 2004; Rintoul, Livingstone, Mellor & Jolley 2013). Many large population studies such as those used in the aforementioned costings frameworks tend not to take into consideration the costs to different subgroups. A major limitation of these approaches is that it is assumed all harms are experienced equally. Given the over-representation of Aboriginal and Torres Strait Islander and minority groups who classify as problem gamblers, making assumptions that everyone experiences harms the same way may attribute significant monetary costs to harm that are not experienced as intensely for some compared to others, despite them sharing ‘problem gambling’ status.
Some culturally and linguistically diverse (CALD) communities and Aboriginal and Torres Strait Islander groups are also likely to be affected in ways that tend not to be measured in prevalence and gambling harm studies and may not be experienced by those from western cultures. For instance, problem gambling that disrupts family life and community connections may impede the transfer of cultural knowledge, stories and wisdom that are key to the legacy of Aboriginal and Torres Strait Islander culture. The impact of these types of harms are not homogenous between cultural groups. Another issue is that many Aboriginal and Torres Strait Islander cultures incorporate large family units beyond the traditional western perception of family size. Therefore, the ‘average’ family size of 2.3 is unlikely to be an accurate depiction of the number of people affected by a person’s gambling in Aboriginal and Torres Strait Islander family units.
7. Using treatment-seeking populations. Those seeking treatment make up a small portion of problem gamblers (Productivity Commission 1999). It is likely that the prevalence and severity of harms is higher in treatment groups as it is often these harms that motivate people to seek help (Browne et al. in press; Li et al. 2017). Costing analyses may therefore overstate the costs of gambling for the wider problem gambling community if these differences are inadequately addressed (Productivity Commission 1999).
Discussion
Defining and measuring gambling-related harms is a contentious issue in the gambling literature (Walker 2007). The systematic literature review aimed to determine the current state of knowledge regarding the harms associated with gambling. Impacts of harmful gambling were reviewed using the domains identified by Langham et al. (2016) and included the impacts on individuals, affected others and the community. Just over half of the research on gambling-related harm from the systematic review was conducted in the USA and Australia, and three-quarters was conducted between 2012 and 2014. Individual level harms to the gambler dominated the research, with little direct focus on the harms to others close to the gambler. Community level harms from gambling were mainly measured in broad terms of the impact on household income, unemployment rates, gambling expenditure, criminal activity and Aboriginal and Torres Strait Islander communities. Of the gambling-related harm domains, the majority of papers were focused on financial, emotional or psychological distress, or relationship and health impacts. However, none of the papers from the systematic literature review attempted to place a monetary cost on gambling-related harms.
The second part of this review explored approaches used to quantify gambling-related harms to provide an aggregate financial cost of problem gambling in both Australia (PC 1999, 2010; ACG 2011; VCEC 2012) and Canada (Anielski & Braaten 2008). Only three recent Australian attempts have been made to quantify problem gambling (PC 2010; ACG 2011; VCEC 2012). All of these
The social cost of gambling to Victoria Browne et al.
Victorian Responsible Gambling Foundation Page 24
attempts were based on the costing framework developed by the Australian Productivity
Commission (1999) as a foundation for cost estimates. As noted above, the Productivity
Commission’s (1999) approach to estimate costs has been well-regarded and often emulated,
having been described as ‘the most competent of the studies that have so far attempted to
quantitatively estimate the social costs of problem gambling’ in Australia (Eadington 2004).
Costs were categorised by the Productivity Commission (1999) into five broad classes: financial
costs (family debts and bankruptcy); effects on productivity and employment (productivity loss and
job change); crime (theft, court cases and imprisonment); personal and family impacts (distress of
family and parents; relationship breakdown, divorce and separation; violence; depression and
suicide); and treatment costs (gambling counselling services). The prevalence of the harm was
then multiplied by the number of people experiencing the harm making adjustments for causality,
problem gambling duration and number of affected others.
Those who have discussed or attempted to quantify the costs of gambling have conceded that
there is not a one-size-fits-all approach to quantifying gambling costs (Anielski & Braaten 2008;
ACG 2011, 2014; Productivity Commission 1999, 2010; Williams, Rheum & Stevens 2011).
Rather, the methodology used to calculate the costs is largely dependent on the data available and
by making informed judgements about the extent, severity and subsequent value placed on
intangible impacts (VCEC 2012).
While the limitations and the methodological considerations regarding these frameworks have
already been mentioned, there are some notable limitations deserving further discussion. Firstly,
the majority of these costing analyses fail to include gamblers who are not categorised as a
problem gamblers. While non-problem and low-risk gamblers may not experience harms to the
same extent as problem gamblers, increased prevalence of low-level harms is likely to lead to a
significant cost that is largely missing in costing studies. Previous implementations also fail to
account for how harms may be experienced differently by different cultural groups. While the
Canadian SEIG framework attempted to broaden the perspective of community harm by including
cultural losses such as loss of social cohesion, this has yet to be attempted in Australia.
Methodological challenges in quantifying the costs identified in the literature revolved around the
limited availability of data that:
(a) (a) illustrates the relationship of the cost with gambling and
(b) (b) describes the extent to which the harm is experienced by the gambler, affected others
and the community.
Researchers were often required to make adjustments or assumptions based on theoretical
approaches in order to account for causality or comorbidity.
Large-scale longitudinal studies have been proposed as the most effective means for obtaining
quality data that may reliably provide insights into the extent and experience of harm resulting from
gambling (Productivity Commission 1999; VCEC 2012). While this method would also provide
insights into harms that may occur after a person stops gambling, it is also highly impractical and
obtaining a precise estimation of social costs may be impossible by any other means (Chang et al.
2010). However, recourse can be made to direct methods for assuming causality, e.g. asking
survey respondents to report only those harms they believe arose as a consequence of gambling
(Browne et al. 2016) and using behavioural economic methods.

The social cost of gambling to Victoria Browne et al.
Victorian Responsible Gambling Foundation Page 25
Other challenges identified including assessing differential impacts on different groups;
consistency issues with defining costs; and difficulties in measurement methodology, including the
valuation of intangible costs. Intangible costs were deemed difficult to quantify as in order to obtain
a cost estimate, researchers were required to determine the economic value based on
assumptions or tentative comparisons between the harm experienced by gambling and the value
placed on the harm in other areas (i.e., compensation claims for emotional distress). Central
issues remain unresolved, most notably the issues of sourcing reliable data for a range of social or
intangible costs and how to provide an accurate representation of their value to provide an overall
economic figure of gambling cost. The inclusion of harms in costing analysis has largely relied on
the data available, resulting in many known gambling-related harms being excluded from costing
analyses (Anielski & Braaten 2008).
Policy implications
A standardised comprehensive methodology for quantifying gambling-related harm would enable
comparisons of costs across different populations to provide a more accurate depiction of the cost
of gambling harms. There is a need for a universally accepted approach that systematically and
reliably equates economic values to intangible harms, considers causality and comorbidity, and
accounts for the harms beyond those considered to date. This will support the comparison of
impacts between different populations and time frames, and help to determine the return on
investment of future harm minimisation strategies. This starts with the development of a
comprehensive framework detailing the impact of gambling-related harms, with clear operational
definitions (Anielski & Braaten, 2008).
Conclusion
The negative consequences of gambling are complex and multifaceted, occurring in almost all
domains of the life of the gambler and those close to them, as well as in the community at large.
This makes the quantification of gambling-related impacts and the subsequent calculation of the
aggregate social of cost of gambling a challenging task. Limitations in our knowledge, particularly
with respect to prevalence, comorbidity and causality (or attributable fraction), creates uncertainty
in estimating the social cost of gambling. Further, assumptions regarding the value of intangible
costs must also be made; with the result that any costing is influenced by the value judgements of
its society, and perhaps also the researchers involved.
However, the range of impacts of gambling have been quite comprehensively explored and
credible attempts at costings – most notably by the Australian Productivity Commission (1999) –
have been implemented. The research area would benefit from greater adherence to a common
set of terminology and concepts, and a common model for approaching the costing of gambling-
related harms. This would help make explicit the assumptions and approximations in a given
costing model and promote the reconciliation of any differences in approach. Despite the
conceptual, empirical and methodological challenges, an appropriate costing of the impact of
gambling is a feasible objective, with clear and significant benefits for gambling policy
development.

The social cost of gambling to Victoria Browne et al.
Victorian Responsible Gambling Foundation Page 26
Phase 2: The social cost of gambling to Victoria
Introduction
Gambling-related harm imposes both direct and indirect costs on the gambler, members of their familial and social networks (‘affected others’), the community and the Victorian Government. Direct costs include the costs to the Victorian Government of policy, regulation and research on problem gambling, costs to local government, and treatment costs for problem gambling. Indirect costs are harder to measure, and include costs of excessive expenditure on gambling, bankruptcy, illegal offshore gambling, and emotional or psychological costs to the gambler, which include depression, suicide attempts and ideation, and experiences of violence. These costs also extend to affected others in the form of divorce or separation, experiences of violence, emotional distress and, in extreme cases, the impact of suicide attempts or fatality by suicide. Costs also extend to third parties and the community in the form of productivity loss and work impacts, the cost of crime to businesses and the Victorian justice system, and costs to the health and human service sector, the mental health sector and homelessness services.
As discussed in the literature review of this report, previous attempts to calculate the costs of gambling have focused only on the costs associated with problem gambling, which corresponds to a small percentage of the population (0.8 per cent in Victoria) who meet this criterion through population screens. However, a recent study by Browne and colleagues (2016) has shown that problem gamblers only account for around 15 per cent of the total years of healthy life lost due to gambling-related harms in the Victorian adult population, while the moderate- and low-risk groups account for the majority of harms (35 per cent and 50 per cent respectively). In addition, gambling-related harms are being experienced by others close to the gambler (‘affected others’) by various degrees based on problem gambling severity. It is estimated that for every problem gambler, six others are typically affected by their gambling, while gamblers at moderate risk impacted three others, and low-risk gamblers one other (Goodwin et al. 2017).
The purpose of this phase of the project is to estimate the cost of gambling-related harm at all severity levels (low-risk, moderate-risk and problem gambling) to Victoria in the 2014–15 financial year. The methodology has been adapted from previous costing studies, including those by the Productivity Commission (PC 1999; 2010) and the Victorian Competition and Efficiency Commission (VCEC 2012). The main departure in the current estimates has been the utilisation of a more robust and representative source of prevalence figures of gambling-related harm across the various costing items.
The methodology section of this report summarises the steps taken in estimating the costs of each gambling-related harm item, including the data sources for prevalence figures and cost assumptions used in the calculations. The results section provides a summary of the estimates of the total costs of gambling and a breakdown of the cost estimates by costing item and PGSI category (where applicable). A comparison of our findings to the costs of alcohol, tobacco and illicit drugs and the implications for future policies and research on gambling-related impact are discussed in the final section of the report.

The social cost of gambling to Victoria Browne et al.
Victorian Responsible Gambling Foundation Page 27
Methodology
Methodological considerations
Several methodological assumptions were used in deriving estimates of the cost of gambling-
related harm in Victoria. These are outlined below:
The approach adopted an existing gambling framework that included gambling-related
harms across a range of domains including:
o financial
o emotional and psychological
o relationships and family
o crime
o productivity loss and work
o the cost to the Victorian Government.
Three gambling categories were considered: low-risk, moderate-risk and problem
gambling.
Where appropriate, prevalence data were taken from a recent study conducted by Browne
and colleagues (2016).
For each item, a three-step costing process was followed: identification, measurement and
evaluation.
Cost estimates were derived using multiple data sources; where data may be lacking,
conservative assumptions were derived using expert opinion or previous methods.
Costs are presented in Australian dollars for the reference year 2014–15. If 2014–15 price
weights were not available, the Consumer Price Index (CPI) was used to adjust costs to
2014–15 dollars..
The costing methods are based on accepted techniques; where differences in costing
methodology is applied, rationale and justification are provided.
An ‘average’ cost estimate per item was adopted and a conservative (i.e. lower) estimate
was employed where there was uncertainty. Low and high cost estimates are presented
only when there is uncertainty in a parameter that significantly affects the estimate.
Where appropriate, double-counting was avoided by following the procedures applied in
previous costings.
Where applicable, an 80 per cent counterfactual was applied to prevalence numbers in
accordance with the approach used by the Productivity Commission (1999) and the VCEC
(2012).
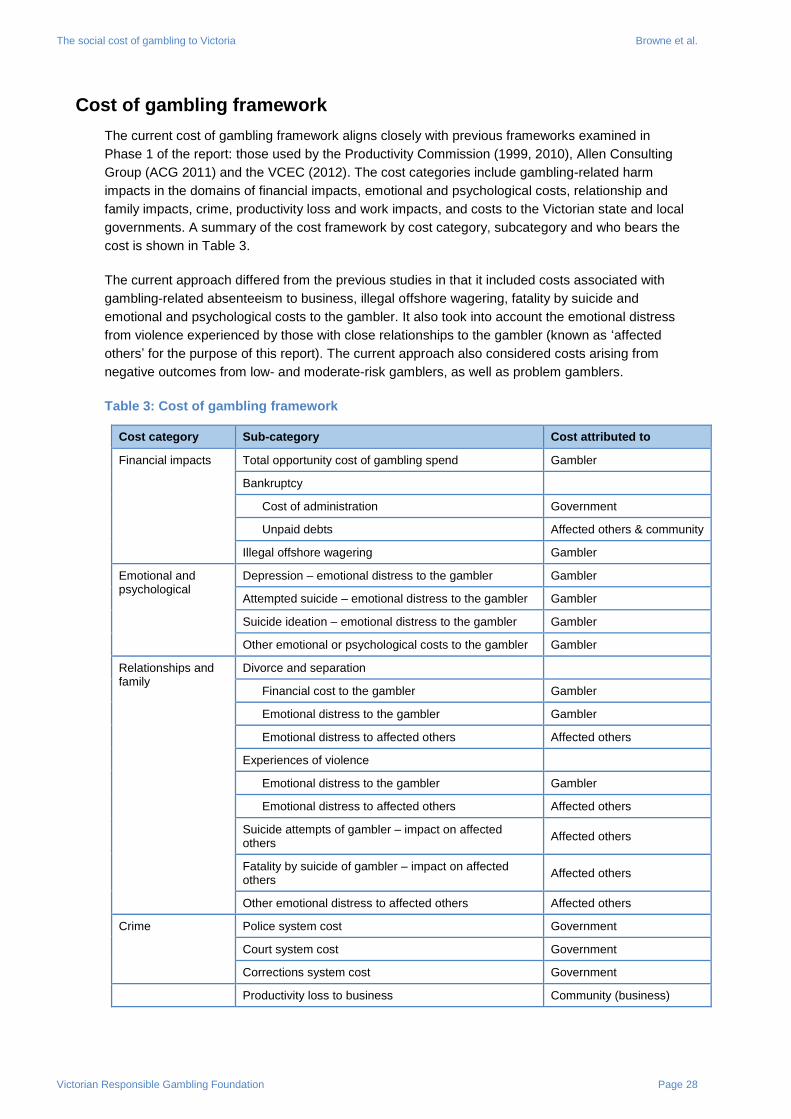
The social cost of gambling to Victoria Browne et al.
Victorian Responsible Gambling Foundation Page 28
Cost of gambling framework
The current cost of gambling framework aligns closely with previous frameworks examined in
Phase 1 of the report: those used by the Productivity Commission (1999, 2010), Allen Consulting
Group (ACG 2011) and the VCEC (2012). The cost categories include gambling-related harm
impacts in the domains of financial impacts, emotional and psychological costs, relationship and
family impacts, crime, productivity loss and work impacts, and costs to the Victorian state and local
governments. A summary of the cost framework by cost category, subcategory and who bears the
cost is shown in Table 3.
The current approach differed from the previous studies in that it included costs associated with
gambling-related absenteeism to business, illegal offshore wagering, fatality by suicide and
emotional and psychological costs to the gambler. It also took into account the emotional distress
from violence experienced by those with close relationships to the gambler (known as ‘affected
others’ for the purpose of this report). The current approach also considered costs arising from
negative outcomes from low- and moderate-risk gamblers, as well as problem gamblers.
Table 3: Cost of gambling framework
Cost category Sub-category Cost attributed to
Financial impacts Total opportunity cost of gambling spend Gambler
Bankruptcy
Cost of administration Government
Unpaid debts Affected others & community
Illegal offshore wagering Gambler
Emotional and psychological
Depression – emotional distress to the gambler Gambler
Attempted suicide – emotional distress to the gambler Gambler
Suicide ideation – emotional distress to the gambler Gambler
Other emotional or psychological costs to the gambler Gambler
Relationships and family
Divorce and separation
Financial cost to the gambler Gambler
Emotional distress to the gambler Gambler
Emotional distress to affected others Affected others
Experiences of violence
Emotional distress to the gambler Gambler
Emotional distress to affected others Affected others
Suicide attempts of gambler – impact on affected others
Affected others
Fatality by suicide of gambler – impact on affected others
Affected others
Other emotional distress to affected others Affected others
Crime Police system cost Government
Court system cost Government
Corrections system cost Government
Productivity loss to business Community (business)

The social cost of gambling to Victoria Browne et al.
Victorian Responsible Gambling Foundation Page 29
Cost category Sub-category Cost attributed to
Productivity loss and work impacts
Cost of job loss
Loss of income Gambler
Job search cost to the gambler Gambler
Employer staff replacement costs Community (business)
Unemployment benefits Government
Cost of absenteeism to business Community (business)
Cost of crime to business Community (business)
Cost of fatality by suicide
Community (business) and government
Cost to Victorian Government
Policy, regulation, research (including treatment funding)
Government
Direct costs to local governments in Victoria Government
Health and human services systems Government
Mental health sector Government
Homelessness services Government
Data sources
Three key data source types are required to calculate the cost of gambling for each category:
Victorian population prevalence
prevalence of cost item
average cost per item.
Where possible, data was sourced for the 2014–15 financial year. Where this was not available,
most recent information was preferred.
Prevalence estimates
Data on the prevalence of problem gambling severity in Victoria was sourced from the 2014
Victorian Gambling and Health Study weighted dataset which was produced on behalf of the
Victorian Responsible Gambling Foundation (VRGF) and the Victorian Department of Justice and
Regulation (DJR) (Hare 2015). Table 4 summarises the prevalence and estimated total of the
Victorian population in 2014 by problem gambling severity (PGSI). While non-gamblers and non-
problem gamblers are present in the table, they were excluded from the cost analysis. That is, it
was assumed that no costs arose from gambling associated with non-problem gamblers. This may
not necessarily be the case, but given the lack of research on harms to non-problem gamblers, it
would appear to be an appropriately conservative stance.

The social cost of gambling to Victoria Browne et al.
Victorian Responsible Gambling Foundation Page 30
Table 4: Prevalence of gambling in Victoria by problem gambling severity (PGSI)
Problem gambling severity index (PGSI) Prevalence in Victorian
population (%) Estimated number in Victorian population
Non-gambler (last 12 months) 29.9% 1,312,769
Non-problem gambler (0 score) 57.6% 2,528,381
Low-risk gambler (1–2 score) 8.9% 391,206
Moderate-risk gambler (3–7 score) 2.8% 122,667
Problem gambler (8+ score) 0.8% 35,415
Total 100.0% 4,390,438
Source: Victorian Gambling and Health Study 2014 weighted dataset (Hare 2015)
One of the weaknesses of previous gambling cost studies, such as those by VCEC (2012) and the
PC (1999, 2010) was sourcing prevalence estimates from unrepresentative samples for some cost
estimates, such as populations seeking treatment for gambling problems. Another limitation was
the use of out-dated prevalence figures, often replicated from the 1999 Productivity Commission
study report. In many cases, more recent and better quality prevalence estimates are now
available. Thus, the current cost analysis aims to source prevalence figures by cost items which
are as current and representative as possible.
A major data source for the prevalence of negative gambling impacts was a study conducted
recently by Browne et al. (2016), which measured 72 gambling-related harms reported by a large
national Australian sample of gamblers and affected others. Browne et al. (2016) data is not
population representative; rather, it was a convenience sample, stratified so as to provide
approximately equal groups with respect to PGSI category. Therefore, where it is applied, this
‘gambling-related harms’ data was used as prevalence rates for individual cost items broken down
by PGSI category, which was then applied to population-representative estimates of PGSI
categories (Table 4).
The gambling-related harm items cover six domains: financial, emotional and psychological,
relationships, health, work and study, and other impacts such as crime and experiences of
violence. See Appendix 2 for the gambling-related harms study questionnaire (Browne et al.
(2016). In the instance that a cost item could not be matched to a harms item, prevalence data was
sought from other academic research, back-calculated from actual figures (e.g. people using the
Victorian mental health system), or sourced from previous gambling cost studies.
Table 5 provides the prevalence estimates by problem gambling severity (PGSI) for each
gambling-related harm cost item used in the calculations of gambling costs.

The social cost of gambling to Victoria Browne et al.
Victorian Responsible Gambling Foundation Page 31
Table 5: Prevalence estimates and data sources for cost items by problem gambling severity (PGSI)
Item Low-risk gamblers
(PGSI 1–2)
Moderate-risk gamblers (PGSI
3–7)
Problem gamblers (PGSI 8+)
Prevalence description Sources
Estimated % of Victorian population 2014–15
8.9% 2.8% 0.8% Problem gambling severity index (PGSI) – prevalence (%) in Victorian population 2014–15
Victorian Gambling and Health Study 2014 weighted dataset (Hare 2015, Table 1)
Estimated total adult Victorian population 2014–15
391,206 122,667 35,415 Problem gambling severity index (PGSI) – estimated total in Victorian population 2014–15 (of 4,390,438)
Victorian Gambling and Health Study 2014 weighted dataset (Hare 2015)
Estimated number of ‘affected others’ by gambler in Victorian population 2014–15 (of 4,390,438)
391,206 368,001 212,493 Estimated number of Victorian population 2014–15 (of 4,390,438)
Victorian Gambling and Health Study 2014 weighted dataset (Hare 2015)
Ratio of gambler to others affected (low-risk: 1; moderate-risk: 3; problem: 6) and affected others data for level of emotional or psychological impact from gambler (Goodwin et al. 2017)
Financial
Total opportunity cost of gambling spend
29.7% 30.0% 40.2% Increased per person spend by problem gambling risk category over that of non-problem gamblers
Victorian Gambling-Related Harms Study (Browne et al. 2016) national survey dataset – financial harms. Prevalence figures represent percentage of the total opportunity cost of gambling spend.
Victorian Gambling and Health Study 2008 weighted dataset (Hare 2009) – average expenditure by PGSI
Bankruptcy 0.0% 0.7% 7.0% % of PGSI group whose gambling contributed to or caused bankruptcy (12-month period)
Victorian Gambling-Related Harms Study (Browne et al. 2016, Table 9) national survey dataset, variable Q5a_4 (see Appendix 2 of this report)
Illegal offshore wagering
N/A N/A N/A Not applicable: all expenditure on illegal offshore wagering included in cost estimate
Not applicable: all expenditure on illegal offshore wagering included in cost estimate
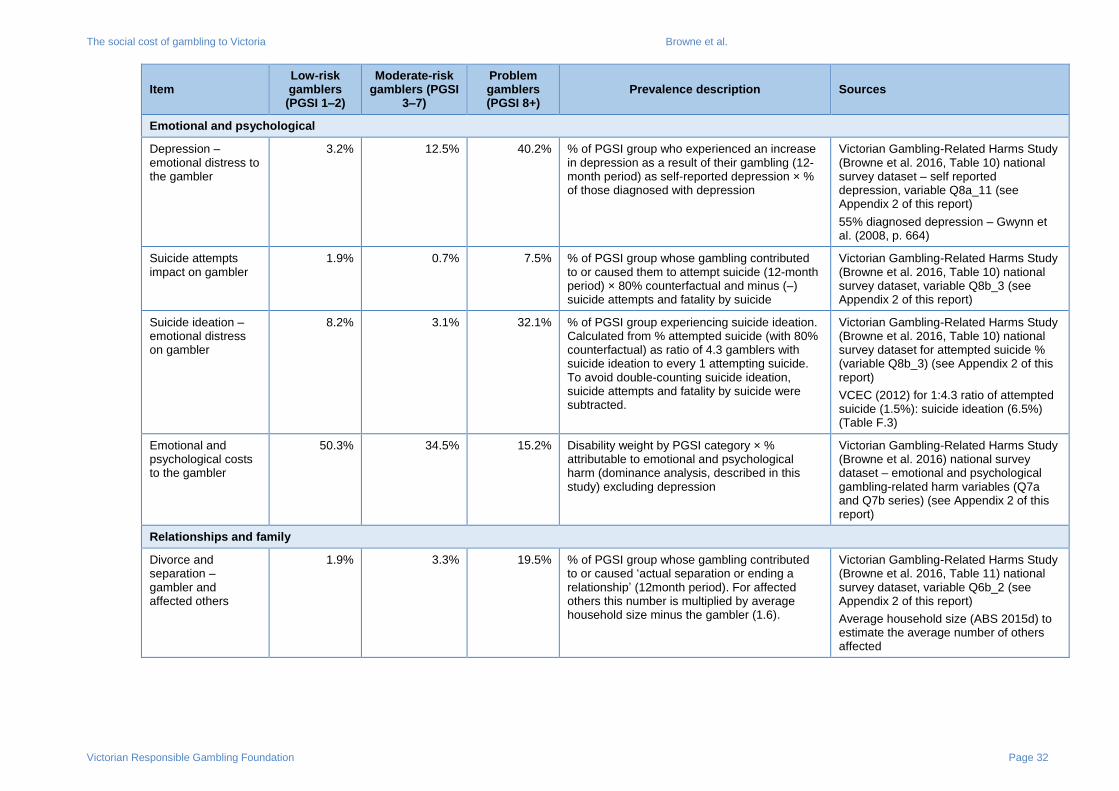
The social cost of gambling to Victoria Browne et al.
Victorian Responsible Gambling Foundation Page 32
Item Low-risk gamblers
(PGSI 1–2)
Moderate-risk gamblers (PGSI
3–7)
Problem gamblers (PGSI 8+)
Prevalence description Sources
Emotional and psychological
Depression – emotional distress to the gambler
3.2% 12.5% 40.2% % of PGSI group who experienced an increase in depression as a result of their gambling (12-month period) as self-reported depression × % of those diagnosed with depression
Victorian Gambling-Related Harms Study (Browne et al. 2016, Table 10) national survey dataset – self reported depression, variable Q8a_11 (see Appendix 2 of this report)
55% diagnosed depression – Gwynn et al. (2008, p. 664)
Suicide attempts impact on gambler
1.9% 0.7% 7.5% % of PGSI group whose gambling contributed to or caused them to attempt suicide (12-month period) × 80% counterfactual and minus (–) suicide attempts and fatality by suicide
Victorian Gambling-Related Harms Study (Browne et al. 2016, Table 10) national survey dataset, variable Q8b_3 (see Appendix 2 of this report)
Suicide ideation – emotional distress on gambler
8.2% 3.1% 32.1% % of PGSI group experiencing suicide ideation. Calculated from % attempted suicide (with 80% counterfactual) as ratio of 4.3 gamblers with suicide ideation to every 1 attempting suicide. To avoid double-counting suicide ideation, suicide attempts and fatality by suicide were subtracted.
Victorian Gambling-Related Harms Study (Browne et al. 2016, Table 10) national survey dataset for attempted suicide % (variable Q8b_3) (see Appendix 2 of this report)
VCEC (2012) for 1:4.3 ratio of attempted suicide (1.5%): suicide ideation (6.5%) (Table F.3)
Emotional and psychological costs to the gambler
50.3% 34.5% 15.2% Disability weight by PGSI category × % attributable to emotional and psychological harm (dominance analysis, described in this study) excluding depression
Victorian Gambling-Related Harms Study (Browne et al. 2016) national survey dataset – emotional and psychological gambling-related harm variables (Q7a and Q7b series) (see Appendix 2 of this report)
Relationships and family
Divorce and separation – gambler and affected others
1.9% 3.3% 19.5% % of PGSI group whose gambling contributed to or caused ‘actual separation or ending a relationship’ (12month period). For affected others this number is multiplied by average household size minus the gambler (1.6).
Victorian Gambling-Related Harms Study (Browne et al. 2016, Table 11) national survey dataset, variable Q6b_2 (see Appendix 2 of this report)
Average household size (ABS 2015d) to estimate the average number of others affected

The social cost of gambling to Victoria Browne et al.
Victorian Responsible Gambling Foundation Page 33
Item Low-risk gamblers
(PGSI 1–2)
Moderate-risk gamblers (PGSI
3–7)
Problem gamblers (PGSI 8+)
Prevalence description Sources
Experiences of violence – gambler and affected others
0.6% 1.3% 9.9% % of PGSI group whose gambling contributed to or caused them to have experiences with violence (including family/domestic violence) (12-month period). For affected others this number is multiplied by average household size minus the gambler (1.6)
Victorian Gambling-Related Harms Study (Browne et al. 2016, Table 11) national survey dataset, variable Q10b_4 (see Appendix 2 of this report)
Average household size (ABS 2015d) to estimate the average number of others affected
Suicide attempts of gambler – impact on affected others
1.9% 0.7% 7.5% % of PGSI group whose gambling contributed to or caused them to attempt suicide (12month period) × 6 (average number of others affected)
Victorian Gambling-Related Harms Study (Browne et al. 2016, Table 10) national survey dataset, variable Q8b_3 (see Appendix 2 of this report)
Average number of persons affected by suicide (Beautrais 2004; ConNetica 2016)
Fatality by suicide of gambler – impact on affected others
1.9% 0.7% 7.5% % of PGSI group whose gambling contributed to or caused them to attempt suicide (12-month period) / 15 (attempted suicides that result in fatality) × 6 (average number of others affected)
Victorian Gambling-Related Harms Study (Browne et al. 2016, Table 10) national survey dataset, variable Q8b_3 (see Appendix 2 of this report)
Average number of persons affected by suicide (Beautrais 2004; ConNetica 2016)
Other emotional distress to affected others
6.5% 16.4% 53.9% Ratio of others affected by PGSI group (of gambler) minus impacts to affected others already accounted for (divorce/separation, experiences of violence, suicide attempts of gambler, fatality by suicide of gambler) × % affected others by PGSI group (of gambler) reporting moderate-major emotional or psychological impact from the gambler
Victorian Gambling-Related Harms Study (Browne et al. 2016) national survey dataset, variable Q7c (see Appendix 2 of this report)
Ratio of gambler to others affected (low-risk: 1; moderate-risk: 3; problem: 6) and affected others data for level of emotional or psychological impact from gambler (Goodwin et al. 2017)
Crime – Cost to the Victorian justice system
Crime 1.3% 4.7% 21.9% % of PGSI group who committed a serious crime as a result of their gambling (12-month period) – either ‘petty theft or dishonesty in respect to government, businesses or other people (not family/friends)’ or ‘felt compelled or forced to commit a crime or steal to fund gambling or pay debts’
Victorian Gambling-Related Harms Study (Browne et al. 2016, Table 11) national survey dataset, variables Q10b_1 and Q10b_2 (see Appendix 2 of this report)

The social cost of gambling to Victoria Browne et al.
Victorian Responsible Gambling Foundation Page 34
Item Low-risk gamblers
(PGSI 1–2)
Moderate-risk gamblers (PGSI
3–7)
Problem gamblers (PGSI 8+)
Prevalence description Sources
Police system cost 0.5% 1.7% 8.0% % of PGSI group who committed a crime which resulted in being investigated by the police
VCEC (2012, Table E.2), as sourced from PC (1999) – 36.5% of total crimes committed result in a police investigation
Court system cost 0.4% 1.5% 6.9% % of PGSI group who committed a crime which resulted in police bringing criminal charges and a subsequent court appearance
VCEC (2012, Table E.2), as sourced from PC (1999) – 86.3% of total crimes committed which resulted in a police investigation result in criminal charges and a court appearance
Corrections system cost
0.2% 0.6% 2.8% % of PGSI group who committed a crime which resulted a court appearance resulting in a prison sentence
VCEC (2012, Table E.2), as sourced from PC (1999) – 40.5% of total committing crime and appearing in court on charges result in a prison sentence
Productivity loss and work impacts
Productivity loss to business
3.2% 12.5% 30.4% % of PGSI group who experienced reduced performance at work or study as a result of their gambling (12-month period)
Victorian Gambling-Related Harms Study (Browne et al. 2016, Table 9) national survey dataset, variable Q9a_1 (see Appendix 2 of this report)
Cost of job change 0.0% 1.7% 11.1% % of PGSI group whose gambling contributed to or caused them to lose their job (12-month period)
Victorian Gambling-Related Harms Study (Browne et al. 2016, Table 9) national survey dataset, variable Q9b_1 (see Appendix 2 of this report)
Cost of absenteeism to business
1.9% 4.6% 21.7% % of PGSI group who experienced an absence from work or study as a result of their gambling (12-month period)
Victorian Gambling-Related Harms Study (Browne et al. 2016, Table 9) national survey dataset, variable Q9a_3 (see Appendix 2 of this report)
Cost of crime to business
0.6% 3.0% 12.3% % of PGSI group who committed a ‘petty theft or dishonesty in respect to government, businesses or other people (not family/friends)’
Victorian Gambling-Related Harms Study (Browne et al. 2016, Table 11) national survey dataset, variable Q10b_1 (see Appendix 2 of this report)

The social cost of gambling to Victoria Browne et al.
Victorian Responsible Gambling Foundation Page 35
Item Low-risk gamblers
(PGSI 1–2)
Moderate-risk gamblers (PGSI
3–7)
Problem gamblers (PGSI 8+)
Prevalence description Sources
Fatality by suicide 0.1% 0.0% 0.4% % of PGSI group who suffered fatality by suicide. Calculated as 1:15 ratio of attempted suicide: fatality by suicide.
Victorian Gambling-Related Harms Study (Browne et al. 2016, Table 10) national survey dataset for attempted suicide % (variable Q8b_3) (see Appendix 2 of this report)
Doran, Ling, Milner & Doran (2015) for 1:15 ratio
Cost to Victorian Government
Policy, regulation, research and treatment
N/A N/A N/A 2014–15 Victorian Government costs for: VRGF, DJR and VCGLR, and Pre-Commitment Implementation Project. All costs included, unable to distribute costs by PGSI.
VRGF and Pre-Commitment Implementation Project – Department of Treasury and Finance (DTF 2015)
DJR policy costs – VCEC (2012) 2010–11 costs of DOJ inflated to 2014–15 using CPI (ABS 2015c)
VCGLR regulation costs – direct correspondence with VCGLR
Direct costs to local governments in Victoria
N/A N/A N/A Number of local Victorian councils responding to gaming machine applications in 2014–15 – submission, hearing attendance and VCAT appeal. All costs included, unable to distribute costs by PGSI.
Victorian Responsible Gambling Foundation (VRGF), via correspondence with authors
Health and human services systems
3.6% 1.2% 0.4% % of Victorian population with gambling problems with 'wellbeing issues' who have potentially accessed services provided by the health and human services sector in Victoria.
% PGSI group potentially accessing health and human services estimated as an average between % well-being issues (lower estimate, those experiencing depression, attempted suicide, or experiences of violence due to gambling). Assumption 33% go on to receive treatment.
Victorian Gambling-Related Harms Study (Browne et al. 2016, Table 10 and 11) national survey dataset – % experiencing depression, violence, attempted suicide due to gambling (see Appendix 2 of this report)
Sane Australia (2016) – one-third of people with mental illness receive treatment
Victorian Gambling and Health Study 2014 weighted dataset Hare 2015) – 2014 prevalence gambling in Victorian population (Table 1)
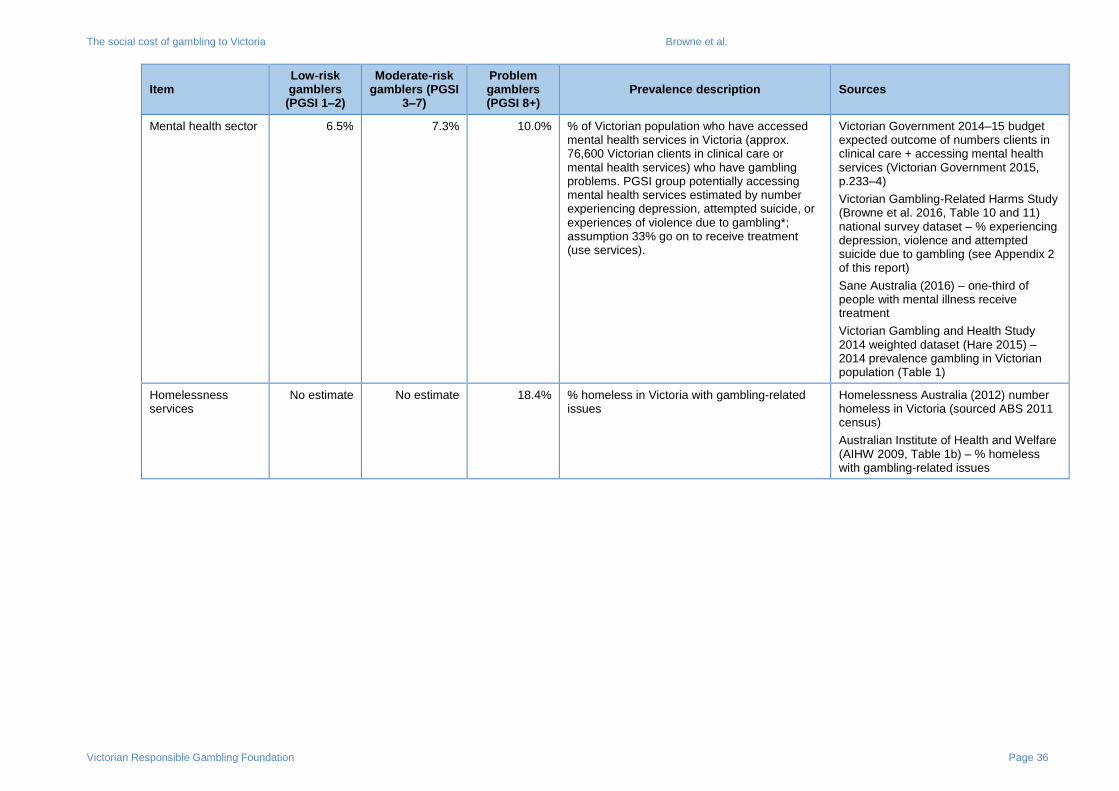
The social cost of gambling to Victoria Browne et al.
Victorian Responsible Gambling Foundation Page 36
Item Low-risk gamblers
(PGSI 1–2)
Moderate-risk gamblers (PGSI
3–7)
Problem gamblers (PGSI 8+)
Prevalence description Sources
Mental health sector 6.5% 7.3% 10.0% % of Victorian population who have accessed mental health services in Victoria (approx. 76,600 Victorian clients in clinical care or mental health services) who have gambling problems. PGSI group potentially accessing mental health services estimated by number experiencing depression, attempted suicide, or experiences of violence due to gambling*; assumption 33% go on to receive treatment (use services).
Victorian Government 2014–15 budget expected outcome of numbers clients in clinical care + accessing mental health services (Victorian Government 2015, p.233–4)
Victorian Gambling-Related Harms Study (Browne et al. 2016, Table 10 and 11) national survey dataset – % experiencing depression, violence and attempted suicide due to gambling (see Appendix 2 of this report)
Sane Australia (2016) – one-third of people with mental illness receive treatment
Victorian Gambling and Health Study 2014 weighted dataset (Hare 2015) – 2014 prevalence gambling in Victorian population (Table 1)
Homelessness services
No estimate No estimate 18.4% % homeless in Victoria with gambling-related issues
Homelessness Australia (2012) number homeless in Victoria (sourced ABS 2011 census)
Australian Institute of Health and Welfare (AIHW 2009, Table 1b) – % homeless with gambling-related issues

The social cost of gambling to Victoria Browne et al.
Victorian Responsible Gambling Foundation Page 37
Measurement of cost items
Table 6 summarises the cost estimation method and data sources that were used to determine the
average cost of each gambling-related harm cost item. The approach taken was to follow the
methodology used by the VCEC (2012) or/and the PC (1999, 2010) and source the costs by item
using 2014 data. In cases where this data was unavailable, the estimate from the most recent
VCEC (2012) study for 2010–11 costs was inflated from 2010 to 2014 using the Consumer Price
Index (ABS 2015c). If a better alternative approach to costing a gambling-related harm was found,
it was followed and justification provided. This method also allowed a direct comparison to be
made between the current costs of problem gambling calculated in this study and those reported
by the VCEC (2012). This comparison is discussed later in this report.
Table 6: Definitions and data sources for cost items
Cost item Data item Sources
Financial
Total opportunity cost of gambling spend
Increased per person spend by PGSI score weighted by increased relative prevalence of financial deprivation harms by PGSI score
Victorian Gambling-Related Harms Study (Browne et al. 2016) national survey dataset – number of financial harms reported Victorian Gambling and Health Study 2008 weighted dataset (Hare 2009) – average expenditure figures by PGSI score
Bankruptcy
Cost of bankruptcy administration
Cost to the government to administer bankruptcies (per case)
Bankruptcy (Fees and Remuneration) Determination 2014, Section 3.05 (ITSA 2014)
Cost of unpaid debts
Gambling debt per problem gambler gone bankrupt
VCEC (2012, Table J.3) inflated to 2014 price using CPI (ABS 2015c)
Illegal offshore wagering
‘Unofficial’ industry sector cost of online poker and casinos
Productivity Commission (2010, Figure 1) inflated to 2014 price using CPI (ABS 2015c)
Emotional and psychological
Depression – emotional distress to the gambler
Average amount of financial assistance awarded to victims of crime on final determination in 2014–15
VOCAT (2015) Annual Report 2014–15, Table 13
Suicide attempts – impact on gambler
Average amount of financial assistance awarded to victims of crime on final determination in 2014–15
VOCAT (2015) Annual Report 2014–15, Table 13
Suicide ideation – emotional distress to the gambler
Average amount of financial assistance awarded to victims of crime on final determination in 2014–15
VOCAT (2015) Annual Report 2014–15, Table 13
Emotional and psychological costs to the gambler
Scaled attributable disability weighting × GDP per capita
Victorian Gambling-Related Harms Study (Browne et al. 2016) national survey dataset – disability weights (Table 23)
GDP per capita (World Bank 2016)

The social cost of gambling to Victoria Browne et al.
Victorian Responsible Gambling Foundation Page 38
Cost item Data item Sources
Relationships and family
Divorce and separation
Financial cost to the gambler
Federal court application for divorce + average legal fees for uncontested divorce
Court Fees (Family Law). (Family Court of Australia & Federal Circuit Court of Australia 2012)
Family Law (Fees) Regulation 2012 (Australian Government 2015, Schedule 1 – Fees, section 2.02)
Emotional distress to the gambler
Average amount of financial assistance awarded to victims of crime on final determination in 2014–15
VOCAT (2015) Annual Report 2014–15, Table 13
Emotional distress to affected others
Average amount of financial assistance awarded to victims of crime on final determination in 2014–15
VOCAT (2015) Annual Report 2014–15, Table 13
Experiences of violence
Emotional distress to the gambler
Average amount of financial assistance awarded to victims of crime on final determination in 2014–15
VOCAT (2015) Annual Report 2014–15, Table 13
Emotional distress to affected others
Average amount of financial assistance awarded to victims of crime on final determination in 2014–15
VOCAT (2015) Annual Report 2014–15, Table 13
Suicide attempts of gambler – impact on affected others
Average amount of financial assistance awarded to victims of crime on final determination in 2014–15
VOCAT (2015) Annual Report 2014–15, Table 13
Fatality by suicide of gambler – impact on affected others
Average amount of financial assistance awarded to victims of crime on final determination in 2014–15
VOCAT (2015) Annual Report 2014–15, Table 13
Other emotional distress to affected others
Average amount of financial assistance awarded to victims of crime on final determination in 2014–15
VOCAT (2015) Annual Report 2014–15, Table 13
Crime – cost to the Victorian justice system
Police system cost Real recurrent expenditure (less revenue from own sources) per person on justice services in Victoria, 2014–15
Report on Government Services 2016. Volume C: Justice sector overview. (Productivity Commission 2016a, Table C.2)
Court system cost Total recurrent expenditure on courts less income (excluding fines) in Victoria, 2014–15 / total number of lodgements to courts in Victoria, 2014–15 = average expenditure per lodgement to court
Report on Government Services 2016. Volume C: Justice. (Productivity Commission 2016a, Table 7.1, Table 7.2, Table 7.3)
Corrections system cost
Average cost per prisoner (in prison or remand) per month + average cost per offender (serving community correction orders) per month, Victoria 2014–15 × average length of sentence in months (4 months)
Report on Government Services 2016. Volume C: Justice sector overview. (Productivity Commission 2016a, Table C.9)
Productivity loss and work impacts
Productivity loss to business
Average weekly earnings Victoria – annualised (× 52 weeks)
ABS (2015b, Table 11b. Average Weekly Earnings, Victoria (Dollars) – Trend (Earnings; Persons; Full Time; Adult; Ordinary time earnings; Victoria)

The social cost of gambling to Victoria Browne et al.
Victorian Responsible Gambling Foundation Page 39
Cost item Data item Sources
Cost of job change Cost of loss of income + cost of job search + employer staff replacement cost + unemployment benefits (transfer)
Loss of income Average weekly earnings Victoria – monthly (× 12 months)
ABS (2015b, Table 11b. Average Weekly Earnings, Victoria (Dollars) – Trend (Earnings; Persons; Full Time; Adult; Ordinary time earnings; Victoria)
Job search cost to the gambler
See source notes. Followed approach of PC (1999) and VCEC (2012)
VCEC (2012, Table J.1) 2010–11 cost inflated to 2014–15 price using CPI (ABS 2015c). Note: VCEC inflated their estimate from PC (1999) which used an estimate of $2357 by Dickerson et al. (1998). This was reported as ‘approximately half of the cost reported by major job search firms.’
Employer staff replacement costs
Average weekly earnings Victoria – annualised (× 52 weeks)
ABS (2015b Table 11b. Average Weekly Earnings, Victoria (Dollars) – Trend (Earnings; Persons; Full Time; Adult; Ordinary time earnings; Victoria)
Unemployment benefits
Monthly cost of unemployment benefits Newstart Allowance $527.60 per fortnight (single, no children), sourced Department of Human Services (DHS 2016)
Cost of absenteeism to business
Average annual cost to business per employee of absenteeism
2013 Absence Management Survey (Direct Health Solutions 2013) – $2741 in 2013 converted to 2014 using CPI (ABS 2015c)
Cost of crime to business
Value of money and goods stolen from business per incident
Inflated lower and upper estimates made by VCEC (2012, Table G.2) to 2014–15 prices using CPI (ABS 2015c), taking average of lower and upper estimates
Cost of fatality by suicide
Average annual cost of fatality by suicide = average total cost of fatality by suicide / average years of life lost due to fatality by suicide (average life expectancy SA male – average age of fatality by suicide in SA Construction Industry 2012
Doran et al. (2015) average years of life lost due to fatality by suicide: average age of fatality by suicide (39.5 years, Table 2) and total cost of fatality by suicide ($1,865,302), inflated to 2014 price using CPI (ABS 2015c)
1367.0 – State and Territory Statistical Indicators 2012 (ABS 2012) – average life expectancy SA male (79.5 years)
Cost to Victorian Government
Policy, regulation, research and treatment
Victorian Responsible Gambling Foundation (VRGF)
Community Support Fund expenditure 2014–15 on VRGF (under Gaming portfolio)
Department of Treasury and Finance (2015)
Pre-commitment Implementation Project
Community Support Fund expenditure 2014–15 on the Pre-commitment Implementation Project (under Gaming portfolio)
Department of Treasury and Finance (2015)
Policy costs related to problem gambling (DJR)
DJR policy costs related to problem gambling
VCEC (2012, p.56) 2010–11 cost ($1.7m) inflated to 2014 price using CPI (ABS 2015c)

The social cost of gambling to Victoria Browne et al.
Victorian Responsible Gambling Foundation Page 40
Cost item Data item Sources
Cost of regulating problem gambling (VCGLR)
VCGLR total policy costs plus costs of activities to regulate problem gambling. Cost categories include: compliance and audit functions, gambling premises and gambling product approvals, licensing operations and strategic and legal support.
Provided by VCGLR via correspondence with VRGF for the authors, Figures are for the cost of their activity attributed to problem gambling in 2014–15.
Direct costs to local governments in Victoria
Average cost to local Victorian councils of responding to gaming machine applications – submission + hearing attendance + VCAT appeal costs
VCEC (2012, Table C.1) 2010 cost items inflated to 2014 price using CPI (ABS 2015c). Note: VCEC cost item received in a submission by the Municipal Association of Victoria (2012a, p.8)
Health and human services systems
Share of total health and human service expenditure to the Victorian Government due to gambling problems
VCEC (2012) 2010 cost items inflated to 2014 price using CPI (ABS 2015c). VCEC sourced total health and human expenditure (including capital costs) from various sources: DH and DHS expenditure and Report on Government Services (SCRGSP 2012 – cited in VCEC 2012, Table D.2)
Mental health sector Share of mental health sector expenditure by the Victorian Government due to gambling problems
Victorian Government 2014–15 budget (revised figures) for mental health, as provided by the Department of Health and Human Services (Victorian Government 2015, Table 2.11)
Homelessness services
Total annual offset cost per client, street to home (health and justice services, excludes welfare, children placed in care, and eviction)
Zaretzky et al. (2013, Table 1)
The cost of emotional distress
As shown in Table 6, the ‘emotional distress’ items for depression and suicide (attempts and
ideation) have been sourced from the Victims of Crime Assistance Tribunal’s reported
compensation schedule for the ‘average amount of financial assistance awarded to victims of
crime on final determination in 2014–15’ (VOCAT 2015). This amounts to a cost of $7,641 per
person for emotional distress. VOCAT compensation awards cover costs such as funeral
expenses, counselling, medical and safety, loss of and/or damage to clothing, loss of earnings and
other expenses which assist the victim.
This approach is consistent with the PC’s (1999) use of compensation schedules ($5000 to
$15,000) and the VCEC (2012) and The Allen Consulting Group (2011) who inflated the PC’s 1999
schedules to 2010 prices ($7200 to $21,500) and 2011 prices ($7208 to $21,623) respectively. The
current approach differs in the use of one conservative lower estimate of emotional distress
($7641) using VOCAT’s most recent compensation schedule (VOCAT 2015). It is acknowledged
that while this may be an unsatisfactory proxy for the cost per person of emotional distress due to
gambling-related harms, no alternative estimate was available.
Approach to cost calculations
As described above, the framework adopted in this study for estimating the cost of problem
gambling to Victoria (2014–15) largely relies on prevalence figures for a range of gambling-related
harms, with respect to PGSI categories (LR, MR and PG). Where harms are able to be costed, an
estimate of cost for each item has been sourced and applied to the 2014–15 financial year. Figure
2 illustrates the approach to estimating the cost of gambling problems. The calculations for each

The social cost of gambling to Victoria Browne et al.
Victorian Responsible Gambling Foundation Page 41
cost item are presented in the results section along with the findings. The basic approach
described in Figure 2 had to be altered in the case of two specific cost items –emotional or
psychological distress and excessive spend – which are described in the following subsections.
Figure 2: CQU approach to estimating the cost of gambling problems to Victoria
As shown in Figure 2, the cost calculations adopted two adjustment strategies in line with the
approach of the Productivity Commission (1999) and the VCEC (2012): adjustments for the
counterfactual and double-counting, which are described in the following subsections.
80 per cent counterfactual adjustment
As mentioned in the targeted literature review section of this report, in their cost calculations the
Productivity Commission (1999) drew on the judgements of academics and researchers that
approximately 20 per cent of gambling-related impacts would occur in the absence of gambling
(the counterfactual). The PC (1999) applied a 20 per cent discount to the estimated number of
people impacted by gambling-related harm. In the absence of a better estimate the VCEC (2012)
used the same approach, labelling it a ‘counterfactual adjustment’ of 80 per cent. The authors of
the current study investigated an alternative counterfactual adjustment which would more
accurately factor for direct causality between gambling and the associated harms. However, none
of the limited longitudinal studies conducting on gambling have been able to capture data sufficient
to establish causality or determine rigorous attributable fractions. Therefore, our approach follows
that taken by the PC (1999) and VCEC (2012) in applying an 80 per cent counterfactual
adjustment to the number of people experiencing the gambling-related harm.
Double-counting adjustment
A number of gambling-related harm estimates are associated with intangible costs, such as the
cost of emotional distress due to suicide ideation, suicide attempts, depression, divorce or
separation, experiencing violence, or other emotional or psychological impacts. It is very likely that
an individual reporting one of these emotional or psychological harms due to gambling is also
experiencing another. For example, someone who has attempted suicide within the last year is
very likely to have experienced depression, both attributable to their gambling problems.
Therefore, to avoid double-counting potential comorbid gambling-related harms in estimates of
emotional distress, discounts have been applied in the calculations by subtracting the smaller
harm/s (by population impacted) from the larger harms. Specifically, these discounts have been
applied in the following calculations:
Number of people
experiencing
gambling-related harm
item by PGSI category
80% counterfactual
adjustment
Cost of harm item per
person
Cost across range of
gambling-related
harms
Total cost of gambling
problems to Victoria
Other gambling-related
harm costs unable to
be partitioned to PGSI
category

The social cost of gambling to Victoria Browne et al.
Victorian Responsible Gambling Foundation Page 42
Number of gamblers experiencing suicide ideation discounted by:
o number of gamblers attempting suicide
Number of affected others experiencing emotional distress due to another’s gambling
discounted by:
o number of affected others experiencing emotional distress due to gambling-related
divorce or separation
o number of affected others experiencing emotional distress due to gambling-related
experiences of violence
o number of affected others experiencing emotional distress due to gambler’s attempted
suicide
o number of affected others experiencing emotional distress due to gambler’s fatality by
suicide
o percentage of affected others reporting moderate to major emotional or psychological
impact from another’s gambling.
For more detail, refer to the detailed cost calculations in the results section.
Emotional or psychological distress dominance analysis and disability weights
Emotional or psychological distress, as an ‘intangible’ cost to those suffering gambling problems, is
inherently difficult to cost using standard methods. For this reason, though it is recognised as a
major negative consequence of gambling and has been discussed in detail, it has not been
integrated into previous costing studies. However, the recent study by Browne et al. (2016)
provides a means to approach such a costing through the application of WHO Burden of Disease
(BoD) methodologies. The main objective of that study was to estimate the average disability
weight (DW) associated with different categories of problematic gambling.
The DW is a [0,1] bounded metric that reflects the total impact of a condition on a person’s quality
of life. The DW ranges from none at all (0) – or normal health and wellbeing – to so extreme that
life is effectively not worth living (1). Integrated over the course of one year and over individuals,
the DW translates to a ‘disability adjusted life year’ (DALY), which may be understood as a cost in
terms of human quality of life. Given that financial resources are generally dedicated to enhancing
quality of life, GDP per capita (World Bank 2016) can be used as a surrogate for the economic
worth of one person’s life year. This method has been applied, for instance, to measure the
economic worth of medical research to reduce the incidence of cancer (Murphy & Topel 2010).
Browne et al. (2016) gathered data that associated symptomology across all major domains of
gambling harm, including emotional or psychological distress, with the estimated DWs. This
provides scope to calculate the emotional and psychological distress cost via:
𝐶 = 𝐷𝐴𝐿𝑌 ∙ 𝐺𝐷𝑃 ∙
where W describes the relative importance of emotional and psychological harm, with respect to
other domains of harm (e.g. financial), in contributing to the DW of an individual suffering from
gambling harm.

The social cost of gambling to Victoria Browne et al.
Victorian Responsible Gambling Foundation Page 43
To find W a regression-based procedure known as dominance analysis (Budescu 1993; Azen &
Budescu 2003) was applied to assess the relative importance of independent variables in
predicting an outcome. Dominance analysis is just one of a number of approaches that
acknowledge that there is intrinsic uncertainty in assigning explained variance to predictors when
there are multiple co-varying explanatory variables (see e.g. Leamer & Leonard 1983). Another
way of describing the goal of dominance analysis is that it aims to partition the total explained
variance in an outcome into parts attributable to each individual predictor.
The algorithm used to implement the analysis takes into account covariance among predictors by
aggregating information over all possible combinations of predictors. A regression dominance
analysis was implemented on Browne et al.’s (2016) dataset of harms reported by 3076 gamblers.
The predictor variables were the general questions attached to each domain, e.g. ‘Overall how
much were you impacted by financial harms?’, and the response variable was the estimated DW
for that case. DW varied by individual based on the severity of gambling problems.
Table 7 summarises the outcome of this dominance analysis. As shown in Table 7, 25.9 per cent
of the DW associated with gambling-related harm can be attributed to emotional or psychological
harms, and this served as the estimate of W in the current study. The DALY attributable to
gambling-related harm was sourced directly from that reported by Browne et al. (2016) and
Australian GDP per capita (used as a proxy for Victorian GDP per capita) was sourced by the
World Bank (2016).
Table 7: Regression dominance analysis estimation of the relative contribution of emotional
or psychological harms to disability weights
Gambling-related harm domain Relative contribution (%)
Financial harms 26.8%
Emotional and psychological harms 25.9%
Relationship and family harms 15.6%
Health-related harms 16.6%
Work or study harms 7.5%
Other harms (anti-social consequences) 7.5%
Excessive spend by problem gamblers and financial deprivation
Excessive expenditure by those engaging in problematic gambling represents a clear opportunity
cost to gamblers, for whom the money would have been better spent on other products and
activities. The financial harms identified by Browne et al. (2016), e.g. ‘less spending on essential
items (e.g. medications, health care and food), essentially probe the occurrence of this opportunity
cost of misused funds. In brief, the approach taken by the Productivity Commission (1999) and by
the VCEC (2012) was to assume that on average, non-problem gamblers were making a rational
choice regarding the amount invested in gambling each year so as to maximise their utility.
Accordingly, the average amount that problem gamblers spent in excess of this was treated as
incurring an opportunity cost to the gambler. The Productivity Commission (1999) gave a lower
estimate of $1 billion and an upper estimate of $1.4 billion. The VCEC (2012) report reviews in
detail the approach taken by the Productivity Commission to assess excessive expenditure. The
AGC and Clubs Australia disputed this approach, suggesting gamblers may in some cases
evidence a high spend that remains consistent with rational spending. The VCEC (2012) disagreed
with these points and supported the position taken by the Productivity Commission.
The social cost of gambling to Victoria Browne et al.
Victorian Responsible Gambling Foundation Page 44
The authors of the current study agree with the assessment of the VCEC, that beyond a certain
level of expenditure problem gamblers generally do not gain value for money for their spending,
while the opportunity costs rise quickly. The average spend amounts by PGSI category would
appear to be most valid points at which to set the threshold at which this occurs.
However, the existing case can be strengthened further using data from Browne et al. (2016) by
considering the increasing rate of financial harm symptomology with respect to PGSI. These harms
directly measure the increasing occurrence of financial deprivation due to opportunity costs of
gambling investment, and can be related to PGSI and increasing spend. Low-risk gamblers incur
these harms at about 1.5× the rate of non-problem gamblers, moderate risk at 3–4× and PGs at 5–
10×. It is possible to address the concerns raised by AGC and Clubs Australia by not costing 100
per cent of excessive spend by problem gamblers, but rather weighting the allocation based on the
increased rate of occurrence of financial harms over the non-problem gambling baseline. For PGs,
approximately 80 per cent of their spend in excess of non-problem gamblers is treated as a cost.
For low-risk gamblers, only about 40 per cent of the excessive spend is treated as a cost. Thus,
this approach takes into account the relative increase in spends as well as the relative increase of
financial harms as PGSI increases. The costing formula is given as:
𝐶 = ∑ 𝑁𝑘 ∙ (𝑆𝑘 − 𝑆0) ∙ (1 −𝐻0
𝐻𝑘
)
15+
𝑘=1(PGSI)
where (1 −𝐻0
𝐻𝑘) describes the weight W, or the proportion of the excessive spend assumed to incur
opportunity costs to the gambler in excess of any entertainment benefit obtained.
The rationale behind this formula can be set out as follows. It is assumed that 100 per cent of the
spend 𝑆0 by recreational gamblers is not a ‘cost’ since it is presumably less than the theoretical
consumer surplus obtained by these gamblers. As financial harms H increase for non-recreational
gamblers with increasing PGSI score k, then a relative proportion (1 −𝐻0
𝐻𝑘) of the increased spend
(𝑆𝑘 − 𝑆0) by those with non-zero PGSI scores is considered to not provide additional consumer
surplus over that enjoyed by recreational gamblers. Therefore, this proportion of the increased
spend by those experiencing financial harms is treated as a cost. This approach integrates most
recent evidence on the escalating rate of financial deprivation experienced by higher PGSI
categories. Nevertheless, it only treats a proportion (<100 per cent) of the spend of those
experiencing problems as a cost, this proportion being estimated by the relative increase in self-
reported financial harms.
Results
Total costs of gambling problems to Victoria, by gambling category
The total cost of gambling problems in Victoria is estimated to be $7 billion in 2014–15 with over
one-third of this total cost attributable to low-risk gambling ($2.45 billion), one-third to problem
gambling ($2.36 billion) and one-quarter to moderate-risk gambling ($1.9 billion). Table 8 shows
the cost of gambling problems to Victoria in the 2014–15 financial year by PGSI category across
cost items.

The social cost of gambling to Victoria Browne et al.
Victorian Responsible Gambling Foundation Page 45
Table 8: Cost of gambling problems to Victoria (2014–15)
Cost item Low-risk gamblers
(PGSI 1–2)
Moderate-risk gamblers (PGSI 3–7)
Problem gamblers
(PGSI 8+)
Total gambling problems
Estimated Victorian population
(of 4,390,438)
391,206 122,667 35,415 549,289
Financial
Total opportunity cost of gambling spend
$315,582,939 $318,811,285 $427,186,784 $1,061,581,009
Bankruptcy
Total cost of bankruptcy administration
$0 $2,841,023 $7,930,772 $10,771,795
Total cost of unpaid debts
$0 $15,853,528 $44,255,438 $60,108,966
Illegal offshore wagering No estimate No estimate No estimate $215,634,140
Sub-total financial costs $315,582,939 $337,505,836 $479,372,995 $1,348,095,911
Emotional and psychological
Depression – emotional distress to the gambler
$52,358,703 $64,672,516 $59,775,675 $176,806,894
Suicide attempts – impact on gambler
$45,694,868 $5,427,064 $16,137,785 $67,259,718
Suicide ideation – emotional distress to the gambler
$150,793,065 $17,909,312 $53,254,692 $221,957,069
Emotional and psychological costs to the gambler
$566,286,653 $389,181,066 $171,465,281 $1,126,933,000
Sub-total emotional and psychological costs
$815,133,289 $477,189,959 $300,633,433 $1,592,956,680
Relationships and family
Divorce and separation
Financial cost to the gambler
$9,844,221 $5,261,280 $9,081,796 $24,187,297
Emotional distress to the gambler
$45,694,868 $24,421,789 $42,155,848 $112,272,505
Emotional distress to affected others
$73,111,789 $160,679,868 $384,126,043 $617,917,699
Experiences of violence
Emotional distress to the gambler
$15,231,623 $9,949,618 $21,517,047 $46,698,288
Emotional distress to affected others
$24,370,596 $15,919,389 $34,427,276 $74,717,260
Suicide attempts of gambler – impact on affected others
$274,169,209 $32,562,386 $96,826,713 $403,558,307
Fatality by suicide of gambler – impact on affected others
$18,277,947 $2,170,826 $6,455,114 $26,903,887
Other emotional distress to affected others
$129,124,853 $334,844,790 $418,671,785 $882,641,428
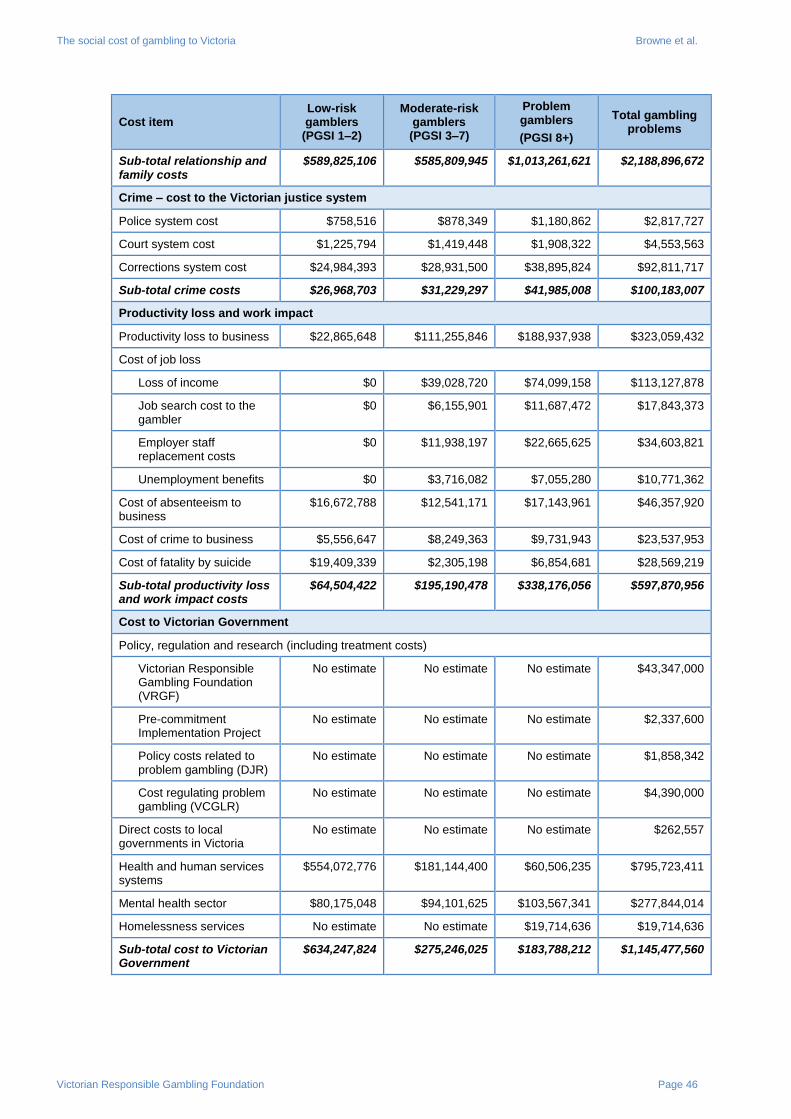
The social cost of gambling to Victoria Browne et al.
Victorian Responsible Gambling Foundation Page 46
Cost item Low-risk gamblers
(PGSI 1–2)
Moderate-risk gamblers (PGSI 3–7)
Problem gamblers
(PGSI 8+)
Total gambling problems
Sub-total relationship and family costs
$589,825,106 $585,809,945 $1,013,261,621 $2,188,896,672
Crime – cost to the Victorian justice system
Police system cost $758,516 $878,349 $1,180,862 $2,817,727
Court system cost $1,225,794 $1,419,448 $1,908,322 $4,553,563
Corrections system cost $24,984,393 $28,931,500 $38,895,824 $92,811,717
Sub-total crime costs $26,968,703 $31,229,297 $41,985,008 $100,183,007
Productivity loss and work impact
Productivity loss to business $22,865,648 $111,255,846 $188,937,938 $323,059,432
Cost of job loss
Loss of income $0 $39,028,720 $74,099,158 $113,127,878
Job search cost to the gambler
$0 $6,155,901 $11,687,472 $17,843,373
Employer staff replacement costs
$0 $11,938,197 $22,665,625 $34,603,821
Unemployment benefits $0 $3,716,082 $7,055,280 $10,771,362
Cost of absenteeism to business
$16,672,788 $12,541,171 $17,143,961 $46,357,920
Cost of crime to business $5,556,647 $8,249,363 $9,731,943 $23,537,953
Cost of fatality by suicide $19,409,339 $2,305,198 $6,854,681 $28,569,219
Sub-total productivity loss and work impact costs
$64,504,422 $195,190,478 $338,176,056 $597,870,956
Cost to Victorian Government
Policy, regulation and research (including treatment costs)
Victorian Responsible Gambling Foundation (VRGF)
No estimate No estimate No estimate $43,347,000
Pre-commitment Implementation Project
No estimate No estimate No estimate $2,337,600
Policy costs related to problem gambling (DJR)
No estimate No estimate No estimate $1,858,342
Cost regulating problem gambling (VCGLR)
No estimate No estimate No estimate $4,390,000
Direct costs to local governments in Victoria
No estimate No estimate No estimate $262,557
Health and human services systems
$554,072,776 $181,144,400 $60,506,235 $795,723,411
Mental health sector $80,175,048 $94,101,625 $103,567,341 $277,844,014
Homelessness services No estimate No estimate $19,714,636 $19,714,636
Sub-total cost to Victorian Government
$634,247,824 $275,246,025 $183,788,212 $1,145,477,560

The social cost of gambling to Victoria Browne et al.
Victorian Responsible Gambling Foundation Page 47
Cost item Low-risk gamblers
(PGSI 1–2)
Moderate-risk gamblers (PGSI 3–7)
Problem gamblers
(PGSI 8+)
Total gambling problems
Total cost of gambling to Victoria5
$2,446,262,283 $1,902,171,540 $2,357,217,325 $6,973,480,788
Cost of gambling problems to Victoria, by cost category and PGSI
As shown in Table 9, just under one-third of the total costs of gambling problems are accounted for
by the costs to relationships and family ($2.2 billion) and two-fifths of this the cost ($883 million) is
borne by persons harmed by the gambler in the form of ‘other emotional distress’ (not including
from divorce or separation, suicide attempts, fatality by suicide or experiences of violence). In fact,
the total of all emotional distress costs on affected others accounted for over one-quarter ($2
billion, 28.8 per cent) of the total cost to Victoria, slightly higher than the emotional and
psychological cost born by the gambler ($1.6 billion, 22.8 per cent of total costs). The financial and
emotional and psychological costs (excluding those counted under the relationship and family
category) accounted for approximately 20 per cent each of the total costs ($1.3 billion and $1.6
billion respectively). These findings are consistent with the research by Browne et al. (2016), which
found that relationship, emotional and psychological and financial harms aggregated accounted for
60 per cent of the healthy years of life lost to the Victorian adult population, using the same 2014
population estimates as the current analysis.
The authors note that the health harms domain in this study accounted for another 20 per cent of
the healthy years of life lost, and the harm items of depression and attempted suicide were
categorised within this health domain (Browne et al. (2016). In the current costing, depression and
attempted suicide are counted in the emotional and psychological (for gambler) and relationship
and family (for affected others) cost categories. Suicide ideation is only counted as an emotional
cost to the gambler. Fatality by suicide is costed separately as a relationship and family cost (on
affected others) and productivity loss and work impacts (to the community and government).
The cost to the Victorian Government to fund gambling-related policy, regulation, research,
treatment, local government and health and social services (including mental health and
homelessness) accounted for another 16.4 per cent of the estimated total cost ($1.1 billion).
Interestingly, just over half of these costs were associated with low-risk gamblers ($635 million).
Productivity loss and other impacts to work (absenteeism, job loss, crime and fatality by suicide)
cost just under $598 million (8.6 per cent of the total costs), followed the cost of crime to the
Victorian justice system at $100 million (1.4 per cent of total costs).
5 Total combined costs for low-risk, moderate-risk and problem gamblers do not add to the overall total of
gambling problems due to some cost items unable to be costed for all three groups: policy, regulation, research and treatment costs to Victorian Government, direct costs to local Government, illegal offshore gambling, and homelessness services.

The social cost of gambling to Victoria Browne et al.
Victorian Responsible Gambling Foundation Page 48
Table 9: Cost of gambling problems to Victoria (2014–15) by cost category and PGSI
Cost category Low-risk gamblers
(PGSI 1–2)
Moderate-risk gamblers
(PGSI 3–7)
Problem gamblers (PGSI 8+)
Total gambling problems
Financial impacts Cost $315,582,939 $337,505,836 $479,372,995 $1,348,095,911
% total
4.5% 4.8% 6.9% 19.3%
Emotional and psychological
Cost $815,133,289 $477,189,959 $300,633,433 $1,592,956,680
% total
11.7% 6.8% 4.3% 22.8%
Relationships and family
Cost $589,825,106 $585,809,945 $1,013,261,621 $2,188,896,672
% total
8.5% 8.4% 14.5% 31.4%
Crime Cost $26,968,703 $31,229,297 $41,985,008 $100,183,007
% total
0.4% 0.4% 0.6% 1.4%
Productivity loss and work impacts
Cost $64,504,422 $195,190,478 $338,176,056 $597,870,956
% total
0.9% 2.8% 4.9% 8.6%
Costs to Victorian Government
Cost $634,247,824 $275,246,025 $183,788,212 $1,145,477,560
% total
9.1% 3.9% 2.6% 16.4%
Total cost of gambling to Victoria
Cost $2,446,262,283 $1,902,171,540 $2,357,217,325 $6,973,480,788
% total
35.1% 27.3% 33.8% 100%
Cost of gambling problems to Victoria, by bearer of cost and PGSI
Aggregating the costs by the group bearing the costs has gamblers themselves accounting for
just over 45 per cent of the total costs ($3.2 billion), followed by affected others ($2.0 billion),
the Victorian Government ($1.3 billion) and the community ($472 million). The two groups
which accounted for the higher share of the overall costs were low-risk gamblers (17.2 per
cent of the total, $1.2 billion) and others affected by problem gamblers (13.8 per cent of the
total, $963 million).
See Table 10 for a breakdown of these costs. For a summary of cost items by bearer of costs,
refer to the gambling cost framework in Table 3.

The social cost of gambling to Victoria Browne et al.
Victorian Responsible Gambling Foundation Page 49
Table 10: Cost of gambling problems to Victoria (2014–15) by bearer of cost and PGSI
Cost category Low-risk gamblers
(PGSI 1–2)
Moderate-risk gamblers
(PGSI 3–7)
Problem gamblers (PGSI 8+)
Total gambling problems
Gambler Cost $1,201,486,940 $880,818,552 $886,361,538 $3,184,301,170
% total
17.2% 12.6% 12.7% 45.7%
Affected others6 Cost $519,054,394 $554,104,022 $962,634,649 $2,035,793,065
% total
7.4% 7.9% 13.8% 29.2%
Community (businesses)
Cost $54,799,752 $153,063,940 $264,034,525 $471,898,218
% total
0.8% 2.2% 3.8% 6.8%
Government Cost $670,921,196 $314,185,026 $244,186,612 $1,281,488,334
% total
9.6% 4.5% 3.5% 18.4%
Total cost of gambling to Victoria
Cost $2,446,262,283 $1,902,171,540 $2,357,217,325 $6,973,480,788
% total
35.1% 27.3% 33.8% 100%
The next section of results summarises the costs by category and subcategory items, giving a
more in-depth look at the individual costs of gambling-related harms and the cost to the Victorian
Government.
Financial costs
Gambling expenditure in Victoria
In 2014–15 gambling expenditure in Victoria was approximately $5.8 billion and, as shown in
Figure 3, it continues to increase each year. This expenditure (or player loss) covers casinos,
EGMs, instant lottery, keno, lotteries, lotto and pools. Minor gaming (e.g. bingo, raffles), interactive
gaming and illegal offshore gambling are excluded from this figure. Of this revenue, in 2014–15 a
total of $1.6 billion in taxes and levies were paid into the Consolidated Fund (VCGLR 2015). The
majority of the revenue was from EGMs located in hotels and clubs ($961.6 million). Approximately
8.3 per cent of revenue from EGMs in Victorian hotels in 2014–15 ($110 million) went directly into
the Community Support Fund programs which support community-orientated expenditure and the
Victorian Responsible Gambling Foundation (VCGLR 2015; DTF 2015).
6 The cost of unpaid debts was divided equality among affected others and the community, as per the description of who bears the costs in Table 3.

The social cost of gambling to Victoria Browne et al.
Victorian Responsible Gambling Foundation Page 50
Figure 3: Victorian gambling expenditure ($ million) Source: Australian Gambling Statistics (AGS) 2013–14 figures (Queensland Treasury 2015) and Victorian Commission for Gambling and Liquor Regulation for 2014–15 figure (VCGLR 2015).
Table 11 summarises the total expenditure on gambling activities in Victorian 2014–15 by player
problem gambling severity level (PGSI). As per the VCEC approach, this expenditure was
calculated from the estimated percentage share of the total expenditure, calculated from the
average expenditure on the gambling activity that the gambler spent the most money on. This is
organised by PGSI category weighted to the Victorian population (sourced from the 2008 Victorian
Gambling and Health Study weighted dataset, Hare 2009). The percentage share by PGSI
category was then applied to the reported 2014–15 player loss revenue for five types of gambling
activities in Victoria (VCGLR 2015).
In total, the population with some degree of gambling problems accounted for $4.5 billion of the
$5.8 billion spent in Victoria in 2014–15 (76.7 per cent of the total). The largest proportion of the
total was attributed to problem gamblers expenditure on EGMs ($1.3 billion, or 22.9 per cent of the
total). However, expenditure from the non-problem, low-risk and moderate-risk gamblers on EGMs
in 2014–15 was still substantial ($695 million, $817 million, and $878 million respectively).
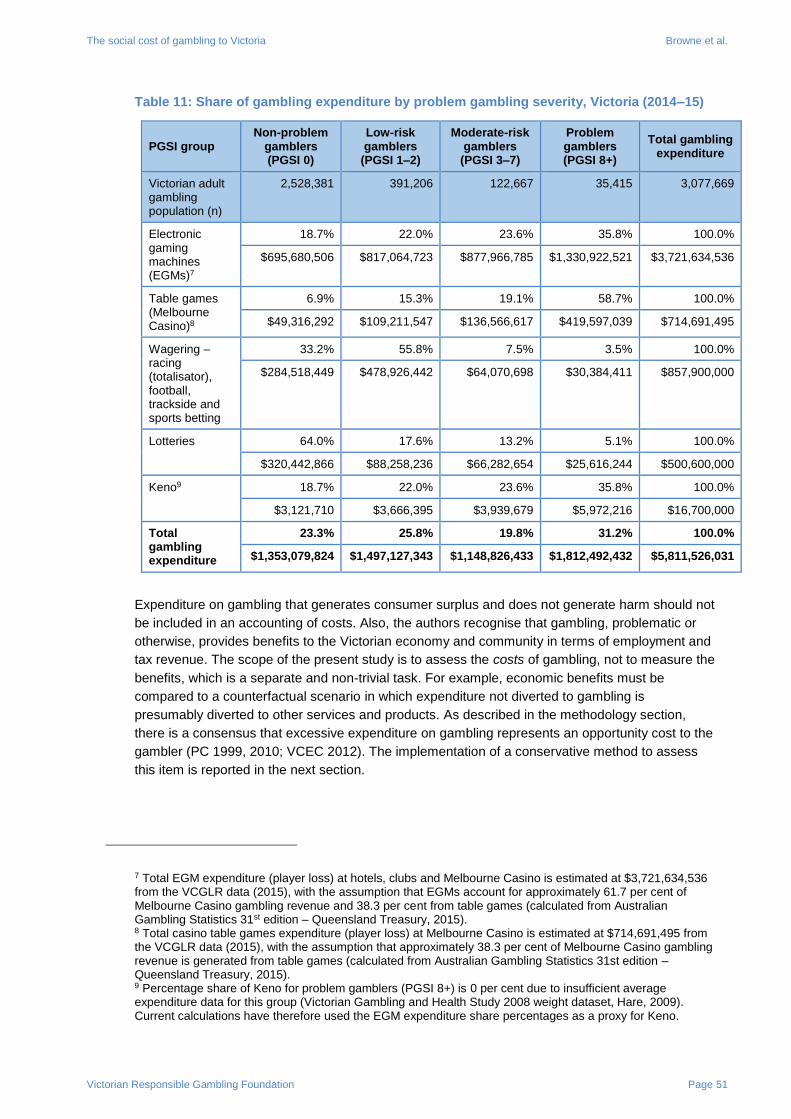
The social cost of gambling to Victoria Browne et al.
Victorian Responsible Gambling Foundation Page 51
Table 11: Share of gambling expenditure by problem gambling severity, Victoria (2014–15)
PGSI group Non-problem
gamblers (PGSI 0)
Low-risk gamblers
(PGSI 1–2)
Moderate-risk gamblers
(PGSI 3–7)
Problem gamblers (PGSI 8+)
Total gambling expenditure
Victorian adult gambling population (n)
2,528,381 391,206 122,667 35,415 3,077,669
Electronic gaming machines (EGMs)7
18.7% 22.0% 23.6% 35.8% 100.0%
$695,680,506 $817,064,723 $877,966,785 $1,330,922,521 $3,721,634,536
Table games (Melbourne Casino)8
6.9% 15.3% 19.1% 58.7% 100.0%
$49,316,292 $109,211,547 $136,566,617 $419,597,039 $714,691,495
Wagering – racing (totalisator), football, trackside and sports betting
33.2% 55.8% 7.5% 3.5% 100.0%
$284,518,449 $478,926,442 $64,070,698 $30,384,411 $857,900,000
Lotteries 64.0% 17.6% 13.2% 5.1% 100.0%
$320,442,866 $88,258,236 $66,282,654 $25,616,244 $500,600,000
Keno9 18.7% 22.0% 23.6% 35.8% 100.0%
$3,121,710 $3,666,395 $3,939,679 $5,972,216 $16,700,000
Total gambling expenditure
23.3% 25.8% 19.8% 31.2% 100.0%
$1,353,079,824 $1,497,127,343 $1,148,826,433 $1,812,492,432 $5,811,526,031
Expenditure on gambling that generates consumer surplus and does not generate harm should not
be included in an accounting of costs. Also, the authors recognise that gambling, problematic or
otherwise, provides benefits to the Victorian economy and community in terms of employment and
tax revenue. The scope of the present study is to assess the costs of gambling, not to measure the
benefits, which is a separate and non-trivial task. For example, economic benefits must be
compared to a counterfactual scenario in which expenditure not diverted to gambling is
presumably diverted to other services and products. As described in the methodology section,
there is a consensus that excessive expenditure on gambling represents an opportunity cost to the
gambler (PC 1999, 2010; VCEC 2012). The implementation of a conservative method to assess
this item is reported in the next section.
7 Total EGM expenditure (player loss) at hotels, clubs and Melbourne Casino is estimated at $3,721,634,536 from the VCGLR data (2015), with the assumption that EGMs account for approximately 61.7 per cent of Melbourne Casino gambling revenue and 38.3 per cent from table games (calculated from Australian Gambling Statistics 31st edition – Queensland Treasury, 2015). 8 Total casino table games expenditure (player loss) at Melbourne Casino is estimated at $714,691,495 from the VCGLR data (2015), with the assumption that approximately 38.3 per cent of Melbourne Casino gambling revenue is generated from table games (calculated from Australian Gambling Statistics 31st edition – Queensland Treasury, 2015). 9 Percentage share of Keno for problem gamblers (PGSI 8+) is 0 per cent due to insufficient average expenditure data for this group (Victorian Gambling and Health Study 2008 weight dataset, Hare, 2009). Current calculations have therefore used the EGM expenditure share percentages as a proxy for Keno.

The social cost of gambling to Victoria Browne et al.
Victorian Responsible Gambling Foundation Page 52
Cost of excessive spend by gamblers
As described in the method section, our costing formula for this item is given as follows:
𝐶 = ∑ 𝑁𝑘 ∙ (𝑆𝑘 − 𝑆0) ∙ (1 −𝐻0
𝐻𝑘
)
15+
𝑘=1(PGSI)
where (𝟏 −𝑯𝟎
𝑯𝒌) describes the weight W applied to the excessive spend. This yields an estimate of
$1.06 billion, at the lower end of the Productivity Commission’s range.
Table 12 illustrates the implementation of this formula by PGSI score. Excessive spend per capita
(S^=S–$670.31) is weighted according to the increased prevalence of gambling-related harm (H)
over non-problem gamblers, scaled by the Victorian population weighted N. This is summarised
again in Table 13 by PGSI category.
Though prevalence of gamblers in each category varies greatly, the aggregate cost of excessive
spend is approximately equal across gambling categories. For comparison, it is interesting to
consider an entirely different approach, whereby financial harms are costed with respect to the
attributable fraction of DALYs estimated for gambling by Browne et al. (2016) – i.e. as was done
for costing emotional and psychological distress. Using this entirely different DW-based estimation
method, the cost of financial harms due to excessive gambling expenditure is estimated as $996
million – which, in relative terms, is very close to the proposed estimate of $1.06 billion. The strong
correspondence in these two cost estimates, based on very different but entirely congruent
assumptions, increases confidence in the estimate given by both approaches.
Table 12: Details of calculations to infer excessive spend leading to financial deprivation or
opportunity costs by PGSI category*
PGSI score
Estimated number persons in Victoria
(N)
Average spend per person (S)
Average number
financial harms (H)
Discount weight (W)
Aggregate excessive spend
(W*S^)
0 2581154.1 $670 0.5 0.0 $0
1 164659.9 $978 0.9 0.4 $61,166,039
2 64080.5 $10,702 0.8 0.4 $254,416,899
3 40739.4 $2744 1.5 0.7 $73,088,209
4 24329.1 $6053 2.2 0.8 $111,612,057
5 14889.6 $7010 2.1 0.8 $77,805,250
6 8410.2 $1,995 2.6 0.8 $13,421,034
7 6367.5 $8,238 2.9 0.8 $42,884,733
8 6627.0 $3,649 3.3 0.8 $20,323,495
9 5562.5 $25,141 3.4 0.8 $117,980,852
10 2924.8 $39,408 3.6 0.9 $98,639,827
11 1097.6 $7,921 3.6 0.9 $7,440,857
12 719.2 $10,152 3.5 0.9 $6,214,311
13 1691.9 $13,209 4.1 0.9 $19,453,120

The social cost of gambling to Victoria Browne et al.
Victorian Responsible Gambling Foundation Page 53
PGSI score
Estimated number persons in Victoria
(N)
Average spend per person (S)
Average number
financial harms (H)
Discount weight (W)
Aggregate excessive spend
(W*S^)
14 1240.4 $6,352 4.6 0.9 $6,969,076
15+ 8409.0 $19,671 5.7 0.9 $150,165,243
Total $1,061,581,009
* Prevalence and spend data sourced from Victorian Gambling and Health Study (2008). Refer to Table 11 for details.
Table 13: Cost of excessive spend by gamblers, Victoria (2014–15)
PGSI group Low-risk gamblers
(PGSI 1–2)
Moderate-risk gamblers
(PGSI 3–7)
Problem gamblers (PGSI 8+)
Total gambling problems
Victorian population n = 391,206 n = 122,667 n = 35,415 n = 549,289
Average spend per person
$670 $3663 $4539 $16,715
Share of total cost 29.7% 30.0% 40.2% 100%
Total cost $315,582,939 $318,811,285 $427,186,784 $1,061,581,009
Cost of bankruptcy and unpaid debts
At the extreme end of financial harms from gambling problems is bankruptcy, which results in the
direct costs of unpaid debts and the administration fees for declaring bankruptcy. The method we
used for costing bankruptcy due to gambling problems was consistent with that employed by the
(PC 1999) and VCEC (2012), and included estimates of:
number of bankruptcies due to gambling by PGSI category (Browne et al. 2016) × 80 per
cent counterfactual
cost to administer bankruptcies to the government per case (ITSA 2014)
average cost of unpaid debts from the gambler per bankruptcy to affected others (family,
friends etc.) and the community (such as businesses) (VCEC 2012 estimated inflated to
2014; ABS 2015c)
The number of bankruptcies by PGSI category was calculated from the National Gambling-Related
Harms study for the percentage of respondents whose gambling contributed to or caused
bankruptcy during a 12-month period (Browne et al. 2016). This figure was projected onto the
estimated Victorian population by PGSI category from the 2014 Victorian Gambling and Health
Study weighted dataset (Hare 2015).
Administration costs to the government per bankruptcy were $4000, as sourced from the fee paid
to the Insolvency Trustee Service Australia to administer a bankruptcy (ITSA 2014). It was not
possible to obtain a current estimate of average unpaid debt per gambler. Therefore the VCEC
(2012) 2010–11 estimate of $20,419 per gambler was used and inflated from 2010 to 2014
($22,321) using the CPI (ABS 2015c).

The social cost of gambling to Victoria Browne et al.
Victorian Responsible Gambling Foundation Page 54
It is acknowledged that bankruptcy has other indirect gambling-related harm costs, such as costs
to relationships (e.g. emotional distress, divorce) and use of government services (e.g. housing
assistance, welfare payments). To avoid double-counting these indirect costs, other gambling-
related harm items have been excluded from the cost of bankruptcy.
Table 14 shows the estimated cost of bankruptcy to Victoria by PGSI category. In total, the cost of
bankruptcy was $70.1 million in 2014–15, with more than half due to unpaid debts from gambling
at problematic levels ($44.3 million). Note that no costs are reported for the low-risk gambler group
due to a 0 per cent prevalence of bankruptcies reported in the gambling-related harms survey
(Browne et al. 2016).
Table 14: Cost of bankruptcy due to gambling problems, Victoria (2014–15) – administration
and unpaid debts
Variable
Calculation Low-risk gamblers
(PGSI 1–2)
Moderate-risk gamblers
(PGSI 3–7)
Problem gamblers (PGSI 8+)
Total gambling problems
Victorian population (n)
n = 391,206 n = 122,667 n = 35,415 n = 549,289
% gambling contributed to or caused bankruptcy
a 0.0% 0.7% 7.0% 4.7%
Number of bankruptcies in Victorian population due to gambling
b = a × n = 80%
0 710 1,983 2,693
Administration cost per bankruptcy
c $4,000
Unpaid debt per gambler d $22,321
Sub-total admin cost e = b × c $0 $2,841,023 $7,930,772 $10,771,795
Sub-total unpaid debts f = b × d $0 $15,853,528 $44,255,438 $60,108,966
Total cost e + f $0 $18,694,551 $52,186,211 $70,880,762
Cost of illegal offshore gambling
Legalised forms of gambling in Australia are subject to taxation and levies that flow back into the
Australian economy and which may then be directed towards community-orientated expenditure.
Illegal gambling, such as offshore online gambling, generates no direct benefits to the Australian
economy, with all proceeds going to international companies. The expenditure data on illegal
offshore gambling is scarce but the following points are salient:
Australian expenditure on gambling in the ‘unofficial sector’ (online poker and online
casinos) has been estimated at $790 million (PC 2010), which is approximately $197
million for Victoria, which accounts for 25 per cent of the Australian population.
In a 2015 review, the Department of Social Services reported that the cost of illegal
offshore wagering in 2014 was between $63.9 million (source: Global Betting and Gaming
Consultants) and $400 million (source: H2 Gambling Capital).
The current study took a conservative approach in estimating illegal offshore gambling, inflating the
Productivity Commission’s 2010 estimate to 2014 prices using CPI (ABS 2015c) and applying the
percentage share of the Victorian population in June 2015 (25 per cent – ABS 2015a) to give
$215,634,140.

The social cost of gambling to Victoria Browne et al.
Victorian Responsible Gambling Foundation Page 55
Emotional and psychological harms
The emotional and psychological harms experienced due to gambling problems are well
established in gambling research (Shaffer & Korn 2002; Abbott et al. 2014). In their framework of
gambling-related harms, Langham et al. (2016) identified emotional and psychological distress as
a significant harm domain which covered feelings of worthlessness, failure, extreme distress,
hopelessness, vulnerability, anger, shame and regret and thoughts of escape. These impacts were
evident not only for the gambler but also for others affected by the gambler (family, friends and
colleagues).
Using the gambling-related harms framework to quantify the years of healthy life lost due to
gambling in Victoria, Browne et al. (2016) found that 18.6 per cent of the years of healthy life lost in
Victoria due to gambling harm could be attributed to emotional or psychological harms.
The entirety of the cost of emotional and psychological distress due to gambling is difficult to
quantify, but this study has included the following harms:
the cost of depression due to gambling
the cost of suicide attempts and suicide ideation due to gambling
the cost of other emotional and psychological distress to the gambler.
The ‘emotional distress’ items for depression and suicide (attempts and ideation) have been
costed per person at $7641, sourced from the Victims of Crime Assistance Tribunal’s reported
compensation schedule for the ‘average amount of financial assistance awarded to victims of
crime on final determination in 2014–15’ (VOCAT 2015). For more detail on the rationale for using
this as a cost proxy for emotional distress, refer to the methodology subsection ‘The cost of
emotional distress’.
The costs detailed in this section pertain only to those costs incurred by the gambler. The costs of
emotional and psychological distress experienced by others affected by a gambler are reported on
in the ‘Relationship and family’ cost category in the next section.
Cost of depression
Depression has been established as being highly correlated with gambling problems, with a bi-
directional causality (Dussault et al 2011; Haw 2009; Holdsworth, Haw & Hing 2011; Quigley et al.
2015), which makes attributing the cost of depression due to gambling a challenging task.
The Productivity Commission’s 1999 estimation of the cost of depression due to problem gambling
used survey data from the National Gambling Survey of regular gamblers who ‘often’ or ‘always’
suffered from depression in the last 12 months as a result of their gambling. Numbers reporting
suicide ideation were subtracted from those ‘always’ suffering depression to avoid double-counting
and the overall figure was adjusted by 80 per cent for causality (PC 1999). The VCEC (2012)
calculated the number of gambling-related depression cases from the PC (1999) rate of
depression from the Survey of Clients of Counselling Agencies, annualising it by the average
period of gambling reported by the PC (8.9 years).
There are issues with using data for the prevalence of gambling from the above approaches:
1. the PC data is outdated

The social cost of gambling to Victoria Browne et al.
Victorian Responsible Gambling Foundation Page 56
2. the VCEC calculation is based on PC data which is both outdated and from an
unrepresentative sample of persons seeking counselling services
3. neither data source differentiates levels of problem gambling severity.
The current study then reviewed depression data from the most recent 2014 Victorian Gambling
and Health Study (Hare 2015). This study asked moderate-risk and problem gamblers on whether
they had ever been diagnosed with depression by a medical professional, but did not ask the level
of their depression brought about by their gambling. As this data lacked any attribution of gambling
to depression or an estimate for low-risk gamblers, the decision was made not to use it.
The National Gambling-Related Harms study (Browne et al. 2016) asked all respondents whether
they had experienced an increase in depression due to their gambling (in a 12-month period).
Since this data was recent and covered all PGSI categories, this data was used with an adjustment
made for causality.
In the current approach, the number of persons in Victoria experiencing depression due to
gambling problems by PGSI category was estimated as follows:
The percentage experiencing increased depression due to their gambling by PGSI
category (National Gambling-Harms Study, Browne et al. 2016) was multiplied by the
estimated Victorian population by PGSI category.
Taking into consideration that the above estimate is based on self-reported data, an
adjustment of 55 per cent was applied to account for the percentage of self-reported
depression that is diagnosed (Gwynn et al. 2008), resulting in costs (e.g. treatment). In
this instance the 80 per cent counterfactual was not applied.
The emotional distress cost proxy of $7641 (VOCAT 2015) was used in the cost
calculations of depression due to gambling.
Table 15 shows the estimated cost of depression to the gambler in Victoria by PGSI category. The
total cost of depression due to gambling problems in 2014–15 is estimated at $176 million, with
each level of gambling problems representing $50–65 million of the aggregated cost.
Table 15: Cost of depression due to gambling problems, Victoria (2014–15)
Variable
Calculation Low-risk gamblers
(PGSI 1–2)
Moderate-risk gamblers
(PGSI 3–7)
Problem gamblers (PGSI 8+)
Total gambling problems
Victorian population (n)
n = 391,206 n = 122,667 n = 35,415 n = 549,289
% who experienced increased depression due to their gambling
a 3.2% 12.5% 40.2%
Number who experienced depression due to gambling (diagnosed)
b = a × n = 55%
6,852 8,464 7,823 23,139
Cost of depression c $7,641
Total cost b × c $52,358,703 $64,672,516 $59,775,675 $176,806,894
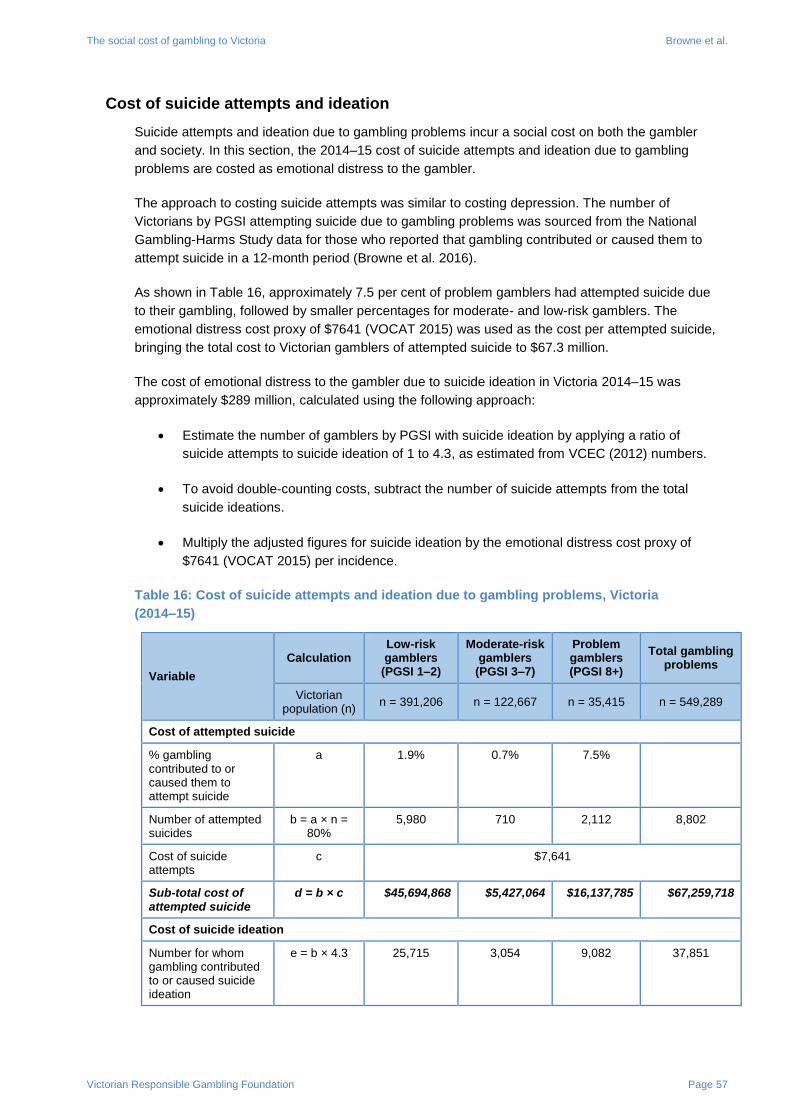
The social cost of gambling to Victoria Browne et al.
Victorian Responsible Gambling Foundation Page 57
Cost of suicide attempts and ideation
Suicide attempts and ideation due to gambling problems incur a social cost on both the gambler
and society. In this section, the 2014–15 cost of suicide attempts and ideation due to gambling
problems are costed as emotional distress to the gambler.
The approach to costing suicide attempts was similar to costing depression. The number of
Victorians by PGSI attempting suicide due to gambling problems was sourced from the National
Gambling-Harms Study data for those who reported that gambling contributed or caused them to
attempt suicide in a 12-month period (Browne et al. 2016).
As shown in Table 16, approximately 7.5 per cent of problem gamblers had attempted suicide due
to their gambling, followed by smaller percentages for moderate- and low-risk gamblers. The
emotional distress cost proxy of $7641 (VOCAT 2015) was used as the cost per attempted suicide,
bringing the total cost to Victorian gamblers of attempted suicide to $67.3 million.
The cost of emotional distress to the gambler due to suicide ideation in Victoria 2014–15 was
approximately $289 million, calculated using the following approach:
Estimate the number of gamblers by PGSI with suicide ideation by applying a ratio of
suicide attempts to suicide ideation of 1 to 4.3, as estimated from VCEC (2012) numbers.
To avoid double-counting costs, subtract the number of suicide attempts from the total
suicide ideations.
Multiply the adjusted figures for suicide ideation by the emotional distress cost proxy of
$7641 (VOCAT 2015) per incidence.
Table 16: Cost of suicide attempts and ideation due to gambling problems, Victoria
(2014–15)
Variable
Calculation Low-risk gamblers
(PGSI 1–2)
Moderate-risk gamblers
(PGSI 3–7)
Problem gamblers (PGSI 8+)
Total gambling problems
Victorian population (n)
n = 391,206 n = 122,667 n = 35,415 n = 549,289
Cost of attempted suicide
% gambling contributed to or caused them to attempt suicide
a 1.9% 0.7% 7.5%
Number of attempted suicides
b = a × n = 80%
5,980 710 2,112 8,802
Cost of suicide attempts
c $7,641
Sub-total cost of attempted suicide
d = b × c $45,694,868 $5,427,064 $16,137,785 $67,259,718
Cost of suicide ideation
Number for whom gambling contributed to or caused suicide ideation
e = b × 4.3 25,715 3,054 9,082 37,851

The social cost of gambling to Victoria Browne et al.
Victorian Responsible Gambling Foundation Page 58
Variable
Calculation Low-risk gamblers
(PGSI 1–2)
Moderate-risk gamblers
(PGSI 3–7)
Problem gamblers (PGSI 8+)
Total gambling problems
Victorian population (n)
n = 391,206 n = 122,667 n = 35,415 n = 549,289
Cost of suicide ideation
f $7,641
Sub-total cost of suicide ideation
g = (e – b) × f $150,793,065 $17,909,312 $53,254,692 $221,957,069
Total cost d + g $196,487,933 $23,336,376 $69,392,477 $289,216,787
Costing emotional and psychological distress to the gambler
Emotional and psychological distress to individuals is considered in terms of its impact on their
health and wellbeing. In isolation (i.e. excluding consequent issues such as increased reliance on
services), this impact can be considered an ‘intangible’ cost, in that it is not realised as a financial
burden. However, these intangibles should arguably be included in any costing, since emotional
and psychological harm or distress represents one of the major impacts of gambling. Therefore,
the current study considered the impact of this component on the individual’s quality of life, as
indicated by the Disability Weights (DWs) estimated by Browne et al. (2016) for the PGSI.
DWs are bounded on a 0–1 scale and describe an impact on an individual’s quality of life from
none at all (0) to so extreme such that life is not worth living (1). DWs can be converted into
disability adjusted life years (DALYs) and then into monetary terms using median Australian GDP
per capita (VCEC 2012). The VCEC (2012) notes that DALYs provide a clear method to determine
the costs of harm based on the impact on an individual’s quality of life. However, they also state
that a degree of subjectivity is required in determining key inputs. The approach of Browne et al.
(2016) to estimate DWs is data driven and arguably represents the community consensus
regarding the typical harm impact associated with a given degree of gambling problems.
Browne et al.’s (2016) dataset contains 3076 cases, and associates self-reported harm from six
domains with DW scores inferred from administration of the PGSI. One of the harm domains is
‘emotional and psychological’. Accordingly, the authors aimed to determine the proportion of
variance in DW that could be attributed to emotional and psychological distress. Lindeman,
Merenda and Gold (1980) describe a method for partitioning an 𝑅2 for correlated predictors by
averaging over models specifying all possible orders of predictors. The method is implemented by
the package relaimpo (Groemping 2006) in the R statistical programming environment (Team
2013). Applying this to Browne et al.’s (2016) data, 29.3 per cent of gambling DW variance could
be attributed to emotional and psychological harms, 25.9 per cent to financial deprivation, 15.9 per
cent to health, 15.8 per cent to relationships, 6.7 per cent to socially deviate consequential
behaviour and 6.3 per cent to work or study issues. A year of life spent in Australia spent in optimal
health and wellbeing was costed at $37,828.25 based on available 2014 International Monetary
Fund data10. Using this model, costing the fraction of life lost to emotional and psychological harms
disability attributable to gambling problems is given by the following equation:
𝐶=GDP per capita∙attributable fraction∙DALY
10 Sourced from https://www.imf.org/external/pubs/ft/weo/2015/02/weodata/index.aspx

The social cost of gambling to Victoria Browne et al.
Victorian Responsible Gambling Foundation Page 59
or
𝐶 = $37,825.85 ∙ .293 ∑ 𝐷𝑊𝑘 ∙ 𝑁𝑘
𝑘
which was calculated at $1,126,932,884.
See Table 17 for the cost of emotional and psychological harms to gamblers by PGSI category.
Table 17: Cost of emotional and psychological harms to gamblers, Victoria (2014–15)
PGSI group Low-risk gamblers
(PGSI 1–2)
Moderate-risk gamblers
(PGSI 3–7)
Problem gamblers (PGSI 8+)
Total gambling problems
Victorian population
n = 391,206 n = 122,667 n = 35,415 n = 549,289
Share of the total cost
50.3% 34.5% 15.2% 100.0%
Total cost $566,286,653 $389,181,066 $171,465,281 $1,126,933,884
Importantly, the emotional and psychological harm domain, as measured by Browne et al. (2016),
excludes depression and suicide ideation, which is assessed under the health domain. Therefore,
the dominance analysis described in the methodology attributes a proportion of the variance in
DWs to emotional and psychological harms excluding these issues. This avoids double-counting
issues arising from comorbidity between these harms.
Relationships and family harms
The relationships between persons with gambling problems and affected others (including family,
friends and community) has been identified as a prominent harm domain centred around
relationship disruption, conflict and breakdown (Langham et al. 2016; Browne et al. 2016). The
quantifiable gambling-related relationship harms in the current costings are the financial and
emotional distress costs of divorce and separation, and the emotional distress costs of
experiences of violence (gambler and affected others), gambler suicide attempts and fatality by
suicide to affected others, and ‘other’ emotional distress to affected others.
As with the emotional and psychological harm items costs, all ‘emotional distress’ items were
costed at $7641 per person, sourced from VOCAT’s (2015) compensation schedule for the
‘average amount of financial assistance awarded to victims of crime on final determination in
2014–15’.
The method of estimating the number of affected others for a cost item is described in each
subsection.
Cost of divorce and separation
Three costings of the impacts of gambling-related divorce and separation were estimated:
the financial cost of divorce and separation to the gambler ($24.2 million)
the cost of emotional distress from divorce and separation to the gambler ($112.3 million)

The social cost of gambling to Victoria Browne et al.
Victorian Responsible Gambling Foundation Page 60
the cost of emotional distress from divorce and separation to affected others ($617.9
million).
The number of persons divorced or separated due to gambling problems by PGSI category was
calculated from the National Gambling-Related Harms study for the percentage of respondents
whose gambling contributed to or caused the actual separation or ending of a relationship during a
12-month period (Browne et al. 2016), projected onto the estimated Victorian population from the
Victorian Gambling and Health Study dataset (Hare 2015).
The number of others affected by gambling-related divorce or separation was calculated by
multiplying the estimated number of gamblers impacted by divorce or separation within each PGSI
category (after the 80 per cent counterfactual adjustment) by the average number of affected
others in the household (1.6 people). The latter was estimated by using a proxy of the average
Australian household size (2.6, sourced from 2011 Census – ABS 2015d) minus the gambler,
assuming conservatively that divorce or separation will impact the immediate family and others
living in the household.
Consistent with the methodology of the PC (1999) and VCEC (2012), the financial cost per divorce
or separation was quantified as $1646 in 2014–15, which combines the costs of:
$845 for court fees associated with the application for divorce (Family Court of Australia &
Federal Circuit Court of Australia 2012, inflated to 2014 price)
$801 as the average legal fee related to divorce (Australian Government 2015).
The emotional distress cost proxy of $7641 was used in the cost calculations of the emotional
distress of divorce and separation to the gambler and affected others separately.
Table 18 shows the estimated cost of divorce/separation in Victoria by PGSI category. The total
cost of divorce and separation in Victoria due to gambling problems in 2014–15 was estimated at
$754 million. Over 80 per cent of the cost ($618 million) is attributable to the emotional distress
experienced by affected others, and of that more than half ($384 million) relates to the impact on
affected others by problem gamblers. This is not surprising considering that divorce and separation
impact strongly upon the immediate family and even wider networks of friends and the community
(Dowling et al. 2014; Dowling et al. 2015; Holdsworth et al. 2013).
Table 18: Cost of divorce and separation due to gambling problems, Victoria (2014–15)
Variable
Calculation Low-risk gamblers
(PGSI 1–2)
Moderate-risk gamblers
(PGSI 3–7)
Problem gamblers (PGSI 8+)
Total gambling problems
Victorian population
(n) n = 391,206 n = 122,667 n = 35,415 n = 549,289
% gambling contributed to or caused divorce or separation
a 1.9% 3.3% 19.5%
Number divorced or separated
b = a × n × 80%
5,980 3,196 5,517 14,693
Financial cost of divorce or separation to gambler

The social cost of gambling to Victoria Browne et al.
Victorian Responsible Gambling Foundation Page 61
Variable
Calculation Low-risk gamblers
(PGSI 1–2)
Moderate-risk gamblers
(PGSI 3–7)
Problem gamblers (PGSI 8+)
Total gambling problems
Victorian population
(n) n = 391,206 n = 122,667 n = 35,415 n = 549,289
Financial cost of divorce or separation
c $1,646
Sub-total financial cost to gambler
d = b × c $9,844,221 $5,261,280 $9,081,796 $24,187,297
Cost of emotional distress from divorce or separation to the gambler
Emotional cost of divorce or separation
e $7,641
Sub-total cost of emotional distress to gambler
f = b × e $45,694,868 $24,421,789 $42,155,848 $112,272,505
Cost of emotional distress from divorce or separation to affected others
Average number of persons per household, excluding gambler – affected others impacted
g 1.6
Number of others affected by gambling-related divorce or separation
h = b × g 9,568 21,029 50,272 80,869
Emotional cost of divorce or separation
i $7,641
Sub-total cost of emotional distress to affected other
j = h × i $73,111,789 $160,679,868 $384,126,043 $617,917,699
Total cost of divorce and separation
d + f + j $128,650,878 $190,362,937 $435,363,687 $754,377,502
Cost of experiences of violence
Gambling problems have shown to contribute to experiences of violence (whether as the
perpetrator or the victim), such as family or intimate partner (domestic) violence (Langham et al.
2016; Dowling et al. 2014; Suomi et al. 2013). Two costings of the impacts of gambling-related
experiences of violence were estimated:
the cost of emotional distress from experiences of violence to the gambler ($46.7 million)
the cost of emotional distress from experiences of violence to affected others ($74.7
million).
In the National Gambling-Related Harms study, gamblers were asked whether their gambling
problems had caused or contributed to experiences of violence (including family and domestic
violence) during a 12-month period (Browne et al. 2016). Table 19 shows that nearly 10 per cent of
problem gamblers reported experiences of violence, followed by 1.3 per cent for moderate-risk and
less than 1 per cent for low-risk gamblers, showing that violence increased by gambling severity.
The number of people in the Victorian population in 2014 with experiences of violence due to

The social cost of gambling to Victoria Browne et al.
Victorian Responsible Gambling Foundation Page 62
gambling problems by PGSI was calculated with an 80 per cent counterfactual adjustment applied,
giving a result of approximately 6110 people. Applying the average number of affected others in
the household (1.6 people) by PGSI category, the estimated number of affected others impacted
by gambling-related experiences of violence was 9778.
The emotional distress proxy of $7641 for the cost of experience of violence per person per year
was applied to both gamblers and affected others, estimating the total cost at $121 million in 2014–
15, just less than half being borne by problem gamblers ($55.9 million).
It is noted that while the cost of family violence to gamblers due to gambling problems has been
costed previously by the VCEC (ranging from $3 million to $8 million), no attempt was made to
cost the emotional distress of gambling-related violence to affected others. To our knowledge, the
current study is the first attempt to do so.
Table 19: Cost of experiences of violence due to gambling problems, Victoria (2014–15)
Variable
Calculation Low-risk gamblers
(PGSI 1–2)
Moderate-risk gamblers
(PGSI 3–7)
Problem gamblers (PGSI 8+)
Total gambling problems
Victorian population (n)
n = 391,206 n = 122,667 n = 35,415 n = 549,289
% gambling contributed to or caused experiences of violence (including family and domestic violence)
a 0.6% 1.3% 9.9%
Number who experienced violence due to gambling
b = a × n × 80%
1,993 1,302 2,816 6,112
Emotional distress from experiences of violence to the gambler
Cost of experiences of violence
c $7,641
Sub-total cost of violence to the gambler
d = b × c $15,231,623 $9,949,618 $21,517,047 $46,698,288
Emotional distress from experiences of violence to affected others
Average number of persons per household, excluding gambler – affected others impacted
e 1.6
Number of others affected by gambling-related experiences of violence
f = b × e 3,189 2,083 4,506 9,778
Cost of experiences of violence
g $7,641
Sub-total cost of violence to affected others
h = f × g $24,370,596 $15,919,389 $34,427,276 $74,717,260
Total cost of experiences of violence
d + h $39,602,219 $25,869,006 $55,944,323 $121,415,548
Cost of suicide attempts and fatality by suicide to affected others
The previous ‘Emotional and psychological harms’ section covered the cost of suicide attempts as
an emotional distress to the gambler themselves, and the cost of fatality by suicide as loss of

The social cost of gambling to Victoria Browne et al.
Victorian Responsible Gambling Foundation Page 63
productive years the gambler would have lived. However, suicide attempts and fatality by suicide
have a much wider cost as they also impact others close to the gambler, such as family, friends,
colleagues and the community. On average, it is estimated that each suicide impacts at least 6
other people close to the person (Beautrais 2004; ConNetica 2016).
One limitation of previous costings by the PC (1999, 2010), ACG (2011) and VCEC (2012) was the
absence of costing for fatality by suicide due to gambling problems, and therefore an attempt has
been made to quantify this cost in this study.
The emotional distress cost estimates of a gambler’s suicide attempt and of fatality by suicide on
affected others are shown in Table 20 to be approximately $430 million in Victoria in 2014–15.
Two-thirds of that costs ($292.4 million) is attributable to low-risk gamblers who are greater in
number and therefore impact a greater number of people. The approach to estimating this cost
were as follows:
Estimate the number of fatalities by suicide due to gambling problems by PGSI category
by dividing the number of attempted suicides (after 80 per cent adjustment) by the ratio of
suicide attempts to fatality by suicide (15 suicide attempts per 1 fatality by suicide, as cited
by Doran et al. 2015).
Multiply the number of gambler attempted suicides and fatality by suicide (after 80 per cent
counterfactual adjustment) by 6 to get the number of affected others impacted by the
attempted suicide and fatality by suicide of a gambler.
Sum the total number of others affected by attempted suicide and fatality by suicide, then
multiply for each PGSI category by the emotional distress proxy of $7641 for the cost per
person.
Table 20: Cost of attempted suicide and fatality by suicide due to gambling problems on
affected others, Victoria (2014–15)
Variable
Calculation Low-risk gamblers
(PGSI 1–2)
Moderate-risk gamblers
(PGSI 3–7)
Problem gamblers (PGSI 8+)
Total gambling problems
Victorian population (n)
n = 391,206 n = 122,667 n = 35,415 n = 549,289
Emotional distress from attempted suicide of gambler to affected others
% gambling contributed to or caused them to attempt suicide
a 1.9% 0.7% 7.5%
Number who attempted suicide
b = a × n × 80%
5,980 710 2,112 8,802
Average number of other persons impacted by suicide
c 6
Number of others affected by gambler attempted suicide
d = b × c 35,881 4,262 12,672 52,815

The social cost of gambling to Victoria Browne et al.
Victorian Responsible Gambling Foundation Page 64
Variable
Calculation Low-risk gamblers
(PGSI 1–2)
Moderate-risk gamblers
(PGSI 3–7)
Problem gamblers (PGSI 8+)
Total gambling problems
Victorian population (n)
n = 391,206 n = 122,667 n = 35,415 n = 549,289
Cost of emotional distress of affected others by gambler attempted suicide
e $7,641
Sub-total cost of attempted suicide to affected others
f = d × e $274,169,209 $32,562,386 $96,826,713 $403,558,307
Emotional distress from fatality by suicide by gambler to affected others
Number of gambler fatalities by suicide
g = b / 15 399 47 141 587
Number of others affected by gambling-related fatality by suicide
h = c × g 2,392 284 845 3,521
Cost of emotional distress of affected others by gambler’s fatality by suicide
i $7,641
Sub-total cost of fatality by suicide to affected others
j = h × i $18,277,947 $2,170,826 $6,455,114 $26,903,887
Total cost f + j $292,447,156 $34,733,211 $103,281,827 $430,462,194
Cost of other emotional distress to affected others
The emotional distress to affected others due to another’s gambling problems extend into a
multitude of experiences other than those that have already been costed (divorce and separation,
experience of violence, and the impact of the gambler’s attempted suicide or fatality by suicide).
Previous research suggests that the same types of emotional and psychological harms that
gamblers experience are also experienced by affected others, such as depression, feelings of
vulnerability, shame, feelings of hopelessness, anger, worthlessness and being a failure (Langham
et al. 2016; Browne et al. 2016), although the precise mix of symptomology may vary according to
whether one is the gambler or the affected other. To calculate the cost of ‘other emotional distress’
to affected others, we must first estimate the total population in Victorian who are impacted by
another with gambling problems.
The Productivity Commission (1999) suggested that a gambler in Australia affects between 5 and
10 other individuals. Though this figure has been cited often in the literature and in non-academic
communications, no evidence has been offered to support this statement. A similarly non-precise
estimate of ‘at least 10 people’ has been attributed to Ladouceur (1993, as cited in Ferland et al.
2008).

The social cost of gambling to Victoria Browne et al.
Victorian Responsible Gambling Foundation Page 65
Recently, population level gambling studies have started to collect data on the impact the gambler has on significant others. The 2014 Victorian Gambling and Health Study (Hare 2015) asked a sample of 15,000 Victorians (gamblers and non-gamblers) whether they had experienced problems because of someone else’s gambling in the last 12 months and found that around 2.79 per cent had been impacted (an estimated 122,493 Victorian adults). The authors concluded that this suggests that a problem gambler impacts on average 3–4 persons, but that this is likely an underestimate given the data is based on self-reporting of friends and family who may not be aware that gambling is impacting their lives when the gambler is secretive about their gambling.
Abbott et al. (2014) found that 8 per cent of the New Zealand population were affected by the gambling of someone close to them. Given that the prevalence of problem gambling in New Zealand is estimated to be less than 1 per cent (Devlin and Walton 2012), this figure presumably includes those who are affected by individuals in other PGSI categories.
Goodwin and colleagues (2017) analysed data gathered from Browne et al.’s (2016) national survey which examined gambling-related harm to gamblers and affected others. Gamblers were asked to report the number of people who they believed had been affected by their gambling, and likewise affected others reported the number of people (including themselves) affected by the gambler who affects them. Taking into account both data points, the authors concluded that a typical problem gambler affects 6 others, a moderate-risk gambler affects 3 others, and a low-risk gambler affects 1 other person.
Projecting these ratios of gamblers to affected others onto the Victorian population, the total number of affected others is 971,700 people (low-risk = 391,206; medium-risk = 368,001; problem gambler = 212,493) or 22.1 per cent of the Victorian population. It is theorised by the current authors that:
Similar to gamblers, a percentage of harm to others would be experienced in the absence of gambling. For consistency, the assumption is again incorporated via a 20 per cent counterfactual discount.
It is likely that a good percentage of this population would only be experiencing minor harms, not enough to cause a high degree of emotional distress resulting in costs.
Considering the above assumptions, the costs of ‘other emotional distress’ were calculated as follows:
The number of persons in Victoria affected by someone else’s gambling were calculated by multiplying the prevalence of gambling problem by PGSI category (Victorian Gambling and Health Study 2014 weighted dataset, Hare 2015) to the ratio of gambler to affected others (1:1 for low-risk gamblers, 1:3 for moderate-risk gamblers, and 1:6 for problem gamblers) × 80 per cent counterfactual adjustment.
To avoid double-counting for emotional distress already costed, the number of affected others by divorce or separation, experience of violence, attempted suicide and fatality by suicide were subtracted (the 80 per cent counterfactual adjustment having already been applied).
This number was then adjusted to the proportion reporting to experience moderate to major emotional and psychological impacts from another’s gambling (Browne et al. 2016) –

The social cost of gambling to Victoria Browne et al.
Victorian Responsible Gambling Foundation Page 66
6.5 per cent of low-risk gamblers, 16.4 per cent of moderate-risk gamblers and 53.9 per
cent of problem gamblers.
The adjusted number of affected others experiencing moderate to major emotional and
psychological impacts due to another’s gambling problems was multiplied by the emotional
distress proxy of $7641 per person.
As shown in Table 21, the estimated number of affected others (n = 115,514) is in line with the
2014 Victorian Gambling Prevalence Study’s estimate (n = 122,493). The total cost of other
emotional distress experienced by affected others of persons with gambling problems is estimated
at $843 million.
Table 21: Cost of other emotional distress to affected others due to gambling problems,
Victoria (2014–15)
Variable
Calculation Low-risk gamblers
(PGSI 1–2)
Moderate-risk gamblers
(PGSI 3–7)
Problem gamblers (PGSI 8+)
Total gambling problems
Victorian population (n)
n = 391,206 n = 122,667 n = 35,415 n = 549,289
Ratio of other person’s gambling problems impact – affected others
a 1 3 6
Number of others affected by gambling-related problems
b = a × n × 80%
312,965 294,401 169,994 777,360
Divorce or separation – number of affected others
c 9,568 21,029 50,272 80,869
Experience of violence – number of affected others
d 3,189 2,083 4,506 9,778
Suicide attempts – number of affected others
e 35,881 4,262 12,672 52,815
Fatality by suicide – number of affected others
f 2,392 284 845 3,521
% others affected reporting a moderate to major emotional and psychological impact from another’s gambling
g 6.5% 16.4% 53.9%
Estimated number of affected others with moderate to major emotional distress
h = (b – c – d – e – f) × g
16,899 43,822 54,793 115,514
Cost of emotional distress of affected others by another’s gambling problems
i $7,641
Total cost h × i $129,124,853 $334,844,790 $418,671,785 $882,641,428

The social cost of gambling to Victoria Browne et al.
Victorian Responsible Gambling Foundation Page 67
Productivity loss and work impact costs
Harms from gambling problems can cross over into a gambler’s working life, affecting their
employment and their employer. These harms can range from reduced performance at work (i.e.
by spending more time preoccupied with gambling), absenteeism, job loss and acts of crime (i.e.
stealing from an employer to fund gambling activity) (Langham et al. 2016; Browne et al. 2016).
Using the gambling-related harms framework to quantify the years of healthy life lost due to
gambling in Victoria, Browne et al. (2016) found work and study harms attributed to 8.66 per cent
of years of healthy life lost in Victoria. While this proportion is small compared to the other harm
domains, the financial costs of gambling-related work harms could be considerable.
The costs of gambling problems in Victoria in the work domain have been estimated by covering
the following items:
the cost of loss of work productivity
the cost of job loss
the cost of absenteeism
the cost of crime to business
the cost of fatality by suicide.
A similar approach to the VCEC (2012) was taken in costing loss of work productivity, job loss
(called ‘job change’ by the VCEC) and the cost of crime to business. To our knowledge, the current
study is the first to attempt to quantify the cost of absenteeism due to gambling problems.
Cost of loss of work productivity
Calculating the cost of lost work productivity due to gambling required:
the number of people experiencing productivity loss at work due to gambling problems by
PGSI category
a cost proxy for the value of lost productivity.
The Productivity Commission’s 1999 approach to estimating the number of people included a
lower and upper estimate by multiplying the number of people reporting adverse effect on job
performance ‘sometimes to always’ (low estimate of 7000 people) and ‘often to always’ (high
estimate of 49,200 people) by the ‘extent of productivity loss’ (7.9 per cent as reported from their
Survey of Clients of Counselling Agencies) and then multiplying this by the value of productivity,
using average annual earnings as a proxy (PC 1999). The VCEC (2012) used a mixture of data
sources to estimate the lower and upper numbers as 1100 and 7600 respectively, again applying
the 7.9 per cent productivity loss adjustment used by the PC and 2010 earnings data.
In the current analysis, the number experiencing lost work productivity due to their gambling was
calculated from the National Gambling-Related Harms study for the percentage of respondents
experiencing ‘reduced performance at work or study as a result of their gambling’ during a 12-
month period (Browne et al. 2016) projected onto the Victorian population by PGSI category from
the 2014 Victorian Gambling and Health Study weighted dataset (Hare 2015).

The social cost of gambling to Victoria Browne et al.
Victorian Responsible Gambling Foundation Page 68
As per the PC (1999) and VCEC (2012), the cost of lost work productively annually per case was
estimated as the average annual earnings in Victoria in 2014 (ABS 2015b).
Table 22 breaks down the costs of lost work productivity to the employer in Victoria by PGSI
category. The total cost associated with the lost annual earnings due to lost work productivity is
estimated to be $323 million to Victorian businesses in 2014–15, with approximately 60 per cent of
this cost being attributable to problem gamblers ($189 million) followed by moderate-risk gamblers
($111 million) and low-risk gamblers ($23 million).
Table 22: Cost of loss of work productivity due to gambling problems, Victoria (2014–15)
Variable
Calculation Low-risk gamblers
(PGSI 1–2)
Moderate-risk gamblers
(PGSI 3–7)
Problem gamblers (PGSI 8+)
Total gambling problems
Victorian population (n)
n = 391,206 n = 122,667 n = 35,415 n = 549,289
% reduced work productivity due to gambling
a 3.2% 12.5% 30.4% 24.0%
Number with reduced work productivity due to gambling
b = a × n = 80%
9,967 12,311 8,620 30,899
Average annual earnings
c $72,036
Total cost b × c $22,865,648 $111,255,846 $188,937,938 $323,059,432
Cost of job loss
Job loss is a gambling-related harm outcome which can result from other harms, such as reduced
productivity at work (Langham et al. 2016; Browne et al. 2016). All studies which have costed
problem gambling to date have looked at the cost of job change associated with gambling (PC
1999, 2010; ACG 2011; VCEC 2012). The current methodology will follow this precedent, with the
exception of defining the cost item as ‘job loss’ and costing for all gambling severity levels, which
includes counting the following impacts:
the cost of loss of income to the gambler
the cost of job search to the gambler
the cost of job search to replace the employee to business
the cost of unemployment benefits to the government.
The total cost of gambling-related job loss in Victoria in 2014–15 is estimated at $176 million. As
per Table 23, the calculation assumption, methods and results for each cost item are as follows:
The number of persons in Victoria with gambling-related job loss was sourced from
prevalence figures from the National Gambling-Related Harms study by Browne et al.
(2016), which found that 11.1 per cent of problem gamblers experienced job loss due to
their gambling, followed by 1.7 per cent of moderate-risk gamblers and 0 per cent of low-
The social cost of gambling to Victoria Browne et al.
Victorian Responsible Gambling Foundation Page 69
risk gamblers. A counterfactual adjustment of 80 per cent was applied, the final estimate of
job loss in Victoria being 4804 in 2014–15.
Loss of income
o The gambler will experience a loss of income from unemployment which will last for a
medium duration of 17 weeks, or 3.9 months, as sourced from (ABS 2013).
o The estimate of cost per person is the average monthly earnings (estimated from
average weekly earnings in Victoria – ABS 2015c) multiplied by the median duration of
unemployment.
o The total cost of loss of income to the gambler due to job loss is approximately $113
million.
Job search
o The average cost of searching for a new job for the gambler is $3714. Since no recent
estimate was available, this figure was inflated from the VCEC 2010–11 estimate of
$3398 to 2014 prices using CPI (ABS 2015c). The VCEC estimate was also an
inflation of the (PC 1999) estimate.
o The total cost of job search for persons in Victoria with gambling problems in 2014–15
was $17.8 million.
Staff replacement costs to the employer
o There is a cost to the employer of replacing a staff member who has lost their job due
to gambling problems, the assumption being that the cost is 10 per cent of the average
annual income (PC 1999; VCEC 2012).
o The average annual income in Victoria for 2014–15 was $72,036 (ABS 2015b).
o The total cost to the employer of gambling-related staff replacement in Victorian 2014–
15 is estimated at $34.6 million.
Unemployment benefit costs to the government
o There is a cost to the government of providing unemployment benefits to people who
have lost their job due to gambling problems.
o The assumption is that 50 per cent of people who have lost their job will be eligible to
receive unemployment benefits (PC 1999; VCEC 2012).
o The monthly Newstart Allowance is used as the cost proxy for unemployment benefits
(DHS 2016).
o The total cost of unemployment benefits is calculated as the number of people with job
loss due to gambling (after 80 per cent counterfactual applied) × 50 per cent × median
duration of unemployment × monthly cost of unemployment benefits. The total is
estimated at $10.8 million in Victoria in 2014–15.

The social cost of gambling to Victoria Browne et al.
Victorian Responsible Gambling Foundation Page 70
Table 23: Cost of job loss due to gambling problems, Victoria (2014–15)
Variable
Calculation Low-risk gamblers
(PGSI 1–2)
Moderate-risk gamblers
(PGSI 3–7)
Problem gamblers (PGSI 8+)
Total gambling problems
Victorian population (n)
n = 391,206 n = 122,667 n = 35,415 n = 549,289
% job loss due to gambling
a 0.0% 1.7% 11.1%
Number who lost job due to gambling
b = a × n = 80%
0 1,657 3,146 4,804
Loss of income
Average duration of unemployment – months
c 3.9
Average monthly earnings
d $6,003
Sub-total loss of income
b × c × d $0 $39,028,720 $74,099,158 $113,127,878
Job search
Cost of job search e $3,714
Sub-total cost of job search
b × e $0 $6,155,901 $11,687,472 $17,843,373
Employer costs
Employer staff replacement costs as percentage of salary
f 10%
Average annual earnings g $72,036
Sub-total employer costs
b × f × g $0 $11,938,197 $22,665,625 $34,603,821
Unemployment benefits
Proportion of job changes eligible for unemployment benefits
h 50%
Monthly cost of unemployment benefits
i $1,143
Sub-total unemployment benefits
b × c × h × i $0 $3,716,082 $7,055,280 $10,771,362
Total cost $0 $60,838,899 $115,507,534 $176,346,434
Cost of absenteeism
To date, no attempts have been made to estimate the cost of gambling-related absenteeism from
work to the employer. The present approach in calculating this cost included estimating the
number of Victorians by PGSI who were absent from work due to gambling, applying an 80 per
cent adjustment, and multiplying this by the annual cost per employee per year to the employer.
The number of gamblers absent from work due to their gambling was calculated from the National
Gambling-Related Harms study for the percentage of respondents who ‘experienced an absence
from work as a result of their gambling’ during a 12-month period (Browne et al. 2016) projected

The social cost of gambling to Victoria Browne et al.
Victorian Responsible Gambling Foundation Page 71
onto the Victorian population by PGSI category from the 2014 Victorian Gambling and Health
Study dataset (Hare 2015). A causality adjustment of 80 per cent was then applied.
Conducted annually since 2008, the most recent Absence Management Survey (Direct Health
Solutions 2013) surveyed over 108 organisations in Australia on absenteeism, with businesses
reporting the cost per employee per annum as approximately $2741. This figure was inflated from
2013 to 2014 prices using CPI (ABS 2015c) to give $2788, then multiplied by the adjusted number
absent from work due to gambling problems to get a total cost of absenteeism.
Table 24 shows the cost of absenteeism to the employer due to gambling problems by PGSI
category. In total, absenteeism due to gambling problems cost Victoria an estimated $46 million in
2014–15 and has a similar cost across different levels of gambling problems.
Table 24: Cost of absenteeism due to gambling problems, Victoria (2014–15)
Variable
Calculation Low-risk gamblers
(PGSI 1–2)
Moderate-risk gamblers
(PGSI 3–7)
Problem gamblers (PGSI 8+)
Total gambling problems
Victorian population (n)
n = 391,206 n = 122,667 n = 35,415 n = 549,289
% absent from work due to gambling
a 1.9% 4.6% 21.7%
Number absent from work due to gambling
b = a × n = 80%
5,980 4,498 6,149 16,628
Average annual cost per employee
c $2,788
Total cost b × c $16,672,788 $12,541,171 $17,143,961 $46,357,920
Cost of gambling-related crime to business
The VCEC (2012) estimated the number of problem gamblers committing gambling-related crimes
involving businesses in 2010–11 at 1800 people. Their calculations used the Victorian Gambling
and Health Study 2008 weighted dataset (Hare 2009) and Victorian crime statistics data. The 2008
Victorian Gambling and Health Study asked moderate-risk and problems gamblers whether their
gambling led them to do something that is technically against the law, with 3 per cent and 15 per
cent respectively answering that they had, resulting in an estimate by the VCEC of approximately
4500 people (VCEC 2012). Using findings from Victorian crime statistics that around 40 per cent of
burglaries and deception crimes occur to businesses, the VCEC then applied a 40 per cent
adjustment to the Victorian Gambling and Health Study number to result in an estimate of 1800
people committing a gambling-related crime against business.
A criticism of the VCEC methodology to cost gambling-related crime is a lack of data which
measured a direct link of crime to business being committed as a result of gambling. The current
study aimed to seek out such data.
First we looked at the most recent 2014 Victorian Gambling and Health Study weighted dataset
(Hare 2015), but this was ruled out as a source of gambling-related crime data as it did not ask the
same question as the 2008 Victorian Gambling and Health Study. The closest question asked in
Victorian Gambling and Health Study 2014 was whether those seeking treatment for gambling
problems were prompted into action by legal problems (0.4 per cent of moderate-risk gamblers, 0.8
per cent of problem gamblers). Secondly, studies of gambling-related crime to business were

The social cost of gambling to Victoria Browne et al.
Victorian Responsible Gambling Foundation Page 72
reviewed, but these studies often surveyed populations who had already been charged or
incarcerated for a crime and whether the crimes were committed due to gambling addiction (Abbott
& McKenna 2005; Minchin 2006; Westphal & Johnson 2006).
Lastly, gambling-related harm items associated with crime from the National Gambling-Related
Harms study were examined (Browne et al. 2016). The study asked respondents four questions
about gambling-related crime, one of which asked whether they had ‘committed a crime towards
government, business, other people (not family or friends) due to their gambling’ (over a 12-month
period). Around 12.3 per cent of problem gamblers answered that they had, followed by 3 per cent
of moderate-risk gamblers and 0.6 per cent of low-risk gamblers.
The research to date on gambling-related crime does not appear to provide a good estimate of the
average monetary value of the gambling-related crime per gambler. Most studies have looked at
crimes to business which involved a substantial amount of money, such as fraud or theft into the
millions of dollars (Warfield 2011 2012). Warfield (2012) studied 89 fraud cases in Australia
resulting in prison sentences due to $1 million or more being stolen, and found that more than half
(46 cases) had gambling addiction as the motivating factor for the fraud, totalling around $165
million.
In the absence of any available recent estimates of the average cost of crime to business due to
gambling problems, we used the same cost estimate per case as the PC (1999) and VCEC (2012)
– the estimate of the value of money or goods stolen from the business as a result of problem
gambling. While the PC and VCEC used lower and upper estimates of costs, our approach was to
take the average of these estimates. VCEC cost estimates per person of $2100 (low) and $3000
(high) were inflated to 2014 prices using CPI (ABS 2015c) and averaged at $2788.
Table 25 shows the estimated cost of gambling-related crime to business by PGSI category. The
total cost to Victorian businesses in 2014–15 was estimated at $22.5 million, with the cost due to
moderate-risk and problem gamblers being similar ($8.2 million and $9.7 million respectively),
followed by low-risk gamblers at around $5.6 million.
Table 25: Cost of gambling-related crime to business, Victoria (2014–15)
Variable
Calculation Low-risk gamblers
(PGSI 1–2)
Moderate-risk
gamblers (PGSI 3–7)
Problem gamblers (PGSI 8+)
Total gambling problems
Victorian population (n)
n = 391,206 n = 122,667 n = 35,415 n = 549,289
% who committed a crime towards government, business, other people (not family or friends) due to gambling
a 0.6% 3.0% 12.3%
Number who committed a crime due to gambling
b = a × n × 80%
1,993 2,959 3,491 8,444
Value of money and goods stolen from business per incident
c $2,788
Total cost b × c $5,556,647 $8,249,363 $9,731,943 $23,537,953

The social cost of gambling to Victoria Browne et al.
Victorian Responsible Gambling Foundation Page 73
Cost of fatality by suicide
One limitation of previous costings by the PC, (1999, 2010), ACG (2011) and VCEC (2012) was
the absence of costing for fatality by suicide due to gambling problems. The emotional distress to
others close to the gambler has been costed. However, fatality by suicide also has an indirect cost
impact due to the year of life lost which would have been productively contributing (financially and
otherwise) to the community and economy (government).
An attempt has been made to quantify this cost (see Table 16) using the following steps:
Estimate the number of fatalities by suicide due to gambling problems by PGSI category
by dividing the number of attempted suicides (after 80 per cent adjustment) by the ratio of
suicide attempts to fatality by suicide (15 suicide attempts per 1 fatality by suicide, as cited
by Doran et al. 2015).
Estimate the average annual cost of fatality by suicide by dividing the total cost of fatality
by suicide by the average years of life lost by suicide (average life expectancy – average
age of fatality by suicide), giving $48,684 using the figures below:
o the total lifetime cost of fatality by suicide: $1,865,302 (Doran et al. 2015), inflated from
2012 to 2014 costs to $1,947,353
o the average life expectancy for SA males: 79.5 years (ABS 2012)
o the average age of fatality by suicide for SA males: 39.5 years (Doran et al. 2015)
o the average years of life lost due to fatality by suicide: 40 years (Doran et al. 2015).
Multiply the number of fatalities by suicide for each PGSI group by the annual cost of
fatality by suicide.
Using this method, the total cost of fatality by suicide due to gambling problems was estimated at
$28.6 billion in Victoria in 2014–15.
Table 26: Cost of fatality by suicide due to gambling problems, Victoria (2014–15)
Variable
Calculation Low-risk gamblers
(PGSI 1–2)
Moderate-risk gamblers
(PGSI 3–7)
Problem gamblers (PGSI 8+)
Total gambling problems
Victorian population (n)
n = 391,206 n = 122,667 n = 35,415 n = 549,289
% gambling contributed to or caused them to attempt suicide
a 1.9% 0.7% 7.5%
Number who attempted suicide
b = a × n × 80%
5,980 710 2,112 8,802
Number of fatalities by suicide
c = b / 15 399 47 141 587
Average annual cost of fatality by suicide
d $48,684
Total cost c × d $19,409,339 $2,305,198 $6,854,681 $28,569,219

The social cost of gambling to Victoria Browne et al.
Victorian Responsible Gambling Foundation Page 74
Crime-related costs
Cost of crime to the Victorian justice system
Gambling problems can result in the gambler committing crimes to support their gambling and, if
they are caught, these crimes generate costs arising from the resulting police investigation,
criminal charges and court appearance, or imprisonment (Langham et al. 2016; Browne et al.
2016; Perrone, Jansons & Morrison 2013). The cost of gambling-related criminal activity to the
Victorian criminal justice system – that is police, courts and the corrections systems – is estimated
in this section.
The total cost of crime to the Victorian justice system in 2014–15 is estimated at $100 million, as
shown in Table 27. The calculation assumption, methods and results for each cost item are as
follows:
The number of people in Victoria who committed a crime which could result in police
investigation, criminal charges or a conviction was sourced from the National Gambling-
Related Harms study (Browne et al. 2016). This study had four items in relation to crime
committed due to gambling:
o petty theft or dishonesty in respect to government, businesses or other people (not
family or friends)
o feeling compelled or forced to commit a crime or steal to fund gambling or pay debts
o taking money or items from friends or family without asking first
o being arrested for unsafe driving.
The first two items above, considered more serious crimes, were used to calculate the total
number of Victorians by PGSI category committing a crime due to gambling problems: 1.3
per cent of low-risk gamblers, 4.7 per cent of moderate-risk gamblers and 21.9 per cent of
problem gamblers (Browne et al. 2016). These percentages were then applied to the
estimated Victorian 2014 population. As per the PC (1999), ACG (2011) and VCEC (2012)
methodologies, no counterfactual adjustment of 80 per cent was applied.
Following the PC (1999), ACG (2011) and VCEC (2012) approaches, the percentage of
the total number who committed a crime due to gambling was split out into those resulting
in a police investigation, a court appearance and imprisonment.
Police incidents
o Approximately 36.5 per cent of crimes committed due to gambling problems result in
problems with the police (PC,1999 assumption), which is 0.5 per cent of low-risk
gamblers, 1.7 per cent of moderate-risk gamblers and 8 per cent of problem gamblers.
o The estimated cost per police incident is $417 (Report on Government Services –
Productivity Commission 2016b).
o The total cost of gambling-related crime to the Victorian police system in 2014–15 was
$2.8 million.

The social cost of gambling to Victoria Browne et al.
Victorian Responsible Gambling Foundation Page 75
Court appearances
o Approximately 86.3 per cent of the gambling-related crimes investigated by the police
result in an appearance in court on criminal charges (PC,1999 assumption), which is
0.4 per cent of low-risk gamblers, 1.5 per cent of moderate-risk gamblers and 6.9 per
cent of problem gamblers.
o The average cost per court matter is $781 (Report on Government Services –
Productivity Commission 2016b).
o The total cost of gambling-related crime to the Victorian court system in 2014–15 was
$4.6 million.
Imprisonment
o Approximately 40.5 per cent of the gambling-related crimes resulting in the gambler
appearing in court on criminal charges lead to a prison sentence (PC,1999
assumption), which is 0.2 per cent of low-risk gamblers, 0.6 per cent of moderate-risk
gamblers and 2.8 per cent of problem gamblers.
o The average prison sentence is 4 months (VCEC 2012).
o The cost of imprisonment per prisoner or offender per month is $9825 (Report on
Government Services – Productivity Commission 2016b).
o The total cost of gambling-related crime to the Victorian correctional system in 2014–
15 was $92.8 million.
Table 27. Cost of gambling-related crime to the Victorian justice system (2014–15)
Variable
Calculation Low-risk gamblers
(PGSI 1–2)
Moderate-risk gamblers
(PGSI 3–7)
Problem gamblers (PGSI 8+)
Total gambling problems
Victorian population
(n) n = 391,206 n = 122,667 n = 35,415 n = 549,289
% who committed a crime due to gambling
a 1.3% 4.7% 21.9%
Number who committed a crime due to gambling
b = a × n 4,984 5,771 7,758 18,513
Police system cost
% who committed a crime which resulted in being investigated by the police
c 0.5% 1.7% 8.0%
Number investigated by the police
d = c × n 1,819 2,106 2,832 6,757
Cost per police incident e $417
Sub-total cost to police system
d × e $758,516 $878,349 $1,180,862 $2,817,727
Court system cost

The social cost of gambling to Victoria Browne et al.
Victorian Responsible Gambling Foundation Page 76
Variable
Calculation Low-risk gamblers
(PGSI 1–2)
Moderate-risk gamblers
(PGSI 3–7)
Problem gamblers (PGSI 8+)
Total gambling problems
Victorian population
(n) n = 391,206 n = 122,667 n = 35,415 n = 549,289
% who committed a crime which resulted in police bringing criminal charges and a subsequent court appearance
f 0.4% 1.5% 6.9%
Number of court appearances
g = f × n 1,570 1,818 2,444 5,831
Cost per court matter h $781
Sub-total cost to court system
g × h $1,225,794 $1,419,448 $1,908,322 $4,553,563
Corrections system cost
% who committed a crime which resulted a court appearance resulting in a prison sentence
i 0.2% 0.6% 2.8%
Number with prison sentence j = I × n 636 736 990 2,362
Average sentence (months) k 4
Cost per prisoner or offender (per month)
l $9,825
Sub-total cost to corrections system
j × k × l $24,984,393 $28,931,500 $38,895,824 $92,811,717
Total cost to the Victorian justice system
$26,968,703 $31,229,297 $41,985,008 $100,183,007
Cost to the Victorian Government
This section considers the costs of problem gambling to the Victorian state and local governments,
covering the costs of:
policy, regulation, research and treatment services (Victorian Government)
the Victorian Government health and human services sector
the Victorian Government mental health sector
the Victorian Government sector providing homelessness services
local governments in Victoria.
Cost of policy, regulation, research and treatment
One of the major direct costs of gambling problems borne by the Victorian Government is that of
funding gambling policy and regulation, research and treatment services. As shown in Table 28, it
is estimated that in 2014–15 the Victorian Government spent at least $52 million on gambling
policy, regulation, research and treatment services. However, it should be noted that not all
administrative costs are necessarily related to problem gambling. As distinguishing ‘normal’

The social cost of gambling to Victoria Browne et al.
Victorian Responsible Gambling Foundation Page 77
administrative costs from others is not always possible, some costs in this component may be an
overestimate.
The Victorian Department of Justice and Regulation (formerly just called the Department of
Justice) outlines three main bodies responsible for gambling policy, regulation, research and
treatment support services (DJR 2016):
The Office of Liquor, Gaming and Racing (OLGR) in the Department of Justice and
Regulation is ‘the primary government point of references for industry, community and
government on gambling matters’. It provides strategic policy advice and support to the
Minister for Consumer Affairs, Gaming and Liquor Regulation and is responsible for
implementing key policies.
The Victorian Commission for Gambling and Liquor Regulation (VCGLR) is the Victorian
statutory authority responsible for the regulation of all forms of legalised gambling in
Victoria. This includes communication with the industry and the public about regulatory
practices and requirements.
The Victorian Responsible Gambling Foundation (VRGF) is an independent statutory
authority responsible for fostering a greater understanding of responsible gambling and
reducing the impact of gambling on the Victorian community. VRGF funds services for
people affected by problem gambling, community education and gambling research.
Where possible, the authors attempted to obtain a cost for each of the above authorities.
The Victorian Responsible Gambling Foundation is mostly funded by the Community Support Fund
(CSF) under its gaming portfolio; in 2014–15 the funds allocated to the foundation by the CSF
were $43,347,000 (DTF 2015). The foundation funded various projects in 2014–15 such as
Gambler’s Help services, Gambler’s Help line and Gambling Help Online, problem gambling
treatment services for culturally and linguistically diverse communities, State-wide problem
gambling and mental health programs, clinical development programs, Gambler’s Help local area
marketing grants, local prevention programs, gambling research program grants and a clinical
research program (VRGF 2015).
The CSF, which is itself funded by Victorian EGM revenues, also under the gaming portfolio,
funded the Pre-Commitment Implementation Project for $2.3 million in 2014–15 (DTF 2015). This
project is delivered by the Department of Justice and Regulation. By June 2015 YourPlay was
being piloted in 10 gaming venues and by December 2015 it had been rolled out to all Victorian
venues with EGMs, including Melbourne Casino (DJR 2016). The cost to venues of implementing
YourPlay is discussed in the next section of this report.
In their 2010–11 estimates, both the DOJ (Department of Justice, Victoria) and the VCGLR
provided the VCEC with estimates of $1.7 million and $5.1 million respectively for the cost of their
policy and regulatory activities on problem gambling (VCEC 2012). Cost estimates for 2014–15
were provided by VCGLR, who provided an estimate of $4.39 million attributable to problem
gambling measures including strategic and legal support, compliance and audit functions,
gambling premises and gambling product approvals and licensing operations. The cost of policy
related to problem gambling borne by the Department of Justice and Regulation in 2014–15 was
estimated by inflating the VCEC (2012) estimate ($1.7 million) to 2014–15 prices using CPI.
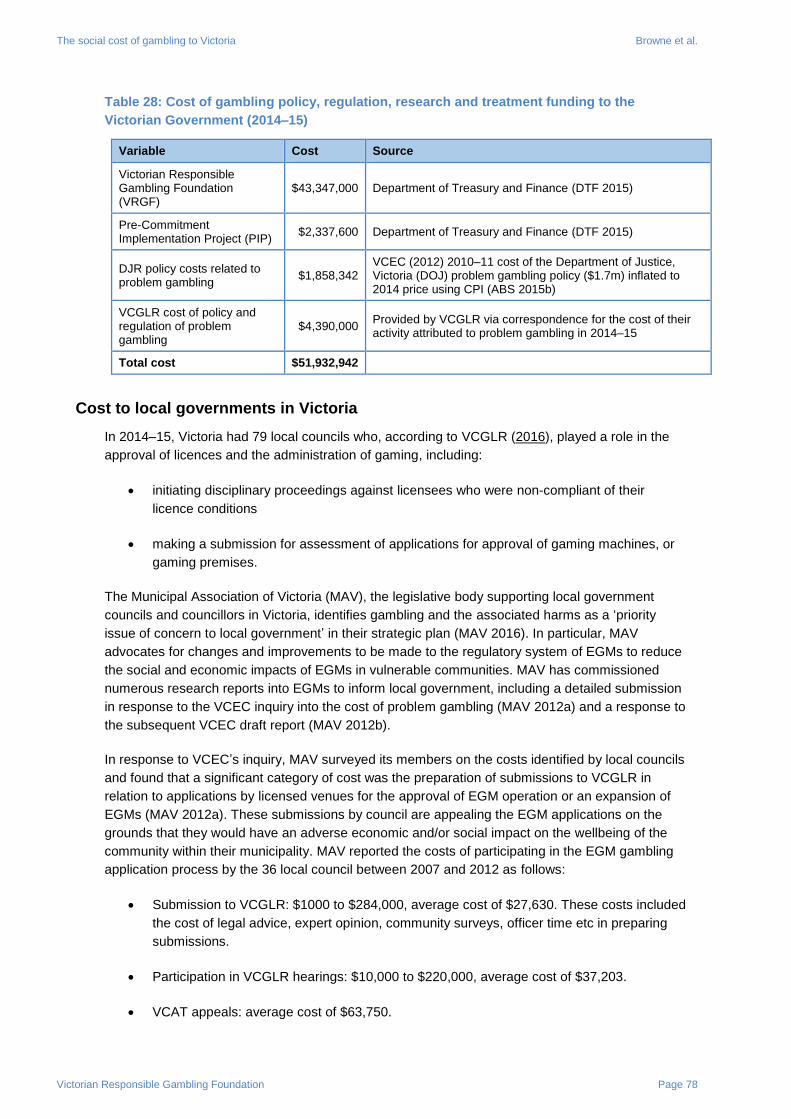
The social cost of gambling to Victoria Browne et al.
Victorian Responsible Gambling Foundation Page 78
Table 28: Cost of gambling policy, regulation, research and treatment funding to the
Victorian Government (2014–15)
Variable Cost Source
Victorian Responsible Gambling Foundation (VRGF)
$43,347,000 Department of Treasury and Finance (DTF 2015)
Pre-Commitment Implementation Project (PIP)
$2,337,600 Department of Treasury and Finance (DTF 2015)
DJR policy costs related to problem gambling
$1,858,342 VCEC (2012) 2010–11 cost of the Department of Justice, Victoria (DOJ) problem gambling policy ($1.7m) inflated to 2014 price using CPI (ABS 2015b)
VCGLR cost of policy and regulation of problem gambling
$4,390,000 Provided by VCGLR via correspondence for the cost of their activity attributed to problem gambling in 2014–15
Total cost $51,932,942
Cost to local governments in Victoria
In 2014–15, Victoria had 79 local councils who, according to VCGLR (2016), played a role in the
approval of licences and the administration of gaming, including:
initiating disciplinary proceedings against licensees who were non-compliant of their
licence conditions
making a submission for assessment of applications for approval of gaming machines, or
gaming premises.
The Municipal Association of Victoria (MAV), the legislative body supporting local government
councils and councillors in Victoria, identifies gambling and the associated harms as a ‘priority
issue of concern to local government’ in their strategic plan (MAV 2016). In particular, MAV
advocates for changes and improvements to be made to the regulatory system of EGMs to reduce
the social and economic impacts of EGMs in vulnerable communities. MAV has commissioned
numerous research reports into EGMs to inform local government, including a detailed submission
in response to the VCEC inquiry into the cost of problem gambling (MAV 2012a) and a response to
the subsequent VCEC draft report (MAV 2012b).
In response to VCEC’s inquiry, MAV surveyed its members on the costs identified by local councils
and found that a significant category of cost was the preparation of submissions to VCGLR in
relation to applications by licensed venues for the approval of EGM operation or an expansion of
EGMs (MAV 2012a). These submissions by council are appealing the EGM applications on the
grounds that they would have an adverse economic and/or social impact on the wellbeing of the
community within their municipality. MAV reported the costs of participating in the EGM gambling
application process by the 36 local council between 2007 and 2012 as follows:
Submission to VCGLR: $1000 to $284,000, average cost of $27,630. These costs included
the cost of legal advice, expert opinion, community surveys, officer time etc in preparing
submissions.
Participation in VCGLR hearings: $10,000 to $220,000, average cost of $37,203.
VCAT appeals: average cost of $63,750.

The social cost of gambling to Victoria Browne et al.
Victorian Responsible Gambling Foundation Page 79
In addition, MAV reported that across 13 councils a range of $20,000 to $288,000 (average
$81,667) was spent on the allocation of resources to planning appeals arising from a refusal to
approve premises for gaming. Furthermore, councils spent on average $69,333 annually on
community activities and support services targeted at assisting those with gambling problems or
their families. Finally, MAV noted that ‘considerable uncosted staff time is also reported by councils
in relation to addressing gambling-related issues’ (MAV 2012a, p. 8).
The VCEC (2012) took MAV’s average figures on the costs of council responding to EGM
applications (written submissions, presentation at hearings and VCAT appeals), multiplied it by the
number of incidents in 2010–11 and discounted it by 50 per cent attributable to problem gambling
to get a figure of $345,393. The cost of planning appeals, services targeted to problem gamblers
and families, and staff time was not costed by VCEC.
MAV’s response to the 2012 draft report was that VCEC had ‘considerably underestimated the
direct costs experienced by local councils in addressing the process for dealing with applications
for gambling venues’ (MAV 2012b, p. 2) by not including any estimation of staff costs, and
discounting the costs of councils in respect to the proportion attributable to problem gambling.
The current approach to estimate the cost to local governments in Victoria for activities related to
gambling problems follows the methodology of VCEC (2012) in costing their response to EGM
applications. While we acknowledge that it is important to cost the other council expenditure on
research and policy development, staff time, community-orientated programs and planning appeals
related to gambling, they have been excluded due to lack of available data. However, contrary to
the VCEC approach, 100 per cent of the costs of responding to applications are counted towards
local governments, rather than just the portion attributable to problem gamblers. The data for local
council submissions in response to applications for EGM increases (numbers submitted, presented
at hearings and VCAT appeals) were sourced from the Victorian Responsible Gambling
Foundation. The average cost per submission, hearing presentation and VCAT appeal was inflated
from 2010 to 2014 prices using CPI (ABS 2015c). In total the estimated cost is approximately
$262,557 for 2014–15 (see Table 29).
Table 29: Cost to Victorian local government of responding to EGM applications (2014–15)
Variable Number Average cost
per case Total Cost
Applications for EGM increases 11
Written submissions from council 6 $30,204 $181,221
Presented at hearings 2 $40,668 $81,336
VCAT appeals 0 $69,688 $0
Total cost to local government
$262,557
Cost to the health and human services system
In lieu of better available data, the VCEC (2012) estimated the cost of problem gambling to the
health and human services system in Victoria using a ‘bottom-up’ approach in which services
potentially linked to a population with gambling problems, e.g. drug treatment and rehabilitation
and community health care, were combined as the estimated total expenditure for 2010–11, and
lower and upper estimates for problem gamblers calculated (see VCEC (2012), Table D.1 and
Table D.2).
The social cost of gambling to Victoria Browne et al.
Victorian Responsible Gambling Foundation Page 80
The first step was to review the figures for 2014–15 Victorian Government expenditure on health
and human services that persons with gambling problems are more likely to use, as per the VCEC
approach. After reviewing the 2014–15 Victorian Government budget (Victorian Government
2015), the Victorian Department of Health and Human Services annual report 2014–15 (DHHS
2015) and the Report on Government Services for 2014–15 (Productivity Commission 2016c), we
found that the expenditure by sector and department were fairly consistent from 2010 to 2014.
Therefore, we decided to assume VCEC was reasonably accurate in their estimate of the total
health and human services expenditure in 2010–11 and inflated this figure to 2014–15 prices to get
$15.3 billion.
The next step was to calculate the number of people with gambling problems in Victoria likely to
have used services available in the health and human services sector.
In 2012, the VCEC calculated lower and upper estimates using the following methods:
Lower estimate: number of problem gamblers with mental wellbeing issues (who are
assumed to have had some contact with health and human services) as a proportion of the
total Victorian population expenditure ($6.5 million). Wellbeing issues for problem
gamblers included depression, attempted suicide, suicide ideation, plus those with
experiences of family violence (double-counting adjusted).
Upper estimate: total number of problem gamblers in Victoria as a proportion of the total
Victorian population expenditure × 80% counterfactual ($78.6 million).
Using the same approach as the VCEC (2012), lower and upper estimates of usage of the health
and human service system were calculated using ‘wellbeing issues’ as the lower estimate and
gambling population as the higher estimate, but these were applied to all three levels of problem
gambling severity using 2014 prevalence estimates and an 80 per cent counterfactual adjustment
(Victorian Gambling and Health Study 2014 weighted dataset – Hare 2015). Wellbeing issues were
defined slightly differently as the combined number experiencing increased depression due to
gambling, attempted suicide due to gambling, or experiencing of violence due to gambling with an
adjustment of 33.3 per cent applied, assuming one-third will seek treatment services. Suicide
ideation was excluded from ‘wellbeing issues’ to avoid double-counting.
As shown in Table 30, the proportion of the Victorian population with gambling problems using
government health and human services ranged from 0.4 per cent to 12.5 per cent, with problem
gamblers making up the smallest proportion (0.1–0.8 per cent) due to their low baseline
prevalence.
Deviating from the VCEC (2012), a third calculation was done: the average estimate of the
proportion of the Victorian population using the services, which across the three PGSI groups was
5.2 per cent of the population representing a total cost in 2014–15 of nearly $800 million.
Interestingly, the cost attributable to problem gamblers in 2014–15 of $60.5 million is towards the
higher estimate of $78.6 million for 2010–11 (VCEC 2012), but only accounts for approximately 8
per cent of the current total costs to the sector due to gambling problems. It is the low-risk
gamblers who contribute nearly 70 per cent of the cost of gambling problems on the health and
human services sector. It is noted that this ‘average’ estimation should be reviewed with the cost
assumptions mentioned in mind, and that the lower and upper estimated costs for 2014–15 are
$59.7 million to $1.5 billion.
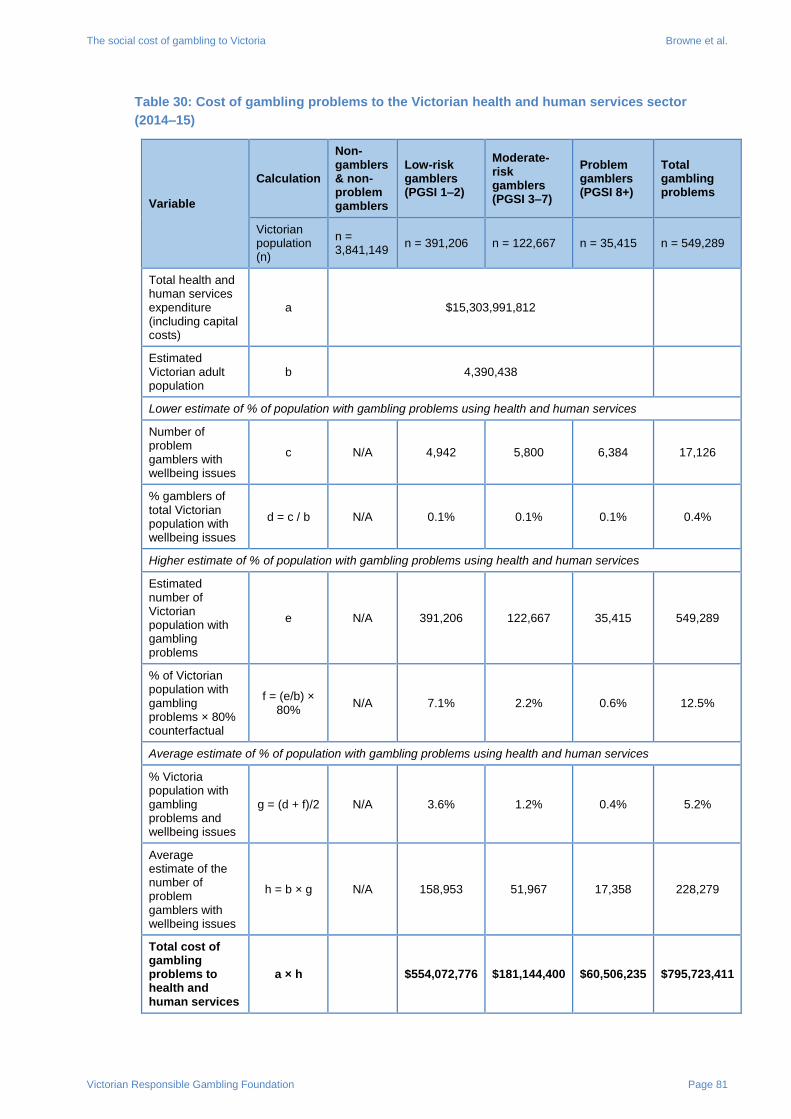
The social cost of gambling to Victoria Browne et al.
Victorian Responsible Gambling Foundation Page 81
Table 30: Cost of gambling problems to the Victorian health and human services sector
(2014–15)
Variable
Calculation
Non-gamblers & non-problem gamblers
Low-risk gamblers (PGSI 1–2)
Moderate-risk gamblers (PGSI 3–7)
Problem gamblers (PGSI 8+)
Total gambling problems
Victorian population (n)
n = 3,841,149
n = 391,206 n = 122,667 n = 35,415 n = 549,289
Total health and human services expenditure (including capital costs)
a $15,303,991,812
Estimated Victorian adult population
b 4,390,438
Lower estimate of % of population with gambling problems using health and human services
Number of problem gamblers with wellbeing issues
c N/A 4,942 5,800 6,384 17,126
% gamblers of total Victorian population with wellbeing issues
d = c / b N/A 0.1% 0.1% 0.1% 0.4%
Higher estimate of % of population with gambling problems using health and human services
Estimated number of Victorian population with gambling problems
e N/A 391,206 122,667 35,415 549,289
% of Victorian population with gambling problems × 80% counterfactual
f = (e/b) × 80%
N/A 7.1% 2.2% 0.6% 12.5%
Average estimate of % of population with gambling problems using health and human services
% Victoria population with gambling problems and wellbeing issues
g = (d + f)/2 N/A 3.6% 1.2% 0.4% 5.2%
Average estimate of the number of problem gamblers with wellbeing issues
h = b × g N/A 158,953 51,967 17,358 228,279
Total cost of gambling problems to health and human services
a × h $554,072,776 $181,144,400 $60,506,235 $795,723,411
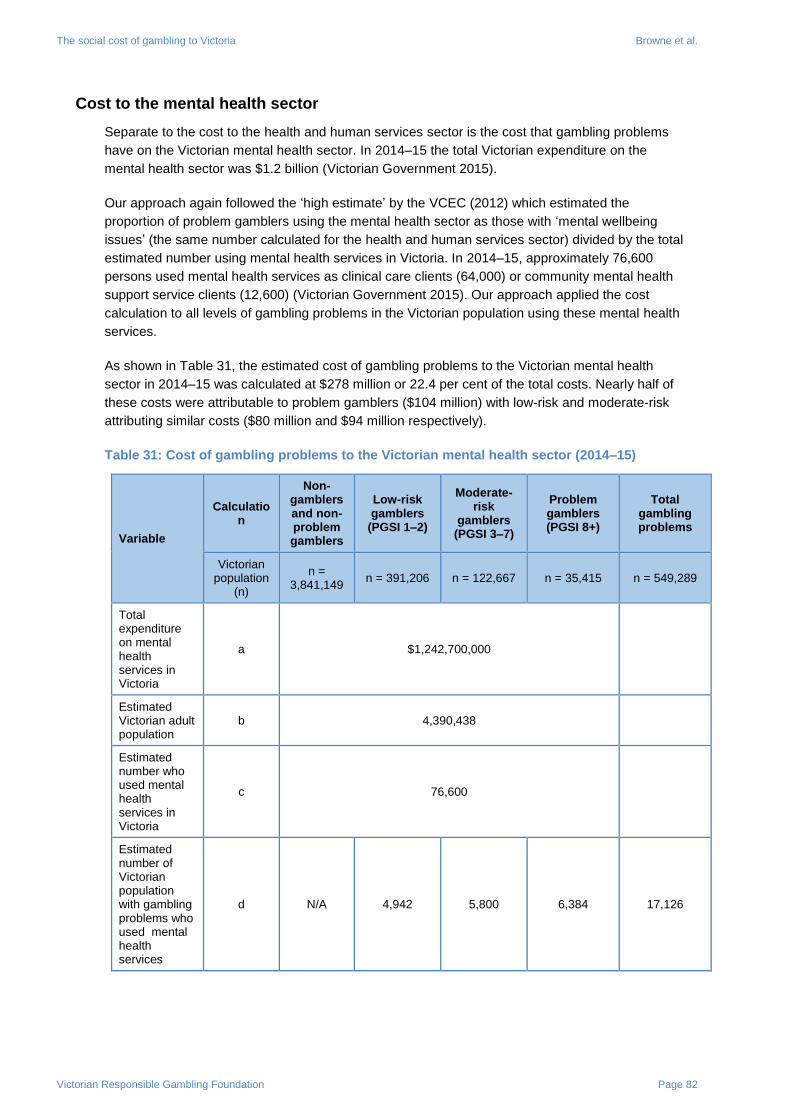
The social cost of gambling to Victoria Browne et al.
Victorian Responsible Gambling Foundation Page 82
Cost to the mental health sector
Separate to the cost to the health and human services sector is the cost that gambling problems
have on the Victorian mental health sector. In 2014–15 the total Victorian expenditure on the
mental health sector was $1.2 billion (Victorian Government 2015).
Our approach again followed the ‘high estimate’ by the VCEC (2012) which estimated the
proportion of problem gamblers using the mental health sector as those with ‘mental wellbeing
issues’ (the same number calculated for the health and human services sector) divided by the total
estimated number using mental health services in Victoria. In 2014–15, approximately 76,600
persons used mental health services as clinical care clients (64,000) or community mental health
support service clients (12,600) (Victorian Government 2015). Our approach applied the cost
calculation to all levels of gambling problems in the Victorian population using these mental health
services.
As shown in Table 31, the estimated cost of gambling problems to the Victorian mental health
sector in 2014–15 was calculated at $278 million or 22.4 per cent of the total costs. Nearly half of
these costs were attributable to problem gamblers ($104 million) with low-risk and moderate-risk
attributing similar costs ($80 million and $94 million respectively).
Table 31: Cost of gambling problems to the Victorian mental health sector (2014–15)
Variable
Calculation
Non-gamblers and non-problem gamblers
Low-risk gamblers
(PGSI 1–2)
Moderate-risk
gamblers (PGSI 3–7)
Problem gamblers (PGSI 8+)
Total gambling problems
Victorian population
(n)
n = 3,841,149
n = 391,206 n = 122,667 n = 35,415 n = 549,289
Total expenditure on mental health services in Victoria
a $1,242,700,000
Estimated Victorian adult population
b 4,390,438
Estimated number who used mental health services in Victoria
c 76,600
Estimated number of Victorian population with gambling problems who used mental health services
d N/A 4,942 5,800 6,384 17,126

The social cost of gambling to Victoria Browne et al.
Victorian Responsible Gambling Foundation Page 83
Variable
Calculation
Non-gamblers and non-problem gamblers
Low-risk gamblers
(PGSI 1–2)
Moderate-risk
gamblers (PGSI 3–7)
Problem gamblers (PGSI 8+)
Total gambling problems
Victorian population
(n)
n = 3,841,149
n = 391,206 n = 122,667 n = 35,415 n = 549,289
Estimated % with gambling problems who used mental health services
e = d / c N/A 6.5% 7.6% 8.3% 22.4%
Total cost of gambling problems to Victorian mental health sector
a × e $80,175,048 $94,101,625 $103,567,341 $277,844,014
Cost of homelessness services
The Australian Institute of Health and Welfare (AIHW) identified that 18.4 per cent of clients of the
Supported Accommodation Assistance Program (SAAP) had gambling-related issues as their main
reason for seeking accommodation and support (2009). This positions homelessness as a
potentially costly gambling-related harm.
In Victoria, the Department of Human Services is responsible for homelessness support services
and under their Victorian Homelessness Action Plan 2011–2015 has committed $76.7 million on
targeting homelessness via prevention, intervention and continued support to existing services
(Victorian Government 2011, cited in Zaretzky et al. 2013). The primary program in Victoria to
assist pathways out of homelessness is the Homeless Support Program (HSP, previously known
as the SAAP) which is jointed funded by the Commonwealth and Victorian governments under the
National Affordable Housing Agreement (NAHA) (Zaretzky et al. 2013).
Our approach to costing homelessness services in Victoria due to gambling problems was as
follows:
Estimate the number of homeless in Victoria.
Estimate the number of homeless in Victoria due to gambling problems: proportion of
Victorian homeless due to gambling problems × number of Victorian homeless × 80 per
cent counterfactual.
Estimate the cost of homelessness per case per year.
Calculate the total cost: number of homeless in Victoria due to gambling problems × cost
per case,
As shown in Table 32, using this approach the estimated cost to the Victorian Government of
homelessness services due to gambling problems in 2014–15 was $19.7 million. Note that the cost
of ‘street-to-home’ services per client has been used as the cost estimate, as street-to-home
programs are funded in Victoria under the NPAH through the Housing and Community Building

The social cost of gambling to Victoria Browne et al.
Victorian Responsible Gambling Foundation Page 84
division of the Department of Human Services (Zaretzky et al. 2013). The proportion of this cost
per client associated with ‘welfare and taxation foregone (average wage)’ was not included as this
is likely already costed under the health and human services sector cost.
The current cost estimate of $19.7 million attributable to problem gamblers’ use of homelessness
services in Victoria is much higher than the 2010–11 cost of $0.2 to $1.8 million estimated by the
VCEC (2012). This difference is explained due to our assumption of a much higher prevalence of
problem gamblers in the homeless population seeking homelessness services (VCEC: 0.1–0.8 per
cent) and a higher average cost per case (VCEC: $3495).
Table 32: Cost of homelessness services to the Victorian Government due to problem
gambling (2014–15)
Variable Calculation Data Source
Estimated number of homeless in Victoria
a 22,789 2011 census, cited by Homelessness Australia (2012)
Prevalence of homelessness in Victoria due to gambling problems
b 18.4% Australian Institute of Health and Welfare (AIHW 2009)
Estimated number of Victorian homeless due to gambling problems
c = a × b × 80%
3355 Number of Victorian homeless × prevalence of homelessness due to gambling problems × 80% counterfactual
Average annual cost per person for homelessness services
d $5877
Total annual offset per client, street-to-home (includes health and justice services, excludes welfare and taxation, forgone average wage) – Zaretzky et al. (2013), Table 1
Total cost c × d $19,714,636
Cost of YourPlay pre-commitment scheme
In 2014 the Victorian Government introduced legislative changes to the Gambling Regulation Act
2003 under the Gambling Regulation Amendment (Pre-commitment) Act 2014 which imposed the
provision of a pre-commitment scheme for all gaming machines In Victoria from 1 December 2015
(Victorian Government 2014).
As mentioned previously, in the 2014–15 financial year $2.3 million was funded by the Victorian
Government’s Community Support Fund to the DOJ (now known as the DJR) to set up and pilot
the pre-commitment implementation project (PIP) called YourPlay and start its rollout from 1 June
2015 (DTF 2015). As of 1 December 2015, YourPlay was rolled out in all Victorian EGM licensed
venues (DOJ 2014).
YourPlay is a card-based pre-commitment system for EGMs which allows players who voluntarily
and anonymously participate to have control over their play via features such as setting time
and/or money limits, tracking play and receiving annual activity statements. Players monitor their
play either via a physical kiosk provided at the venue or via the YourPlay website (DJR 2015b).
In line with the new regulations surrounding pre-commitment schemes, YourPlay requires gaming
venue operators to comply with the following (DJR 2015a):
Install YourPlay hardware and software available for use from 1 December 2015.
The social cost of gambling to Victoria Browne et al.
Victorian Responsible Gambling Foundation Page 85
All staff complete online training on YourPlay and how to help players use it.
Order YourPlay player cards (two types: registered cards and pre-coded casual cards).
Have YourPlay pre-coded casual cards available for players.
Display YourPlay information and materials in the venue. These include YourPlay
brochures and posters, responsible gambling materials and YourPlay talkers on gaming
machines.
Replace printed responsible gambling materials (Player Information Standards).
Adhere to the YourPlay branding guidelines (the YourPlay logo is trademarked), such as
ensuring that all player cards are branded with YourPlay.
Have a computer, card readers, encoders and keypad available at the player service point
with online access to the YourPlay portal.
This compliance comes at a cost to Victorian gaming venues. Not only are venue operators
required to pay for the purchase and installation of player account equipment, from 1 December
2015 venues are charged 74.7 cents per connected EGM per day for the provision of pre-
commitment services (DOJ 2014).
The DJR has advised that the cost of YourPlay to the industry will be $197 million over 11 years,
which is approximately $18 million per year. This includes the costs of purchasing and installing
equipment, player cards, service fees and maintenance of equipment.
Furthermore, non-complying venues are subject to financial penalties which are not covered in this
cost.
Comparing the costs of problem gambling to the VCEC and
Productivity Commission estimates
How do the current estimates of the costs to Victoria of the harm associated with problem
gamblers compare to those which have been costed in previous studies when applied to 2014–15?
Although our methodology varied in several respects, the final costings are very similar. Table 33
shows the present report’s costs of problem gambling for 2014–15 compared to VCEC (2012) and
(PC 1999, 2010) estimates applied to the 2014–15 Victorian population.
The current estimate, which incorporates recent gambling-related harms prevalence data while
remaining fairly consistent with the cost per harm and methods of calculation used by the VCEC
(2012) and PC (1999, 2010), has problem gambling costing Victoria a total of $2.4 billion in 2014–
15. In comparison to our updated estimate using VCEC prevalence figures, updated costs per item
and methodology, this cost is positioned towards the high estimate of $3 billion for 2014–15. An
inflation of PC (1999) Australian estimates proportioned to Victoria (25 per cent of the total) has a
cost range of problem gambling between $717 million and $2.2 billion, of which the upper estimate
is only slightly lower than the present estimate. Lastly, PC (2010), inflated to Victoria 2014–15, has
a range of $1.36 billion to $2.4 billion. Again, the high estimate is close to our own of $2.4 billion.
The caveat to comparing the current estimate of problem gambling costs to the Victorian
population to the PC (1999, 2000) inflated estimates is that their prevalence estimates for ‘problem

The social cost of gambling to Victoria Browne et al.
Victorian Responsible Gambling Foundation Page 86
gamblers’ varied by cost item, being sourced from the PC’s 1999 National Gambling Survey for
regular gamblers (gambled weekly) or the Survey of Clients of Counselling Agencies (SCCA) for
sample with SOGS score 10+. The VCEC (2012) also sourced their ‘problem gambler’ prevalence
data from multiple sources, including the 2008 Victorian Gambling and Health Study (Hare 2009)
sample of problem gamblers (CPGI 8+ score) or the PC (1999) figures.
Of importance here is that our incorporation of the costs from the low- and moderate-risk gambler
populations added another $4.3 billion to the total estimate of $7 billion in costs to Victoria in 2014–
15.
Table 33: Cost of problem gambling to Victoria (2014–15) compared to VCEC and PC (1999)
updated estimates
Cost item CQU cost 2014–15
(PGs only)
VCEC 2010–11 cost updated to 2014–15 (PGs or regular
gamblers)
PC 1997–98 cost inflated to 2014–15 (regular gamblers)
Low High Low High
Estimated Victorian population (4,390,438)
35,415 35,415 25% of Australian figure
Financial
Total opportunity cost of gambling spend
$427,186,784 $1,093,142,272 $1,530,399,181 No estimate
Bankruptcy
Total cost of bankruptcy administration
$10,771,795 $750,527 $8,443,429
$518,060
Total cost of unpaid debts
$60,108,966 $4,188,105 $47,116,177
Illegal offshore wagering
$215,634,140 No estimate No estimate
Sub-total financial costs
$479,372,995 $1,098,080,904 $1,585,958,788 $518,060
Emotional and psychological
Depression – emotional distress to the gambler
$59,775,675 $668,981 $1,997,651 $92,055,224 $275,767,164
Suicide attempts impact on gambler
$16,137,785 $15,583,200 $26,092,800 $27,895,522 $46,625,373
Suicide ideation – emotional distress on gambler
$53,254,692 $25,972,000 $51,944,000 $47,820,896 $95,243,284
Emotional and psychological costs to the gambler
$171,465,281 No estimate No estimate
Sub-total emotional and psychological costs
$300,633,433 $42,224,181 $80,034,451 $167,771,642 $417,635,821
Relationship and family

The social cost of gambling to Victoria Browne et al.
Victorian Responsible Gambling Foundation Page 87
Cost item CQU cost 2014–15
(PGs only)
VCEC 2010–11 cost updated to 2014–15 (PGs or regular
gamblers)
PC 1997–98 cost inflated to 2014–15 (regular gamblers)
Low High Low High
Divorce and separation
Financial cost to gambler
$9,081,796 $1,352,525 $1,115,821
Emotional distress to gambler
$42,155,848 $20,473,206 $40,946,413 $50,211,940 $100,822,388
Emotional distress to affected others
$384,126,043 $47,088,375 $94,176,750 No estimate
Experiences of violence
Emotional distress to the gambler
$21,517,047 $3,546,281 $10,589,590 $1,115,821 $3,307,612
Emotional distress to affected others
$34,427,276 No estimate No estimate
Suicide attempts by gambler – impact on affected others
$96,826,713 $22,972,992 $51,966,812 $32,279,104 $72,528,358
Fatality by suicide of gambler – impact on affected others
$6,455,114 No estimate No estimate No estimate No estimate
Other emotional distress to affected others
$418,671,785 $387,278,961 $1,356,821,476 $301,271,642 $1,168,822,388
Breakup of a relationship
No estimate No estimate $114,770,149 $344,310,448
Sub-total relationship and family costs
$1,013,261,621 $482,712,341 $1,555,853,566 $500,764,478 $1,690,907,015
Crime – cost to the Victorian justice system
Police system cost $1,180,862 $817,726 $1,275,224
Court system cost $1,908,322 $1,443,099 $2,231,642
Corrections system cost
$38,895,824 $26,934,674 $2,032,388
Sub-total crime costs
$41,985,008 $29,195,499 $5,539,254
Productivity loss and work impacts
Productivity loss to business
$188,937,938 $7,340,968 $50,719,416 $11,237,910 $79,701,493
Cost of job loss
Loss of income $74,099,158 $16,570,301 $9,564,179
Job search to the gambler
$11,687,472 $2,613,591 $5,180,597

The social cost of gambling to Victoria Browne et al.
Victorian Responsible Gambling Foundation Page 88
Cost item CQU cost 2014–15
(PGs only)
VCEC 2010–11 cost updated to 2014–15 (PGs or regular
gamblers)
PC 1997–98 cost inflated to 2014–15 (regular gamblers)
Low High Low High
Employer staff replacement costs
$22,665,625 $5,068,563 $8,767,164
Unemployment benefits
$7,055,280 $1,577,725 No estimate
Cost of absenteeism to business
$17,143,961 No estimate No estimate
Cost of crime to business
$9,731,943 $4,845,682 $6,922,402 No estimate
Cost of fatality by suicide
$6,854,681 No estimate No estimate
Sub-total productivity loss and work impact costs
$338,176,056 $38,016,829 $83,471,998 $34,749,851 $103,213,433
Cost to Victorian Government
Policy, regulation, research
$7,970,149
Victorian Responsible Gambling Foundation (VRGF)
$43,347,000 N/A N/A
Pre-commitment Implementation Project
$2,337,600 N/A N/A
DJR policy costs related to problem gambling
$1,858,342 $1,858,342 No estimate
Cost regulating problem gambling (VCGLR)
$4,390,000 $4,390,000 No estimate
Direct costs to local governments in Victoria
$262,557 $377,564 No estimate
Health and human services systems
$60,506,235 $8,197,063 $98,759,797 No estimate
Mental health sector
$103,567,341 $4,802,078 $38,150,386 No estimate
Homelessness services
$19,714,636 $218,628 $1,967,656 No estimate
Sub-total cost to Victorian Government
$235,983,731 $58,103,655 $183,763,724 $7,970,149

The social cost of gambling to Victoria Browne et al.
Victorian Responsible Gambling Foundation Page 89
Cost item CQU cost 2014–15
(PGs only)
VCEC 2010–11 cost updated to 2014–15 (PGs or regular
gamblers)
PC 1997–98 cost inflated to 2014–15 (regular gamblers)
Low High Low High
TOTAL cost of gambling to Victoria11
$2,409,412,824 $1,748,333,410 $3,030,400,142 $717,313,433 $2,225,783,731
Comparing the costs of gambling to the cost of alcohol, tobacco and
illicit drug use
Collins and Lapsley (2008) examined the costs of tobacco, alcohol and illicit drug abuse to
Australian society in 2004–05. The study was carried out using methods specified in the
International Guidelines for Estimating the Costs of Substance Abuse, 2nd edition (Single et al.
2003). Table 34 provides a summary of their key findings (inflated to 2014–15 dollars). The total
cost of drug abuse is estimated at $71.8 billion, with tobacco accounting for 57 per cent ($41.2
billion), alcohol 28 per cent ($20 billion) and illicit drugs 15 per cent ($10.7 billion). Tangible costs
comprised 54 per cent of the total ($38.9 billion) and intangible costs 46 per cent ($32.9 billion).
Considering Victoria accounts for around 25 per cent of the Australian population, 25 per cent of
the total cost estimates is equivalent to just under $18 billion ($10.3 billion for tobacco, $5 billion for
alcohol and $2.7 billion for illicit drugs).
Table 34: Total cost of drug abuse in Australia (inflated to 2014–15 dollars)
Alcohol ($m) Tobacco ($m) Illicit ($m) All drugs ($m)
Tangible $14,139 $15,702 $9,029 $38,870
Intangible $5,861 $25,407 $1,664 $32,932
Total $20,000 $41,109 $10,693 $71,801
Estimated total for Victoria (25%)
$5,000 $10,277 $2,673 $17,950
A more recent study conducted by Laslett et al. (2010) made the first attempt to quantify the range
and magnitude of harms that alcohol causes to others in Australia. Similar to gambling, the
consumption of alcohol can adversely affect not only the user but a number of others. The impacts
of a drinker’s drinking on others can range from nuisance and inconvenience, such as street noise
or petty costs from damaged property, to severe harms, such as child abuse, physical violence and
death from assaults. Laslett et al. (2010) used a general population survey, routinely collected
social response agencies’ data and standard costing methods to quantify different aspects of
alcohol’s harm to others.
Together, Collins and Lapsley (2008) and Laslett et al. (2010) provide a more accurate
assessment of the social cost of alcohol. Although both studies use a different methodology with
different data sources and assumptions, these two studies represent the first real attempt to
understand the true extent of alcohol harm.
11 For the purposes of direct comparison with other costing studies, the cost of policy, regulation and research to the Victorian Government and direct costs to local governments in Victoria have been included in the total costs.

The social cost of gambling to Victoria Browne et al.
Victorian Responsible Gambling Foundation Page 90
Table 35 provides an overview of alcohol cost estimates derived for each study using key
categories. The total social cost of alcohol is estimated at $40 billion, double that of the original
Collins and Lapsley (2008) study that considered the cost of alcohol abuse, predominantly to the
drinker. Assuming Victorians have the same level of exposure to alcohol harms as other states, the
alcohol cost to Victoria can be estimated at just over $10 billion.
Table 35: Cost of alcohol use to drinkers in Australia (Collins & Lapsley 2008) and others
(Laslett et al 2010)
Collins & Lapsley (2008)
Laslett et al. (2010)
Tangible Intangible Tangible Intangible
Categories (used in Collins and Lapsley)
Labour costs $4,619
Healthcare costs $2,581
Road accidents costs $2,875 $462
Crime $1,859
Resources used in abusive consumption
$2,205
Loss of life $5,399
Categories (used in Laslett) Out of pocket expenses
Cost of time lost/spent
Child protection costs
Lost quality of life costs
Child protection system $734
Effects of drinking of household or family member or friend with most effect
$462 $9,840 $8,050
Property damage by stranger’s drinking
$1,239
Counselling, advice, treatment expenses
$120
Subtotal $14,139 $5,860 $1,821 $9,840 $734 $8,050
Total $40,444.74
The current study estimates the total cost of gambling to be close to $7 billion, which is of the
same order of magnitude but substantially lower than the $10 billion quantified for alcohol (Collins
& Lapsley 2008; Laslett et al. 2010). A similar comparison can be made to Collins and Lapsley’s
(2008) $10 billion estimate for tobacco. In spite of methodological caveats, this is a startling
finding, given that tobacco is the single most preventable risk factor for disease in Australia.

The social cost of gambling to Victoria Browne et al.
Victorian Responsible Gambling Foundation Page 91
Discussion
In many respects, the methodology presented here closely followed previous efforts. For example,
the general framework applied was similar, and similar counterfactual weights and cost value
assumptions were applied. However, the present study addressed some issues identified in
previous costings. This included a better costing of ‘intangibles’, including financial deprivation and
emotional or psychological distress caused by gambling. We incorporated information from both
the increasing rate of spend and the increasing rate of harm caused by financial deprivation, with
respect to PGSI category, to arrive at a conservative estimate of the opportunity cost of misspent
funds to the gambler. This estimate is conservative because it allows for the possibility that at least
some of the extra money spent by gamblers with problems – over and above the typical rate of
non-problem gamblers – is money ‘well spent’ in terms of generating recreational utility for the
gambler which doesn’t create problems. At the time prior costings were conducted, no information
was available to allow costing of ‘intangibles’ – most notably the typical impact of gambling
problems on individuals’ quality of life (QoL). The present analysis makes use of data and
knowledge reported in recent gambling harms surveys to provide a reasonable estimate of the
impact of the psychological and emotional component of QoL. Notably, similar calculations done
for financial deprivation yield a similar estimate when compared to the reported figures based on
excessive spend.
The present study incorporated findings from recent surveys of gambling-related harm, which
demonstrated a non-negligible incidence of harms occurring to low- and moderate-risk gamblers.
These groups contribute approximately $4.2 billion to the total cost estimate. Accordingly, the
present cost estimate is markedly larger than previous costings, due to incorporating costs arising
from non-problem gamblers. Previous costings relied on sometimes poor-quality sources of
prevalence data in general. In particular, prior prevalence data often did not explicitly link the
costed incident (e.g. divorce) to gambling. Furthermore, until recently, prevalence information for
harms arising from non-problem gamblers were not available, contributing to the neglect of costs
arising from these groups.
A key feature of the present costing is that it incorporates recent large-sample survey data for
determining the prevalence of most cost items. The present work costed a wider variety of harms
than previous studies, such as fatality by suicide in terms of loss of earnings, and absenteeism and
emotional distress from experiences of violence by affected others. Whilst the Productivity
Commission (2010) discussed illegal offshore gambling but did not cost the net loss of income to
the economy, the present study did cost this item. Finally, in the absence of a strong evidence
base, prior studies assumed that costs to affected others amounted to distress only to immediate
family and relatives. We applied more recent findings that directly investigated the number of
affected others per problem gambler. This takes into account the varying number of affected others
by problem gambling category and does not assume that affected others are limited to immediate
family.
Limitations
In common with previous studies, there were some negative impacts of gambling that we were
unable to cost. These included: harm to children (i.e. neglect), physical health (i.e. comorbid
smoking, sleep deprivation, unhealthy diet, alcohol use, stress, neglecting medical needs,
sedentary lifestyle), crime prevention, welfare, cultural harms, community harms, costs to local
government other than submissions appealing against EGM applications, and other gambling-
The social cost of gambling to Victoria Browne et al.
Victorian Responsible Gambling Foundation Page 92
related costs by non-government agencies (e.g. business, non-for-profit) such as money spent on
gambling prevention, education, treatment and regulation compliance.
In severe cases, excessive gambling spend results in long-term legacy and intergenerational costs
due to ongoing debt, lost family assets and major disruption to family networks. However, data that
can provide a basis for estimating the extent and severity of these costs is not available and
accordingly they do not feature in the present costing. In common with previous economic
costings, there is still a lack of data on the monetary costs of some specific gambling-related
impacts, resulting in the need to substitute with proxies.
The likely effect of the issues mentioned above is that our findings are an underestimate.
A separate issue is making inference on the direction of causality between gambling problems and
harms. Although the present study largely relied on surveys that specifically queried whether
incidents occurred as a result of gambling, it is possible that respondents may have overestimated
the role that gambling had in a given negative event. Unfortunately, resolving the issue of causality
beyond any doubt is only possible via long-term and costly longitudinal surveys. A more cost-
effective way of capturing these data would be to include gambling behaviour and outcomes in
extant longitudinal studies such as the Australian Longitudinal Study of Women’s Health, Ten to
Men, the Longitudinal Study of Australia’s Children and the Longitudinal Study of Indigenous
Children, which already capture information on smoking and alcohol consumption.
A related issue concerns the assumptions regarding attributable fractions of the costs of the harm
to assign to gambling problems. In the absence of better information, we have followed precedents
of prior studies (e.g. 80 per cent counterfactual weighting). However, this is a clear source of
uncertainty in the total costing. Unfortunately, like causality, issues to do with comorbidity are not
easy to resolve without major research effort. The lack of screening for gambling in health services
precludes the use of administrative data used in other public health areas. Furthermore, the
contribution of gambling to mortality is difficult to estimate as gambling is not included in the
contributing factors on registrations for reasons of perception and stigma.
A final limitation is due to our handling of certain items for which current costs were not available.
In these cases we relied on inflation of previous cost estimates, sometimes back to the 1999
Productivity Commission report. However, these cost items were generally quite small and in most
cases unlikely to vary markedly from year to year. Therefore, they should have had minimal impact
on the cost estimates presented.
The conclusion to Phase 2 is incorporated in the overall study conclusion which follows.

The social cost of gambling to Victoria Browne et al.
Victorian Responsible Gambling Foundation Page 93
Conclusion
Gambling in Victoria involves a cost of $7 billion per annum, which is less than but on a similar scale to costs previously estimated for alcohol ($10 billion) and tobacco ($10.3 billion). However, this cost is large with respect to the size of the gambling industry ($5.8 billion gross revenue), especially when compared to the size of the liquor industry ($8.3 billion). Gambling generates costs of about 70 per cent to that of alcohol, which corresponds closely to the relative per annum years of life lost to disability (YLD), which is approximately 69 per cent that of alcohol (Browne et al. 2016). The cost of gambling largely stems from the redistribution of wealth from low-risk, moderate-risk and problem gamblers to other people – including interests within government and industry. This is reflected in our finding that about 75 per cent of the total cost of gambling is borne by gamblers, their families and their social networks. The immediate cost is primarily felt in terms of financial deprivation due to the opportunity cost of funds spent on gambling. Financial deprivation leads to significant further costs in terms of quality of life to both gamblers and affected others. Major cost items include relationship and family breakdown and emotional and psychological suffering.
Gambling is not the only industry or recreational pursuit that involves costs. For example, road transportation involves a yearly toll not just in the economic costs of vehicles and infrastructure, but also a high human cost in death and injury due to accidents and other impacts. However, these costs are arguably dwarfed by the critical role of the transport industry to the economy. Recreational watersports such as SCUBA diving or surfing involve an intrinsic risk of severe events such as drowning, but these are infrequent enough to not call into question the value of the activity. The costs of gambling appear to be of a different magnitude, when both prevalence and severity are considered, and when evaluated relative to the presumed benefits of the activity or the scale of the industry itself. For example, Victorians are projected to spend $10 billion in 2018 on other forms of digital entertainment such as filmed entertainment or television programming; the reasonably defined ‘negative consequences’ of these activities approach zero cost. Judgements about whether gambling is ‘worth the cost’ are beyond the scope of this report. However, our conclusion is that gambling generates costs that appear to be out of proportion in relation to the scale of the industry, the tax revenue generated, and any generous assumptions about the likely recreational value of the activity to Victorians.

The social cost of gambling to Victoria Browne et al.
Victorian Responsible Gambling Foundation Page 94
References
Abbott, M, Bellringer, M, Garrett, N & Mundy-McPherson, S, 2014, New Zealand 2012 national
gambling study: Gambling harm and problem gambling, AUT, Wellington. Retrieved from
https://www.health.govt.nz/system/files/documents/pages/national_gambling_study_report_2.pdf
Abbott, M, Binde, P, Hodgins, D, Korn, D, Pereira, A, Volberg, R & Williams, R, 2013, Conceptual
Framework of Harmful Gambling: An International Collaboration, Guelph, Ontario, Canada: The
Ontario Problem Gambling Research Centre (OPGRC).
Abbott, MW & McKenna, BG, 2005, Gambling and problem gambling among recently sentenced
women in New Zealand prisons, Journal of Gambling Studies, 21(4), 559–581.
http://doi.org/10.1007/s10899-005-5563-5
Adams, PJ, 2013, Addiction industry studies: understanding how proconsumption influences block
effective interventions, American Journal of Public Health, 103, 35–8. doi:
10.2105/AJPH.2012.301151
Ahlgren, MB, Tanford, S & Singh, A, 2013, Impact of the 2003 Illinois Gaming Tax rate increase on
marketing spending, UNLV Gaming Research & Review Journal, 17, 1–15. Retrieved from
http://digitalscholarship.unlv.edu/cgi/viewcontent.cgi?article=1289&context=grrj
Anielski, M & Braaten, A, 2008, The socio-economic impact of gambling (SEIG) framework: An
assessment framework for Canada: In search of the gold standard, Edmonton, Alberta:
Management, Anielski.
Australian Bureau of Statistics, 2012, 1367.0 - State and territory statistical indicators: Life
expectancy at birth. Retrieved from
http://www.abs.gov.au/ausstats/[email protected]/Lookup/by%20Subject/1367.0~2012~Main%20Features
~Life%20Expectancy%20at%20Birth~5.16
Australian Bureau of Statistics, 2013, 6222.0 - Job search experience, Australia. Retrieved from
http://www.ausstats.abs.gov.au/ausstats/subscriber.nsf/0/0E68B21D67E1620FCA257C75000F1D
48/$File/62220_july%202013.pdf
Australian Bureau of Statistics, 2015a, 3101.0 - Australian demographic statistics, Jun 2015.
Canberra. Retrieved from
http://www.abs.gov.au/AUSSTATS/[email protected]/allprimarymainfeatures/6CBA90A25BAC951DCA257
F7F001CC559?opendocument
Australian Bureau of Statistics., 2015b, 6302.0 Average weekly earnings, Australia – Victoria, May
2015. Table 11B. Retrieved from
http://www.abs.gov.au/AUSSTATS/[email protected]/DetailsPage/6302.0May%202015?OpenDocument
Australian Bureau of Statistics, 2015c, 6401.0 – Consumer Price Index, Australia. Retrieved from
http://www.abs.gov.au/AUSSTATS/[email protected]/DetailsPage/6401.0Jun%202015?OpenDocument
The social cost of gambling to Victoria Browne et al.
Victorian Responsible Gambling Foundation Page 95
Australian Bureau of Statistics, 2015d, 3236.0 – Household and family projections, Australia, 2011 to 2036. Retrieved from http://www.abs.gov.au/ausstats/[email protected]/Latestproducts/3236.0Main%20Features42011%20to%202036
Australian Government, 2015, Family Law (Fees) Regulation 2012. Retrieved from https://www.legislation.gov.au/Details/F2015C00675/Download
Australian Institute of Health and Welfare (AIHW), 2009, Problem gambling among those seeking homelessness services. Retrieved from http://www.aihw.gov.au/WorkArea/DownloadAsset.aspx?id=6442465019
Azen, R & Budescu, DV, 2003, The dominance analysis approach for comparing predictors in multiple regression, Psychological Methods, 8(2), 129–148. http://doi.org/10.1037/1082–989x.8.2.129
Beautrais, AL, 2004, Support for families, Whānau and significant others after a suicide attempt: A literature review and synthesis of evidence. Christchurch: Christchurch School of Medicine & Health Sciences.
Belanger, YD, Williams, RJ & Arthur, JN, 2012, Assessing the impact of the introduction of casinos in two northern Alberta first nation communities, The American Review of Canadian Studies, 42, 1–19. doi: 10.1080/02722011.2012.649924
Belanger, YD, Williams, RJ & Arthur, JN, 2013, Manufacturing regional disparity in The pursuit of economic equality: Alberta’s First Nations Gaming Policy, 2006–2010, The Canadian Geographer. Geographe Canadien, 57, 11–30. doi: 10.1111/j.1541-0064.2012.00445.x
Binde, P, 2011, What are the most harmful forms of gambling? Analyzing problem gambling prevalence surveys. Retrieved from http://130.241.16.4/handle/2077/26165
Black, DW, Shaw, MC, McCormick, BA & Allen, J, 2012, Marital status, childhood maltreatment, and family dysfunction: a controlled study of pathological gambling, The Journal of Clinical Psychiatry, 73, 1293–1297. doi: 10.4088/JCP.12m07800
Blaszczynski, A, 2009, Problem gambling: We should measure harm rather than ‘cases’, Addiction, 104(7), 1072–1074. doi: 10.1111/j.1360-0443.2009.02505.x
Brown, S, Dickerson, A, McHardy, J & Taylor, K, 2012, Gambling and credit: An individual and household level analysis for the UK, Applied Economics, 44, 4639–4650. doi: 10.1080/00036846.2011.593502
Browne, M, Langham, E, Rawat, V, Greer, N, Li, E, Rose, J, Rockloff, M, Donaldson, P, Thorne, H, Goodwin, B, Bryden, G & Best, T, 2016, Assessing gambling-related harm in Victoria: A public health perspective. Victorian Responsible Gambling Foundation. Retrieved from http://www.responsiblegambling.vic.gov.au/__data/assets/pdf_file/0007/28465/Browne_assessing_gambling-related_harm_in_Vic_Apr_2016-REPLACEMENT2.pdf
Browne, M, Rawat, V, Greer, N, Langham, E, Rockloff, M & Hanley, C (2017), ‘What is the harm? Appling a public health methodology to measure the impact of gambling problems and harm on quality of life’, Journal of Gambling Issues, No. 36, September 2017, pp 28-50.

The social cost of gambling to Victoria Browne et al.
Victorian Responsible Gambling Foundation Page 96
Buddelmeyer, H & Peyton, K, 2014, How windfall income increases gambling at poker machines,
The Economic Record, 90, 236–248. doi: 10.1111/1475-4932.12094
Budescu, DV, 1993, Dominance analysis: A new approach to the problem of relative importance of
predictors in multiple regression, Psychological Bulletin, 114(3), 542. http://doi.org/10.1037/0033-
2909.114.3.542
Centre for Social and Health Outcomes Research and Evaluation, 2006, Socio-economic impacts
of gambling: Developing a methodology for assessing the socio-economic impacts of gambling in
New Zealand. Ministry of Health.
Centre for Social and Health Outcomes Research and Evaluation, 2008, Assessment of the social
impacts of gambling in New Zealand. Ministry of Health.
Chang, J-J, Lai, C-C & Wang, P, 2010, Casino regulations and economic welfare, Canadian
Journal of Economics, 43, 1058–1085. doi: 10.1111/j.1540-5982.2010.01606.x
Cheng, Z, Smyth, R & Sun, G, 2014, Participation and expenditure of migrants in the illegal lottery
in Chinas Pearl River Delta, Eurasian Geography and Economics, 55, 333–361. doi:
10.1080/15387216.2014.994542
Chen, VCH, Stewart, R & Lee, CTC, 2012, Weekly lottery sales volume and suicide numbers: A
time series analysis on national data from Taiwan, Social Psychiatry and Psychiatric Epidemiology,
47, 1055–1059. doi: 10.1007/s00127-011-0410-8 10.1007/s00127-009-0102-9:
Cheung, NW, 2014, Low self-control and co-occurrence of gambling with substance use and
delinquency among Chinese adolescents, Journal of Gambling Studies, 30, 105–124. doi:
10.1007/s10899-012-9351-8
Clarke, D, Tse, S, Abbott, M, Townsend, S, Kingi, P & Manaia, W, 2006, Key indicators of the
transition from social to problem gambling, International Journal of Mental Health and Addiction, 4,
247–264. doi: 10.1007/s11469-006-9024-x
Collins, DJ & Lapsley, HM, 2008, The costs of tobacco, alcohol and illicit drug abuse to Australian
society in 2004/05. Department of Health and Ageing, Canberra. Retrieved from
http://nadk.mesuvawebdevelopment.com.au/files/3013/8551/1279/Collins__Lapsley_Report.pdf
Conner, TW & Taggart, WA, 2013, Assessing the impact of Indian gaming on American Indian
nations: Is the house winning, Social Science Quarterly, 94, 1016. doi: 10.1111/ssqu.12009
ConNetica, 2016, Suicide in Australia – Key Facts. Retrieved from
http://www.connetica.com.au/uploads/2/6/4/6/26465293/media_backgrounder_-_suicide-
suicide_prevention_australia_may_24_final.pdf
Conway, M, 2015, Vulnerability modeling of casinos in the United States: A case study of
Philadelphia, Applied Geography , 63, 21–32. doi: 10.1016/j.apgeog.2015.05.015
Cotti, CD & Walker, DM, 2010, The impact of casinos on fatal alcohol-related traffic accidents in
the United States, Journal of Health Economics, 29, 788–796. doi: 10.1016/j.jhealeco.2010.08.002
Currie, SR & Casey, DM, 2007, Quantification and dimensionalization of gambling behaviour,
Research and Measurement Issues in Gambling Studies, 156–173.

The social cost of gambling to Victoria Browne et al.
Victorian Responsible Gambling Foundation Page 97
Currie, SR, Hodgins, DC, Wang, J, el-Guebaly, N, Wynne, H & Chen, S, 2006, Risk of harm
among gamblers in the general population as a function of level of participation in gambling
activities, Addiction, 101(4), 570–580. doi: 10.1111/j.1360-0443.2006.01392.x
Currie, SR, Miller, N, Hodgins, DC & Wang, J, 2009, Defining a threshold of harm from gambling
for population health surveillance research, International Gambling Studies, 9(1), 19–38. doi:
10.1080/14459790802652209
Department of Health and Human Services, 2015, Annual report 2014–15. Retrieved from
http://www.parliament.vic.gov.au/file_uploads/Department_of_Health_and_Human_Services_Repo
rt_2014–15_r2hQcf9B.pdf
Department of Human Services, 2016, Payment rates for Newstart allowance. Retrieved from
https://www.humanservices.gov.au/customer/enablers/payment-rates-newstart-allowance
Department of Justice, 2009, A study of gambling in Victoria: Problem gambling from a public
health perspective. Melbourne: Department of Justice. Retrieved from
http://www.justice.vic.gov.au/home/liquor+gambling+and+racing/research+and+statistics/problem+
gambling+from+a+public+health+perspective
Department of Justice, 2014, Pre-commitment implementation project: News 3. Office of Liquor,
Gaming and Racing, Melbourne.
Department of Justice and Regulation, 2015a, YourPlay – Victoria’s pre-commitment scheme.
Retrieved July 13, 2016, from
http://www.justice.vic.gov.au/home/safer+communities/gambling/yourplay+information+for+venue+
operators
Department of Justice and Regulation, 2015b, YourPlay: How it works. Retrieved July 13, 2016,
from https://www.yourplay.com.au/
Department of Justice and Regulation, 2016, YourPlay – Victoria’s pre-commitment scheme.
Retrieved July 11, 2016, from
http://www.justice.vic.gov.au/home/safer+communities/gambling/yourplay+victorias+precommitme
nt+scheme
Department of Social Services, 2015, Review of illegal offshore wagering. Retrieved from
https://www.dss.gov.au/communities-and-vulnerable-people/programmes-
services/gambling/review-of-illegal-offshore-wagering
Department of Treasury and Finance, 2015, Community Support Fund expenditure – Financial
overview 2014–15. Retrieved from http://www.dtf.vic.gov.au/files/a1e864e2-e676-4306-b0c0-
a53800bc6cce/Expenditure-by-Program-CSF-Annual-Reporting-2014-15.docx
Devlin, ME & Walton, D, 2012, The prevalence of problem gambling in New Zealand as measured
by the PGSI: adjusting prevalence estimates using meta-analysis, International Gambling Studies,
12(2), 177–197. doi:10.1080/14459795.2011.653384
Dickerson, M, Allcock, C, Blaszczynski, A, Nicholls, B, Williams, R & Maddern, R, 1998, An
examination of the socio-economic effects of gambling on individuals, families and the community
including research into the costs of problem gambling in New South Wales: The 1997 study 2
update. Casino Community Benefit Fund, NSW Government.

The social cost of gambling to Victoria Browne et al.
Victorian Responsible Gambling Foundation Page 98
Direct Health Solutions, 2013, Absence Management Survey Summary. Retrieved from
http://www.dhs.net.au/insight/2013-absence-management-survey-summary/
Doran, CM, Ling, R, Milner, A & Doran, C, 2015, The economic cost of suicide and suicide
behaviour in the South Australian Construction Industry. Retrieved from
http://matesinconstruction.org.au/wp-content/uploads/2016/03/Cost-of-suicide-in-SA-CI-final-
V2.pdf
Dowling, NA, Rodda, SN, Lubman, DI & Jackson, AC, 2014, The impacts of problem gambling on
concerned significant others accessing web-based counselling, Addictive Behaviors, 39(8), 1253–
1257. http://doi.org/10.1016/j.addbeh.2014.04.011
Dowling, NA, Suomi, A, Jackson, AC & Lavis, T, 2015, Problem gambling family impacts:
Development of the problem gambling family impact scale, Journal of Gambling Studies, 1–21.
http://doi.org/10.1007/s10899-015-9582-6
Dussault, F, Brendgen, M, Vitaro, F, Wanner, B & Tremblay, RE, 2011, Longitudinal links between
impulsivity, gambling problems and depressive symptoms: a transactional model from adolescence
to early adulthood, Journal of Child Psychology and Psychiatry, and Allied Disciplines, 52(2), 130–
138. http://doi.org/10.1111/j.1469-7610.2010.02313.x
Eadington, WR, 2004, Comment on Kindt’s Paper, Managerial and Decision Economics, 25, 191–
196.
Family Court of Australia & Federal Circuit Court of Australia, 2012, Court Fees (Family Law).
Retrieved from http://www.familycourt.gov.au/wps/wcm/connect/a3440dc0-6a14-4282-9794-
bd59233238f9/Fees_120815V2_web.pdf?MOD=AJPERES&CONVERT_TO=url&CACHEID=ROO
TWORKSPACE-a3440dc0-6a14-4282-9794-bd59233238f9-lhWwF48
Farrell, L, 2012, Chasing data: Sources of data for the study of gambling economics, The
Australian Economic Review, 45, 488–496. doi: 10.1111/j.1467-8462.2012.00701.x
Fearnley, J, Roaf, E, George, S & Gerada, C, 2012, Mainstreaming gambling-related harm in
Britain as a public health issue, Journal of Public Health, 21(2), 215–217. doi: 10.1007/s10389-
012-0530-y
Ferland, F, Fournier, P-M, Ladouceur, R, Brochu, P, Bouchard, M & Pâquet, L, 2008,
Consequences of pathological gambling on the gambler and his spouse, Journal of Gambling
Issues, (22).
http://search.ebscohost.com/login.aspx?direct=true&profile=ehost&scope=site&authtype=crawler&j
rnl=19107595&AN=42848747&h=hOupd0W6e5HZydn7FjzDzSD5vAHzYxNwcfwi1SpNJVim4bMj3
CgQLUd0XeYduB%2BSqSdzwr63KFH850i3ddSm3A%3D%3D&crl=c
Ferris, J & Wynne, H, 2001, The Canadian Problem Gambling Index: Final Report. Canadian
Centre on Substance Abuse.
Francis, K, Dowling, N, Jackson, A, Christensen, D & Wardle, H, 2015, Gambling motives:
Application of the reasons for gambling questionnaire in an Australian population survey, Journal
of Gambling Studies, 31, 807–823. doi: 10.1007/s10899-014-9458-1

The social cost of gambling to Victoria Browne et al.
Victorian Responsible Gambling Foundation Page 99
Gainsbury, SM, Russell, A, Hing, N, Wood, R, Lubman, DI & Blaszczynski, A, 2014, The prevalence and determinants of problem gambling in Australia: Assessing the impact of interactive gambling and new technologies, Psychology of Addictive Behaviors, 28, 769–779. doi: 10.1037/a0036207
Gon Kim, W, Kim, T, Gazzoli, G, Park, Y, Hyuck Kim, S & Sa Park, S, 2011, Factors affecting the travel expenditure of visitors to Macau, China, Tourism Economics, 17, 857–883. doi: 10.5367/te.2011.0060
Goodwin, BC, Browne, M, Rockloff, M & Rose, J (2017), ‘A typical problem gambler affects six others’, International Gambling Studies, 17:2, 276-289, doi: 10.1080/14459795.2017.1331252
Groemping, U, 2006, Relative importance for linear regression in R: The package relaimpo, Journal of Statistical Software, 17(1), 1–27. http://doi.org/10.18637/jss.v017.i01
Grote, KR & Matheson, VA, 2014, The impact of state lotteries and casinos on state bankruptcy filings, Growth and Change, 45, 121–135. doi: 10.1111/grow.12030
Gu, X & Tam, PS, 2011, Casino taxation in Macao: an economic perspective, Journal of Gambling Studies, 27, 587–605. doi: 10.1007/s10899-010-9235-8
Gu, X & Tam, PS, 2014, Market structure and casino taxation in tourist resorts, Applied Economics, 46, 1049–1057. doi: 10.1080/00036846.2013.864037
Gu, X, Li, G & Tam, PS, 2013, Casino tourism, social cost and tax effects, International Gambling Studies, 13, 221–239. doi: 10.1080/14459795.2012.760641
Gwynn, McQuistion, McVeigh, Garg, Frieden & Thorpe, 2008, Prevalence, diagnosis, and treatment of depression and generalized anxiety disorder in a diverse urban community. Psychiatric Services, 59(6), 641–647. http://doi.org/10.1176/appi.ps.59.6.641
Hansen, MB & Rossow, IM, 2012, Does a reduction in the overall amount of gambling imply a reduction at all levels of gambling? Addiction Research & Theory, 20, 145–152. doi: 10.3109/16066359.2011.605968
Hare, S, 2009, A study of gambling in Victoria: Problem gambling from a public health perspective. Department of Justice.
Hare, S, 2015, Study of gambling and health in Victoria. Victoria, Australia: Victorian Responsible Gambling Foundation and Victorian Department of Justice and Regulation.
Haw, J, 2009, Impulsivity partially mediates the relationship between depression and problem gambling, Gambling Research: Journal of the National Association of Gambling Studies (Australia), 21(2), 12–21. Retrieved from http://epubs.scu.edu.au/cgi/viewcontent.cgi?article=1318&context=tourism_pubs
Hayatbakhsh, MR, Clavarino, A, Williams, GM, Bor, W & Najman, JM, 2012, Young adults’ gambling and its association with mental health and substance use problems, Australian and New Zealand Journal of Public Health, 36, 160–166. doi: 10.1111/j.1753-6405.2011.00815.x

The social cost of gambling to Victoria Browne et al.
Victorian Responsible Gambling Foundation Page 100
Hing, N, Breen, H, Buultjens, J & Gordon, A, 2012, A profile of gambling behaviour and impacts
among indigenous Australians attending a cultural event in New South Wales, Australian
Aboriginal Studies, 2, 3–20.
Holdsworth, L, Haw, J & Hing, N, 2011, The temporal sequencing of problem gambling and
comorbid disorders, International Journal of Mental Health and Addiction, 10(2), 197–209.
http://doi.org/10.1007/s11469-011-9324-7
Holdsworth, L, Nuske, E, Tiyce, M & Hing, N, 2013, Impacts of gambling problems on partners:
partners’ interpretations, Asian Journal of Gambling Issues and Public Health, 3(1), 11.
http://doi.org/10.1186/2195-3007-3-11
Holtslag, HR, van Beeck, EF, Lichtveld, RA, Leenen, LP, Lindeman, E & van der Werken, C, 2008,
Individual and population burdens of major trauma in the Netherlands, Bulletin of the World Health
Organization, 86(2), 111–117. Retrieved from http://www.ncbi.nlm.nih.gov/pubmed/18297165
Homelessness Australia, 2012, Homelessness statistics. Retrieved June 21, 2016, from
http://www.homelessnessaustralia.org.au/index.php/about-homelessness/homeless-statistics
Huberfeld, R & Dannon, PN, 2014, Pathological gambling: Who gains from others’ losses? In The
Psychological Science of Money (pp. 163–185). Springer New York. doi: 10.1007/978-1-4939-
0959-9_8
Humphreys, BR & Soebbing, BP, 2014, Access to legal gambling and the incidence of crime:
Evidence from Alberta, Growth and Change, 45, 98–120. doi: 10.1111/grow.12034
Insolvency Trustee Service Australia (ITSA), 2014, Bankruptcy (fees and remuneration)
Determination 2014. Retrieved from
https://www.legislation.gov.au/Details/F2014L00367/Download
Kerber, C, Adelman-Mullally, T, Kim, M & Astroth, KS, 2015, The impact of disordered gambling
among older adults, Journal of Psychosocial Nursing and Mental Health Services, 53, 41–47. doi:
10.3928/02793695-20150923-03
Kun, B, Balázs, H, Arnold, P, Paksi, B & Demetrovics, Z, 2012, Gambling in Western and Eastern
Europe: The example of Hungary, Journal of Gambling Studies, 28, 27–46. doi: 10.1007/s10899-
011-9242-4
Langham, E, Thorne, H, Browne, M, Donaldson, P, Rose, J & Rockloff, M, 2016, Understanding
gambling related harm: a proposed definition, conceptual framework, and taxonomy of harms,
BMC Public Health, 16, 1–23. doi: 10.1186/s12889-016-2747-0
Larsen, CV, Curtis, T & Bjerregaard, P, 2013, Harmful alcohol use and frequent use of marijuana
among lifetime problem gamblers and the prevalence of cross-addictive behaviour among
Greenland Inuit: evidence from the cross-sectional Inuit Health in transition Greenland survey
2006-2010, International Journal of Circumpolar Health, 72, 19551. doi: 10.3402/ijch.v72i0.19551
Laslett, A-M, Catalano, P, Chikritzhs, T, et al, 2010, The range and magnitude of alcohol’s harm to
others, Deakin West, ACT, Australia: AERF. Retrieved from http://www.aerf.com.au/home.aspx
Leal, A, Lopez-Laborda, J & Rodrigo, F, 2014, The inside and outside revenue impact of regional
gambling taxes in Spain, Growth and Change, 45, 79–97. doi: 10.1111/grow.12033

The social cost of gambling to Victoria Browne et al.
Victorian Responsible Gambling Foundation Page 101
Leamer, E & Leonard, H, 1983, Reporting the fragility of regression estimates, The Review of
Economics and Statistics, 65(2), 306–317. https://doi.org/10.2307/1924497
Lee, C-K, Kang, S & Reisinger, Y, 2010, Community attachment in two rural gaming communities:
Comparisons between Colorado gaming communities, USA and Gangwon gaming communities,
South Korea, Tourism Geographies: An International Journal of Tourism Place, Space and the
Environment, 12, 140–168. doi: 10.1080/14616680903493688
Li, E, Browne, M, Rawat, V, Langham, E, Rockloff, M 2016, ‘Breaking bad: comparing gambling
harms among gamblers and affected others’, Journal of Gambling Studies, vol. 83, no. 1, pp. 223–
48.
Li, G, Gu, X & Siu, RC, 2010, The impacts of gaming expansion on economic growth: a theoretical
reconsideration. Journal of Gambling Studies, 26, 269–285. doi: 10.1007/s10899-009-9165-5
Li, G, Gu, X & Wu, J, 2015, A trade based view on casino taxation: market conditions, Journal of
Gambling Studies, 31, 585–606. doi: 10.1007/s10899-013-9407-4
Lindberg, A, Fernie, BA & Spada, MM, 2011, Metacognitions in problem gambling, Journal of
Gambling Studies, 27, 73–81. http://doi.org/10.1007/s10899-010-9193-1
Lindeman, RH, Merenda, PF & Gold, RZ, 1980, Introduction to bivariate and multivariate analysis.
(F. Scott, Ed.). Glenview, IL. Retrieved from http://www.sidalc.net/cgi-
bin/wxis.exe/?IsisScript=COLPOS.xis&method=post&formato=2&cantidad=1&expresion=mfn=005
517
Livingstone, C & Adams, PJ, 2011, Harm promotion: observations on the symbiosis between
government and private industries in Australasia for the development of highly accessible gambling
markets, Addiction, 106, 3–8.
Long, J, Johnson, C & Oakley, J, 2011, Changes created by the introduction of legalized gaming:
A review of the Tunica County, Mississippi experience, Journal of Management Policy and
Practice, 12, 156–163. Retrieved from http://www.na-businesspress.com/JMPP/LongWeb.pdf
Ludwig, M, Kraplin, A, Braun, B & Kraus, L, 2013, Gambling experiences, problems, research and
policy: Gambling in Germany, Addiction , 108, 1554–1561. doi: 10.1111/j.1360-0443.2012.04025.x
Maierova, E, Charvat, M & Miovsky, M, 2014, The lifecycle and consequences of gambling on
male patients treated in residential care all diagnosed with symptoms of pathological gambling.
[Czech] Prubeh a nasledky hracskych karier u muzskych pacientu hospitalizovanych v
psychiatrickych nemocnicich pro diagnozu F 63.0 patologicke hracstvi, Ceska a Slovenska
Psychiatrie, 110, 291–300.
Markham, F, Young, M & Doran, B, 2014, Gambling expenditure predicts harm: evidence from a
venue-level study, Addiction , 109, 1509–1516 8p. doi: 10.1111/add.12595
Minchin, G, 2006, Sentencing problem gamblers in New Zealand, International Journal of Mental
Health and Addiction, 4(1), 53–64. http://doi.org/10.1007/s11469-006-9007-y
Mixon, FG, Jr & Ressler, RW, 2014, Rent seeking in successive monopoly: The case of casino
gambling in New Orleans, Evolutionary and Institutional Economics Review, 11, 41–51. doi:
10.14441/eier.110103

The social cost of gambling to Victoria Browne et al.
Victorian Responsible Gambling Foundation Page 102
Moellman, N & Mitra, A, 2013, Indian gaming in Oklahoma: Implications for community welfare,
The Journal of Socio-Economics, 45, 64–70. doi: 10.1016/j.socec.2013.04.001
Moher, D, Liberati, A, Tetzlaff, J, Altman, DG & The PRISMA Group, 2009, Preferred reporting
items for systematic reviews and meta-analyses: The PRISMA statement. PLoS Medicine, 6.
Municipal Association of Victoria, 2012a, Submission in response to the VCEC `Inquiry into the
social and economic costs of problem gambling in Victoria’ issues paper. Retrieved from
http://www.mav.asn.au/policy-services/social-
community/Documents/Counting%20the%20cost%20-
%20Inquiry%20into%20the%20costs%20of%20problem%20gambling%20draft%20report.docx
Municipal Association of Victoria, 2012b, MAV response to VCEC draft report for inquiry into the
costs of problem gambling. Retrieved from http://www.mav.asn.au/policy-services/social-
community/Documents/Response%20to%20VCEC%20draft%20report%20for%20inquiry%20into
%20the%20costs%20of%20problem%20gambling.docx
Municipal Association of Victoria, 2016, Gambling. Retrieved July 11, 2016, from
http://www.mav.asn.au/policy-services/social-community/Pages/gambling.aspx
Murphy, KM & Topel, RH, 2010, Measuring the gains from medical research: An economic
approach. University of Chicago Press. Retrieved from
https://books.google.com.au/books?id=X95KKZUL4pEC
Najavits, LM, Meyer, T, Johnson, KM & Korn, D, 2011, Pathological gambling and posttraumatic
stress disorder: a study of the co-morbidity versus each alone, Journal of Gambling Studies, 27,
663–683. doi: 10.1007/s10899-010-9230-0
Pannell, CW & Loughlin, PH, 2015, Macau’s role as a recreation/tourist center in the Pearl River
Delta city-region, Urban Geography, 36, 883–904. doi: 10.1080/02723638.2015.1067407
Perrone, S, Jansons, D & Morrison, L, 2013, Problem gambling and the criminal justice system.
Melbourne, Victoria: Victorian Responsible Gambling Foundation.
Philander, KS, 2014, Specific or ad valorem? A theory of casino taxation, Tourism Economics, 20,
107–122. doi: 10.5367/te.2013.0265
Pickernell, D, Keast, R, Brown, K, Yousefpour, N & Miller, C, 2013, Taking the gamble: Local and
regional policy issues of access to electronic gaming machines (EGMs): A case study of Victoria,
Australia, Australasian Journal of Regional Studies, 19, 274–294. Retrieved from
http://search.informit.com.au/documentSummary;dn=587052948475725;res=IELHSS
Popay, J, Roberts, H, Sowden, A, Petticrew, M, Arai, L, Rodgers, M, … Duffy, S, 2006, Guidance
on the conduct of narrative synthesis in systematic reviews: A product from the ESRC research
methods programme. Lancaster: Lancaster University.
Productivity Commission, 1999, Australia’s gambling industries: Inquiry report (No. 10). Canberra,
Australia. Retrieved from http://www.pc.gov.au/inquiries/completed/gambling/report/gambling1.pdf
Productivity Commission, 2010, Gambling. (No. 50). Canberra, Australia. Retrieved from
http://books.google.com.au/books/about/Gambling_Introduction.html?hl=&id=8SAOMgEACAA

The social cost of gambling to Victoria Browne et al.
Victorian Responsible Gambling Foundation Page 103
Productivity Commission, 2016a, Report on government services 2016. Volume C: Justice sector
overview. Retrieved from http://www.pc.gov.au/research/ongoing/report-on-government-
services/2016/justice/rogs-2016-volumec-sectorc.pdf
Productivity Commission, 2016b, Report on government services (2016). Volume C: Justice.
Retrieved from http://www.pc.gov.au/research/ongoing/report-on-government-
services/2016/justice/rogs-2016-volumec-justice.pdf
Productivity Commission, 2016c, Report on government services 2016. Volume E: Health.
Retrieved from http://www.pc.gov.au/research/ongoing/report-on-government-
services/2016/health/rogs-2016-volumee-health.pdf
Queensland Government Statistician’s Office, Queensland Treasury, 2015, Australian gambling
statistics, 31st edition.
Quigley, L, Yakovenko, I, Hodgins, DC, Dobson, KS, El-Guebaly, N, Casey, DM, Currie, SR,
Smith, GJ, Williams, RJ & Schopflocher, DP, 2015, Comorbid problem gambling and major
depression in a community sample, Journal of Gambling Studies, 31(4), 1135–1152.
http://doi.org/10.1007/s10899-014-9488-8
Raylu, N & Oei, Tpo, 2004, Role of culture in gambling and problem gambling, Clinical Psychology
Review, 23(8), 1087–1114. doi: 10.1016/j.cpr.2003.09.005
Richard, B, 2010, Diffusion of an economic development policy innovation: explaining the
international spread of casino gambling, Journal of Gambling Studies, 26, 287–300. doi:
10.1007/s10899-009-9166-4
Rintoul, AC, Livingstone, C, Mellor, AP & Jolley, D, 2013, Modelling vulnerability to gambling
related harm: How disadvantage predicts gambling losses, Addiction Research & Theory, 21(4),
329–338. doi: 10.3109/16066359.2012.727507
Rude, J, Surry, Y & Kron, R, 2014, A generalized double-hurdle model of Swedish gambling
expenditures, Applied Economics, 46, 4151–4163. doi: 10.1080/00036846.2014.939376
Sane Australia, 2016, Facts & figures: How many people experience mental illness? Retrieved
June 29, 2016, from https://www.sane.org/mental-health-and-illness/facts-and-guides/facts-figures
Shaffer, HJ & Korn, DA, 2002, Gambling and related mental disorders: a public health analysis,
Annual Review of Public Health, 23, 171–212.
http://doi.org/10.1146/annurev.publhealth.23.100901.140532
Single, E, Collins, D, Easton, B, Harwood, H, Lapsley, H, Kopp, P & Wilson, E, 2003, International
guidelines for estimating the costs of substance abuse. Geneva: World Health Organization.
Suomi, A, Jackson, AC, Dowling, NA, Lavis, T, Patford, J, Thomas, SA, Harvey, P, Abbott, M,
Bellringer, ME & Koziol-McLain, J, 2013, Problem gambling and family violence: family member
reports of prevalence, family impacts and family coping, Asian Journal of Gambling Issues and
Public Health, 3(1), 1. Retrieved from http://ajgiph.springeropen.com/articles/10.1186/2195-3007-
3-13

The social cost of gambling to Victoria Browne et al.
Victorian Responsible Gambling Foundation Page 104
Svensson, J, Romild, U & Shepherdson, E, 2013, The concerned significant others of people with
gambling problems in a national representative sample in Sweden: A 1 year follow-up study, BMC
Public Health, 13, 1087. doi: 10.1186/1471-2458-13-1087
Tam, F, Tsai, H & Chen McCain, S-L, 2013, Tourists’ and residents’ perceptions toward casino
gaming development in Hong Kong, Asia Pacific Journal of Tourism Research, 18, 385–407. doi:
10.1080/10941665.2012.658410
Team, R, 2013, R: A language and environment for statistical computing. Retrieved from
http://cran.fiocruz.br/web/packages/dplR/vignettes/timeseries-dplR.pdf
The Allen Consulting Group, Problem Gambling Research and Treatment Centre (ACG), 2011,
Social and economic impact study of gambling in Tasmania: Summary report. Tasmanian
Government Department of Treasury and Finance.
The Allen Consulting Group, The Social Research Centre & The Problem Gambling Research and
Treatment Centre, 2014, Third social and economic impact study of gambling Tasmania: Volume
1, gambling industry trends and impacts. Tasmanian Government Department of Treasury and
Finance.
The South Australian Centre for Economic Studies, 2008, Social and economic impact study into
gambling in Tasmania (No. 1). Department of Treasury and Finance Tasmania.
Tu, D, Gray, RJ & Walton, DK, 2014, Household experience of gambling-related harm by socio-
economic deprivation in New Zealand: Increases in inequality between 2008 and 2012,
International Gambling Studies, 14, 330–344. doi: 10.1080/14459795.2014.922112
Victims of Crime Assistance Tribunal (VOCAT), 2015, Annual Report 2014–15. Retrieved from
https://www.vocat.vic.gov.au/sites/default/files/9306%20Vocat%20Annual%20report_2015_WEB.p
df
Victorian Commission for Gambling and Liquor Regulation (VCGLR), 2015, Annual report 2014–
15.
Victorian Commission for Gambling and Liquor Regulation (VCGLR), 2016, Local government
authorities. Retrieved July 11, 2016, from
http://www.vcglr.vic.gov.au/home/laws+and+regulations/regulatory+structure/local+government+au
thorities/
Victorian Competition and Efficiency Commission (VCEC), 2012, Counting the cost: Inquiry into the
costs of problem gambling. Victoria.
Victorian Government, 2014, Gambling Regulation Amendment (Pre- commitment) Act 2014.
Retrieved from
http://www.legislation.vic.gov.au/Domino/Web_Notes/LDMS/PubStatbook.nsf/f932b66241ecf1b7ca
256e92000e23be/663694238A57827ECA257C7C00177862/$FILE/14-004a%20authorised.pdf
Victorian Government, 2015, Victorian Budget 2015-16: Budget Paper No.3. Retrieved from
http://www.dtf.vic.gov.au/files/869ffb27-4996-4b53-baff-a48200c2db0a/BP3-2015-16.pdf
The social cost of gambling to Victoria Browne et al.
Victorian Responsible Gambling Foundation Page 105
Victorian Responsible Gambling Foundation, 2015, Annual Report 2014–15. Melbourne: Victorian
Government. Retrieved from
https://www.responsiblegambling.vic.gov.au/__data/assets/pdf_file/0018/25326/Victorian-
Responsible-Gambling-Foundation-Annual-Report-2014–15.pdf
Vlcek, W, 2015, Taking other people’s money: development and the political economy of Asian
casinos, Pacific Review, 28, 323–345. doi: 10.1080/09512748.2014.995127
Walker, DM, 2007, Problems in quantifying the social costs and benefits of gambling, American
Journal of Economics and Sociology, 66, 609–646. Retrieved from
http://www.jstor.org/stable/27739654
Walker, DM & Calcagno, PT, 2013, Casinos and political corruption in the United States: A
Granger causality analysis, Applied Economics, 45, 4781–4795. doi:
10.1080/00036846.2013.804171
Walker, J, 1997, Estimates of the costs of crime in Australia in 1996 (No. 72). Australian Institute of
Criminology. Retrieved from http://aic.gov.au/media_library/publications/tandi_pdf/tandi072.pdf
Walker, SE, Abbott, MW & Gray, RJ, 2012, Knowledge, views and experiences of gambling and
gambling-related harms in different ethnic and socio-economic groups in New Zealand, Australian
and New Zealand Journal of Public Health, 36, 153–159. doi: 10.1111/j.1753-6405.2012.00847.x
Wall, M, Peter, M, You, R, Mavoa, S & Witten, K, 2010, Problem gambling research: A study of
community level harm from gambling: Phase one final report. Ministry of Health.
Wan, YKP, 2012, The social, economic and environmental impacts of casino gaming in Macao:
The community leader perspective, Journal of Sustainable Tourism, 20, 737–755. doi:
10.1080/09669582.2011.636818
Warfield, B, 2011, Gambling motivated fraud in Australia 2008-2010. Warfield & Associates.
Warfield, B, 2012, Million dollar employee fraud in Australia. Warfield & Associates. Retrieved from
https://books.google.com.au/books?id=jq_1nQEACAAJ
Wenz, M, 2014, Valuing casinos as a local amenity, Growth and Change, 45, 136–158. doi:
10.1111/grow.12036
Westphal, JR & Johnson, LJ, 2006, Gambling behavior of juvenile offenders in Louisiana,
International Journal of Mental Health and Addiction, 4(4), 330–350. http://doi.org/10.1007/s11469-
006-9033-9
Williams, RJ, Rhem, J & Stevens, RMG, 2011, The social and economic impacts of gambling. Final
report prepared for the Canadian Consortium for Gambling Research.
Wolfe, B, Jakubowski, J, Haveman, R & Courey, M, 2012, The income and health effects of tribal
casino gaming on American Indians, Demography, 49, 499–524. doi:10.1007/s13524-012-0098-8
World Bank, 2016, Australia GDP per capita. Retrieved July 15, 2016, from
http://www.tradingeconomics.com/australia/gdp-per-capita

The social cost of gambling to Victoria Browne et al.
Victorian Responsible Gambling Foundation Page 106
Wu, S-T & Chen, Y-S, 2015, The social, economic, and environmental impacts of casino gambling
on the residents of Macau and Singapore, Tourism Management, 48, 285–298. doi:
10.1016/j.tourman.2014.11.013
Young, M, Lamb, D & Doran, B, 2011, Gambling, resource distribution, and racial economy: an
examination of poker machine expenditure in three remote Australian towns, Geographical
Research, 49(1), 59–71. doi: 10.1111/j.1745-5871.2010.00667.x
Young, M & Tyler, W, 2008, Mediating markets: Gambling venues, communities and social harm,
Gambling Research: Journal of the National Association for Gambling Studies (Australia), 20(1),
50. Retrieved from
http://search.informit.com.au/documentSummary;dn=397509529845470;res=IELHSS
Zaretzky, Flatau, Clear, Conroy, Burns & Spicer, 2013, The cost of homelessness and the net
benefit of homelessness programs: A national study. Findings from the baseline client survey.
Retrieved from http://researchrepository.murdoch.edu.au/24596/
Zheng, V & Hung, EP, 2012, Evaluating the economic impact of casino liberalization in Macao,
Journal of Gambling Studies, 28, 541–559. doi: 10.1007/s10899-011-9251-3

The social cost of gambling to Victoria Browne et al.
Victorian Responsible Gambling Foundation Page 107
Appendix 1: Summary of systematic literature review
N Author/s (year)
Country Objective Method Gambling type
Gambling harm level and types
Key findings General comments
1 Black, Shaw, Brett, McCormick & Allen (2012)
USA To examine negative consequences of pathological gambling on families and marriages.
Interviews conducted between 2005 and 2010 with 95 pathological gamblers and 91 community controls to assess marital and family variables and indices of childhood maltreatment. The Family Assessment Device (FAD) was used to evaluate family functioning.
All gambling Individual
Affected others
Relationships
Severity of gambling was positively correlated with divorce, childhood maltreatment and greater family dysfunction.
No data reported on the social costs of gambling.
2 Brown, Dickerson, McHardy & Taylor (2012)
UK To investigate the association between the use of credit at the individual and household levels and gambling.
Pooled data from the seven UK Expenditure and Food Surveys (EFS) conducted annually between 2001 and 2007. Gambling expenditure, use of credit (loans, hire purchases, credit club payments) and household characteristics were analysed.
Total gambling expenditure derived from gambling activities: football ‘pools’, bingo, book-makers, lottery, and scratch cards.
Individual
Community
Financial
The positive association between gambling and credit was stable across household income. There was strong intra-household correlation in both gambling activity and the use of credit, with stronger relationships in lower income households.
Study reports on the association between the financial costs (credit use) and gambling expenditure (also a financial cost). Does not report on data on actual monetary costs from the EFSs.
Keywords: risk-taking, gambling, credit, debt.

The social cost of gambling to Victoria Browne et al.
Victorian Responsible Gambling Foundation Page 108
N Author/s (year)
Country Objective Method Gambling type
Gambling harm level and types
Key findings General comments
3 Cheng, Smyth & Sun (2014)
China To examine determinants of participation in and expenditure on the illegal lottery among rural-urban migrants in China.
Conducted a literature review of international research on lotteries and the illegal lottery in China.
Data from the 2006 Survey of Rural-to-Urban Migrant Workers in the Pearl River Delta in China was analysed descriptively and via econometric methods. Factors associated with rural-urban migrants’ participation in and expenditure on illegal gambling were analysed.
Legal and illegal lottery
Mahjong and other card games
Individual
Crime
Workers who were male, in their twenties or thirties, had relatively high income, were religious, came from larger households, work in the formal sector and play mahjong and cards were more likely to participate in the illegal lottery. Having a network of female friends was negatively correlated with participation in the illegal lottery.
Evidence of gambling participation association with crime – participation in the illegal lottery.
No data reported on the social costs of gambling.
Keywords: China, Pearl River Delta, migrant workers, gambling, illegal lottery, liuhecai.
4 Cheung (2014)
China To examine the association between gambling, substance use and delinquency among Chinese adolescents.
Analysed data from a cross-sectional questionnaire survey of a stratified, random sample of 4734 high school students aged 12–23 years in Hong Kong.
All gambling Individual (youth)
Health
Delinquency (including crime)
The prevalence of gambling pathology, frequency and attitudes showed statistically significant (p<.001), positive and consistent relationships with tobacco use, alcohol use and delinquent acts.
No data reported on the social costs of gambling.
Keywords: gambling, tobacco, alcohol, delinquency, comorbidity, self-control, Chinese.
5 Cotti & Walker (2010)
USA To test whether there is a relationship between the spread of casinos and the number of alcohol-related fatal traffic accidents.
Analysed USA data from 1990 to 2000 (during which the majority of casinos opened) on alcohol-related fatal accidents (ARFAs), comparing ARFAs in 131 counties with casinos and 1437 without casinos.
Casino Individual Alcohol-related fatal accidents increased by about 9.2% for casino counties. The relationship between ARFAs and casino presence was negatively related to county population.
Makes tenuous links between casino location and ARFA data.
No data reported on the social costs of gambling.
Keywords: alcohol, casinos, drunk drinking, traffic fatalities.

The social cost of gambling to Victoria Browne et al.
Victorian Responsible Gambling Foundation Page 109
N Author/s (year)
Country Objective Method Gambling type
Gambling harm level and types
Key findings General comments
6 Gainsbury, et al. (2014)
Australia To report on the prevalence and correlates of problem gambling in Australian adults, with a focus on the impact of interactive gambling.
Nationally representative sample of Australian adults (n = 15,006) interviewed via telephone in late 2011, including 2010 interactive gamblers.
Data was collected for measures such as gambling participation, problem gambling, substance use, psychological distress and help-seeking. Statistical analyses were conducted to compare these variables by gambler type (interactive vs non-interactive) and other variables of interest.
All gambling Individual
Health
Emotional and Psychological distress
The prevalence of problem gambling among interactive gamblers was 3 times higher than for non-interactive gamblers. However, problem and moderate-risk interactive gamblers were most likely to attribute problems to EGMs and land-based gambling.
60% of both interactive and non-interactive moderate-risk/problem gamblers had sought help for their gambling: self-help (57.5% IG, 55% NIG), family/friends (18.4% IG), self-exclusion from land-based venues (30% NIG, 15% IG).
No data reported on the social costs of gambling.
This study was the first national PG prevalence study conducted in Australia since 1999.
Keywords: prevalence, problem gambling, internet gambling, addiction, public health policy, risk factors.
7 Grote & Matheson (2014)
USA To determine if the presence of casinos and state lotteries have contributed significantly to the increase in bankruptcy filings.
The annual data from 1982 to 2010 on casino gambling, lottery participation and personal and business bankruptcy filings at the state level was examined, controlling for other variables impacting on the decision to file for bankruptcy.
Results report on rates of bankruptcy, not the costs of bankruptcy.
Lottery and casino
Individual
Community
Financial
States that adopted lotteries and casinos prior to 1995 experienced significantly higher personal bankruptcy rates, while this effect post-1995 is non-existent.
No data reported on the social costs of gambling.
Although implied, doesn’t review the direct relationship of gambling problems to bankruptcy.

The social cost of gambling to Victoria Browne et al.
Victorian Responsible Gambling Foundation Page 110
N Author/s (year)
Country Objective Method Gambling type
Gambling harm level and types
Key findings General comments
8 Hayatbakhs et al. (2012)
Australia To examine the socio-demographic characteristics of young adults’ gambling and its association with mental health and substance use behaviour.
Data was obtained for 3512 young adults aged 18–24 years for whom data from the Mater-University of Queensland Study of Pregnancy (MUSP) were available on self-report gambling, gambling expenditure, Achenbach’s Young Adult Self Report and substance use at the 21-year follow-up of the MUSP.
All gambling Individual
Emotional or psychological distress
Health
Individuals who are involved in gambling are more likely to report cigarette smoking, alcohol consumption and use of illicit drugs, and exhibit high levels of externalising behaviour than non-gamblers.
Recommends that substance abuse and mental health services consider comorbid gambling problems in treatment-seeking patients.
No data reported on the social costs of gambling.
Keywords: young adult, gambling, problem gambling, mental health, substance use.

The social cost of gambling to Victoria Browne et al.
Victorian Responsible Gambling Foundation Page 111
N Author/s (year)
Country Objective Method Gambling type
Gambling harm level and types
Key findings General comments
9 Hing, Breen, Buultjens & Gordon (2012)
Australia To examine gambling behaviour, gambling motivations, gambling-related problems, impacts of gambling and help-seeking among a sample of Indigenous Australians.
The survey was administered face-to-face to 277 Indigenous Australian adults at the 2011 Saltwater Freshwater Festival in New South Wales. Data was collected on gambling participation, frequency, duration and expenditure; gambling motivations; consequences of own gambling; help-seeking for gambling-related problems; erroneous gambling beliefs; demographics; and PGSI. Descriptive statistical analyses were conducted.
All gambling Individual
Affected others
Community
Financial
Relationships
Emotional or psychological distress
Several negative impacts were reported, including financial problems and subsequent reliance on relatives or friends, going without, not paying or putting off bills. Gamblers reported that gambling had led to household arguments, depression and violence.
Substantial minorities reported obtaining emergency help, begging, getting an advance, selling possessions, borrowing money or obtaining money illegally.
The study found intensive card gambling, with prize pools as high as $2500 reported, along with some people typically playing for 8–24 hours and spending more than $300 per fortnight on this activity.
No data reported on the social costs of gambling other than average expenditure by gambling activity.
10 Humphreys & Soebbing (2014)
USA To examine the relationship between the presence of video lottery terminals (VLTs) and casino gambling in Albert (USA) and crime.
Data from the Statistics Canada Uniform Crime Reporting Survey (UCRS) was used to analyse the relationship between access to legal gambling and crime in Alberta between 1977 and 2008.
Article ‘does not attempt to estimate the monetary value of the benefits and costs of crime.’ (pp. 99).
VLTs and casinos
Community
Criminal activity
The analysis revealed a weak association between the presence of VLTs and casinos and crime in Albert. However, some positive and negative crime-specific associations with casinos and VLTs were found (e.g. negative association of prostitution and shoplifting with the presence of VLTs).
No data reported on the social costs of gambling.

The social cost of gambling to Victoria Browne et al.
Victorian Responsible Gambling Foundation Page 112
N Author/s (year)
Country Objective Method Gambling type
Gambling harm level and types
Key findings General comments
11 Kerber et al. (2015)
USA To describe the mental, social and economic health impacts of disordered gambling on older adults recovering from pathological gambling.
Data from 40 older adults (M=65.7 years) recovering from pathological gambling was analysed descriptively.
Social health impact was measured by examining: others’ complaints of the participant’s gambling, missed work to gamble, job loss related to gambling, divorce related to gambling, and distance travelled to gamble.
Economic health measures: still having a gambling debt, money owed to pay off gambling debt, individual income, and largest amount lost in one day.
All gambling Individual
Financial
Relationships
Reduced performance work or study
Crime
57.3% had a gambling debt.
Job loss was a key indicator of a significant gambling disorder.
Financial loss due to gambling was the most frequent motivator to seek treatment.
No data reported on the social costs of gambling.
12 Larsen, Curtis & Bjerregaard (2013)
Denmark To investigate (a) the association between lifetime problem gambling and harmful alcohol use as well as frequent use of marijuana and (b) the prevalence of cross-addictive behaviour among Greenland Inuit.
Data from the Inuit Health in Transition Greenland Survey was collected among Greenland Inuit adults aged 18+ years from 2006 to 2010 via face-to-face interviews (n = 2415) and a follow-up self-administered questionnaire (n = 2189).
Lifetime problem gambling, harmful alcohol use and frequent use of marijuana were measured through the self-administered questionnaire and were analysed.
All gambling Individual
Health
For lifetime problem gamblers, the gambling problems were more often combined with harmful alcohol use, frequent use of marijuana or both, especially among men.
No data reported on the social costs of gambling.
Keywords: problem gambling, indigenous health, social pathologies, addictive behaviour, Inuit.
13 Lee, Kang & Reisinger (2010)
USA & South Korea
To examine whether residents’ socio-demographic variables were related to their community attachment and whether residents’
Data collection
South Korea: Face-to-face interviews (n = 604) conducted in 2007.
USA: Self-completed mail surveys in 3 communities (n = 380), collected in 2004.
Casino Community
Financial
Relationships
Health
Cultural harm
PCA extracted six factors for perceptions:
1) Negative social impact with direct gambling costs, 5 items: bankruptcy, gambling addition, speculative betting, destruction of
No data reported on the social costs of gambling.
Article is about perceptions of
negative and positive benefits of casino gaming

The social cost of gambling to Victoria Browne et al.
Victorian Responsible Gambling Foundation Page 113
N Author/s (year)
Country Objective Method Gambling type
Gambling harm level and types
Key findings General comments
community attachment affected their perceived impacts, benefits, and support for casino gaming development by comparing communities in two rural gaming locations: Colorado, USA and Gangwon Province, South Korea.
Data analyses
Descriptive statistics summarising the data.
Principal component analysis (PCA) of perceptions, community attachment, benefits and support for gambling development was conducted.
Regression analyses to examine relationship between(a) residents’ social-demographic characteristics and their community attachment level,(b) community attachment level to perceptions, benefits and support factors.
Criminal activity
families, brining usury to a community
2) Negative environmental impact, 6 items: noise, water pollution, traffic congestion, environmental degradation, crowding
3) Negative social impact with indirect gambling costs, 5 items: alcohol and drug problems, crime, divorce, prostitution, corruption
4) Positive social impact, five items: traditional/cultural preservation, community spirit, residents’ pride, educational environment, historical/cultural preservation
5) Positive economic impact, 5 items: tourists’ spending, employment, investments and businesses, tax revenues, income
6) Negative economic impact, 2 items: tax burden, cost of living
PCA extracted one factor for these 3 measures: community attachment (5 items), benefits (4 items), and support (5 items).
development, not the actual impacts.
Key words: community attachment, casino gaming, Colorado, South Korea, rural gaming development.

The social cost of gambling to Victoria Browne et al.
Victorian Responsible Gambling Foundation Page 114
N Author/s (year)
Country Objective Method Gambling type
Gambling harm level and types
Key findings General comments
Residents’ community attachments were significantly different between the two locations and influenced residents’ perceptions of, benefits, and support for gaming development. Highly community-attached individuals viewed the benefits of casinos more positively and supported them more strongly, than individuals with less community attachment.
14 Lindberg, Fernie & Spada (2011)
UK To investigate the relationship among metacognitions, anxiety, depression and gambling in a sample of problem gamblers.
Data collected via self-completion survey with adults attending gambling treatment services (n = 91).
Measures: Metacognitions Questionnaire (MCQ-30), Hospital Anxiety and Depression Scale (HADS), South Oaks Gambling Scale (SOGS), demographic.
Analyses: descriptive, correlation, regression.
All gambling Individual
Emotional or psychological distress
Anxiety, depression and metacognitions were significantly positively correlated with gambling consequences and behaviour.
No data reported on the social costs of gambling
Keywords: anxiety, depression, gambling, metacognitions, problem gambling.
15 Maierova, Charvat & Miovsky (2014)
Czech Republic
To describe the key stages of gamblers’ lifecycle and the associated consequences from clinical, social, economic and time perspective.
SOGS questionnaire and semi-structured interview administered to 139 men living in residential care and diagnosed with gambling problems.
All gambling Individual
Financial
Relationships
Emotional or psychological distress
Health
Work or study
Family and relationship problems, loss of employment debt, psychopathological comorbidity with such problems as substance abuse, affective disorders (anxiety, depression), suicidal thoughts and/or attempts.
No data reported on the social costs of gambling
Keywords: consequences of gambling, gambling careers, pathological gambling, SOGS.

The social cost of gambling to Victoria Browne et al.
Victorian Responsible Gambling Foundation Page 115
N Author/s (year)
Country Objective Method Gambling type
Gambling harm level and types
Key findings General comments
16 Markham, Young & Doran (2014)
Australia To test the hypothesis that electronic gaming machines (EGMs) expenditure predicts gambling harm at the level of the venue.
Cross-sectional data collected from adult population in the Northern Territory via a self-completed mail survey (n = 7049) on venue visitation and gambling behaviour across 62 EGM venues.
Measures:
Gambling-related harm (PGSI 2+ items endorsed)
EGM expenditure at venue level (sourced from local licensing authorities)
Analyses: prevalence of gambling-related harm among patrons aggregated at the venue level with the estimated mean EGM expenditure for each adult resident in the venue’s service area using a Huff model, correlation analysis and multivariate binomial regression.
Electronic gaming machines (EGMs)
Individual
Harm type not specified, PGSI used as proxy.
An increase in mean per capita monthly EGM expenditure from A$10 to A$150 was associated with a doubling in the prevalence of gambling-related harm from 9% to 18%.
No data reported on the social costs of gambling.
Keywords: electronic gaming machines, gambling expenditure, gambling-related harm, slot machines, total consumption theory, gambling venues.

The social cost of gambling to Victoria Browne et al.
Victorian Responsible Gambling Foundation Page 116
N Author/s (year)
Country Objective Method Gambling type
Gambling harm level and types
Key findings General comments
17 Moellman & Mitra (2013)
USA To explore how Indian gaming impacts local communities in Oklahoma, USA.
Empirical analysis conducted using data collected from the US Census Bureau, the FBI’s Uniform Crime Reporting Program, the Bureau of Labor Statistics, the 500 Nations Indian gaming website, and phone interviews with various gaming centres.
Four metrics were used to determine the relationship between gaming (number of gaming machines and tables) and community welfare: median household income, unemployment level, violent crime, and property crime.
Gaming machines
Gaming tables
Community
Financial
Work or study
Criminal activity
Gaming venue characteristics association with measures of harm, problem gambling causing harm
On average as the number of gaming tables increases median household income increases and the levels of unemployment, violent crime and property crime decrease.
Opposite findings are shown for the number of gaming machines: as the number of gaming machines increases, the median household income decreases and the levels of unemployment, violent crime and property crime increase.
This difference may be due to the number of gaming tables being more correlated with larger gaming operations (e.g. casinos), whereas it is possible to have a fairly large number of gaming machines in smaller gaming operations (e.g. a pub).
No data reported on the social costs of gambling
Keywords: economic development, Indian gaming, regional economics, cultural economics.

The social cost of gambling to Victoria Browne et al.
Victorian Responsible Gambling Foundation Page 117
N Author/s (year)
Country Objective Method Gambling type
Gambling harm level and types
Key findings General comments
18 Najavits, Meyer, Johnson & Korn (2011)
USA To compare pathological gambling (PG), post-traumatic stress disorder (PTSD) and their co-occurrence.
Data was collected for three groups: 36 with current PTSD, 35 with current PG, and 35 with current PTSD and PG via in-person assessment and interviews.
Measures: socio-demographics, psychopathology (e.g., dissociation, suicidality, comorbid Axis I and II disorders), functioning, cognition, life history, problem gambling severity and PTSD.
Not applicable; only problem gambling severity data collected.
Individual
Emotional or psychological distress
Overall, the PG group reported better psychological health and higher functioning than the PTSD or BOTH groups; across the sample many reported a family history of substance use disorder (59%) and gambling problems (34%), highlighting intergenerational impact.
No data reported on the social costs of gambling
Keywords: problem gambling, pathological gambling, PTSD, posttraumatic stress disorder, trauma, comorbidity.
19 Pickernell et al. (2013)
Australia To explore issues of accessibility as they relate to electronic gaming machines (EGMs) in Victoria, Australia.
EGM survey data for 62 local government areas (LGAs) in Victoria were sourced from the Victorian Government Department of Justice website (2006) and the ABS12 census (2006) website.
Measures: EGM location, EGMs per venue/locality, EGM spend per person, spend per EGM, socio-economic-cultural environment (income, unemployment, mean age, number of tourists), and volunteering as proxy for social capital.
Data analyses: interactions between the location of and demand for EGM products.
Electronic gaming machines (EGMs)
Community
Financial
Work or study
Volunteering
EGMs per 1000 adults negatively related to unemployment rates and income, and positively related to number of visitors to Victoria.
Expenditure on EGMs per adult positively related to EGM access (number of EGMs per adult and venue size) and unemployment.
Social capital (volunteering) potential two-way relationship with access to EGMs: negatively related to EGM venue size, unemployment, income; positively related to age and tourist areas.
No data reported on the social costs of gambling
Keywords: electronic gaming machines, gambling revenues, social capital, Australia.
12 Australian Bureau of Statistics.
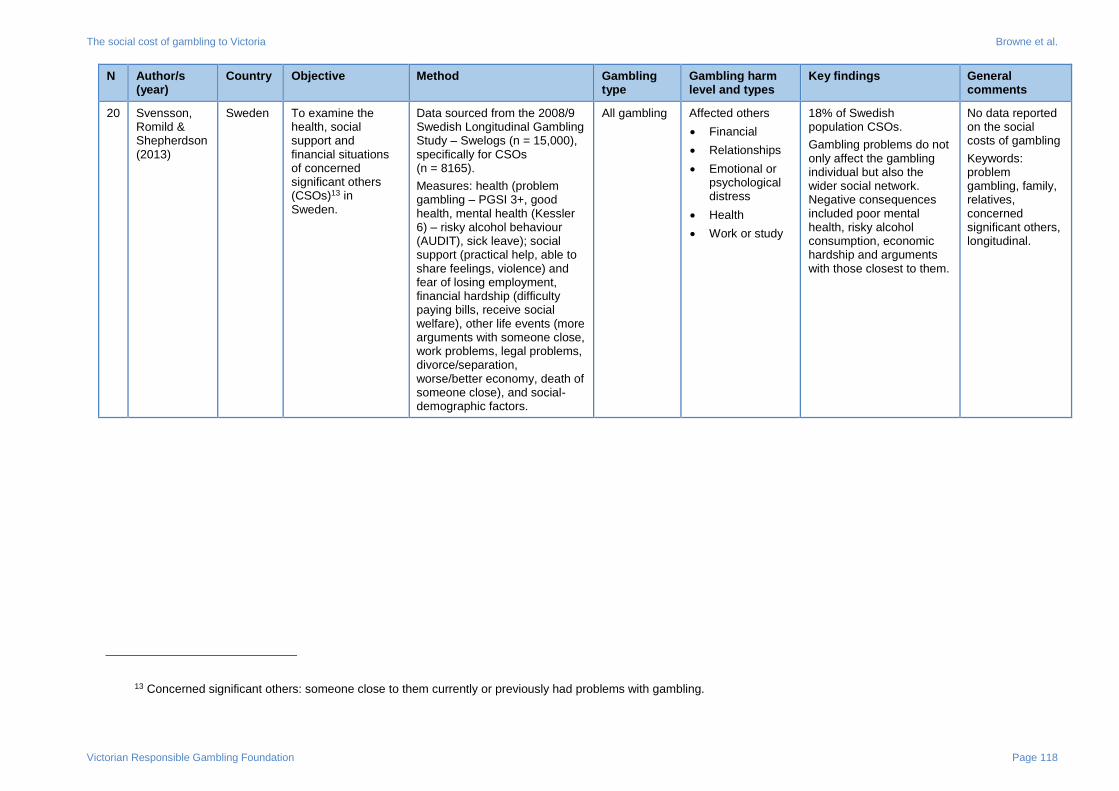
The social cost of gambling to Victoria Browne et al.
Victorian Responsible Gambling Foundation Page 118
N Author/s (year)
Country Objective Method Gambling type
Gambling harm level and types
Key findings General comments
20 Svensson, Romild & Shepherdson (2013)
Sweden To examine the health, social support and financial situations of concerned significant others (CSOs)13 in Sweden.
Data sourced from the 2008/9 Swedish Longitudinal Gambling Study – Swelogs (n = 15,000), specifically for CSOs (n = 8165).
Measures: health (problem gambling – PGSI 3+, good health, mental health (Kessler 6) – risky alcohol behaviour (AUDIT), sick leave); social support (practical help, able to share feelings, violence) and fear of losing employment, financial hardship (difficulty paying bills, receive social welfare), other life events (more arguments with someone close, work problems, legal problems, divorce/separation, worse/better economy, death of someone close), and social-demographic factors.
All gambling Affected others
Financial
Relationships
Emotional or psychological distress
Health
Work or study
18% of Swedish population CSOs.
Gambling problems do not only affect the gambling individual but also the wider social network. Negative consequences included poor mental health, risky alcohol consumption, economic hardship and arguments with those closest to them.
No data reported on the social costs of gambling
Keywords: problem gambling, family, relatives, concerned significant others, longitudinal.
13 Concerned significant others: someone close to them currently or previously had problems with gambling.
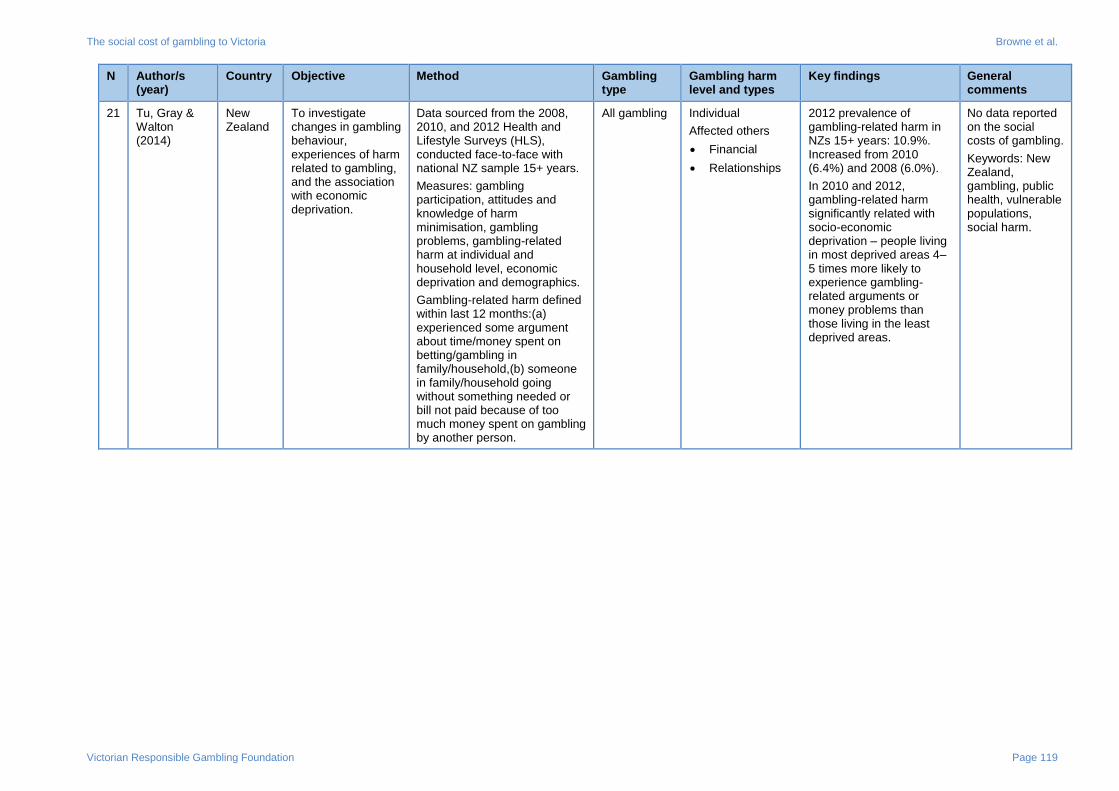
The social cost of gambling to Victoria Browne et al.
Victorian Responsible Gambling Foundation Page 119
N Author/s (year)
Country Objective Method Gambling type
Gambling harm level and types
Key findings General comments
21 Tu, Gray & Walton (2014)
New Zealand
To investigate changes in gambling behaviour, experiences of harm related to gambling, and the association with economic deprivation.
Data sourced from the 2008, 2010, and 2012 Health and Lifestyle Surveys (HLS), conducted face-to-face with national NZ sample 15+ years.
Measures: gambling participation, attitudes and knowledge of harm minimisation, gambling problems, gambling-related harm at individual and household level, economic deprivation and demographics.
Gambling-related harm defined within last 12 months:(a) experienced some argument about time/money spent on betting/gambling in family/household,(b) someone in family/household going without something needed or bill not paid because of too much money spent on gambling by another person.
All gambling Individual
Affected others
Financial
Relationships
2012 prevalence of gambling-related harm in NZs 15+ years: 10.9%. Increased from 2010 (6.4%) and 2008 (6.0%).
In 2010 and 2012, gambling-related harm significantly related with socio-economic deprivation – people living in most deprived areas 4–5 times more likely to experience gambling-related arguments or money problems than those living in the least deprived areas.
No data reported on the social costs of gambling.
Keywords: New Zealand, gambling, public health, vulnerable populations, social harm.

The social cost of gambling to Victoria Browne et al.
Victorian Responsible Gambling Foundation Page 120
N Author/s (year)
Country Objective Method Gambling type
Gambling harm level and types
Key findings General comments
22 Walker, Abbott & Gray (2012)
New Zealand
To describe survey findings which measure broader gambling harms and provide benchmark data to evaluate an awareness and education program to minimise harm. To assess ethnic and socio-economic disparities of gambling harms.
The 2006/7 Gaming and Betting Activities Survey (GBAS) was conducted face-to-face with a random probability sample of adults (n = 1774) and 15–17-year-olds (n = 199). Māori (NZ’s indigenous people), Pacific and Asian peoples, and people in areas of deprivation, were oversampled for analysis purposes.
Measures: gambling participation (type and frequency of gambling activities), form of gambling (non-continuous, continuous), socio-economic status, ethnicity, knowledge of gambling harms, and experience of gambling harms.
Gambling harms defined within last 12 months:(a) experienced some argument about time/money spent on betting/gambling in family/household,(b) someone in family/household going without something needed or bill not paid because of too much money spent on gambling by another person.
All gambling Individual
Affected others
Financial
Relationships
Self-reported knowledge of the signs of gambling harm was high. Arguments about gambling and people going without/unpaid bills provided two indicators of broader gambling harm. Around one-sixth of New Zealanders experienced each of these harms. Impacts were greatest for low-income groups, Māori, and Pacific peoples.
The proportion of New Zealander’s experiencing broader gambling harms was much higher than the prevalence for problem gambling. Results show the flow-on impacts of problem gambling – on family, friends and communities.
No data reported on the social costs of gambling.
Keywords: public health, problem gambling, nationwide survey, gambling harm, New Zealand.

The social cost of gambling to Victoria Browne et al.
Victorian Responsible Gambling Foundation Page 121
N Author/s (year)
Country Objective Method Gambling type
Gambling harm level and types
Key findings General comments
23 Wan (2012) China To investigate the social, economic and environmental consequences of casino gaming in Macao since casino license liberalisation in 2002.
Data was collected via in-depth qualitative interviews with 17 key community leaders who: represented an industry affected by casino gaming, had an interest in casino gaming development/improvement of the industry, and were widely recognised by local people as knowledgeable and reputable in the field.
They were asked 4 questions on their views on the social, economic and environmental impacts of casino gaming and suggestions on minimising negative impacts. Two questions were asked about their views of community acceptance levels of gaming development and reasons attributed to levels, and periods of change in residents’ attitudes on gaming and the causes. The aim was to understand whether social exchange theory (SET) or social disruption theory (SDT) explained residents’ attitude toward gaming.
Content analysis was employed to examine the relationship between identified categories and themes.
Casino Community
Study is about community leaders’ perceptions and opinions, not actual gambling-related harm data.
The community leaders suggest that although casino gaming does make positive social, economic and environmental contributions to the community, negative consequences such as the changing values of teenagers, the high student drop-out rate, problem gambling and crime, changing family relationships, increasing tension between public needs and casino land requirements, traffic congestion, and air and noise pollution need to be dealt with.
Macao residents’ acceptance level of the further development of casino gaming is found to be high, and their perceptions of its impact can be explained by the social exchange theory, rather than by social disruption theory.
No data reported on the social costs of gambling.
Keywords: casino gaming impacts, community leaders’ perceptions, Macao, China.

The social cost of gambling to Victoria Browne et al.
Victorian Responsible Gambling Foundation Page 122
N Author/s (year)
Country Objective Method Gambling type
Gambling harm level and types
Key findings General comments
24 Wolfe et al. (2012)
USA To examine the relationship between household income and the health of tribal casino gaming on American Indians.
Annual data from 1988–2003 on tribal gaming, health care access (from the Area Resource File) and individual health and socioeconomic characteristics data (from the Behavioral Risk Factors Surveillance System) was used in the analysis.
Measures: income, tribal gaming 2+ years, health risk behaviours (smoking, drinking), health indicators (e.g. obesity, diabetes), health care utilisation (e.g. health plan), mental health, household income, employment status, and other demographics.
Casino Community
Income
Health
Emotional or psychological distress
Work or study
Identified estimates of the positive effect of gaming on American Indian income and on several indicators of American Indian health, health-related behaviours and access to health care.
No data reported on the social costs of gambling.
Keywords: income gradient, health, American Indian health, social determinants.
25 Young, Lamb & Doran (2011)
Australia To examine the ways in which EGMs redistribute resources to and from three remote towns in the Northern Territory, Australia.
Gambling in three remote towns in the Northern Territory (Nhulunbuy, Katherine and Tennant Creek) was discussed to give contextual background to these case studies.
Exploratory analysis was then conducted for each case study, with focus on EGM expenditure levels at venue level (2006–07 financial year), local EGM markets and racially-based alcohol regulations, and examining the outcomes of resource redistribution mechanisms designed to redistribute a proportion of local EGM profits.
Electronic gaming machines (EGMs)
Community
Financial
Two venues in Nhulunbuy had over $100,000 expenditure each per EGM for 2006–07 from a total of 55 EGMs.
EGMs only permitted in venues licensed to serve alcohol. Coupled with alcohol restrictions in the NT targeted at impoverished Aboriginal drinkers, authors argue anecdotally that this is an attempt to govern the Aboriginal consumer patterns and correlates with EGM and venue use.
In NT, clubs are not formally required to redistribute EGM revenue to the community, meaning money often goes back into club
No data reported on the social costs of gambling.
Keywords: gambling, electronic gaming machines, remote towns, racial economy, Northern Territory.
The social cost of gambling to Victoria Browne et al.
Victorian Responsible Gambling Foundation Page 123
N Author/s (year)
Country Objective Method Gambling type
Gambling harm level and types
Key findings General comments
membership to the benefit of patrons and the broader community (e.g. sporting and recreational facilities).
Hotels are required to contribute 10% of EGM revenue to the Community Benefit Fund (CBF) which is created to improve the negative social consequences of gambling in the NT (via gambling research and support programs for PG).
Summary: ’The suburban clubs are likely to develop social capital and amenity for a select group of beneficiaries, while their most disadvantaged patrons, particularly if they are Aboriginal and live outside town, may receive very little.’ (p. 69).

The social cost of gambling to Victoria Browne et al.
Victorian Responsible Gambling Foundation Page 124
Appendix 2: Understanding gambling
harms questionnaire (Browne et al, 2016)
The gambling-related harms questionnaire presented in this appendix was administered by
Browne et al (2016) via an online survey to an Australian sample of 3076 gamblers impacted by
their gambling and 2129 non-gamblers affected by a gambler they have a close relationship with
(‘affected others’). The questionnaire collected data on gambling-related harm for 72 harm items
across six domains: financial, work and study, health, emotional and psychological, relationship,
and other harms such as crime and child neglect. Problem gambling status was measured via the
nine-item Problem Gambling Severity Index (PGSI, Ferris & Wynne, 2001), self-reported by
gamblers and reported by ‘affected others’ for the gamblers affecting them.
The current report utilised the gambling-related harm items from the national gambling-harm
survey data, specifically the aggregate percentages of gamblers experiencing the harm item due to
their gambling during a 12-month period by PGSI category: low-risk gamblers (n = 157), moderate-
risk gamblers (n = 829) and problem gamblers (n = 1972). For these figures, refer to Table 5 of this
report and Tables 9, 10 and 11 of the Browne et al. report (2016). The following gambling-related
harm items were used for estimating the cost of gambling in this report:
Group A questionnaire: Gamblers
Q5a_4: Bankruptcy
Q8a_11: Depression
Q8b_3: Attempted suicide
Q7a and Q7b series: Emotional and psychological harms
Q6b_2: Divorce or separation
Q9a_1: Reduced performance at work or study
Q9b_1: Lost job
Q9a_3: Absent from work or study
Q10b_4: Experiences of violence
Q10b_1: Petty theft or dishonesty in respect to government, business or other people (not
family/friends)
Q10b_2: Felt compelled or forced to commit a crime or steal to fund gambling or pay debts
Group B questionnaire: Non-gamblers ( ‘affected others’)
Q7c: Level of emotional or psychological impact from being affected by someone else’s
gambling

The social cost of gambling to Victoria Browne et al.
Victorian Responsible Gambling Foundation Page 125
Understanding gambling harms: questionnaire
This survey will ask you to reflect on gambling experiences. When you think about gambling you
should consider lottery tickets, instant scratch tickets or raffles along with all other types of
gambling such as poker machines, card games, racing, sports betting, day trading, bingo and
casino games.
Q1: Has there been a time when your gambling has caused problems in your life, no matter
how minor?
1. Yes
2. No
If answer = 2 skip to Q1a
When Group A quota filled all respondents will skip immediately to Group B
Group A – Gamblers
Section 1: Your gambling experiences
The next few questions will ask you to reflect on a time in your life when your gambling caused you
the most problems. We’d like you to think about the approximate 12 month period around this time.
Q2: Approximately how long ago was this period of time?
Less than 1 year ago
Enter number of years 1–65
Q3: Thinking about this 12 month period, what form of gambling were you betting the most
money on?
1. Electronic gambling machine (Pokies, Slot Machine, Fruit Machine or VLTs)
2. Sports betting
3. Race betting
4. Poker
5. Casino table games (not including Poker)
6. Keno
7. Lottery tickets
8. Other (please specify)
Q3b. How and where did you most often bet on this form of gambling?
1. Mobile phone
2. Tablet/iPad
3. Computer/laptop
4. Casino
5. Pub/hotel
6. RSL club
7. Sports club/bar
The social cost of gambling to Victoria Browne et al.
Victorian Responsible Gambling Foundation Page 126
8. Betting shop (e.g., TAB or newsagent )
9. Other (please specify)
Q4: For the next few questions please continue to reflect on the 12 month period during
which your gambling was causing you the most problems.
1. At this time, did you bet more than you could really afford to lose?
2. At this time, did you need to gamble with larger amounts of money to get the same feeling
of excitement?
3. At this time, when you gambled, did you sometimes go back another day to try to win back
the money you lost?
4. At this time, did you borrow money or sell anything to get money to gamble?
5. At this time, did you feel that you might have a problem with gambling?
6. At this time, did gambling cause you any health problems, including stress or anxiety?
7. At this time, did people criticize your betting or tell you that you had a gambling problem,
regardless of whether or not you thought it was true?
8. At this time, did your gambling cause any financial problems for you or your household?
9. At this time, did you feel guilty about the way you gamble or what happens when you
gamble?
Response options
0. Never
1. Sometimes
2. Most of the time
3. Almost always
Q4b: How often did you gamble at this time?
1. Monthly or less
2. 2 to 4 times a month
3. 2 to 3 times a week
4. 4 to 5 times a week
5. 6 or more times a week
Q4c: How much time did you spend gambling on a typical day in which you gambled at this
time?
1. Less than 30 minutes
2. More than 30 min but less than 1 hour
3. More than 1 hours but less than 2 hours
4. More than 2 hours but less than 3 hours
5. More than 3 hours

The social cost of gambling to Victoria Browne et al.
Victorian Responsible Gambling Foundation Page 127
Q4d: How often did you spend more than 2 hours gambling (on a single occasion) at this
time?
1. Never
2. Less than monthly
3. Monthly
4. Weekly
5. Daily or almost daily
Section 2: Financial impact
Please continue to consider the 12 month period of time that you nominated above, when your
gambling was causing the most problems. We would like you to think about how your gambling
may have impacted upon your finances during this time.
Q5a: Please review the following list and indicate whether you have experienced any of
these issues as a result of your gambling during this time.
1. Reduction of my savings
2. Reduction of my available spending money
3. Increased credit card debt
4. Sold personal items
5. Took on additional employment
6. Late payments on bills (e.g. utilities, rates)
7. Less spending on recreational expenses such as eating out, going to movies or other
entertainment.
8. Less spending on beneficial expenses such as insurances, education, car and home
maintenance
9. Less spending on essential expenses such as medications, healthcare and food
10. I did not experience any of these issues as a result of my gambling
Q5b: During this time, did your gambling contribute to or cause you to experience any of
the following situations?
1. Needed assistance from welfare organisations (foodbanks or emergency bill payments)
2. Loss of supply of utilities (electricity, gas, etc.)
3. Loss of significant assets (e.g. car, home, business, superannuation)
4. Bankruptcy
5. Needed emergency or temporary accommodation
6. I did not experience any of these issues as a result of my gambling

The social cost of gambling to Victoria Browne et al.
Victorian Responsible Gambling Foundation Page 128
Q5c: Overall, what level of impact did your gambling have upon your financial security
during this time?
1. No impact
2. Minor impact
3. Moderate impact
4. Major impact
Section 3: Impact to relationships
Please continue to consider the 12 month period of time when your gambling was causing the
most problems. We would like you to think about how your gambling may have impacted upon
your relationships during this time.
Q6a: Please review the following list and indicate whether you have experienced any of
these issues as a result of your gambling during this time.
1. Spent less time with people I care about
2. Got less enjoyment from time spent with people I care about
3. Neglected my relationship responsibilities
4. Spent less time attending social events (non gambling related)
5. Experienced greater tension in my relationships (suspicion, lying, resentment, etc)
6. Experienced greater conflict in my relationships (arguing, fighting, ultimatums)
7. Felt belittled in my relationships
8. I did not experience any of these issues as a result of my gambling
Q6b: During this time, did your gambling contribute to or cause you to experience any of
the following situations during this time?
1. Threat of separation or ending a relationship/s
2. Actual separation or ending a relationship/s
3. Social isolation (felt excluded or shut-off from others)
4. I did not experience any of these issues as a result of my gambling
Q6c: Overall, what level of impact did your gambling have upon your personal relationships
(family, friends, spouse, partner, etc) during this time?
1. No impact
2. Minor impact
3. Moderate impact
4. Major impact
The social cost of gambling to Victoria Browne et al.
Victorian Responsible Gambling Foundation Page 129
Section 4: Emotional or psychological impact
Please continue to consider the 12 month period when your gambling was causing the most
problems. We would like you to think about how your gambling may have impacted upon your
emotional or psychological wellbeing during this time.
Q7a: Please review the following list and indicate whether you have experienced any of
these issues as a result of your gambling during this time.
1. Felt distressed about my gambling
2. Felt ashamed of my gambling
3. Felt like a failure
4. Felt insecure or vulnerable
5. Felt angry about not controlling my gambling
6. Felt worthless
7. Had regrets that made me feel sorry about my gambling
8. I did not experience any of these issues as a result of my gambling
Q7b: During this time, did your gambling contribute to or cause you to experience any of
the following situations?
1. Feelings of hopelessness about gambling
2. Feelings of extreme distress
3. Thoughts of running away or escape
4. I did not experience any of these issues as a result of my gambling
Q7c: Overall, what level of impact did your gambling have upon your emotional or
psychological wellbeing during this time?
1. No impact
2. Minor impact
3. Moderate impact
4. Major impact
Section 5: Health impacts
Please continue to consider the 12 month period of time when your gambling was causing the
most problems. We would like you to think about how your gambling may have impacted upon
your health during this time.
Q8a: Please review the following list and indicate whether you have experienced any of
these issues as a result of your gambling during this time.
1. Reduced physical activity due to my gambling
2. Stress related health problems (e.g. high blood pressure, headaches)
3. Loss of sleep due to spending time gambling
4. Loss of sleep due to stress or worry about gambling or gambling-related problems
5. Neglected my hygiene and self-care

The social cost of gambling to Victoria Browne et al.
Victorian Responsible Gambling Foundation Page 130
6. Neglected my medical needs (including taking prescribed medications)
7. Didn’t eat as much or often as I should
8. Ate too much
9. Increased my use of tobacco
10. Increased my consumption of alcohol
11. Increased experience of depression
12. Increased use of health services due to health issues caused or exacerbated by my
gambling
13. Committed acts of self harm
14. I did not experience any of these issues as a result of my gambling
Q8b: During this time, did your gambling contribute to or cause you to experience any of
the following situations?
1. Unhygienic living conditions (living rough, neglected or unclean housing, etc)
2. Required emergency medical treatment for health issues caused or exacerbated by
gambling
3. Attempted suicide
4. I did not experience any of these issues as a result of my gambling
Q8c: Overall, what level of impact did your gambling have upon your physical or mental
health during this time?
1. No impact
2. Minor impact
3. Moderate impact
4. Major impact
Q8d: During this time, how much sleep did you typically get on a week night or work night?
ENTER NUMBER OF HOURS
Q8e: During this time how much sleep did you typically get on a weekend or non-work
night?
ENTER NUMBER OF HOURS
Section 6: Work or study impacts
Please continue to consider the 12 month period of time when your gambling was causing the
most problems. We would like you to think about how your gambling may have impacted upon
your work or study performance during this time.
Q9a: Please review the following list and indicate whether you have experienced any of
these issues as a result of your gambling during this time.
1. Reduced performance at work or study (i.e. due to tiredness or distraction)
2. Was late for work or study
3. Was absent from work or study

The social cost of gambling to Victoria Browne et al.
Victorian Responsible Gambling Foundation Page 131
4. Hindered my job-seeking efforts
5. Used my work or study time to gamble
6. Used my work or study resources to gamble
7. Lack of progression in my job or study
8. Conflict with my colleagues
9. I did not experience any of these issues as a result of my gambling
Q9b: During this time, did your gambling contribute to or cause you to experience any of
the following situations?
1. Lost my job
2. Excluded from study
3. I did not experience any of these issues as a result of my gambling
Q9c: Overall, what level of impact did your gambling have upon your work or study
performance during this time?
1. No impact
2. Minor impact
3. Moderate impact
4. Major impact
Section 7: Other problems
Please continue to consider the 12 month period of time when your gambling was causing the
most problems. We would like you to think about how your gambling may have impacted upon
other areas of your life during this time.
Q10a: Please review the following list and indicate whether you have experienced any of
these issues as a result of your gambling during this time.
1. Left children unsupervised
2. Didn’t fully attend to needs of children
3. Took money or items from friends or family without asking first
4. Promised to pay back money without genuinely intending to do so
5. Arrested for unsafe driving
6. Reduced my contribution to religious or cultural practices
7. Felt less connected to my religious or cultural community
8. Felt that I had shamed my family name within my religious or cultural community
9. I have not experienced any of these issues as a result of my gambling
Q10b: During this time, did your gambling contribute to or cause you to experience any of
the following situations?
1. Petty theft or dishonesty in respect to government, businesses or other people (not
family/friends)
2. Felt compelled or forced to commit a crime or steal to fund gambling or pay debts

The social cost of gambling to Victoria Browne et al.
Victorian Responsible Gambling Foundation Page 132
3. Outcast from religious or cultural community due to involvement with gambling
4. Had experiences with violence (include family/domestic violence)
5. I did not experience any of these issues as a result of my gambling
Q10c: Overall, what level of other impacts did your gambling have upon you during this
time?
1. No impact
2. Minor impact
3. Moderate impact
4. Major impact
Q11: Did you experience any other negative impacts or harms during this time as a result of
your gambling that we haven’t mentioned? If so, please comment below.
Q12: Thinking about this time in your life, did you usually see a solution to problems and
difficulties that other people find hopeless?
1. Yes, usually
2. Yes, sometimes
3. No
Q13: Thinking about this time in your life, did you feel that your daily life was a source of
personal satisfaction?
1. Yes, usually
2. Yes, sometimes
3. No
Q14: Thinking about this time in your life, did you usually feel that the things that happen to
you in your daily life were hard to understand?
1. Yes, usually
2. Yes, sometimes
3. No
Section 8: Impact to others
Q15a: Considering all the issues raised earlier, how many other people would you estimate
were affected by your gambling during this period of time?
ENTER NUMBER 0>
Q15b: And how many of these people would you estimate were affected by your gambling
AS MUCH as you were or more, during this period of time?
ENTER NUMBER 0>
Q15c: What was your relationship with the person/people affected by your gambling?
1. Spouse, de facto or romantic partner
2. Close friend

The social cost of gambling to Victoria Browne et al.
Victorian Responsible Gambling Foundation Page 133
3. Parent
4. Sibling
5. Child
6. Family member
7. Co-worker/colleague
8. Other, please specify
Q16a: Still thinking about the same period of time, were you affected by anybody else’s
gambling during this time?
1. Yes
2. No > skip to demographics Q17
Q16b: How many other people affected you, due to their gambling, during this time?
ENTER NUMBER 1>
Q16c: What was your relationship with the person/people who affected you due to their
gambling?
1. Spouse, de facto or romantic partner
2. Close friend
3. Parent
4. Sibling
5. Child
6. Family member
7. Co-worker/colleague
8. Other, please specify
GROUP A: Proceed to demographics

The social cost of gambling to Victoria Browne et al.
Victorian Responsible Gambling Foundation Page 134
Group B – Non-gamblers
Q1a: Have you had a close relationship* with a person whose gambling has caused
problems in your life, no matter how minor?
*When we talk about a close relationship we are referring to a personal relationship with someone
that you care about and have regular communication with.
1. Yes
2. No
If answer = 2 respondent is not eligible to complete the survey
Q1b: How would you describe your relationship with this person? If there is more than one
person, think about the person with gambling problems whom you are closest to.
1. Person is/was my spouse, de facto or romantic partner
2. Person is/was my close friend
3. Person is my parent
4. Person is my sibling
5. Person is my child
6. Person is other close family member
7. Person is a close co-worker/colleague
8. Other, please specify
Section 1: Gambling experiences of others
The next few questions will ask you to reflect on the time when this person’s gambling caused
them the most problems. We’d like you to think about the approximate 12 month period around
this time.
Q2: Approximately how long ago was this period of time?
Less than 1 year ago
Enter number of years 1–65
Q3a: Thinking about this 12 month period, what form of gambling was this person betting
the most money on?
1. Electronic gambling machine (Pokies, Slot Machine, Fruit Machine or VLTs)
2. Sports betting
3. Race betting
4. Poker
5. Casino table games (not including Poker)
6. Keno
7. Lottery tickets
8. Other (please specify)
9. Don’t know

The social cost of gambling to Victoria Browne et al.
Victorian Responsible Gambling Foundation Page 135
Q3b. To the best of your knowledge, how and where did they most often bet on this form of
gambling?
1. Mobile phone
2. Tablet/iPad
3. Computer/laptop
4. Casino
5. Pub/hotel
6. RSL club
7. Sports club/bar
8. Betting shop (e.g., TAB or newsagent )
9. Other (please specify)
10. Don’t know
Q4: For the next few questions please continue to reflect on the 12 month period in which
the person’s gambling was causing the most problems.
1. At this time, did you feel that the person bet more than they could really afford to lose?
2. At this time, did you feel that the person needed to gamble with larger amounts of money
get the same feeling of excitement?
3. At this time, when the person gambled, did they sometimes go back another day to try to
win back the money they lost?
4. At this time, did the person borrow money or sell anything to get money to gamble?
5. At this time, did the person ever suggest that they might have a problem with gambling?
6. At this time, did gambling cause the person any health problems, including stress or
anxiety?
7. At this time, did people criticize the person’s betting or tell them that they had a gambling
problem, regardless of whether or not they thought it was true?
8. At this time, did the person’s gambling cause any financial problems for them or their
household?
9. At this time, did the person feel guilty about the way they gambled or what happens when
they gamble?
Response options
0. Never
1. Sometimes
2. Most of the time
3. Almost always
4. Don’t know

The social cost of gambling to Victoria Browne et al.
Victorian Responsible Gambling Foundation Page 136
Q4b: To the best of your knowledge, how often did the person gamble at this time?
1. Monthly or less
2. 2 to 4 times a month
3. 2 to 3 times a week
4. 4 to 5 times a week
5. 6 or more times a week
6. Don’t know
Q4c: To the best of your knowledge, how much time did the person spend gambling on a
typical day in which they gambled at this time?
1. Less than 30 minutes
2. More than 30 min but less than 1 hour
3. More than 1 hours but less than 2 hours
4. More than 2 hours but less than 3 hours
5. More than 3 hours
6. Don’t know
Q4d: To the best of your knowledge, how often did the person spend more than 2 hours
gambling (on a single occasion) at this time?
1. Never
2. Less than monthly
3. Monthly
4. Weekly
5. Daily or almost daily
6. Don’t know
Section 2: Financial impact
Please continue to consider the 12 month period of time that you nominated above, when this
person’s gambling was causing the most problems. We would like you to think about how their
gambling may have impacted upon your finances during this time.
Q5a: Please review the following list and indicate whether you experienced any of these
issues as a result of this person’s gambling during this time.
1. Reduction of my savings
2. Reduction of my available spending money
3. Increased credit card debt
4. Sold personal items
5. Took on additional employment
6. Late payments on bills (e.g. utilities, rates)
7. Less spending on recreational expenses such as eating out, going to movies or other
entertainment.

The social cost of gambling to Victoria Browne et al.
Victorian Responsible Gambling Foundation Page 137
8. Less spending on beneficial expenses such as insurances, education, car and home
maintenance
9. Less spending on essential expenses such as medications, healthcare and food
10. I did not experience any of these issues as a result of this person’s gambling
Remember, for these questions we want you to think about the impact that the person’s gambling
had on YOU, not how it might have impacted them.
Q5b: During this time, did this person’s gambling contribute to or cause you to experience
any of the following situations?
1. Needed assistance from welfare organisations (foodbanks or emergency bill payments)
2. Loss of supply of utilities (electricity, gas, etc.)
3. Loss of significant assets (e.g. car, home, business, superannuation)
4. Bankruptcy
5. Needed emergency or temporary accommodation
6. I did not experience any of these issues as a result of this person’s gambling
Q5c: Overall, what level of impact did the person’s gambling have upon your financial
security during this time?
1. No impact
2. Minor impact
3. Moderate impact
4. Major impact
Section 3: Impact to relationships
Please continue to consider the 12 month period of time when this person’s gambling was causing
the most problems. We would like you to think about how their gambling may have impacted upon
your health during this time.
Q6a: Please review the following list and indicate whether you experienced any of these
issues as a result of this person’s gambling during this time.
1. Spent less time with people I care about
2. Got less enjoyment from time spent with people I care about
3. Neglected my relationship responsibilities
4. Spent less time attending social events (non gambling related)
5. Experienced greater tension in my relationships (suspicion, lying, resentment, etc)
6. Experienced greater conflict in my relationships (arguing, fighting, ultimatums)
7. Felt belittled in my relationships
8. I did not experience any of these issues as a result of this person’s gambling

The social cost of gambling to Victoria Browne et al.
Victorian Responsible Gambling Foundation Page 138
Q6b: During this time, did this person’s gambling contribute to or cause you to experience
any of the following situations?
1. Threat of separation or ending a relationship/s
2. Actual separation or ending a relationship/s
3. Social isolation (felt excluded or shut-off from others)
4. I did not experience any of these issues as a result of this person’s gambling
Q6c: Overall, what level of impact did this person’s gambling have upon your personal
relationships (family, friends, spouse, partner, etc) during this time?
1. No impact
2. Minor impact
3. Moderate impact
4. Major impact
Section 4: Emotional or psychological impact
Please continue to consider the 12 month period when this person’s gambling was causing the
most problems. We would like you to think about how their gambling may have impacted upon
your emotional or psychological wellbeing during this time.
Q7a: Please review the following list and indicate whether you have experienced any of
these issues as a result of this person’s gambling during this time.
1. Felt distressed about their gambling
2. Felt ashamed of their gambling
3. Felt like a failure
4. Felt insecure or vulnerable
5. Felt angry about not controlling their gambling
6. Felt worthless
7. I did not experience any of these issues as a result of this person’s gambling
Q7b: During this time, did this person’s gambling contribute to or cause you to experience
any of the following situations?
1. Feelings of hopelessness about their gambling
2. Feelings of extreme distress
3. Thoughts of running away or escape
4. I did not experience any of these issues as a result of this person’s gambling
Q7c: Overall, what level of impact did this person’s gambling have upon your emotional or
psychological wellbeing during this time?
1. No impact
2. Minor impact
3. Moderate impact
4. Major impact

The social cost of gambling to Victoria Browne et al.
Victorian Responsible Gambling Foundation Page 139
Section 5: Health impacts
Please continue to consider the 12 month period of time when this person’s gambling was causing
the most problems. We would like you to think about how their gambling may have impacted upon
your health during this time.
Q8a: Please review the following list and indicate whether you have experienced any of
these issues as a result of this person’s gambling during this time.
1. Reduced physical activity due to their gambling
2. Stress related health problems (e.g. high blood pressure, headaches)
3. Loss of sleep due to spending time with the person gambling
4. Loss of sleep due to stress or worry about their gambling or gambling-related problems
5. Neglected my hygiene and self-care
6. Neglected my medical needs (including taking prescribed medications)
7. Didn’t eat as much or often as I should
8. Ate too much
9. Increased my use of tobacco
10. Increased my consumption of alcohol
11. Increased experience of depression
12. Increased use of health services due to health issues caused or exacerbated by their
gambling
13. Committed acts of self harm
14. I did not experience any of these issues as a result of this person’s gambling
Q8b: During this time, did this person’s gambling contribute to or cause you to experience
any of the following situations?
1. Unhygienic living conditions (living rough, neglected or unclean housing, etc)
2. Required emergency medical treatment for health issues caused or exacerbated by their
gambling
3. Attempted suicide
4. I did not experience any of these issues as a result of this person’s gambling
Q8c: Overall, what level of impact did this person’s gambling have upon your physical or
mental health during this time?
1. No impact
2. Minor impact
3. Moderate impact
4. Major impact
Q8d: During this time, how much sleep did you typically get on a week night or work night?
ENTER NUMBER OF HOURS

The social cost of gambling to Victoria Browne et al.
Victorian Responsible Gambling Foundation Page 140
Q8e: During this time how much sleep did you typically get on a weekend or non-work
night?
ENTER NUMBER OF HOURS
Section 6: Work or study impacts
Please continue to consider the 12 month period of time when this person’s gambling was causing
the most problems. We would like you to think about how your gambling may have impacted upon
your work or study performance during this time.
Q9a: Please review the following list and indicate whether you have experienced any of
these issues as a result of this person’s gambling during this time.
1. Reduced performance at work or study (i.e. due to tiredness or distraction)
2. Was late for work or study
3. Was absent from work or study
4. Hindered my job-seeking efforts
5. Used my work or study time to attend to issues caused by their gambling
6. Used my work or study resources to assist with matters arising from their gambling
7. Lack of progression in my job or study
8. Conflict with my colleagues
9. I did not experience any of these issues as a result of this person’s gambling
Q9b: During this time, did this person’s gambling contribute to or cause you to experience
any of the following situations?
1. Lost my job
2. Excluded from study
3. I did not experience any of these issues as a result of this person’s gambling
Q9c: Overall, what level of impact did this person’s gambling have upon your work or study
performance during this time?
1. No impact
2. Minor impact
3. Moderate impact
4. Major impact

The social cost of gambling to Victoria Browne et al.
Victorian Responsible Gambling Foundation Page 141
Section 7: Other problems
Please continue to consider the 12 month period of time when this person’s gambling was causing
the most problems. We would like you to think about how their gambling may have impacted upon
other areas of your life during this time.
Q10a: Please review the following list and indicate whether you have experienced any of
these issues as a result of this person’s gambling during this time.
1. Left children unsupervised
2. Didn’t fully attend to needs of children
3. Took money or items from friends or family without asking first
4. Promised to pay back money without genuinely intending to do so
5. Arrested for unsafe driving
6. Reduced my contribution to religious or cultural practices
7. Felt less connected to my religious or cultural community
8. Felt that my family name had been shamed within my religious or cultural community
9. I have not experienced any of these issues as a result of this person’s gambling
Q10b: During this time, did the person’s gambling contribute to or cause you to experience
any of the following situations?
1. Petty theft or dishonesty in respect to government, businesses or other people (not
family/friends)
2. Felt compelled or forced to commit a crime or steal to fund their gambling or pay debts
3. Outcast from religious or cultural community due to their involvement with gambling
4. Had experiences with violence (include family/domestic violence)
5. I did not experience any of these issues as a result of this person’s gambling
Q10c: Overall, what level of other impacts did this person’s gambling have upon you during
this time?
1. No impact
2. Minor impact
3. Moderate impact
4. Major impact
Q11: Did you experience any other negative impacts or harms during this time as a result of
this person’s gambling that we haven’t mentioned. Please comment below.
Q12: Thinking about this time in your life, did you usually see a solution to problems and
difficulties that other people find hopeless?
1. Yes, usually
2. Yes, sometimes
3. No
The social cost of gambling to Victoria Browne et al.
Victorian Responsible Gambling Foundation Page 142
Q13: Thinking about this time in your life, did you feel that your daily life was a source of
personal satisfaction?
1. Yes, usually
2. Yes, sometimes
3. No
Q14: Thinking about this time in your life, did you usually feel that the things that happen to
you in your daily life were hard to understand?
1. Yes, usually
2. Yes, sometimes
3. No
Section 8: Impact to others
Q15a: Considering all the issues raised earlier, how many other people would you estimate
were affected by this person’s gambling during this period of time?
ENTER NUMBER 0>
Q15b: And how many of these people would you estimate were affected by this person’s
gambling AS MUCH as you were or more, during this period of time?
ENTER NUMBER 0>
Q15c: What was the relationship to the gambler of the other person/people affected?
1. Spouse, de facto or romantic partner
2. Close friend
3. Parent
4. Sibling
5. Child
6. Family member
7. Co-worker/colleague
8. Other, please specify
Q16a: Still thinking about the same period of time, were you affected by anybody else’s
gambling during this time?
1. Yes
2. No > skip to demographics Q17
Q16b: How many other people affected you, due to their gambling, during this time?
ENTER NUMBER 1>
Q16c: What was your relationship with the other person/people who affected you due to
their gambling?
1. Spouse, de facto or romantic partner
2. Close friend
3. Parent

The social cost of gambling to Victoria Browne et al.
Victorian Responsible Gambling Foundation Page 143
4. Sibling
5. Child
6. Family member
7. Co-worker/colleague
8. Other, please specify
Group A and Group B
Section 9: Demographics
We will end the survey with a few general questions about you.
Q17: What is your gender?
1. Male
2. Female
Q18: In what year were you born?
Q19: What is your present marital status?
1. Single (never married)
2. Widowed
3. Divorced/Separated
4. Married
5. De facto
6. Other (please specify)
Q20: In which country were you born?
1 Australia
2 Other (please specify)
Q21: Do you identify yourself as Aboriginal and/or Torres Strait Islander?
1 Yes
2 No
Q22: What is the highest level of education you have completed?
1. No schooling
2. Year 8/equivalent or below
3. Year 9/equivalent
4. Year 10/equivalent
5. Year 11/equivalent
6. Year 12/equivalent
7. Technical studies, Trade Certificate, etc

The social cost of gambling to Victoria Browne et al.
Victorian Responsible Gambling Foundation Page 144
8. Tertiary studies, Diploma, Advanced Diploma
9. Tertiary studies, Bachelor degree
10. Tertiary studies, Graduate Diploma, Diploma
11. Tertiary studies, Postgraduate including Masters, PhD
12. Other (please specify)
Q23: What is your current MAIN employment status?
1. Employed full-time (typically more than 35 hours per week)
2. Employed part-time
3. Employed casual
4. Self-employed (full-time equivalent)
5. Self-employed (part-time equivalent)
6. Self-employed (casual equivalent)
7. Unemployed
8. Home duties
9. Student
10. Retired
11. Pensioner
12. Other (please specify)
Q24: What is your approximate personal income level? Not including the income of a
spouse, partner or family member (include income from all sources before taxes and any
spending).
1. Negative/Nil income
2. $1–$199 weekly ($1–$10,399 per year)
3. $200–$299 weekly ($10,400–$15,599 per year)
4. $300–$399 weekly ($15,600–$20,799 per year)
5. $400–$599 weekly ($20,800–$31,199 per year)
6. $600–$799 weekly ($31,200–$41,599 per year)
7. $800–$999 weekly ($41,600–$51,999 per year)
8. $1,000–$1,249 weekly ($52,000–$64,999 per year)
9. $1,250–$1,499 weekly ($65,000–$77,999 per year)
10. $1,500–$1,999 weekly ($78,000–$103,999 per year)
11. $2,000–$2,499 weekly ($104,000–$129,999 per year)
12. $2,500–$2,999 weekly ($130,000–$155,999 per year)
13. $3,000–$3,499 weekly ($156,000–$181,999 per year)
14. $3,500–$3,999 weekly ($182,000–$207,999 per year)
15. $4,000–$4,999 weekly ($208,000–$259,999 per year)

The social cost of gambling to Victoria Browne et al.
Victorian Responsible Gambling Foundation Page 145
16. $5,000 or more weekly ($260,000 or more per year)
17. I’m unsure/I’d rather not say
Q25: What is the total income level of ALL people living in your household? Including any
other household member (include income from all sources before taxes and any spending).
As above
Q26: Do you currently live in an urban area (major city), a regional town/city or a rural area?
1. Urban
2. Regional town or city
3. Rural
Q27: Please enter the postcode of your current usual place of residence.
That brings us to the end of the survey. Thank for you taking the time to participate. If you would
like to add any comments please do so below.
If you are experiencing discomfort you can contact Gambler’s Help on 1800 858 858 or
www.gamblinghelponline.org.au. These are free and confidential telephone/online help services
that operate 24 hours a day, 7 days a week.

See Inside gambling for the latest information, evidence and expert opinion on gambling issues
in Australia and overseas.
From betting on the races with Dad to professional punter: my journey
Teenage gambling: a business that’s only getting riskier
Helping people in their own language
Five minutes with...
Community educator, David Clark
Online magazine
insidegambling.com.au
Hear from:• public health experts • gambling sector professionals • people with firsthand experience
of gambling problems
Let us know what you’d like to read
If you have ideas for themes or stories for Inside gambling, we would love to hear from you.
Go to: insidegambling.com.au/contact-us
Subscribe to Inside gambling

responsiblegambling.vic.gov.au
CONNECT WITH US ON:vicrgf
responsiblegambling
Victorian Responsible Gambling Foundation
ResponsibleGambling
The social cost of gambling to Victoria
RESEARCH REPORT
November 2017