the social foundations of world happiness · the social foundations of world happiness the authors...
TRANSCRIPT
8
JOHN F. HELLIWELL, HAIFANG HUANG AND SHUN WANG
Chapter 2
THE SOCIAL FOUNDATIONS OF WORLD HAPPINESS
The authors are grateful to the Canadian Institute for Advanced Research, the KDI School, and the Ernesto Illy Foundation for research support, and to Gallup for data access and assistance. The authors are also grateful for helpful advice and comments from Jan-Emmanuel De Neve, Ed Diener, Curtis Eaton, Carrie Exton, Paul Fritjers, Dan Gilbert, Leonard Goff, Carol Gra-ham, Shawn Grover, Jon Hall, Richard Layard, Guy Mayraz, Bo Rothstein and Meik Wiking.
W O R L D H A P P I N E S S R E P O R T 2 0 1 7
9
Introduction
It is now five years since the publication of the first World Happiness Report in 2012. Its central purpose was to survey the science of measuring and understanding subjective well-being. Subse-quent World Happiness Reports updated and extended this background. To make this year’s World Happiness Report more useful to those who are coming fresh to the series, we repeat enough of the core analysis in this chapter to make it understandable. We also go beyond previous reports in exploring more deeply the social foundations of happiness.
Our analysis of the levels, changes, and determi-nants of happiness among and within nations continues to be based chiefly on individual life evaluations, roughly 1,000 per year in each of more than 150 countries, as measured by an-swers to the Cantril ladder question: “Please imagine a ladder, with steps numbered from 0 at the bottom to 10 at the top. The top of the ladder represents the best possible life for you and the bottom of the ladder represents the worst possible life for you. On which step of the ladder would you say you personally feel you stand at this time?”1 We will, as usual, present the average life evaluation scores for each country, based on averages from surveys cover-ing the most recent three-year period, in this report including 2014-2016.
This will be followed, as in earlier editions, by our latest attempts to show how six key variables contribute to explaining the full sample of nation-al annual average scores over the whole period 2005-2016. These variables include GDP per capita, social support, healthy life expectancy, social freedom, generosity, and absence of corrup-tion. Note that we do not construct our happiness measure in each country using these six factors—rather we exploit them to explain the variation of happiness across countries. We shall also show how measures of experienced well-being, espe-cially positive emotions, add to life circumstances in explaining higher life evaluations.
We shall then turn to consider how different aspects of the social context affect the levels and distribution of life evaluations among individu-als within and among countries. Previous World Happiness Reports have shown that of the inter-national variation in life evaluations explainable by the six key variables, about half comes from GDP per capita and healthy life expectancy, with the rest flowing from four variables reflecting different aspects of the social context. In World Happiness Report 2017 we dig deeper into these social foundations, and explore in more detail the different ways in which social factors can explain differences among individuals and nations in how highly they rate their lives. We shall consider here not just the four factors that measure different aspects of the social context, but also how the social context influences the other two key variables—real per capita incomes and healthy life expectancy.
This chapter begins with an updated review of how and why we use life evaluations as our central measure of subjective well-being within and among nations. We then present data for average levels of life evaluations within and among countries and global regions. This will be followed by our latest efforts to explain the differences in national average evaluations, across countries and over time. This is followed by a presentation of the latest data on changes between 2005-2007 and 2014-2016 in average national life evaluations. Finally, we turn to our more detailed consideration of the social foundations of world happiness, followed by a concluding summary of our latest evidence and its implications.
10
Measuring and Understanding Happiness
Chapter 2 of the first World Happiness Report explained the strides that had been made during the preceding three decades, mainly within psychology, in the development and validation of a variety of measures of subjective well-being. Progress since then has moved faster, as the number of scientific papers on the topic has continued to grow rapidly,2 and as the measure-ment of subjective well-being has been taken up by more national and international statistical agencies, guided by technical advice from experts in the field.
By the time of the first report, there was already a clear distinction to be made among three main classes of subjective measures: life evaluations, positive emotional experiences (positive affect), and negative emotional experiences (negative
affect) (see Technical Box 1). The Organization for Economic Co-operation and Development (OECD) subsequently released Guidelines on Measuring Subjective Well-being,3 which included both short and longer recommended modules of subjective well-being questions.4 The center-piece of the OECD short module was a life evaluation question, asking respondents to assess their satisfaction with their current lives on a 0 to 10 scale. This was to be accompanied by two or three affect questions and a question about the extent to which the respondents felt they had a purpose or meaning in their lives. The latter question, which we treat as an import-ant support for subjective well-being, rather than a direct measure of it, is of a type that has come to be called “eudaimonic,” in honor of Aristotle, who believed that having such a purpose would be central to any reflective individual’s assess-ment of the quality of his or her own life.5
Technical Box 1: Measuring Subjective Well-Being
The OECD (2013, p.10) Guidelines on Measuring of Subjective Well-being define and recommend the following measures of subjective well-being:
“Good mental states, including all of the various evaluations, positive and negative, that people make of their lives and the affective reactions of people to their experiences.
… This definition of subjective well-being hence encompasses three elements: 1. Life evaluation—a reflective assessment on a
person’s life or some specific aspect of it. 2. Affect—a person’s feelings or emotional
states, typically measured with reference to a particular point in time.
3. Eudaimonia—a sense of meaning and purpose in life, or good psychological functioning.”
Almost all OECD countries6 now contain a life evaluation question, usually about life satisfac-tion, on a 0 to 10 rating scale, in one or more of their surveys. However, it will be many years be-fore the accumulated efforts of national statisti-cal offices will produce as large a number of comparable country surveys as is now available through the Gallup World Poll (GWP), which has been surveying an increasing number of countries since 2005 and now includes almost all of the world’s population. The GWP contains one life evaluation as well as a range of positive and negative experiential questions, including several measures of positive and negative affect, mainly asked with respect to the previous day. In this chapter, we make primary use of the life evaluations, since they are, as shown in Table 2.1, more international in their variation and more readily explained by life circumstances.
W O R L D H A P P I N E S S R E P O R T 2 0 1 7
11
Analysis over the past ten years has clarified what can be learned from different measures of subjective well-being.7 What are the main messages? First, all three of the commonly used life evaluations (specifically Cantril ladder, satisfaction with life, and happiness with life in general) tell almost identical stories about the nature and relative importance of the various factors influencing subjective well-being. For example, for several years it was thought (and is still sometimes reported in the literature) hat respondents’ answers to the Cantril ladder question, with its use of a ladder as a framing device, were more dependent on their incomes than were answers to questions about satisfac-tion with life. The evidence for this came from comparing modeling using the Cantril ladder in the Gallup World Poll (GWP) with modeling based on life satisfaction answers in the World Values Survey (WVS). But this conclusion was due to combining survey and method differenc-es with the effects of question wording. When it subsequently became possible to ask both questions8 of the same respondents on the same scales, as was the case in the Gallup World Poll in 2007, it was shown that the estimated income effects and almost all other structural influences were identical, and a more powerful explanation was obtained by using an average of the two answers.9
People also worried at one time that when questions included the word “happiness” they elicited answers that were less dependent on income than were answers to life satisfaction questions or the Cantril ladder.10 For this im-portant question, no definitive answer was available until the European Social Survey (ESS) asked the same respondents “satisfaction with life” and “happy with life” questions, wisely using the same 0 to 10 response scales. The answers showed that income and other key variables all have the same effects on the “happy with life” answers as on the “satisfied with life” answers, so much so that once again more powerful explanations come from averaging the two answers.
A related strand of literature, based on GWP data, compared happiness yesterday, which is an experiential/emotional response, with the Cantril ladder, which is equally clearly an evalua-tive measure. In this context, the finding that income has more purchase on life evaluations than on emotions seems to have general applica-bility, and stands as an established result.11
Another previously common view was that changes in life evaluations at the individual level were largely transitory, returning to their base-line as people rapidly adapt to their circumstanc-es. This view has been rejected by four indepen-dent lines of evidence. First, average life evaluations differ significantly and systematical-ly among countries, and these differences are substantially explained by life circumstances. This implies that rapid and complete adaptation to different life circumstances does not take place. Second, there is evidence of long-standing trends in the life evaluations of sub-populations within the same country, further demonstrating that life evaluations can be changed within policy-relevant time scales.12 Third, even though individual-level partial adaptation to major life events is a normal human response, there is very strong evidence of continuing influence on well-being from major disabilities and unem-ployment, among other life events.13 The case of marriage has been subject to some debate. Some results using panel data from the UK suggested that people return to baseline levels of life satisfaction several years after marriage, a finding that has been argued to support the more general applicability of set points.14 How-ever, subsequent research using the same data has shown that marriage does indeed have long-lasting well-being benefits, especially in protecting the married from as large a decline in the middle-age years that in many countries represent a low-point in life evaluations.15 Fourth, and especially relevant in the global context, are studies of migration showing mi-grants to have average levels and distributions of life evaluations that resemble those of other residents of their new countries more than of
12
comparable residents in the countries from which they have emigrated.16 This confirms that life evaluations do depend on life circumstances, and are not destined to return to baseline levels as required by the set point hypothesis.
Why Use Life Evaluations for International Comparisons of the Quality of Life?
We continue to find that experiential and evalua-tive measures differ from each other in ways that help to understand and validate both, and that life evaluations provide the most informa-tive measures for international comparisons because they capture the overall quality of life as a whole in a more complete and stable way than do emotional reports based on daily experiences.
For example, experiential reports about happi-ness yesterday are well explained by events of the day being asked about, while life evaluations more closely reflect the circumstances of life as a whole. Most Americans sampled daily in the Gallup-Healthways Well-Being Index Survey feel happier on weekends, to an extent that depends on the social context on and off the job. The weekend effect disappears for those employed in a high trust workplace, who regard their superi-or more as a partner than a boss, and maintain their social life during weekdays.17
By contrast, life evaluations by the same respon-dents in that same survey show no weekend effects.18 This means that when they are answer-ing the evaluative question about life as a whole, people see through the day-to-day and hour-to-hour fluctuations, so that the answers they give on weekdays and weekends do not differ.
On the other hand, although life evaluations do not vary by the day of week, they are much more responsive than emotional reports to differences in life circumstances. This is true whether the comparison is among national averages19 or among individuals.20
Furthermore, life evaluations vary more between countries than do emotions. Thus almost one-quarter of the global variation in life evalua-tions is among countries, compared to three-quarters among individuals in the same country. This one-quarter share for life evalua-tions is far higher than for either positive affect (7 percent) or negative affect (4 percent). This difference is partly due to the role of income, which plays a stronger role in life evaluations than in emotions, and is also more unequally spread among countries than are life evalua-tions, emotions, or any of the other variables used to explain them. For example, more than 40 percent of the global variation among house-hold incomes is among nations rather than among individuals within nations.21
These twin facts—that life evaluations vary much more than do emotions across countries, and that these life evaluations are much more fully explained by life circumstances than are emotional reports– provide for us a sufficient reason for using life evaluations as our central measure for making international compari-sons.22 But there is more. To give a central role to life evaluations does not mean we must either ignore or downplay the important information provided by experiential measures. On the contrary, we see every reason to keep experien-tial measures of well-being, as well as measures of life purpose, as important elements in our attempts to measure and understand subjective well-being. This is easy to achieve, at least in principle, because our evidence continues to suggest that experienced well-being and a sense of life purpose are both important influences on life evaluations, above and beyond the critical role of life circumstances. We provide direct evidence of this, and especially of the impor-tance of positive emotions, in Table 2.1. Further-more, in Chapter 3 of World Happiness Report 2015 we gave experiential reports a central role in our analysis of variations of subjective well-be-ing across genders, age groups, and global regions. Although we often found significant differences by gender and age, and that these
W O R L D H A P P I N E S S R E P O R T 2 0 1 7
13
patterns varied among the different measures, these differences were far smaller than the international differences in life evaluations.
We would also like to be able to compare in-equality measures for life evaluations with those for emotions, but this is unfortunately not currently possible as the Gallup World Poll emotion questions all offer only yes and no responses. Thus we can know nothing about their distribution beyond the national average shares of yes and no answers. For life evalua-tions, however, there are 11 response categories, so we were able, in World Happiness Report 2016 Update to contrast distribution shapes for each country and region, and see how these evolved with the passage of time.
Why do we use people’s actual life evaluations rather than some index of factors likely to influ-ence well-being? We have four main reasons:
First, we attach fundamental importance to the evaluations that people make of their own lives. This gives them a reality and power that no expert-constructed index could ever have. For a report that strives for objectivity, it is very import-ant that the rankings depend entirely on the basic data collected from population-based samples of individuals, and not at all on what we think might influence the quality of their lives. The average scores simply reflect what individual respondents report to the Gallup World Poll surveyors.
Second, the fact that life evaluations represent primary new knowledge about the value people attach to their lives means we can use the data as a basis for research designed to show what helps to support better lives. This is especially useful in helping us to discover the relative importance of different life circumstances, thereby making it easier to find and compare alternative ways to improve well-being.
Third, the fact that our data come from popula-tion-based samples in each country means that we can present confidence regions for our estimates, thus providing a way to see if the rankings are based on differences big enough to be statistically meaningful.
Fourth, all of the alternative indexes depend importantly, but to an unknown extent, on the index-makers’ opinions about what is important. This uncertainty makes it hard to treat such an index as an overall measure of well-being, since the index itself is just the sum of its parts, and not an independent measure of well-being.
We turn now to consider the population-weight-ed global and regional distributions of individual life evaluations, based on how respondents rate their lives. In the rest of this Chapter, the Cantril ladder is the primary measure of life evaluations used, and “happiness” and “subjective well-be-ing” are used interchangeably. All the global analysis on the levels or changes of subjective well-being refers only to life evaluations, specifi-cally, the Cantril ladder.
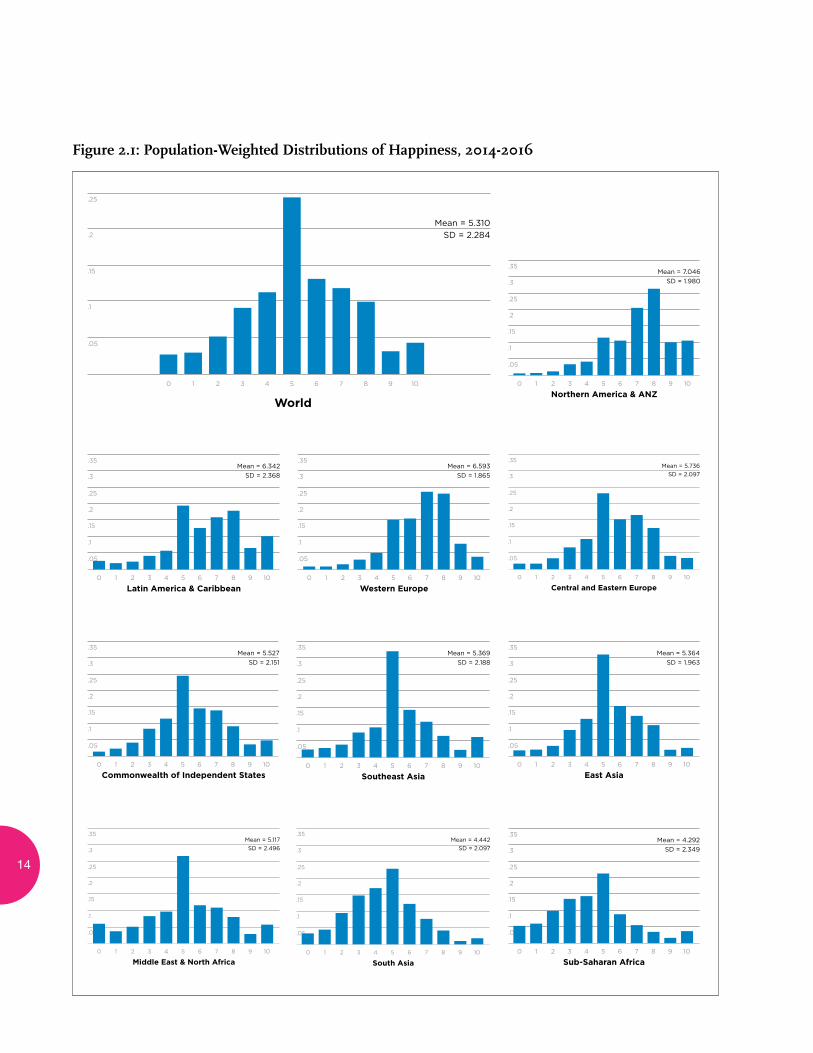
Life Evaluations Around the World
The various panels of Figure 2.1 contain bar charts showing for the world as a whole, and for each of 10 global regions23, the distribution of the 2014-2016 answers to the Cantril ladder question asking respondents to value their lives today on a 0 to 10 scale, with the worst possible life as a 0 and the best possible life as a 10.
14
Figure 2.1: Population-Weighted Distributions of Happiness, 2014-2016
.25
.1
.05
.3
.15
.35
.2
0 1 2 3 4 5 6 7 8 9 10
Mean = 6.342
SD = 2.368
Latin America & Caribbean
.25
.1
.05
.3
.15
.35
.2
0 1 2 3 4 5 6 7 8 9 10
Mean = 6.593
SD = 1.865
Western Europe
.25
.1
.05
.3
.15
.35
.2
0 1 2 3 4 5 6 7 8 9 10
Mean = 5.736
SD = 2.097
Central and Eastern Europe
.25
.1
.05
.3
.15
.35
.2
0 1 2 3 4 5 6 7 8 9 10
Mean = 5.527
SD = 2.151
Commonwealth of Independent States
.25
.1
.05
.3
.15
.35
.2
0 1 2 3 4 5 6 7 8 9 10
Mean = 5.369
SD = 2.188
Southeast Asia
.25
.1
.05
.3
.15
.35
.2
0 1 2 3 4 5 6 7 8 9 10
Mean = 5.364
SD = 1.963
East Asia
.25
.1
.05
.3
.15
.35
.2
0 1 2 3 4 5 6 7 8 9 10
Mean = 5.117
SD = 2.496
Middle East & North Africa
.25
.1
.05
.3
.15
.35
.2
0 1 2 3 4 5 6 7 8 9 10
Mean = 4.442
SD = 2.097
South Asia
.25
.1
.05
.3
.15
.35
.2
0 1 2 3 4 5 6 7 8 9 10
Mean = 4.292
SD = 2.349
Sub-Saharan Africa
.25
.1
.05
.3
.15
.35
.2
0 1 2 3 4 5 6 7 8 9 10
Mean = 7.046
SD = 1.980
Northern America & ANZ
.25
.15
0 1 2 3 4 5 6 7 8 9 10
.05
.2
.1
Mean = 5.310
SD = 2.284
World
W O R L D H A P P I N E S S R E P O R T 2 0 1 7
15
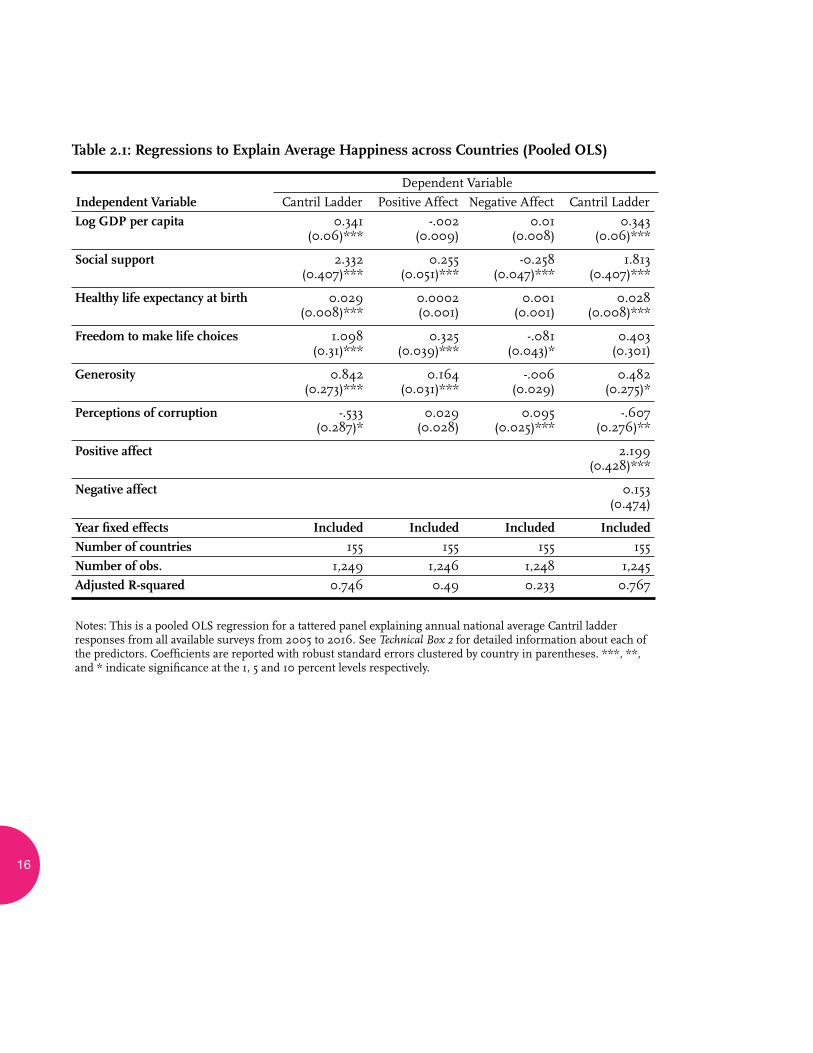
In Table 2.1 we present our latest modeling of national average life evaluations and measures of positive and negative affect (emotion) by country and year. For ease of comparison, the table has the same basic structure as Table 2.1 in the World Happiness Report Update 2016. The major difference comes from the inclusion of data for late 2015 and all of 2016, which increas-es by 131 (or about 12 percent) the number of country-year observations.24 The resulting changes to the estimated equation are very slight.25 There are four equations in Table 2.1. The first equation provides the basis for con-structing the sub-bars shown in Figure 2.2.
The results in the first column of Table 2.1 explain national average life evaluations in terms of six key variables: GDP per capita, social support, healthy life expectancy, freedom to make life choices, generosity, and freedom from corruption.26 Taken together, these six variables explain almost three-quarters of the variation in national annual average ladder scores among countries, using data from the years 2005 to 2016. The model’s predictive power is little changed if the year fixed effects in the model are removed, falling from 74.6% to 74.0% in terms of the adjusted R-squared.
The second and third columns of Table 2.1 use the same six variables to estimate equations for national averages of positive and negative affect, where both are based on averages for answers about yesterday’s emotional experiences. In general, the emotional measures, and especially negative emotions, are much less fully explained by the six variables than are life evaluations. Yet, the differences vary greatly from one circum-stance to another. Per capita income and healthy life expectancy have significant effects on life evaluations, but not, in these national average data, on either positive or negative affect. The situation changes when we consider social variables. Bearing in mind that positive and negative affect are measured on a 0 to 1 scale, while life evaluations are on a 0 to 10 scale, social support can be seen to have a similar
proportionate effect on positive and negative emotions as on life evaluations. Freedom and generosity have even larger influences on posi-tive affect than on the ladder. Negative affect is significantly reduced by social support, freedom, and absence of corruption.
In the fourth column we re-estimate the life evaluation equation from column 1, adding both positive and negative affect to partially implement the Aristotelian presumption that sustained positive emotions are important supports for a good life.27 The most striking feature is the extent to which the results but-tress a finding in psychology that the existence of positive emotions matters much more than the absence of negative ones. Positive affect has a large and highly significant impact in the final equation of Table 2.1, while negative affect has none.
As for the coefficients on the other variables in the final equation, the changes are material only on those variables—especially freedom and generosity—that have the largest impacts on positive affect. Thus we can infer first, that positive emotions play a strong role in support of life evaluations, and second, that most of the impact of freedom and generosity on life evalua-tions is mediated by their influence on positive emotions. That is, freedom and generosity have large impacts on positive affect, which in turn has a major impact on life evaluations. The Gallup World Poll does not have a widely avail-able measure of life purpose to test whether it too would play a strong role in support of high life evaluations. However, newly available data from the large samples of UK data does suggest that life purpose plays a strongly supportive role, independent of the roles of life circumstances and positive emotions.
16
Table 2.1: Regressions to Explain Average Happiness across Countries (Pooled OLS)
Notes: This is a pooled OLS regression for a tattered panel explaining annual national average Cantril ladder responses from all available surveys from 2005 to 2016. See Technical Box 2 for detailed information about each of the predictors. Coefficients are reported with robust standard errors clustered by country in parentheses. ***, **, and * indicate significance at the 1, 5 and 10 percent levels respectively.
Dependent Variable
Independent Variable Cantril Ladder Positive Affect Negative Affect Cantril Ladder
Log GDP per capita 0.341 -.002 0.01 0.343 (0.06)*** (0.009) (0.008) (0.06)***
Social support 2.332 0.255 -0.258 1.813 (0.407)*** (0.051)*** (0.047)*** (0.407)***
Healthy life expectancy at birth 0.029 0.0002 0.001 0.028 (0.008)*** (0.001) (0.001) (0.008)***
Freedom to make life choices 1.098 0.325 -.081 0.403 (0.31)*** (0.039)*** (0.043)* (0.301)
Generosity 0.842 0.164 -.006 0.482 (0.273)*** (0.031)*** (0.029) (0.275)*
Perceptions of corruption -.533 0.029 0.095 -.607 (0.287)* (0.028) (0.025)*** (0.276)**
Positive affect 2.199 (0.428)***
Negative affect 0.153 (0.474)
Year fixed effects Included Included Included Included
Number of countries 155 155 155 155
Number of obs. 1,249 1,246 1,248 1,245
Adjusted R-squared 0.746 0.49 0.233 0.767
W O R L D H A P P I N E S S R E P O R T 2 0 1 7
17
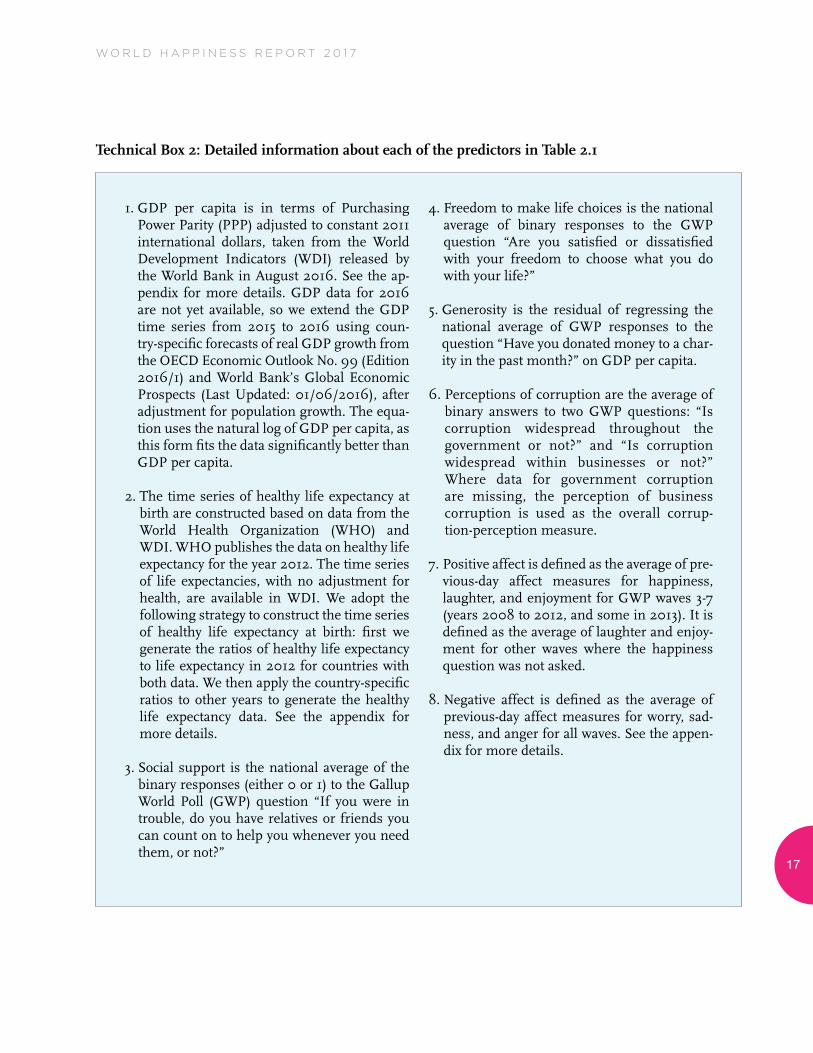
Technical Box 2: Detailed information about each of the predictors in Table 2.1
1. GDP per capita is in terms of Purchasing Power Parity (PPP) adjusted to constant 2011 international dollars, taken from the World Development Indicators (WDI) released by the World Bank in August 2016. See the ap-pendix for more details. GDP data for 2016 are not yet available, so we extend the GDP time series from 2015 to 2016 using coun-try-specific forecasts of real GDP growth from the OECD Economic Outlook No. 99 (Edition 2016/1) and World Bank’s Global Economic Prospects (Last Updated: 01/06/2016), after adjustment for population growth. The equa-tion uses the natural log of GDP per capita, as this form fits the data significantly better than GDP per capita.
2. The time series of healthy life expectancy at birth are constructed based on data from the World Health Organization (WHO) and WDI. WHO publishes the data on healthy life expectancy for the year 2012. The time series of life expectancies, with no adjustment for health, are available in WDI. We adopt the following strategy to construct the time series of healthy life expectancy at birth: first we generate the ratios of healthy life expectancy to life expectancy in 2012 for countries with both data. We then apply the country-specific ratios to other years to generate the healthy life expectancy data. See the appendix for more details.
3. Social support is the national average of the binary responses (either 0 or 1) to the Gallup World Poll (GWP) question “If you were in trouble, do you have relatives or friends you can count on to help you whenever you need them, or not?”
4. Freedom to make life choices is the national average of binary responses to the GWP question “Are you satisfied or dissatisfied with your freedom to choose what you do with your life?”
5. Generosity is the residual of regressing the national average of GWP responses to the question “Have you donated money to a char-ity in the past month?” on GDP per capita.
6. Perceptions of corruption are the average of binary answers to two GWP questions: “Is corruption widespread throughout the government or not?” and “Is corruption widespread within businesses or not?” Where data for government corruption are missing, the perception of business corruption is used as the overall corrup-tion-perception measure.
7. Positive affect is defined as the average of pre-vious-day affect measures for happiness, laughter, and enjoyment for GWP waves 3-7 (years 2008 to 2012, and some in 2013). It is defined as the average of laughter and enjoy-ment for other waves where the happiness question was not asked.
8. Negative affect is defined as the average of previous-day affect measures for worry, sad-ness, and anger for all waves. See the appen-dix for more details.
18
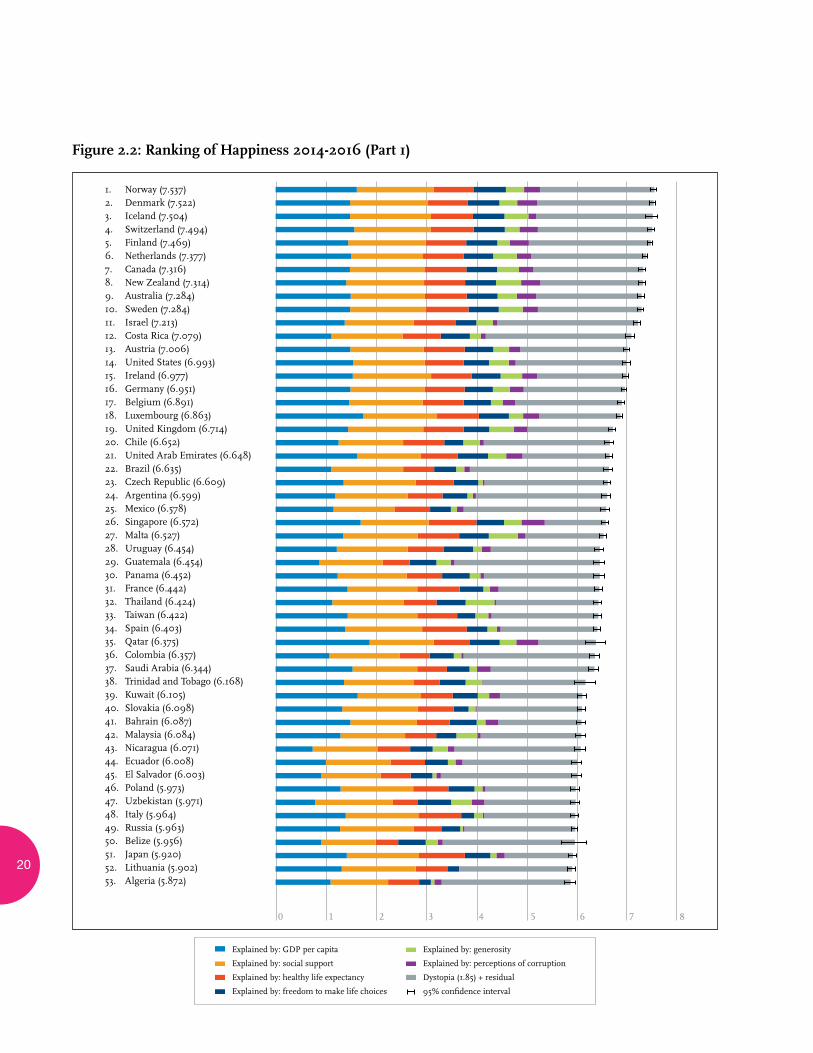
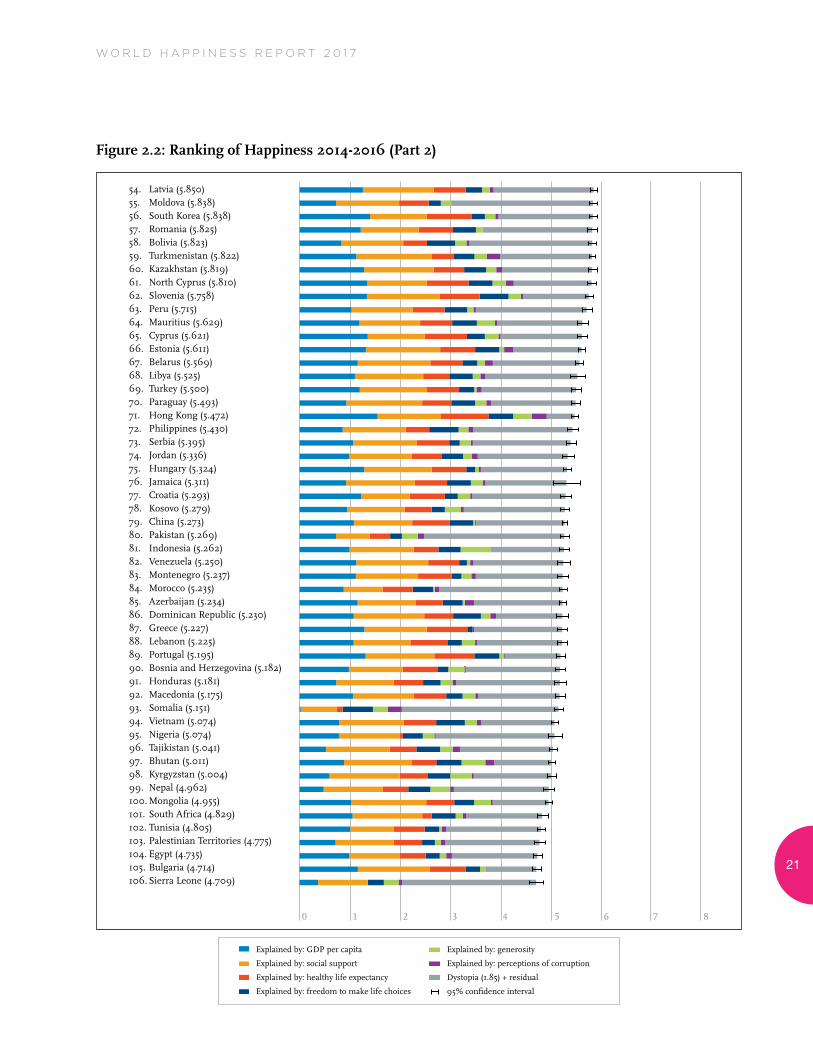
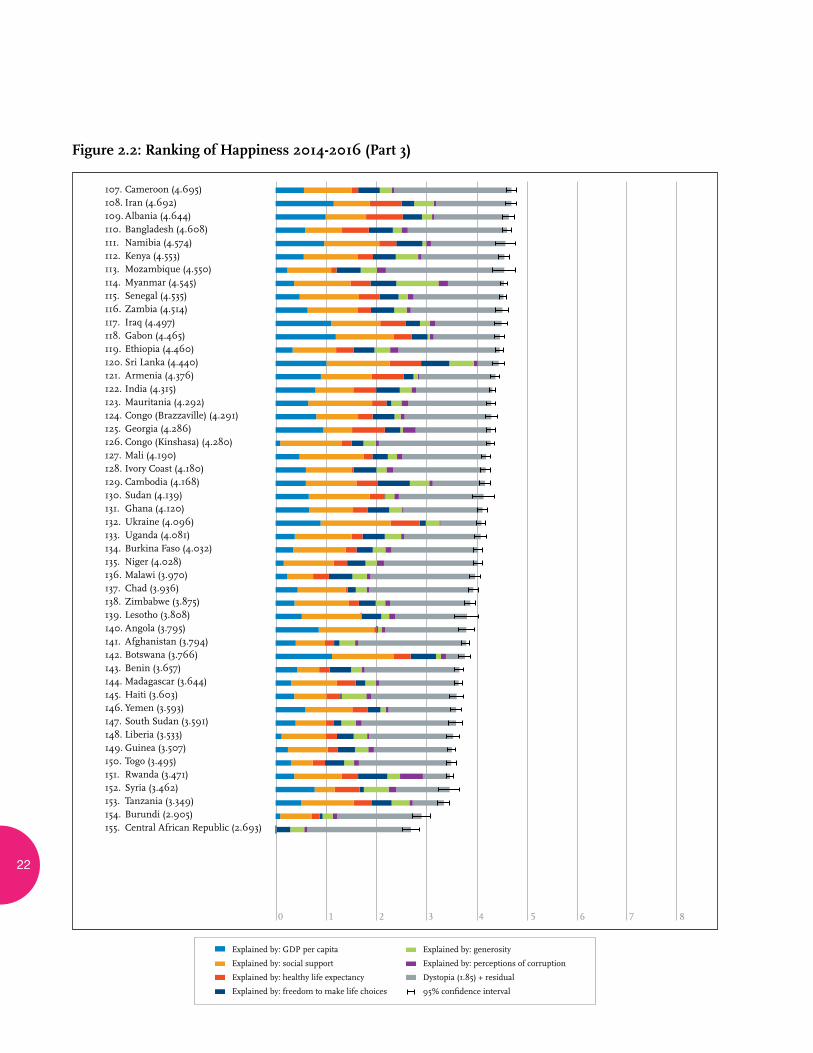
Ranking of Happiness by Country
Figure 2.2 (below) shows the average ladder score (the average answer to the Cantril ladder question, asking people to evaluate the quality of their current lives on a scale of 0 to 10) for each country, averaged over the years 2014-2016. Not every country has surveys in every year; the total sample sizes are reported in the statistical appendix, and they are reflected in Figure 2.2 by the horizontal lines showing the 95 percent confidence regions. The confidence regions are tighter for countries with larger samples. To increase the number of countries ranked, we also include one that had no 2014-2016 surveys, but did have one in 2013. This brings the num-ber of countries shown in Figure 2.2 to 155.
The length of each overall bar represents the average score, which is also shown in numerals. The rankings in Figure 2.2 depend only on the average Cantril ladder scores reported by the respondents.
Each of these bars is divided into seven seg-ments, showing our research efforts to find possible sources for the ladder levels. The first six sub-bars show how much each of the six key variables is calculated to contribute to that country’s ladder score, relative to that in a hypothetical country called Dystopia, so named because it has values equal to the world’s lowest national averages for 2014-2016 for each of the six key variables used in Table 2.1. We use Dystopia as a benchmark against which to compare each other country’s performance in terms of each of the six factors. This choice of benchmark permits every real country to have a non-negative contribution from each of the six factors. We calculate, based on estimates in Table 2.1, that Dystopia had a 2014-2016 ladder score equal to 1.85 on the 0 to 10 scale. The final sub-bar is the sum of two components: the calculated average 2014-2016 life evaluation in Dystopia (=1.85) and each country’s own predic-tion error, which measures the extent to which life evaluations are higher or lower than predicted
by our equation in the first column of Table 2.1. The residuals are as likely to be negative as positive.28
Returning to the six sub-bars showing the contribution of each factor to each country’s average life evaluation, it might help to show in more detail how this is done. Taking the exam-ple of healthy life expectancy, the sub-bar for this factor in the case of Mexico is equal to the amount by which healthy life expectancy in Mexico exceeds the world’s lowest value, multi-plied by the Table 2.1 coefficient for the influ-ence of healthy life expectancy on life evalua-tions. The width of these different sub-bars then shows, country-by-country, how much each of the six variables is estimated to contribute to explaining the international ladder differences. These calculations are illustrative rather than conclusive, for several reasons. First, the selec-tion of candidate variables is restricted by what is available for all these countries. Traditional variables like GDP per capita and healthy life expectancy are widely available. But measures of the quality of the social context, which have been shown in experiments and national surveys to have strong links to life evaluations, have not been sufficiently surveyed in the Gallup or other global polls, or otherwise measured in statistics available for all countries. Even with this limited choice, we find that four variables covering different aspects of the social and institutional context—having someone to count on, generosi-ty, freedom to make life choices and absence of corruption—are together responsible for more than half of the average difference between each country’s predicted ladder score and that in Dystopia in the 2014-2016 period. As shown in Table 18 of the Statistical Appendix, the average country has a 2014-2016 ladder score that is 3.5 points above the Dystopia ladder score of 1.85. Of the 3.5 points, the largest single part (34 percent) comes from social support, followed by GDP per capita (28 percent) and healthy life expectancy (16 percent), and then freedom (12 percent), generosity (7 percent), and corruption (4 percent).29
W O R L D H A P P I N E S S R E P O R T 2 0 1 7
19
Our limited choice means that the variables we use may be taking credit properly due to other better variables, or to un-measurable other factors. There are also likely to be vicious or virtuous circles, with two-way linkages among the variables. For example, there is much evi-dence that those who have happier lives are likely to live longer, be most trusting, be more cooperative, and be generally better able to meet life’s demands.30 This will feed back to improve health, GDP, generosity, corruption, and sense of freedom. Finally, some of the variables are derived from the same respondents as the life evaluations and hence possibly determined by common factors. This risk is less using national averages, because individual differences in personality and many life circumstances tend to average out at the national level.
To provide more assurance that our results are not seriously biased because we are using the same respondents to report life evaluations, social support, freedom, generosity, and corrup-tion, we have tested the robustness of our procedure this year (see Statistical Appendix for more detail). We did this by splitting each country’s respondents randomly into two groups, and using the average values for one group for social support, freedom, generosity, and absence of corruption in the equations to explain average life evaluations in the other half of the sample. The coefficients on each of the four variables fall, just as we would expect. But the changes are reassuringly small (ranging from 1% to 5%) and are far from being statisti-cally significant.31
The seventh and final segment is the sum of two components. The first component is a fixed number representing our calculation of the 2014-2016 ladder score for Dystopia (=1.85). The second component is the average 2014-2016 residual for each country. The sum of these two components comprises the right-hand sub-bar for each country; it varies from one country to the next because some countries have life evaluations above their predicted values, and
others lower. The residual simply represents that part of the national average ladder score that is not explained by our model; with the residual included, the sum of all the sub-bars adds up to the actual average life evaluations on which the rankings are based.
20
Figure 2.2: Ranking of Happiness 2014-2016 (Part 1)
1. Norway(7.537)2. Denmark(7.522)3. Iceland(7.504)4. Switzerland(7.494)5. Finland(7.469)6. Netherlands(7.377)7. Canada(7.316)8. NewZealand(7.314)9. Australia(7.284)10. Sweden(7.284)11. Israel(7.213)12. CostaRica(7.079)13. Austria(7.006)14. UnitedStates(6.993)15. Ireland(6.977)16. Germany(6.951)17. Belgium(6.891)18. Luxembourg(6.863)19. UnitedKingdom(6.714)20. Chile(6.652)21. UnitedArabEmirates(6.648)22. Brazil(6.635)23. CzechRepublic(6.609)24. Argentina(6.599)25. Mexico(6.578)26. Singapore(6.572)27. Malta(6.527)28. Uruguay(6.454)29. Guatemala(6.454)30. Panama(6.452)31. France(6.442)32. Thailand(6.424)33. Taiwan(6.422)34. Spain(6.403)35. Qatar(6.375)36. Colombia(6.357)37. SaudiArabia(6.344)38. TrinidadandTobago(6.168)39. Kuwait(6.105)40. Slovakia(6.098)41. Bahrain(6.087)42. Malaysia(6.084)43. Nicaragua(6.071)44. Ecuador(6.008)45. ElSalvador(6.003)46. Poland(5.973)47. Uzbekistan(5.971)48. Italy(5.964)49. Russia(5.963)50. Belize(5.956)51. Japan(5.920)52. Lithuania(5.902)53. Algeria(5.872)
0 1 2 3 4 5 6 7 8
Explained by: GDP per capita
Explained by: social support
Explained by: healthy life expectancy
Explained by: freedom to make life choices
Explained by: generosity
Explained by: perceptions of corruption
Dystopia (1.85) + residual
95% confidence interval
W O R L D H A P P I N E S S R E P O R T 2 0 1 7
21
Figure 2.2: Ranking of Happiness 2014-2016 (Part 2)
0 1 2 3 4 5 6 7 8
54. Latvia (5.850)55. Moldova (5.838)56. South Korea (5.838)57. Romania (5.825)58. Bolivia (5.823)59. Turkmenistan (5.822)60. Kazakhstan (5.819)61. North Cyprus (5.810)62. Slovenia (5.758)63. Peru (5.715)64. Mauritius (5.629)65. Cyprus (5.621)66. Estonia (5.611)67. Belarus (5.569)68. Libya (5.525)69. Turkey (5.500)70. Paraguay (5.493)71. Hong Kong (5.472)72. Philippines (5.430)73. Serbia (5.395)74. Jordan (5.336)75. Hungary (5.324)76. Jamaica (5.311)77. Croatia (5.293)78. Kosovo (5.279)79. China (5.273)80. Pakistan (5.269)81. Indonesia (5.262)82. Venezuela (5.250)83. Montenegro (5.237)84. Morocco (5.235)85. Azerbaijan (5.234)86. Dominican Republic (5.230)87. Greece (5.227)88. Lebanon (5.225)89. Portugal (5.195)90. Bosnia and Herzegovina (5.182)91. Honduras (5.181)92. Macedonia (5.175)93. Somalia (5.151)94. Vietnam (5.074)95. Nigeria (5.074)96. Tajikistan (5.041)97. Bhutan (5.011)98. Kyrgyzstan (5.004)99. Nepal (4.962)100. Mongolia (4.955)101. South Africa (4.829)102. Tunisia (4.805)103. Palestinian Territories (4.775)104. Egypt (4.735)105. Bulgaria (4.714)106. Sierra Leone (4.709)
Explained by: GDP per capita
Explained by: social support
Explained by: healthy life expectancy
Explained by: freedom to make life choices
Explained by: generosity
Explained by: perceptions of corruption
Dystopia (1.85) + residual
95% confidence interval
22
Figure 2.2: Ranking of Happiness 2014-2016 (Part 3)
Explained by: GDP per capita
Explained by: social support
Explained by: healthy life expectancy
Explained by: freedom to make life choices
Explained by: generosity
Explained by: perceptions of corruption
Dystopia (1.85) + residual
95% confidence interval
0 1 2 3 4 5 6 7 8
107. Cameroon (4.695)108. Iran (4.692)109. Albania (4.644)110. Bangladesh (4.608)111. Namibia (4.574)112. Kenya (4.553)113. Mozambique (4.550)114. Myanmar (4.545)115. Senegal (4.535)116. Zambia (4.514)117. Iraq (4.497)118. Gabon (4.465)119. Ethiopia (4.460)120. Sri Lanka (4.440)121. Armenia (4.376)122. India (4.315)123. Mauritania (4.292)124. Congo (Brazzaville) (4.291)125. Georgia (4.286)126. Congo (Kinshasa) (4.280)127. Mali (4.190)128. Ivory Coast (4.180)129. Cambodia (4.168)130. Sudan (4.139)131. Ghana (4.120)132. Ukraine (4.096)133. Uganda (4.081)134. Burkina Faso (4.032)135. Niger (4.028)136. Malawi (3.970)137. Chad (3.936)138. Zimbabwe (3.875)139. Lesotho (3.808)140. Angola (3.795)141. Afghanistan (3.794)142. Botswana (3.766)143. Benin (3.657)144. Madagascar (3.644)145. Haiti (3.603)146. Yemen (3.593)147. South Sudan (3.591)148. Liberia (3.533)149. Guinea (3.507)150. Togo (3.495)151. Rwanda (3.471)152. Syria (3.462)153. Tanzania (3.349)154. Burundi (2.905)155. Central African Republic (2.693)
W O R L D H A P P I N E S S R E P O R T 2 0 1 7
23
What do the latest data show for the 2014-2016 country rankings? Two features carry over from previous editions of the World Happiness Report. First, there is a lot of year-to-year consistency in the way people rate their lives in different countries. Thus there remains a four-point gap between the 10 top-ranked and the 10 bot-tom-ranked countries. The top 10 countries in Figure 2.2 are the same countries that were top-ranked in World Happiness Report 2016 Update, although there has been some swapping of places, as is to be expected among countries so closely grouped in average scores. The top four countries are the same ones that held the top four positions in World Happiness Report 2016 Update, with Norway moving up from 4th place to overtake Denmark at the top of the ranking. Denmark is now in 2nd place, while Iceland remains in 3rd, Switzerland is now 4th, and Finland remains in 5th position. Netherlands and Canada have traded places, with Nether-lands now 6th, and Canada 7th. The remaining three in the top ten have the same order as in the World Happiness Report 2016 Update, with New Zealand 8th, Australia 9th, and Sweden 10th. In Figure 2.2, the average ladder score differs only by 0.25 points between the top country and the 10th country, and only 0.043 between the 1st and 4th countries. The 10 countries with the lowest average life evaluations are somewhat different from those in 2016, part-ly due to some countries returning to the sur-veyed group—the Central African Republic, for example, and some quite large changes in average ladder scores, up for Togo and Afghani-stan, and down for Tanzania, South Sudan, and Yemen. Compared to the top 10 countries in the current ranking, there is a much bigger range of scores covered by the bottom 10 countries. Within this group, average scores differ by as much as 0.9 points, more than one-quarter of the average national score in the group. Tanza-nia and Rwanda have anomalous scores, in the sense that their predicted values, which are based on their performance on the six key variables, are high enough to rank them much higher than do the survey answers.
Despite the general consistency among the top countries scores, there have been many signifi-cant changes in the rest of the countries. Look-ing at changes over the longer term, many countries have exhibited substantial changes in average scores, and hence in country rankings, between 2005-2007 and 2014-2016, as shown later in more detail.
When looking at average ladder scores, it is also important to note the horizontal whisker lines at the right-hand end of the main bar for each country. These lines denote the 95 percent confidence regions for the estimates, so that countries with overlapping error bars have scores that do not significantly differ from each other. Thus it can be seen that the five top-ranked countries (Norway, Denmark, Iceland, Switzerland, and Finland) have overlapping confidence regions, and all have national aver-age ladder scores either above or just below 7.5. The remaining five of the top ten countries are closely grouped in a narrow range from 7.377 for Netherlands in 6th place, to 7.284 for Sweden in 10th place.
Average life evaluations in the top 10 countries are thus more than twice as high as in the bottom 10. If we use the first equation of Table 2.1 to look for possible reasons for these very different life evaluations, it suggests that of the 4 point difference, 3.25 points can be traced to differences in the six key factors: 1.15 points from the GDP per capita gap, 0.86 due to differences in social support, 0.57 to differences in healthy life expectancy, 0.33 to differences in freedom, 0.2 to differences in corruption, and 0.13 to differences in generosity. Income differ-ences are more than one-third of the total explanation because, of the six factors, income is the most unequally distributed among countries. GDP per capita is 25 times higher in the top 10 than in the bottom 10 countries.32
Overall, the model explains quite well the life evaluation differences within as well as between
24
regions and for the world as a whole.33 On average, however, the countries of Latin America still have mean life evaluations that are higher (by about 0.6 on the 0 to 10 scale) than predict-ed by the model. This difference has been found in earlier work and been considered to represent systematic personality differences, some unique features of family and social life in Latin coun-tries, or some other cultural differences.34 In partial contrast, the countries of East Asia have average life evaluations below those predicted by
the model, a finding that has been thought to reflect, at least in part, cultural differences in response style. It is also possible that both differences are in substantial measure due to the existence of important excluded features of life that are more prevalent in those countries than elsewhere.35 It is reassuring that our findings about the relative importance of the six factors are generally unaffected by whether or not we make explicit allowance for these regional differences.36
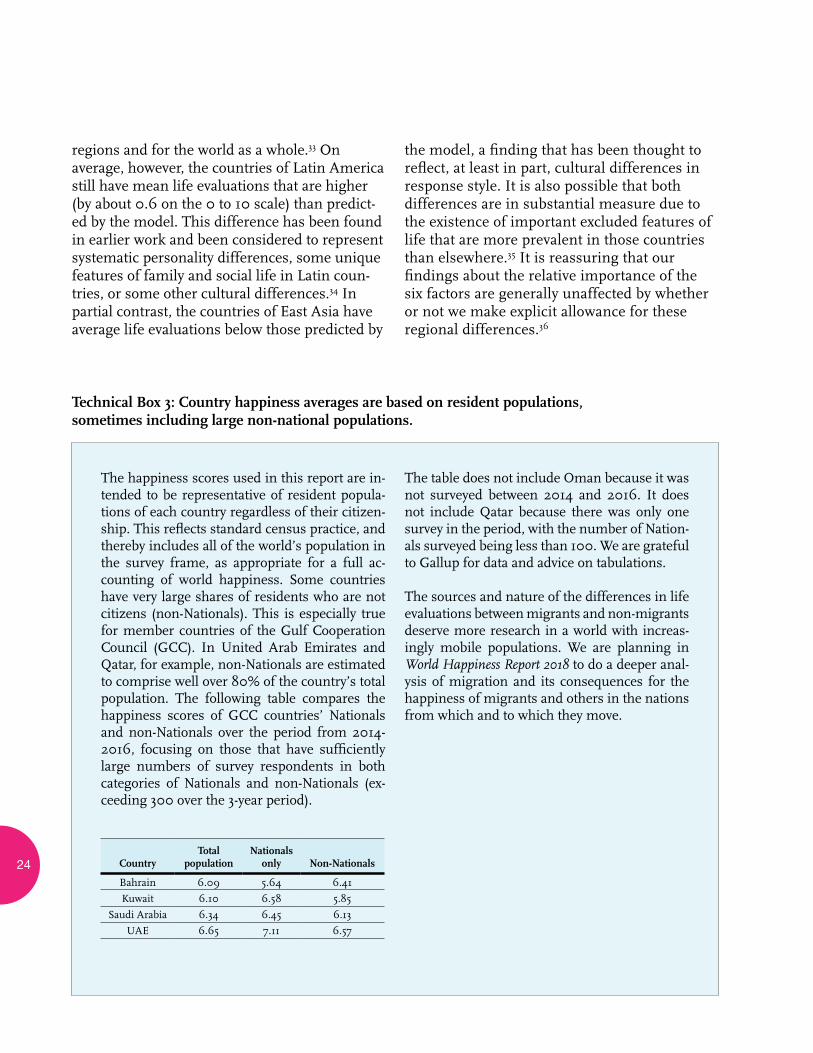
Technical Box 3: Country happiness averages are based on resident populations, sometimes including large non-national populations.
The happiness scores used in this report are in-tended to be representative of resident popula-tions of each country regardless of their citizen-ship. This reflects standard census practice, and thereby includes all of the world’s population in the survey frame, as appropriate for a full ac-counting of world happiness. Some countries have very large shares of residents who are not citizens (non-Nationals). This is especially true for member countries of the Gulf Cooperation Council (GCC). In United Arab Emirates and Qatar, for example, non-Nationals are estimated to comprise well over 80% of the country’s total population. The following table compares the happiness scores of GCC countries’ Nationals and non-Nationals over the period from 2014-2016, focusing on those that have sufficiently large numbers of survey respondents in both categories of Nationals and non-Nationals (ex-ceeding 300 over the 3-year period).
The table does not include Oman because it was not surveyed between 2014 and 2016. It does not include Qatar because there was only one survey in the period, with the number of Nation-als surveyed being less than 100. We are grateful to Gallup for data and advice on tabulations.
The sources and nature of the differences in life evaluations between migrants and non-migrants deserve more research in a world with increas-ingly mobile populations. We are planning in World Happiness Report 2018 to do a deeper anal-ysis of migration and its consequences for the happiness of migrants and others in the nations from which and to which they move.
CountryTotal
populationNationals
only Non-Nationals
Bahrain 6.09 5.64 6.41
Kuwait 6.10 6.58 5.85
Saudi Arabia 6.34 6.45 6.13
UAE 6.65 7.11 6.57
25
W O R L D H A P P I N E S S R E P O R T 2 0 1 6 | U P D AT E
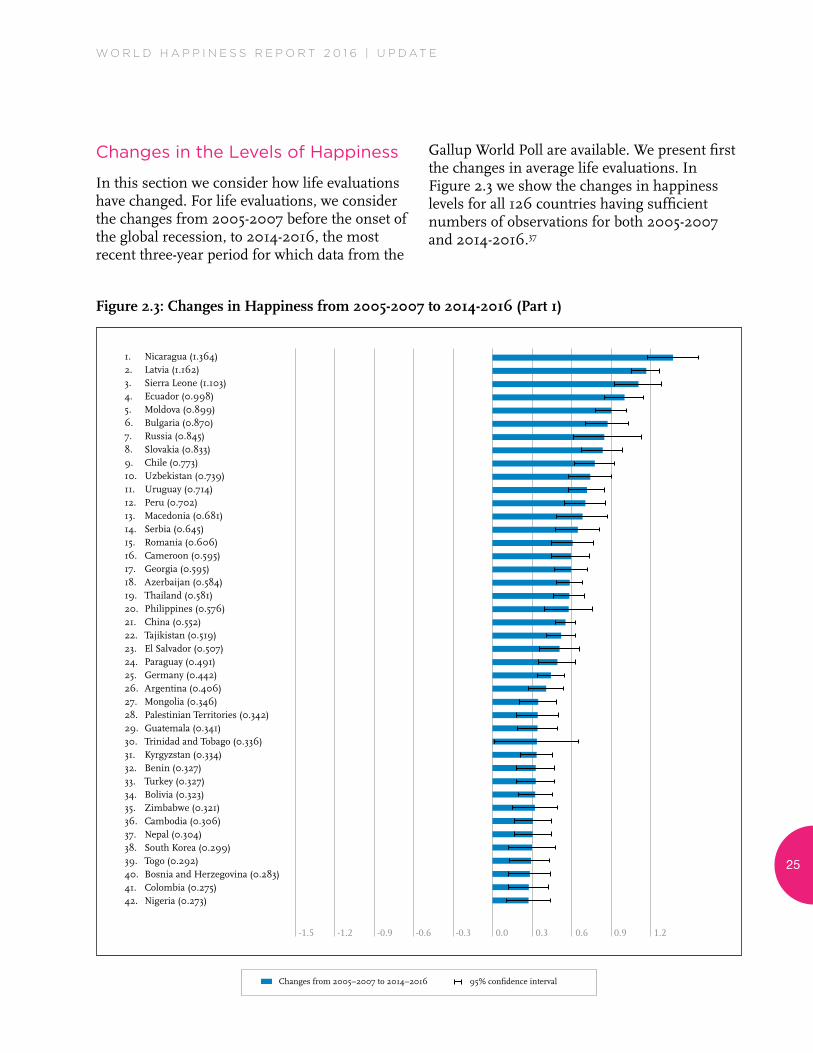
Figure 2.3: Changes in Happiness from 2005-2007 to 2014-2016 (Part 1)
Changes from 2005–2007 to 2014–2016 95% confidence interval
Changes in the Levels of Happiness
In this section we consider how life evaluations have changed. For life evaluations, we consider the changes from 2005-2007 before the onset of the global recession, to 2014-2016, the most recent three-year period for which data from the
Gallup World Poll are available. We present first the changes in average life evaluations. In Figure 2.3 we show the changes in happiness levels for all 126 countries having sufficient numbers of observations for both 2005-2007 and 2014-2016.37
-1.5 -1.2 -0.9 -0.6 -0.3 0.0 0.3 0.6 0.9 1.2
-1.5 -1.2 -0.9 -0.6 -0.3 0.0 0.3 0.6 0.9 1.2
1. Nicaragua(1.364)2. Latvia(1.162)3. SierraLeone(1.103)4. Ecuador(0.998)5. Moldova(0.899)6. Bulgaria(0.870)7. Russia(0.845)8. Slovakia(0.833)9. Chile(0.773)10. Uzbekistan(0.739)11. Uruguay(0.714)12. Peru(0.702)13. Macedonia(0.681)14. Serbia(0.645)15. Romania(0.606)16. Cameroon(0.595)17. Georgia(0.595)18. Azerbaijan(0.584)19. Thailand(0.581)20. Philippines(0.576)21. China(0.552)22. Tajikistan(0.519)23. ElSalvador(0.507)24. Paraguay(0.491)25. Germany(0.442)26. Argentina(0.406)27. Mongolia(0.346)28. PalestinianTerritories(0.342)29. Guatemala(0.341)30. TrinidadandTobago(0.336)31. Kyrgyzstan(0.334)32. Benin(0.327)33. Turkey(0.327)34. Bolivia(0.323)35. Zimbabwe(0.321)36. Cambodia(0.306)37. Nepal(0.304)38. SouthKorea(0.299)39. Togo(0.292)40. BosniaandHerzegovina(0.283)41. Colombia(0.275)42. Nigeria(0.273)
26
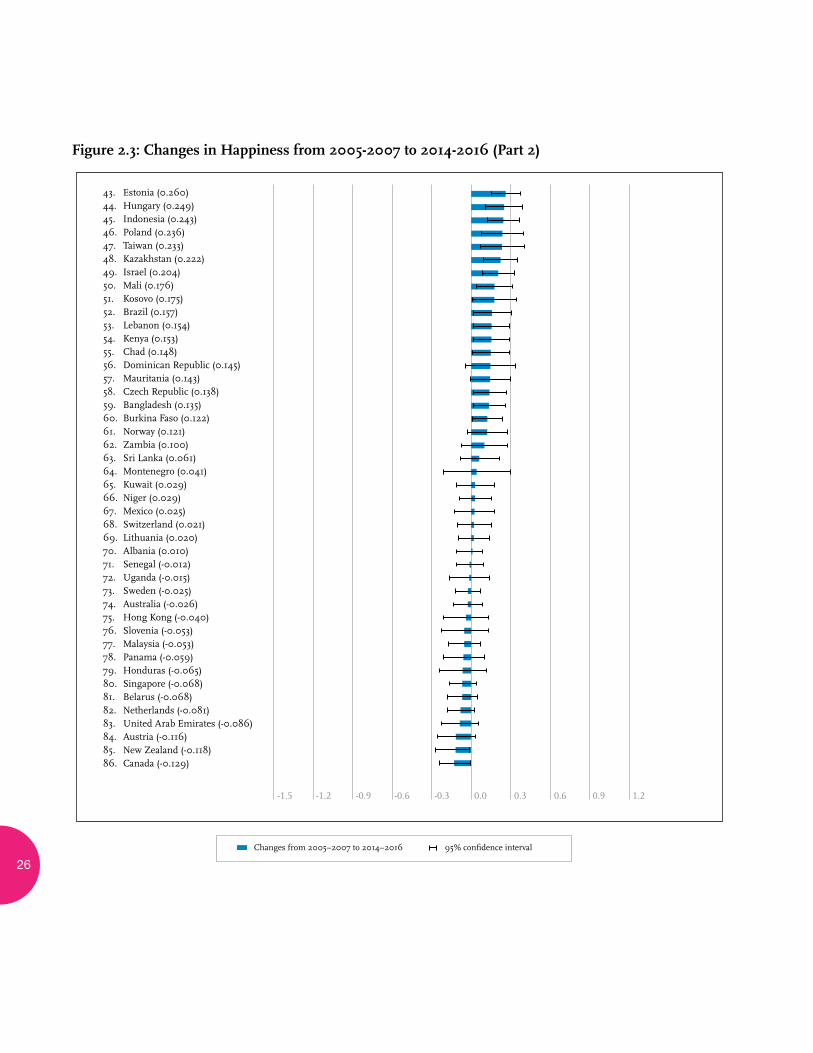
Figure 2.3: Changes in Happiness from 2005-2007 to 2014-2016 (Part 2)
Changes from 2005–2007 to 2014–2016 95% confidence interval
-1.5 -1.2 -0.9 -0.6 -0.3 0.0 0.3 0.6 0.9 1.2
-1.5 -1.2 -0.9 -0.6 -0.3 0.0 0.3 0.6 0.9 1.2
43. Estonia(0.260)44. Hungary(0.249)45. Indonesia(0.243)46. Poland(0.236)47. Taiwan(0.233)48. Kazakhstan(0.222)49. Israel(0.204)50. Mali(0.176)51. Kosovo(0.175)52. Brazil(0.157)53. Lebanon(0.154)54. Kenya(0.153)55. Chad(0.148)56. DominicanRepublic(0.145)57. Mauritania(0.143)58. CzechRepublic(0.138)59. Bangladesh(0.135)60. BurkinaFaso(0.122)61. Norway(0.121)62. Zambia(0.100)63. SriLanka(0.061)64. Montenegro(0.041)65. Kuwait(0.029)66. Niger(0.029)67. Mexico(0.025)68. Switzerland(0.021)69. Lithuania(0.020)70. Albania(0.010)71. Senegal(-0.012)72. Uganda(-0.015)73. Sweden(-0.025)74. Australia(-0.026)75. HongKong(-0.040)76. Slovenia(-0.053)77. Malaysia(-0.053)78. Panama(-0.059)79. Honduras(-0.065)80. Singapore(-0.068)81. Belarus(-0.068)82. Netherlands(-0.081)83. UnitedArabEmirates(-0.086)84. Austria(-0.116)85. NewZealand(-0.118)86. Canada(-0.129)
27
W O R L D H A P P I N E S S R E P O R T 2 0 1 6 | U P D AT E
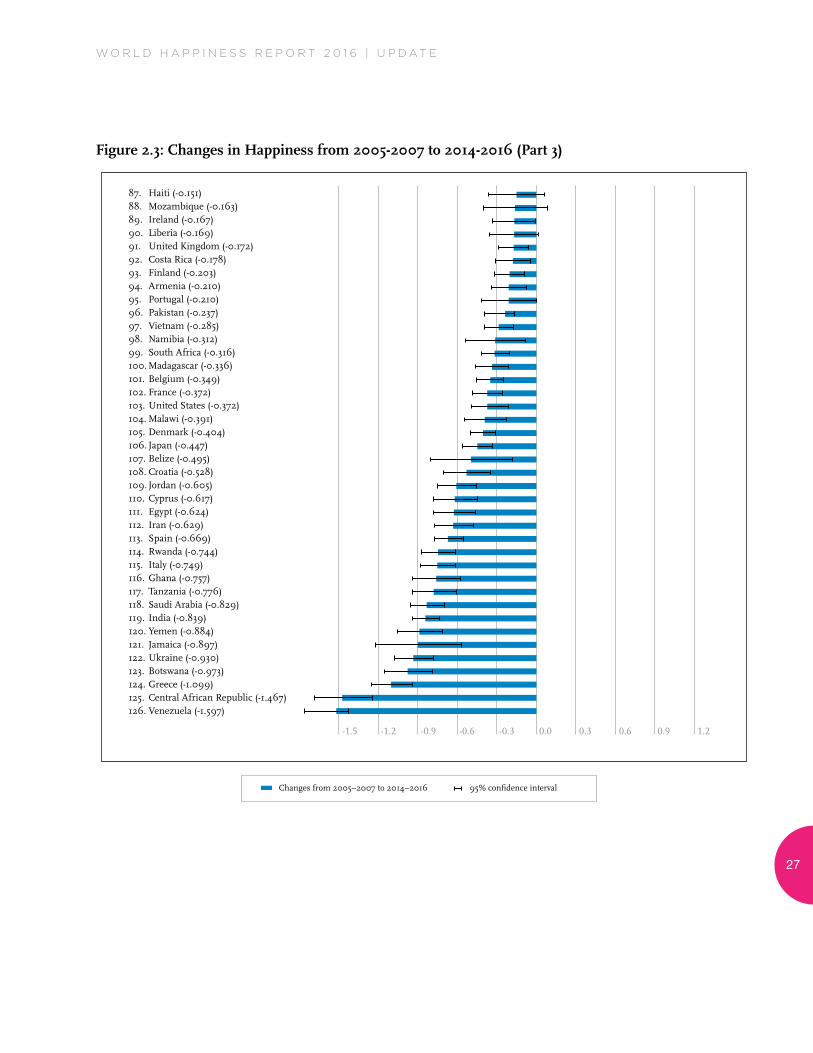
Figure 2.3: Changes in Happiness from 2005-2007 to 2014-2016 (Part 3)
Changes from 2005–2007 to 2014–2016 95% confidence interval
-1.5 -1.2 -0.9 -0.6 -0.3 0.0 0.3 0.6 0.9 1.2
87. Haiti(-0.151)88. Mozambique(-0.163)89. Ireland(-0.167)90. Liberia(-0.169)91. UnitedKingdom(-0.172)92. CostaRica(-0.178)93. Finland(-0.203)94. Armenia(-0.210)95. Portugal(-0.210)96. Pakistan(-0.237)97. Vietnam(-0.285)98. Namibia(-0.312)99. SouthAfrica(-0.316)100.Madagascar(-0.336)101.Belgium(-0.349)102.France(-0.372)103.UnitedStates(-0.372)104.Malawi(-0.391)105.Denmark(-0.404)106.Japan(-0.447)107.Belize(-0.495)108.Croatia(-0.528)109.Jordan(-0.605)110.Cyprus(-0.617)111. Egypt(-0.624)112. Iran(-0.629)113. Spain(-0.669)114. Rwanda(-0.744)115. Italy(-0.749)116.Ghana(-0.757)117. Tanzania(-0.776)118. SaudiArabia(-0.829)119. India(-0.839)120.Yemen(-0.884)121. Jamaica(-0.897)122.Ukraine(-0.930)123. Botswana(-0.973)124.Greece(-1.099)125. CentralAfricanRepublic(-1.467)126.Venezuela(-1.597)
-1.5 -1.2 -0.9 -0.6 -0.3 0.0 0.3 0.6 0.9 1.2
28
Of the 126 countries with data for 2005-2007 and 2014-2016, 95 had significant changes, 58 of which were significant increases, ranging from 0.12 to 1.36 points on the 0 to 10 scale. There were 38 showing significant decreases, ranging from -0.12 to -1.6 points, while the remaining 30 countries revealed no significant trend from 2005-2007 to 2014-2016. As shown in Table 34 of the Statistical Appendix, the significant gains and losses are very unevenly distributed across the world, and sometimes also within continents. For example, in Western Europe there were 11 significant losses but only 1 significant gain. In Central and Eastern Europe, by contrast, these results were reversed, with 12 significant gains against 1 loss. Two other re-gions had many more significant gainers than losers, as measured by country counts. Latin America and the Caribbean had 13 significant gainers against 4 losses, and the Common-wealth of Independent States had 8 gains against 2 losses. In all other world regions, the numbers of significant gains and losses were much more equally divided.
Among the 20 top gainers, all of which showed average ladder scores increasing by 0.50 or more, eleven are in the Commonwealth of Independent States, Central and Eastern Europe, five in Latin America, two in sub-Saharan Africa, Thailand and Philippines in Asia. Among the 20 largest losers, all of which showed ladder reduc-tions of 0.5 or more, five were in the Middle East and North Africa, five in sub-Saharan Africa, four in Western Europe, three in Latin America and the Caribbean, and one each in South Asia, Central and Eastern Europe, and the Common-wealth of Independent States.
These gains and losses are very large, especially for the 10 most affected gainers and losers. For each of the 10 top gainers, the average life evaluation gains exceeded those that would be expected from a doubling of per capita incomes. For each of the 10 countries with the biggest drops in average life evaluations, the losses were more than would be expected from a halving of
GDP per capita. Thus the changes are far more than would be expected from income losses or gains flowing from macroeconomic changes, even in the wake of an economic crisis as large as that following 2007.
On the gaining side of the ledger, the inclusion of five transition countries among the top 10 gainers reflects the rising average life evalua-tions for the transition countries taken as a group. The appearance of sub-Saharan African countries among the biggest gainers and the big-gest losers reflects the variety and volatility of experiences among the sub-Saharan countries for which changes are shown in Figure 2.3, and whose experiences are analyzed in more detail in Chapter 4.
The 10 countries with the largest declines in average life evaluations typically suffered some combination of economic, political, and social stresses. In the World Happiness Report 2016 Update, 3 of the 10 largest losers (Greece, Italy, and Spain) were among the four hard-hit Euro-zone countries whose post-crisis experience was analyzed in detail in World Happiness Report 2013. Of the three, Greece, the hardest hit, is the only one still ranked among the ten largest declines, with a net decline of 1.1, compared to 1.3 previ-ously. The other nine countries come from six of the ten global regions, with separate circum-stances at play in each case.
Figure 18 and Table 33 in the Statistical Appen-dix show the population-weighted actual and predicted changes in happiness for the ten regions of the world from 2005-2007 to 2014-2016. The correlation between the actual and predicted changes is 0.35, with the predicted matching the actual exactly only for the largest gaining region, the Commonwealth of Indepen-dent States, which had life evaluations up by 0.43 points on the 0 to 10 scale. South Asia had the largest drop in actual life evaluations while predicted to have a substantial increase. Sub-Sa-haran Africa was predicted to have a substantial
29
W O R L D H A P P I N E S S R E P O R T 2 0 1 6 | U P D AT E
gain, while the actual change was a very small drop. For all other regions, the predicted and actual changes were in the same direction, with the substantial reductions in the United States (the largest country in the NANZ group), West-ern Europe, and the Middle East and North Africa being larger in each case than predicted. The substantial happiness gains in Southeast Asia, East Asia, and Central and Eastern Europe were all predicted to be substantial, while the Latin American gain was not predicted by the equation. As Figure 18 shows, changes in the six factors are only moderately successful in captur-ing the evolving patterns of life over what have been tumultuous times for many countries. Most of the directions of change were predicted, but generally not the amounts of change.
Social Foundations of Happiness
In this central section of the chapter we exam-ine the social foundations of world happiness. Within the six-factor explanatory framework we have adopted to explain levels and changes of life evaluations, four—social support, freedom to make life choices, generosity, and absence of corruption in government and business—are best seen as representative of different aspects of the social foundations of well-being. The other two—GDP per capita and healthy life expectancy—both long-established as goals for development, are not themselves measures of the quality of a nation’s social foundations, but they are nonetheless strongly affected by the social context. So where do we start in attempt-ing to understand the importance of the social context to the quality of life? After toying with a number of approaches, we come back to the simplest, and organize our discussion under the headings provided by our six explanatory vari-ables, followed by some links to what this method fails to cover.
We start by reviewing some of the linkages between the quality of the social context and real incomes as well as healthy life expectancy. We
then turn to consider the mechanisms whereby the other four variables, themselves more plausibly treated as primary measures of the quality of a society’s social foundations, establish their additional linkages to the quality of life, as revealed by individual life assessments. We then consider how inequality affects the social foun-dations, and vice versa, followed by some links to our earlier analysis of the social foundations of resilience. Finally, we consider new evidence about the social foundations of well-being over the life course, arguing that the age-profiles of happiness in different societies reflect the relative quality of the social fabric for people at different ages and stages of life.
Social Foundations of Income
As human lives and technologies have become more complicated and intertwined over the centuries, the benefits of a bedrock of stable social norms and institutions have become increasingly obvious. There have been many strands of opinion and research about which social norms are most favorable for human development. Adam Smith highlighted two of these strands. In the Theory of Moral Sentiments, Smith argued that human beings are inherently sympathetic to the fates of others beyond them-selves, but too imperfect to apply such sympa-thies beyond themselves, their friends and family, and perhaps their countries. The power and responsibility for achieving general happi-ness of the world population lay with God, with individuals and families presumed able to be fully sympathetic only with those close to them-selves. Modern experimental research in psy-chology echoes this view, since the willingness of students to mark in their own favor has been found to be significant, but reversed by remind-ers of instructions from a higher power.38 Smith’s idea of a strong but limited sense of sympathy underpinned his later and more influential arguments in the Wealth of Nations. Therein, he extolled the capacities of impersonal markets to facilitate specialization in production, with trade being used to share efforts and rewards to mutual advantage as long as these
30
markets were sufficiently underpinned by social norms. These norms are needed to enable people to plan in some confidence that others would deliver as promised, as well as to limit the use of coercion. Much subsequent research in economics has tended to follow Smith’s pre-sumption that each individual’s moral sympathy is limited mainly to family and friends, with individual self-interest serving to explain their decisions. Over the past century, there has been increasing realization of the importance of social norms for any joint activity, especially including the production and distribution of goods and services, as measured by GDP. Indeed, research, including that in this chapter, shows that people routinely act more unselfishly than Smith presumed39, and are happier when they do so40.
Trust has long been seen as an especially im-portant support for economic efficiency. Trust among participants is an asset vital to dealing with the many contingencies that lie beyond the power of contracts to envisage. It also helps to ensure that contracts themselves will be reli-able.41 Empirical research over the past twenty years on the social basis of economic efficiency has given trust a central role, seen as an element or consequence of social capital, which the OECD has defined as “networks together with shared norms, values and understandings that facilitate co-operation within or among groups.”42 Evidence that average levels of eco-nomic performance and rates of economic growth have been higher in regions or countries with higher trust levels is accumulating.43 To the extent that these social norms are present in and protected by public institutions, their capacity to support economic performance is thereby increased.44 There is thus much evidence that good governance is a key foundation for eco-nomic growth; we shall see later that it has benefits for happiness that extend beyond its support for economic progress.
Social foundations of health
There is a long-standing research literature on the social determinants of health. The primary factors considered to represent social determi-nants are measures of social and economic status, primarily income, education, and job status.45 For all three of these markers, both within and across societies, those at the top fare better, in terms of both death and illness, than do those at the bottom.46 The channels for these effects are not yet widely understood, but are thought to include access to health care, better health behaviors, and better nutrition. There has also been some evidence that addressing in-equalities of income and education would not only narrow health inequalities, but also raise average levels at the same time. This literature suggests that at least some of the total influence of income, and perhaps a larger part of the influence of education, on well-being flows through its influence on healthy life expectancy.
Another stream of research has tested and found significant links between social trust and health status.47 The case was made that inequalities in income might have effects on health status through the established linkage between income inequality and social trust.48 Global evidence also suggests that two key social variables—social support and volunteering—are in most coun-tries consistently associated with better self-re-ported health status.49 Furthermore, the quality of social institutions also has important direct effects on health, as health outcomes are better where corruption is less and government quality generally higher.50
More generally, there are many studies showing that maintaining or improving the quality of the social context, whether within the operating room51, in post-operative care, among those recovering from trauma52 or hoping to avoid a new or recurring disease, or among those in elder care53, is a notable protective and healing agent. Both the extent and the quality of social relationships are important. Social support also
W O R L D H A P P I N E S S R E P O R T 2 0 1 7
31
delivers better health by reducing the damage to health from stressful events. For example, a prospective study of Swedish men found that prior exposure to stressful events sharply in-creased subsequent mortality among previously healthy men, but that this risk was almost eliminated for those who felt themselves to have high levels of emotional support.54 More direct beneficial health effects of social integration, without mediation through stressful events, is revealed by a variety of community-level pro-spective studies wherein those with more active social networks had lower subsequent mortality, even after taking into account initial health status and a variety of other protective factors.55
Generosity, which we have found an important source of happiness, also turn out to benefit physical health, with a variety of studies showing that health benefits greater for the givers than for the receivers of peer-to-peer and other forms of support.56
Experimental evidence has shown that those with a broader range of social contacts have significantly lower susceptibility to a common cold virus to an extent that reflects the range of social roles they play.57 By similar reasoning, negative social relations can impose a health cost. For example, those with enduring social conflicts were more than twice as likely to develop a cold from an experimentally delivered cold virus.58
The bulk of the evidence on the health-giving powers of social capital relates to the presence or maintenance of pre-existing natural social connections. The evidence from social support interventions for those with serious life-threat-ening illnesses is more mixed, leading some to suggest that improving natural social networks may be more effective than more targeted patient support.59
The direct role of social support
Social support has been shown in the previous section to have strong linkages to happiness through its effects on physical and mental health. This is only part of the story, however. We have already seen in Table 2.1 that having someone to count on has a very large impact on life evaluations even after allowing for the effects flowing through higher incomes and better health. The percentage of the population who report that they have someone to count on in times of trouble ranges from 29% in Dystopia to almost 99% in Iceland. For a country to have 10% more of its population with someone to count on, (not a large change given the range of 70% between the highest and lowest countries) is associated with an increase in average life evaluations of 0.23 points on the 0 to 10 scale. An increase of that size in life evaluations is equivalent to that from a doubling of GDP per capita, or, for the median country, a ranking increase of seven places in Figure 2.2. These effects are above and beyond those that might flow through higher incomes or better health. Having just one person to count on is not a very demanding definition of social support, as revealed by the large number of countries where more than 90% of respondents have someone to count on. We suspect that a more informative measure of social support might show even larger effects, and, of course, there are many other dimensions of the social support available to people in their homes, on the streets, in their workplaces, among their neighbors, and within their social networks. Having someone to count on is of fundamental importance, but having a fuller set of supporting friendships and social contacts must be even better.
How does a sense of freedom affect happiness?
The Gallup World Poll asks respondents if they are satisfied or dissatisfied with their freedom to choose what to do with their lives. The generality of the question is a virtue, as people are free to focus on whatever aspects of life they find most important. The fact that 0 and 1 are the only
32
possible answers does pose a problem, as it stops us from deriving a measure of just how free people feel, and how evenly this sense of freedom is spread among the population. Even the simple measure has considerable power to explain international differences in life evaluations, however. The variation across countries is even larger than for social support, ranging from 26% to 98%, with an average of 71%. Moving 10% of the population from dissatisfied to satisfied with their life-choice freedom is matched by an in-crease in average life evaluations of 0.11 points on the 0 to 10 scale. This is slightly less than half of what was calculated for having someone to count on. It is nonetheless a very substantial effect, equivalent to an increase of 40% in GDP per capita, or a few places on the ranking tables.
How do answers to the freedom question relate to the social foundations of happiness? In some ways the freedom and social support questions cover different but tightly related aspects of the social fabric. To feel secure, people need to feel that others care for them and will come to their aid when needed. To some extent, being in such a network of usually mutual obligations sets limits on each person’s freedom to make life choices freely, as the interests of others must always be borne in mind. It is apparent from our results that both features are important for a good life. It is also clear from the data that these different aspects need not conflict with each other, as the most successful societies are ones where both measures of the social fabric are strong. Indeed, some of the features of the social fabric that reflect its ability to care for people, in particular the health and education systems, also serve to level out the differences in life opportu-nities that affect the breadth and reality of the life choices open to each individual. For exam-ple, some Northern European countries ranking high in both social support and life-choice freedom have education systems that combine high average success while also narrowing the gaps in performance, and hence future life choices, between children raised in homes with very different levels of parental education.60
Generosity
The Gallup World Poll asked respondents if they have given money for a charitable purpose within the past 30 days. When we use the resulting national averages to explain happiness, we first take out whatever variance is explained by international differences in GDP per capita. Giving money to others is more prevalent in richer countries, in part because higher incomes provide more resources available for sharing. We adjust for income effects so that we can be sure that the effect we find is not a consequence of higher incomes. By doing this, we also increase the estimated effects of per capita incomes, since they now include the effects flowing through greater generosity.
To have 10% more of the population donating is associated with a 0.084 increase in average life evaluations. This is roughly equivalent to the effect of per capita GDP being more than 25% higher.
There are two types of evidence that have been used to assess the happiness effects of generosity. Survey evidence can measure average frequency of generous acts and show how these are related to life evaluations. In lab experiments used to dig deeper into the motivations and consequences of generous acts, the changes under study are too small and too temporary to affect life evaluations, so various positive and negative emotions, mea-sured before, after, and sometimes during the experiments, are used instead61.
Experimental research has routinely found people being more benevolent and altruistic than their self-interest would seem to predict, defying efforts made to explain this in terms of expected reciprocity or other longer term ver-sions of self-interest. But subjective well-being research is now showing that in all cultures62, and even from infancy63, people are drawn to pro-social behavior64, and that they are happier when they act pro-socially65.
W O R L D H A P P I N E S S R E P O R T 2 0 1 7
33
Corruption, trust, and good governance
Social trust, as we have shown above, has been found to be an important support for economic efficiency and physical health. But beyond these channels, the evidence shows that high-trust communities and societies are happier places to live, even after allowing for the effects of higher incomes and better health. The Gallup World Poll does not include the social trust question on a regular basis, so we must rely on the regularly asked questions about perceptions of corruption in business and government to provide a proxy measure.
Respondents are asked separately about corrup-tion in business and government in their own countries, and we use the average of those responses in our estimates of the effects of corruption. Unfortunately, the answers to wheth-er corruption is a problem in one or the other aspect of life are simply ‘yes’ or ‘no,’ so we are unable to properly measure just how bad the problem is seen to be; nor can we see how unequally corruption assessments are distribut-ed. Looking at the 2005 to 2016 data as a whole, the national average corruption assessments vary from 4% to 98%, with an average of 76%. To decrease by 10% the share of the population who think that corruption is a problem is esti-mated by our model to increase average life evaluations by 0.05 points on the 0 to 10 scale—a smaller amount than for social support, freedom, and generosity, but still substantial, equivalent to an increase of GDP per capita of almost 20%. These happiness gains lie above and beyond the well-established effects of corruption on real GDP per capita.
The full happiness effects of a trustworthy environment are likely to be significantly greater than can be captured by a simple measure of the presence or absence of corruption in business and government. It has already been established that even beyond social trust and absence of corruption there are several different aspects of life where trust is important for well-being—in
the workplace, on the streets, in neighborhoods, in business dealings, and in several aspects of government. The European Social Survey (ESS) has several different measures of trust, making it possible to see to what extent they have indepen-dent impacts on happiness. If all trust measures are tapping into the same space, then one mea-sure might be as good as another, and it might not matter which is used. The ESS evidence shows that several different measures of trust have independently important consequences for well-being, and that the total effects of improve-ments in several types of trust are significantly higher than would be estimated using a single measure to stand in for all measures. The ESS also helpfully asks for trust assessments on a 0 to 10 scale, which provides better measures of the levels and distribution of trust, while also increasing the chances for distinguishing the effects of different sorts of trust. The ESS indi-vidual-level results show that five different sorts of trust contribute independently to life satisfac-tion. The two most important are social trust and trust in police, each of which increases life satisfaction by about .08 points for a 1-point improvement on the 0 to 10 scale used for trust assessments in the ESS. Smaller contributions, each about one-third as great as for social trust and trust in police, come from trust in the legal system, trust in parliament, and trust in politi-cians. Single-point increases in all five types of trust are estimated to increase an individual’s satisfaction with life by 0.23 points on the 0 to 10 scale. If social trust is used on its own to stand in for all forms of trust, the estimated effect is less than half as great, at 0.11 points.66
Even if only social trust is used as a basis for estimating the aggregate value of a nation’s social capital, evidence from 132 countries, using wealth-equivalent trust valuations from three different international surveys, shows that social trust represents a substantial share of national wealth in all countries and regions. There are nonetheless big differences among world re-gions, ranging from 12% of total wealth in Latin America to 28% in the OECD countries.67
34
While absence of corruption and presence of trust are both useful measures of the quality of a country’s institutions, they are clearly much too limited in scope to provide a broader view of how the quality of governance affects life evalua-tion beyond the effects flowing through income and health. In looking at the quality of gover-nance more generally, there is a useful distinc-tion to be drawn between the formal structure of institutions and the way they operate on a day-to-day basis. The former is much more frequently studied than the latter, partly because it is more easily measured and categorized. But even when we consider the formal structure of national institutions, such as a country’s parliament, courts, or electoral systems, their effects on life evaluations depend less on what is said in the laws that set them up than in how well they are seen to perform.68 At the aggregate level, several studies have compared the well-being links between two major sets of government charac-teristics and average life evaluations. The first set of characteristics relates to the reliability and responsiveness of governments in their design and delivery of services, referred to here as the quality of delivery. The second set of characteris-tics relate to the presence and pervasiveness of key features of democratic electoral elections and representation. The quality of delivery was measured as the average of four World Bank measures: government effectiveness, regulatory quality, rule of law, and the control of corrup-tion.69 The quality of a country’s democratic processes was based on the average of the remaining two World Bank measures: voice and accountability, and political stability and absence of violence. The results showed that for all countries taken together, the quality of delivery mattered more for well-being than did the presence or absence of democracy.70 The quality of delivery was strongly important for all groups of countries, while the democracy variable had a zero effect for all countries as a group, with a positive effect among richer countries offset by a negative effect among the poorer countries. Subsequent studies using larger country sam-ples, and a variety of survey sources and life eval-
uations, have generally supported this ranking of the relative effects of the delivery and demo-cratic aspects of government quality as supports for happier lives.71
Previous reports considered evidence that good governance has enabled countries to sustain or improve happiness, even during an economic crisis. Results presented there suggested not just that people are more satisfied with their lives in countries with better governance, but also that actual changes in governance quality since 2005 have led to significant changes in the quality of life. For this report we have updated that analy-sis using an extended version of the model that includes country fixed effects, and hence tries to explain the changes going on from year to year in each country. Our updated results, in Table 17 of the Statistical Appendix, show both GDP per capita and changes in governmental quality to have contributed significantly to changes in life evaluations over the 2005 to 2016 period.72
How does inequality affect the social foundations of happiness?
In World Happiness Report Update 2016, we argued that well-being inequality may be as or more relevant than the more commonly used measures of inequality in income and wealth. If happiness is a better measure of well-being than is income, then we might expect concerns about inequality to be focused more on well-being inequality than on the narrower concept of income inequality. We discussed evidence from three international datasets (the World Values Survey, the European Social Survey, and the Gallup World Poll) suggesting that well-being inequality, as measured by the standard devia-tion of life satisfaction responses within the sample populations, does indeed outperform income inequality as a predictor of life satisfac-tion differences among individuals. In addition, the estimated effects of well-being inequality on life satisfaction are significantly larger for those individuals who agree with the statement that income inequalities should be reduced.73 Fur-
W O R L D H A P P I N E S S R E P O R T 2 0 1 7
35
thermore, well-being inequality performs much better than income inequality in one of the key causal roles previously found for income in-equality—as a factor explaining differences in social trust.74 Thus we find that well-being inequality is likely to damage social trust, itself an important index of the strength and quality of the social fabric.75
Another recently exposed link between the social foundations and inequality is that improvements in social trust have been shown to have greater happiness payoffs for the unemployed, those with health problems, and those subject to discrimination, than for others.76 Since these three conditions are much more prevalent among those with the lowest life evaluations, increases in social trust improve average life evaluations both directly and also indirectly by reducing the inequality of well-being.
Social foundations of resilience
The argument was made in previous World Happiness Reports that the strength of the under-lying social fabric, as represented by levels of trust and institutional quality, affects a society’s resilience in response to economic and social crises. We gave Greece, which is the third biggest happiness loser in Figure 2.3 (improved from earlier World Happiness Reports, but still 1.1 points down from 2005-2007 to 2014-2016), special attention, because the well-being losses were so much greater than could be explained directly by economic outcomes. The reports provided evidence of an interaction between social capital and economic or other crises, with the crisis providing a test of the quality of the underlying social fabric.77 If the fabric is suffi-ciently strong, then the crisis may even lead to higher subjective well-being, in part by giving people a chance to do good works together and to realize and appreciate the strength of their mutual social support78, and in part because the crisis will be better handled and the underlying social capital improved in use.
For this argument to be convincing, we realized that we needed examples on both sides of the ledger. It is one thing to show cases where the happiness losses were large and where the erosion of the social fabric appeared to be a part of the story. But what examples are there on the other side? With respect to the post-2007 eco-nomic crisis, the best examples of happiness maintenance in the face of large external shocks were Ireland and especially Iceland.79 Both suffered decimation of their banking systems as extreme as anywhere, and yet suffered incom-mensurately small happiness losses. In the Icelandic case, the post-shock recovery in life evaluations has been great enough to put Ice-land third in the global rankings for 2014-2016. That there is a continuing high degree of social support in both countries is indicated by the fact that of all the countries surveyed by the Gallup World Poll, the percentage of people who report that they have someone to count on in times of crisis remains highest in Iceland and very high in Ireland.80
Social foundations of the life course of happiness
In Chapter 3 of World Happiness Report 2015 we analyzed how several different measures of subjective well-being, including life evaluations and emotions, have varied by age and gender. Chapter 5 of this report makes use of surveys that follow the same people over time to show how well-being varies with age in ways that reflect individual personalities and a variety of past and current experiences and living condi-tions. Both these sources as well as a variety of other research81 have shown that life satisfaction in many countries exhibits a U-shape over the life course, with a low point at about the age of 50. Yet there is also much variety, with some countries showing little or no tendency to rise after middle age, while elsewhere there is evi-dence of an S-shape, with the growing life evaluations after middle age becoming declines again in the late 70s.82 The existence and size of these trends depends on whether they are measured with or without excluding the effects
36
of physical health. Rises in average life evalua-tions after middle age are seen in many coun-tries even without excluding the increasing negative effects due to health status, which gradually worsens with age. Because the U-shape in age is quite prevalent, some re-searchers have thought that it might represent something beyond the scope of life experiences, also since it has been found in a similar form among great apes.83
We shall consider instead the possibility that what has been taken as a natural feature of the life course may be primarily a reflection of a changing pattern of social relationships, and hence likely to appear in some places and not in others, and for some people but not others, depending on the social circumstances in which they live.84 Our analysis of this is very prelimi-nary, and based on a few scattered findings, since the idea itself is fresh and hence largely unstudied. As the empirical science of well-be-ing has developed, and as the available data become richer, it is becoming natural to consid-er not just the possible separate effects of age, marriage, employment, income, and the social context, but also to consider interactions be-tween them. In the present case, we are asking whether the U-shape in age applies equally to people in different social contexts. The simple answer is that it does not. For example, the U-shape in age is significantly less for those who are married than those who are not.85 This suggests that together spouses can better shoul-der the extra demands that may exist mid-life when career and other demands coincide. Yet if the U-shape is partly due to workplace stress and its carry-over into the rest of life, then we might also expect to find the U-shape in age smaller for those whose workplace provides a more welcom-ing social context. That indeed seems to be the case, so much so that among employed respon-dents to the Gallup-Healthways Daily Poll who regard their immediate work superior as a partner (rather than a boss), life evaluations show no reduction from the under-30s into middle age. By contrast, for those whose superior
is seen as a boss, there is a significant U-shape, with life evaluations significantly lower at ages 45-54 than for those under 30.86
If the U-shape in age is importantly based on the quality of the social context, we might also expect to find the U-shape to be less for those who have lived for longer in their local communities as social foundations take time to build. Danish researchers calculated age distributions separate-ly for those residing for more or less than 15 years in their communities, and found that there was some U-shape in age for both groups, with a much deeper mid-life drop for those who arrived more recently in the community.87
Summary of social foundations
We have seen that the roles of social factors as supports for happiness are pervasive and encom-passing. Wherever we looked, from income and health to life in the workplace and on the streets, the quality of the social fabric is seen to be important. Even the widely investigated U-shape in life evaluations over the life course has come to be seen as importantly driven by changes in the supporting power of the social foundations. While the importance of social factors is becom-ing more widely recognized, the underlying mechanisms are just barely beginning to be understood. Our brief review of some recent research covers only a tiny fraction of what has been done, and a smaller fraction still of what needs to be known. In the design and delivery of services, the care for the ailing, and the creation of purpose and opportunities for those who have had neither, a deeper understanding of how people can work better together in achieving happier lives must be thought of as a primary objective. Acceptance of this objective would in turn help to ensure that subjective well-being data are collected wisely and routinely, that new ideas are tested more methodically against currently accepted practice, and that the results of these experiments are shared across commu-nities, disciplines, and cultures.
W O R L D H A P P I N E S S R E P O R T 2 0 1 7
37
The potential benefits from improving the social foundations of well-being are enormous. Appen-dix Table 18 gives some impression of the scale of what might be achieved. It reports the im-provements in life evaluations if each of the four social variables we use in Table 2.1 could be improved from the lowest levels that were observed in the 2014-2016 period to world average levels. To do this, we multiply the lowest-to-average distances for each of the social variables—social support, freedom, generosity, and perceived corruption—with the estimated per-unit contributions of those variables, shown in Table 2.1.
Even ignoring the effects likely to flow through better health and higher incomes, we calculate that bringing the social foundations up to world average levels would increase life evaluations by almost two points (1.97) on the 0 to 10 scale. This comprises 1.19 points from having some-one to count on, 0.41 from a greater sense of freedom to make life choices, 0.25 from living in a more generous environment, and 0.12 from less perceived corruption. These social founda-tion effects are together larger than those calcu-lated to follow from the combined effects of bottom to average improvements in both GDP per capita and healthy life expectancy. The effects from the increase in the numbers of people having someone to count on in times of trouble are by themselves equal to the happiness effects from the 16-fold increase in average per capita incomes required to shift the three poor-est countries up to the world average (from about $600 to about $10,000).
If the countries with the weakest social founda-tions for happiness were able not just to improve to world average standards, but also to match the performance of the three top countries for each of four factors, they would harvest another 1.27 points of happiness, for a total of 3.24 points. Such a move from dystopian to utopian social circumstances is of course not feasible any time soon, but it does show the importance of paying
attention to the oft-ignored social foundations. These calculations do not take into account any improvements flowing through the better health and higher incomes made possible from the better social foundations. Moving from bottom to top-three levels of healthy life expectancy (an increase of 34 healthy years) or GDP per capita (from $600 to $100,000 per year) are calculated to improve life evaluations by 0.98 and 1.78 points, respectively.88 Thus we can see that while all of our six explanatory factors are important in explaining what life looks like in Dystopia and Utopia, the four elements of the social foundations together comprise the largest part of the story.
Conclusions
In presenting and explaining the national-level data in this chapter, we continue to highlight people’s own reports of the quality of their lives, as measured on a scale with 10 representing the best possible life and 0 the worst. We average their reports for the years 2014 to 2016, provid-ing a typical national sample size of 3,000. We then rank these data for 155 countries, as shown in Figure 2.2. The 10 top countries are once again all small or medium-sized western indus-trial countries, of which seven are in Western Europe. Beyond the first ten, the geography immediately becomes more varied, with the second 10 including countries from 4 of the 10 global regions.
In the top 10 countries, life evaluations average 7.4 on the 0 to 10 scale, while for the bottom 10 the average is less than half that, at 3.4. The lowest countries are typically marked by low values of all six variables used here to explain international differences—GDP per capita, healthy life expectancy, social support, freedom, generosity, and absence of corruption—and in addition, often subject to violence and disease. Of the 4-point gap between the top 10 and bottom 10 countries, more than three-quarters is
38
accounted for by differences in the six variables, with GDP per capita, social support, and healthy life expectancy as the largest contributors.
When we turn to consider life evaluation chang-es for 126 countries between 2005-2007 and 2014-2016, we see much evidence of move-ment, including 58 significant gainers and 38 significant losers. Gainers especially outnumber losers in Latin America, the Commonwealth of Independent States, and Central and Eastern Europe. Losers outnumber gainers in Western Europe, while in the rest of the world the numbers of gainers and losers are in rough balance. Changes in the six key variables explain a significant proportion of these chang-es, although the magnitude and nature of the crises facing nations since 2005 have been such as to move some countries into poorly charted waters. We continue to see evidence that major crises have the potential to alter life evaluations in quite different ways according to the quality of the social and institutional infrastructure. In particular, as shown in previous World Happiness Reports, there is evidence that a crisis imposed on a weak institutional structure can actually further damage the quality of the supporting social fabric if the crisis triggers blame and strife rather than co-operation and repair. On the other hand, economic crises and natural disasters can, if the underlying institutions are of sufficient quality, lead to improvements rather than damage to the social fabric.89 These improvements not only ensure better responses to the crisis, but also have substantial additional happiness returns, since people place real value on feeling that they belong to a caring and effective community.
In the World Happiness Report Update 2016, we showed that the inequality of well-being, as measured by the standard deviation of life evaluations within each country, varies among countries quite differently from average happi-ness, and from the inequality of income. We also found evidence that greater inequality of well-being contributes to lower average
well-being. We noted that broadening the focus from income to happiness greatly increases the number of ways of improving lives for the unhappy without making others worse off, and further, this can be achieved in more sustainable and less resource-demanding ways.
This is especially clear for improvements in the social foundations of happiness, the primary focus of our chapter this year. Whether we looked at social support, generosity, or a trust-worthy environment, we found that all can be built in ways that improve the lives of both givers and receivers, those on both ends of the handshake or the exchange of smiles, and whatever the ranks of those who are pooling ideas or sharing tasks.
Targeting the social sources of well-being, which is encouraged by considering a broader measure of well-being, uncovers fresh possibilities for increasing happiness while simultaneously reducing stress on scarce material resources. Much more research is needed to fully under-stand the interplay of factors that determine the social foundations of happiness and consider alternative ways of improving those foundations. There is every hope, however, that simply chang-ing the focus from the material to the social foundations of happiness will improve the rate at which lives can be sustainably improved for all, throughout the world and across generations.

ONLINE APPENDIX
W O R L D H A P P I N E S S R E P O R T 2 0 1 7
HTTP://WORLDHAPPINESS.REPORT/
39
40
1 It is also called Cantril Self-Anchoring Striving Scale (Cantril, 1965).
2 Diener, Lucas, & Oishi (2016) estimate the number of new scientific articles on subjective well-being to have grown by two orders of magnitude over 25 years, from about 130 per year in 1980 to almost 15,000 in 2014.
3 See OECD (2013).
4 As foreshadowed by an OECD case study in the first WHR, and more fully explained in the OECD Chapter in WHR 2013. See Durand & Smith (2013).
5 See Ryff & Singer (2008). The first use of a question about life meaning or purpose in a large-scale international survey was in the Gallup World Poll waves of 2006 and 2007. It was also introduced in the third round of the European Social Survey (Huppert et al. 2009). It has since become one of the four key well-being questions asked by the UK Office for National Statistics (Hicks, Tinkler, & Allin, 2013).
6 The latest OECD list of reporting countries in in Exton et al (forthcoming) and also as an online annex to this report. See here
7 See Helliwell, Layard, & Sachs (2015, Chapter 2, p.14-16). That chapter of World Happiness Report 2015 also explained, on pp. 18-20, why we prefer direct measures of subjective well-being to various indexes of well-being.
8 The Gallup Organization kindly agreed to include the life satisfaction question in 2007 to enable this scientific issue to be addressed. Unfortunately, it has not yet been possible, because of limited space, to establish satisfaction with life as a core question in subsequent Gallup World Polls.
9 See Table 10.1 of Helliwell, Barrington-Leigh, Harris, & Huang (2010, p. 298).
10 See Table 1.2 of Diener, Helliwell, & Kahneman (2010), which shows at the national level GDP per capita correlates more closely with WVS life satisfaction answers than with happiness answers. See also Figure 17.2 of Helliwell & Putnam (2005, p. 446), which compares partial income responses within individual-level equations for WVS life satisfaction and happiness answers. One difficulty with these comparisons, both of which do show bigger income effects for life satisfaction than for happiness, lies in the different response scales. This provides one reason for differing results. The second, and likely more important, reason is that the WVS happiness question lies somewhere in the middle ground between an emotional and an evaluative query. Table 1.3 of Diener et al. (2010) shows a higher correlation between income and the ladder than between income and life satisfaction using Gallup World Poll data, but this is shown, by Table 10.1 of Helliwell et al. (2010), to be because of using non-matched sets of respondents.
11 See, for an example using individual-level data, Kahneman & Deaton (2010), and for national-average data Table 2.1 of Helliwell, Huang, & Wang (2015, p. 22) or Table 2.1 of this chapter.
12 Barrington-Leigh (2013) documents a significant upward trend in life satisfaction in Québec, compared to the rest of Canada, of a size accumulating over 25 years to an amount equivalent to more than a trebling of mean household income.
13 See Lucas (2007) and Yap, Anusic, & Lucas (2012).
14 See Lucas et al. (2003) and Clark & Georgellis (2013).
15 See Yap et al. (2012) and Grover & Helliwell (2014).
16 See International Organization for Migration (2013, chapter 3), Frank, Hou, & Schellenberg (2016), and Helliwell, Bonikowska and Shiplett (2016).
17 See Stone, Schneider, & Harter (2012) and Helliwell & Wang (2015). The presence of day-of-week effects for mood reports is also shown in Ryan, Bernstein, & Brown (2010).
18 See Stone et al. (2012), Helliwell & Wang (2014) and Bonikowska, Helliwell, Hou, & Schellenberg (2013).
19 Table 2.1 of this chapter shows that a set of six variables descriptive of life circumstances explains almost 75 percent of the variations over time and across countries of national average life evaluations, compared to 49 percent for a measure of positive emotions and 23 percent for negative emotions.
20 Using a global sample of roughly 650,000 individual responses, a set of individual-level measures of the same six life circumstances (using a question about health problems to replace healthy life expectancy) explains 19.5 percent of the variations in life evaluations, compared to 7.4 percent for positive affect, and 4.6 percent for negative affect.
21 As shown in Table 2.1 of the first World Happiness Report. See Helliwell, Layard, & Sachs (2012, p. 16).
22 For these comparisons to be meaningful, it should be the case that life evaluations relate to life circumstances in roughly the same ways in diverse cultures. This important issue was discussed some length in World Happiness Report 2015. The burden of the evidence presented was that the data are internationally comparable in structure despite some identified cultural differences, especially in the case of Latin America. Subsequent research by Exton, Smith, & Vandendriessche (2015) confirms this conclu-sion.
23 Gallup weights sum up to the number of respondents from each country. To produce weights adjusted for
W O R L D H A P P I N E S S R E P O R T 2 0 1 7
41
population size in each country for the period of 2014-2016, we first adjust the Gallup weights so that each coun-try has the same weight (one-country-one-vote) in the peri-od. Next we multiply total population aged 15+ in each country in 2015 by the one-country-one-vote weight. To simplify the analysis, we use population in 2015 for the period of 2014-2016 for all the countries/regions. Total population aged 15+ is equal to the proportion of popula-tion aged 15+ (=one minus the proportion of population aged 0-14) multiplied by the total population. Data are mainly taken from WDI (2016). Specifically, the total population and the proportion of population aged 0-14 are taken from the series “Population ages 0-14 (percent of total)” and “Population, total” respectively from WDI (2016). There are a few regions which do not have data in WDI (2016), such as Nagorno-Karabakh, Northern Cyprus, Somaliland, and Taiwan. In this case, other sources of data are used if available. The population in Taiwan is 23,492,000, and the aged 15+ is 20,305,000 in 2015 (Statistical Yearbook of the Republic of China 2015, Table 3). The total population in Northern Cyprus in 2015 is not available, thus we use its population in 2014. It is 313,626 according to Economic and Social Indicators 2014 published by State Planning Organization of Northern Cyprus in December 2015 (p. 3). The ratio of population 0-14 is not available in 2015, so we use the one in 2011, 18.4 percent, calculated based on the data in 2011 Population Census, reported in Statistical Yearbook 2011 by State Planning Organization of Northern Cyprus in April 2015 (p. 13). There are no reliable data on population and age structure in Nagorno-Karabakh and Somaliland region, therefore these two regions are not included in the calculation of world or regional distributions.
24 The statistical appendix contains alternative forms without year effects (Appendix Table 13), and a repeat version of the Table 2.1 equation showing the estimated year effects (Appendix Table 8). These results confirm, as we would hope, that inclusion of the year effects makes no significant difference to any of the coefficients.
25 As shown by the comparative analysis in Table 7 of the Statistical Appendix.
26 The definitions of the variables are shown in the notes to Table 2.1, with additional detail in the online data appendix.
27 This influence may be direct, as many have found, e.g. De Neve, Diener, Tay, & Xuereb (2013). It may also embody the idea, as made explicit in Fredrickson’s broaden-and-build theory (Fredrickson, 2001), that good moods help to induce the sorts of positive connections that eventually provide the basis for better life circumstances.
28 We put the contributions of the six factors as the first elements in the overall country bars because this makes it easier to see that the length of the overall bar depends only on the average answers given to the life evaluation question. In World Happiness Report 2013 we adopted a different ordering, putting the combined Dystopia+resid-ual elements on the left of each bar to make it easier to
compare the sizes of residuals across countries. To make that comparison equally possible in subsequent World Happiness Reports, we include the alternative form of the figure in the on-line statistical appendix (Appendix Figures 7-9).
29 These calculations are shown in detail in Table 18 of the on-line Statistical Appendix.
30 The prevalence of these feedbacks was documented in Chapter 4 of World Happiness Report 2013, De Neve et al. (2013).
31 The coefficients on GDP per capita and healthy life expectancy are affected even less, and in the opposite direction in the case of the income measure, being increased rather than reduced, once again just as expected. The changes are tiny because the data come from other sources, and are unaffected by our experiment. However, the income coefficient does increase slightly, since income is positively correlated with the other four variables being tested, so that income is now able to pick up a fraction of the dropin influence from the other four variables. We also performed an alternative robustness test, using the previous year’s values for the four survey-based variables. This also avoids using the same respondent’s answers on both sides of the equation, and produces similar results, as shown in Table 12 of the Statistical Appendix. The Table 12 results are very similar to the split-sample results shown in Tables 10 and 11, and all three tables give effect sizes very similar to those in Table 2.1.
32 The data and calculations are shown in detail in Table 19 of the Statistical Appendix. Annual per capita incomes average $45,000 in the top 10 countries, compared to $1,500 in the bottom 10, measured in international dollars at purchasing power parity. For comparison, 94 percent of respondents have someone to count on in the top 10 countries, compared to 58 percent in the bottom 10. Healthy life expectancy is 71.7 years in the top 10, compared to 52 years in the bottom 10. 93 percent of the top 10 respondents think they have sufficient freedom to make key life choices, compared to 63 percent in the bottom 10. Average perceptions of corruption are 35 percent in the top 10, compared to 73 percent in the bottom 10.
33 Actual and predicted national and regional average 2014-2016 life evaluations are plotted in Figure 16 of the Statistical Appendix. The 45-degree line in each part of the Figure shows a situation where the actual and predicted values are equal. A predominance of country dots below the 45-degree line shows a region where actual values are below those predicted by the model, and vice versa. East Asia provides an example of the former case, and Latin America of the latter.
34 See the Latin American panel of Figure 16 of the Statisti-cal Appendix, showing almost all countries to have measured ladder averages higher than predicted. Mariano Rojas has previously noted that if our figure were drawn using satisfaction with life rather than the ladder it would
42
show an even larger Latin American premium (based on data from 2007, the only year when the GWP asked both questions of the same respondents). It is also true that looking across all countries, satisfaction with life is on average higher than the Cantril ladder scores, by an amount that is higher at higher levels of life evaluations.
35 For example, see Chen, Lee, & Stevenson (1995).
36 One slight exception is that the negative effect of corrup-tion is estimated to be slightly larger, although not significantly so, if we include a separate regional effect variable for Latin America. This is because corruption is worse than average in Latin America, and the inclusion of a special Latin American variable thereby permits the corruption coefficient to take a higher value.
37 There are thus, as shown in Table 15 of the Statistical Appendix, 29 countries that are in the 2014-2016 ladder rankings of Figure 2.2 but without changes shown in Figure 2.3. These countries for which changes are missing include some of the 10 lowest ranking countries in Figure 2.2. Several of these countries might well have been shown among the 10 major losers had their earlier data been available.
38 Merely being asked to remember the Ten Command-ments removed any tendency for the students to mark falsely in their own favour. See Mazar et al (2008).
39 See, for example, Ostrom (2000).
40 See Ricard (2015).
41 See Solow (2000, p.8) and Fukuyama (1995).
42 OECD (2001, p. 41). See also Putnam (2001).
43 See, in chronological order, Knack & Keefer (1997), Zak & Knack (2001), Beugelsdijk et al (2004). Algan & Cahuc (2010), and Bjørnskov (2012).
44 For a review of the global evidence, see Acemoglu & Robinson (2012).
45 For a recent review combining the income and education channels with more direct consideration of supportive social networks, see Havranek et al (2015).
46 See Marmot et al (1997), Evans et al (1994), Marmot (2005) and Wilkinson & Marmot (2003).
47 See Kawachi & Berkman (2000).
48 See Kawachi et al (1997).
49 See Kumar et al (2012).
50 See Holmberg & Rothstein (2011).
51 The use of surgical safety checklists has become globally widespread following the adoption of the WHO guidelines (Haynes et al 2009). Subsequent research has shown that
typical application of the checklist procedures may not be enough to significantly improve outcomes (Urbach et al 2014). What seems to be most important in achieving safety improvements are improvements in team training (Neily et al 2010), team involvement (Rydenfält et al 2013, Walker et al 2012) and teamwork and communication in the operating room (Russ et al 2013). These latter are all elements contributing directly to the subjective well-being of team members as well as to the safety of the patients.
52 See C. Haslam et al (2008).
53 See Theurer et al (2015).
54 See Rosengren et al (1993). The protective effects of social integration and emotional support were both evident, but much larger for emotional support.
55 The initial Almeda County study was reported by Berk-man & Syme (1979), and the results confirmed by a number of subsequent studies reviewed by Berkman & Glass (2000). There are many more recent studies in smaller settings showing that those who are able to maintain their social networks have better post-stroke recoveries (C. Haslam et al, 2008) and are less likely to suffer post-partum depression (Seymour-Smith et al 2016). And altruism has found to be health predicting in elder care settings, e.g. Theurer & Wister (2010)
56 See Abolfathi Momtaz (2014), Brown et al. (2003), Thomas (2009) and Weinstein & Ryan (2010).
57 See Cohen et al (1997).
58 See Cohen et al (1998).
59 See Cohen (2004, 681-2). For example, Helgeson et al (2000) found that peer emotional support groups helped women cancer patients who lacked support from their partners or physicians but harmed women who had high levels of natural support.
60 See Willms (2003, Figure 1) showing that the two Northern European countries in the 12-country sample, Sweden and the Netherlands, had the highest average literacy levels for their students, and also the smallest impact flowing from parental education.
61 See, e.g. Aknin et al (2017).
62 See Aknin et al (2013).
63 See Aknin et al (2012).
64 See Shultz and Dunbar (2007).
65 See Schwartz & Sendor (1999).
66 These results are drawn from Appendix Table 6 of Helliwell, Huang & Wang (2016).
67 See Hamilton et al (2016).
W O R L D H A P P I N E S S R E P O R T 2 0 1 7
43
68 There are thus complicated links among public institu-tions, trust and corruption. High quality institutions have been shown to favour the development of social trust, above and beyond trust in the institutions themselves (Charron & Rothstein 2017). It has also been argued that social trust and trustworthy institutions are both more likely to be developed where historical circumstances (such as high climate variability) require more cooper-ation and better institutions (Buggle &Durante 2016).
69 From Kaufmann, Kraay & Mastruzzi (2009) and Helliwell &Huang (2008).
70 See Helliwell & Huang (2008).
71 See Ott (2010) and Helliwell, Huang, Grover & Wang (2014).
72 Columns 8 and 9 in Table 17, which include country fixed effects, show the links between changes in governance and GDP and those of life evaluations. In these annual data, causality is much more likely to be flowing from GDP and delivery quality (both measured independently from the GWP survey data) to life evaluations than in the reverse direction.
73 See Goff et al (2016).
74 Evidence for a central trust-destroying role for income inequality is provided by Rothstein and Uslaner (2005). Goff et al. (2016, Table 6) have since shown, using three international datasets, that well-being inequality is much more important than is income inequality as a factor explaining differences among people in how much they think that others can be trusted.
75 Of course, the positive linkages between inequality and social trust are likely to run in both directions. What the evidence in Goff et al (2016) shows is that the combined effect of the two-way linkage between social trust and inequality is larger for well-being inequality than for income inequality.
76 See Helliwell, Huang & Wang (2016).
77 See Helliwell, Huang, & Wang (2014).
78 See Ren & Ye (2016), Brown & Westaway (2011), Uchida et al (2014) and Yamamura et al, (2015).
79 Gudmundsdottir (2013) presents data from a longitudinal survey showing stability of life satisfaction ratings in Iceland from 2007 to 2009.
80 Averaging across the 2014-16 GWP surveys, Iceland and Ireland are ranked first and fourth, respectively, in terms of social support, with over 98 percent of Icelandic respondents, and 96% of Irish ones, having someone to count on, compared to an international average of 80 percent.
81 See, for example, Blanchflower & Oswald (2008).
82 See Bonke et al (2016).
83 See Weiss et al (2012).
84 This is one way of interpreting the results of Frijters and Beatton (2012) who find little evidence of a U-shape when they include individual fixed effects in three panel surveys. For most continuing panel members, there would be little change in the quality of the social contexts of their lives.
85 See Grover and Helliwell (2014).
86 For those whose superior is seen as a partner, the average Cantril ladder score is 7.1 (se=.005) for those under 30, and 7.1 (se=.004) for those aged 45-54. For those whose superior is seen as a boss, the average ladder score is 6.88 (se=.007) for those under 30 and 6.67 (se=.006) for those aged 45-54. In the same vein, the age U-shape in daily happiness ratings is much flatter for reports relating to weekend days and holidays than for regular weekdays. See Helliwell (2014, p.128) for the latter evidence.
87 See Bonke et al (2016).
88 The calculations above, as well as those reported in Tables 18 and 19, are based on country-period averages for 155 countries for the 2014-2016 period. The minimum, maximum and averages are thus slightly different from the summary statistics reported in Table 6 of the Statistical Appendix, which is based on country-year observations instead of country-period observations.
89 See Dussaillant & Guzmán (2014). In the wake of the 2010 earthquake in Chile, there was looting in some places and not in others, depending on initial trust levels. Trust subsequently grew in those areas where helping prevailed instead of looting.
References
Abolfathi Momtaz, Y., Ibrahim, R., & Hamid, T. A. (2014). The impact of giving support to others on older adults’ perceived health status. Psychogeriatrics, 14(1), 31-37.
Acemoglu, D., & Robinson, J. (2012). Why nations fail: The origins of power, prosperity, and poverty. Crown Business.
Aknin, L. B., Barrington-Leigh, C. P., Dunn, E. W., Helliwell, J. F., Burns, J., Biswas-Diener, R., ... & Norton, M. I. (2013). Prosocial spending and well-being: Cross-cultural evidence for a psychological universal. Journal of Personality and Social Psychology, 104(4), 635.
Aknin, L. B., Hamlin, J. K., & Dunn, E. W. (2012). Giving leads to happiness in young children. PLoS One, 7(6), e39211.
Aknin, L. B., Mayraz, G., & Helliwell, J. F. (2017). The emotional consequences of donation opportunities. The Journal of Positive Psychology, 12(2), 169-177.
Algan, Y., & Cahuc, P. (2010). Inherited trust and growth. The American Economic Review, 100(5), 2060-2092.
Barrington-Leigh, C. P. (2013). The Quebec convergence and Canadian life satisfaction, 1985–2008. Canadian Public Policy, 39(2), 193-219.
Berkman, L. F., & Glass, T. (2000). Social integration, social networks, social support, and health. Social epidemiology, 1, 137-173.
Berkman, L. F., & Syme, S. L. (1979). Social networks, host resistance, and mortality: a nine-year follow-up study of Alameda County residents. American journal of Epidemiology, 109(2), 186-204.
Beugelsdijk, S., De Groot, H. L., & Van Schaik, A. B. (2004). Trust and economic growth: a robustness analysis. Oxford economic papers, 56(1), 118-134.
Bjørnskov, C. (2012). How does social trust affect economic growth?. Southern Economic Journal, 78(4), 1346-1368.
Blanchflower, D. G., & Oswald, A. J. (2008). Is well-being U-shaped over the life cycle?. Social science & medicine, 66(8), 1733-1749.
Bonikowska, A., Helliwell, J. F., Hou, F., & Schellenberg, G. (2013). An assessment of life satisfaction responses on recent Statistics Canada Surveys. Social Indicators Research, 118(2), 1-27.
Bonke, J., Mortensen, L.H., Ploug, N., Hansen, A.V. (2016) Explaining inter-area variation in life-satisfaction - matched survey and register data. Statistics Denmark (Paper presented at the OECD/LSE conference on well-being over the life course. December 13, 2016.
Brown, S. L., Nesse, R. M., Vinokur, A. D., & Smith, D. M. (2003). Providing social support may be more beneficial than receiving it: results from a prospective study of mortality. Psychological Science, 14(4), 320-327.
Brown, K., & Westaway, E. (2011). Agency, capacity, and resilience to environmental change: lessons from human development, well-being, and disasters. Annual review of environment and resources, 36(1), 321.
Buggle, J., & Durante, R. (2016). Climate risk, cooperation and the co-evolution of culture and institutions. http://www.johannesbuggle.com/docs/climate.pdf
Cantril, H. (1965). The pattern of human concerns. New Brunswick: Rutgers University Press.
Charron, N., & Rothstein, B. (2017). Regions of trust and distrust: How good institutions can foster social cohesion. In Benritz, U., Mårtensson, M., Oxelheim, L. & Persson, T. eds. Bridging the Prosperity Gap in the EU: The Social Challenge Ahead. Cheltenham, Edward Elgar.
Chen, C., Lee, S. Y., & Stevenson, H. W. (1995). Response style and cross-cultural comparisons of rating scales among East Asian and North American students. Psychological Science, 6(3), 170-175.
Clark, A. E., & Georgellis, Y. (2013). Back to baseline in Britain: Adaptation in the British Household Panel Survey. Economica, 80(319), 496-512.
Cohen, S. (2004). Social relationships and health. American psychologist, 59(8), 676.
Cohen, S., Doyle, W. J., Skoner, D. P., Rabin, B. S., & Gwalt-ney, J. M. (1997). Social ties and susceptibility to the common cold. Journal of the American medical association, 277(24), 1940-1944.
Cohen, S., Frank, E., Doyle, W. J., Skoner, D. P., Rabin, B. S., & Gwaltney Jr, J. M. (1998). Types of stressors that increase susceptibility to the common cold in healthy adults. Health Psychology, 17(3), 214.
Deci, E. L., La Guardia, J. G., Moller, A. C., Scheiner, M. J., & Ryan, R. M. (2006). On the benefits of giving as well as receiving autonomy support: Mutuality in close friendships. Personality and Social Psychology Bulletin, 32(3), 313-327.
De Neve, J. E., Diener, E., Tay, L., & Xuereb, C. (2013). The objective benefits of subjective well-being. In J. F. Helliwell, R. Layard, & J. Sachs (Eds.), World happiness report 2013 (pp. 54-79). New York: UN Sustainable Development Solutions Network.
Diener, E., Helliwell, J., & Kahneman, D. (Eds.) (2010). International differences in well-being. Oxford University Press.
Diener, E., Lucas, R. & Oishi, S. (2016). Advances and open questions in the science of well-being. Unpublished manu-script, University of Viginia.
Durand, M., & Smith, C. (2013). The OECD approach to measuring subjective well-being. In J. F. Helliwell, R. Layard, & J. Sachs (Eds.), World Happiness Report 2013 (pp. 112-137). New York: UN Sustainable Development Solutions Network.
44
Dussaillant, F., & Guzmán, E. (2014). Trust via disasters: The case of Chile’s 2010 earthquake. Disasters, 38(4), 808-832.
Evans, R. G., Barer, M. L., & Marmor, T. R. (Eds.) (1994). Why are some people healthy and others not? The Determinants of the health of populations. New York: De Gruyter.
Exton, C., Smith, C., & Vandendriessche, D. (2015). Compar-ing happiness across the world: Does culture matter? OECD Statistics Working Papers, 2015/04, Paris: OECD Publishing. http://dx.doi.org/10.1787/5jrqppzd9bs2-en
Exton, C., Siegerink, V., and Smith, C. (forthcoming), Measuring subjective well-being in national statistics: Taking stock of recent OECD activities, OECD Publishing, Paris.
Frank, K., Hou, F., & Schellenberg, G. (2016). Life satisfaction among recent immigrants in Canada: comparisons to source-country and host-country populations. Journal of Happiness Studies, 17(4): 1659–1680. doi:10.1007/s10902-015-9664-2
Fredrickson, B. L. (2001). The role of positive emotions in positive psychology: The broaden-and-build theory of positive emotions. American psychologist, 56(3), 218-226.
Frijters, P., & Beatton, T. (2012). The mystery of the U-shaped relationship between happiness and age. Journal of Economic Behavior & Organization, 82(2), 525-542.
Fukuyama, F. (1995). Trust: The social virtues and the creation of prosperity. New York: Free press.
Gandelman, N., & Porzecanski, R. (2013). Happiness inequali-ty: How much is reasonable? Social Indicators Research, 110(1), 257-269.
Gërxhani, K. (2016). Tax evasion and well-being: A study of the social and institutional context in Central and Eastern Europe. European Journal of Political Economy, 45, 149-159.
Goff, L., Helliwell, J., & Mayraz, G. (2016). The welfare costs of well-being inequality. NBER Working Paper 21900.
Grover, S., & Helliwell, J. F. (2014). How’s life at home? New evidence on marriage and the set point for happiness. NBER Working Paper 20794.
Gudmundsdottir, D. G. (2013). The impact of economic crisis on happiness. Social Indicators Research, 110(3), 1083-1101.
Hamilton, K., Helliwell, J. F., & Woolcock, M. (2016). Social capital, trust and well-being in the evaluation of wealth. NBER Working Paper 22556.
Haslam, C., Holme, A., Haslam, S. A., Iyer, A., Jetten, J., & Williams, W. H. (2008). Maintaining group memberships: Social identity continuity predicts well-being after stroke. Neuropsychological Rehabilitation, 18(5-6), 671-691.
Haslam, C., Cruwys, T., Haslam, S. A., Dingle, G., & Chang, M. X. L. (2016). Groups 4 Health: Evidence that a social-iden-tity intervention that builds and strengthens social group
membership improves mental health. Journal of affective disorders, 194, 188-195.
Havranek, E. P., Mujahid, M. S., Barr, D. A., Blair, I. V., Cohen, M. S., Cruz-Flores, S., ... & Rosal, M. (2015). Social determinants of risk and outcomes for cardiovascular disease a scientific statement from the American Heart Association. Circulation, 132(9), 873-898.
Haynes, A. B., Weiser, T. G., Berry, W. R., Lipsitz, S. R., Breizat, A. H. S., Dellinger, E. P., ... & Merry, A. F. (2009). A surgical safety checklist to reduce morbidity and mortality in a global population. New England Journal of Medicine, 360(5), 491-499.
Helgeson, V. S., Cohen, S., Schulz, R., & Yasko, J. (2000). Group support interventions for women with breast cancer: who benefits from what?. Health psychology, 19(2), 107.
Helliwell, J. F. (2014). Understanding and improving the social context of well-being. In Hämäläinen, T. & Michaelson, J. (Eds.) Well-Being and Beyond: Broadening the Public and Policy Discourse. Elgar (pp 125-143). (Also as NBER Working Paper 18486).
Helliwell, J. F., Barrington-Leigh, C., Harris, A., & Huang, H. (2010). International evidence on the social context of well-being. In E. Diener, J. F. Helliwell, & D. Kahneman (Eds.), International differences in well-being (pp. 291-327). Oxford: Oxford University Press.
Helliwell, John F., Bonikowska, A. & Shiplett, H. (2016). Migration as a test of the happiness set point hypothesis: Evidence from Immigration to Canada. NBER Working Paper 22601.
Helliwell, J. F., & Huang, H. (2008). How’s your government? International evidence linking good government and well-be-ing. British Journal of Political Science, 38(04), 595-619.
Helliwell, J. F., Huang, H., Grover, S., & Wang, S. (2014). Good governance and national well-being: What are the linkages? OECD Working Papers on Public Governance, No. 25, Paris: OECD Publishing. DOI: http://dx.doi.org/10.1787/5jx-v9f651hvj-en.
Helliwell, J. F., Huang, H., & Wang, S. (2014). Social capital and well-being in times of crisis. Journal of Happiness Studies, 15(1), 145-162.
Helliwell, J. F., Huang, H., & Wang, S. (2016). New Evidence on Trust and Well-being (No. w22450). National Bureau of Economic Research.
Helliwell, J. F., Layard, R., & Sachs, J. (Eds.). (2012). World happiness report. New York: UN Sustainable Development Solutions Network.
Helliwell, J. F., Layard, R., & Sachs, J. (Eds.). (2015). World happiness report 2015. New York: UN Sustainable Development Solutions Network.
W O R L D H A P P I N E S S R E P O R T 2 0 1 7
45
46
Helliwell, J. F., Layard, R., & Sachs, J. (Eds.). (2016). World Happiness Report Update 2016. New York: UN Sustainable Development Solutions Network.
Helliwell, J. F., & Wang, S. (2013). World happiness: Trends, explanations and distribution. In J. F. Helliwell, R. Layard, & J. Sachs (Eds.), World Happiness Report 2013 (pp. 8-37). New York: UN Sustainable Development Solutions Network.
Helliwell, J.F., & Wang, S. (2014). Weekends and subjective well-being. Social Indicators Research, 116(2), 389-407.
Helliwell, J. F., & Wang, S. (2015). How was the weekend? How the social context underlies weekend effects in happi-ness and other emotions for US workers. PLoS ONE, 10(12), e0145123.
Hicks, S., Tinkler, L., & Allin, P. (2013). Measuring subjective well-being and its potential role in policy: Perspectives from the UK Office for National Statistics. Social Indicators Research, 114(1), 73-86.
Holmberg, S., & Rothstein, B. (2011). Dying of corruption. Health Economics, Policy and Law, 6(04), 529-547.
Huppert, F. A., Marks, N., Clark, A., Siegrist, J., Stutzer, A., Vittersø, J., & Wahrendorf, M. (2009). Measuring well-being across Europe: Description of the ESS well-being module and preliminary findings. Social Indicators Research, 91(3), 301-315.
Inagaki, T. K., & Eisenberger, N. I. (2012). Neural correlates of giving support to a loved one. Psychosomatic Medicine, 74(1), 3-7.
International Organization for Migration (2013). World migration report 2013. http://publications.iom.int/system/files/pdf/wmr2013_en.pdf.
Kahneman, D., & Deaton, A. (2010). High income improves evaluation of life but not emotional well-being. Proceedings of the National Academy of Sciences, 107(38), 16489-16493.
Kalmijn, W., & Veenhoven, R. (2005). Measuring inequality of happiness in nations: In search for proper statistics. Journal of Happiness Studies, 6(4), 357-396.
Kaufmann, D. Kraay, A., & Mastruzzi, M. (2009). Governance matters VIII: Aggregate and individual governance indicators, 1996-2008. World Bank Policy Research Working Paper No. 4978. http://ssrn.com/abstract=1424591
Kawachi, I., & Berkman, L. (2000). Social cohesion, social capital, and health. Social epidemiology, 174-190.
Kawachi, I., Kennedy, B. P., Lochner, K., & Prothrow-Stith, D. (1997). Social capital, income inequality, and mortality. American journal of public health, 87(9), 1491-1498.
Keeley, B. (2015). Income inequality: The gap between rich and poor. OECD Insights, Paris: OECD Publishing.
Knack, S., & Keefer, P. (1997). Does social capital have an economic payoff? A cross-country investigation. The Quarterly journal of economics, 1251-1288.
Konrath, S., Fuhrel-Forbis, A., Lou, A., & Brown, S. (2012). Motives for volunteering are associated with mortality risk in older adults. Health Psychology, 31(1), 87.
Kumar, S., Calvo, R., Avendano, M., Sivaramakrishnan, K., & Berkman, L. F. (2012). Social support, volunteering and health around the world: Cross-national evidence from 139 countries. Social science & medicine, 74(5), 696-706.
Kuznets, S. (1955). Economic growth and income inequality. American Economic Review, 45(1), 1-28.
Lucas, R. E. (2007). Adaptation and the set-point model of subjective well-being: Does happiness change after major life events? Current Directions in Psychological Science, 16(2), 75-79.
Lucas, R. E., Clark, A. E., Georgellis, Y., & Diener, E. (2003). Reexamining adaptation and the set point model of happi-ness: reactions to changes in marital status. Journal of Personality and Social Psychology, 84(3), 527-539.
Marmot, M. (2005). Social determinants of health inequali-ties. The Lancet, 365(9464), 1099-1104.
Marmot, M., Ryff, C. D., Bumpass, L. L., Shipley, M., & Marks, N. F. (1997). Social inequalities in health: Next questions and converging evidence. Social Science & Medicine, 44(6), 901-910.
Mazar, N., Amir, O., & Ariely, D. (2008). The dishonesty of honest people: A theory of self-concept maintenance. Journal of marketing research, 45(6), 633-644.
Neckerman, K. M., & Torche, F. (2007). Inequality: Causes and consequences. Annual Review of Sociology, 33, 335-357.
Neily, J., Mills, P. D., Young-Xu, Y., Carney, B. T., West, P., Berger, D. H., ... & Bagian, J. P. (2010). Association between implementation of a medical team training program and surgical mortality. Jama, 304(15), 1693-1700.
OECD (2001). The Well-Being of Nations: The Role of Human and Social Capital. Education and Skills. Organisation for Economic Cooperation and Development, 2 rue Andre Pascal, F-75775 Paris Cedex 16, France.
OECD. (2013). OECD guidelines on measuring subjective well-being. Paris: OECD Publishing.
OECD (2015). In it together: Why less inequality benefits all. Paris: OECD Publishing. DOI: http://dx.doi.org/10.1787/9789264235120-en.
Ostrom, E. (2000). Collective Action and the Evolution of Social Norms. Journal of Economic Perspectives, 14(3), 137-158.
Ott, J. C. (2010). Good governance and happiness in nations: Technical quality precedes democracy and quality beats size. Journal of Happiness Studies, 11(3), 353-368.
Piketty, T. (2014). Capital in the 21st Century. Cambridge: Harvard University Press.
Putnam, R. D. (2001). Bowling alone: The collapse and revival of American community. Simon and Schuster.
W O R L D H A P P I N E S S R E P O R T 2 0 1 7
47
Ren, Q., & Ye, M. (2016). Donations make people happier: Evidence from the Wenchuan earthquake. Social Indicators Research, 1-20.
Ricard, M. (2015). Altruism: The power of compassion to change yourself and the world. Atlantic Books Ltd.
Rosengren, A., Orth-Gomer, K., Wedel, H., & Wilhelmsen, L. (1993). Stressful life events, social support, and mortality in men born in 1933. BMJ: British Medical Journal, 307(6912), 1102.
Rothstein, B., & Uslaner, E. M. (2005). All for all: Equality, corruption, and social trust. World Politics, 58(1), 41-72.
Russ, S., Rout, S., Sevdalis, N., Moorthy, K., Darzi, A., & Vincent, C. (2013). Do safety checklists improve teamwork and communication in the operating room? A systematic review. Annals of surgery, 258(6), 856-871.
Ryan, R. M., Bernstein, J. H., & Brown, K. W. (2010). Weekends, work, and well-being: Psychological need satisfac-tions and day of the week effects on mood, vitality, and physical symptoms. Journal of Social and Clinical Psychology, 29(1), 95-122.
Rydenfält, C., Johansson, G., Odenrick, P., Åkerman, K., & Larsson, P. A. (2013). Compliance with the WHO Surgical Safety Checklist: deviations and possible improvements. International Journal for Quality in Health Care, 25(2), 182-187.
Ryff, C. D., & Singer, B. H. (2008). Know thyself and become what you are: A eudaimonic approach to psychological well-being. Journal of Happiness Studies, 9(1), 13-39.
Shultz, S., & Dunbar, R. I.M. (2007). The evolution of the social brain: anthropoid primates contrast with other verte-brates. Proceedings of the Royal Society of London B: Biological Sciences, 274(1624), 2429-2436.
Schwartz, C. E., & Sendor, R. M. (1999). Helping others helps oneself: response shift effects in peer support. Social science & medicine, 48(11), 1563-1575.
Solow, R. M. (2000). Notes on social capital and economic performance. Social capital: A multifaceted perspective, 6(10).
Steffens, N. K., Jetten, J., Haslam, C., Cruwys, T., & Haslam, S. A. (2016). Multiple Social Identities Enhance Health Post-Retirement Because They Are a Basis for Giving Social Support. Frontiers in Psychology, 7.
Stiglitz, J., Sen, A., & Fitoussi, J. P. (2009). The measurement of economic performance and social progress revisited: Reflections and overview. Paris: Commission on the Measurement of Economic Performance and Social Progress.
Stone, A. A., Schneider, S., & Harter, J. K. (2012). Day-of-week mood patterns in the United States: On the existence of ‘Blue Monday’, ‘Thank God it’s Friday’ and weekend effects. Journal of Positive Psychology, 7(4), 306-314.
Theurer, K., & Wister, A. (2010). Altruistic behaviour and social capital as predictors of well-being among older Canadi-ans. Ageing and Society, 30(1), 157.
Theurer, K., Mortenson, W. B., Stone, R., Suto, M., Timonen, V., & Rozanova, J. (2015). The need for a social revolution in residential care. Journal of aging studies, 35, 201-210.
Thomas, P. A. (2009). Is it better to give or to receive? Social support and the well-being of older adults. The Journals of Gerontology Series B: Psychological Sciences and Social Sciences, 65B(3):351-357. .
Uchida, Y., Takahashi, Y., & Kawahara, K. (2014). Changes in hedonic and eudaimonic well-being after a severe nationwide disaster: The case of the Great East Japan Earthquake. Journal of Happiness Studies, 15(1), 207-221.
Urbach, D. R., Govindarajan, A., Saskin, R., Wilton, A. S., & Baxter, N. N. (2014). Introduction of surgical safety checklists in Ontario, Canada. New England Journal of Medicine, 370(11), 1029-1038.
Walker, I. A., Reshamwalla, S., & Wilson, I. H. (2012). Surgical safety checklists: do they improve outcomes?. British Journal of Anaesthesia, aes175.
Weiss, A., King, J. E., Inoue-Murayama, M., Matsuzawa, T., & Oswald, A. J. (2012). Evidence for a midlife crisis in great apes consistent with the U-shape in human well-being. Proceedings of the National Academy of Sciences, 109(49), 19949-19952.
Weinstein, N., & Ryan, R. M. (2010). When helping helps: autonomous motivation for prosocial behavior and its influence on well-being for the helper and recipient. Journal of personality and social psychology, 98(2), 222.
Wilkinson, R. G., & Marmot, M. G. (2003). Social determinants of health: the solid facts. World Health Organization.
Willms, J. D. (2003). Literacy proficiency of youth: Evidence of converging socioeconomic gradients. International Journal of Educational Research, 39(3), 247-252.
Yamamura, E., Tsutsui, Y., Yamane, C., Yamane, S., & Powdthavee, N. (2015). Trust and happiness: Comparative study before and after the Great East Japan Earthquake. Social Indicators Research, 123(3), 1-17.
Yap, S. C., Anusic, I., & Lucas, R. E. (2012). Does personality moderate reaction and adaptation to major life events? Evidence from the British Household Panel Survey. Journal of Research in Personality, 46(5), 477-488.
Zak, P. J., & Knack, S. (2001). Trust and growth. The Economic Journal, 111(470), 295-321.