the social policy and development centre (spdc)spdc.org.pk/data/publication/pdf/rr-94-growth and...
TRANSCRIPT
The Social Policy and Development Centre (SPDC) Established in 1995, the Social Policy and Development Centre
(SPDC), a non-profit research think tank, has made a significant
intellectual contribution in placing issues of pro-poor growth and
social development on Pakistan's policy-making agenda. With a
focus on development, poverty, inequality, governance, social sector
policies, climate, gender issues and pro-poor macro-economic
policy, it contributes to the national goal of social development
through research, policy advice, and advocacy. The Centre also
collaborates and cooperates with organizations working on issues
relevant to its mandate both at home and abroad and is a partner
with several national and international networks on social and
economic issues. Determining its own agenda, SPDC has
successfully maintained a balance between responsive and
proactive social sector research.
Research Report No.94
Growth and Income Inequality Effects on Poverty:
The Case of Pakistan (1988 – 2011)
Haroon Jamal
January, 2015
DISCLAIMER: The views expressed in this research report are those of the author and do not necessarily represent those of the Social Policy and Development Centre (SPDC). Research Reports describe research in progress by the author and are published to elicit comments and initiate further debate.

Growth and Income Inequality Effects on Poverty: The Case of Pakistan
(1988-2011)
ABSTRACT
This research assesses the distributional characteristics of growth in
Pakistan by applying statistical techniques suggested in the empirical
literature on poverty and income inequality. An attempt is also made to
determine the relative contribution of economic growth and distribution of
income to changes in poverty.
Various episodes of growth are considered during the period 1988-2011.
The findings of the research will facilitate policy makers to evaluate growth
strategies in terms of pro-poorness or growth with equity.
JEL Classification: I32, D31, D63 Keywords: Poverty Decomposition, Income Inequality,
Pro-Poor Growth, Pakistan

TABLE OF CONTENTS Pages ABSTRACT ................................................................................................................. I
1. INTRODUCTION ...................................................................................................... 1
2. POVERTY AND INEQUALITY PROFILE ....................................................................... 3
2.1 Poverty Measurement ......................................................................3 2.2 Poverty Estimates ............................................................................6 2.3 Profile of Income Inequality ..............................................................7 3. POVERTY-GROWTH-INEQUALITY NEXUS ................................................................. 9
4. ASSESSING PRO-POORNESS OF SELECTED GROWTH EPISODES ............................ 11
5. CONCLUDING REMARKS....................................................................................... 15 REFERENCES .............................................................................................................. 16 APPENDIX A: POVERTY DECOMPOSITION METHODOLOGY ................................................. 19
APPENDIX B: METHODOLOGY FOR MEASURING PRO-POOR GROWTH ................................ 20
APPENDIX C: ASSESSMENT OF PRO-POOR GROWTH – PAKISTAN’S EMPIRICS .................... 23 LIST OF FIGURES AND TABLES:
Figure 1: National and Regional Poverty Estimates ........................................................ 6
Figure 2: Poverty and GDP ............................................................................................. 7
Figure 3: Poverty, Inequality and Growth [1987-88 to 2010-11] ....................................... 9
Figure 4: Per Capita Distributionally Corrected Consumption Growth [1987-1988 to 1998-1999] .............................................................................. 14
Figure 5: Per Capita Distributionally Corrected Consumption Growth [2000-2001 to 2004-2005] ............................................................................. 14
Table 1: Per Capita Income Inequality ............................................................................. 8
Table 2: Decomposition of Poverty Incidence ................................................................. 10
Table 3: Pro-Poorness Assessment in Low and High Growth Episodes .......................... 14

1
Research Report No.94 Growth and Income Inequality Effects on Poverty: The Case of Pakistan - (1988-2011)
1. INTRODUCTION
During the last three decades, vast literature on the relationship between growth, poverty and income distribution has flourished. Empirical studies have investigated causality and links from growth to poverty, from growth to inequality, from inequality to growth or from inequality to poverty. The development literature in the 1990s suggested that growth is central to any strategy aimed at poverty reduction. Empirical studies concluded that countries that made noticeable progress on poverty reduction were those which recorded fast and high growth rates. However, this view was modified after empirical investigation and it was suggested that it is not growth per se, but the structure of growth that matters (Ravallion and Datt, 1996, Mellor 1999)1. The ‘primacy of growth’ paradigm assumes a trade-off between growth and equity. Based on initial research findings, it was maintained that distribution policies give rise to distortions in the economy resulting in inefficiencies that may be substantial enough to adversely affect the overall well-being of society. It is also argued that inequality within a country is stable over time and changes too slowly to make a significant difference in poverty reduction. The conclusion drawn is that growth must precede distribution, and that the poor will pay the price of growth in terms of inequality and poverty until such time that growth builds up a 'reservoir' of wealth and its benefits trickle down in sufficient measure to reduce poverty (SPDC, 2004). The contention of a positive relationship between inequality and growth has been questioned in the empirical evidence based on rigorous testing of cross-country data. For instance, Knowles (2001) reconfirms the negative effects of inequality on growth using updated and more comparable inequality data. The emerging consensus now is that inequality is harmful for growth; although disagreement exists on the underlying mechanisms. There are at least three main arguments in support of a negative effect of inequality on growth. These routes or mechanisms have been summarised in Perotti (1996). The first argument is that an unequal distribution of income will lead to pressure for redistribution through higher government expenditure and distortionary taxes leading to a reduction in the growth rate. The second argument is that inequality may lead to
1 This version or modification is very much similar to the recent literature on the inclusiveness of growth.
2
Growth and Income Inequality Effects on Poverty: The Case of Pakistan - (1988-2011) Research Report No.94
socio-political instability, which in turn will reduce investment and growth. The third argument is that in the presence of imperfect capital markets, inequality will reduce investment in human capital and this will also in turn reduce growth. While empirical evidence predominantly suggests that inequality is bad for growth (Naschold, 2002), it is reasoned that there does not exist an unavoidable trade-off between growth and equity. The World Development Report (2000/01) concludes that better distribution is possible without a reduction in economic growth. Given that there is no trade-off per se between growth and equality, it follows that distribution can be pursued as an additional policy objective to enhance the poverty reducing effect of growth. The removal or correction of the various anti-poor institutional constraints and policy-induced biases is likely to actually improve market efficiency while promoting equity. For instance, social policy ensuring adequate provision of education and health services to the poor can improve their productivity and contribution to the economy. Therefore, the conclusion drawn is that poverty reduction is not a function of high or low growth but rather of distribution sensitive growth (Naschold, 2002). Although there is plenty of evidence suggesting that the combination of growth and distribution is essential for poverty reduction (e.g., Deininger-Squire 1998; Foster and Szekely 2001; Ravallion 2002; Krayy 2004), Bourguignon (2004) has redirected attention from the growth-distribution debate to the interaction between growth and distribution in reducing absolute poverty. He suggested a poverty-growth-inequality triangle hypothesis that is based on the idea that development strategy should be guided by the goal of reducing absolute poverty, which can be achieved by implementing country-specific combination of growth and distribution policies. This research contributes to the debate by assessing the distributional characteristics of growth in Pakistan. Statistical techniques suggested in the empirical literature on redistribution and growth are applied to analyse the historical relationship between growth, poverty and inequality. It also quantifies the relative role of income distribution in Pakistan’s poverty reduction. Section 2 describes the situation analysis in terms of trends in poverty and inequality during the period 1987-88 to 2010-11. The analysis of poverty decomposition into growth and income distribution components is provided in section 3, while the subsequent section evaluates Pakistan’s growth with respect to its ‘pro-poorness’. The last section summarises the research findings.
3
Research Report No.94 Growth and Income Inequality Effects on Poverty: The Case of Pakistan - (1988-2011)
2. POVERTY AND INEQUALITY PROFILE This section furnishes poverty and inequality estimates derived from various household surveys during the period 1987-88 and 2010-11. Issues in poverty measurement are also discussed briefly to comprehend the problems and variations in deriving the poverty line from household consumption data. 2.1 Poverty Measurement Among the various approaches of defining monetary2 (income/consumption) or traditional poverty, ‘calorific approach’ is the most popular in developing countries due to its practicality. In almost all studies of poverty in LDCs including Pakistan, the poverty level is defined in terms of food inadequacy which is typically measured by the lack of nutritional (calorie) requirements. Correspondingly, the Government of Pakistan adopted this approach for estimating the official poverty line. According to the Poverty Reduction Strategy Paper (PRSP-I, GOP, 2003), the Planning Commission provided the following definition for estimating the poverty line. “Calorific requirement approach wherein all those households (or individuals) are classified as poor who do not have income sufficient to allow a consumption pattern consistent with minimum calorie requirements (2350 calories per adult equivalent per day). It is also assumed that the households earning incomes equivalent to poverty line not only have sufficient food to meet the minimum nutrition requirements but also the non-food requirements”. Poverty can then be used to define the poor by total (food and non-food) expenditure failing short of the poverty line by the average dietary pattern the expenditure would translate into fewer calories than required. To estimate the poverty line, the first step is to translate household food consumption into calories. Food Consumption Tables for Pakistan (GoP, 2001) facilitates this conversion. Moreover, the recommended daily allowances for the Pakistani population for various age and sex composition are also provided in the Food Consumption Tables. These minimum requirements are matched
2 The assessment of non-income and multidimensional poverty is also important for policy and planning.
However, it is worth highlighting that consumption or income poverty measures only advocate the case for transfer policies and social safety-nets that alleviate poverty in the short-term, whereas multidimensional (education, health, housing etc.) measures facilitate policy makers in designing socio-economic policies that could alleviate the intergenerational poverty in the long-term.
4
Growth and Income Inequality Effects on Poverty: The Case of Pakistan - (1988-2011) Research Report No.94
with household demography (sex and age of members) to estimate adult equivalent unit (AEU) for each household. Now, to get the estimates of household expenditure required to obtain the minimum required calories, the Calorie-Consumption Function (CCF) is estimated. The poverty line is then computed by combining calorie norms (minimum required calories) and estimated coefficients of the CCF. This author also adopts the calorific approach defined above to estimate the poverty indices in Pakistan, however, with slight modifications3. The major deviations with the official methodology are as follows:
The Government of Pakistan does not estimate separate urban and rural poverty lines. The rural lifestyle in general requires a greater consumption of calories than the urban lifestyle. It is not irrational to assume that for any given level of income, rural households are likely to consume more calories, on average, than their urban counterparts. Thus, poverty estimates derived from official methodology using a unique poverty line for both urban and rural households underestimate rural poverty and overestimate urban poverty.
This study, therefore, considers separate calorie requirement and follows the 2,550 and 2,230 calories per day per adult as calorie norms4 (minimum requirement) for rural and urban areas, respectively.
The official methodology uses first three per adult equivalent consumption
quintiles (60 percent) to estimate the CCF by arguing that the consumption pattern of the rich does not affect the determination of the poverty line. This is, however, against the popular perception of magnitude of poverty in Pakistan.
This study estimates the CCF from the lowest quartile (25 percent) of distribution after ranking households by per capita expenditure to reflect the average dietary pattern of only low income group in the estimation of the poverty line.
To monitor the poverty level or to estimate inter-temporal changes in the poverty magnitude, the poverty line for the latest survey year may either be updated by utilising previous estimated poverty line after adjusting with some appropriate index of inflation or it may be re-estimated with the help of new available consumption data.
3 For detail, see Jamal (2002, 2006, 2007 and 2013). 4 The justifications of taking these norms are described in Jamal (2002).
5
Research Report No.94 Growth and Income Inequality Effects on Poverty: The Case of Pakistan - (1988-2011)
The Government of Pakistan adjusts the previous poverty line with the inflation index to estimate the new level of poverty. To estimate official poverty estimates, two price indices are considered: Consumer Price Index (CPI) and the survey based price index (Tornqvist Price Index, TPI). There are many criticisms on using the Consumer Price Index (CPI) for updating the previous poverty line due to its very low geographical coverage. The CPI only covers major urban centres for tracking inflation and ignores price movement in rural areas and small urban locations. As an alternative, therefore, the survey based price index (TPI) is suggested. However, it is not a problem-free option, since the TPI can only incorporate homogenous goods like specific food items. Further, the household survey does not report the consumption of non-food quantities and provides only expenditures. These complications make the TPI an inappropriate measure of inflation. The extent of adjustment in the TPI can be ascertained from the fact that the TPI includes only 75 items, whereas the CPI includes more than 400 items. On the other hand, re-estimation of the poverty line is also criticised on the ground that for monitoring and tracking poverty numbers, the bundle of goods and services should remain the same and one should adjust the magnitude of the poverty line with price movement. However, this criticism does not seem valid if the ‘calorific approach’ is used in deriving the poverty line instead of the ‘basic need approach’5 . With fixed norms, the calorific approach estimates the amount of rupees required to obtain minimum required calories with the observed consumption pattern for the particular year. Thus, in the absence of any appropriate price index for inflating the previous poverty line, it is perhaps reasonable and is also preferred for this research to re-estimate the poverty line from the latest survey to circumvent problems associated with price indices. Specifically to measure the poverty line and poverty estimates, per adult equivalent household calories consumption is regressed on the lowest quintile of household per adult equivalent total expenditure, including value of goods consumed from own production. The provincial dummy variables6 are also included in the regression function to capture the provincial dissimilarities with respect to socio-economic development. The regression coefficient of CCF gives an idea about how many rupees, on average, are required to have one calorie. Rural and urban poverty lines are then computed by
5 See Jamal (2002) for the methodological consideration and choices. 6 It is worth mentioning that provincial dummy variables are not included in the calorie-expenditure
regression function for estimating poverty line in the official (Government of Pakistan) methodology.
6
Growth and Income Inequality Effects on Poverty: The Case of Pakistan - (1988-2011) Research Report No.94
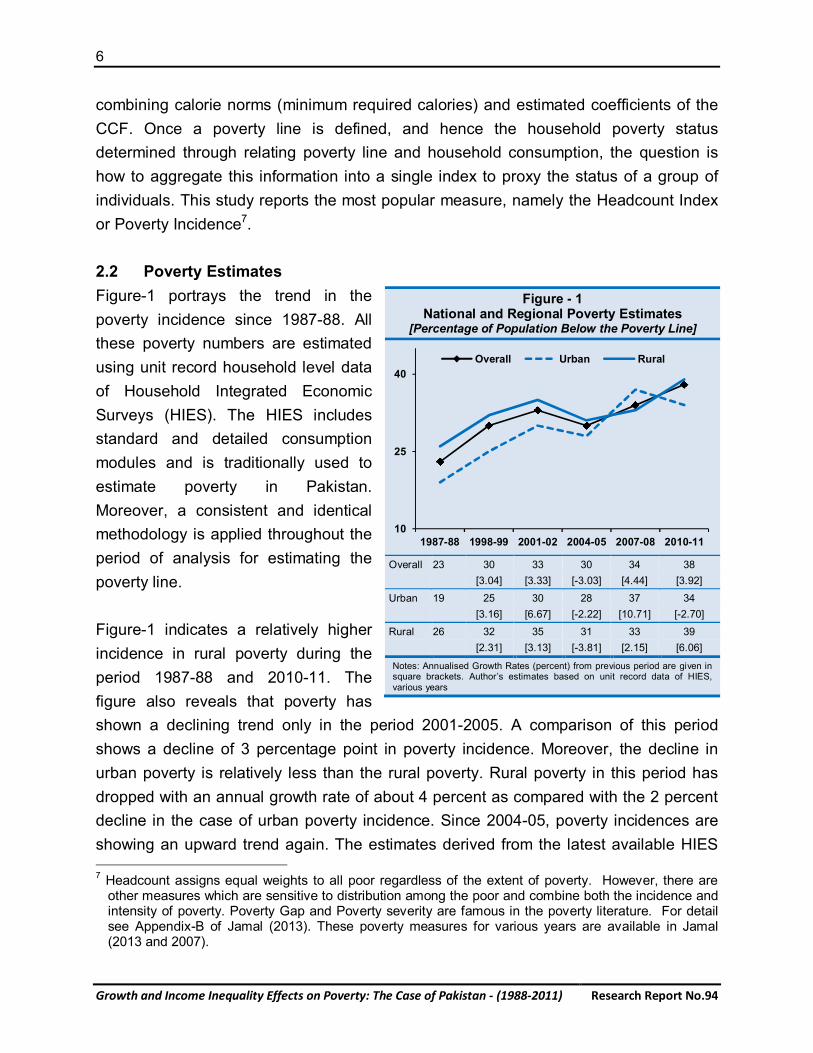
combining calorie norms (minimum required calories) and estimated coefficients of the CCF. Once a poverty line is defined, and hence the household poverty status determined through relating poverty line and household consumption, the question is how to aggregate this information into a single index to proxy the status of a group of individuals. This study reports the most popular measure, namely the Headcount Index or Poverty Incidence7. 2.2 Poverty Estimates Figure-1 portrays the trend in the poverty incidence since 1987-88. All these poverty numbers are estimated using unit record household level data of Household Integrated Economic Surveys (HIES). The HIES includes standard and detailed consumption modules and is traditionally used to estimate poverty in Pakistan. Moreover, a consistent and identical methodology is applied throughout the period of analysis for estimating the poverty line. Figure-1 indicates a relatively higher incidence in rural poverty during the period 1987-88 and 2010-11. The figure also reveals that poverty has shown a declining trend only in the period 2001-2005. A comparison of this period shows a decline of 3 percentage point in poverty incidence. Moreover, the decline in urban poverty is relatively less than the rural poverty. Rural poverty in this period has dropped with an annual growth rate of about 4 percent as compared with the 2 percent decline in the case of urban poverty incidence. Since 2004-05, poverty incidences are showing an upward trend again. The estimates derived from the latest available HIES 7 Headcount assigns equal weights to all poor regardless of the extent of poverty. However, there are
other measures which are sensitive to distribution among the poor and combine both the incidence and intensity of poverty. Poverty Gap and Poverty severity are famous in the poverty literature. For detail see Appendix-B of Jamal (2013). These poverty measures for various years are available in Jamal (2013 and 2007).
Figure - 1 National and Regional Poverty Estimates
[Percentage of Population Below the Poverty Line]
10
25
40
1987-88 1998-99 2001-02 2004-05 2007-08 2010-11
Overall Urban Rural
Overall 23 30 33 30 34 38
[3.04] [3.33] [-3.03] [4.44] [3.92]
Urban 19 25 30 28 37 34 [3.16] [6.67] [-2.22] [10.71] [-2.70]
Rural 26 32 35 31 33 39 [2.31] [3.13] [-3.81] [2.15] [6.06]
Notes: Annualised Growth Rates (percent) from previous period are given in square brackets. Author’s estimates based on unit record data of HIES, various years
7
Research Report No.94 Growth and Income Inequality Effects on Poverty: The Case of Pakistan - (1988-2011)
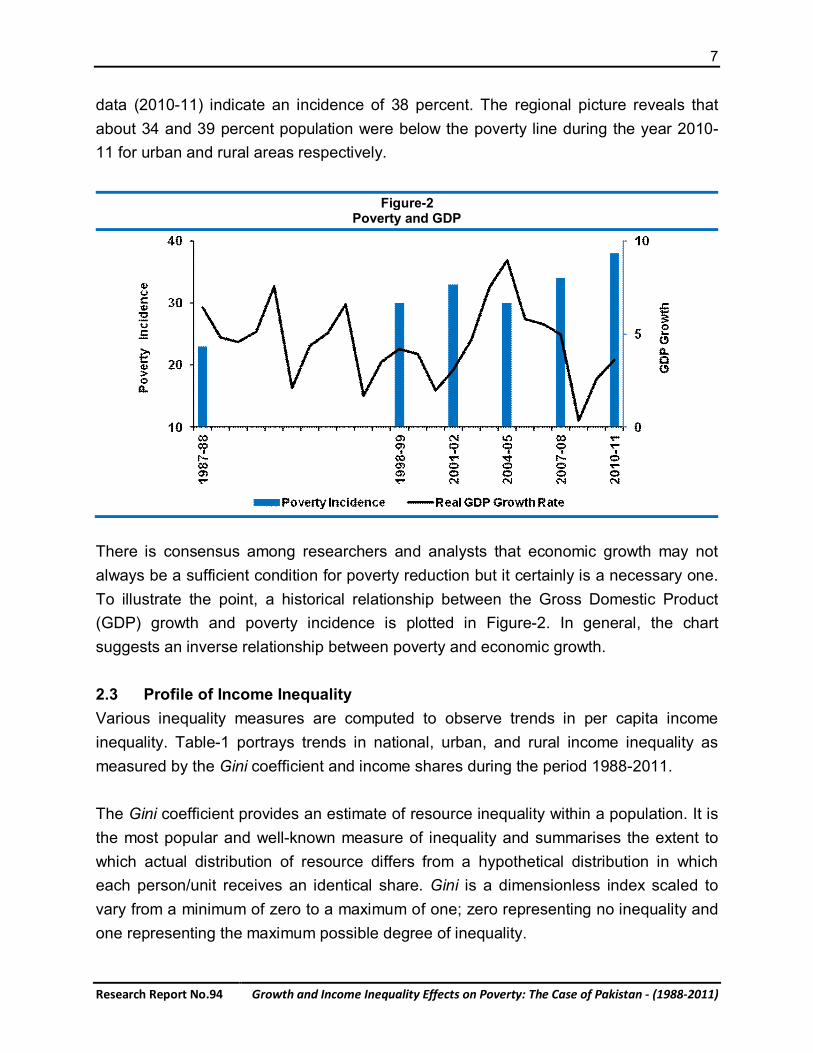
data (2010-11) indicate an incidence of 38 percent. The regional picture reveals that about 34 and 39 percent population were below the poverty line during the year 2010-11 for urban and rural areas respectively.
Figure-2 Poverty and GDP
There is consensus among researchers and analysts that economic growth may not always be a sufficient condition for poverty reduction but it certainly is a necessary one. To illustrate the point, a historical relationship between the Gross Domestic Product (GDP) growth and poverty incidence is plotted in Figure-2. In general, the chart suggests an inverse relationship between poverty and economic growth. 2.3 Profile of Income Inequality Various inequality measures are computed to observe trends in per capita income inequality. Table-1 portrays trends in national, urban, and rural income inequality as measured by the Gini coefficient and income shares during the period 1988-2011. The Gini coefficient provides an estimate of resource inequality within a population. It is the most popular and well-known measure of inequality and summarises the extent to which actual distribution of resource differs from a hypothetical distribution in which each person/unit receives an identical share. Gini is a dimensionless index scaled to vary from a minimum of zero to a maximum of one; zero representing no inequality and one representing the maximum possible degree of inequality.
8
Growth and Income Inequality Effects on Poverty: The Case of Pakistan - (1988-2011) Research Report No.94
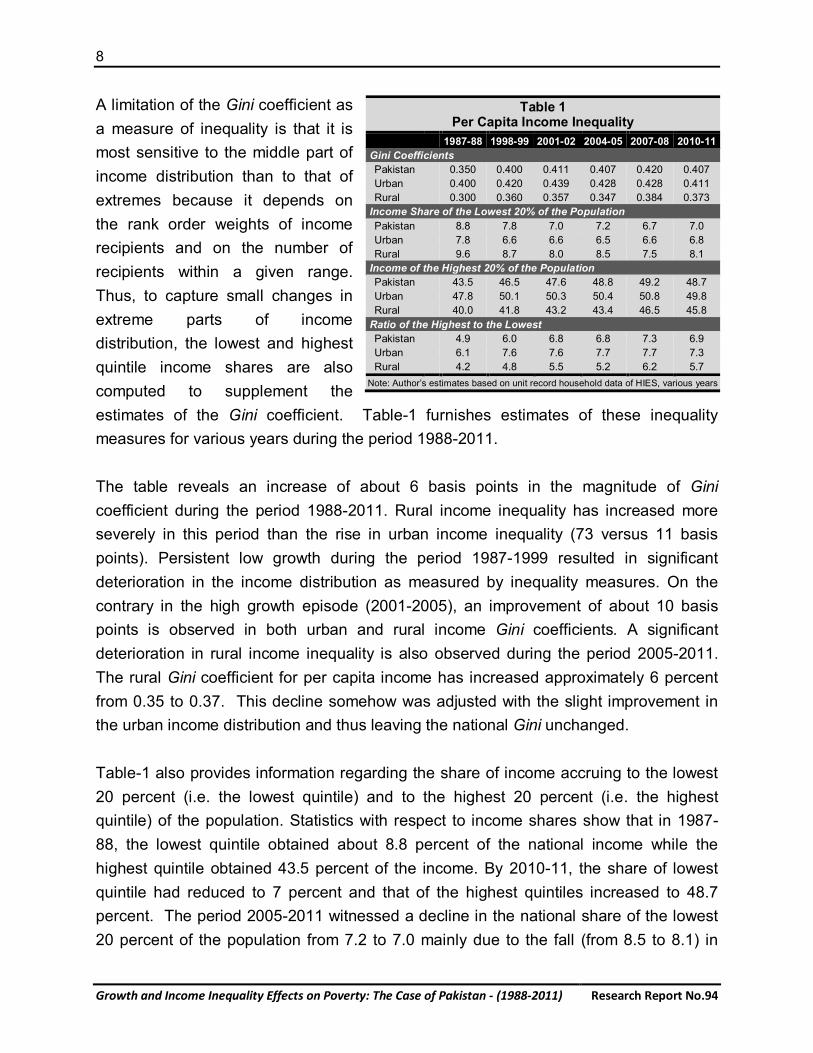
A limitation of the Gini coefficient as a measure of inequality is that it is most sensitive to the middle part of income distribution than to that of extremes because it depends on the rank order weights of income recipients and on the number of recipients within a given range. Thus, to capture small changes in extreme parts of income distribution, the lowest and highest quintile income shares are also computed to supplement the estimates of the Gini coefficient. Table-1 furnishes estimates of these inequality measures for various years during the period 1988-2011. The table reveals an increase of about 6 basis points in the magnitude of Gini coefficient during the period 1988-2011. Rural income inequality has increased more severely in this period than the rise in urban income inequality (73 versus 11 basis points). Persistent low growth during the period 1987-1999 resulted in significant deterioration in the income distribution as measured by inequality measures. On the contrary in the high growth episode (2001-2005), an improvement of about 10 basis points is observed in both urban and rural income Gini coefficients. A significant deterioration in rural income inequality is also observed during the period 2005-2011. The rural Gini coefficient for per capita income has increased approximately 6 percent from 0.35 to 0.37. This decline somehow was adjusted with the slight improvement in the urban income distribution and thus leaving the national Gini unchanged. Table-1 also provides information regarding the share of income accruing to the lowest 20 percent (i.e. the lowest quintile) and to the highest 20 percent (i.e. the highest quintile) of the population. Statistics with respect to income shares show that in 1987-88, the lowest quintile obtained about 8.8 percent of the national income while the highest quintile obtained 43.5 percent of the income. By 2010-11, the share of lowest quintile had reduced to 7 percent and that of the highest quintiles increased to 48.7 percent. The period 2005-2011 witnessed a decline in the national share of the lowest 20 percent of the population from 7.2 to 7.0 mainly due to the fall (from 8.5 to 8.1) in
Table 1 Per Capita Income Inequality
1987-88 1998-99 2001-02 2004-05 2007-08 2010-11 Gini Coefficients Pakistan 0.350 0.400 0.411 0.407 0.420 0.407 Urban 0.400 0.420 0.439 0.428 0.428 0.411 Rural 0.300 0.360 0.357 0.347 0.384 0.373
Income Share of the Lowest 20% of the Population Pakistan 8.8 7.8 7.0 7.2 6.7 7.0 Urban 7.8 6.6 6.6 6.5 6.6 6.8 Rural 9.6 8.7 8.0 8.5 7.5 8.1
Income of the Highest 20% of the Population Pakistan 43.5 46.5 47.6 48.8 49.2 48.7 Urban 47.8 50.1 50.3 50.4 50.8 49.8 Rural 40.0 41.8 43.2 43.4 46.5 45.8
Ratio of the Highest to the Lowest Pakistan 4.9 6.0 6.8 6.8 7.3 6.9 Urban 6.1 7.6 7.6 7.7 7.7 7.3 Rural 4.2 4.8 5.5 5.2 6.2 5.7
Note: Author’s estimates based on unit record household data of HIES, various years
9
Research Report No.94 Growth and Income Inequality Effects on Poverty: The Case of Pakistan - (1988-2011)
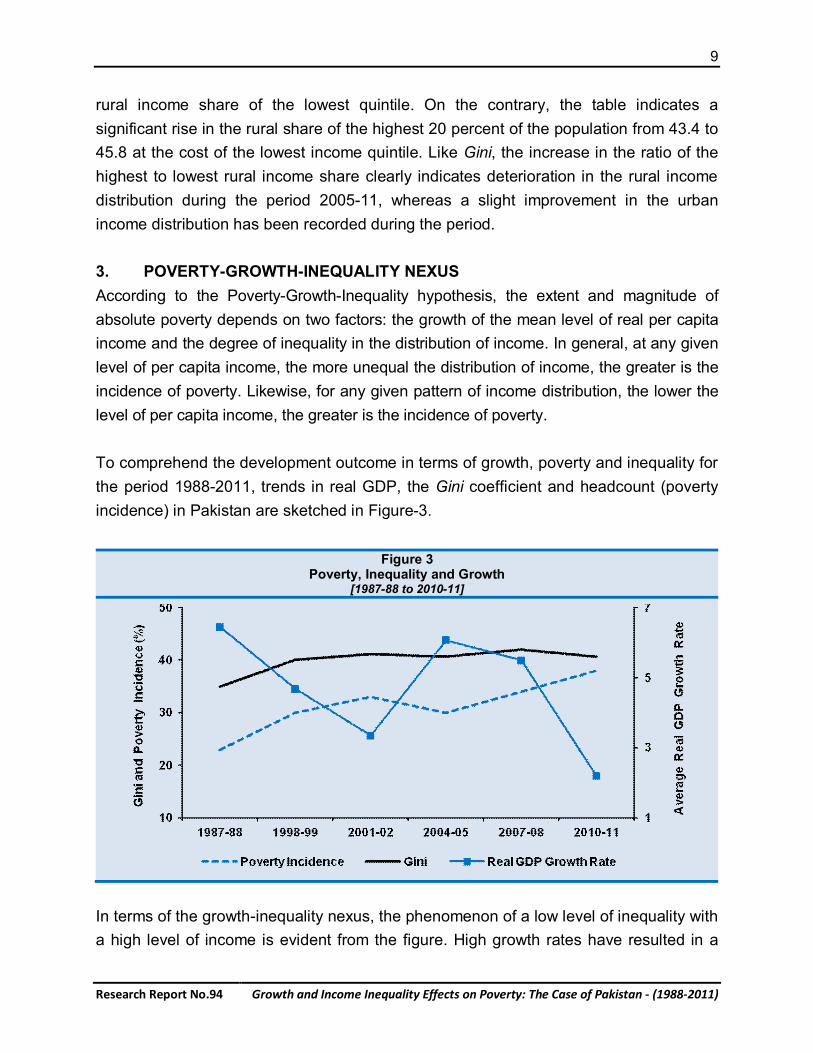
rural income share of the lowest quintile. On the contrary, the table indicates a significant rise in the rural share of the highest 20 percent of the population from 43.4 to 45.8 at the cost of the lowest income quintile. Like Gini, the increase in the ratio of the highest to lowest rural income share clearly indicates deterioration in the rural income distribution during the period 2005-11, whereas a slight improvement in the urban income distribution has been recorded during the period. 3. POVERTY-GROWTH-INEQUALITY NEXUS According to the Poverty-Growth-Inequality hypothesis, the extent and magnitude of absolute poverty depends on two factors: the growth of the mean level of real per capita income and the degree of inequality in the distribution of income. In general, at any given level of per capita income, the more unequal the distribution of income, the greater is the incidence of poverty. Likewise, for any given pattern of income distribution, the lower the level of per capita income, the greater is the incidence of poverty. To comprehend the development outcome in terms of growth, poverty and inequality for the period 1988-2011, trends in real GDP, the Gini coefficient and headcount (poverty incidence) in Pakistan are sketched in Figure-3.
Figure 3 Poverty, Inequality and Growth
[1987-88 to 2010-11]
In terms of the growth-inequality nexus, the phenomenon of a low level of inequality with a high level of income is evident from the figure. High growth rates have resulted in a
10
Growth and Income Inequality Effects on Poverty: The Case of Pakistan - (1988-2011) Research Report No.94
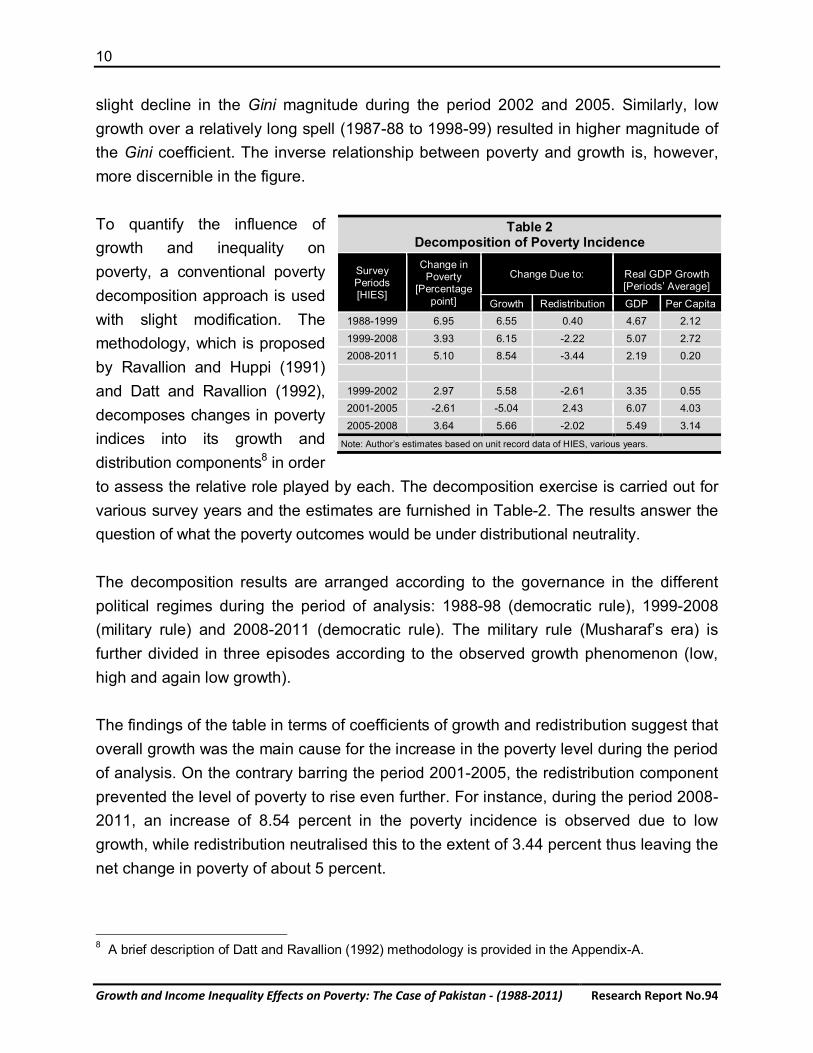
slight decline in the Gini magnitude during the period 2002 and 2005. Similarly, low growth over a relatively long spell (1987-88 to 1998-99) resulted in higher magnitude of the Gini coefficient. The inverse relationship between poverty and growth is, however, more discernible in the figure. To quantify the influence of growth and inequality on poverty, a conventional poverty decomposition approach is used with slight modification. The methodology, which is proposed by Ravallion and Huppi (1991) and Datt and Ravallion (1992), decomposes changes in poverty indices into its growth and distribution components8 in order to assess the relative role played by each. The decomposition exercise is carried out for various survey years and the estimates are furnished in Table-2. The results answer the question of what the poverty outcomes would be under distributional neutrality. The decomposition results are arranged according to the governance in the different political regimes during the period of analysis: 1988-98 (democratic rule), 1999-2008 (military rule) and 2008-2011 (democratic rule). The military rule (Musharaf’s era) is further divided in three episodes according to the observed growth phenomenon (low, high and again low growth). The findings of the table in terms of coefficients of growth and redistribution suggest that overall growth was the main cause for the increase in the poverty level during the period of analysis. On the contrary barring the period 2001-2005, the redistribution component prevented the level of poverty to rise even further. For instance, during the period 2008-2011, an increase of 8.54 percent in the poverty incidence is observed due to low growth, while redistribution neutralised this to the extent of 3.44 percent thus leaving the net change in poverty of about 5 percent.
8 A brief description of Datt and Ravallion (1992) methodology is provided in the Appendix-A.
Table 2 Decomposition of Poverty Incidence
Survey Periods [HIES]
Change in Poverty
[Percentage point]
Change Due to:
Real GDP Growth [Periods’ Average]
Growth Redistribution GDP Per Capita 1988-1999 6.95 6.55 0.40 4.67 2.12
1999-2008 3.93 6.15 -2.22 5.07 2.72 2008-2011 5.10 8.54 -3.44 2.19 0.20
1999-2002 2.97 5.58 -2.61 3.35 0.55 2001-2005 -2.61 -5.04 2.43 6.07 4.03
2005-2008 3.64 5.66 -2.02 5.49 3.14
Note: Author’s estimates based on unit record data of HIES, various years.
11
Research Report No.94 Growth and Income Inequality Effects on Poverty: The Case of Pakistan - (1988-2011)
According to the table, if growth had been distributionally neutral in the 2001-2005 period (high growth period), the incidence of poverty would have declined by 5 percentage points instead of 2.61 percentage points. The evidence clearly reveals that unequal distribution has blunted the impact of growth on poverty. Similarly in a low growth period (1988-98), poverty would have gone up by 6.55 percentage points instead of 6.95 if growth had been distributionally neutral. The magnitudes of decomposition reveal that poverty has risen by almost 94 percent due to low growth and about 6 percent due to the rise in inequality for the period 1988-98. Results in Table-2 also suggest that the role of income distribution is relatively more important in high growth periods as evident from the magnitudes of redistribution component in both scenarios. The positive redistribution component is about 6 times higher in the period 2001-05 as compared with the period 1988-98. 4. ASSESSING PRO-POORNESS OF SELECTED GROWTH EPISODES9 The evaluation of economic growth to analyse whether distributional changes are ‘pro-poor’ has become increasingly widespread in academic and policy circles. The definition of ‘pro-poor growth’, however, is still somewhat arbitrary. International development agencies define pro-poor growth as “growth that benefits the poor and provides them with opportunities to improve their economic situation”. From the measurement point of view, pro-poor growth can refer to either a relative or absolute concept of poverty reduction. Thus, the debate on defining pro-poor growth has very similar characteristics to the debate on how to measure poverty. This is equivalent to asking whether we should be interested in the impact of growth on absolute poverty or on relative inequality. The absolute definition concentrates on the absolute level of growth for the poor. Growth is considered pro-poor if the poor population benefits from it in absolute terms, irrespective of how the total gains are distributed within the country in question. According to Ravallion and Chen (2003), the growth process is said to be ‘pro-poor’ only if poor people benefit in absolute terms. The extent to which growth is pro-poor by this definition depends solely on the rate of change in poverty. However, this will naturally depend in part on what happens to income distribution as well as to average living standards.
9 This section is largely benefited from the author’s previous work, Jamal (2009)
12
Growth and Income Inequality Effects on Poverty: The Case of Pakistan - (1988-2011) Research Report No.94
Ravallion’s absolute perspective of pro-poor growth is identical with the concept of poverty reducing growth and refers to the totality of the growth process. Thus, it advocates the ‘primacy of growth’ paradigm and ’trickle down’ philosophy. According to Ravallion and Chen (2001), it is possible that both the poor and the non-poor see a drastic reduction in income but in relative terms, the income of the poor is less severely affected than that of the non-poor. Under a relative measure, this would mean growth would have been pro-poor even though the poor have seen an absolute decrease in income. They also argue that policy interventions targeted at reducing inequality alone may hurt economic growth and have a net negative effect on society. Moreover, Ravallion and Chen are of the opinion that in operational terms, absolute measures tend to provide assessments that are more easily understood than relative ones. The relative definition, proposed by Kakwani and others, classifies growth as pro-poor when growth implies distributional effects favouring the poor. In other words, when the poor gain from economic growth proportionally more relative to the non-poor, the nature of growth is said to be pro-poor. Thus, the relative perspective stresses the existence of a bias in favour of the poor. According to Kakwani and Pernia (2000), pro-poor growth is described as a situation in which any distributional shifts accompanying economic growth favour the poor, meaning that poverty falls more than it would have if all income levels had grown at the same rate. Kakwani et. al. (2004) argue “The trickle-down development, which was the dominant thinking in the 1950s and 1960s, also reduces poverty but the rate of poverty reduction may be much slower. It is the slowness of poverty reduction that has generated interest in the concept of pro-poor growth. It is now being realised that neither growth itself nor growth-enhancing policies are likely to result in a rapid reduction in poverty. Pro-poor growth raises a call for enhancing growth that also delivers proportionally greater benefits to the poor than to the rich”. Therefore, the relative definition of pro-poorness has been widely used in the literature due to its intuitive appeal, but it also has limitations. As maintained by Ravallion and Chen (2001), concentrating solely on the inequality aspects and disregarding the absolute levels of growth might end up favouring growth strategies that are suboptimal for both the poor and the rich. Osmani (2005) argues that he “find(s) both their definitions problematic”. He suggests identifying a benchmark first that allows gauging of the pro-poorness of growth. ‘Pro-poor growth’ is then defined as a growth process that reduces poverty more than the benchmark.
13
Research Report No.94 Growth and Income Inequality Effects on Poverty: The Case of Pakistan - (1988-2011)
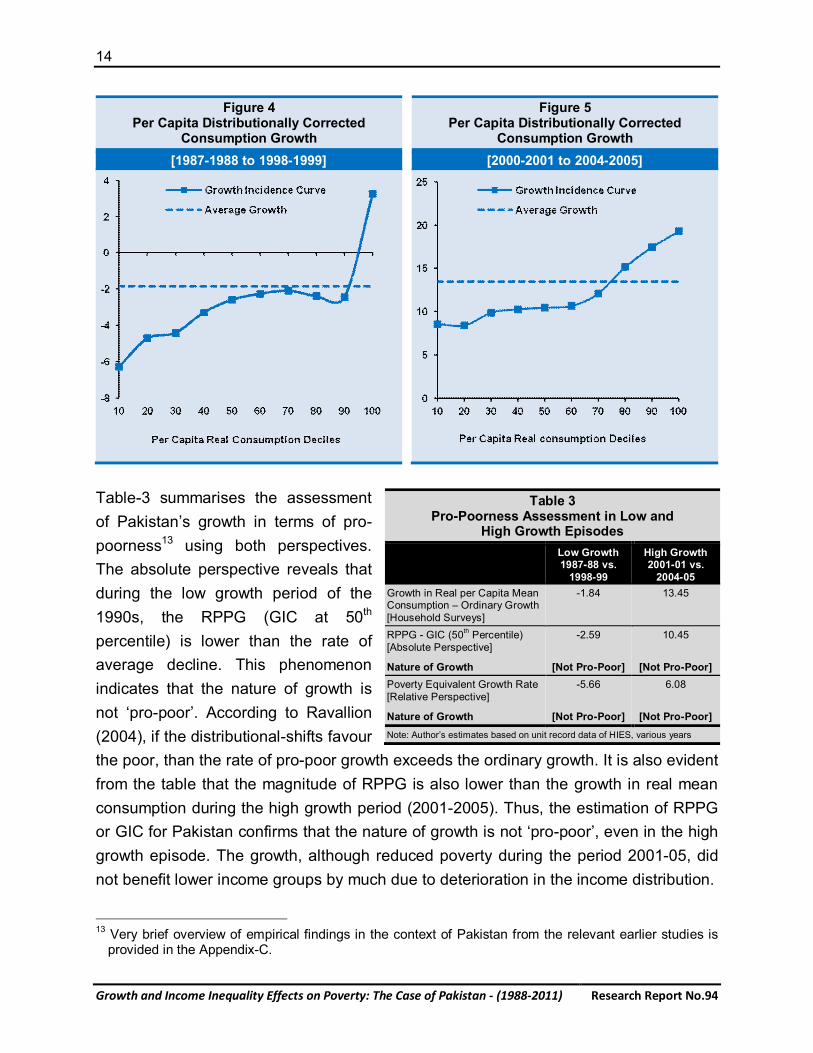
Due to practical difficulties and subjectivity in identifying the benchmark, most of the empirical literature on ‘pro-poorness’, however, has evolved around Ravallion’s absolute and Kakwani’s relative perspective. Both perspectives on pro-poor growth are relevant for designing different policies and routes for poverty reduction. This research evaluates Pakistan’s growth performance in terms of both absolute and relative pro-poorness to combine the strength of both perspectives10. Two growth episodes are selected for this exercise: 1988-1999 (low growth scenario) and 2001-2005 (high growth scenario). In the context of terminology, ‘Rate of Pro-Poor Growth’ (RPPG) or Growth Incidence Curve (GIC) and ‘Poverty Equivalent Growth Rate’ (PEGR) for the absolute and the relative perspectives are used respectively to assess pro-poorness of the growth process. Growth will be assumed to be pro-poor if the average GIC and PEGR are higher than the actual (ordinary) mean growth rate. Figures 4 and 5 are developed to portray a sketch of the absolute pro-poorness of the growth process as measured by the Growth Incidence Curve (GIC)11. These figures plot distribution corrected growth in the average decile consumption12 per capita. A decline in real consumption was observed during low GDP growth period of the 1990s (1987-88 to 1998-99). However, Figure-4 clearly reveals that the poor (bottom deciles) have been more adversely affected as compared with top deciles. Figure-5 summarises growth in mean quintile consumption for the high growth episode (2001-2005). The figure also confirms that relatively high growth in the years 2000-01 and 2004-05 did not go to the poor as much as to the non-poor. It is evident from the figure that the highest growth is observed in the top three deciles. Both figures assert the nature of Pakistan’s growth, which is evidently not ‘pro-poor’.
10 Brief methodologies for measuring absolute and relative pro-poorness of growth are provided in the
Appendix–B. 11 DAD software (version 4.6) is used for estimating GIC curves and RPPG. The software is designed
and developed by Jean-Yves Duclos, Araar Abdelkrim and Cari Fortin of Laval University (Canada). 12 Traditionally in Pakistan, poverty indices are estimated using consumption data. Therefore, growth in
mean decile consumption per capita is plotted instead of mean decile income per capita.
14
Growth and Income Inequality Effects on Poverty: The Case of Pakistan - (1988-2011) Research Report No.94
Figure 4 Per Capita Distributionally Corrected
Consumption Growth
Figure 5 Per Capita Distributionally Corrected
Consumption Growth [1987-1988 to 1998-1999] [2000-2001 to 2004-2005]
Table-3 summarises the assessment of Pakistan’s growth in terms of pro-poorness13 using both perspectives. The absolute perspective reveals that during the low growth period of the 1990s, the RPPG (GIC at 50th percentile) is lower than the rate of average decline. This phenomenon indicates that the nature of growth is not ‘pro-poor’. According to Ravallion (2004), if the distributional-shifts favour the poor, than the rate of pro-poor growth exceeds the ordinary growth. It is also evident from the table that the magnitude of RPPG is also lower than the growth in real mean consumption during the high growth period (2001-2005). Thus, the estimation of RPPG or GIC for Pakistan confirms that the nature of growth is not ‘pro-poor’, even in the high growth episode. The growth, although reduced poverty during the period 2001-05, did not benefit lower income groups by much due to deterioration in the income distribution.
13 Very brief overview of empirical findings in the context of Pakistan from the relevant earlier studies is
provided in the Appendix-C.
Table 3 Pro-Poorness Assessment in Low and
High Growth Episodes Low Growth
1987-88 vs. 1998-99
High Growth 2001-01 vs.
2004-05 Growth in Real per Capita Mean Consumption – Ordinary Growth [Household Surveys]
-1.84 13.45
RPPG - GIC (50th Percentile) [Absolute Perspective]
Nature of Growth
-2.59
[Not Pro-Poor]
10.45
[Not Pro-Poor] Poverty Equivalent Growth Rate [Relative Perspective]
Nature of Growth
-5.66
[Not Pro-Poor]
6.08
[Not Pro-Poor] Note: Author’s estimates based on unit record data of HIES, various years
15
Research Report No.94 Growth and Income Inequality Effects on Poverty: The Case of Pakistan - (1988-2011)
The relative perception of pro-poorness (PEGR), which is more attractive due to giving proportionally more weights to the poor or lower income deciles also asserts that the nature of growth was not in favour of the poor for the growth periods considered in the analysis. PERG is lower than the growth in mean consumption in both growth episodes. This suggests that the non-poor benefitted more than the poor, even in a high growth scenario. 6. CONCLUDING REMARKS This study scrutinizes Pakistan’s empirics on growth, poverty and inequality in terms of poverty decomposition into growth and distribution components and assessment of growth in terms of its distributional neutrality with the help of widely-used statistical tools. Decomposition of poverty into growth and inequality components answers the question of what poverty outcomes would be under distributional neutrality. The results presented in this research suggest that unequal distribution has blunted the poverty impact of growth in a high-growth poverty-reducing episode. The findings in terms of coefficients of growth and redistribution suggest that overall growth was the main cause for the increase in the poverty level during the period of analysis. On the contrary, the redistribution component provided a cushion to prevent poverty to rise even further. Two growth episodes are examined in term of pro-poorness. High economic growth that occurred during the early 2000s led to poverty reduction but was not accompanied by lowering inequality. The evaluation of growth during 2001-2005 suggests that the rich benefited much more than the poor. This eventually resulted in a lower reduction of the poverty incidence. On the contrary, the poor have been more adversely affected during a low growth scenario during the period 1988-98. The estimated results regarding the measurement of pro-poorness of growth suggest that the nature of growth is not pro-poor in Pakistan. Pakistan’s evidence supports the thesis that economic growth alone does not guarantee sustained poverty reduction. The evidence of high growth during the period 2001-2005 in Pakistan clearly indicates that without equity consideration, the benefit of growth may impede the rate of poverty reduction. For ‘pro-poor growth’ to take place, policies must be both pro-growth and pro-equity.
16
Growth and Income Inequality Effects on Poverty: The Case of Pakistan - (1988-2011) Research Report No.94
REFERENCES
Anwar, Talat (2010). Role of Growth and Inequality in Explaining Changes in Poverty in
Pakistan, The Pakistan Development Review 49:1, 1–17. Bourguignon, F. (2004). The Poverty– Growth– Inequality Triangle, Indian Council for
Research on International Economic Relations, New Delhi, Working Paper No. 125 (March).
Datt, G. and M. Ravallion (1992). Growth and Redistribution Components of Changes in
Poverty Measures: A Decomposition with Application to Brazil and India in the 1980s. Journal of Development Economics Vol. (38).
Deninger, K. and L. Squire (1998). New Ways of Looking at Old Issues: Asset Inequality
and Growth. Journal of Development Economics, 57(2): 259-287. Foster, J. and M. Székely (2001). Is Economic Growth Good for the Poor? Tracking Low
Incomes Using General Means. Inter-American Development Bank Research Department Working Paper No. 453.
Government of Pakistan (GOP, 2003). Accelerating Economic Growth and Reducing
Poverty: The Road Ahead, Poverty Reduction Strategy Paper, Poverty Reduction Strategy Paper Secretariat, Ministry of Finance, Government of Pakistan.
Government of Pakistan (GOP, 2001). Food Consumption Table for Pakistan,
Department of Agricultural Chemistry, NWFP Agriculture University, Peshawar. Jamal, Haroon (2002). On the Estimation of an Absolute Poverty Line: An Empirical
Appraisal, The Lahore Journal of Economics, July-December. Jamal Haroon (2006). Does Inequality Matter for Poverty Reduction? Evidence from
Pakistan’s Poverty Trends, Pakistan Development Review, Autumn. Jamal, Haroon. (2007). Updating Poverty and Inequality Estimates: 2005 Panorama,
SPDC Research Report No. 69, Social Policy and Development Centre, Karachi Jamal, Haroon (2009). Growth and Income Distribution for Poverty Reduction:
Pakistan’s Experience, Policy Brief Number 1, UNDP-Pakistan.
17
Research Report No.94 Growth and Income Inequality Effects on Poverty: The Case of Pakistan - (1988-2011)
Jamal, Haroon. (2013). Pakistan Poverty Statistics, Estimates for 2011, SPDC Research Report No. 84, Social Policy and Development Centre, Karachi.
Kakwani, Nanak and E. Pernia, (2000). What Is Pro-Poor Growth? Asian Development
Review. 18(1): 1-16. Kakwani, N.C., S. Khandker and H.H. Son (2004). Pro-poor Growth: Concepts and
Measurement with Country Case Studies. Working Paper Number 2004-1, International Poverty Center, Brazil.
Kraay, A. (2004). When is Growth Pro-Poor? Evidence from a Panel of Countries Policy
Research Working Paper, The World Bank Series No. 3225. Knowles, S. (2001). Inequality and Economic Growth: The Empirical Relationship
Reconsidered in the Light of Comparable Data, Centre for Research in Economic Development and International Trade, CREDIT Research Paper Number 3, University of Nottingham
Mellor, J. B. (1999). The Structure of Growth and Poverty Reduction, (Mimeo) World
Bank, Washington D.C. Osmani Siddiq (2005). Defining Pro-Poor Growth, One Pager, January, Number 9,
International Poverty Centre, Brazil. Omer, M and Sarah Jafri (2008). Pro-Poor Growth in Pakistan: An Assessment Over
the Past Four Decades, South Asia Economic Journal, 9:1 (2008): 51–68 Pasha A. H. and Palanivel T.(2004). Pro-Poor Growth and Policies: The Asian
Experience, Asia-Pacific Regional Programme on the Macroeconomics of Poverty Reduction, United Nations Development Programme.
Perotti, R., (1996). Growth, Income Distribution and Democracy: What the Data Say,
Journal of Economic Growth 1, 149-187. Ravallion, M. and Huppi, M., (1991). Measuring Changes in Poverty: A Methodological
Case Study of Indonesia during an Adjustment Period, The World Bank Economic Review, 5(1).
Ravallion, M. and G. Datt (1996). How Important to India’s Poor is the Sectoral
Composition of Economic Growth? World Bank Economic Review 10, pp. 1-25.
18
Growth and Income Inequality Effects on Poverty: The Case of Pakistan - (1988-2011) Research Report No.94
Ravallion, M. and S. Chen (2001), Measuring Pro-Poor Growth, Policy Research Working Paper No. 2666, World Bank, Washington D.C.
Ravallion, M. (2002). Externalities in Rural Development: Evidence from China. Policy
Research Working Paper, The World Bank, No. 2879. Ravallion, M. and S. Chen (2003). Measuring Pro-Poor Growth, Economics
Letters,78(1). Ravallion, M (2004). Pro-Poor Growth: A Primer, World Bank Policy Research Working
Paper Number 3242, World Bank, Washington DC. Shapley, L. (1953). A Value for n-Person Games, in: H. W. Kuhn and A. W. Tucker,
eds., Contributions to the Theory of Games, Vol. 2, Princeton University Press. Shorrocks, A. F. (1999). Decomposition Procedures for Distributional Analysis: A
Unified Framework Based on Shapley Value, mimeo, Department of Economics, University of Essex.
Son, Hyun Hwa. (2004). A Note on Pro-Poor Growth, Economics Letters, Number (82). SPDC (2004). Social Development in Pakistan: Combating Poverty: Is Growth
Sufficient? Social Policy and Development Centre, Karachi. World Bank (2001). World Development Report (2000/01), Oxford University Press,
New York.
19
Research Report No.94 Growth and Income Inequality Effects on Poverty: The Case of Pakistan - (1988-2011)
APPENDIX A
POVERTY DECOMPOSITION METHODOLOGY The method proposed by Ravallion and Huppi (1991) decomposes the changes in poverty indices (incidence, poverty gap, poverty severity etc.) into its growth and distribution components. Let P* denote the measure of poverty in period 2 in only mean consumption which has changed since period 1 without any change in relative consumption level; that is, P* is obtained by applying the period 2 mean to the period 1 distribution. Similarly, let P** denote the poverty level in period 2 if only the distribution (Lorenz curve) had shifted since period 1, leaving the mean consumption unchanged. In practice, the redistribution component is calculated by multiplying each observation in the period 2 dataset by the ratio of the period 1 to the period 2 mean consumption. The observed change in poverty between the two periods can then be decomposed into growth and distributional effects as follows: Pt2 – Pt1 = (P* – Pt1 ) + (P** – Pt1 ) + Residual
[Growth Effect] + [Distribution Effect] The growth component captures the effect of the changing level of mean expenditure between t1 and t2, while maintaining the t1 distribution. The redistribution component shows the effect of the changes in distribution, while maintaining mean expenditure at its t1 level. This decomposition method however also computes a residual component, which they explain as the interaction of growth and redistribution process. Shorrocks (1999) modified this decomposition method using the concept introduced by Shapley (1953). The advantage of this method is the elimination of the residual component or “black box” that remains unexplained in conventional decomposition techniques. Due to criticism on the residual term, the modified decomposition method proposed by Shorrocks (1999) is used in this paper14.
14 DAD software (version 4.6) is used for decomposing poverty indices. The software is designed and
developed by Jean-Yves Duclos, Araar Abdelkrim and Cari Fortin of Laval University (Canada).
20
Growth and Income Inequality Effects on Poverty: The Case of Pakistan - (1988-2011) Research Report No.94
APPENDIX B METHODOLOGY FOR MEASURING PRO-POOR GROWTH
Absolute Perspective15: The measure of the rate of pro-poor growth proposed by Ravallion and Chen (2003) equals the ordinary rate of growth times a “distributional correction” given by the ratio of the actual change in poverty over time to the change that would have been observed under distribution neutrality. If the distributional shifts favour the poor, then the Rate of Pro-Poor Growth (RPPG) exceeds the ordinary rate of growth. If the shifts go against the poor then it is lower than the ordinary rate of growth. Thus, one can think of the second measure of the rate of pro-poor growth as the first measure times the ordinary rate of growth. For distributional correction component, they proposed to estimate ‘Growth Incidence Curve’ (GIC) which was first used by Ravallion and Chen (2001) in the pro-poor growth concept. The GIC gives rates of growth by percentiles of the distribution of income. Growth Incidence Curve may be derived as follows:
Lt (p) gt (p) = _________ (γt + 1) _1 Lt-1 (p)
where γt = (µt / µt-1) is the growth rate in µt. It is evident from the equation that if the Lorenz curve (L) does not change, then gt(p) = γt for all p. Also gt(p) > γt if and only if γt(p)/µt is increasing over time. If gt(p) is a decreasing (increasing) function for all p then inequality falls (rises) over time for all inequality measures satisfying the Pigou-Dalton transfer principle. If the GIC lies above zero everywhere (gt(p) > 0 for all p), then there is first-order dominance of the distribution at date t over t-1. If the GIC switches sign then one cannot in general infer whether higher-order dominance holds by looking at the GIC alone. At the 50th percentile, the Growth Incidence Curve indicates the growth rate of the median income. Ravallion and Chen (2003) have thus defined the “pro-poor growth rate” as the mean growth rate of the poor. There is clearly a difference between this mean growth rate of the poor and the ordinary growth rate of the mean income or consumption.
15 For detailed methodology see Ravallion and Huppi (1991) and Ravallion and Chen (2001, 2003).
21
Research Report No.94 Growth and Income Inequality Effects on Poverty: The Case of Pakistan - (1988-2011)
Relative Perspective16: The poverty reduction depends on two factors. The first factor is the magnitude of economic growth rate; the larger the growth rate, the greater the poverty reduction. The second factor is the distribution of benefits of growth; if the benefits of growth go more to the poor than to the non-poor, then the poverty reduction will be larger. This implies that the policy of maximising growth alone will not necessarily lead to a maximum reduction in poverty. The idea of “poverty equivalent growth rate” (PEGR) takes into account not only the magnitude of growth but also how much benefits the poor receive from growth. It is demonstrated that the proportional reduction in poverty is a monotonically increasing function of the PEGR; the larger the PEGR, the greater the proportional reduction in poverty. Thus, the maximisation of PEGR will lead to a maximum reduction in poverty. Unit record household data for any two periods is required to estimate the PEGR. The poverty measure θ is fully characterised by the poverty line z, the mean income µ and the Lorenz curve L(p). That is
θ = θ [z, u, L (p)]
Suppose the income distributions in the initial and terminal years have mean income µ1 and µ2 with the Lorenz curves L1(p) and L2(p), respectively. An estimate of total poverty elasticity can be estimated by
δ = {[ ln[θ(z, u2, L2 (p) – ln[θ(z, u1, L1 (p)]} / γ where γ is given by γ = Ln (µ2) – Ln (µ1), which is an estimate of growth rate of mean income. An estimate of PEGR is given by γ* = (δ / η) γ, where δ is an estimate of the growth elasticity of poverty, which should satisfy δ = η + ξ. ξ is an estimate of the inequality effect of poverty reduction. Kakwani’s poverty decomposition methodology can then be used to calculate η and ξ by following formulae:
η = ½ {ln [θ(z, u2, L1 (p))] – ln [θ(z, u1, L1 (p))] + ln [θ(z, u2, L2 (p))] – (ln [θ(z, u1, L2 (p))]}
and
ξ = ½ {ln [θ(z, u1, L2 (p))] – ln [θ(z, u1, L1 (p))] + ln [θ(z, u2, L2 (p))] – ln [θ(z, u2, L1 (p))]}
16 For detailed methodology see Kakwani and Pernia (2000) and Kakwani et al. (2004).
22
Growth and Income Inequality Effects on Poverty: The Case of Pakistan - (1988-2011) Research Report No.94
which will always satisfy [δ = η + ξ]. This methodology can be used to estimate the PEGR for the entire class of poverty measures. The proportional reduction in poverty is equal to δ and γ, which is equal to (η γ*). Since η is always negative (unless µ1 = µ2), the magnitude of poverty reduction will be a monotonically increasing function of γ*; the larger γ*, the greater percentage reduction in poverty between the two periods. Thus, maximising γ* will be equivalent to maximising the percentage reduction in poverty. Growth will be assumed to be pro-poor if the PEGR is higher than the actual growth rate. If the PEGR is positive but smaller than the actual growth rate, it implies that growth is accompanied by an increase in inequality but a reduction in poverty is still observed. In such a case Kakwani et al. (2004) talk about a “trickle down” process where the poor receive proportionally less benefits from growth than the non-poor. Finally, if the PEGR is negative, one has the case where positive economic growth leads to an increase in poverty.
23
Research Report No.94 Growth and Income Inequality Effects on Poverty: The Case of Pakistan - (1988-2011)
APPENDIX C ASSESSMENT OF PRO-POOR GROWTH – PAKISTAN’S EMPIRICS:
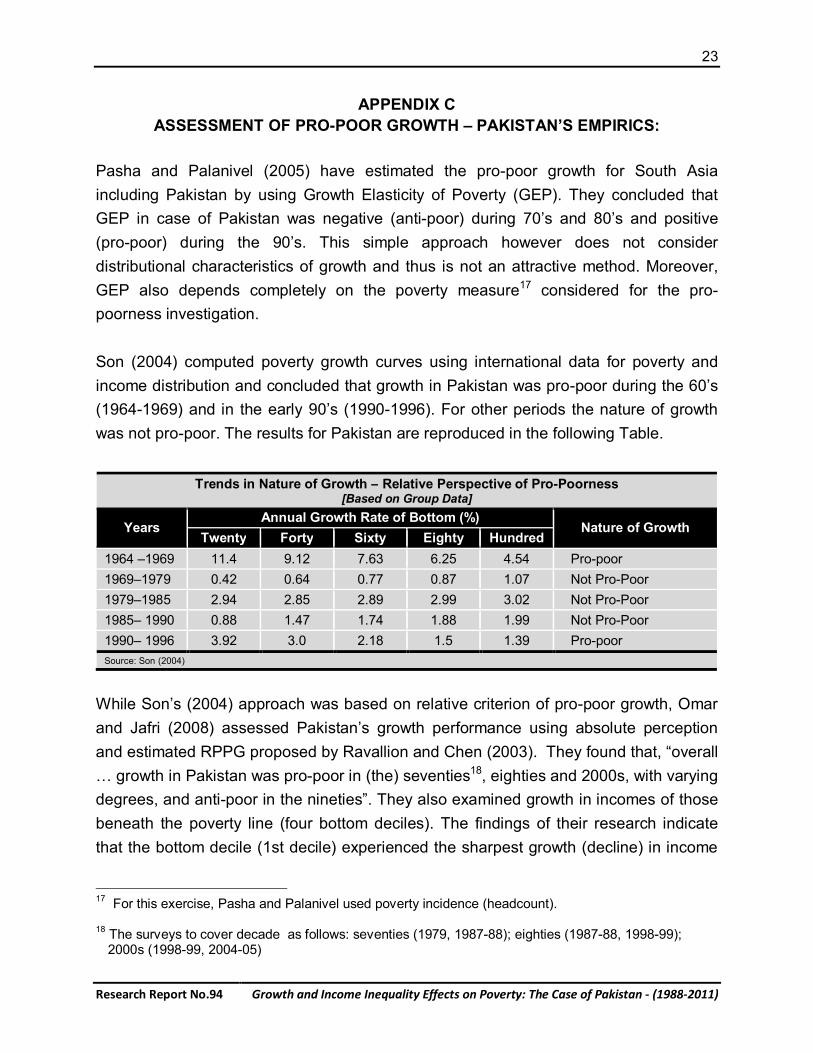
Pasha and Palanivel (2005) have estimated the pro-poor growth for South Asia including Pakistan by using Growth Elasticity of Poverty (GEP). They concluded that GEP in case of Pakistan was negative (anti-poor) during 70’s and 80’s and positive (pro-poor) during the 90’s. This simple approach however does not consider distributional characteristics of growth and thus is not an attractive method. Moreover, GEP also depends completely on the poverty measure17 considered for the pro-poorness investigation. Son (2004) computed poverty growth curves using international data for poverty and income distribution and concluded that growth in Pakistan was pro-poor during the 60’s (1964-1969) and in the early 90’s (1990-1996). For other periods the nature of growth was not pro-poor. The results for Pakistan are reproduced in the following Table.
Trends in Nature of Growth – Relative Perspective of Pro-Poorness [Based on Group Data]
Years Annual Growth Rate of Bottom (%)
Nature of Growth Twenty Forty Sixty Eighty Hundred
1964 –1969 11.4 9.12 7.63 6.25 4.54 Pro-poor 1969–1979 0.42 0.64 0.77 0.87 1.07 Not Pro-Poor 1979–1985 2.94 2.85 2.89 2.99 3.02 Not Pro-Poor 1985– 1990 0.88 1.47 1.74 1.88 1.99 Not Pro-Poor 1990– 1996 3.92 3.0 2.18 1.5 1.39 Pro-poor Source: Son (2004)
While Son’s (2004) approach was based on relative criterion of pro-poor growth, Omar and Jafri (2008) assessed Pakistan’s growth performance using absolute perception and estimated RPPG proposed by Ravallion and Chen (2003). They found that, “overall … growth in Pakistan was pro-poor in (the) seventies18, eighties and 2000s, with varying degrees, and anti-poor in the nineties”. They also examined growth in incomes of those beneath the poverty line (four bottom deciles). The findings of their research indicate that the bottom decile (1st decile) experienced the sharpest growth (decline) in income
17 For this exercise, Pasha and Palanivel used poverty incidence (headcount). 18 The surveys to cover decade as follows: seventies (1979, 1987-88); eighties (1987-88, 1998-99);
2000s (1998-99, 2004-05)
24
Growth and Income Inequality Effects on Poverty: The Case of Pakistan - (1988-2011) Research Report No.94
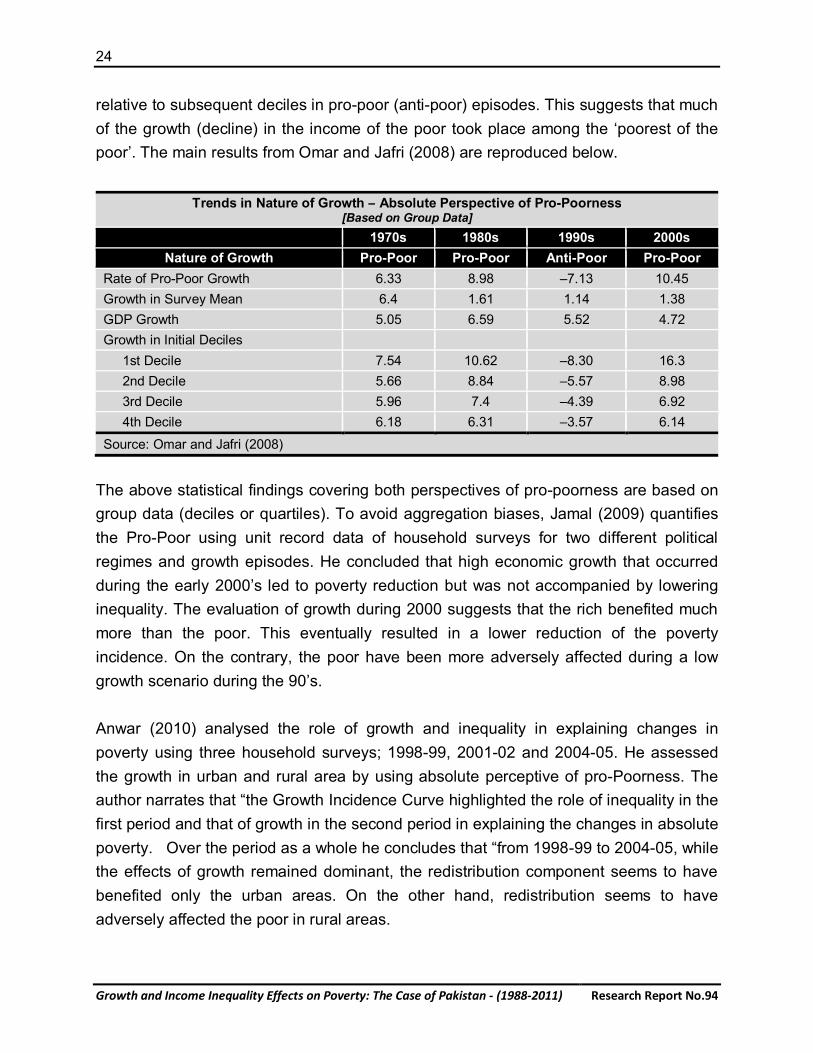
relative to subsequent deciles in pro-poor (anti-poor) episodes. This suggests that much of the growth (decline) in the income of the poor took place among the ‘poorest of the poor’. The main results from Omar and Jafri (2008) are reproduced below.
Trends in Nature of Growth – Absolute Perspective of Pro-Poorness [Based on Group Data]
1970s 1980s 1990s 2000s
Nature of Growth Pro-Poor Pro-Poor Anti-Poor Pro-Poor Rate of Pro-Poor Growth 6.33 8.98 –7.13 10.45 Growth in Survey Mean 6.4 1.61 1.14 1.38 GDP Growth 5.05 6.59 5.52 4.72 Growth in Initial Deciles
1st Decile 7.54 10.62 –8.30 16.3 2nd Decile 5.66 8.84 –5.57 8.98 3rd Decile 5.96 7.4 –4.39 6.92 4th Decile 6.18 6.31 –3.57 6.14
Source: Omar and Jafri (2008)
The above statistical findings covering both perspectives of pro-poorness are based on group data (deciles or quartiles). To avoid aggregation biases, Jamal (2009) quantifies the Pro-Poor using unit record data of household surveys for two different political regimes and growth episodes. He concluded that high economic growth that occurred during the early 2000’s led to poverty reduction but was not accompanied by lowering inequality. The evaluation of growth during 2000 suggests that the rich benefited much more than the poor. This eventually resulted in a lower reduction of the poverty incidence. On the contrary, the poor have been more adversely affected during a low growth scenario during the 90’s. Anwar (2010) analysed the role of growth and inequality in explaining changes in poverty using three household surveys; 1998-99, 2001-02 and 2004-05. He assessed the growth in urban and rural area by using absolute perceptive of pro-Poorness. The author narrates that “the Growth Incidence Curve highlighted the role of inequality in the first period and that of growth in the second period in explaining the changes in absolute poverty. Over the period as a whole he concludes that “from 1998-99 to 2004-05, while the effects of growth remained dominant, the redistribution component seems to have benefited only the urban areas. On the other hand, redistribution seems to have adversely affected the poor in rural areas.
25
Research Report No.94 Growth and Income Inequality Effects on Poverty: The Case of Pakistan - (1988-2011)
List of SPDC’s Publications
26
Growth and Income Inequality Effects on Poverty: The Case of Pakistan - (1988-2011) Research Report No.94
ANNUAL REVIEWS OF SOCIAL DEVELOPMENT IN PAKISTAN
SPDC-AR, Social Development in Pakistan: Annual Review 2012-13 (The State of Social Development in Rural Pakistan)
SPDC-AR, Social Development in Pakistan: Annual Review 2011-12 (Devolution and Social Development)
SPDC-AR, Social Development in Pakistan: Annual Review 2009-10 (Social Impact of the Security Crisis)
SPDC-AR, Social Development in Pakistan: Annual Review 2007-08 (Women at Work)
SPDC-AR, Social Development in Pakistan: Annual Review 2006-07 (Devolution and Human Development in Pakistan)
SPDC-AR, Social Development in Pakistan: Annual Review 2005-06 (Trade Liberalization, Growth and Poverty)
SPDC-AR, Social Development in Pakistan: Annual Review 2004 (Combating Poverty: Is Growth Sufficient?)
SPDC-AR, Social Development in Pakistan: Annual Review 2002-03 (The State of Education)
SPDC-AR, Social Development in Pakistan: Annual Review 2001 (Growth, Inequality and Poverty)
SPDC-AR, Social Development in Pakistan: Annual Review 2000 (Towards Poverty Reduction) (Urdu summary is also available)
SPDC-AR, Social Development in Pakistan: Annual Review 1999 (Social Development in Economic Crisis)| (Urdu summary is also available)
SPDC-AR, Social Development in Pakistan: Annual Review 1998
RESEARCH REPORTS RR-94, Growth and Income Inequality Effects on Poverty: The Case of
Pakistan (1988 – 2011), [2014]
RR-93, Determinants of Child Schooling, Work and Idleness: The Case of the Punjab Province, [2014]
RR-92, Health and Educational Status of Children: An Exploration through a Gender Lens, [2014]
RR-91, Profiling Rural Pakistan for Poverty, Inequality and Social Exclusion, [2014]
RR-90, School Participation in Rural Pakistan: A Situation Analysis, [2014]
RR-89, Incidence of General Sales Tax in Pakistan: Latest Estimates, [2014]
RR-88, State of the Economy: An Evaluation of the Federal Budget 2014-15, [2014]
RR-87, State of the Economy: An Ambitious Budget 2013-14, [2013]
RR-86, State of the Economy: Imperatives for Fiscal Policy in the Federal Budget of 2013-14, [2013]
RR-85, Predicting Sub-National Poverty Incidence for Pakistan, [2013]
RR-84, Pakistan Poverty Statistics: Estimates for 2011, [2012]
RR-83, An Exploratory Analysis of Inter-Temporal Multidimensional Poverty, [2012]
RR-82, Districts' Indices of Multiple Deprivations for Pakistan-2011, [2012]
RR-81, A Profile of Social Protection in Pakistan: An Appraisal of Empirical Literature [2010]
RR-80, Assessing Vulnerability to Poverty: Evidence from Pakistan, [2009]
RR-79, Estimation of Multidimensional Poverty in Pakistan, [2009]
RR-78, Understanding Rural Poverty Dynamics: The Case of the Poorest District of Sindh Pakistan, [2008]
RR-77, Exploring the Impact of Microfinance in Pakistan, [2008]
RR-76, State of the Economy: Fiscal Policy Choices in Budget 2008-09, [2008]
RR-75, Pay Offs to Schooling and Returns to Credentials, [2008]
RR-74, Satisfaction or Frustration: A Survey of Selected District Governments, [2008]
RR-73, Trends in Regional Human Development Indices, [2007]
RR-72, In dices of Multiple Deprivations 2005, [2007]
RR-71, Education Status of Districts: An Exploration of Inter-Temporal Changes, [2007]
RR-70, Income Poverty at District Level: An Application of Small Area Estimation Technique, [2007]
RR-69, Updating Poverty and Inequality Estimates: 2005 Panorama, [2007]
RR-68, Determinants of Total Factor Productivity in Pakistan, [2006]
RR-67, Gender Inequality and Trade Liberalization: A Case Study of Pakistan, [2007]
RR-66, Determinants of Recent Inflation in Pakistan, [2007]
RR-65, Estimating the Black Economy through Monetary Approach: A Case Study of Pakistan, [2006]
RR-64, State of the Economy: Growing Macroeconomic Imbalances, [2006]
RR-63, The Economy in the Aftermath of the Earthquake, [2005]
RR-62, State of the Economy: An Overheating Economy, [2005]
RR-61, Cancer: Social Implications of Treatment and Financial Burden, [2005]
RR-60, Province-Wise Growth Patterns in Human Capital Accumulation, [2005]
RR-59, In Search of Poverty Predictors: The Case of Urban and Rural Pakistan, [2004]
RR-58, Does Inequality Matter for Poverty Reduction? Evidence from Pakistan's Poverty Trends, [2004]
RR-57, State of the Economy: A Shift towards Growth, [2004]
RR-56, State of the Economy: Behind the Aggregates, [2003]
RR-55, Poverty and Inequality during the Adjustment Decade: Empirical Findings from Household Surveys, [2003]
RR-54, Impact of Ownership and Concentration of Land on Schooling: The Case of Rural Punjab, [2003]
RR-53, Zakat as A Social Safety Net: Exploring the Impact, [2003]
RR-52, Mapping the Spatial Deprivation of Pakistan, [2003]
RR-51, Price and Income Effects on Urban Undernutrition, [2003]
RR-50, Private Returns to Education: Evidence for Pakistan, [2003]
RR-49, Returns to Education: The Case of Fertility, [2003]
RR-48, Microfinancing: Fighting Against Poverty, [2003]
RR-47, The Changing Profile of Regional Inequality, [2003]
RR-46, The Knowledge Divide: Education Inequality in Pakistan, [2003]
RR-45 Pakistan's External Debt Burden: Causes, Complexities and Remedies, [2003]
RR-44, The Slowing Down of the Growth of Total Factor Productivity in Pakistan, [2002]
RR-43, Cost of Living Index by City of Pakistan, [2002]
RR-42, Recasting Sindh Budget (Expenditures) From 'Head of Account' To 'Department' Basis, [2002]
RR-41, Impact of the Afghan War on the Economy: Options for Pakistan, [2001]
27
Research Report No.94 Growth and Income Inequality Effects on Poverty: The Case of Pakistan - (1988-2011)
RR-40, Stabilization vs Growth: Federal Budget 2001-02, [2001]
RR-39, Incidence of Income Poverty in Pakistan, [2001]
RR-38, Credit to the Poor: Consultations with Borrowers, [2001]
RR-37, Social Development and Economic Growth: A Statistical Exploration, [2001]
RR-36, Alternative Delivery Mechanisms, [2000]
RR-35, Evaluation of the Federal Budget 2000-01, [2000]
RR-34, Public-Private Partnerships in the Health Sector, [2000]
RR-33, Macroeconomic Developments and Poverty, [2000]
RR-32, Evaluation of Social Safety Nets in Pakistan, [2000]
RR-31, A Medium-Term Macroeconomic Framework for Pakistan, [2000]
RR-30, Elements of Good Economic Governance, [2000]
RR-29, Social Impact of Economic Crisis: Lessons for Pakistan, [1999]
RR-28, Impact of Economic Adjustment on Social Development in Pakistan, [1999]
RR-27, Modeling Poverty Trends in Pakistan: Some Additional Empirical Evidence, [1999]
RR-26, Analysis of Provincial Budgets, 1999 2000, [1999]
RR-25, The 1998 Population Census, [1999]
RR-24, Gender Inequality in Developing Countries: A Case Study of Pakistan, [1999]
RR-23, Evaluation of the Federal Budget 1999 2000, [1999]
RR-22, Essays on the Federal Budget 1998 99, [1998]
RR-21, Decentralised Governance of Sindh Katchi Abadis Authority, [1998]
RR-20, Social Development in Pakistan Annual Review 1998
RR-19, Fiscal Decentralization: Lessons from the Asian Experience, [1997]
RR-18, Social and Economic Ranking of Districts of Pakistan, [1998]
RR-17, Growth of Public Debt and Debt Servicing in Pakistan, [1996]
RR-16, Review of the Social Action Program, [1997]
RR-15, The Provincial Budgets 1997 98, [1997]
RR-14, An Evaluation of the Federal Budget 1997 98, [1997]
RR-13, An Evaluation of the Budget 1996 97, [1996]
RR-12, Resource Mobilisation and Expenditure Planning for Social Sectors in Pakistan, [1996]
RR-11, The World Summit for Social Development: Its Implications for Social Sector Development in Pakistan, [1996]
RR-10, Social Development Ranking of Districts of Pakistan, [1996]
RR-9, Continuation Rates in Primary Education: A Study of Pakistan
RR-8, National Finance Commission: 1995 - Inter-Governmental Revenue Sharing in Pakistan, [1996]
RR-7, Integrated Social Policy and Macro Economic Planning Model for Pakistan, [1995]
RR-6, Optimal Enrollment and Cost Effective Expenditures for Public School System, [1994]
RR-5, Optimal Mix of Health Sector Expenditure, [1994]
RR-4, Data Base Development for Integrated Social Sector Revenue and Expenditure Model, [1994]
RR-3, Specification of Integrated Social Sector Revenue and Expenditure Planning Model, [1993]
RR-2, A Study on Improving the Efficiency and Effectiveness of Spending in the Social Sectors and Increasing Resource Mobilisation in the Provinces, (Five Volumes), [1992]
RR-1, Fiscal Policy in Pakistan, [1991]
GRP RESEARCH REPORTS 8, GRP Research Report No. 8: The Socio-Economic Impact of Floods
in District Thatta: A Gendered Analysis, [2013]
7, GRP Research Report No. 7: Gender Dimensions in Rural Non-farm Employment in Pakistan, [2013]
6, GRP Research Report No. 6: Gender Dimensions of Development Induced Displacement and Resettlement: A Case of Lyari Expressway in Karachi, [2012]
5, GRP Research Report No. 5: The Socio-Economic Cost of Violence Against Women: A Case Study of Karachi, [2012]
4, GRP Research Report No. 4: Gender Dimensions of Social Safety Nets: The Case of Zakat Recipients in Pakistan, [2010]
3, GRP Research Report No. 3: Socio-Economic Characteristics of Female- Headed Households in Pakistan Baseline Survey, 2009-10, [2010]
2, GRP Research Report No. 2: Trade Liberalisation and Gender Dynamics of Employment in Pakistan, [2010]
1, GRP Research Report No. 1: Public Spending on Education and Health in Pakistan: A Dynamic Investigation through Gender Lens, [2010]
POLICY PAPERS PP-25, Agenda for the 8th NFC: Lessons from the 7th NFC Award, Post-
7th NFC Development and Emerging Issues, [2014]
PP-24, The Privatization Program, [2014]
PP-23, On the Estimation of An Absolute Poverty Line: An Empirical Appraisal, [2003]
PP-22, Hidden Subsidies, [2002]
PP-21, Why has the Tax-To-GDP Ratio Fallen? [2002]
PP-20, A National Poverty Reduction Strategy and the Role of Donors, [2000]
PP-19, Macroeconomic Framework for Debt Management, [2000]
PP-18, Revamping the SAP, [2000]
PP-17, Statement to the Commonwealth Delegation, [1999]
PP-16, Unsustainability of the Balance of Payments, [1999]
PP-15, Broad-Basing of GST: The Strategy for Transition, [1999]
PP-14, Provincial Resource Mobilisation, [1998]
PP-13, Financial Sustainability of NGOs: Proposal for 1998-99 Federal Budget, [1998]
PP-12, Political Economy of Tax Reforms: The Pakistan Experience, [1997]
PP-11, Ninth Five Year Plan (1998-2003): Issues Paper, [1996]
PP-10, Fiscal Effort by Provincial Governments in Pakistan, [1995]
PP-9, Implication of the TOR of the New NFC, [1995]
PP-8, Provincial Budgets of 1995-96, [1995]
PP-7, Switchover to Ad Valorem Octroi Rates at Dry Ports, [1994]
PP-6, Rationalisation of Octroi Rates, [1994]
PP-5, User Charges in Health, [1994]
PP-4, Sindh Government Budget of 1993-94, [1994]
PP-3, User Charges in Education, [1994]
PP-2, Sales Taxation of Services by Provincial Governments, [1994]
PP-1, Rationalisation of Stamp Duties on Financial Assets and Transactions, [1994]
28
Growth and Income Inequality Effects on Poverty: The Case of Pakistan - (1988-2011) Research Report No.94
POLICY BRIEF Social Impact of the Security Crisis [ Rabia Sidat] Policy Brief, December 2011
Women at Work [Samar Zuberi] Policy Brief, July 2011
The Elimination of Textile Quotas and Pakistan-EU Trade [Iffat Ara] Policy Brief, April 2007
CONFERENCE PAPERS CP-63, Challenges and Responses for Democracy and Security:
Pakistan's Perspective, [2009]
CP-62, Neo-Liberal Governance and Poverty in Pakistan, [2009]
CP-61, How External Shocks and Exchange Rate Depreciations Affect Pakistan? Implications for Choice of an Exchange Rate Regime, [2005]
CP-60, Agricultural Terms of Trade in Pakistan: Issues of Profitability and Standard of Living of the Farmers, [2005]
CP-59, Is Pakistan's Manufacturing Sector Competitive? [2005]
CP-58, The Plight of Working Mothers in Pakistan: Advantages and Disadvantages of a Joint Family System, [2004]
CP-57, Macroeconomic Reforms and Return to Human Capital in Pakistan, [2004]
CP-56, Burden of Stabilization on Provinces and Its Implication on Social Sectors, [2004]
CP-55, Macroeconomic Reforms and Total Factor Productivity Growth in Pakistan: An Empirical Analysis, [2003]
CP-54, Budgets and Fiscal Decentralization: A Case Study of Sindh, [2003]
CP-53, Districts Level of Development as Push and Pull Factor in Inter-District Migration in Pakistan, [2002]
CP-52, Is Female Illiteracy a Determinant for Child Malnutrition: An Analyses of Developing Countries, [2003]
CP-51, Tax Holidays, Cost of Capital and Investment Behaviour: Jorgenson Approach, [2003]
CP-50, Why Private Investment in Pakistan has Collapsed and how can it be Restored, [2003]
CP-49, Hidden Subsidies, [2003]
CP-48, Gender and Public Spending on Education in Pakistan: A Case Study of Disaggregated Benefit Incidence, [2003]
CP-47, Nonprofit Sector in Pakistan: Government Policy and Future Issues, [2003]
CP-46, The Income Tax Regime and the Non-Profit Sector: The Case of Pakistan, [2003]
CP-45, The Long run and Short run Impact of Exchange Rate Devaluation on Pakistan's Trade Performance, [2002]
CP-44, Crowding Out Hypothesis in a Vector Error Correction Framework: A Case Study of Pakistan, [2002]
CP-43, Dynamic Consequences of the1997 National Finance Commission Award: Provincial Social Sector Expenditures, [2002]
CP-42, Political Economy of Fiscal Reforms in the 1990s, [2002]
CP-41, Stabilization Policy vs Growth Oriented Policy: Implication for the Pakistan Economy, [2002]
CP-40, Internal Migration: The Case of Sindh Province, [2001]
CP-39, Some Issues of Governance in Pakistan, [2000]
CP-38, Governance, Decentralisation and Poverty: The Case of Pakistan, [2001]
CP-37, Devolution and Fiscal Decentralisation, [2001]
CP-36, Brief on Annual Review of SPDC for 2000 on Towards Poverty Reduction, [2000]
CP-35, Policy Research and Its Implementation: Pakistan and Canada, [2000]
CP-34, Issues in Institutional Reform for Devolution, [2000]
CP-33, Issues in Fiscal Decentralisation, [2000]
CP-32, Public Expenditure Reform, [2000]
CP-31, Social Sector Policies Under SAP, [1999]
CP-30, Impediments to Social Development in Pakistan, [1999]
CP-29, Pakistan's Ranking in Social Development: Have We Always Been Backward, [1999]
CP-28, An Econometric Evaluation of Pakistan's National Education Policy 1998-2010, [1999]
CP-27, Impediments to Improvement of Social Sectors in Pakistan, [1998]
CP-26, Gender Differentials in the Cost of Primary Education: A Study of Pakistan, [1996]
CP-25, Integrated Social-Sector Macroeconomic Model for Pakistan, [1996]
CP-24, Determinants of Rates of Octroi Tax in Pakistan, [1995]
CP-23, Social Development Ranking of Districts of Pakistan, [1996]
CP-22, The City of Karachi: Planning and Managing for Urban Development, [1996]
CP-21, Sustainability of Public Debt in Pakistan, [1996]
CP-20, Has Poverty Returned to Pakistan? [1996]
CP-19, Improved Health Status and Economic Growth: Some Co-integration Results from Developing Economies, [1996]
CP-18, Is There a Long-Run Relationship Between Economic Growth and Human Development? Some Cross Country Evidence from Developing Countries, [1996]
CP-17, Municipal Finance in Small Cities, [1995]
CP-16, Financial Development of Megacities, [1995]
CP-15, Is Public Sector Investment Productive? Some Evidence from Pakistan, [1995]
CP-14, Is the Social Action Programme (SAP) in Pakistan Financially Sustainable? [1995]
CP-13, Results of Policy Simulations, [1995]
CP-12, Software Development and Use of the Model, [1995]
CP-11, Specification of the Integrated Social Policy Macro Economic Model, [1995]
CP-10, Overview of Integrated Revenue and Expenditure Planning Model for Social Sectors, [1995]
CP-9, Development of Property Taxation, [1995]
CP-8, Prospects of Resource Mobilisation by the Provincial Governments, [1995]
CP-7, Expenditure Planning Issues, [1993]
CP-6, Local Government Resource Mobilisation, [1993]
CP-5, Local Government Resource Mobilisation, [1993]
CP-4, Problems in Resource Mobilisation in Punjab, [1993]
CP-3, Provincial Government Resource Mobilisation in Punjab, [1993]
CP-2, Investment Strategy and Expenditure Requirements for Social Development, [1993]
CP-1, The Implementation Environment of the Social Action Programme, [1993]
29
Research Report No.94 Growth and Income Inequality Effects on Poverty: The Case of Pakistan - (1988-2011)
CONFERENCE PROCEEDINGS CPP-4, Proceedings of the Seminar on Prospects and Policies for the
Future, [2000]
CPP-3, Proceedings of the Launching Ceremony of the Social Development in Pakistan - Annual Review 1998, [1998]
CPP-2, Proceedings of the Second Conference on Resource Mobilisation and Expenditure Planning, [1995]
CPP-1, Proceedings of the Conference on Resource Mobilisation and Expenditure Planning, [1993]
DATABASE REPORTS DB-5, Data-Base Report 2013: Gender Disaggregated Indicators of the
Labour Market in Pakistan, [2013]
DB-4, Data-Base Report 2005: Socio-Economic Indicators by Gender: A Regional Comparison for Pakistan, [2005]
DB-3, Data-Base Report 1997: Education Module, [1997]
DB-2, Data-Base Report 1997: Provincial Finance Module, [1997]
DB-1, Data-Base Report 1997: Federal Finance Module, [1997]
WORKING PAPERS WP-7, Proposed Agenda for Sustained Economic Revival, [2013]
WP-6, Has civil society failed in Pakistan? [2011]
WP-5, Provincial Accounts of Pakistan: Methodology and Estimates 1973-2000, [2005]
WP-4, Nonprofit Sector in Pakistan: Historical Background, [2004]
WP-3, Law and the Nonprofit Sector in Pakistan, [2002]
WP-2, Nonprofit Sector in Pakistan: Government Policy and Future Issues, [2002]
WP-1, Dimensions of the Nonprofit Sector in Pakistan, [2002]
SPDC BOOKS SPDC Book, In Search of Gendered Development:
A Compendium, [2014]
SPDC Book, Provincial Governments and the Social Sectors in Pakistan, [1997]
SPDC Book, Resource Mobilisation and Expenditure Planning in the Provinces of Pakistan, [1996]
OTHER PUBLICATIONS OP-3, Report of Interactive Discussion Session on Integrated Energy
Policy Formulation with Emphasis on Social Dimensions, [2012]
OP-2, Booklet: ABC of the Economics of Tariffs and Import Quotas, [2007]
OP-1, Research Report: The Elimination of Textile Quotas and Pakistan-EU Trade, [2007]