The Sociology of Biological Intelligence Sociology of Biological Intelligence Linda S. Gottfredson, ... and I have對 written a lot about them, ... (R. B. Cattell,
63
The Sociology of Biological Intelligence Linda S. Gottfredson, PhD School of Education University of Delaware, USA Hans J. Eysenck Lecture International Society for the Study of Individual Differences London, July 26, 2011 1 Speaker notes can be toggled on or off
The Sociology of Biological Intelligence Linda S. Gottfredson, PhD
School of Education University of Delaware, USA
Hans J. Eysenck Lecture International Society for the Study of Individual Differences
London, July 26, 2011 1
Speaker notes can be toggled on or off
Eysenck and the London School
2
Presenter
Presentation Notes
It’s a special pleasure to be giving the Eysenck lecture in London, the home of the London School of intelligence in which Hans Eysenck has loomed so large. This just-published Handbook confirms the reemergence of individual differences from its “dark ages” in psychology
3 points about variation in g o Human variation in g social structure o Population variation is a social fact o Use life tasks as a heuristic to trace its structural effects
3 examples of structural effects o Evolution of occupational hierarchy o Evolution of high human intelligence o Emergence of pervasive health disparities
3
Three points & three examples
Eysenck’s biological (vertical) focus
4
Genetic
differences
Non-genetic influences
“Environmental” differences
Life outcomes • Educ & job performance • Educ & job level • Health
IQ scores
Brain
g
VER T I CAL
HORIZONTAL
But he also looked at its social consequences
Presenter
Presentation Notes
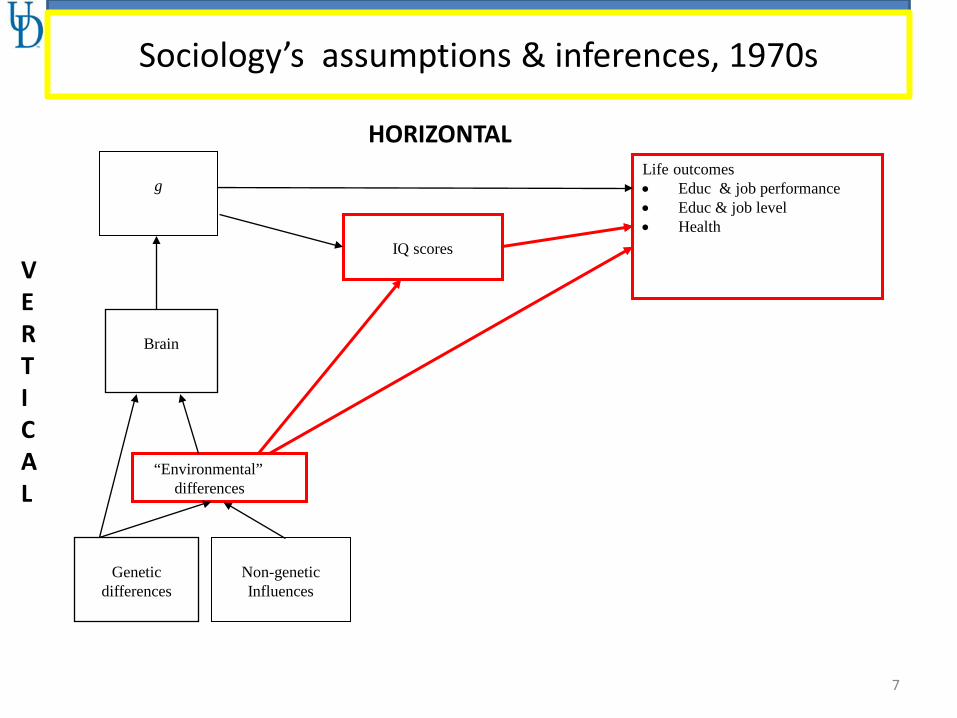
Eysenck was noted for his analytical, empirical, experimental, and biological approach to intelligence—the latter being labeled the “vertical” emphasis by Arthur Jensen. But Eysenck also looked at the “horizontal” correlates and effects of intelligence. Note the difference between the empirical phenomenon of g and the IQ tests used to measure it. It is the real-world effects of variation in g itself, not test scores, that concern us here. The latter can affect life outcomes when known and used administratively, but g exerts its effects whether measured or not.
Sociologists’ life-course path model
5
Early heritability of social class studies
1972
1977
1979
Presenter
Presentation Notes
I begin with the 1970s because that is when I obtained my PhD. It was in sociology. I’ll highlight several major publications in the 70s, 80s, and 90s to give the younger members of the audience a sense of where intelligence research stood in each decade. In the 1970s, regression and path analyses of “who gets ahead” had become all the rage in sociology. Neo-Marxist explanations of social inequality were de riguer; were were no such thing as traits, but only differences in social resources, power, and opportunity. The 1972 book was by a sociologist, the 1977 book by an economist. Both looked at the heritability of socioeconomic outcomes, but sociology still mostly ignores or minimizes such genetic evidence. Genetic involvement in traits was still “controversial” in psychology into the 1990s. Eysenck’s 1979 book reported on the genetic modeling in these two books. Note the sociologists’ “life course model” of status attainment on the cover of his book. He was very up-to-date about developments in the sociology of who gets ahead. Such modeling was the cutting edge when I got my degree.
Consistent pattern of correlations
Father
Son
Occupation IQ Education Occupational Earnings
Father Education .48 .27 .40 .28 .20
Occupation .29 .38 .31 .22
Son IQ .57 .46 .28
Education .61 .38
Occupation .43
6
Object of much causal modeling
Presenter
Presentation Notes
These are typical correlations between “social background” and socioeconomic attainment in adulthood. The pattern of correlations between son’s IQ and the other variables is very consistent in study after study. My chapter in the Individual Differences Handbook is concerned with explaining the biological component of these correlations with IQ—not to explain the variance in particular social outcomes. That is, we need to explain the phenotypic and genetic covariance of social outcomes with g.
Sociology’s assumptions & inferences, 1970s
7
Genetic
differences
Non-genetic Influences
“Environmental” differences
Life outcomes • Educ & job performance • Educ & job level • Health
IQ scores
Brain
g
VER T I CAL
HORIZONTAL
Sociology’s assumptions & inferences
8
Genetic
differences
Non-genetic Influences
“Environmental” differences
Life outcomes • Educ & job performance • Educ & job level • Health
IQ scores
Brain
g
VER T I CAL
HORIZONTAL
Social background social destination
Family IQ Educ Occ Income
• No traits • No genetic component • Individual differences = “inequalities”
Sociology’s assumptions & inferences, 1970s
9
Genetic
differences
Non-genetic Influences
“Environmental” differences
Life outcomes • Educ & job performance • Educ & job level • Health
IQ scores
Brain
g
VER T I CAL
HORIZONTAL
Social background social destination
Family IQ Educ Occ Income
• No traits • No genetic component • Individual differences = “inequalities”
X
Presenter
Presentation Notes
Eysenck’s book, and the contemporary sociological sources he drew from, demonstrated that these assumptions were already known to be mistaken. The evidence had little effect on the sociological approach, however, which still minimizes the existence and import of individual differences.
10
Human variation = biological fact
IQ
Presenter
Presentation Notes
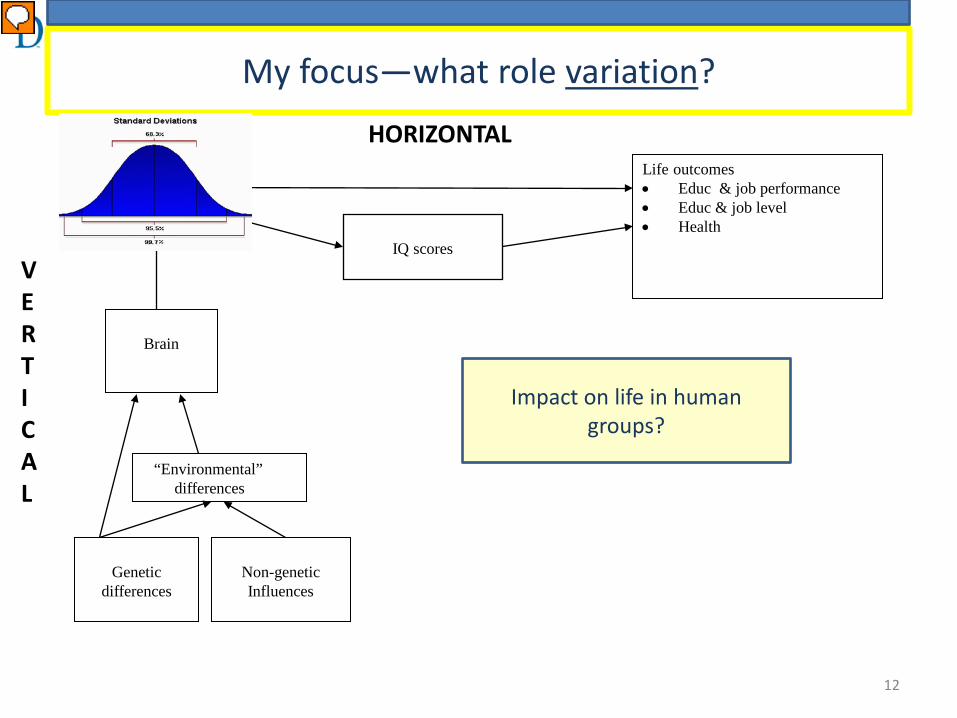
My first point is simply that the bell curve of intelligence is a striking fact. When I encountered it for the first time, in graduate school, I was struck that it must be a biological fact. It did not look like any of the distributions of social outcomes I had come across, which could morph from one decade or generation to another.
11
Everywhere
• Wide spread (like height) • Predictable form (~normal curve) • In all times • In all places
Presenter
Presentation Notes
As far as we know, intelligence variation is much the same everywhere and behaves like other biological traits. This alone is an incredibly important fact about human populations. If intelligence is important, then this recurring, predictable variation is something that will constrain how human groups organize themselves. This is an intriguing phenomenon for me, as a sociologist.
My focus—what role variation?
12
Genetic
differences
Non-genetic Influences
“Environmental” differences
Life outcomes • Educ & job performance • Educ & job level • Health
IQ scores
Brain
Intelligence differences (g)
VER T I CAL
HORIZONTAL
Impact on life in human groups?
Presenter
Presentation Notes
Hence my focus over the years on the impact of variation itself.
Life outcomes • Educ & job performance • Educ & job level • Health
Sociology of intelligence
13
Genetic
differences
Non-genetic influences
“Environmental” differences
Differences in test scores (IQ)
Brain
Intelligence differences (g)
VER T I CAL
HORIZONTAL
Group differences
Presenter
Presentation Notes
Many researchers have examined group differences in phenotypic intelligence and how they create mean differences in life outcomes. A few have been willing to discuss the likely genetic involvement in such differences. As important as they are, and I have written a lot about them, these g-based differences in individual and group outcomes are but the tip of the iceberg in understanding how cognitive diversity shapes human societies.
Life outcomes • Educ & job performance • Educ & job level • Health
Sociology of intelligence—other units of analysis
14
Genetic
differences
Non-genetic influences
“Environmental” differences
Differences in test scores (IQ)
Social structures (distal) • Economy • Innovation • Occupational hierarchy
Interpersonal contexts (proximal) • Rates of social pathology • Sub-group norms, mores • Disorganization
Brain
Intelligence differences (g)
VER T I CAL
HORIZONTAL
Flows of info & error (Robert Gordon) Geography of intelligence (Richard Lynn, Phil Rushton) Syntality (R. B. Cattell, Heiner Rinderman)
Group differences
Presenter
Presentation Notes
To fully appreciate the impact of cognitive diversity on human social organization, we also have to look at two higher levels of analysis: the proximal social context and the distal social structures we tend to take for granted. Beginning in the 1970s, a few intelligence researchers have examined intelligence at these other levels of analysis, usually by correlating mean IQs with various other attributes of the populations in question.
Life outcomes • Educ & job performance • Educ & job level • Health
Interpersonal contexts (proximal ) • Rates of social pathology • Sub-group norms, mores • Disorganization
Brain
Intelligence differences (g)
VER T I CAL
HORIZONTAL
Discovery in 1960s: It’s the same everywhere
Presenter
Presentation Notes
We now come to my first example of how intelligence variation can create social structure. It involves the prestige hierarchy of occupations that we now take for granted. Sociologists were struck in the 1960s and 1970s with how similarly all groups inside and outside the US ranked the desirability, or prestige, of familiar occupations. None has tried to explain this striking similarity in social structure across different cultures and social groups. However, I will show you how examining the task attributes of work can give us purchase on how cognitive diversity could evolve a shared hierarchy of occupations.
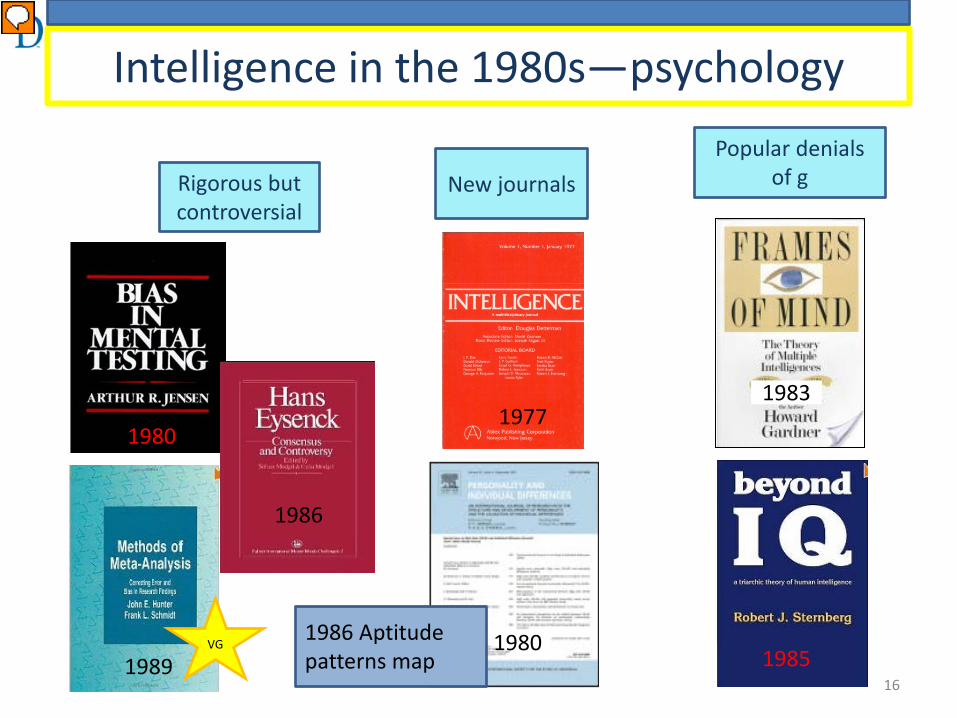
Intelligence in the 1980s—psychology
16
Rigorous but controversial
Popular denials of g
1977 1980
1989 1980
New journals
1985
1983
1986
VG 1986 Aptitude patterns map
Presenter
Presentation Notes
I did this work during the 1980s, which was an important decade in intelligence research. Two journals were started. While some classics on tests and intelligence were published, so were two books proposing that intelligence is multiple. Especially important for my first example (the evolution of the occupational hierarchy) was the work by Schmidt and Hunter on validity generalization (VG). At that time I was collecting all available evidence on the aptitude demands of jobs in order to create a simple occupational aptitude patterns “map” for vocational counseling purposes. I was also using that evidence to test sociological claims about the non-importance on intelligence at work.
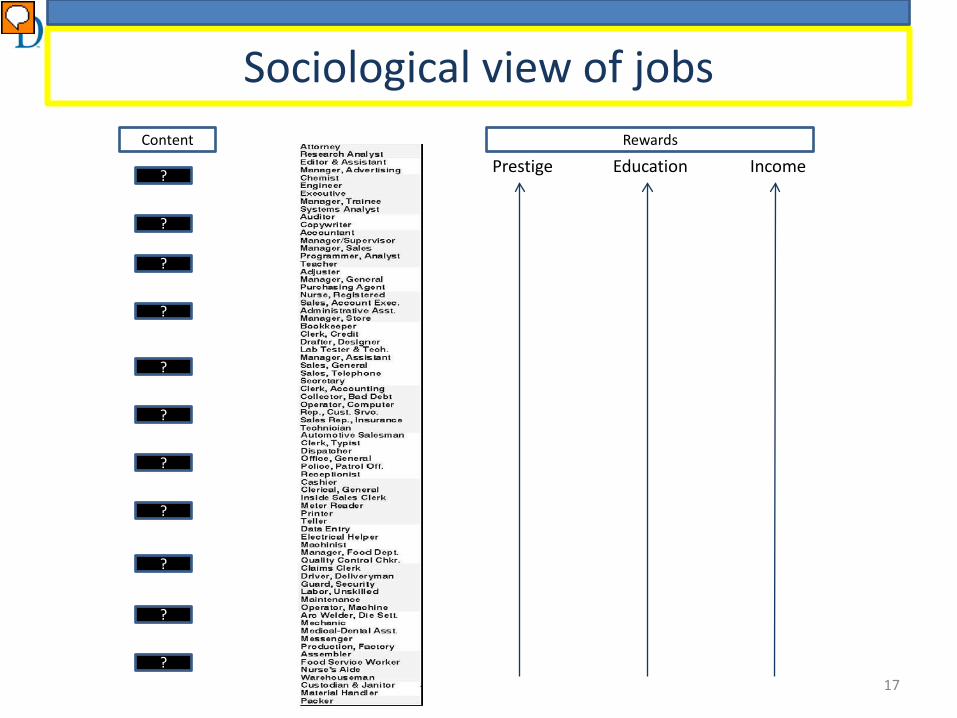
Sociological view of jobs
17
Prestige
Education
Income
Rewards Content
?
?
?
?
?
?
?
?
?
?
?
Presenter
Presentation Notes
Occupational level is the sociologists’ most important life outcome for studying status inequalities. They still tend to look at occupations in terms of the rewards they confer on incumbents, not the work that workers actually do.
Prestige lines up best with workers’ average IQ
Workers’ IQ
average is higher
But do more prestigious occupations really need smarter
workers?
Presenter
Presentation Notes
Incumbents’ mean IQ is the strongest correlate of an occupation’s prestige level, but sociologists rejected the notion that higher level jobs require smarter workers.
Prestige lines up best with workers’ average IQ
Workers’ IQ
average is higher
But do more prestigious occupations really need smarter
workers?
Sociology in 1970s
“No” • Hierarchy based on power • IQ = privilege, not merit • ~All can master any job
Presenter
Presentation Notes
Their claims (shown here) didn’t make sense to me, but there was not yet any good rebuttal to them.
Rebuttal—part 1
Workers’ IQ
average is higher
g predicts performance within all jobs
VG
Presenter
Presentation Notes
Schmidt and Hunter showed that g predicts performance to some extent in all jobs. But this alone is not sufficient to show that differences in IQ actually affect quality of work, as sociologists had argued. Perhaps employers just have a “taste” for workers with higher IQs and rate them more highly for this reason.
Rebuttal—part 2
Workers’ IQ
average is higher
g predicts performance within all jobs
g predicts better in
higher jobs VG
Presenter
Presentation Notes
IQ actually does predict performance when objectively measured, but this is not enough. It is also essential to show that intelligence matters more in higher level jobs. If not, then it wouldn’t much matter what occupation higher-IQ individuals worked in. If g really matters for job performance, it should matter more for performance in higher level, more cognitively demanding jobs. In fact, the evidence soon showed that it does. And the relation is stronger when performance is measured more objectively—which is opposite what sociologists had predicted. (They assumed that supervisors rate higher-IQ individuals better because they are partial to such workers, not because the workers perform any better. The more discretion they have in rating workers, the more tightly their ratings were—mistakenly—assumed to correlate with IQ.)
Rebuttal—part 3
Workers’ IQ
average is higher
g predicts performance
in all jobs
g predicts better in
higher jobs VG
Jobs more complex
Job analysis
Presenter
Presentation Notes
The most conclusive rebuttal was to show that higher level jobs actually require more cognitively demanding work. As I have detailed elsewhere, job analysis research shows that the occupational hierarchy orders occupations by complexity of the work performed. Complexity resides in information processing, and especially in more g-loaded information processing (reasoning)—regardless of work content. In sum, it appears that the occupational prestige hierarchy is actually a g-demands hierarchy, and thus mirrors the g dimension among humans.
Rebuttal—part 3
Workers’ IQ
average is higher
g predicts performance
in all jobs
g predicts better in
higher jobs VG
Jobs more complex
Job complexity factor = Reasoning demands factor = So – 1st factor among jobs mirrors 1st factor among people (g)
Job analysis
Why? Mechanism??
How many jobs in the Pleistocene?
24
Ache Hunter Gatherer
Presenter
Presentation Notes
Modern economies have thousands of distinct jobs, but human societies began with only two. It’s easy to understand that jobs proliferated as societies grew in size and work became specialized. But why in the manner it did, and not some other? When I was in graduate school, some sociologists were arguing that work could, in fact, be organized very differently. For example, one argued in a well-known book that individuals could work their way up to physician from orderly, or people could be rotated through good and bad jobs, as communes have tried to do. That is, they saw no reason that work and workers couldn’t be matched to each other in any way we might wish.
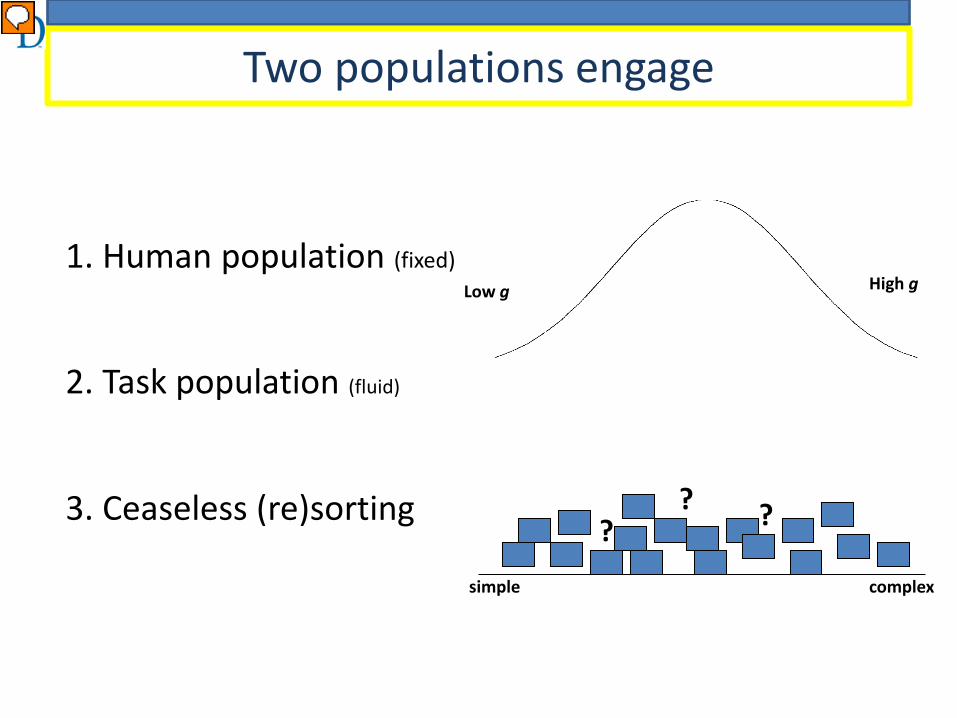
1. Human population (fixed)
2. Task population (fluid)
3. Ceaseless (re)sorting
?
simple complex
Low g High g
? ?
Two populations engage
Presenter
Presentation Notes
So, for my example 1, the question is: How did work become organized primarily according to its g demands? I note that there is also a horizontal dimension running through the division of labor. I have described that elsewhere (Gottfredson, 1986, on an occupational aptitude patterns map), and it appears to coincide with Stratum II of Carroll’s hierarchy structure of human abilities. But that is a topic for another day. My focus here is on the dominant distinction—the up-down distinction—among jobs that is of such concern in sociology. When I was studying the job analysis literature, I was struck by the fact that occupations are, essentially, living creatures. They are constantly changing, with duties often coming and going as new occupations come into being and others disappear. It is important to realize that occupations are just similar task constellations, and that workers often shape the nature of the work they do. Supervisors often reassign tasks depending on who is most skilled at them. What we have, when broadly conceived, are two populations that must engage each other for a society’s work to get done: a fluid population of tasks and a relatively fixed pool of humans to perform them. The flexibility lies in how each is sorted to the other, day after day, generation after generation in the myriad choices that workers and employers make.
1. Human population (fixed)
2. Task population (fluid)
3. Ceaseless (re)sorting
?
simple complex
Low g High g
? ?
Potential workforce
Two populations engage
Tasks proliferate, jobs evolve
Presenter
Presentation Notes
Briefly, evolution proceeds as tasks proliferate over generations of social and technological innovation.
1. Human population (fixed)
2. Task population (fluid)
3. Ceaseless (re)sorting
?
simple complex
Low g High g
? ?
Tasks proliferate, jobs evolve
Potential workforce
Work behavior Productivity
Two populations engage
Presenter
Presentation Notes
The increasing number and variety of work tasks creates pressure to segregate tasks into feasible sets (different jobs).
1. Human population (fixed)
2. Task population (fluid)
3. Ceaseless (re)sorting
?
simple complex
Low g High g
? ?
Tasks proliferate, jobs evolve
Potential workforce
Work behavior Productivity
Two populations engage
Presenter
Presentation Notes
But no task constellation will survive over time if there isn’t a reliable pool of workers to man it. Since workers differ in ability, there is steady pressure to segregate tasks into bundles according to broad intelligence level required. The great variation in human intelligence dictates that some task constellations are more workable than others. For instance, some but not all jobs can require cognitively complex reasoning and decision-making, because only a limited proportion of adults could perform them satisfactorily. (I detail this process in Gottfredson, 1985.)
1. Human population (fixed)
2. Task population (fluid)
3. Ceaseless (re)sorting
?
simple complex
Low g High g
? ?
Tasks proliferate, jobs evolve
Potential workforce
Work behavior Productivity
Two populations engage
Presenter
Presentation Notes
The result is a sorting process by which workers and tasks are sorted and resorted, not just over a lifetime but over generations. Such sorting is natural and inconspicuous—pervasive and ceaseless—and can be observed in workplaces today. My point—my hypothesis—is that human variation in intelligence constrains the sorting process. It always biases the segregation and sorting in the same direction, whether the bias be strong or weak at any particular time.
The task heuristic
• Humans generate instrumental tasks • Tasks evoke performance differences • Myriad tweaks in who does what • Toward higher g-e correlation • Occupational hierarchy is human’s extended
phenotype
30
Presenter
Presentation Notes
This process illustrates how human variation becomes expressed in the global human phenotype, that is, in how humans structure their lives together. The occupational hierarchy may be viewed as a cross-century increase in g-e correlation as large human groups create and populate new niches. Tasks are stimuli for behavior and instrumental tasks evoke differences in g. By studying tasks, we can see intelligence in action. By attending to these stimulus-packets, we can trace the effects of human cognitive diversity at all levels of human organization.
Example 2—the 1990s
31
1990, London School comes to Manhattan
32
Presenter
Presentation Notes
Do you see some familiar faces? (Sybil and Hans Eysenck at left in front row)
Intelligence in the 1990s
33
1997
1998
1993
1994
?
1997 “Why g matters”
Presenter
Presentation Notes
The 1990s saw the publication of some very important treatises on intelligence. I will use Carroll’s book to make my second point about why understanding tasks is so helpful for understanding how human cognitive diversity shapes human life—that is, the sociology of biological intelligence. During the 1990s I had turned to figuring out why g matters in everyday life, not just in jobs and school. The persisting and sometimes large correlations between IQ and life outcomes are impressive, but skeptics of intelligence might explain them as just more proof of how pervasively social privilege affects our lives. Once again, by what mechanism does higher g confer advantages in so many realms of life?
What is ____ ? • Ability: “the possible variations over individuals in the liminal [threshold] levels of task
difficulty …at which, on any given occasion in which all conditions appear favorable, individuals perform successfully on a defined class of tasks”
• Task: “any activity in which a person engages, given an appropriate setting, in order
to achieve a specifiable class of objectives, final results, or terminal states of affairs”
• Cognitive task: “any task in which correct or appropriate processing of mental information is
critical to successful performance” Carroll (1993)
34
?
Presenter
Presentation Notes
I was struck by a deceptively simple fact in Carroll’s book—his definition of “ability.” An ability is defined by a specified domain of tasks performed. Now, these domains are not defined a priori, as they would be on a test of achievement in some content area, but by the range of tasks discovered to be associated with high performance (from broad to narrow, as in Carroll’s 3-stratum model).
What is ____ ? • Ability: “the possible variations over individuals in the liminal [threshold] levels of task
difficulty …at which, on any given occasion in which all conditions appear favorable, individuals perform successfully on a defined class of tasks”
• Task: “any activity in which a person engages, given an appropriate setting, in order
to achieve a specifiable class of objectives, final results, or terminal states of affairs”
• Cognitive task: “any task in which correct or appropriate processing of mental information is
critical to successful performance” Carroll (1993)
35
?
Ability = behavior in response to task stimuli
Presenter
Presentation Notes
In short, we identify and understand abilities in terms of behavior in response to specified tasks. This simple fact is very important, as my second example illustrates.
Life outcomes • Educ & job performance • Educ & job level • Health
Interpersonal contexts (proximal ) • Rates of social pathology • Sub-group norms, mores • Disorganization
Brain
Intelligence differences (g)
VER T I CAL
HORIZONTAL
Evo psych— Intelligence is modular
Presenter
Presentation Notes
My example begins with an invitation I received to discuss the modularity of intelligence. Evolutionary psychologists have generally argued there is no general problem solver and thus no general intelligence, but that human intelligence is modularized.
Could a general intelligence have evolved?
• Some evo psych—“no”
– Modular brain – Specific heuristics for specific needs
37
But it did evolve
Could a general intelligence have evolved?
• Some evo psych—“no”
– Modular brain – Specific heuristics for specific needs
• Other evo psych—”yes”
– “Mating mind” – “Social brain”
38
But it did evolve
But g is instrumental, not social
Presenter
Presentation Notes
I was planning to write that “But yes, there is a general intelligence, and it doesn’t behave like a social intelligence.”
Challenge • g is general • What selection pressure was equally general and unique to
But then I had to ask myself, “Since it did evolve, what evolved it?” What in the environment conferred a survival or reproductive advantage on individuals who learned and reasoned better? That is, what ecological demands tilted relative risk in favor of those members of a group? �
Life outcomes • Educ & job performance • Educ & job level • Health
Interpersonal contexts (proximal ) • Rates of social pathology • Sub-group norms, mores • Disorganization
Brain
Intelligence differences (g)
VER T I CAL
HORIZONTAL
Tasks evoke phenotypes
Presenter
Presentation Notes
As I explain in Gottfredson, 2007, I hypothesize that human innovation itself created the ecological conditions that favor higher-ability individuals—because innovations (novel tasks) evoke intelligence differences more strongly than do routine, practiced tasks. They also create novel hazards to which the less intelligent are more susceptible.
Innovation floods the human environment, not just with novel, increasingly complex tasks, but also novel physical hazards.
USA (1986) Ache (<1971)
Age: 15-24 25-34 35-44 45-64 0-3 4-14 15-59
Illness 22 44 72 93 50 35 49
Accident 51 31 15 4 3 25 37
Suicide 13 12 7 2 0 0 0
Homicide 14 13 6 1 47 40 14
% of civilian deaths
Presenter
Presentation Notes
“Accidents” (unintentional injuries) are still a major cause of death worldwide. So were they in pre-modern hunter-gatherer societies, such as the Ache in Paraguay.
Preventing accidents = cognitive process “Keeping systems under control”
Hazards of daily life
Task clues from job analysis
“Judgment & Reasoning Factor” (1st factor) • Deal with unexpected situations • Learn & recall job-related information • Reason & make judgments • Identify problem situations quickly • React swiftly when unexpected problems occur • Apply common sense to solve problems
46
None of these is domain-specific.
Imaginators
Innovate to adapt to harsher climates:
• clothing, shelter • storage, preservation
Bigger consequences More hazards More complexity More innovations
Relative risk steepens
Mean IQ rises
Selection walk? Illustration
Not the obvious • Starvation, harsh climate • Because g-based benefits shared—meat from hunting, shelter
But the “minor” side-effects of core tasks • “Accidental” injury—the myriad low-probability, chance-laden, oft-ignored
hazards in daily chores • Because their g-based costs not shared
Ecological pressure?
Lesson— Hazards are unobtrusive tests Not avoided if not seen Not seen if weak “mind’s eye”
• Opportunity to learn & reason + within-group variation in g = opportunity for selection
• Tiny effect size + many generations = big shift in distribution
Simpler life ≠ g-proof environment
Example 3—Health disparities
• Same principles – Task requirements – Mind’s eye to recognize them – Aggregate small risks
• Applied to health self-care – Diabetes self-management
50
Current models of health disparities
Assumption: Disparities can be traced to social inequalities
Braverman, Egerter, & Williams, 2011, Figure 2
Current models of health disparities
Assumption: Disparities can be traced to social inequalities Unique challenge: How does inequality “get under the skin”?
Current models of health disparities
Assumption: Disparities can be traced to social inequalities Unique challenge: How does inequality “get under the skin”? Usual constraint: No traits Behavior not genetic
How does inequality kill?
Diabetes self-management
54
• A complex “job” • Unwanted • Little training • Little supervision • Little feedback • Much non-adherence
Presenter
Presentation Notes
But self-care, like accident prevention, is a highly cognitive activity that individuals themselves must perform independently.
• Learn about diabetes in general (At “entry’) – Physiological process – Interdependence of diet, exercise, meds – Symptoms & corrective action – Consequences of poor control
• Apply knowledge to own case (Daily, Hourly) – Implement appropriate regimen – Continuously monitor physical signs – Diagnose problems in timely manner – Adjust food, exercise, meds in timely and appropriate manner
• Coordinate with relevant parties (Frequently) – Negotiate changes in activities with family, friends, job – Enlist/capitalize on social support – Communicate status and needs to practitioners
• Update knowledge & adjust regimen (Occasionally) – When other chronic conditions or disabilities develop – When new treatments available – When life circumstances change
Self-management
Job description
Presenter
Presentation Notes
Diabetes provides an example of how complex the job of self-care can be.
• Not mechanically following a recipe
• Task—keep complex system under control in often unpredictable circumstances