the s¨oderfors project: experimental hydrokinetic power station
TRANSCRIPT

The Soderfors Project: Experimental HydrokineticPower Station Deployment and First Results
Staffan Lundin, Johan Forslund, Nicole Carpman, Marten Grabbe,Katarina Yuen, Senad Apelfrojd, Anders Goude and Mats Leijon
Swedish Centre for Renewable Electric Energy ConversionDivision of Electricity, Uppsala University
The Angstrom Laboratory, Uppsala, SwedenE-mail: [email protected]
Abstract—The Division of Electricity at Uppsala Universityrecently deployed an experimental hydrokinetic power stationfor in-stream experiments at a site in a river. This paper brieflydescribes the deployment process and reports some initial resultsfrom measurements made at the test site.
Index Terms—hydrokinetic energy, vertical axis turbine, low-speed generator, experimental facility, deployment experience
I. I NTRODUCTION
The Division of Electricity at Uppsala University is devel-oping a test site for marine current or hydrokinetic energyconversion in the River Dalalven at Soderfors. TheSoderforsProject was presented at the 9th EWTEC in 2011 [1], anddetails of the project have also been published in [2]. Recently,an important milestone was reached as the energy conversionunit, comprising turbine and generator, was deployed into theriver.
The experimental station is located in the River Dalalvenat Soderfors, whence the project derives its name. The systemcomprises a vertically oriented cross-stream axis turbineanda directly driven permanent magnet generator situated on theriverbed. The necessary systems for control, power conversionand various measurements are housed in a small measuringstation on shore.
This paper will briefly describe the practicalities of con-structing and deploying the experimental power station andreport some initial results from operating the unit.
II. D EPLOYMENT
A. Background
As described in [1], research on hydrokinetic energy con-version has been conducted at Uppsala University since 2000.A prototype low speed permanent magnet generator wasdesigned and built in a laboratory environment in 2007. Thelocation of the test site at Soderfors (see Figures 1 and 2) wasselected in 2009, and after analysing the characteristics of thesite [3], [4] the test equipment was designed and constructedin the lab in 2010 and 2011. See [2] and [1] for details of thesite selection process and design choices for the experimentalstation.
During spring and summer of 2012, the equipment wasmoved in pieces to Soderfors and reassembled. The plan was todeploy the energy conversion unit into the river in late summer,
since statistics had shown that river discharge is relatively lowat that time of year. However, due to unanticipated levels ofprecipitation during summer and autumn 2012, deploymenthad to be postponed several times and eventually into 2013.
The equipment to be deployed was the energy conversionunit (foundation, generator and turbine) and three water ve-locity measurement devices of type ADCP1. Attached to thegenerator was a cable bundle comprising the power cableand two signal cables. The ADCPs also had cables attachedand foundations weighing around 100 kg for the two bottom-mounted units. The third unit, to be mounted on the bridgepillar, had a lighter foundation, but in the end that ADCP wasdeployed at a later date than the other components.
The general layout of the test site is illustrated in Figure 3.The turbine and the bottom-mounted ADCPs are placed ona line roughly aligned with the main direction of flow ofthe river. The distance from the turbine centre to the ADCPsis approximately 15 m in either direction, corresponding to2 turbine diameters from the turbine periphery. The horizontalADCP is mounted on a bridge pillar upstream of the turbine atthe same distance. The water depth at the site is just less than7 m, putting the turbine blade tips at 2 m below the surface.An electrical enclosure mounted on the bridge railing providesa connection point for cables coming up out of the waterand cables going on to the measuring station on shore. Themeasuring station is about 170 m from the bridge enclosurein terms of cable length. It is approximately 800 m along theriver from the hydro power station to the test site.
B. Time of deployment
As mentioned above, the original plan called for deploymentin late summer based on predicted river discharge. It was nec-essary to have divers working in the water during deployment,to inspect the placement of the machinery on the river bed butalso to secure the cabling on the river bed and to the bridgepillar where the cables come out of the water. For the diversto have a reasonable work environment, it was necessary tohave Vattenfall AB, the utility company operating the hydropower station at Soderfors, shut down the water flow fromthe power station (if not completely at least nearly). With the
1Acoustic Doppler Current Profiler

Soderfors
UppsalaStockholm
SWEDEN
NORWAYFINLAND
DENMARK BalticSea
NorthAtlantic
Fig. 1. The location of Soderfors, approximately 1 hour’sdrive north of Uppsala.
Assembly site
Test site
Measuring
station
Hydro power station
Dalalven
c ©La
ntm
ater
ietG
avle
2009
.Per
mis
sion
I200
8/19
62
Fig. 2. A bird’s eye view of central Soderfors. The experimental station is placed some 800 mdownstream of the conventional hydro power plant.
heavy rainfall experienced in 2012, it was not until well intoDecember 2012 that the discharge in the River Dalalven fellto such a level that a shutdown were possible.
On the other hand, in December temperatures are coldwhich means high season for the utility companies, andVattenfall were reluctant to shut down their power station inthe winter. Deployment was therefore postponed further.
In early March, Vattenfall planned a shutdown of theSoderfors hydro power station for some maintenance work.The date was 7 March 2013, and since control of the riverdischarge was the single most important factor for success,itwas decided to seize the opportunity to deploy.
C. Execution
The deployment was carried out by lifting the energyconversion unit (see Figure 5) into the River Dalalven fromtheroad bridge spanning the river by use of a mobile crane. Sincethe machine’s mass was 11.5 tonnes (in air), a 55-tonne cranewas required, just barely passing the load limit of 60 tonnesfor the bridge.
The intention had been to reassemble the generator andturbine and mount them on the tripod foundation in closeproximity to the measuring station. This would have facilitatedconnecting the generator to the control system in the measur-ing station prior to deployment in order to verify functionality.However, a 12 kV power line passes across the road close tothe river shoreline on the south side of the river. With theturbine mounted, it would not be possible to pass that powerline when moving the machine onto the bridge for deployment.
Instead, a separate assembly site had to be established in aparking lot on the north side of the river.
The tripod foundation and the generator were assembledduring summer 2012, but the mounting of the turbine was heldoff until it was time for deployment. The generator, includingits Hall effect sensors and other instrumentation (for detailsof the generator, see [5]), thus spent the entire autumn andwinter outdoors in temperatures occasionally reaching below−20C.
Fig. 3. Detail of the testsite. Cables runs from the turbinator and ADCPs tothe downstream side of a bridge pillar, at the top of which they connect toan enclosure mounted on the bridge railing. From the enclosure, cables runon along the bridge to land and underground to the measuring station.
Pho
to:U
ppsa
laU
nive
rsity
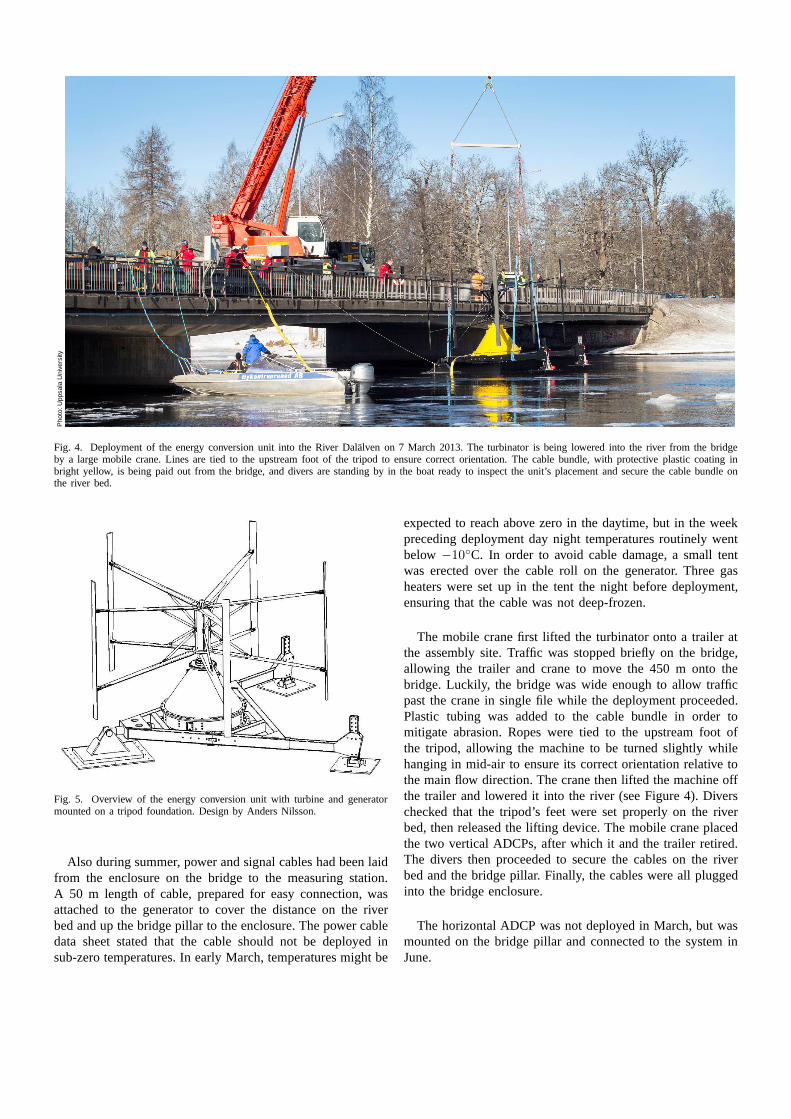
Fig. 4. Deployment of the energy conversion unit into the River Dalalven on 7 March 2013. The turbinator is being loweredinto the river from the bridgeby a large mobile crane. Lines are tied to the upstream foot ofthe tripod to ensure correct orientation. The cable bundle,with protective plastic coating inbright yellow, is being paid out from the bridge, and divers are standing by in the boat ready to inspect the unit’s placement and secure the cable bundle onthe river bed.
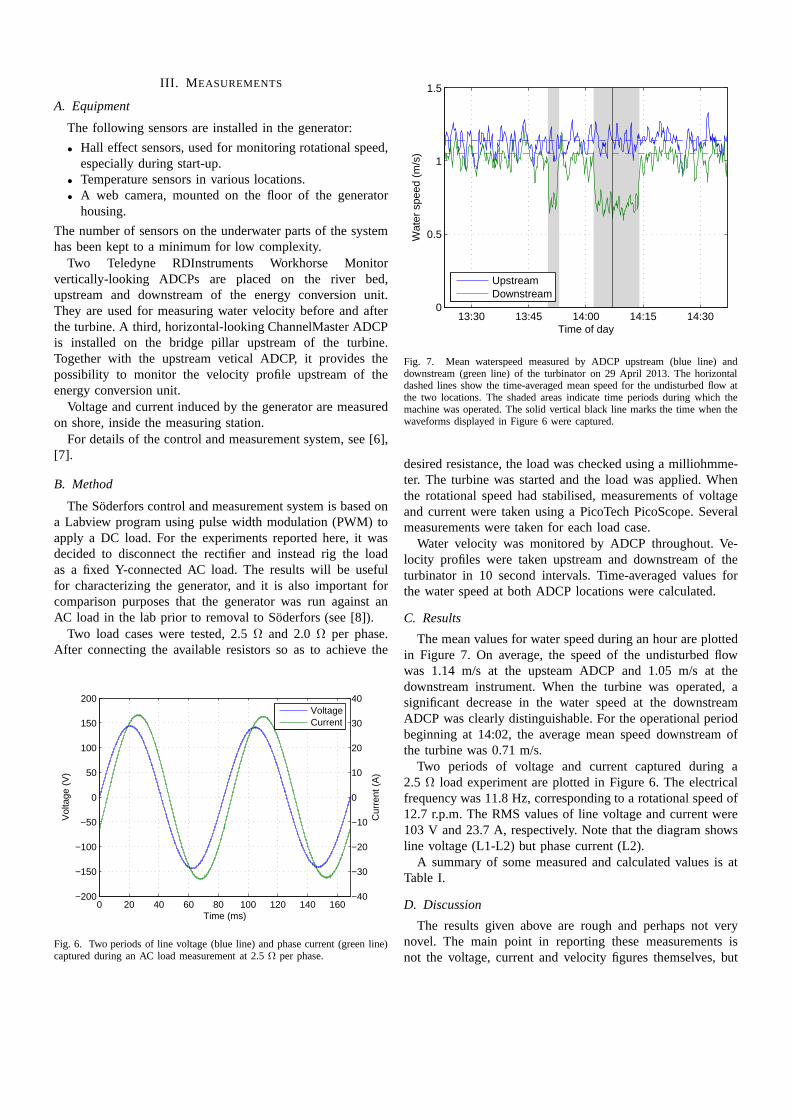
Fig. 5. Overview of the energy conversion unit with turbine and generatormounted on a tripod foundation. Design by Anders Nilsson.
Also during summer, power and signal cables had been laidfrom the enclosure on the bridge to the measuring station.A 50 m length of cable, prepared for easy connection, wasattached to the generator to cover the distance on the riverbed and up the bridge pillar to the enclosure. The power cabledata sheet stated that the cable should not be deployed insub-zero temperatures. In early March, temperatures mightbe
expected to reach above zero in the daytime, but in the weekpreceding deployment day night temperatures routinely wentbelow −10C. In order to avoid cable damage, a small tentwas erected over the cable roll on the generator. Three gasheaters were set up in the tent the night before deployment,ensuring that the cable was not deep-frozen.
The mobile crane first lifted the turbinator onto a trailer atthe assembly site. Traffic was stopped briefly on the bridge,allowing the trailer and crane to move the 450 m onto thebridge. Luckily, the bridge was wide enough to allow trafficpast the crane in single file while the deployment proceeded.Plastic tubing was added to the cable bundle in order tomitigate abrasion. Ropes were tied to the upstream foot ofthe tripod, allowing the machine to be turned slightly whilehanging in mid-air to ensure its correct orientation relative tothe main flow direction. The crane then lifted the machine offthe trailer and lowered it into the river (see Figure 4). Diverschecked that the tripod’s feet were set properly on the riverbed, then released the lifting device. The mobile crane placedthe two vertical ADCPs, after which it and the trailer retired.The divers then proceeded to secure the cables on the riverbed and the bridge pillar. Finally, the cables were all pluggedinto the bridge enclosure.
The horizontal ADCP was not deployed in March, but wasmounted on the bridge pillar and connected to the system inJune.
III. M EASUREMENTS
A. Equipment
The following sensors are installed in the generator:
• Hall effect sensors, used for monitoring rotational speed,especially during start-up.
• Temperature sensors in various locations.• A web camera, mounted on the floor of the generator
housing.
The number of sensors on the underwater parts of the systemhas been kept to a minimum for low complexity.
Two Teledyne RDInstruments Workhorse Monitorvertically-looking ADCPs are placed on the river bed,upstream and downstream of the energy conversion unit.They are used for measuring water velocity before and afterthe turbine. A third, horizontal-looking ChannelMaster ADCPis installed on the bridge pillar upstream of the turbine.Together with the upstream vetical ADCP, it provides thepossibility to monitor the velocity profile upstream of theenergy conversion unit.
Voltage and current induced by the generator are measuredon shore, inside the measuring station.
For details of the control and measurement system, see [6],[7].
B. Method
The Soderfors control and measurement system is based ona Labview program using pulse width modulation (PWM) toapply a DC load. For the experiments reported here, it wasdecided to disconnect the rectifier and instead rig the loadas a fixed Y-connected AC load. The results will be usefulfor characterizing the generator, and it is also important forcomparison purposes that the generator was run against anAC load in the lab prior to removal to Soderfors (see [8]).
Two load cases were tested, 2.5Ω and 2.0Ω per phase.After connecting the available resistors so as to achieve the
−40
−30
−20
−10
0
10
20
30
40
Cur
rent
(A
)
0 20 40 60 80 100 120 140 160−200
−150
−100
−50
0
50
100
150
200
Vol
tage
(V
)
Time (ms)
VoltageCurrent
Fig. 6. Two periods of line voltage (blue line) and phase current (green line)captured during an AC load measurement at 2.5Ω per phase.
13:30 13:45 14:00 14:15 14:300
0.5
1
1.5
Time of day
Wat
er s
peed
(m
/s)
UpstreamDownstream
Fig. 7. Mean waterspeed measured by ADCP upstream (blue line) anddownstream (green line) of the turbinator on 29 April 2013. The horizontaldashed lines show the time-averaged mean speed for the undisturbed flow atthe two locations. The shaded areas indicate time periods during which themachine was operated. The solid vertical black line marks the time when thewaveforms displayed in Figure 6 were captured.
desired resistance, the load was checked using a milliohmme-ter. The turbine was started and the load was applied. Whenthe rotational speed had stabilised, measurements of voltageand current were taken using a PicoTech PicoScope. Severalmeasurements were taken for each load case.
Water velocity was monitored by ADCP throughout. Ve-locity profiles were taken upstream and downstream of theturbinator in 10 second intervals. Time-averaged values forthe water speed at both ADCP locations were calculated.
C. Results
The mean values for water speed during an hour are plottedin Figure 7. On average, the speed of the undisturbed flowwas 1.14 m/s at the upsteam ADCP and 1.05 m/s at thedownstream instrument. When the turbine was operated, asignificant decrease in the water speed at the downstreamADCP was clearly distinguishable. For the operational periodbeginning at 14:02, the average mean speed downstream ofthe turbine was 0.71 m/s.
Two periods of voltage and current captured during a2.5 Ω load experiment are plotted in Figure 6. The electricalfrequency was 11.8 Hz, corresponding to a rotational speed of12.7 r.p.m. The RMS values of line voltage and current were103 V and 23.7 A, respectively. Note that the diagram showsline voltage (L1-L2) but phase current (L2).
A summary of some measured and calculated values is atTable I.
D. Discussion
The results given above are rough and perhaps not verynovel. The main point in reporting these measurements isnot the voltage, current and velocity figures themselves, but
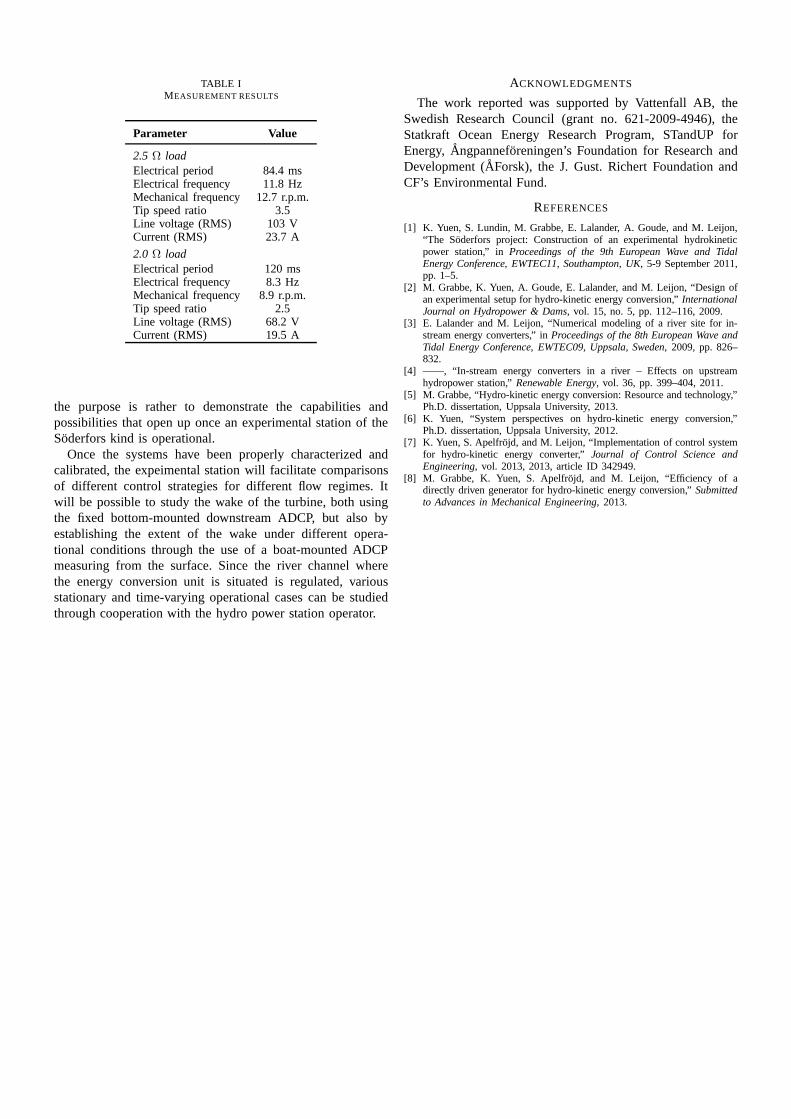
TABLE IMEASUREMENT RESULTS
Parameter Value
2.5 Ω loadElectrical period 84.4 msElectrical frequency 11.8 HzMechanical frequency 12.7 r.p.m.Tip speed ratio 3.5Line voltage (RMS) 103 VCurrent (RMS) 23.7 A
2.0 Ω loadElectrical period 120 msElectrical frequency 8.3 HzMechanical frequency 8.9 r.p.m.Tip speed ratio 2.5Line voltage (RMS) 68.2 VCurrent (RMS) 19.5 A
the purpose is rather to demonstrate the capabilities andpossibilities that open up once an experimental station of theSoderfors kind is operational.
Once the systems have been properly characterized andcalibrated, the expeimental station will facilitate comparisonsof different control strategies for different flow regimes.Itwill be possible to study the wake of the turbine, both usingthe fixed bottom-mounted downstream ADCP, but also byestablishing the extent of the wake under different opera-tional conditions through the use of a boat-mounted ADCPmeasuring from the surface. Since the river channel wherethe energy conversion unit is situated is regulated, variousstationary and time-varying operational cases can be studiedthrough cooperation with the hydro power station operator.
ACKNOWLEDGMENTS
The work reported was supported by Vattenfall AB, theSwedish Research Council (grant no. 621-2009-4946), theStatkraft Ocean Energy Research Program, STandUP forEnergy,Angpanneforeningen’s Foundation for Research andDevelopment (AForsk), the J. Gust. Richert Foundation andCF’s Environmental Fund.
REFERENCES
[1] K. Yuen, S. Lundin, M. Grabbe, E. Lalander, A. Goude, and M. Leijon,“The Soderfors project: Construction of an experimental hydrokineticpower station,” inProceedings of the 9th European Wave and TidalEnergy Conference, EWTEC11, Southampton, UK, 5-9 September 2011,pp. 1–5.
[2] M. Grabbe, K. Yuen, A. Goude, E. Lalander, and M. Leijon, “Design ofan experimental setup for hydro-kinetic energy conversion,” InternationalJournal on Hydropower & Dams, vol. 15, no. 5, pp. 112–116, 2009.
[3] E. Lalander and M. Leijon, “Numerical modeling of a riversite for in-stream energy converters,” inProceedings of the 8th European Wave andTidal Energy Conference, EWTEC09, Uppsala, Sweden, 2009, pp. 826–832.
[4] ——, “In-stream energy converters in a river – Effects on upstreamhydropower station,”Renewable Energy, vol. 36, pp. 399–404, 2011.
[5] M. Grabbe, “Hydro-kinetic energy conversion: Resourceand technology,”Ph.D. dissertation, Uppsala University, 2013.
[6] K. Yuen, “System perspectives on hydro-kinetic energy conversion,”Ph.D. dissertation, Uppsala University, 2012.
[7] K. Yuen, S. Apelfrojd, and M. Leijon, “Implementation of control systemfor hydro-kinetic energy converter,”Journal of Control Science andEngineering, vol. 2013, 2013, article ID 342949.
[8] M. Grabbe, K. Yuen, S. Apelfrojd, and M. Leijon, “Efficiency of adirectly driven generator for hydro-kinetic energy conversion,” Submittedto Advances in Mechanical Engineering, 2013.