the solar flare - squarespace · 500-mwp $0.022/wp for a ... “pursuant to section 202 of the...
TRANSCRIPT

The Solar Flare -1- SF-52017 April 2013
SPV Market Research October 31, 2017
THE SOLAR FLARE
Issue 5
Paula Mints, Chief Market Research Analyst
SPV Market Research
www.spvmarketresearch.com
408-221-1564
The Solar Flare -2- SF-52017 April 2013
SPV Market Research October 31, 2017
Copyright 2017 SPV Market Research
All rights reserved.
No material contained in this report may be reproduced in whole or in part without the
express written permission of SPV Market Research. This report is intended for the
sole and exclusive use of the original purchaser and may not be distributed or trans-
ferred in any form to any other person or entity.
SPV Market Research provides that the information in this report for informational
purposes only and does not grant any express or implied warranty, guaranty, or rep-
resentation concerning the information contained in this report, its merchantability, or its
fitness for a particular purpose or function. Any reference to any specific commercial
product, process, or service by trade name, trademark, manufacturer, or otherwise,
does not necessarily constitute or imply its endorsement, recommendation, or favoring
by SPV Market Research. Neither SPV Market Research nor any of its affiliates or
partners shall be liable to you or any third party in damages of whatever kind that may
result from any reliance on (or use of) any information contained in this report. By
receiving this report, you acknowledge that any reliance on information contained in this
report shall be at your sole risk.

The Solar Flare -3- SF-52017 April 2013
SPV Market Research October 31, 2017
SOLAR FLARE TABLE OF CONTENTS
Notes from the Market Research Underground: US Trade Case Recommendations Analysis and
Implications ......................................................................................................................................... 5
Table 1: Tariff Recommendations ................................................................................................... 5
Chairman Schmidtlein: .................................................................................................................... 6
Vice Chairman David S. Johanson and Commissioner Irving A. Williamson ................................... 6
Commissioner Meredith M. Broadbent .......................................................................................... 7
What does it mean? ........................................................................................................................ 8
Notes from the Market Research Underground: Implications of DoE/FERC Proposed Grid Resiliency
Pricing Rule for the US Solar Industry and Australia’s National Energy Guarantee ............................ 9
Australia’s National Energy Guarantee ........................................................................................... 9
Figure 1: Australia Forecast to 2019 .............................................................................................. 11
US DoE Proposed Grid Resiliency Pricing Rule .............................................................................. 11
Figure 2: US Forecast to 2019 ....................................................................................................... 12
Implications ................................................................................................................................... 13
Hawaii Proposes Smart Export and embarks on an experiment in controlling DER ......................... 14
Figure 3: Tesla Powerwall Installation in Hawaii ........................................................................... 14
Hawai’i PUC Steps in with options ................................................................................................ 15
Table 2: Hawai’i Smart Charging/Exporting and Customer Grid Supply+ Programs ..................... 16
Does the future for DG Solar and Utilities Resemble a Partnership? ........................................... 16
Commentary .................................................................................................................................. 17
Supply Update – Yes, depending on the country, there is a module shortage ................................. 18
Figure 4: Solar Cell Commercial Capacity 2006-2016 .................................................................... 18
Figure 5: Solar Cell Capacity and 2017 Demand Estimate ............................................................. 20
Q1 through Q3 Shipment Estimate ............................................................................................... 20
Figure 6: 2017 PV Shipments through Q3 Estimate by Country ................................................... 21
Figure 7: 2017 PV Shipments through Q3 Estimate by Technology .............................................. 21
Where is all this PV going, what could derail the forecast ............................................................ 22
Figure 8: 2017 PV Estimated Demand ........................................................................................... 23
Figure 9: 2017 PV Forecast through 2019 ..................................................................................... 23
The Solar Flare -4- SF-52017 April 2013
SPV Market Research October 31, 2017
Highly Competitive Industries and Their Highly Expected Mergers .................................................. 24
The Walking Solar Unprofitable .................................................................................................... 25
Figure 10: Gintech, NSP and Solartech Revenues and Profit/Loss 2014 through Half Year 2017 26
“The best laid schemes o’ Mice an’ Men Gang aft agley”, Robert Burns, To a Mouse ................. 26
Markets ............................................................................................................................................. 27
Egypt .............................................................................................................................................. 27
India ............................................................................................................................................... 27
US .................................................................................................................................................. 28
Catalonia and Spain ....................................................................................................................... 29
Figure 11: Spain’s Historical PV Growth High and its Long, Long Low, 2005-2016 ....................... 30
Companies ......................................................................................................................................... 31
China .............................................................................................................................................. 31
US .................................................................................................................................................. 32
US/Puerto Rico .............................................................................................................................. 33
US .................................................................................................................................................. 35
Japan .............................................................................................................................................. 35
Iran/Norway .................................................................................................................................. 36
The Solar Flare -5- SF-52017 April 2013
SPV Market Research October 31, 2017
Notes from the Market Research Underground: US Trade Case Recommenda-
tions Analysis and Implications
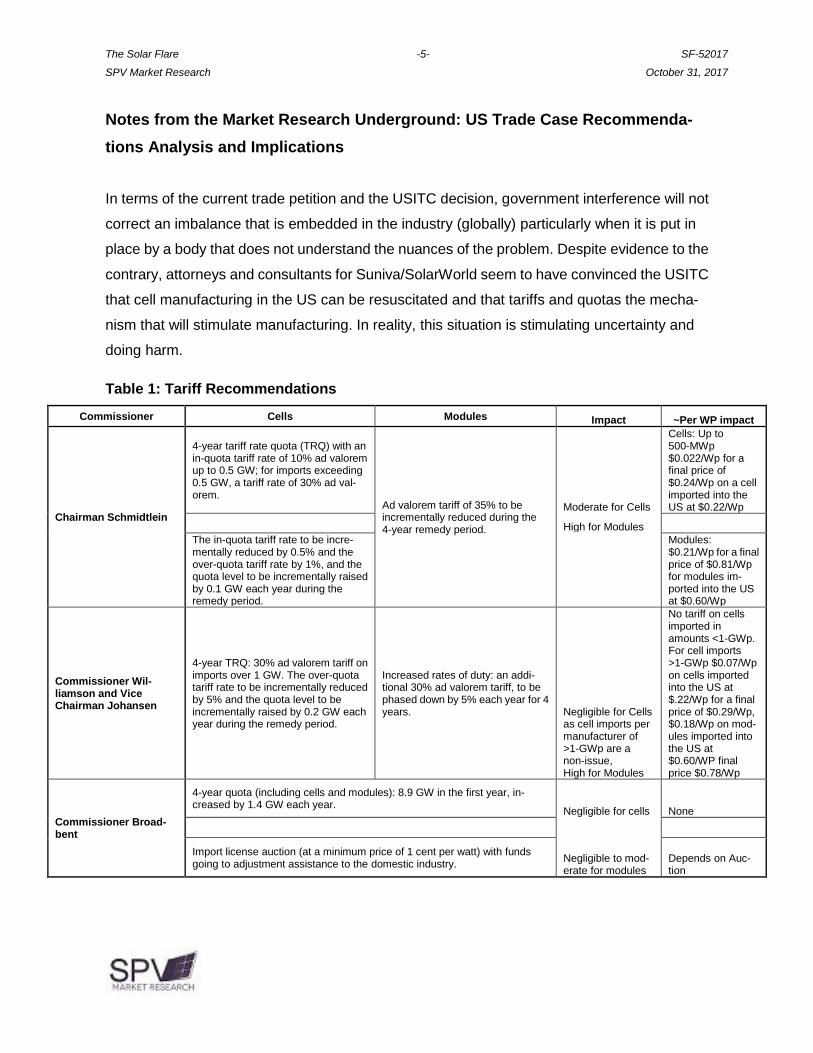
In terms of the current trade petition and the USITC decision, government interference will not
correct an imbalance that is embedded in the industry (globally) particularly when it is put in
place by a body that does not understand the nuances of the problem. Despite evidence to the
contrary, attorneys and consultants for Suniva/SolarWorld seem to have convinced the USITC
that cell manufacturing in the US can be resuscitated and that tariffs and quotas the mecha-
nism that will stimulate manufacturing. In reality, this situation is stimulating uncertainty and
doing harm.
Table 1: Tariff Recommendations
Commissioner Cells Modules Impact ~Per WP impact
Chairman Schmidtlein
4-year tariff rate quota (TRQ) with an in-quota tariff rate of 10% ad valorem up to 0.5 GW; for imports exceeding 0.5 GW, a tariff rate of 30% ad val-orem.
Ad valorem tariff of 35% to be incrementally reduced during the 4-year remedy period.
Moderate for Cells
Cells: Up to 500-MWp $0.022/Wp for a final price of $0.24/Wp on a cell imported into the US at $0.22/Wp
High for Modules
The in-quota tariff rate to be incre-mentally reduced by 0.5% and the over-quota tariff rate by 1%, and the quota level to be incrementally raised by 0.1 GW each year during the remedy period.
Modules: $0.21/Wp for a final price of $0.81/Wp for modules im-ported into the US at $0.60/Wp
Commissioner Wil-liamson and Vice Chairman Johansen
4-year TRQ: 30% ad valorem tariff on imports over 1 GW. The over-quota tariff rate to be incrementally reduced by 5% and the quota level to be incrementally raised by 0.2 GW each year during the remedy period.
Increased rates of duty: an addi-tional 30% ad valorem tariff, to be phased down by 5% each year for 4 years. Negligible for Cells
as cell imports per manufacturer of >1-GWp are a non-issue, High for Modules
No tariff on cells imported in amounts <1-GWp. For cell imports >1-GWp $0.07/Wp on cells imported into the US at $.22/Wp for a final price of $0.29/Wp, $0.18/Wp on mod-ules imported into the US at $0.60/WP final price $0.78/Wp
Commissioner Broad-bent
4-year quota (including cells and modules): 8.9 GW in the first year, in-creased by 1.4 GW each year.
Negligible for cells None
Import license auction (at a minimum price of 1 cent per watt) with funds going to adjustment assistance to the domestic industry.
Negligible to mod-erate for modules
Depends on Auc-tion

The Solar Flare -6- SF-52017 April 2013
SPV Market Research October 31, 2017
Chairman Schmidtlein: Along with recommending tariffs, Chairman Schmidtlein recom-
mends that the president initiate negotiations with countries subject to tariffs to address the
underlying cause of the trade petition. Chairman Schmidtlein excluded Australia, the
CAFTA-DR countries, Colombia, Israel, Jordan, Panama, Peru, Singapore, and the benefi-
ciary countries under the Caribbean Basin Economic Recovery Act from remedies.
Commentary on Chairman Schmidtlein’s proposed remedy: Concerning Chairman’s recom-
mendations the suggested tariff on cells is negligible and will likely be absorbed by larger
producers while the tariff on imported modules is too high to be blanket-absorbed but likely will
be absorbed for large quantity or multi-megawatt level buyers. Another option for producers
is to ship product through the excluded countries. The remedy does not apply to First Solar
(3.6-GWp CdTe capacity), Solar Frontier (1-GWp CIS capacity) and REC (1.3-GWp mul-
ticrystalline capacity in Singapore). REC, which is already ramping capacity is likely to be
encouraged if this recommendation is adopted.
Vice Chairman David S. Johanson and Commissioner Irving A. Williamson: Along with
tariffs recommend expedited consideration of some unnamed sort for those harmed by imports
(Suniva and SolarWorld), as well as exclusion of certain products and domestic support of
some unnamed sort for US companies. Excludes imports from Canada, Australia, Co-
lombia, Costa Rica, the Dominican Republic, El Salvador, Guatemala, Honduras, Israel,
Jordan, Nicaragua, Panama, Peru, Singapore and the Caribbean Basin Economic Re-
covery Act.
Commentary on Vice Chairman Johanson and Commissioner Williamson’s recommen-
dation: Impact on cell imports negligible as the US has only slightly over 1-GWp of module
assembly capacity. The likelihood of a manufacturer shipping >1-GWp of cells into the
US approaches zero. The higher tariff on modules is unlikely to be absorbed even for
larger buyers. An option for producers is to ship product through the excluded countries.
The Solar Flare -7- SF-52017 April 2013
SPV Market Research October 31, 2017
Commissioner Meredith M. Broadbent: In her recommendation statement Commissioner
Broadbent wrote: “Pursuant to Section 202 of the Trade Act of 1974, I have determined that
CSPV products subject to this investigation are being imported into the United States in such
increased quantities as to be a substantial cause of serious injury to the domestic industry
producing CSPV products.” Her solution is to leave the tariff remedy ambiguous while limiting
the amount that can be imported and thus potentially limiting the market size. Her assessment
suggests a breathtakingly poor understanding of the US solar market and would insinuate a
high degree of turmoil and uncertainty into an already vulnerable market.
On the other hand, Commissioner Broadbent indicated an understanding of the need to avoid
further damage: “My recommendations are intended to address the serious injury while
seeking to avoid inflicting additional damage on the broader solar energy industry in the United
States. The U.S. solar energy industry has been a relative success story in making progress
toward grid parity with a carbon neutral source of power.”
Commissioner Broadbent’s suggestion to use an auction mechanism to set tariffs would insert
even more uncertainty into the market and is a likely nonstarter. The imposition of a quota
(8.9-GWp for year one) has the potential of limiting the market in that the US has slightly over
900-MWp of cell capacity (including First Solar) and must import cells for its slightly over
1-GWp of module assembly capacity. REC, First Solar (including its US capacity) and Solar
Frontier have ~6-GWp of thin film and crystalline capacity considered together. Without con-
sidering inventory, this indicates an availability of 6.6-GWp of imports not subject to tariff and,
including the quota for year one, a market ceiling of 15.5-GWp.
Commissioner Broadbent assumes that the 1-cent/Wp will result in $89-million in additional
revenue for the US, rising annually. However, there is no guarantee that the auction will result
in a tariff of just one cent or that anyone will participate in it. Broadbent excludes the countries
mentioned by the other commissioners while suggesting Mexico have annual import quota of
720-MWp increasing by 115-MWp annually. Manufacturers could ship product through the
excluded countries.

The Solar Flare -8- SF-52017 April 2013
SPV Market Research October 31, 2017
What does it mean?
Unfortunately, the US solar industry must now contend with several weeks of uncertainty while
SEIA lobbies Commerce Secretary Wilbur Ross and US Trade Representative Robert
Lighthizer. Both Ross and Lighthizer reportedly have views similar to Trump’s on tariffs that
is, they support imposition of tariffs with the view that there will be a positive impact on US
manufacturing. Ross recently favored tariffs on Canadian lumber but has chosen to defer the
decision on steel imports until after tax reform. Lighthizer has advocated increasing tariffs on
imports of certain products and commodities while arguing against Japan’s imposition of tariffs
on US beef.
President Trump’s position on tariffs is clear in that he favors them. However, as he has also
been clear about his preference of coal over solar and wind, it is unclear what he will choose to
do with the three options that will be presented to him. Trump could choose to impose tariffs
simply to make a point and without regard to the impact on the US solar industry.
Again, this means that the US and global solar industry will need to contend with uncertainty as
well as whether Ross, Lighthizer and eventually President Trump will decide to make any
remedy retroactive to November 1 – he may, or, he may not insinuate a retroactive component
to what is frankly, a messy and unfortunate situation that harms many and benefits no one.

The Solar Flare -9- SF-52017 April 2013
SPV Market Research October 31, 2017
Notes from the Market Research Underground: Implications of DoE/FERC Pro-
posed Grid Resiliency Pricing Rule for the US Solar Industry and Australia’s
National Energy Guarantee
What do the US DoE Grid Resiliency Pricing Rule and Australia’s proposed National Energy
Guarantee have in common? – both decisions represent attempts to balance the grid while
appearing to favor fossil fuels for electricity generation ahead solar and wind.
The federal governments of both Australia and the US are defining energy security and relia-
bility as possible only with fossil fuels and nuclear energy as the base upon which other energy
options (renewables) can be built. This argument assumes that renewable energy technolo-
gies are inherently unreliable and ignores storage, system configurations that use different RE
technologies, energy efficiency and conservation as the energy paradigm of the future. Doing
so ignores international agreement that the climate warming must be held to 2 degrees cen-
tigrade or lower.
Australia’s National Energy Guarantee
Australia’s proposed National Energy Guarantee (NEG) does not include a renewable energy
target, carbon pricing or other clean energy mechanism. It does have an emissions guar-
antee but favors coal, natural gas and oil via its reliability guarantee. Emissions and reliability
guarantees can be traded between utilities and even traded internationally. The emissions
guarantee may be fully satisfied through international marketing. The guarantee levels have
not been set and will vary state-by-state depending on the level of wind and solar in each state.
The state of Western Australia is not part of the plan. In sum, at this point the NEG is a bi-
furcated attempt to satisfy all stakeholders while in reality offering an advantage to coal.
As to Australia’s future deployment of wind and solar, the country’s Energy Minister Josh
Frydenberg indicated that the country’s RE target appears to be 95% met via projects in de-
velopment and already installed. Recently Minister Frydenberg indicated that new coal plants
need to be considered and indicated that the government could intervene to ensure a stable
energy supply.

The Solar Flare -10- SF-52017 April 2013
SPV Market Research October 31, 2017
NEG Commentary: Concerning Australia’s National Energy Guarantee is the government
intervening, as Minister Frydenberg suggested was possible, to ensure a stable energy supply
based on coal? Details about the NEG are in such short supply that an assessment of its
impact is in the realm of speculation. Though an anti-RE stance can be inferred from Energy
Minister Frydenberg’s comments, it cannot be confirmed even though the bare outline of the
NEG indicates a preference for fossil fuel generated electricity.
Two well-known entities have taken starkly different views on the NEG. Despite a lack of
detail Bloomberg termed it “innovative” and called it a “template” for other countries. An idea
can be innovative, though the devil is in the details. Templates can be vague but need to be
vetted and implemented before they can be declared innovative.
Meanwhile, Deutsche Bank downgraded the value of Tilt Renewables, an Australian wind and
solar development firm, assessing that its 1.7-GWp pipeline had little chance of being devel-
oped.
When two companies, one known for punditry and one a financial institution make radically
different judgements on a subject, follow the money.
The proposed NEG, even sans salient details, is already affecting the market for solar de-
ployment in Australia. The availability of storage could make a significant difference to its
residential and small commercial market for PV deployment.
In the future the onus to develop solar and wind projects in Australia may fall on its states.
Victoria announced its VRET (renewable energy target) of VRET) of 25% renewables in the
energy mix by 2020, and up to 40% by 2025. The state of Victoria will also hold an auction for
650-MWp of RE projects.

The Solar Flare -11- SF-52017 April 2013
SPV Market Research October 31, 2017
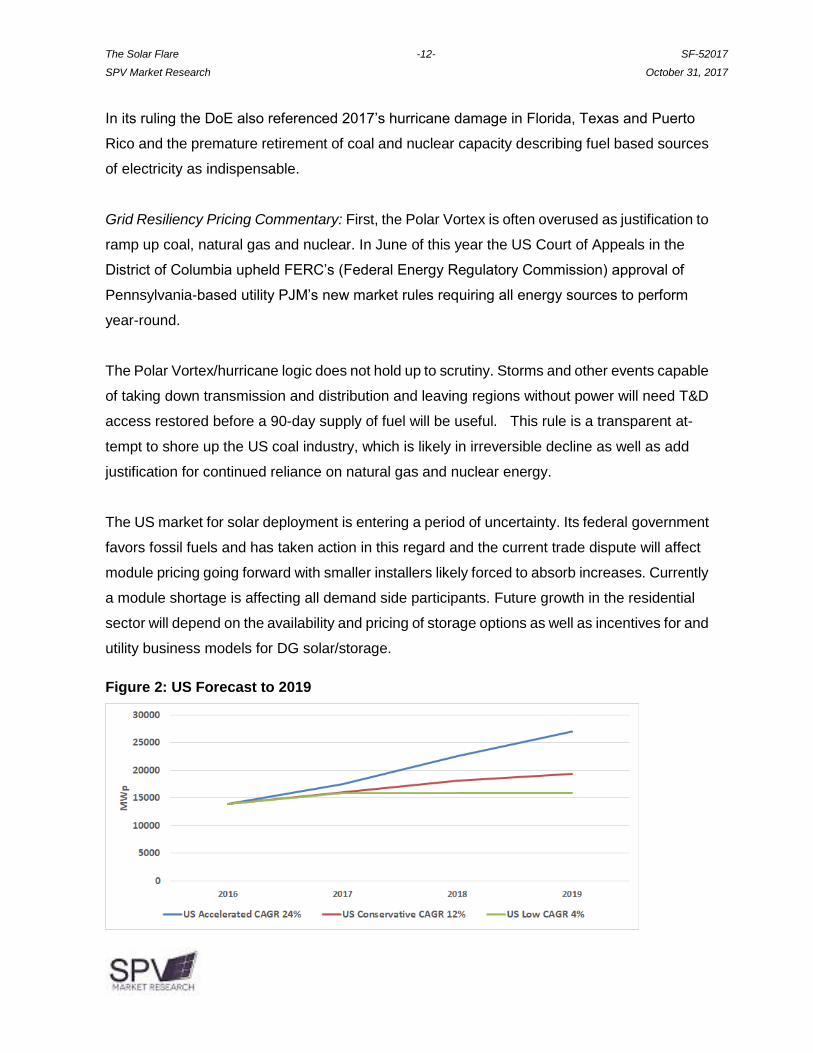
Figure 1 offers a short-term forecast for Australia from three perspectives, low, conservative
and accelerated.
Figure 1: Australia Forecast to 2019
US DoE Proposed Grid Resiliency Pricing Rule
In the US battle lines have been drawn with those in favor of the ruling, such as coal and nu-
clear provider FirstEnergy, and those against, including the IRC (the ISO/RTO Council). The
proposed ruling essentially provides favorable pricing to coal, natural gas and nuclear energy
by offering full cost recovery to power plants that stockpile a 90-day fuel supply not subject to
cost-based recovery. The proposed ruling would affect regions with organized energy and
capacity markets, that is, traditional wholesale markets for electricity. These markets are
usually found in the Southeast, Southwest and Northwest. Utilities in these markets typically
own generation, transmission and distribution.
The DoE based its logic for the proposed ruling on the 2014 Polar Vortex. During the first
week in January 2014 the Eastern US experienced a historic cold front that saw temperatures
drop 20 to 30 degrees below normal. The US experienced another severe cold front in No-
vember 2014. Approximately 35,000 MW of generating capacity was unavailable due to fuel
shortages and equipment breakdowns.
The Solar Flare -12- SF-52017 April 2013
SPV Market Research October 31, 2017
In its ruling the DoE also referenced 2017’s hurricane damage in Florida, Texas and Puerto
Rico and the premature retirement of coal and nuclear capacity describing fuel based sources
of electricity as indispensable.
Grid Resiliency Pricing Commentary: First, the Polar Vortex is often overused as justification to
ramp up coal, natural gas and nuclear. In June of this year the US Court of Appeals in the
District of Columbia upheld FERC’s (Federal Energy Regulatory Commission) approval of
Pennsylvania-based utility PJM’s new market rules requiring all energy sources to perform
year-round.
The Polar Vortex/hurricane logic does not hold up to scrutiny. Storms and other events capable
of taking down transmission and distribution and leaving regions without power will need T&D
access restored before a 90-day supply of fuel will be useful. This rule is a transparent at-
tempt to shore up the US coal industry, which is likely in irreversible decline as well as add
justification for continued reliance on natural gas and nuclear energy.
The US market for solar deployment is entering a period of uncertainty. Its federal government
favors fossil fuels and has taken action in this regard and the current trade dispute will affect
module pricing going forward with smaller installers likely forced to absorb increases. Currently
a module shortage is affecting all demand side participants. Future growth in the residential
sector will depend on the availability and pricing of storage options as well as incentives for and
utility business models for DG solar/storage.
Figure 2: US Forecast to 2019
The Solar Flare -13- SF-52017 April 2013
SPV Market Research October 31, 2017
Implications
Both Australia’s National Energy Guarantee and the US DoE’s proposed Grid Resiliency
Pricing Rule have the potential to alter the future of solar deployment in their respective
countries. For Australia it is difficult to assess the market effect as the NEG lacks sufficient
detail. The intent, as implied by the country’s Energy Minister, is to increase and favor coal.
Until the details become clear it is best to take him at his word.
For the US, uncertainty over the trade case led to a shortage of modules as suppliers (for the
most part) wait for the proposed remedy. The DoE’s proposed price rule, should FERC rule in
the DoE’s favor, will affect utility scale wind and solar deployment as it will upend the playing
field rending it decidedly uneven and favorable to fossil fuels.
The Solar Flare -14- SF-52017 April 2013
SPV Market Research October 31, 2017
Hawaii Proposes Smart Export and embarks on an experiment in controlling
DER
Utilities around the world are waking up to the fact that controlling and profiting from residential
and small commercial solar is possible via digital market places. The trend– sort of,
if-you-can’t-fight-em-join-em – is nascent but there is enough data to state that it is taking hold
in markets that have strong solar residential markets such as the US and Australia. One im-
portant question about utility control of DER (distributed energy resource) is whether con-
sumers will want to give up even more control to utilities. Another, and perhaps more im-
portant question is, should they?
In June 2015 Hawaii’s governor signed House Bill 623 setting the states RPS at 30% re-
newables by 2020, 70% renewables by 2040 and 100% renewables by 2045. Hawaii fol-
lowed the increase in its RPS up in October by ending net metering and replacing it with two
options, a grid supply option that is based on the avoided cost of fossil fuel generation
measured during peak hours of July 2014 through June 2015 and a self-supply option. Fol-
lowing the changes to its net metering program demand for residential solar installations in
Hawaii slowed and has continued slowly.
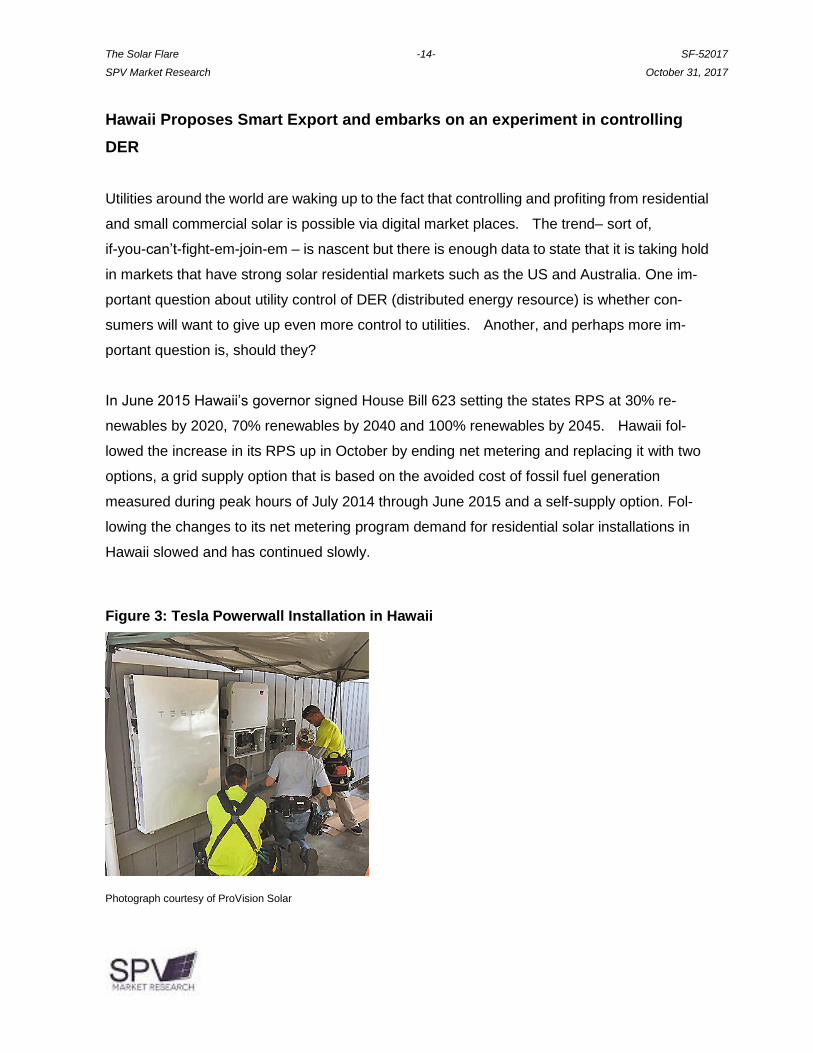
Figure 3: Tesla Powerwall Installation in Hawaii
Photograph courtesy of ProVision Solar
The Solar Flare -15- SF-52017 April 2013
SPV Market Research October 31, 2017
Hawai’i PUC Steps in with options
In October the Hawai’i PUC stepped in with two options under order 34924 for PV systems with
and without storage. The options have relatively few megawatts available for customers and
may be oversubscribed rapidly.
The Smart Charging and Exporting Program allows customers with PV/Storage installations to
charge their batteries during the day for use during the evening to provide electricity to their
homes. These customers have the option to be compensated for electricity exported to the
grid from 4pm to 9am. No compensation is available from 9am to 4pm. Electricity is credited
monthly for electricity sent to the grid with unused credits expiring at the end of the year. There
is an annual true-up. There are 35 MWp available in this program: HECO 25-MWp, HELCO
5-MWp, MECO 5-MWp.
The Customer Grid Supply+ Program allows customers to continuing receiving a credit for
exporting electricity to the grid if they install equipment that allows the utility to manage elec-
tricity from the system as needed for grid stability. Electricity fed into the grid is credited
monthly and there is an annual true-up. Customers of the current Customer Grid Supply pro-
gram are grandfathered in at the existing rates for five years and current net metered cus-
tomers can join the new program. There are 49-MWp available in this program: HECO
35-MWp, HELCO 7-MWp, MECO 7-MWp.
The Solar Flare -16- SF-52017 April 2013
SPV Market Research October 31, 2017
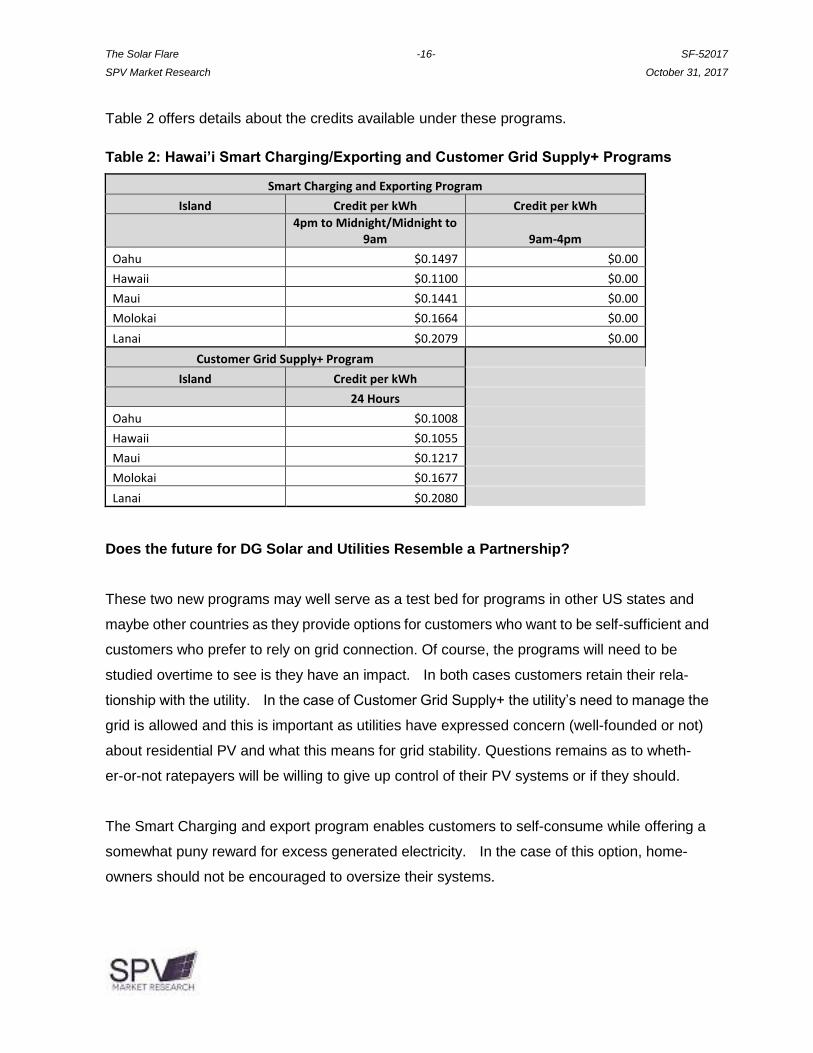
Table 2 offers details about the credits available under these programs.
Table 2: Hawai’i Smart Charging/Exporting and Customer Grid Supply+ Programs
Smart Charging and Exporting Program
Island Credit per kWh Credit per kWh
4pm to Midnight/Midnight to
9am 9am-4pm
Oahu $0.1497 $0.00
Hawaii $0.1100 $0.00
Maui $0.1441 $0.00
Molokai $0.1664 $0.00
Lanai $0.2079 $0.00
Customer Grid Supply+ Program
Island Credit per kWh
24 Hours
Oahu $0.1008
Hawaii $0.1055
Maui $0.1217
Molokai $0.1677
Lanai $0.2080
Does the future for DG Solar and Utilities Resemble a Partnership?
These two new programs may well serve as a test bed for programs in other US states and
maybe other countries as they provide options for customers who want to be self-sufficient and
customers who prefer to rely on grid connection. Of course, the programs will need to be
studied overtime to see is they have an impact. In both cases customers retain their rela-
tionship with the utility. In the case of Customer Grid Supply+ the utility’s need to manage the
grid is allowed and this is important as utilities have expressed concern (well-founded or not)
about residential PV and what this means for grid stability. Questions remains as to wheth-
er-or-not ratepayers will be willing to give up control of their PV systems or if they should.
The Smart Charging and export program enables customers to self-consume while offering a
somewhat puny reward for excess generated electricity. In the case of this option, home-
owners should not be encouraged to oversize their systems.
The Solar Flare -17- SF-52017 April 2013
SPV Market Research October 31, 2017
Customer Grid Supply+ offers below kWh rates for electricity fed into the grid in excess of the
home’s needs, while requiring that the ratepayer give up control of the PV system should the
utility feel the need to curtail its output. The CGS+ option does not offer compensation gen-
erous enough to drive demand and ratepayers may balk at the control option – if, that is, they
realize what that it means giving up control. Installers may find this option a hard sell.
Commentary
So, do these two plans come close to an end user/utility partnership? The answer is that they
represent an attempt by Hawai’i’s PUC to design a partnership under its own terms and its own
definition in which consumers for the CGS+ give up the right to give permission on a
case-by-case basis should the utility need access to their systems for purposes of curtailment.
Blanket permission for anything is almost never a good idea. Unfortunately, consumers of all
goods and services have grown accustomed to agreeing to blanket permission when it is re-
quirement to get something they want. Concerning the CGS+, Hawai’i’s utility ratepayers need
to pause, think and ask for a program with better kWh rewards and that offers a fair and bal-
anced partnership between themselves and their utility.
The Solar Flare -18- SF-52017 April 2013
SPV Market Research October 31, 2017
Supply Update – Yes, depending on the country, there is a module shortage
The PV industry is at a high degree of capacity utilization in 2017 driven by strong demand in
China for PV deployment. Globally 92-GWp is on track to be installed in 2017. Currently the
industry has 94-GWp of manufacturing capacity and at the beginning of the year there was
3-GWp of inventory on the supply and demand sides. This means that in 2017, and in a
perfect world with no unexpected manufacturing downtime, the industry will be ~97% capacity
utilization. It is highly likely that inventory will be worked off in 2017 leaving no cushion for
2018. Given current supply constraints manufacturers will need to make some hard decisions
about capacity additions. Additional module assembly will not ameliorate the situation. Addi-
tional cell capacity is required and the decision to add capacity in an incentive or mandate
driven industry is not to be taken lightly.
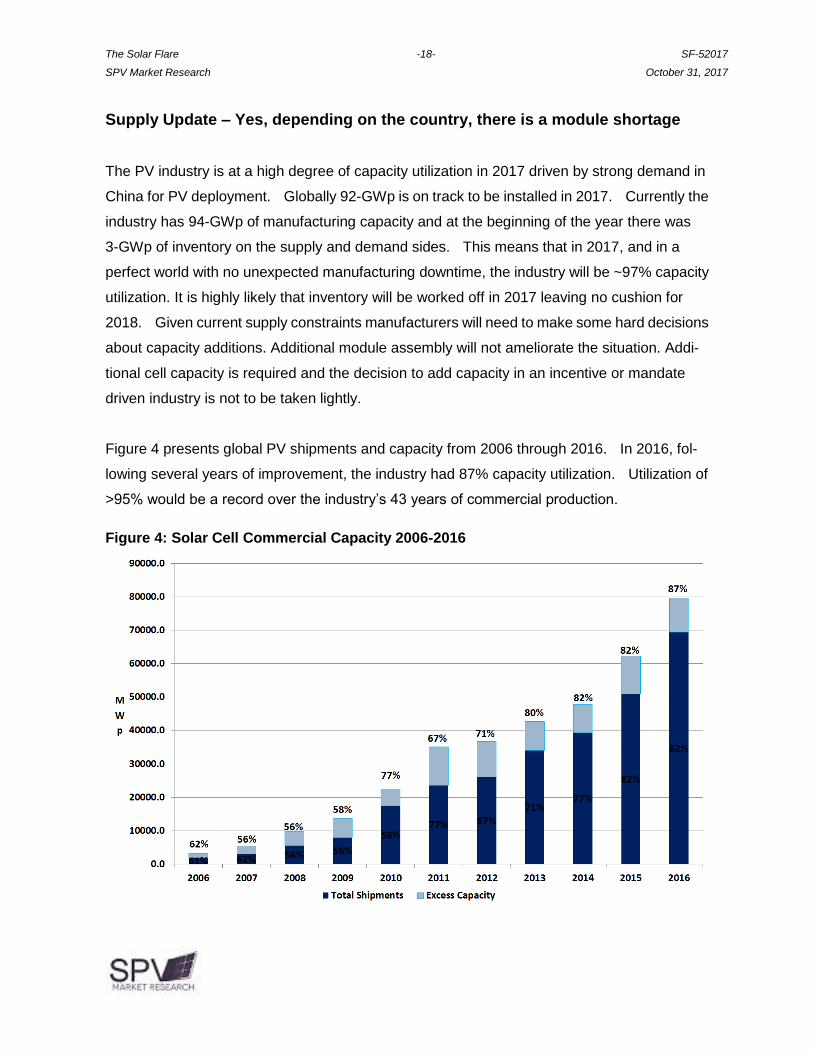
Figure 4 presents global PV shipments and capacity from 2006 through 2016. In 2016, fol-
lowing several years of improvement, the industry had 87% capacity utilization. Utilization of
>95% would be a record over the industry’s 43 years of commercial production.
Figure 4: Solar Cell Commercial Capacity 2006-2016

The Solar Flare -19- SF-52017 April 2013
SPV Market Research October 31, 2017
Installers in the US and other countries are currently experiencing a shortage in module
availability. The shortage is not merely one of perception, supply is tight, the market in China
is booming and many manufacturers delayed orders from US installers and module assem-
blers awaiting a decision on recommended remedies in the trade case. Well, the recom-
mendations are in and the uncertainty remains as everyone waits for President Trump’s de-
cision.
Manufacturers in countries affected by the upcoming tariffs will need to assess the damage
and consider whether Trump – on his own – will make the chosen remedy retroactive. the
value of the US market and develop a pricing strategy to take the changes into account. A few
manufacturers have offered guaranteed pricing for future orders, in particular, large quantity
orders. In an industry with a history of broken contracts and the ensuing litigation caution is the
best way to approach these offers.
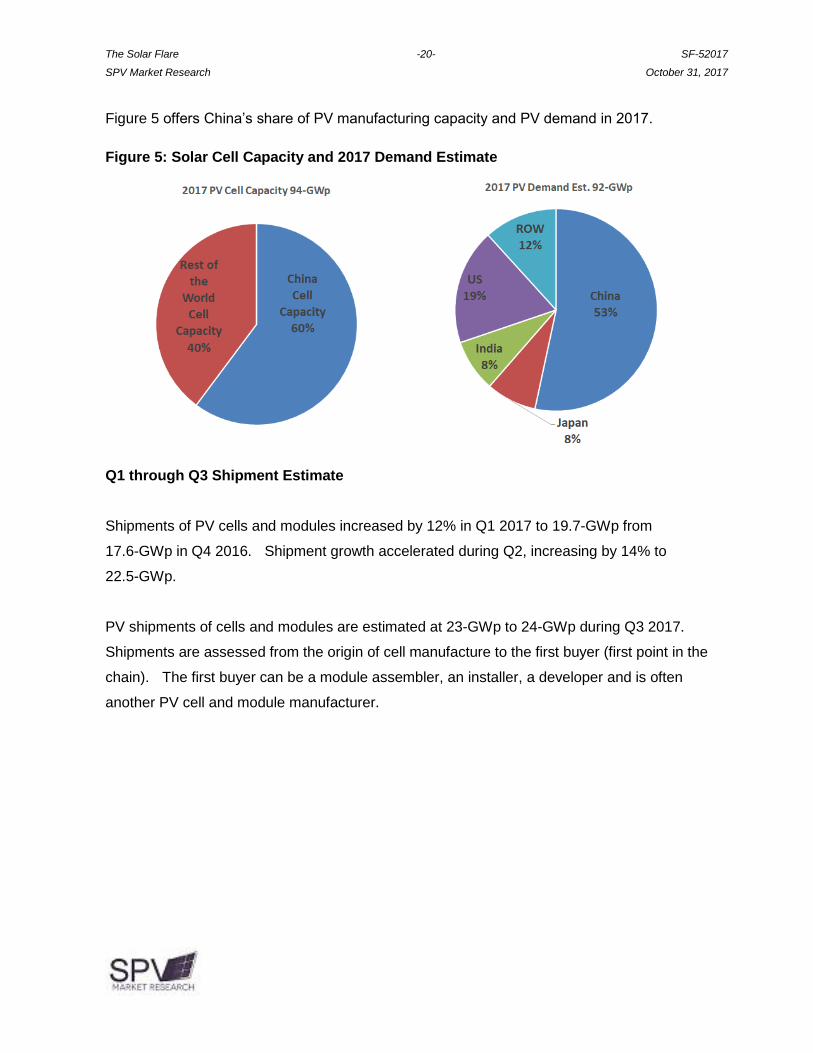
The other issue is the dominance of China’s PV manufacturers. China has, including its
off-shore cell manufacturing capacity, 60% of global capacity to manufacture cells and as it will
install close to 50-GWp in 2017 it is 53% of the market. As no markets are currently any more
profitable than its domestic market why should it bother with the US, Europe and India? In
poker, and in any negotiation, the person who can walk away from the table has the most
power.
The current shortage has come about because China has, at least temporarily, walked away
from the table. In a year when demand will be met only because there is available inventory
on the demand and supply sides of the industry the world market needs China’s solar manu-
facturers more than they needs the world market.
The Solar Flare -20- SF-52017 April 2013
SPV Market Research October 31, 2017
Figure 5 offers China’s share of PV manufacturing capacity and PV demand in 2017.
Figure 5: Solar Cell Capacity and 2017 Demand Estimate
Q1 through Q3 Shipment Estimate
Shipments of PV cells and modules increased by 12% in Q1 2017 to 19.7-GWp from
17.6-GWp in Q4 2016. Shipment growth accelerated during Q2, increasing by 14% to
22.5-GWp.
PV shipments of cells and modules are estimated at 23-GWp to 24-GWp during Q3 2017.
Shipments are assessed from the origin of cell manufacture to the first buyer (first point in the
chain). The first buyer can be a module assembler, an installer, a developer and is often
another PV cell and module manufacturer.

The Solar Flare -21- SF-52017 April 2013
SPV Market Research October 31, 2017
Figure 6 presents the share of PV shipments by country through the estimate for Q3 2017.
Figure 6: 2017 PV Shipments through Q3 Estimate by Country
Crystalline manufacturers are shifting manufacturing focus to monocrystalline assuming a
higher margin for cells and shifting module assembly to 72+cell modules. PERC (passivated
emitter rear cell) technology is the announced focus of most crystalline manufacturers with
equipment orders confirming the trend. Shipments of monocrystalline PV increased by 19% in
Q2 2017 to 11.3-GWp from 9.5-GWp in Q1. Crystalline share of shipments was ~95% of total
during Q1 and Q2 2017.
Monocrystalline share of shipments increased by two percentage points in Q2 and will surpass
shipments of multi-crystalline in 2017, the first time that monocrystalline share of shipments
surpassed that of multicrystalline since 1998.
Figure 7 offers PV shipment shares by technology for Q1, Q2 and a Q3 estimate.
Figure 7: 2017 PV Shipments through Q3 Estimate by Technology

The Solar Flare -22- SF-52017 April 2013
SPV Market Research October 31, 2017
Where is all this PV going, what could derail the forecast
As indicated above, Manufacturers based in China (including capacity in other countries) have
60% of global capacity to manufacture PV cells. Though this capacity is primarily for crystal-
line, China also has a-Si, CIGS and CdTe capacity. At an estimated 53% of global installations
in 2017, China is also the most significant market for PV deployment.
China’s market is government controlled. Though a rapid shutdown of its market is unlikely, it is
possible that its central government will eventually put stricter controls on the number of PV
systems installed and connected to the grid. China’s government is ramping its battery ca-
pacity. Once capacity is ramped and commercially viable this capacity could resolve the
country’s ongoing grid issues.
Figure 5 offers an estimate of demand by the four major global markets for PV deployment and
the rest of the world. Each of the major markets in Figure 5 have areas of concern.
The US has a focus on fossil fuels and the DoE has ordered FERC (Federal Energy Regulatory
Commission) to institute preferable pricing for coal, natural gas and nuclear energy and has
insinuated instability into its market via the trade petition.
India has an unprofitable market with a high degree of market manipulation and graft. PPA
bidding is extremely low and though this is often celebrated as progress, the underlying soft
costs such as bribes are left undiscussed and should be included in any discussion of system
costs in India.
Changes in the rules for Japan’s FiTs indicate that the market for large scale deployment will
continue to soften while residential and small commercial may see a resurgence with battery
systems. However, the availability and safety of lithium ion batteries might stall growth.
The Solar Flare -23- SF-52017 April 2013
SPV Market Research October 31, 2017
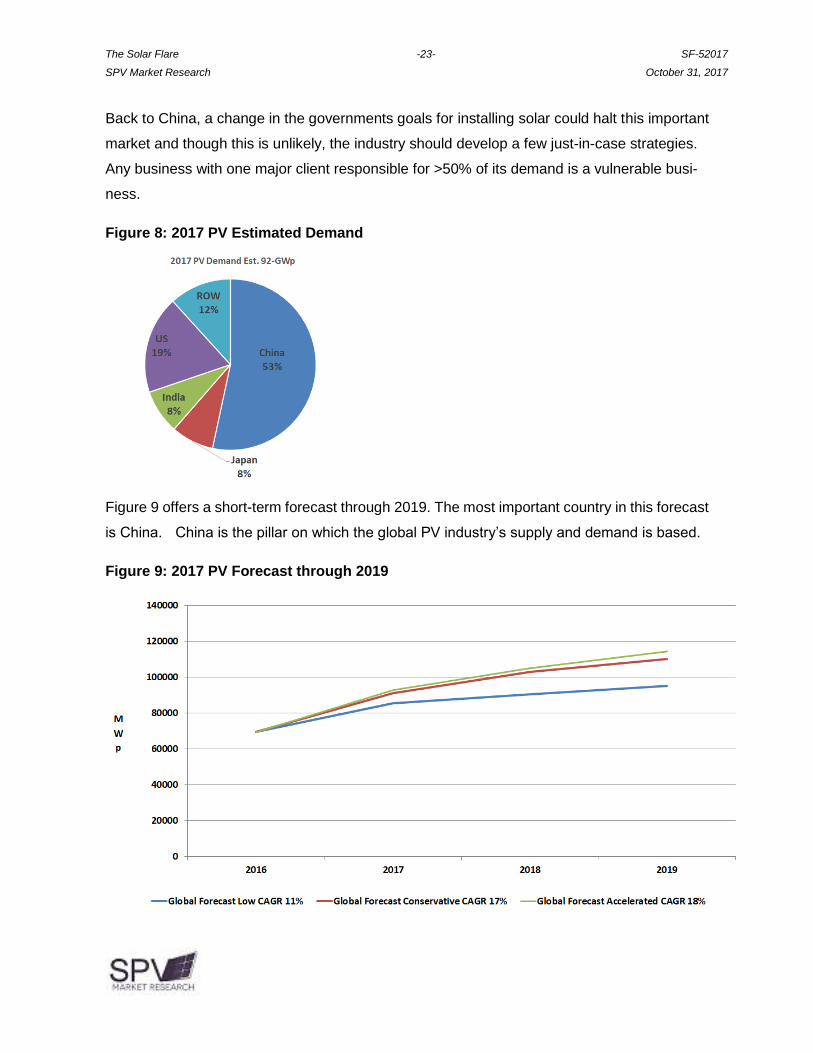
Back to China, a change in the governments goals for installing solar could halt this important
market and though this is unlikely, the industry should develop a few just-in-case strategies.
Any business with one major client responsible for >50% of its demand is a vulnerable busi-
ness.
Figure 8: 2017 PV Estimated Demand
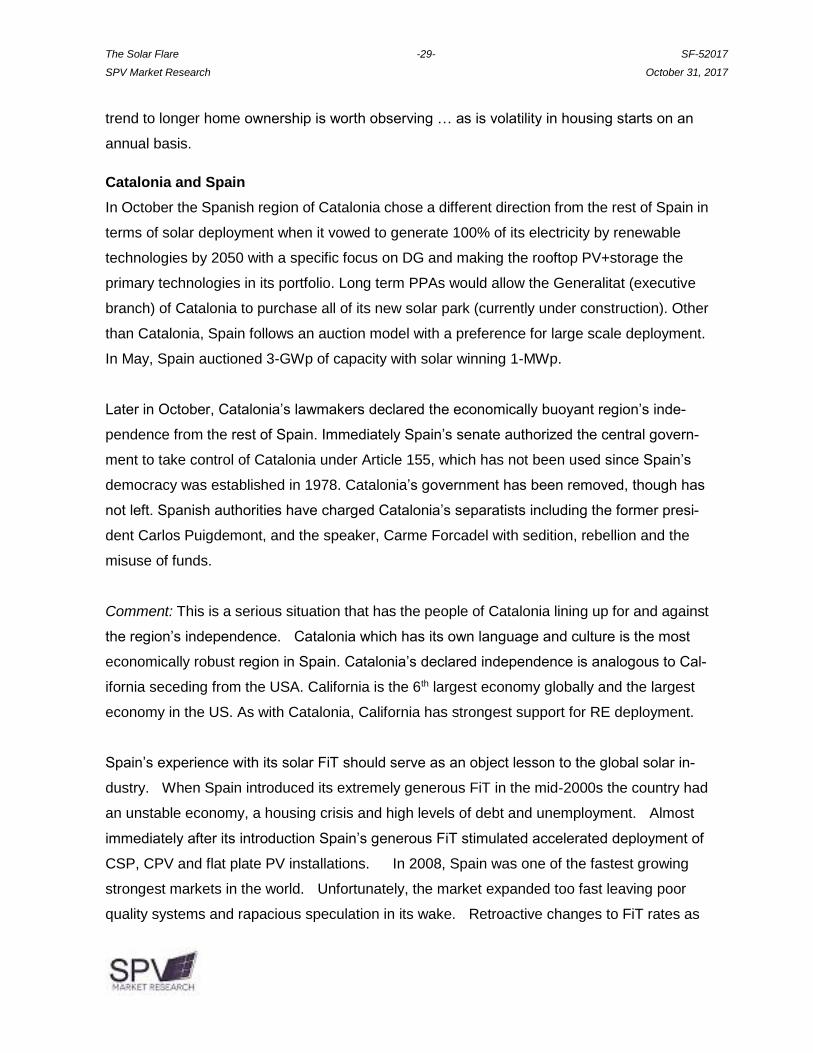
Figure 9 offers a short-term forecast through 2019. The most important country in this forecast
is China. China is the pillar on which the global PV industry’s supply and demand is based.
Figure 9: 2017 PV Forecast through 2019

The Solar Flare -24- SF-52017 April 2013
SPV Market Research October 31, 2017
Highly Competitive Industries and Their Highly Expected Mergers
In 2012 NSP and Del Solar merged claiming that at 1.5-GWp the new company would be the
largest cell manufacturer in the world.
In 2015 Motech Solar merged with Top Cell announcing that at 3-GWp the new entity would be
the largest cell manufacturer in the world.
In October, NSP (2.6-GWp cell capacity), Gintech (1.9-GWp cell capacity) and Solar Tech
(1.4-GWp Cell Capacity) announced that they are merging to create the second largest cell
manufacturer in the world with 5.9-GWp of cell capacity. The newly formed company, United
Renewable Energy or UREC will also depart the already departed merchant cell business
model to create a new vertically integrated business model that resembles, basically, what
everyone else is already doing. The usual glowing press releases were offered by company
PR departments and repeated by pretty much everyone. The companies have signed the
ubiquitous letter of intent a document, which sounds impressive but holds no legal sway and
cannot force anyone to do anything.
One thing for certain, by the time the merger is completed during Q3 2018 UREC will no longer
be able to claim the title of second largest because yes, things really do move this fast.
In the announcement from NSP, which will be the leading entity in the three-way equal part-
nership, the group indicated that the primary reason for the merger was the “highly competitive
and concentrated market for solar cells/modules.” Translation, the companies could no longer
compete in an incentive driven industry with significant downward price pressure. The group
has invited other Taiwanese cell manufacturers to join.
UREC will have five business units with Gintech in charge of wafers, Solartech in charge of
cells and new business and with NSP in charge of modules and projects.

The Solar Flare -25- SF-52017 April 2013
SPV Market Research October 31, 2017
As to UREC’s plans to exit the merchant cell business, it is unclear when this will happen or
even if it will happen. A stated reason for the exit is the highly competitive concentrated
business environment the manufacturers faced as independent entities. As SunEdison, First
Solar and SunPower have found, UREC will face a highly competitive and concentrated
market for project development if indeed the group’s current goals remain as stated.
The Walking Solar Unprofitable
The photovoltaic industry can be brutal in that most participants enter believing they are part of
the climate change solution, are part of something bigger than themselves and can profit from
their good intentions only to be beaten down by low price expectations and an industry-wide
lack of insight into the true cost of manufacturing solar modules.
Many point to soft costs as the next cost frontier, but this is based on believing that the low
margins not-enjoyed by PV manufacturers are sufficient to support healthy company opera-
tions. Until the low-margin fallacy is corrected margin recovery is impossible and the industry’s
focus will remain dangerously askew. To be clear, gross margin supports the entire company
from logistics through marketing and administration through R&D and including everyone’s
salaries, health care and other benefits.
The belief that a 15% gross margin is sufficient to run a manufacturing company is almost
impossible to overcome simply because people need to believe and so will continue to seek
evidence to support their closely held beliefs while eschewing all conflicting information. A
skittish race horse may wear blinders so that it can successfully compete relying on the jockey
to avoid being blindsided. An industry that wears blinders to avoid uncomfortable facts will, and
often is, blindsided.
Salaries and benefits could also be considered soft costs and it is worth remembering that
behind these soft costs are people trying to make a living and to increase their personal mar-
gins. The cost of labor increases, and it should; the only controlling factor is to limit how much
of it you use. In this regard the industry needs to search its soul and decide whether limiting
labor is really in its long term best interests.

The Solar Flare -26- SF-52017 April 2013
SPV Market Research October 31, 2017
The drastic price drops at the end of 2016 affected all cell/module manufacturers. Gintech,
Solartech and NSP reported losses for several years and though the price drops certainly did
not help, there were problems before the crash.
Despite the triumvirate’s announced optimism in their new (not-so-new) direction there is no
reason to think that this merger will result in an economic improvement for them or, it, as long
as the overriding industry metrics remain the same.
Figure 10 offers several years of revenues and profit/losses for Gintech, NSP and Solartech.
Figure 10: Gintech, NSP and Solartech Revenues and Profit/Loss 2014 through Half
Year 2017
“The best laid schemes o’ Mice an’ Men Gang aft agley”, Robert Burns, To a Mouse
UREC has announced a new direction for itself that seems overly complex while offering no
details on how it will profit from the same margin constrained situation that drove the three
companies to combine. Presumably the revenues will be larger, but the losses will also likely
be larger. Vertical integration is not a new strategy though it is, unfortunately, often used as a
last-ditch effort to stave off failure. Project development is complex and has long timelines.
UREC will likely find that revenues from this new direction are lower than anticipated.

The Solar Flare -27- SF-52017 April 2013
SPV Market Research October 31, 2017
Markets
Egypt
A consortium led by IFC, International Finance Corporation, pledged $653-million in debt for
thirteen solar projects in Egypt, a total of 752-MWp ($0.87/kWp) at Benban Solar Park near
Aswan in Egypt. Consortium members include: the African Development Bank, Asian Infra-
structure Investment Bank, The Arab Bank of Bahrain, CDC of the UK, Europe Arab Bank,
Finance in Motion, FinnFund, ICBC2, and OeEB of Austria. The Multilateral Investment GTD
Agency, a member of the World Bank, is providing an insurance guarantee of $210-million for
twelve projects. The European Bank for Reconstruction and Development (EBRD) earlier
approved $500-million for 750-MWp of solar deployment ($0.71/kWp).
Comment: Before excitement drives forecasts for solar deployment in the Middle East and
Africa into the stratosphere, these projects are dancing closer to the development stage, but
they are not on the dance floor yet. This announcement represents real money and money
usually indicates progress. There are enough signs of progress in the Middle East and Africa to
feel comfortable that this emerging region for solar deployment is emerging.
Lesson: Though the promise of money is always a good sign, wait for action that is, don’t count
your PV modules until they are installed.
India
Troubles within India’s market for PV deployment are becoming visible enough for its Ministry
of New and Renewable Energy (MNRE) to announce that there will soon be laws that will
penalize state governments and distribution companies that do not honor PPAs, will potentially
make Renewable Purchase Obligations (RPOs) statutory, will make smart meters mandatory
and add penalties for non-payment of electricity bills.
Comment: The market in India is a maze of at best of backroom dealing and at worst outright
graft with low PPA rates hiding the other costs of doing business. Meanwhile, as PPA bidding
continues to be forced down state governments and distribution companies are encouraged to
renegotiate. The new rules are only as good as enforcement and will only work if the en-
trenched problems of, again, backroom dealing and graft, are solved.

The Solar Flare -28- SF-52017 April 2013
SPV Market Research October 31, 2017
As for introducing penalties for those who do not pay their electricity bill … if someone is poor
they are already penalized and if they cannot pay their bill in the first place the penalty may not
be a meaningful incentive.
Lesson: India’s booming market for PV deployment has always been built on a shaky structure.
The risk of collapse should be built into all assessments of the market.
US
In a possible behavioral change brought about by the 2008 housing crash, US homeowners
are moving less often and renovating more. More than a decade in the rearview mirror, the
US housing bubble was built on overconfidence and derivatives. Housing reached its peak
value in 2006 and began declining. In 2008 the housing market experienced its most significant
drop ever and continued declining until it reached its bottom in 2012. Most of the value was
illusory but as their house is the most significant asset to middleclass Americans, the crash
destroyed more than ~$8-trillion in home equity, it destroyed trust and confidence in the future.
Though much value has been recovered, Americans are staying put in record numbers. Before
the housing bubble popped in 2008 Americans typically began with a starter home selling it
and buying up in five to six years. Since 2010 the number of sellers has consistently slowed
with the average homeownership now closer to fifteen years.
Comment: This is good news to residential installers. Longer times between selling means that
homeowners are more likely to include adding a solar installation when considering renova-
tions. Homeowners with plans to move every five years are less likely to invest in a solar in-
stallation the value of which they may not fully recover in a sale. On the other hand, home-
owners remaining in their homes over ten years are likely to consider adding a solar installation
that will reduce their electricity bills as well as adding value to their home in a sale. The
availability of storage and incentives to encourage people to self-consume enhances the solar
value proposition.
Lesson: When analysts prepare forecasts and marketing professional assess available mar-
kets it is crucial to look at the behavior of people in the sector observed. A risk analysis must
be prepared and fearlessly considered. Available information that indicates a change in market
behavior is also crucial. In the US, despite the trade case and other potential roadblocks, the
The Solar Flare -29- SF-52017 April 2013
SPV Market Research October 31, 2017
trend to longer home ownership is worth observing … as is volatility in housing starts on an
annual basis.
Catalonia and Spain
In October the Spanish region of Catalonia chose a different direction from the rest of Spain in
terms of solar deployment when it vowed to generate 100% of its electricity by renewable
technologies by 2050 with a specific focus on DG and making the rooftop PV+storage the
primary technologies in its portfolio. Long term PPAs would allow the Generalitat (executive
branch) of Catalonia to purchase all of its new solar park (currently under construction). Other
than Catalonia, Spain follows an auction model with a preference for large scale deployment.
In May, Spain auctioned 3-GWp of capacity with solar winning 1-MWp.
Later in October, Catalonia’s lawmakers declared the economically buoyant region’s inde-
pendence from the rest of Spain. Immediately Spain’s senate authorized the central govern-
ment to take control of Catalonia under Article 155, which has not been used since Spain’s
democracy was established in 1978. Catalonia’s government has been removed, though has
not left. Spanish authorities have charged Catalonia’s separatists including the former presi-
dent Carlos Puigdemont, and the speaker, Carme Forcadel with sedition, rebellion and the
misuse of funds.
Comment: This is a serious situation that has the people of Catalonia lining up for and against
the region’s independence. Catalonia which has its own language and culture is the most
economically robust region in Spain. Catalonia’s declared independence is analogous to Cal-
ifornia seceding from the USA. California is the 6th largest economy globally and the largest
economy in the US. As with Catalonia, California has strongest support for RE deployment.
Spain’s experience with its solar FiT should serve as an object lesson to the global solar in-
dustry. When Spain introduced its extremely generous FiT in the mid-2000s the country had
an unstable economy, a housing crisis and high levels of debt and unemployment. Almost
immediately after its introduction Spain’s generous FiT stimulated accelerated deployment of
CSP, CPV and flat plate PV installations. In 2008, Spain was one of the fastest growing
strongest markets in the world. Unfortunately, the market expanded too fast leaving poor
quality systems and rapacious speculation in its wake. Retroactive changes to FiT rates as
The Solar Flare -30- SF-52017 April 2013
SPV Market Research October 31, 2017
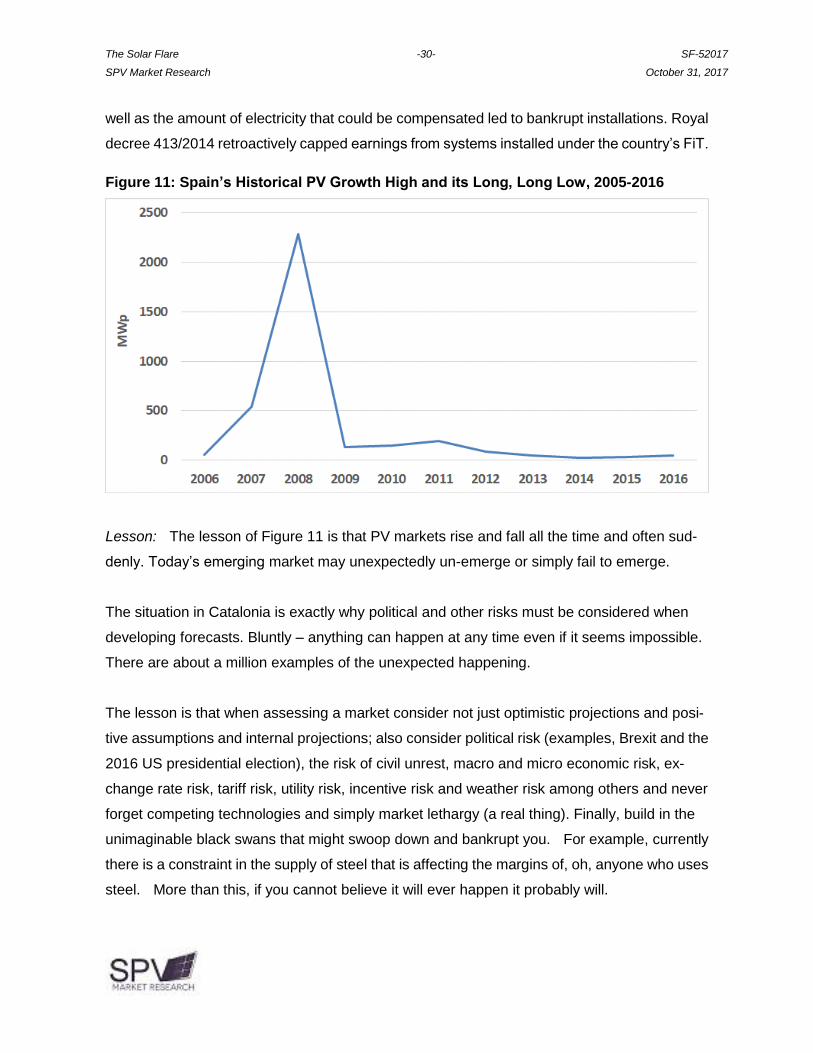
well as the amount of electricity that could be compensated led to bankrupt installations. Royal
decree 413/2014 retroactively capped earnings from systems installed under the country’s FiT.
Figure 11: Spain’s Historical PV Growth High and its Long, Long Low, 2005-2016
Lesson: The lesson of Figure 11 is that PV markets rise and fall all the time and often sud-
denly. Today’s emerging market may unexpectedly un-emerge or simply fail to emerge.
The situation in Catalonia is exactly why political and other risks must be considered when
developing forecasts. Bluntly – anything can happen at any time even if it seems impossible.
There are about a million examples of the unexpected happening.
The lesson is that when assessing a market consider not just optimistic projections and posi-
tive assumptions and internal projections; also consider political risk (examples, Brexit and the
2016 US presidential election), the risk of civil unrest, macro and micro economic risk, ex-
change rate risk, tariff risk, utility risk, incentive risk and weather risk among others and never
forget competing technologies and simply market lethargy (a real thing). Finally, build in the
unimaginable black swans that might swoop down and bankrupt you. For example, currently
there is a constraint in the supply of steel that is affecting the margins of, oh, anyone who uses
steel. More than this, if you cannot believe it will ever happen it probably will.

The Solar Flare -31- SF-52017 April 2013
SPV Market Research October 31, 2017
Companies
China
From the if-you-believe-this-I-have-a-bridge-to-sell-you, in October ReneSola announced it
had exited solar manufacturing, or, divested itself of its solar manufacturing business, and
transferred the majority of its ~$450-million in debt to its CEO Xianshou Li and other family
members who will be running its polysilicon, wafer and module manufacturing so that
ReneSola can concentrate on being, what it referred to as, a “pure play” developer of solar
projects. Approximately $200-million in debt was cancelled. The new pure play development
company indicated that it would have very low debt.
Comment: So…ReneSola divested itself of its manufacturing and debt by transferring its
manufacturing and 69% of its debt to itself thus freeing itself up to buy modules for its projects
at the lowest possible price, including from itself and ensuring that its manufacturing arm re-
mains unprofitable. The most successful aspect of this shell game is that it was picked up as
news and repeated as a true divestment of assets. Unfortunately for ReneSola the weak-
nesses that led to unprofitability and high debt remain the same as before and have simply
been shifted around to give the appearance of newness.
Lesson: A shell game is a confidence scheme involving slight-of-hand in which observers and
bettors are misdirected in order to relieve them of their money. The lesson is to recognize a
shell game when you see them. ReneSola wants observers to look at the development firm
and away from its debt and continued weaknesses in its manufacturing arm which again, is
itself.
The Solar Flare -32- SF-52017 April 2013
SPV Market Research October 31, 2017
US
In October troubled and unprofitable cell/module manufacturer CSUN (China Sunergy) began
taking orders for modules it has yet to manufacture at its unopened California facility. CSUN
offered a price guarantee on the modules that again, have yet to be manufactured, particularly
for larger quantity orders. Many articles about the company’s offer repeated its PR by referring
to CSUN as a well-known brand.
Comment: In the case of CSUN’s pre-orders the cliché if it seems too good to be true it
probably is, is worth remembering. In fact, it is worth embroidering the phrase on a pillow.
Referring to CSUN as a well-known brand and placing orders that have a good possibility of
slipping at a guaranteed price should not be reassuring particularly as it came at a time when
most manufacturers are holding off on taking orders as the industry waits for the US ITC to
announce its proposed remedy or remedies. The recommendations have been made but no
one knows what the Trump administration will do with or about them.
Lesson: One more time … A shell game is a confidence scheme involving slight-of-hand in
which observers and bettors are misdirected in order to relieve them of their money. The
lesson is to recognize a shell game when you see them. CSUN wants observers to order
module product it has yet to manufacture from an unopened manufacturing facility and not
scrutinize years of troubling financials and other problems.

The Solar Flare -33- SF-52017 April 2013
SPV Market Research October 31, 2017
US/Puerto Rico
A two-year old Montana-based energy company, Whitefish Energy, that had two full time
employees before Hurricane Maria ravaged Puerto Rico, won a $300-million non-competitive
contract with Puerto Rico Electric Power Authority (PREPA) to rebuild Puerto Rico’s decimated
power grid. Reportedly there were at least seven other bidders with one, Power Secure, a
division of Southern Company, asking for a $25-million down payment, something bankrupt
PREPA may have found difficult to do. Whitefish, whose headquarters is a two-bedroom house
in rural Montana, apparently did not request a deposit.
Secretary of the Interior Ryan Zinke comes from the same town, Whitefish Montana, where
Whitefish Energy is located. His son spent a summer working for the small company. Secretary
Zinke has denied any involvement in the contract.
FEMA expressed concern about the contract and investigations into how a tiny company won
this high value contract. Whitefish Energy has reportedly hired ~300 contractors and tweets
daily about their progress. In an interview, Whitefish Energy CEO Andrew Techmanski said
that the company has between 20 and 40 employees and that he learned of potential project
via LinkedIn.
Details of the contract include these costs: For Whitefish Employees (presumably including the
two full time employees the company had before the contract) $240/hour for a general fore-
man, $227/hour for a lineman, $80/day for meals, $332/night for lodging and $1000 each way
for plane fare. Subcontractors, most of the company’s work force, are billed at $336/hour for a
general foreman and $319/hour for a lineman. The contract apparently had a clause that stated
pay rates and other terms could not be audited.
On October 29, as investigations into the contract began, and with ~75% of the island’s pop-
ulation still without electricity, Puerto Rico Governor Ricardo Rossello called for the immediate
cancellation of the contract and it is now cancelled.
Comment: The situation in Puerto Rico calls out – still – for emergency intervention to restore
power and a long-term solution to the reconstruction of the island’s grid. In this regard the
solar industry is uniquely qualitied to 1) offer temporary relief via portable PV/battery genera-

The Solar Flare -34- SF-52017 April 2013
SPV Market Research October 31, 2017
tors and 2) rebuild the islands grid in as a modern microgrid that can deliver power to the grid
and operate independently of it.
First, it was highly reasonable for Power Secure to request a deposit from Puerto Rico’s
bankrupt utility and second, the choice of a tiny two-person company willing to step in without a
deposit smacks of desperation on the part of PREPA. The situation on Puerto Rico remains
catastrophic and there is genuine suffering and it’s worth pondering whether the US congress
could have done more to get the power back on. After all, the job is to actually rebuild the grid
– the transmission and distribution – on this US territory.
As to Whitefish, during an interview CEO Techmanski said that PREPA might not like him
saying this but, he learned of the potential project via LinkedIn. Now, if that isn’t a reasonable
and professional way to learn of a $300-million project to restore Puerto Rico’s entire grid I
don’t know what is. Techmanski also indicated, as written above, that he had between 20 to
40 employees and not just two. On this, a small company with between 20 and 40 employees
should be able to come up with an exact count and should not be forgiven for not being able to
do so. Likely Techmanski mean that at any one time the company had 20 to 40 contract em-
ployees.
On the other hand, if the company was tweeting daily about its progress it can obviously be
forgiven.
Lesson: Here is a lesson we seem doomed to relearn: there will be more devastating weather
events and it is time for the US and all countries to redesign their utility grids with an eye for real
energy independence and security. The current outdated model will be much more expensive
to repair and rebuild than it would be to embark on a new, innovative and pertinent cli-
mate-change defense model of the grid. The new energy paradigm should feature renewable
technologies, storage and microgrid configurations.

The Solar Flare -35- SF-52017 April 2013
SPV Market Research October 31, 2017
US
SolarCity will pay $29.5-million to settle claims it overcharged the federal government or re-
bates on systems installed between 2009 and 2013. In its official response SolarCity indicated
that it had done nothing wrong.
Meanwhile Tesla laid off several hundred, oh, what the heck, less than 1000 employees in
California as, what it referred to as, a normal course of business.
Comment: Companies that spin layoffs and losses as positive developments are practicing the
age-old magic trick of misdirection wherein the audience is directed to look at one thing while
the real action (and meaning) is somewhere else.
Lesson: Whenever a company tells you to look up, take a moment and look down, if it tells you
to look to the right, look left and if it tells you to keep your eyes forward, look all around you.
Follow this suggestion with political announcements (and tweets) too.
Japan
Quality matters, unfortunately quality seals and internal testing may not be worth much. In
October Japan’s third largest steelmaker, Kobe Steel, admitted to falsifying quality data for
potentially a decade for its aluminum and copper products. The company found that em-
ployees at four of its facilities altered inspection certificates from September 2016 to August
2017. Late in October Kobe lost Japan’s quality seal for its copper product.
Comment: Next time someone in the PV industry refutes quality concerns by pointing to in-
ternal testing remember the sad saga of Kobe Steel and ask some hard questions. Module
quality is falling in the solar industry and it is time participants began asking hard questions. It
can’t happen here almost never proves true.
Lesson: Quite frankly module testing in the solar industry is a growing problem. Low margins
are squeezing PV manufacturers and leading to short cuts. Solar is still a relatively small and
young industry and it is not too late to make changes. Kobe Steel, Volkswagen – the list of
highly thought of companies cutting corners and making excuses is long. The damage to solar
for similar behavior would be devastating. Ask questions. Demand data.
The Solar Flare -36- SF-52017 April 2013
SPV Market Research October 31, 2017
Iran/Norway
Solar deployment in the Middle East may finally be accelerating or, at least moving forward.
Saga Energy, Norway, has signed an agreement with Iranian state-run Amin Energy Devel-
opers to build 2-GWp of solar projects in Iran for ~$2.9-million ($1.45/kWp). Two plants with a
capacity of 14-MWp were completed in 2017 and other projects totaling 700-MWp are planned.
Comment: Expectations for solar deployment in the Middle East have been high for decades
with industry observers remaining optimistic despite little movement. Well, movement has
begun.
Lesson: Saga’s agreement with Amin Energy Developers is laudable but it is best to wait until
building begins as anything can happen during project development. Project scopes shrink
and almost never get bigger. Occasionally projects are cancelled.