the solution to managing plastic waste in the united
TRANSCRIPT

The Solution to Managing Plastic Waste in the United States of America
Marco J. Castaldi Professor, Chemical Engineering
Director, Earth System Science and Environmental EngineeringDirector, Earth Engineering Center | CCNY
Director, WTERT-U.S.A.City College, City University of New York
Presentation at:
Heraklion, Crete, Gr, June 27th, 2019

Introduction
• Plastic Recycling Situation in New York City
• Perspective on benefits and recyclability of plastic
• Technologies that can solve the non-recyclables
© Castaldi, M.J. 2014

Plastic Situation in NYC
Only 48% recovered from blue bins due to market opportunities.
Total MSW (2017) = 3,121,471 tons
MGP (-15% AD)= 451,053 tons
Blue bin plastics collected = 81,679 tons (18%)
Recovered from blue bin = 39,834 tons (48%)
If all recovered plastics are recycled = 8.8%
U.S. EPA states = 9.1%
biocycle states = 7.5%
Based on literature survey: 73% recovery rates have been realized for plastic waste streams in the U.S.A.
83,846 tons of waste left in this ideal community (~15 %)
Plastics recycling: ~8% 73%Remember: Recovery is not recycling
Impa
ct s
tren
gth
Tensile strengt h
HDPE LDPE

Decoupling of Municipal Solid Waste (MSW) from Personal Consumption Expenditure (PCE)
• EPA and several other sources in the literature have reported a decoupling of MSW generation from economic growth indictors, such as GDP and PCE
• Generation: materials that enter the waste management system from the MSW source, after reduction and reuse
• PCE: US household spending on goods and services such as food, clothing, and vehicles and recreation services, accounts for 70% of GDP
Source: Economic Data and Indicators Scoping Analysis, December 2013, US EPA
Why has this decoupling occurred?
MSW
PCE
MSW per PCE

Decoupling of MSW vs PCE due to Plastic Use in U.S.
• Decoupling is estimated to have begun in the late 1990s
• Yard trimming legislation implemented in 1992 to encourage residents to dispose of yard waste in back yard i.e. reduction of yard waste in MSW
• Yard waste excluded from overall MSW generation tonnage
Figure 3. Parity plot of total tons of MSW generated, excluding yard waste, and PCESource: Tsiamis, Torres, Castaldi. Waste management 77 (2018): 147-155.
Even though Plastic Use has been increasing much faster than other material use

Plastic in the MSW Stream is Rising• Reduction of plastic waste in U.S. MSW does not seem likely in the near future:
• No plastic bag bans, Styrofoam ban in NYC overruled• MSW decoupling from PCE may be attributed to plastics seen as positive impact of plastics
• Main Driver for Thermal Conversion in U.S.: Zero Waste Initiatives • i.e. NYC’s OneNYC plan aims to send zero waste to landfills by 2030 • Zero waste is not possible without energy recovery.
• Ideal recycling scenario for paper and plastics, 15% residual generation• Gasification and pyrolysis are attractive technologies to decision makers compared to WTE
but not fully proven yet.
Source: Tsiamis and Castaldi
Decoupling of MSW from PCE in U.S.
on weight and volume basis
• Plastics cannot be 100% recycled• Benefits of plastic use are real• Export market constraints
More plastics in US MSW
Only solution is thermal conversion
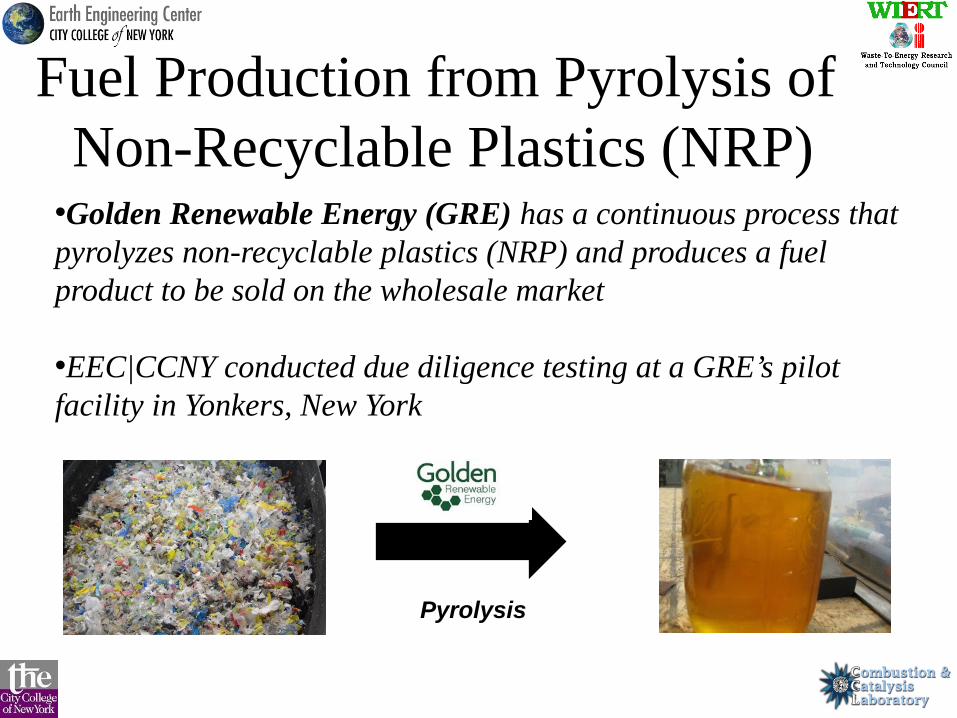
Fuel Production from Pyrolysis of Non-Recyclable Plastics (NRP)
•Golden Renewable Energy (GRE) has a continuous process that pyrolyzes non-recyclable plastics (NRP) and produces a fuel product to be sold on the wholesale market
•EEC|CCNY conducted due diligence testing at a GRE’s pilot facility in Yonkers, New York
Pyrolysis
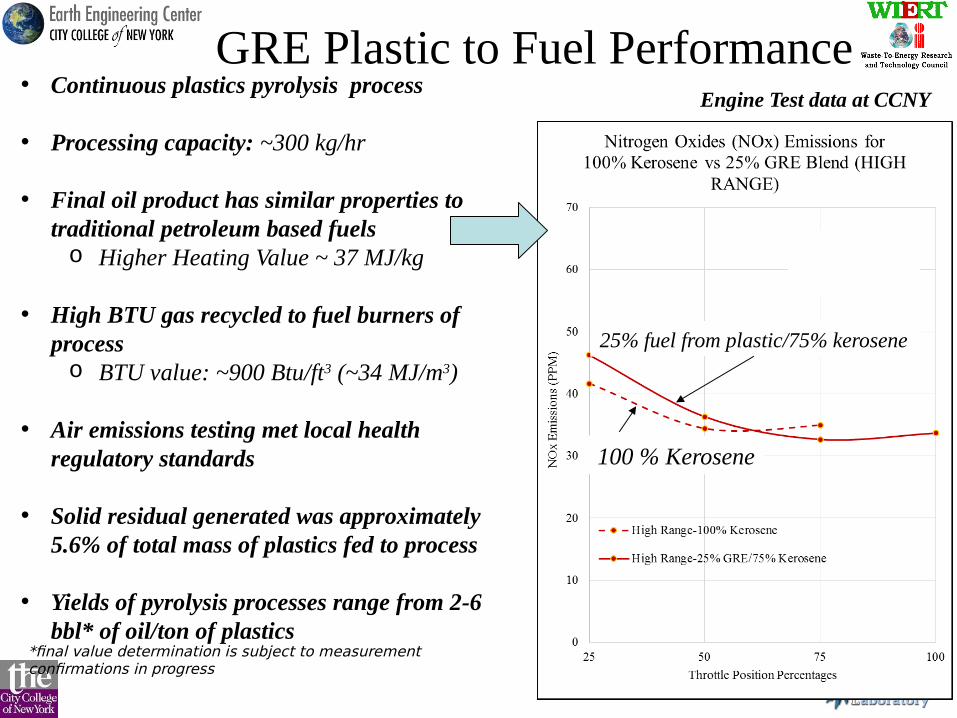
GRE Plastic to Fuel PerformanceEngine Test data at CCNY
100 % Kerosene
25% fuel from plastic/75% kerosene
• Continuous plastics pyrolysis process
• Processing capacity: ~300 kg/hr • Final oil product has similar properties to
traditional petroleum based fuelso Higher Heating Value ~ 37 MJ/kg
• High BTU gas recycled to fuel burners of processo BTU value: ~900 Btu/ft3 (~34 MJ/m3)
• Air emissions testing met local health regulatory standards
• Solid residual generated was approximately 5.6% of total mass of plastics fed to process
• Yields of pyrolysis processes range from 2-6
bbl* of oil/ton of plastics*final value determination is subject to measurement confirmations in progress

Plastics co-Gasified with Biomass
biomass
15%
50%
Equil. Calc
Measured
Improvements are neededGasifier produces high CO2 too much combustion
Requires further reaction for proper H2/CO
Temperature distribution produces high CH4
33%35.5%
39.5% 41%
8%
15% 50%8%biomass
Carbon efficiency from 66 – 75 %
Energy efficiency
Plastic addition reduces char
Nor
mal
ized
Met
hano
l Pro
duct
ion
Ove
rall
Ene
rgy
Eff
icie
ncy

NRP Use in Cement/Concrete Production• Primary collection must be improved (recall only 48% of blue bin recovered)• Cement Kiln (ready now but impact ~30% of NRP to LF can be diverted)• Energy for heat has the potential to use 100% NRP for coal replacement
• Will require adaptation of current systems (i.e. boilers, etc)
Concrete (can consume up to 29 % NRP without changing performance), demonstrated internationallyNeeds to undergo rigorous testing on a state by state basis.
Possible addition to current solution
NJ & PA – close but not the same
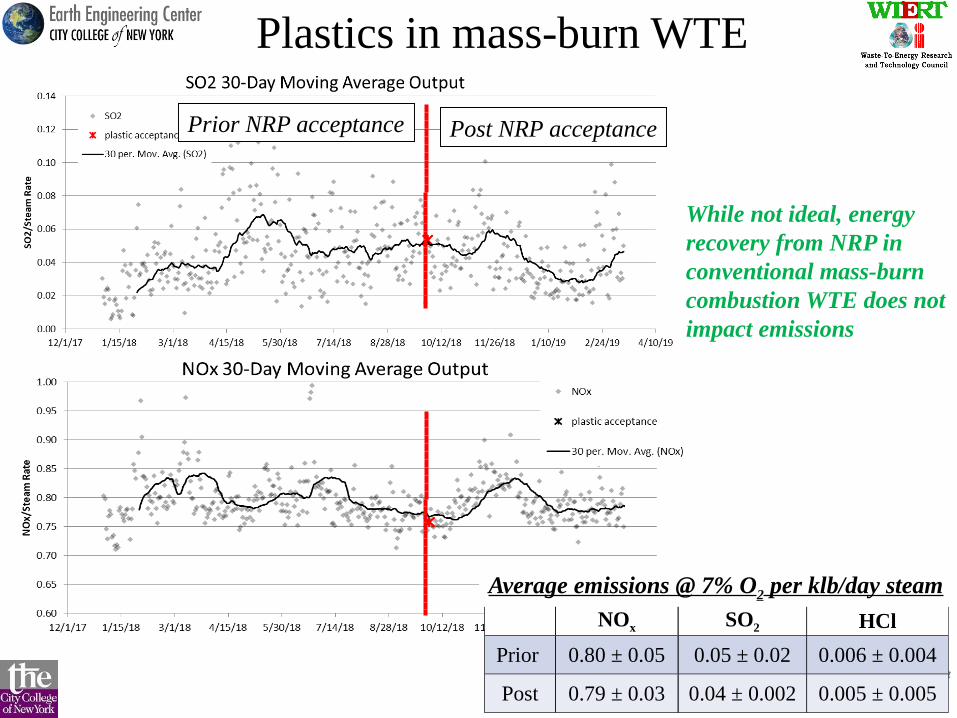
Plastics in mass-burn WTE
NOx SO2 HCl
Prior 0.80 ± 0.05 0.05 ± 0.02 0.006 ± 0.004
Post 0.79 ± 0.03 0.04 ± 0.002 0.005 ± 0.005
Average emissions @ 7% O2 per klb/day steam
While not ideal, energy recovery from NRP in conventional mass-burn combustion WTE does not impact emissions
Prior NRP acceptance Post NRP acceptance
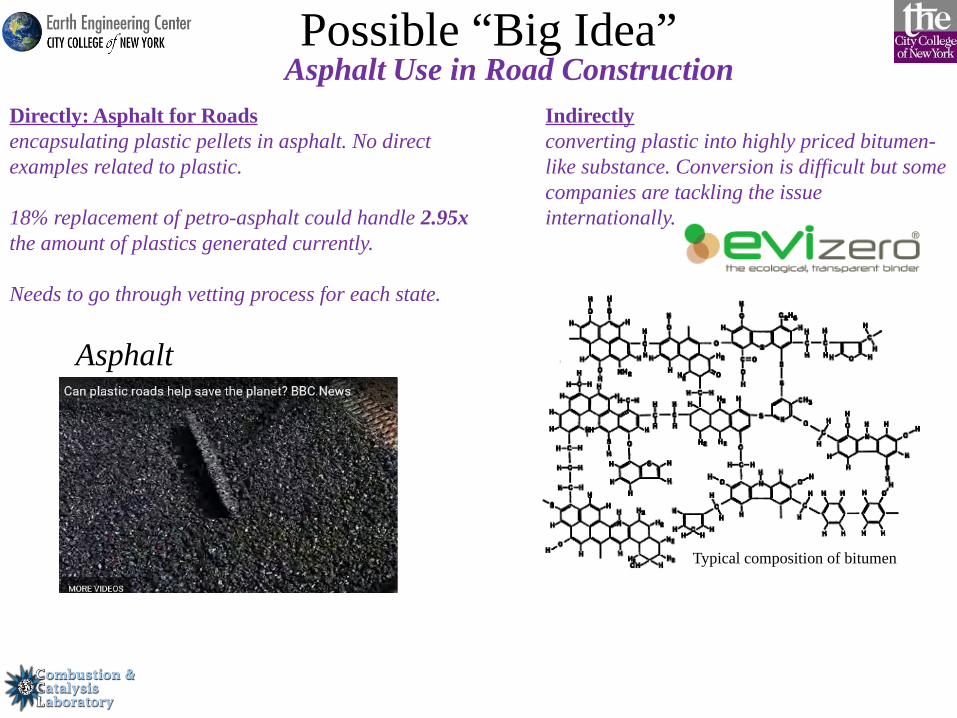
Possible “Big Idea”Asphalt Use in Road Construction
Directly: Asphalt for Roadsencapsulating plastic pellets in asphalt. No direct examples related to plastic.
18% replacement of petro-asphalt could handle 2.95x the amount of plastics generated currently.
Needs to go through vetting process for each state.
Indirectlyconverting plastic into highly priced bitumen-like substance. Conversion is difficult but some companies are tackling the issue internationally.
Typical composition of bitumen
Asphalt
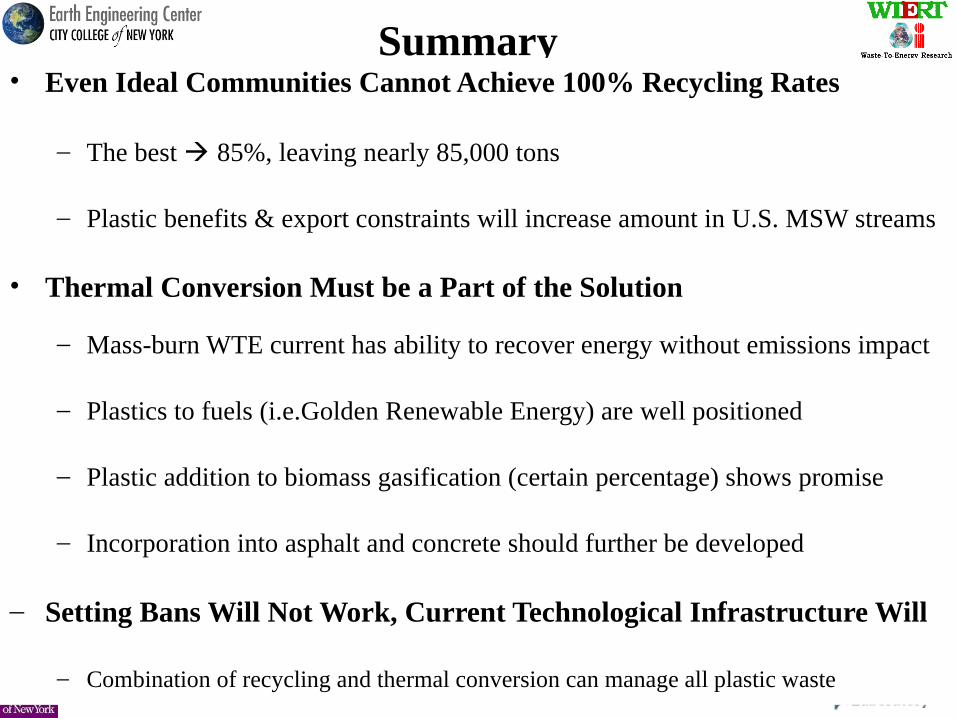
Summary • Even Ideal Communities Cannot Achieve 100% Recycling Rates
– The best 85%, leaving nearly 85,000 tons
– Plastic benefits & export constraints will increase amount in U.S. MSW streams
• Thermal Conversion Must be a Part of the Solution
– Mass-burn WTE current has ability to recover energy without emissions impact
– Plastics to fuels (i.e.Golden Renewable Energy) are well positioned
– Plastic addition to biomass gasification (certain percentage) shows promise
– Incorporation into asphalt and concrete should further be developed
– Setting Bans Will Not Work, Current Technological Infrastructure Will
– Combination of recycling and thermal conversion can manage all plastic waste

EEC | CCNYwww.ccnyeec.org
The goal of EEC|CCNY is to bring to bear rigorous engineering solutions that enable responsible use of energy and materials for the advancement of society.
Through industry collaborations and research sponsorship EEC|CCNY develops novel solutions to some of the world’s most pressing problems. EEC|CCNY
routinely engages students with industry professionals enabling a holistic approach to creative realistic, forward-looking applications. The reach of EEC|CCNY is
international in scope with many projects connecting international students and companies with a global presence.
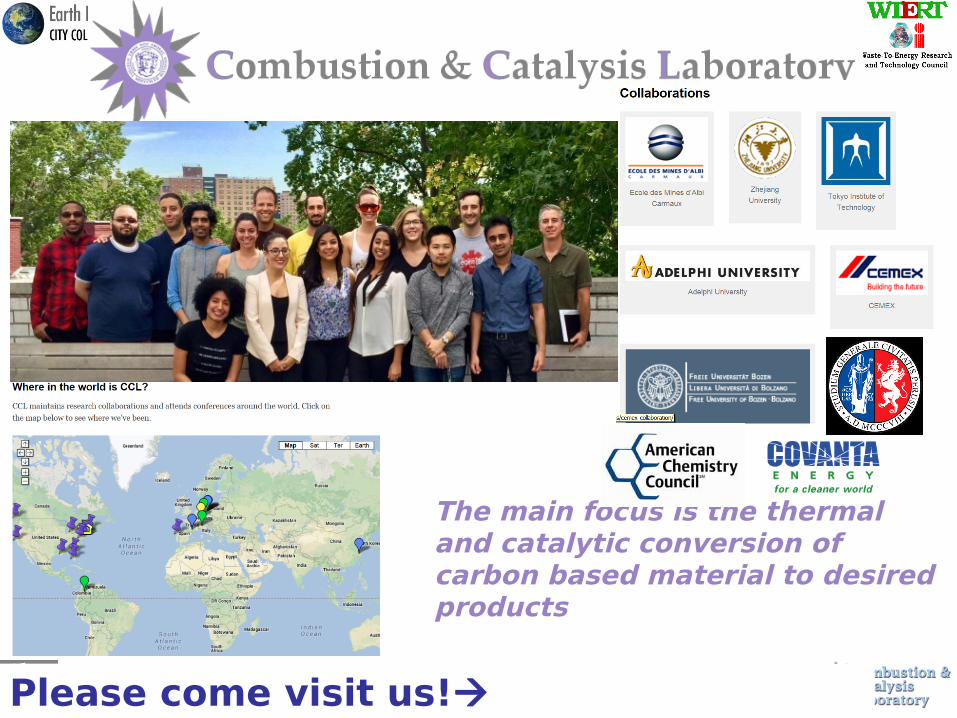
© Castaldi, M.J. 2014Please come visit us! http://www.cclabs.org
The main focus is the thermal and catalytic conversion of carbon based material to desired products

Plastics Research at EEC|CCNY
CHARACTERIZATION:
GASIFICATION:
PYROLYSIS: APPLICATIONS:
Determine energy value of non-recycled plastics, how does residue impact it? Address discrepancies in the literature
Impact of non-recycled plastics on gasification. Pilot scale testing at Enerkem facility in Edmonton.
Due diligence assessments and emissions testing at pilot plastics-to-oil pyrolysis technologies in the US and internationally
Performance testing of waste plastic pyrolysis oils in engines, innovative applications for beneficial reuse of char
Plasticpyrolysisoils 25-40MJ/kgPlasticpyrolysischars 10-25MJ/kg

Aspen Simulation Diagram
Gasification Section
Devolatilization Section
Desulfurization Section
PSA SectionWater Gas Shift Section
Figure 3. ASPEN SWPS H2 Generation
17
•Devolatilization efficiency: 75.23%
•Gasification efficiency: 86.74 %
•Overall Process efficiency:
13 – 42% (wide range uncertainty in product use)
SWPS Process

Plastics Waste in the U.S.
• In US, Plastics accounted for approximately 13% of total MSW
• Recyclable plastics are designated as rigid plastics of primarily #1-PET, #2-HDPE, and #5-PP resins
• Non-recyclable plastics are primarily films and multi-layer packaging
Plastics Generation and Recovery in U.S., 1960-2013
• Plastics waste generation is currently 83x greater from 1960 to present; Yet recovery is only 2X
Source: US EPA

Impact of NRP on Methanol Production from Waste Gasification
• Conducted pilot testing of Enerkem process at City of Edmonton’s Advanced Energy Research Facility (AERF) in Edmonton, Alberta, Canada
• Tested biomass-NRP mixtures of varying plastic concentration and measured syngas composition to quantify impact of NRP on methanol production Enerkem commercial facility,
Edmonton, CanadaDesign capacity: approx. 300 tpd
Enerkem process at Advanced Energy Research Facility (AERF)
Edmonton, CanadaCapacity: 8 tpd
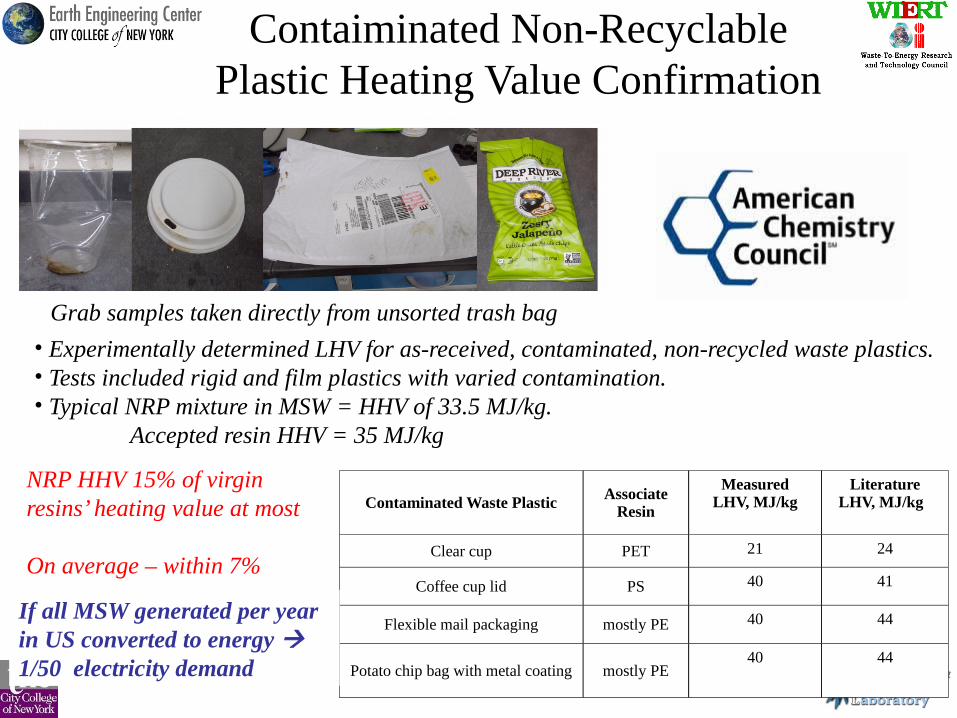
Contaiminated Non-Recyclable Plastic Heating Value Confirmation
Contaminated Waste Plastic AssociateResin
MeasuredLHV, MJ/kg
LiteratureLHV, MJ/kg
Clear cup PET 21 24
Coffee cup lid PS 40 41
Flexible mail packaging mostly PE 40 44
Potato chip bag with metal coating mostly PE40 44
Grab samples taken directly from unsorted trash bag
• Experimentally determined LHV for as-received, contaminated, non-recycled waste plastics.• Tests included rigid and film plastics with varied contamination. • Typical NRP mixture in MSW = HHV of 33.5 MJ/kg.
Accepted resin HHV = 35 MJ/kg
NRP HHV 15% of virgin resins’ heating value at most
On average – within 7%
If all MSW generated per year in US converted to energy 1/50 electricity demand

Limits to Recycling
Having ideal recovery of rates of 85% and 73% for paper and plastic waste streams.
Leaves 83,846 tons of waste left in this ideal community (~15 %)
This is only plastic and paper
Stretch strength
rigidness
Quality trade-offs with recycling
Some areas have great real recovery rates
Deepak Sharma et al.
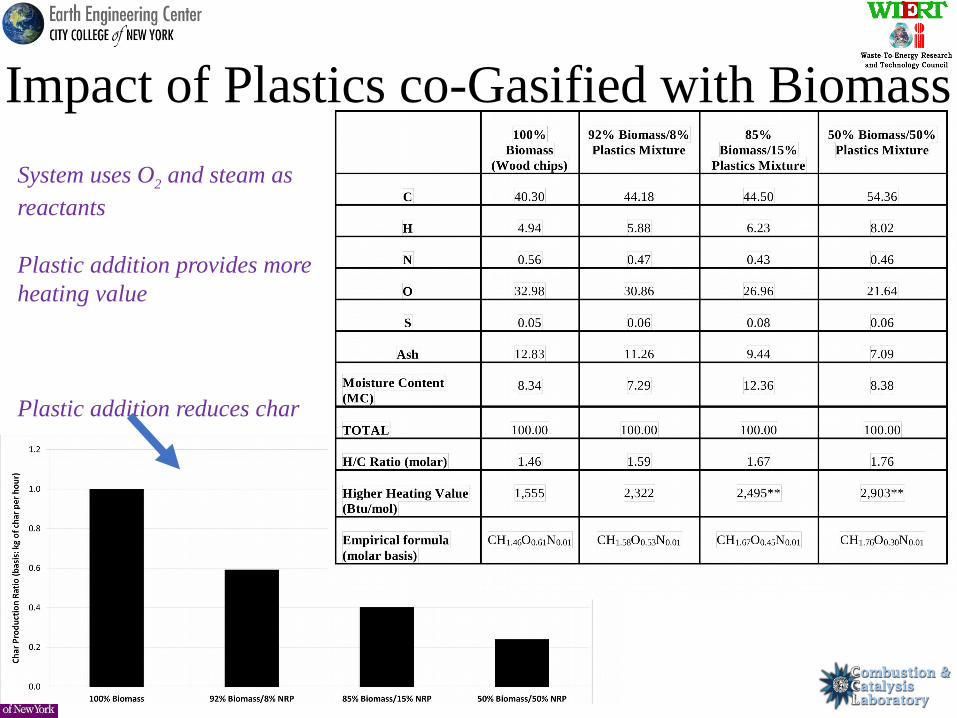
Impact of Plastics co-Gasified with Biomass
System uses O2 and steam as reactants
Plastic addition provides more heating value
Plastic addition reduces char