the sound of silence: what do we know when insiders do … annual meetings/2014-… · levon...
TRANSCRIPT
The Sound of Silence:
What Do We Know When Insiders Do Not Trade?*
George P. Gao and Qingzhong Ma
Cornell University
This draft: October 24, 2013
* We are grateful to Ferhat Akbas, Warren Bailey, Sanjeev Bhojraj, Walter Boudry, Linda Canina, Matt Clayton, Zhi
Da, Frank D'Souza, Julia D. D'Souza, David Feldman, Vyacheslav Fos, Pengjie Gao, Ross Garon, John Griffin,
Levon Goukasian, Yaniv Grinstein, Omrane Guedhami, Michael Johnson, G. Andrew Karolyi, Jan Katz, Hyunseob
Kim, Heather Knewtson, Paul Koch, Piotr Korczak, Dima Leshchinskii, Claire Liang, Bob Libby, Crocker Liu,
Edith Liu, Peng Liu, Xiaomeng Lu, Ken Merkley, Roni Michaely, Pam Moulton, David Ng, Dominik Rösch,
Gideon Saar, Rick Sias, Richard Smith, Mike Sturman, Andrey Ukhov, Abhishek Varma, Samuel Weaver, David
Whidbee, Jinghua Yan, Eric Yeung, Xiaojing Yuan, Kelvin Chunhui Zhang, Wei Zhang, and seminar participants at
Cornell University (Johnson School accounting), Cornell finance brownbag seminars, the 2012 Northern Finance
Association conference, SAC Capital quant seminar, the 2013 Midwest Finance Association conference, the 2013
Applied Finance Conference at St. John’s University, the 2013 SFS Finance Cavalcade, and the 2013 Financial
Management Association (FMA) annual meeting in Chicago (a top ten session) for helpful suggestions, and Irene
Kim and Douglas Skinner for help with constructing the litigation risk data. All errors are our own.
Gao: 314 Sage Hall, Samuel Curtis Johnson Graduate School of Management, Cornell University, Ithaca, New
York, 14853. Email: [email protected], phone: (607) 255–8729. Ma (corresponding author): 435 B Statler Hall,
Cornell University, Ithaca, New York, 14853. Email: [email protected], phone: (607) 255–8140.

The Sound of Silence:
What Do We Know When Insiders Do Not Trade?
Abstract
This paper examines stock returns following insider silence, periods of no insider
trading. We hypothesize that, for fear of litigation risk, rational insiders do not sell
own-company shares when they withhold bad news; neither would they buy,
given unfavorable prospects; thus they keep silent. By contrast, insiders sell
shares when they do not anticipate significant bad news. Consistent with this
hypothesis, future returns are significantly lower following insider silence than
following insider net selling. Further, the silence-sell return difference is wider
among firms with worse information environment and firms at higher litigation
risk. In sum, insider silence sounds bad news.
Keywords: Insider trading, Insider silence, Information environment, Litigation
risk
JEL Classification: G12, G14, G18
1
1. Introduction
It is well documented that managers tend to withhold bad news about their firms.1 This
paper examines managers’ insider trading decisions and subsequent stock returns when they
withhold bad news. We hypothesize that, when managers (and insiders in general) withhold bad
news, their rational decision is not to sell own-company shares on the bad news, as doing so
involves high levels of litigation risk. This is because shareholders launch securities class action
lawsuits following large stock price drops on the basis of 10b-5, mostly alleging that insiders
knew the adverse information but failed to disclose it to the market.2 Insider selling prior to the
disclosure of the information would be taken as evidence that insiders knew the information.3 By
contrast, lack of insider selling undercuts plaintiffs’ allegation that insiders knew the
information. Thus, for fear of shareholder litigation, rational insiders do not sell own-company
shares while possessing significant negative information. Neither would they buy, given the
unfavorable prospects. Hence, insider silence, a period of no insider trading, is associated with
bad news.4 On the other hand, insiders selling shares indicates that they do not expect as bad
news in the future.5 This litigation risk hypothesis thus implies that insider silence is associated
with significant negative future returns, and insider net selling is associated with not-so-negative
1 See, for example, empirical evidence in Kothari, Shu, and Wysocki (2009) and survey evidence in Graham,
Harvey and Rajgopal (2005). Sletten (2012) and Tse and Tucker (2010) provide empirical evidence of clustering in
bad news announcements, which is predicted if firms withhold bad news (Dye and Sridhar, 1995; Acharya,
DeMarzo, and Kremer, 2011); Rogers, Shrand, and Zechman (2013) provide evidence of managers tacitly
withholding industry-wide bad news. Theories on managers withholding bad news include Dye (1985), Jung and
Kwon (1988), Dye and Sridhar (1995), Shin (2003, 2006), and Acharya, DeMarzo, and Kremer (2011). 2 See Arshadi (1998) and Bainbridge (2007) for overviews of insider trading laws and enforcement strategies. For a
recent example of securities class-action lawsuits following large stock price declines, see the case involving
Expedia, http://securities.stanford.edu/1050/EXPE00_01/index.html. 3 See, e.g., Johnson, Nelson, and Pritchard (2007), Rogers (2008), Rogers, Van Buskirk, and Zeckman (2011).
4 One might argue that insider silence could also be related to good news, such as a takeover offer. Such a possibility
adds noise to the relation between insider silence and negative future returns and biases against us in empirical tests.
Section 4.2 examines this possibility in greater detail and shows that, with a six-month window to measure insider
trading activity, takeover cases do not significantly contaminate insider silence as a negative signal. 5 Numerous studies show that insider sales are inferior as a return predictor (Jaffe, 1974; Finnerty, 1976; Seyhun,
1986; Rozeff and Zaman, 1988; Lin and Howe, 1990; Seyhun, 1998; Noe, 1999), or insider sales have no predictive
ability (Chowdhury, Howe, and Lin, 1993; Lakonishok and Lee, 2001; Jeng, Metrick, and Zeckhauser, 2003).

2
(or non-negative) future returns. That is, the spread in future returns between insider silence and
insider net selling, or the silence-sell spread, is negative.
Further, the hypothesis has two cross-sectional implications. First, when the information
environment of a firm is worse, it is more likely that insiders possess important information that
outsiders do not know. Thus, we expect the silence-sell spreads are wider among firms with
worse information environment. Second, if litigation risk drives insiders’ decision not to sell on
negative information, the silence-sell spreads are wider among firms at higher litigation risk.
We test these implications in a sample of NYSE/ASE/NASDAQ common stocks from
1990 to 2011. Each month we form portfolios of stocks based on their cumulative insider trading
activity over the trailing six months. Stocks whose insiders do not trade over the past six months
form the “silence” portfolio; stocks that insiders net buy and net sell over the past six months
form the “buy” and “sell” portfolios, respectively. We then examine their future returns.
We report the following findings. First, the silence portfolio on average earns a
significant negative abnormal return (adjusted by size and book-to-market ratio) over the
subsequent 12-month period, which is significantly lower than the “sell” portfolio. The silence-
sell spread is a significant -2.50%. This result is consistent with the litigation risk hypothesis.
Second, the silence-sell spread in future returns varies systematically in the cross-section.
It is wider for growth stocks, stocks of younger firms, and more volatile stocks. These results are
consistent with the hypothesis that this litigation risk effect is stronger among firms with worse
information environment. Using a composite measure of litigation risk developed by Kim and
Skinner (2012), industry membership (following Francis, Philbrick, and Schipper, 1994), and
sales growth as proxies for litigation risk, we find that the silence-sell spread is wider among
firms with higher ex-ante litigation risk, further supporting the litigation risk hypothesis.
3
The main findings survive numerous robustness checks. The significant negative silence-
sell spread survives alternative estimation methodologies (size and B/M adjusted returns, Fama
and French three-factor alphas); the silence-sell spread also arises in subsequent quarterly
earnings announcement period abnormal returns. The silence-sell spread is not explained by the
underperformance of firms that have just conducted initial public offering (IPO); it is not
explained by a broad list of anomaly variables that predict future returns in the cross section; it is
not explained by insider trading activity prior to the six-month measuring period. Furthermore,
while insiders might also abstain from trading prior to releasing extremely positive news (e.g., a
takeover offer), there is no evidence that insiders abstain from trading over the six-month period
prior to takeover announcements. As a result, takeover cases do not materially contaminate
insider silence as a negative signal. Last, the silence-sell spread does not reverse in the long term
and in fact it continues to widen for at least another two years.
The paper contributes to the insider trading literature. The existing literature focuses
exclusively on insiders’ buying and selling activities and no study examines the phenomenon of
the lack of insider trading. In addition, while it is well known that litigation risk reduces insider
trading during information rich events (e.g., Seyhun, 1992; Jagolinzer and Roulstone, 2009;
Piotroski and Roulstone, 2008), there is no systematic study on how the reduction in insider
trading is related to stock returns. Our paper fills this gap. We show that insider silence, periods
of no insider trading, signals bad news as it predicts significant negative future returns, which are
even lower than when insiders net sell. We further show that this effect is systematically related
to litigation risk and information environment. Our findings offer a potential explanation for the
puzzling results documented in the literature that insider sales, on average, are not informative.
In recent work, Cohen, Malloy, and Pomorski (2012) find that some insider trades (the
4
opportunistic ones) are informative for up to six months. Our paper is related to theirs in that we
find another significant information signal from insider trading activity: the lack of it.
This paper is also broadly related to several recent papers on the price implication of lack
of activity. Bagnoli, Kross, and Watts (2002) show that delays in earnings reports precede price
drops. Marin and Olivier (2008) report that lower insider selling volume over the recent past and
heavy insider selling volume in the distant past predicts higher probability of price crash. Akbas
(2013) reports that stocks experiencing unusually low trading volume over a week before
earnings announcements tend to have more unfavorable earnings surprises. Giglio and Shue
(2013) find that the passage of time after merger announcement is related to the probability of
merger completion. Our paper shows that insider silence, the lack of insider trading, sounds bad
news.
We describe the sample and data in Section 2, report main findings in Section 3, discuss
alternative hypotheses and robustness checks in Section 4, and conclude in Section 5.
2. Sample and data
The sample is based on all NYSE/Amex/NASDAQ common stocks (share code 10 or 11)
covered in CRSP/Compustat merged database from January 1990 to December 2011, a total of
264 year/month cross-sections. The sample starts from 1990 when insider trading data is
available and ends in 2011 so that we have at least one-year future return data. We exclude
stocks whose prior month-end price is lower than $5 and stocks that would be classified into the
lowest NYSE market capitalization decile.6 We also exclude firms with missing or non-positive
book value of equity. Firms are required to be at least one year old.7
6 These two restrictions eliminate low-priced and small stocks, which are likely to have low past returns. As a result,
the average trailing 12-month return of the remaining stocks is 25.5% (see Table 1). Without these restrictions the
average would be around 15.5%. Further, since insiders’ buying and selling activities are more informative among
small firms (e.g., Lakonishok and Lee, 2001; Sias and Whidbee, 2010), excluding these firms reduces the return
5
Stock return data are obtained from the Center for Research in Security Prices (CRSP) at
the University of Chicago and accounting data from Compustat. We follow Fama and French
(1992) to construct firm size and B/M ratio, and Jegadeesh and Titman (2001) to calculate past
returns. Insider trading data are from Thomson Reuters Insider Filing Data Feed. The Securities
and Exchange Commission (SEC) mandates that officers and directors, large shareholders (those
who own 10% or more of the outstanding shares), and affiliated shareholders report their
transactions to the SEC by the 10th
of the month following the transactions (prior to August
2002) or within two days (since August 2002). The database cleaning process largely follows
recent studies (e.g., Lakonishok and Lee, 2001; Piotroski and Roulstone, 2005; Sias and
Whidbee, 2010).8 Only open-market transactions are considered. Defined in equation (1), the net
insider demand (NID) for month j is the total number of shares insiders buy minus the total
number of shares insiders sell over the past six months, normalized by the total number of shares
outstanding at the end of month j-1.
(1)
Portfolios are formed on past insider trading activity. Stocks with no insider trading
activity reported over the past six months form the “silence” portfolio; stocks with positive and
non-positive NID form the “buy” and “sell” portfolios, respectively. Future returns start from
predictability following insiders’ buying and selling activities. In our main analysis we choose to exclude these
stocks to focus on economically significant stocks. Our main findings hold as strongly when low-priced and small
stocks are included (see Section 4.5). 7 For firms that just conducted initial public offerings, this filter allows a six-month period for insiders of these firms
to make insider trading decisions if the IPO lockup period is shorter than six months; for IPO firms with a lockup
period longer than 180 days (see Brav and Gompers, 2003), this filter is not sufficient. We address this issue in
robustness section 4.1. 8 We follow the literature (e.g., Lakonishok and Lee, 2001; Sias and Whidbee, 2010) to “clean” the insider trading
data. Specifically, we use the following filters. We delete duplicate and amended records and records with cleanse
code of “S” or “A” are deleted. Transaction price must be available, and we delete records if the number of shares in
a transaction is below 100. The transaction code is either “P” or “S” for stock transactions. We delete transactions
that involve more than 20% of total shares outstanding, and delete records if the transaction price is outside the
80%–120% range of the CRSP end-of-day stock price.
6
month j. It is worth noting that since we use report date to measure past insider trading activity
(see Lakonishok and Lee, 2001, p.97), such information is publicly available by the time the
portfolios are formed.9
Figure 1 presents, month by month from January 1990 to December 2011, the proportion
of firms with insider net selling, net buying, and insider silence over the trailing six-month
period. The proportion of insider silence is around 35% during early years and generally declines
over time, except for a spike around the end of 2010. The average proportion of insider silence is
24%.10
Figure 1 also shows that insider net selling is more frequent than net buying.
[Insert Figure 1 about here]
Table 1 shows summary statistics of the whole sample and portfolios formed on past
insider trading. The sample average NID over the trailing six months is -0.418%, consistent with
insiders on average being net sellers. The average six-month NID is also consistent with the
literature.11
Compared to stocks in the overall sample, stocks in the silence group tend to be
smaller, have higher B/M ratio, have lower institutional ownership, are less likely followed by
analysts, have fewer analysts following, are slightly younger, and are a bit more volatile. There is
no apparent difference in terms of past stock issuance. Stocks in the silence group tend to have
lower past return, lower accruals, lower past asset growth, and are less profitable. The silence
group also has lower values of KS, FPS, and sales growth, proxies we use for litigation risk (see
section 3.2.2).
9 Our main findings are robust to alternative choices in defining net insider demand. Detailed are in Section 4.5.
10 By definition, firms that fall in the “silence” group in a month are more likely to fall in the “silence” group over
the subsequent months. That is, the “silence” portfolio membership is sticky over time. Indeed, with a probability of
48%, a firm in the “silence” group will remain in the “silence” group six months later. This number indicates that on
average over half of the “silence” portfolio members are replaced during a half-year period. 11
The average quarterly NID (unreported) for our sample is -0.246, slightly more negative than the corresponding
number reported in Sias and Whidbee (2010, p.1551), which is -0.145%. Because we exclude the very small stocks,
which tend to have more positive (or less negative) net insider demand, the average NID of our sample is larger (in
magnitude) than that reported in Sias and Whidbee (2010).

7
Note that for all stocks, the average return over the trailing 12 months is 25.5%. This
average return is higher than one would expect, mainly because the sampling procedure
eliminates low-priced and small stocks, which are likely to have low past returns.12
Stocks that
insiders net buy have lower returns than stocks that insiders net sell, consistent with the literature
that the contemporaneous correlation between net insider demand and stock returns is negative
(e.g., Sias and Whidbee, 2010). In addition, stocks in the “buy” portfolio are smaller with higher
B/M ratios, consistent with the notion that insiders of larger firms tend to sell and insiders are
contrarian (Seyhun, 1986; Rozeff and Zaman, 1998; Piotroski and Roulstone, 2005).
[Insert Table 1 about here]
3. Results
3.1. Insider silence and future returns
We take three approaches to examining future returns following insider trading decisions.
First is the cumulative returns over a holding period of one, six, and 12 months, both raw returns
and cumulative abnormal returns adjusted by size and B/M; second is the abnormal returns based
on Fama and French (1993) three-factor regressions; and the third is the abnormal returns during
subsequent earnings announcement periods.
3.1.1. Cumulative returns, both raw and adjusted
We first examine the subsequent raw returns and returns adjusted by size and B/M over
the one-, six-, and 12-month holding periods. The methodology of calculating the cumulative
abnormal returns are described in the Appendix. Table 2 presents the raw (Panel A) and adjusted
(Panel B) returns for the silence, buy, sell portfolios, as well as the silence-sell and buy-sell
12
Without excluding the low-priced small stocks, the average 12-month return for the period of 1990-2011 is
15.5%. Our main conclusion is robust with or without excluding these stocks. See Section 4.5 for detail.
8
spreads. All statistical tests (this table and all other tables throughout this paper) are based on
Newey-West standard errors.
In Panel A of Table 2, the silence portfolio on average earns raw returns of 0.90%,
5.34%, and 11.08% over the one-, six-, and 12-month holding period, respectively. The sell
portfolio earns raw returns of 1.01%, 6.26%, and 13.10% over the one-, six-, and 12-month
holding period, respectively. The silence-sell spreads are all negative over these holding periods,
and significantly so for the longer holding periods. There is some evidence that the buy portfolio
earns higher returns than the sell portfolio in the one-month holding period.
Because firm characteristics are different among these portfolios, it is more informative
to examine abnormal returns. Panel B of Table 2 presents such results, where we adjust the
returns by size and B/M. Later in calendar-time portfolio regressions and Fama-MacBeth
regressions we also control for momentum and other potentially relevant variables. Panel B
shows that the silence portfolio earns abnormal returns of -0.15% (t=-2.41), -0.87% (t=-3.60),
and -1.74% (t=-4.29) over the one-, six-, and 12-month holding periods, respectively. By
comparison, the sell portfolio earns 0.00% (t=0.01), 0.30% (t=0.87) and 0.75% (t=1.26) over the
one-, six-, and 12-month holding periods, respectively.13
As a result, the silence-sell spreads are -
0.15% (t=-2.77), -1.17% (t=-4.19), and -2.50% (t=-4.10) over the one-, six- and 12-month
holding periods, respectively. These results support the litigation risk hypothesis.
The two panels also present the returns following insider net buying and the buy-sell
spreads. In the very short holding period (one month), returns are higher (with marginal
13
Note it is well documented in the literature that insider sales do not predict significant negative returns. For
example, Lakonishok and Lee (2001, p.102), in their comprehensive study of insider trades, report a small one-year
abnormal return of -0.5% for low net purchase ratio (a measure similar to net insider demand in our paper); the
abnormal return following low net purchase ratio is a positive 1.6% for larger firms; even more telling, Lakonishok
and Lee (2001, p.106-7) find that a strong insider selling signal actually predicts positive, instead of negative, future
returns. Similarly, Jeng, Metrick, and Zeckhauser (2003, p.456) report that there is no noticeable abnormal returns
over the 100 days after insider selling; Sias and Whidbee (2010, 1575) find that the 6-month abnormal returns
following net insider selling are 0.717% for medium-cap stocks and 0.045% for large-cap stocks.
9
statistical significance) following insider net buying than following net selling. For longer
holding periods, however, returns following insider net buying and following net selling are
largely indistinguishable.14
Note that in our sample the very small stocks are excluded. In
unreported analysis when these (many) stocks are added back in the sample, we find that the
buy-sell spreads are positive and more significant. These results are consistent with the prior
literature that insider trading activities predict future returns mostly among small firms (e.g.,
Lakonishok and Lee, 2001; Sias and Whidbee, 2010).15
[Insert Table 2 about here]
3.1.2. Monthly alphas
Alternatively, we examine the future returns following insider trading decisions using
monthly alphas from asset pricing models such as the one by Fama and French (1993).
Specifically, Each month j from January 1989 to December 2012, portfolios are formed on
preceding insider trading activity over the trailing six months. Stocks with no insider trading
activity over the prior six-month period form the “silence” portfolio; stocks with positive and
non-positive net insider demand (NID) over the prior six-month period form the “buy” and “sell”
portfolios, respectively. The portfolios are held over months j+1 to j+k (k=1, 6, or 12). Portfolio
returns are equal weighted (value weighted) across their constituent stocks. The overall portfolio
return for month j is the equal-weight average month-j returns of the strategy implemented in the
prior month and strategies formed up to k (k=1, 6, or 12) months earlier. These monthly
portfolios (from January 1990 to December 2012) are then regressed on the Fama and French
14
Forming finer portfolios within the net selling and net buying groups does not reveal any significant differences
either. The lack of significance of the buy-sell spread is largely due to our sampling procedure in which we exclude
the very small stocks. Untabulated analysis shows that adding back these stocks into the sample does generate a
positive and marginally significant buy-sell spread in adjusted returns over the one-year period (0.83% with t=1.52). 15
It is worth noting that a silence-sell return spread of 2.50% does not appear attractive for an aggressive trading
strategy. In this paper we simply point out that insider silence has information content, which is negative. For
potential trading strategies that utilize this phenomenon, we refer readers to contemporaneous work by Ma (2013)
and Ma and Ukhov (2013).
10
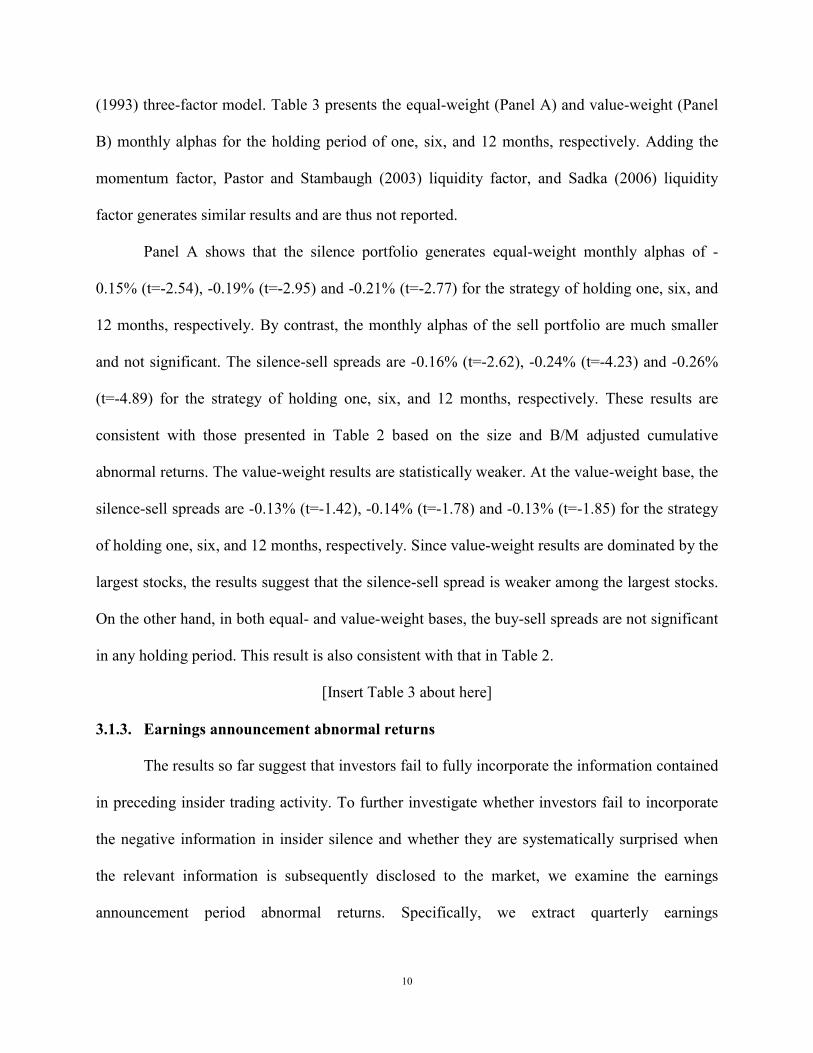
(1993) three-factor model. Table 3 presents the equal-weight (Panel A) and value-weight (Panel
B) monthly alphas for the holding period of one, six, and 12 months, respectively. Adding the
momentum factor, Pastor and Stambaugh (2003) liquidity factor, and Sadka (2006) liquidity
factor generates similar results and are thus not reported.
Panel A shows that the silence portfolio generates equal-weight monthly alphas of -
0.15% (t=-2.54), -0.19% (t=-2.95) and -0.21% (t=-2.77) for the strategy of holding one, six, and
12 months, respectively. By contrast, the monthly alphas of the sell portfolio are much smaller
and not significant. The silence-sell spreads are -0.16% (t=-2.62), -0.24% (t=-4.23) and -0.26%
(t=-4.89) for the strategy of holding one, six, and 12 months, respectively. These results are
consistent with those presented in Table 2 based on the size and B/M adjusted cumulative
abnormal returns. The value-weight results are statistically weaker. At the value-weight base, the
silence-sell spreads are -0.13% (t=-1.42), -0.14% (t=-1.78) and -0.13% (t=-1.85) for the strategy
of holding one, six, and 12 months, respectively. Since value-weight results are dominated by the
largest stocks, the results suggest that the silence-sell spread is weaker among the largest stocks.
On the other hand, in both equal- and value-weight bases, the buy-sell spreads are not significant
in any holding period. This result is also consistent with that in Table 2.
[Insert Table 3 about here]
3.1.3. Earnings announcement abnormal returns
The results so far suggest that investors fail to fully incorporate the information contained
in preceding insider trading activity. To further investigate whether investors fail to incorporate
the negative information in insider silence and whether they are systematically surprised when
the relevant information is subsequently disclosed to the market, we examine the earnings
announcement period abnormal returns. Specifically, we extract quarterly earnings
11
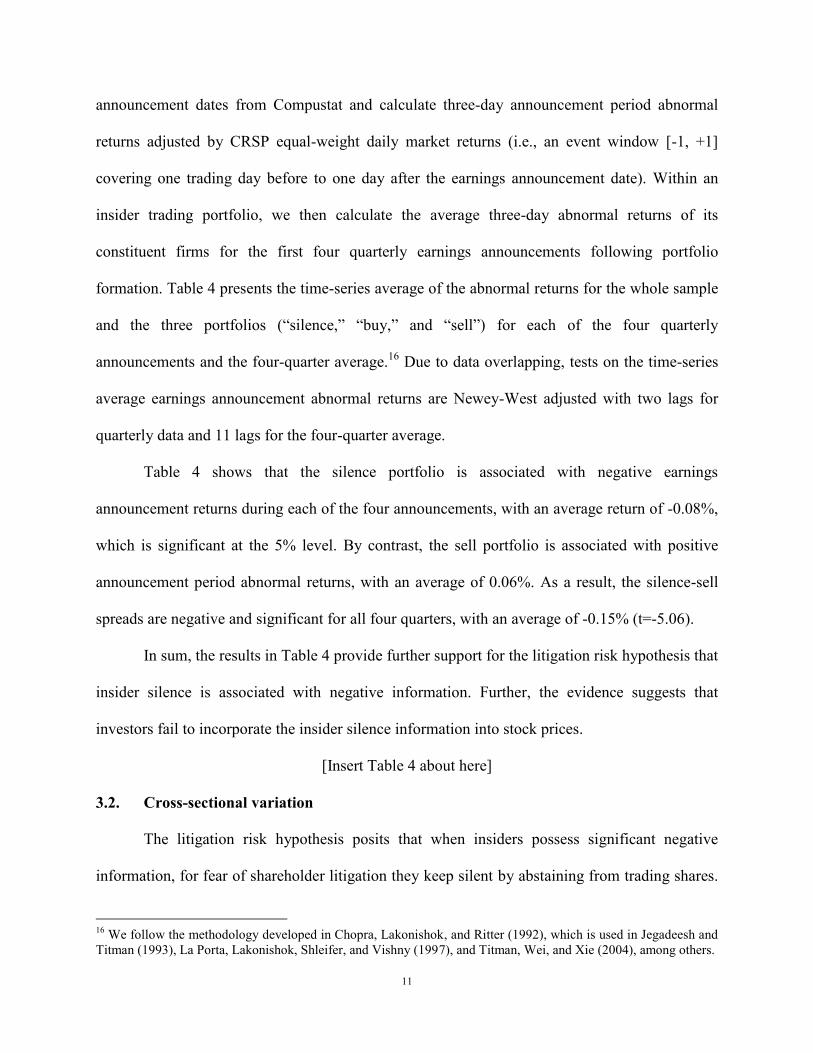
announcement dates from Compustat and calculate three-day announcement period abnormal
returns adjusted by CRSP equal-weight daily market returns (i.e., an event window [-1, +1]
covering one trading day before to one day after the earnings announcement date). Within an
insider trading portfolio, we then calculate the average three-day abnormal returns of its
constituent firms for the first four quarterly earnings announcements following portfolio
formation. Table 4 presents the time-series average of the abnormal returns for the whole sample
and the three portfolios (“silence,” “buy,” and “sell”) for each of the four quarterly
announcements and the four-quarter average.16
Due to data overlapping, tests on the time-series
average earnings announcement abnormal returns are Newey-West adjusted with two lags for
quarterly data and 11 lags for the four-quarter average.
Table 4 shows that the silence portfolio is associated with negative earnings
announcement returns during each of the four announcements, with an average return of -0.08%,
which is significant at the 5% level. By contrast, the sell portfolio is associated with positive
announcement period abnormal returns, with an average of 0.06%. As a result, the silence-sell
spreads are negative and significant for all four quarters, with an average of -0.15% (t=-5.06).
In sum, the results in Table 4 provide further support for the litigation risk hypothesis that
insider silence is associated with negative information. Further, the evidence suggests that
investors fail to incorporate the insider silence information into stock prices.
[Insert Table 4 about here]
3.2. Cross-sectional variation
The litigation risk hypothesis posits that when insiders possess significant negative
information, for fear of shareholder litigation they keep silent by abstaining from trading shares.
16
We follow the methodology developed in Chopra, Lakonishok, and Ritter (1992), which is used in Jegadeesh and
Titman (1993), La Porta, Lakonishok, Shleifer, and Vishny (1997), and Titman, Wei, and Xie (2004), among others.
12
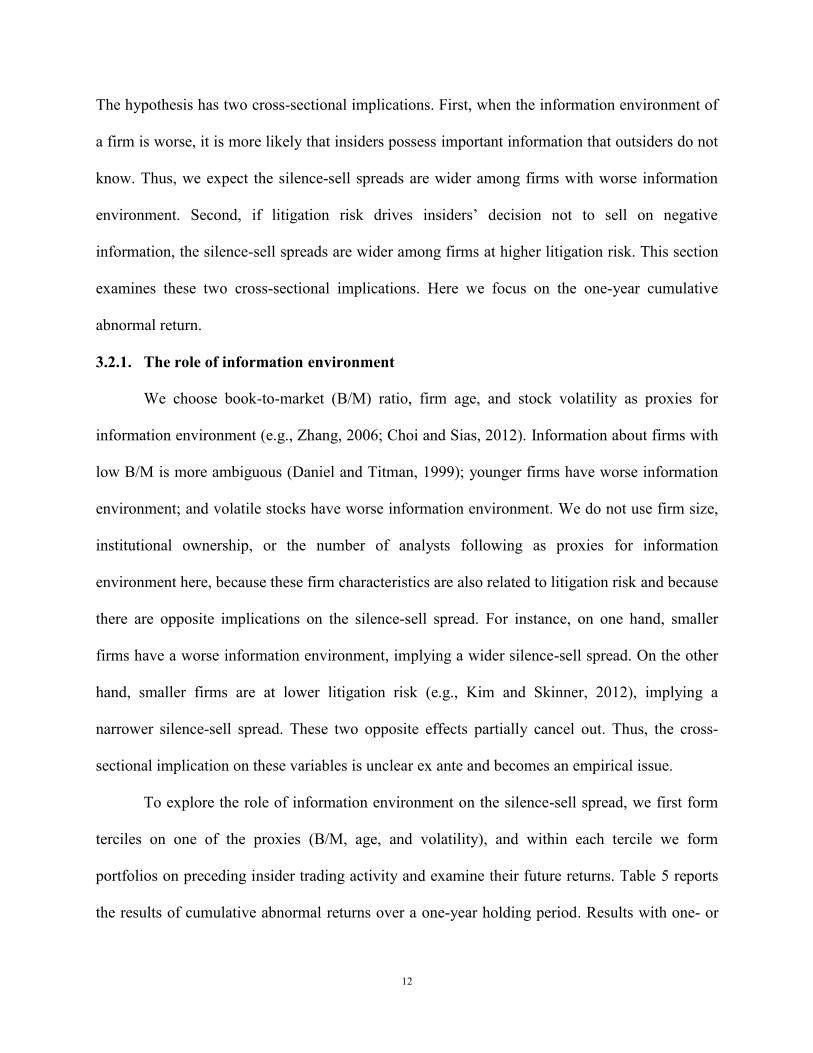
The hypothesis has two cross-sectional implications. First, when the information environment of
a firm is worse, it is more likely that insiders possess important information that outsiders do not
know. Thus, we expect the silence-sell spreads are wider among firms with worse information
environment. Second, if litigation risk drives insiders’ decision not to sell on negative
information, the silence-sell spreads are wider among firms at higher litigation risk. This section
examines these two cross-sectional implications. Here we focus on the one-year cumulative
abnormal return.
3.2.1. The role of information environment
We choose book-to-market (B/M) ratio, firm age, and stock volatility as proxies for
information environment (e.g., Zhang, 2006; Choi and Sias, 2012). Information about firms with
low B/M is more ambiguous (Daniel and Titman, 1999); younger firms have worse information
environment; and volatile stocks have worse information environment. We do not use firm size,
institutional ownership, or the number of analysts following as proxies for information
environment here, because these firm characteristics are also related to litigation risk and because
there are opposite implications on the silence-sell spread. For instance, on one hand, smaller
firms have a worse information environment, implying a wider silence-sell spread. On the other
hand, smaller firms are at lower litigation risk (e.g., Kim and Skinner, 2012), implying a
narrower silence-sell spread. These two opposite effects partially cancel out. Thus, the cross-
sectional implication on these variables is unclear ex ante and becomes an empirical issue.
To explore the role of information environment on the silence-sell spread, we first form
terciles on one of the proxies (B/M, age, and volatility), and within each tercile we form
portfolios on preceding insider trading activity and examine their future returns. Table 5 reports
the results of cumulative abnormal returns over a one-year holding period. Results with one- or

13
six-month holding periods lead to the same conclusions. Panel A shows that the silence-sell
spreads are -4.29% (t=-4.85) among growth stocks (the bottom 1/3 stocks based on B/M) and -
1.30% (t=-2.73) among value stocks (the top 1/3 stocks based on B/M). The growth-value
difference between the two spreads is -2.98% (t=-4.30). Note all t-statistics throughout this paper
are based on Newey-West standard errors. To the extent that lower B/M indicates worse
information environment, the result in Panel A is consistent with our hypothesis that the silence-
sell spread is wider among firms with worse information environment.
In Panel B of Table 5 we form subsamples on firm age. As mentioned earlier, younger
firms have worse information environment. Thus we expect wider silence-sell spreads among
younger firms. Indeed, Panel B shows that the silence-sell spreads are -3.58% (t=-4.77) among
younger firms (lower 1/3 based on firm age) and -1.19% (t=-2.17) among the older firms (top 1/3
based on firm age), leading to a significant young-old difference of -2.39% (t=-3.82). Similarly,
Panel C shows that the silence-sell spreads are -4.76% (t=-4.83) among the most volatile stocks
(top 1/3 on stock volatility) and -1.49% (t=-3.47) among the least volatile stocks (bottom 1/3 on
stock volatility), leading to a significant high-low difference of -3.27% (t=-3.70). To the extent
that firm age and volatility proxy for information environment, these results are consistent with
the hypothesis that firms with worse information environment have a wider silence-sell spread.17
[Insert Table 5 about here]
3.2.2. The role of litigation risk
17
In untabulated analysis, we examine the silence-sell spreads among subsamples formed on firm size. Stocks with
market cap below the NYSE 20th
percentile form the “small” group; stocks with market cap above the NYSE 50th
percentile form the “large” group; all other stocks form the “medium” group. The silence-sell spreads are -1.95%
(t=-2.23) among small firms, -1.69% (t=-2.08) among large firms, and -3.54% (t=-5.46) among medium-sized firms.
Consistent with the conjecture that the relation is ex-ante ambiguous between firm size and the silence-sell spread in
future returns, there is no significant difference between the small and large groups (0.26% with a t=0.29).
14
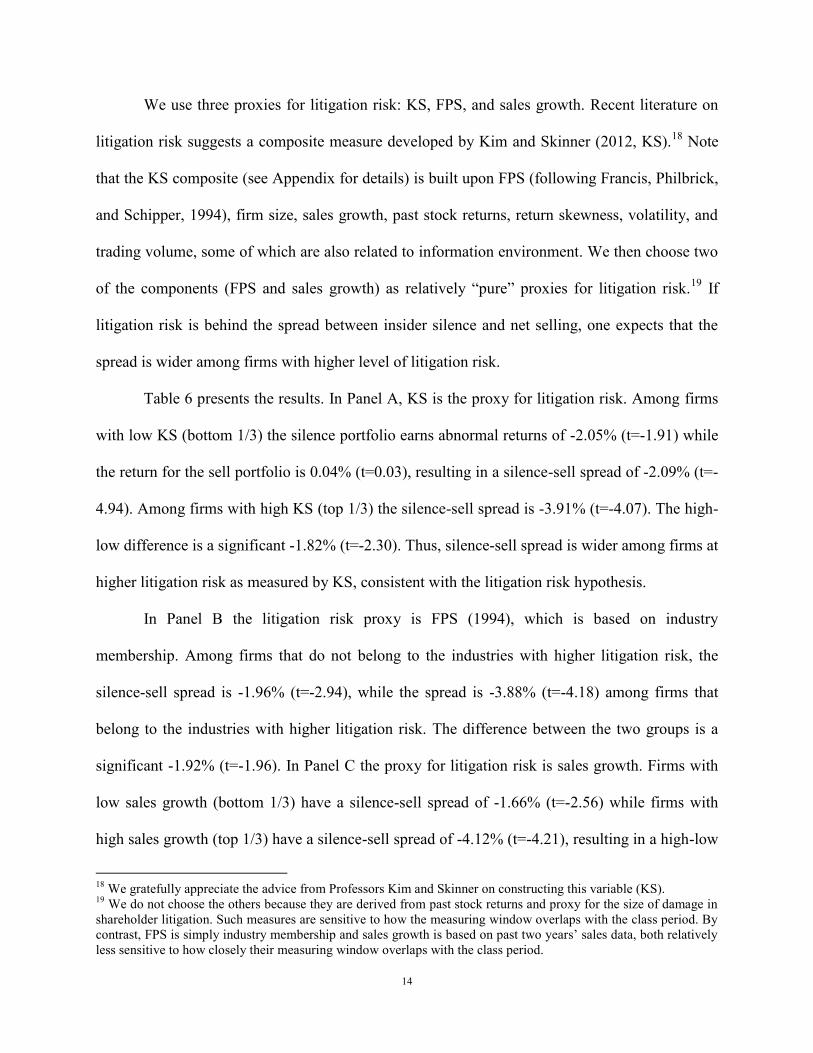
We use three proxies for litigation risk: KS, FPS, and sales growth. Recent literature on
litigation risk suggests a composite measure developed by Kim and Skinner (2012, KS).18
Note
that the KS composite (see Appendix for details) is built upon FPS (following Francis, Philbrick,
and Schipper, 1994), firm size, sales growth, past stock returns, return skewness, volatility, and
trading volume, some of which are also related to information environment. We then choose two
of the components (FPS and sales growth) as relatively “pure” proxies for litigation risk.19
If
litigation risk is behind the spread between insider silence and net selling, one expects that the
spread is wider among firms with higher level of litigation risk.
Table 6 presents the results. In Panel A, KS is the proxy for litigation risk. Among firms
with low KS (bottom 1/3) the silence portfolio earns abnormal returns of -2.05% (t=-1.91) while
the return for the sell portfolio is 0.04% (t=0.03), resulting in a silence-sell spread of -2.09% (t=-
4.94). Among firms with high KS (top 1/3) the silence-sell spread is -3.91% (t=-4.07). The high-
low difference is a significant -1.82% (t=-2.30). Thus, silence-sell spread is wider among firms at
higher litigation risk as measured by KS, consistent with the litigation risk hypothesis.
In Panel B the litigation risk proxy is FPS (1994), which is based on industry
membership. Among firms that do not belong to the industries with higher litigation risk, the
silence-sell spread is -1.96% (t=-2.94), while the spread is -3.88% (t=-4.18) among firms that
belong to the industries with higher litigation risk. The difference between the two groups is a
significant -1.92% (t=-1.96). In Panel C the proxy for litigation risk is sales growth. Firms with
low sales growth (bottom 1/3) have a silence-sell spread of -1.66% (t=-2.56) while firms with
high sales growth (top 1/3) have a silence-sell spread of -4.12% (t=-4.21), resulting in a high-low
18
We gratefully appreciate the advice from Professors Kim and Skinner on constructing this variable (KS). 19
We do not choose the others because they are derived from past stock returns and proxy for the size of damage in
shareholder litigation. Such measures are sensitive to how the measuring window overlaps with the class period. By
contrast, FPS is simply industry membership and sales growth is based on past two years’ sales data, both relatively
less sensitive to how closely their measuring window overlaps with the class period.

15
difference of -2.45% (t=-2.69). This result provides further evidence that firms at higher
litigation risk are associated with a wider silence-sell spread.
[Insert Table 6 about here]
3.2.3. Fama-MacBeth regressions
This section presents Fama-MacBeth regressions. Compared to portfolio analysis, linear
regressions are more flexible to control for other firm/stock characteristics. The dependent
variable is the one-year abnormal returns following portfolio formation. The main independent
variable of interest is a binary variable “silence,” which is equal to one if for a stock/month
insiders have kept silent over the past six months, and zero otherwise. We control for firm size,
book-to-market, and past stock returns, in addition to a binary variable “buy,” which is equal to
one if insiders of the firm have net bought over the past six months. The benchmark case is when
insiders net sell. Thus, the coefficient of the “silence” variable represents the silence-sell spread
after controlling for other variables.
Table 7 presents seven regression models. Each column shows the time-series averages
of 264 cross-sectional regression coefficients with t-statistics presented in parentheses, which are
based on Newey-West standard errors. Model 1 shows a significant coefficient of -2.69% (t=-
4.66) on the “silence” variable, representing the silence-sell spread after controlling for size,
B/M, and past return. The coefficient on “buy” variable is not statistically significant.20
These
results reconfirm the portfolio results as presented in Table 2.
In Model 2, we add the interaction term between “silence” and B/M. The variable B/M
itself is already in the list of control variables. In this and all subsequent regressions in this table
that have interaction terms with the “silence” variable, all the interacted variables are demeaned
20
In an unreported regression, in which a continuous variable of net insider demand is added as a control variable ,
the “silence” variable has a coefficient of -2.68% (t=-4.46), similar to that in Model 1 of Table 7.

16
so that the coefficient on “silence” itself means the silence-sell spread when the interacted
variable is at the sample mean. In Model 2, the coefficient on this interaction term represents
how the silence-sell spread changes with B/M. The coefficient is a significant positive 1.70%
(t=6.14). This result further confirms that the silence-sell spread is wider (more negative) for
firms with lower B/M ratio (growth firms), a result consistent with the hypothesis that the
silence-sell spread is wider among firms with worse information environment. This conclusion is
further supported in Models 3 and 4, where we add the interaction term between “silence” and
firm age (model 3) or volatility (model 4). Both coefficients on the interaction terms are
significant with the expected signs. That is, the silence-sell spread is wider (more negative) for
younger firms and for stocks that are more volatile. In sum, Models 2 to 4 reconfirm the portfolio
results in Table 5 that the silence-sell spread is wider with worse information environment.
In Model 5, we add an interaction term between “silence” and KS, the composite proxy
for litigation risk. If the silence-sell spread is due to insiders’ fear for shareholder litigation risk,
this spread should be wider for firms with higher levels of ex-ante litigation risk. That is, the
interaction term should have a significant negative coefficient. Model 5 shows that the
interaction term silence * KS indeed has a significant negative coefficient of -0.53 (t=-2.17). In
Models 6 and 7, we replace KS with FPS and sales growth, respectively, and find that both
interaction terms have significant negative coefficients. In sum, the regression models 5 to 7
reconfirm that the silence-sell spread is wider among firms at higher litigation risk.21
21
Note that among the three proxies for information environment and three proxies for litigation risk, some are
closely related. For example, the composite measure of litigation risk (KS) has a component of volatility, a
component of FPS, and a component of sales growth. Thus, a regression model with all interaction terms included
could be difficult to interpret. Indeed, when all interaction terms are included (together with the six proxy variables
themselves), the coefficient on KS becomes positive, which is weakly significant. All other interaction terms still
have the expected signs, and the coefficients on silence*volatility and silence*ln(B/M) remain statistically
significant. Unreported for brevity, these results are available upon request.
17
Note that in all seven models, the coefficients on “silence” are all significant at the 1%
level, ranging from -2.52% to -2.85%. These results suggest that when the proxy variables take
the sample mean values, the silence-sell spreads are all significant. Overall, Table 7 provides
further results, in a regression setting, that the silence-sell spread is negative, which
systematically varies with proxies for information environment and proxies for ex-ante litigation
risk. These results are all consistent with the litigation risk hypothesis that, for fear of litigation
risk, insiders abstain from trading on negative information.
[Insert Table 7 about here]
4. Alternative hypotheses and robustness checks
4.1. Other information signals
The evidence so far indicates that insider silence is a signal of negative information that
predicts future returns. It is important to check whether it is actually just a proxy for other
information signals. In this section we consider three types of signals.
First, we check whether insider silence is a proxy for underperformance of firms that
have just conducted initial public offering (IPO). Note that we require sample firms at least one-
year old, so that most sample firms have passed the IPO lockup period (see Brav and Gompers,
2003, p.7) and insiders of the sample firms have at least six months to make insider trading
decisions without the IPO lockup restriction (see section 2). For the remaining IPO firms that
have lockup periods longer than six months, their insiders are still restricted to sell shares during
our six-month window to measure insider trading. Thus, it is important to check whether our
results are driven by the underperformance of these IPO firms (e.g., Ritter, 1991). To account for
this possibility, we add in the Fama-MacBeth regressions an IPO dummy variable which is equal
18
to one if the stock is younger than three years (relative to its first appearance in the CRSP
database).
Second, we check whether it is likely that insiders keep silent in response to some
publicly available signals that predict future returns. For example, firms that have issued stocks
in the past tend to underperform (Loughran and Ritter, 1995), and firms that have higher levels
of accruals tend to underperform (Sloan, 1996). If insiders abstain from trading as a response to
past stock issuance or accruals, then insider silence should not have any information content after
controlling for these other public information signals. We choose the five return anomaly
variables examined in Fama and French (2008) as proxies for the public information signals.
They are net stock issues, momentum (already in our original regressions), accruals, asset
growth, and profitability.
Third, in our hypothesis we implicitly assume that insiders have shares available to sell
but, for fear of shareholder litigation, choose not to. It is possible, however, that the outcome of
“no trading” is due to portfolio constraints as discussed in Marin and Olivier (2008). That is,
insiders cannot short sell their own company shares, insiders have concerns about corporate
control, or the shares insiders hold are restricted and not available for sale. In the framework of
Marin and Olivier (2008), uninformed investors, when observing reduced insider trading
following a period of heavy selling, infer that insiders possess bad news and update their beliefs
on expected payoffs and risk, leading to a price crash.22
To address this possibility, we control
for the net insider demand over the six-month period prior to the current time period. That is, we
control for net insider demand over months -12 to -7 relative to portfolio formation.
22
Strictly speaking, the insider silence phenomenon we examine is fundamentally different from the reduced insider
selling volume studied in Marin and Olivier (2008). In addition, Marin and Olivier (2008) model the probability of
price crash only but do not predict subsequent stock returns, which are the focus of our paper.

19
The Fama-MacBeth regression results are presented in Table 8. Based on the first model
in Table 7, Model 1 in Table 8 adds a dummy variable “IPO firm,” which is equal to one if the
stock is younger than three years. This variable has a significant negative coefficient of -2.49%
(t=-2.43), consistent with IPO underperformance. The coefficient on “silence” remains negative
and significant, with a magnitude similar to that in the first model of Table 7. Thus, Model 1 of
Table 8 suggests that IPO underperformance does not explain the insider silence effect.
In Model 2, we add the anomaly variables: net stock issues (NS), accruals (Ac/B), asset
growth (dA/A), and profitability (Y/B) in the regression. Note that momentum is already in the
list of control variables. Consistent with the literature, firms that issue stock in net underperform
(Ikenberry, Lakonishok, and Vermaelen, 1995; Loughran and Ritter, 1995; Daniel and Titman,
2006; Pontiff and Woodgate, 2008; McLean, Pontiff, and Watanabe, 2012); higher accruals are
associated with lower returns (Sloan, 1996); firms that grow faster in the past tend to earn lower
returns (Fairfield, Whisenant, and Yohn, 2003; Titman, Wei, and Xie, 2004; Cooper, Gulen, and
Schill, 2008); and higher profitability is associated with positive returns (Haugen and Baker,
1996; Cohen, Gompers, and Vuolteenaho, 2002). These results are largely consistent with Fama
and French (2008). Nevertheless, the coefficient on the “silence” dummy remains negative and
significant at -2.77 (t=-4.53), even after controlling for these anomaly variables. Although the
five anomaly variables (with past return included) do not represent all publicly available
information signals, the evidence in Model 2 is clear that these important publicly available
informational signals do not explain the underperformance associated with insider silence.
In Model 3, we add past trades by insiders (NID over months -12 to -7). The coefficient
on past trades is not significant. By contrast, the coefficient on “silence” is virtually unchanged.
Thus, insider silence contains new information beyond what is contained in earlier insider
20
trading activities. Model 4 adds all aforementioned variables in the regression. The coefficient on
“silence” remains negative and significant with a similar magnitude (-2.69% with t=-4.43).
Further, in an untabulated analysis, we add short interest as a control and find that the coefficient
on “silence” remains significant and negative (-2.11% with t=-3.70) and that the short interest
variable carries a significant negative coefficient, consistent with the literature.
In sum, the evidence in Table 8 suggests that the information contained in insider silence
is not explained by IPO underperformance, a broad list of anomaly variables, and insider trading
activity of earlier time period.
[Insert Table 8 about here]
4.2. Insider silence and positive information: the takeover cases
We motivate the phenomenon of insider silence from the perspective of shareholder
litigation, which represents the primary enforcers of insider trading regulations. Because
shareholders are more likely to launch lawsuits following large price drops, the litigation risk is
higher when insiders sell on negative news than when insiders buy on positive news.23
This
argument establishes that insider silence is more likely associated with negative information. The
empirical evidence presented so far confirms this hypothesis. There are, however, situations in
which insiders also abstain from trading when anticipating large stock price jumps. After all, the
regulation on insider trading, in particular 10b-5, applies to both buying and selling on
information. Thus, it is important to consider the potential relation between insider silence and
positive informational events. Of interest is the insider trading decisions prior to takeover offers,
as stock prices on average experience significant jumps at the public announcement. Indeed,
23
See Bettis, Coles, and Lemmon (2000, p.208), Ke, Huddart, and Petroni (2003, p.316), Cheng and Lo (2006, p.
821), Piotroski and Roulstone (2008, p.410), Rogers (2008, p. 1269), Lee, Lemmon, Li, and Sequeira (2012),
Cohen, Malloy, and Pomorski (2012, p. 1040, model 4, Panel B of Table IX), among others.

21
Agrawal and Nasser (2012) document that insiders of takeover targets scale back from selling
shares prior to the public announcement.
In this section we reconcile the average negative relation between insider silence and
future returns as we have shown so far in this paper with a possible positive relation in the case
of takeover offers. Specifically, we examine how frequent takeovers are, how likely insiders
abstain from trading over a six-month period prior to takeover announcements, and the extent to
which takeover events contaminate the average negative signal in insider silence. We first
classify every firm/month as either targeted or non-targeted. A firm/month is targeted if this firm
receives a takeover offer over the subsequent 12-month period; otherwise, it is non-targeted. We
then form portfolios based on both preceding insider trading (silence, buy, and sell) and
subsequent takeover status (targeted vs. non-targeted).
Table 9 presents the average numbers of stocks in the portfolios and their future one-year
returns. For convenience we also present the whole sample data. For the whole sample of
average 2,487 stocks, 141 (5.7%) are classified as targeted during the subsequent 12-month
period. These targeted firms receive an annual return of 20.58% on average, which is consistent
with the literature on mergers and acquisitions (e.g., Andrade, Mitchell, and Stafford, 2001).
Accordingly, the non-targeted portfolio earns a significant negative return of -1.18% (t=-2.64).
Interestingly, among the firms that are targeted, insiders net sell in more than half (74/141) of the
firms over the past six months, net buy in about 20% (28/141) of the firms, and keep silent in
only 28% (39/141) of them. Thus, there is no evidence that insiders predominantly abstain from
trading own-company shares over the six-month period prior to the public announcement.24
After
24
This result is probably related to how long it takes for a takeover deal from deal initiation to the public
announcement. The merger literature seems to use a two-month (Schwert, 1996) or three-month (e.g., Boone and
Mulherin, 2007) period to measure the price runup. If the start of the stock price runup period is somewhere near the
start of the time point insiders refrain from buying shares, it is not surprising that insider silence does not emerge as
22
excluding these targeted firms, the silence portfolio earns a return of -3.10% over the subsequent
12-month period, and the sell portfolios earns -0.39%, resulting in a silence-sell spread of -2.72%
(t=-4.42). This return spread is comparable to the whole sample spread of -2.50% (t=-4.10).
The evidence in Table 9 suggests that for the sample we examine in the paper, the
probability of receiving a takeover offer over a one-year period is not trivial but relatively low
(5.7%); more importantly, there is no evidence that insiders predominantly keep silent over the
six-month period prior to the public announcement; the silence-sell spreads are comparable with
or without excluding these takeover cases. Therefore, the conclusion is in line with our
hypothesis: Insider silence on average signals negative insider information.
[Insert Table 9 about here]
4.3. Long term performance
The results so far suggest that insider silence is associated with negative returns over the
future one, six, and 12 months. In this section we study the long-term stock performance
following preceding insider trading activity. We have two goals in mind. First, following the
litigation risk hypothesis, if insiders keep silent because they possess negative information, a
priori it is unclear whether the negative information is completely incorporated into stock prices
over a one-year period. An investigation of the long-term performance indicates how long it
takes for the negative information to be incorporated into prices. Second is to exclude the
possibility that the results are just by chance. If the relation between insider silence and negative
future returns is by chance, it is expected that the negative returns reverse over the long term.
Table 10 presents the returns of the silence and sell portfolios over the 2nd
& 3rd
years
following portfolio formation. The silence firms earn an average of -1.65% (t=-4.53) and -0.64%
an overwhelming phenomenon during a six-month period prior to the public announcement. After all, the insider
trading pattern of the targeted firms over the first three or four months of the six-month period is no different from
that of a typical firm.
23
(t=-1.86) over the 2nd
and 3rd
subsequent years, respectively. Thus, there is no reversal over the
long term, and it takes more than a year for the negative information to be incorporated into
prices. By comparison, the sell portfolio earns positive returns over each of the two subsequent
years. As a result, the silence-sell spreads are negative and significant over the two years. The
evidence clearly rejects the possibility that the main results in the paper are by chance.
It is worth noting that the long-term returns following insider net selling are not negative.
These results are consistent with the existing literature. For example, Lakonishok and Lee (2001,
p.102) report abnormal returns to a portfolio of low net purchase ratio (more likely net selling)
are 1.0% and 1.2% for the second and third years, respectively, following portfolio formation.
By contrast, the corresponding returns to a portfolio of high net purchase ratio (more likely net
buying) are 0.1% and -0.1% over the second and third years, respectively. Similarly, Sias and
Whidbee (2010, p.1575) report a two-year abnormal return of 1.93% and 0.28% for mid- and
large-cap stocks, respectively, following net insider selling.
The result that insider net selling is associated with non-negative (or even positive) long-
term returns appears counterintuitive to conventional wisdom, which suggests that insider net
selling is motivated, at least partly, by bad news and thus predicts negative future returns. If one
takes into account the litigation risk involved in insider selling, however, it is not surprising non-
negative long-term returns are associated with insider net selling. Despite the high-profile cases
that some insiders commit illegal insider trading by selling on significant negative news, the
result indicates that, on average, insiders do not sell on significant negative information. The fact
that a small number of insiders who committed apparently illegal insider trading were
subsequently exposed to the media and prosecuted by legal forces also helps remind all corporate
24
insiders the litigation risk involved in insider trading.25
Such legal actions help maintain the
equilibrium outcome in which corporate insiders as a whole do not sell shares on significant
negative information. Indeed, Cohen, Malloy, and Pomorski (2012, p. 1039) show that
opportunistic insider trading, which predicts returns up to six months, is sensitive to the number
of SEC sanctions and that opportunistic trades (especially sales) attract subsequent SEC activity.
The results on insider trading in this paper suggest that corporate insiders on average sell shares
while anticipating not so negative (or mildly positive) returns in the future and abstain from
trading while anticipating significant negative future returns.
[Insert Table 10 about here]
4.4. Database quality
In our analysis we classify a firm to the “silence” group if we do not observe any insider
trading activity as recorded in the database. The validity of this definition depends on the quality
of the database, Thomson Reuters. Several other possibilities could lead to observing no insider
trading. First, insiders have traded but failed to report to the SEC or the SEC’s record of insider
trades is incomplete.26
Thus, a researcher could mistakenly assign stocks to the “silence”
portfolio while they actually belong to the “buy” or “sell” portfolio. If these unfiled or
unrecorded trades are not driven by private information, the incompleteness of the database
simply adds random noise to the data and works against our empirical testing.
Second, insiders have traded on private information but decided not to report to the SEC
due to fear of regulatory and legal action. Seyhun and Bradley (1997, p. 200) discuss this
25
For recent legal cases against such apparent illegal insider trading, see Pulliam and Barry (2012), “Executives’
good luck in trading own stock,” The Wall Street Journal, November 22, 2012. 26
The insider trading data we use are made available through Wharton Research Data Services (WRDS). The
WRDS web has the following description of the database: “The Insider Filing Data Feed (IFDF) is designed to
capture all U.S. insider activity as reported on Forms 3, 4, 5, and 144 in line-by-line detail.” (See http://wrds-
web.wharton.upenn.edu/wrds/ds/tfn/index.cfm)
25
possibility on a sample of firms that filed bankruptcy. Meulbroek (1992) examines episodes of
illegal insider trading. Without a full list of such illegal insider trading we cannot distinguish
whether our “insider silence” cases are due to insiders having not traded on information or
insiders having traded on information but having hidden the trades from regulators. Either way,
however, the observed insider silence is consistent with our hypothesis that the fear for
regulatory and legal actions is at work when insiders make trading decisions.
Third, insiders might engage in off-market transactions instead of outright open-market
transactions.27
Jagolinzer, Matsunaga, and Yeung (2007) report that insiders use prepaid variable
forward (PVF) transactions for hedging purposes and find that such transactions typically follow
strong performance and precede degraded accounting and stock performance.28
Jagolinzer,
Matsunaga, and Yeung (2007, p. 1056) point out that these PVF transactions are alternative to
open-market sales that allow insiders to avoid downside loss and mitigate litigation risk. While
beyond the scope of the paper, it is interesting for future research to examine whether insider
silence and off-market transactions are somehow related. Regardless, insiders’ incentives to
engage in off-market transactions are also consistent with avoiding litigation risk.
4.5. Time-series variation
Two time points over the sample period are potentially important for understanding the
evolving litigation environment. One is the Private Securities Litigation Reform Act of 1995, or
PSLRA, and the other is the Sarbanes-Oxley of 2002 (SOX).
The PSLRA erects a series of procedural barriers designed to discourage frivolous
lawsuits. On the face value, firms would face lower litigation risk post-PSLRA. The number of
suits being filed Post-PSLRA, however, has not declined (Johnson, Nelson, and Pritchard 2007).
27
We thank P. Eric Yeung for pointing out this possibility and for detailed discussions on this point. 28
See also Bettis, Bizjak, and Lemmon (2001), who examine zero-cost collars transacted between insiders and
investment banks.
26
The upsurge in filings probably reflects a massive expansion in the amount of fraud being
committed, perhaps due to reduced exposure to liability (Bernardo, Talley, and Welch, 2000).
The notorious fraudulent cases such as Enron and WorldCom over this time period are examples.
Another issue is that plaintiff lawyers have stronger incentives to file a larger number of
lawsuits, in the hope they eventually win at least some. Thus, it is not all clear whether firms face
higher or lower litigation risk post-PSLRA.
The litigation environment may have shifted again due to the SOX, passed in 2002. The
direction on the change of litigation risk, however, is again unclear. On one hand, SOX imposes
more stringent requirements on governance and accounting control on public companies in an
effort to deter fraud. These mechanisms may lower firms’ litigation risk by lowering the overall
incidence of fraud. On the other hand, SOX also requires the chief executive and financial
officers to certify their company’s financial results, which could expose these executives and
their companies to additional litigation risk because it provides additional evidence of scienter if
those financial results are subsequently found misstated.
Because the implications of the two time points (PSLRA and SOX) on litigation risk are
not clear, our analysis on the time variation of the silence-sell spread is mostly descriptive in
nature. To simply take a look at the time series, we first draw the month-by-month silence-sell
spread in Figure 2. As one can see, the silence-sell spread is negative for majority of the months.
The recent financial crisis period is the obvious exception. It might be that insiders behave
differently during the recent economic turmoil, that insiders’ information is not as predictive as
in normal time periods, or that the stock prices do not reflect as much the fundamentals. To avoid
the impact of this turbulent period, in our subsequent exploratory analysis on time-varying
litigation risk, we exclude the time period after the end of 2007.
27
[Insert Figure 2 about here]
Table 11 presents the one-year portfolio cumulative abnormal returns and silence-sell
spreads for three periods: pre-PSLRA (1990-1995), post-PSLRA but pre-SOX (1996-2002), and
post-SOX (2003-2007). Pre-PSLRA, the silence portfolio earns a return of -2.54% (t=-3.18) and
the sell portfolio earns 0.75% (t=2.32), resulting in a silence-sell spread of -3.28% (t=-4.05).
Post-PSLRA but pre-SOX, the silence-sell spread is -4.46% (t=-3.96). The difference between
these two periods is an insignificant -1.18% (t=-0.85). Post-SOX, the silence-sell spread is -
1.36% (t=-3.38). Compared to the second period (post-PSLRA but pre-SOX), the silence-sell
spread post-SOX is significantly lower by 3.10% (t=2.59).29
The overall results appear to be
consistent with the view that SOX, by imposing stringent governance and accounting control
requirement, has reduced the overall incidence of fraud.30
[Insert Table 11 about here]
4.6. Other robustness checks
Additional robustness checks are conducted. Specifically, we check robustness by a)
using 3-month and 12-month periods to measure past insider trading activity; b) focusing on
trading activity by managers and directors only; c) measuring insider trading activity based on
transaction dates instead of report dates; d) adding back the low-priced and very small stocks
into the sample. We conduct these robustness checks using the Fama-MacBeth regression as in
Model 1 of Table 7. Results are presented in Table 12.
The first two regressions in Table 12 show that when insider trading information is
measured over the preceding three and 12 months, the regression coefficients on the “silence”
29
Unreported for brevity, none of the buy-sell spreads over the three periods is statistically significant; likewise,
none of the differences in the buy-sell spreads between the periods is statistically significant. 30
Alternatively, the narrower silence-sell spread over the more recent time period is also possible if the information
environment facing the firms has in general improved over time.
28
variable are -2.20% (t=-4.64), and -4.89% (t=-6.73), respectively. These results suggest that our
main results are robust to the window of measuring past insider trading activity. The third and
fourth models also produce significant negative coefficients on the “silence” variable, suggesting
that our main results are robust to focusing on trades by managers and officers only or to using
transaction dates instead of report dates to define the measuring period. In the last model, we
expand the sample by adding back the low-priced and small stocks (we require minimum stock
price of $1). The coefficient on “silence” is -2.39% (t=-3.88), indicating that our main results are
robust to including the very small and low-priced stocks in the sample.
[Insert Table 12 about here]
5. Conclusion
This paper examines stock returns following insider silence, periods of no insider trading.
We hypothesize that, for fear of litigation risk, rational insiders do not sell own-company shares
when they withhold bad news. Neither would they buy, given the unfavorable prospects. Thus
they keep silent. By contrast, rational insiders sell shares when they do not anticipate significant
bad news to come. Consistent with this hypothesis, we find that future returns are significantly
lower following insider silence than following insider net selling. Further, the silence-sell spread
is wider among firms with worse information environment and firms at higher litigation risk.
This paper fills a gap in the insider trading literature. The extant literature focuses
exclusively on the buying and selling activities by corporate insiders. This paper shows that
insider silence, a period of no insider trading, signals significant negative information.

29
References:
Acharya, Viral V., Peter DeMarzo and Ilan Kremer, 2011, Endogenous information flows and
the clustering of announcements, American Economic Review 101: 2955-2979.
Agrawal, A., Nasser, T., 2012. Insider trading in takeover targets. Journal of Corporate Finance
18, 598-625.
Akbas, Ferhat, 2013. The calm before the storm. Available at http://ssrn.com/abstract=2230698.
Andrade, G., M. Mitchell, and E. Stafford, 2001, New Evidence and Perspectives on Mergers,
Journal of Economic Perspectives 15, 103-120.
Arshadi, N., 1998. Insider trading liability and enforcement strategy. Financial Management 70,
70–84.
Bainbridge, S., 2007. Securities Law: Insider Trading. Foundation Press, 2 ed.
Bagnoli, M., Kross, W., Watts, S.G., 2002. The Information in Management’s Expected
Earnings Report Date: A Day Late, a Penny Short. Journal of Accounting Research 40 (5),
1275–1296.
Bernardo, A., E. Talley, and I. Welch. 2000. A Theory of Legal Presumptions. Journal of Law,
Economics and Organization 16, 1–49.
Bettis, J.C., Bizjak, J.M., Lemmon, M.L., 2001. Managerial ownership, incentive contracting and
the use of zero-cost collars and equity swap by corporate insiders. Journal of Financial and
Quantitative Analysis 36, 345–70.
Bettis, J.C., Coles, J.L., Lemmon, M.L., 2000. Corporate policies restricting trading by insiders.
Journal of Financial Economics 57, 191–220.
Boone, A., Mulherin, H., 2007. How are firms sold? The Journal of Finance 62, 847-875.
Brav, A., and P. A. Gompers. 2003. The Role of Lockups in Initial Public Offerings. Review of
Financial Studies 16, 1–29.
Cheng, Q., Lo, K., 2006. Insider trading and voluntary disclosures. Journal of Accounting
Research 44, 815-848.
Choi, N.Y., Sias, R.W., 2012. Why does financial strength forecast stock returns? Evidence from
subsequent demand by institutional investors. Review of Financial Studies 25, 1550–1587.
Chopra, N., Lakonishok, J., Ritter, J., 1992. Measuring abnormal returns: Do stocks overreact?
Journal of Financial Economics 31, 235–268.
Chowdhury, M., J. Howe, and J. Lin. 1993.The relation between aggregate insider transactions
and stock market returns. Journal of Financial and Quantitative Analysis 28: 431–7.
Cohen, L, Malloy, C., Pomorski, L., 2012. Decoding inside information. Journal of Finance 67,
1009–43.
Cohen, R.B., Gompers, P.A., Vuolteenaho, T., 2002. Who underreacts to cash flow news?
Evidence from trading between individuals and institutions, Journal of Financial
Economics 66, 409–462.
Cooper, M.J., Gulen, H., Schill, M.J., 2008. Asset growth and the cross- section of stock returns.
Journal of Finance 63, 1609–1652.
Daniel, K., and Sheridan Titman. 1999. Market Efficiency in an Irrational World. Financial
Analysts' Journal 55, 28-40.
Daniel, Kent, and Sheridan Titman, 2006, Market reactions to tangible and intangible
information, Journal of Finance 61, 1605–1643.
Dye, R.A., 1985, Disclosure of nonproprietary information, Journal of Accounting Research 23,
123-45.
30
Dye, Ronald A. and Sri S. Sridhar, 1995, Industry-wide disclosure dynamics, Journal of
Accounting Research 33, (1): 157-174.
Fairfield, P., Whisenant, S., Yohn, T., 2003, Accrued earnings and growth: Implications for
future profitability and market mispricing, The Accounting Review 78, 353–371.
Fama, E. F., and K. R. French. 1992, The cross-section of expected stock returns, Journal of
Finance 47, 427–465.
Fama, E., French, K., 1993. Common risk factors in the returns on stocks and bonds. Journal of
Financial Economics 33, 3–56.
Fama, E., French, K., 2008. Dissecting Anomalies. Journal of Finance 63:1653–78.
Finnerty, J. 1976. Insiders and Market Efficiency. Journal of Finance 31: 1141–8.
Francis, J., Philbrick, D., Schipper, K., 1994. Shareholder litigation and corporate disclosures.
Journal of Accounting Research 32, 137–164.
Giglio, S., Shue, K., 2013. No news is news: Do markets underreact to nothing? NBER working
paper #18914.
Graham, John R., Campbell R. Harvey, and Shiva Rajgopal, 2005, The economic implications of
corporate financial reporting, Journal of Accounting and Economics 40 (1-3): 3-73.
Haugen, Robert A., and Nardin L. Baker, 1996, Commonality in the determinants of expected
stock returns, Journal of Financial Economics 41, 401–439.
Ikenberry, David, Josef Lakonishok, and Theo Vermaelen, 1995, Market underreaction to open
market share repurchases, Journal of Financial Economics 39, 181–208.
Jaffe, F. 1974. Special Information and Insider Trading. Journal of Business 47: 410–28.
Jagolinzer A.D., Roulstone, D., 2009. The effects of insider trading regulation on trade timing,
litigation risk, and profitability. Working paper.
Jagolinzer A.D., Matsunaga, S.R., Yeung, P.E., 2007. An analysis of insiders’ use of prepaid
variable forward transactions. Journal of Accounting Research 45, 1050-1079.
Jegadeesh, Narasimhan, and Sheridan Titman, 1993, Returns to buying winners and selling
losers: Implications for stock market efficiency, Journal of Finance 48, 65–91.
Jegadeesh, Narasimhan, and Sheridan Titman, 2001, Profitability of momentum strategies: An
evaluation of alternative explanations, Journal of Finance 56, 699-720.
Jeng, L., A. Metrick, and R. Zeckhauser. 2003. Estimating the Returns to Insider Trading: A
Performance-Evaluation Perspective. The Review of Economics and Statistics 85: 453–71.
Johnson, M., Nelson, K., Pritchard, A., 2007. Do the merits matter more? The impact of the
Private Securities Litigation Reform Act. Journal of Law, Economics, and Organization 23:
627–52.
Jung, W., Kwon, Y.K., 1988. Disclosure when the market is unsure of information endowment
of managers. Journal of Accounting Research 26: 146-153.
Ke, B., Huddart, S., Petroni, K., 2003. What insiders know about future earnings and how they
use it: Evidence from insider trades. Journal of Accounting and Economics 35, 315–46.
Kim I., Skinner, D.J., 2012. Measuring securities litigation risk. Journal of Accounting and
Economics 53, 290-310.
Kothari, S.P., Susan Shu, and Peter D. Wysocki, 2009, Do managers withhold bad news?,
Journal of Accounting Research 47: 1-36.
Lakonishok, J., Lee, I., 2001. Are insider trades informative? Review of Financial Studies 14,
79–111.
La Porta, R., Lakonishok, J., Shleifer, A., Vishny, R., 1997. Good news for value stocks: further
evidence on market efficiency. Journal of Finance 49, 1541–78.
31
Lee, I., Lemmon, M., Li, Y., Sequeira, J., 2012. Do voluntary corporate restrictions on insider
trading eliminate informed insider trading? Working paper June 2012.
Lin, J., and J. Howe, 1990. Insider Trading in the OTC Market. Journal of Finance 45, 1273–84.
Loughran, Tim, and Jay R. Ritter, 1995, The new issues puzzle, Journal of Finance 50, 23–51.
Ma, Q., 2013. Momentum and insider trading. http://ssrn.com/abstract=2293221.
Ma, Q., Ukhov, A., What is Common among Return Anomalies? Evidence from Insider Trading
Decisions (May 7, 2013). Available at SSRN: http://ssrn.com/abstract=2188653.
Marin, J.M., Olivier, J.P., 2008. The dogs that did not bark: Insider trading and crashes. Journal
of Finance 63, 2429–2476.
McLean, David, Jeffrey Pontiff, and Akiko Watanabe, 2009, Share Issuance and Cross-Sectional
Returns: International Evidence, Journal of Financial Economics, 94, 1-17.
Meulbroek, L.K., 1992. An empirical analysis of illegal insider trading. Journal of Finance 47,
1661–1699.
Newey, W.K., West, K.D., 1987. A simple positive semi–definite, heteroskedasticity and
autocorrelation consistent covariance matrix. Econometrica 55, 703–708.
Noe, C., 1999. Voluntary Disclosures and Insider Transactions. Journal of Accounting and
Economics 27: 305–26.
Pastor, L., and R. F. Stambaugh, 2003, Liquidity risk and stock returns. Journal of Political
Economy 111, 642-685.
Piotroski, J.D., Roulstone, D.T., 2005. Do insider trades reflect both contrarian beliefs and
superior knowledge about future cash flow realizations? Journal of Accounting and
Economics 39, 55–81.
Piotroski, J.D., Roulstone, D.T., 2008. Evidence on the Non-linear Relation between Insider
Trading Decisions and Future Earnings Information. Journal of Law, Economics, and
Policy 4, 409-448.
Pontiff, J., Woodgate, A., 2008, Share issuance and cross-sectional returns, Journal of Finance
63, 921–945.
Pulliam, S., Barry, R., 2012. Executives’ good luck in trading own stock. The Wall Street
Journal, November 22, 2012.
Ritter, J. R., 1991. The long-run performance of initial public offerings. The Journal of Finance,
46: 3–27.
Rogers, J. L. 2008. Disclosure quality and management trading incentives. Journal of
Accounting Research 46 (5): 1265–1296.
Rogers, J. L., and A. Van Buskirk. 2009. Shareholder litigation and changes in disclosure
behavior. Journal of Accounting and Economics 47 (1-2): 136–156.
Rogers, J., Catherine Shrand, and Sarah Zechman, 2013. Do Managers Tacitly Collude to
Withhold Industry-Wide Bad News? Working paper. http://ssrn.com/abstract=2221558
Rogers, J.L., Van Burskirk, Andrew, and Sarah Zechman. 2011. Disclosure tone and shareholder
litigation. The Accounting Review 86, 2155-2183.
Rogers, Jonathan L. and Andrew Van Buskirk, 2009, Shareholder litigation and changes in
disclosure behavior, Journal of Accounting and Economics 47 (1/2): 136-156.
Rozeff, M.S., Zaman, M.A., 1988, Market efficiency and insider trading: New evidence, Journal
of Business 61, 25–44.
Rozeff, M.S., Zaman, M.A., 1998. Overreaction and insider trading: Evidence from growth and
value portfolios. Journal of Finance 53, 701–16.

32
Sadka, R., 2006. Momentum and post-earnings-announcement drift anomalies: The role of
liquidity risk. Journal of Financial Economics 80, 309-349.
Schwert, W.G., 1996. Markup pricing in mergers and acquisitions. Journal of Financial
Economics 41, 153–192.
Seyhun, H.N., 1986. Insiders’ profits, costs of trading, and market efficiency. Journal of
Financial Economics 16, 189–212.
Seyhun, H.N., Bradley, M., 1997. Corporate bankruptcy and insider trading. Journal of Business
70, 189-216.
Seyhun, H.N., 1992. Effectiveness of insider trading sanctions. Journal of Law and Economics
35, 149-182.
Seyhun, H.N., 1998. Investment Intelligence: From Insider Trading. MIT Press, Cambridge,
Mass.
Shin, Hyun S., 2003, Disclosures and asset returns, Econometrica 71, 105 - 133.
Shin, Hyun S., 2006, Disclosure risk and price drift, Journal of Accounting Research 44, 351-9.
Sias, R., Whidbee, D., 2010. Insider trades and demand by institutional and individual investors.
Review of Financial Studies 23, 1544–95.
Sletten, Ewa, 2012. The effect of stock price on discretionary disclosure, Review of Accounting
Studies 17: 96-133.
Sloan, Richard G., 1996, Do stock prices fully reflect information in accruals and cash flows
about future earnings? The Accounting Review 71, 289–315.
Titman, S., Wei, K.C.J., Xie, F., 2004. Capital investments and stock returns. Journal of
Financial and Quantitative Analysis 39, 677–700.
Tse, Senyo and Jennifer Wu Tucker, 2010, Within-industry timing of earnings warnings: do
managers herd? Review of Accounting Studies 15: 879-914.
Zhang, X.F., 2006. Information uncertainty and stock returns. Journal of Finance 61, 105-137.
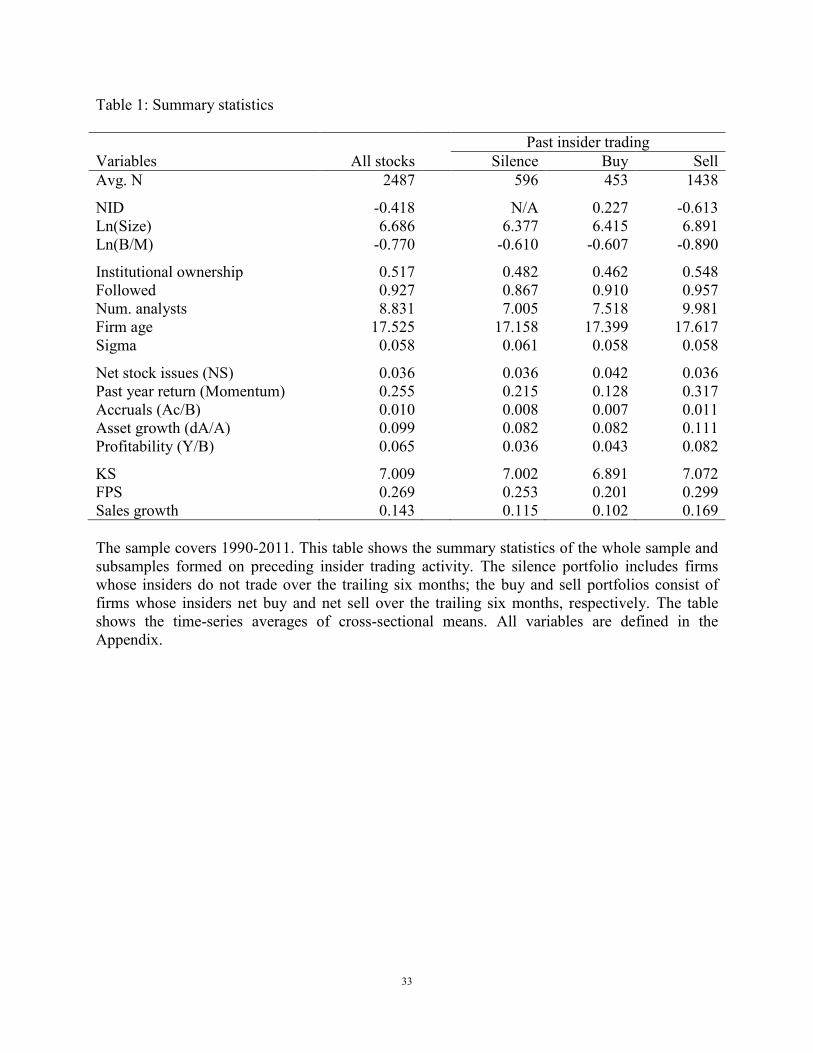
33
Table 1: Summary statistics
Past insider trading
Variables All stocks Silence Buy Sell
Avg. N 2487 596 453 1438
NID -0.418
N/A 0.227 -0.613
Ln(Size) 6.686
6.377 6.415 6.891
Ln(B/M) -0.770
-0.610 -0.607 -0.890
Institutional ownership 0.517
0.482 0.462 0.548
Followed 0.927
0.867 0.910 0.957
Num. analysts 8.831
7.005 7.518 9.981
Firm age 17.525
17.158 17.399 17.617
Sigma 0.058
0.061 0.058 0.058
Net stock issues (NS) 0.036
0.036 0.042 0.036
Past year return (Momentum) 0.255
0.215 0.128 0.317
Accruals (Ac/B) 0.010
0.008 0.007 0.011
Asset growth (dA/A) 0.099
0.082 0.082 0.111
Profitability (Y/B) 0.065
0.036 0.043 0.082
KS 7.009
7.002 6.891 7.072
FPS 0.269
0.253 0.201 0.299
Sales growth 0.143 0.115 0.102 0.169
The sample covers 1990-2011. This table shows the summary statistics of the whole sample and
subsamples formed on preceding insider trading activity. The silence portfolio includes firms
whose insiders do not trade over the trailing six months; the buy and sell portfolios consist of
firms whose insiders net buy and net sell over the trailing six months, respectively. The table
shows the time-series averages of cross-sectional means. All variables are defined in the
Appendix.
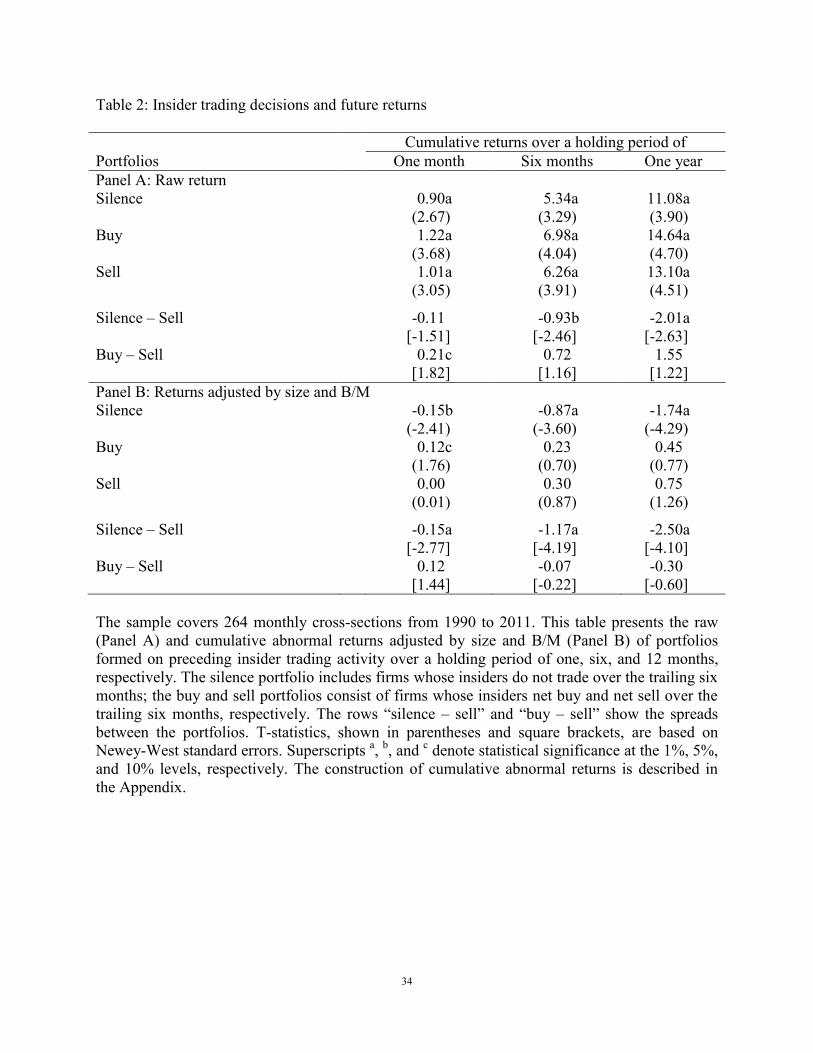
34
Table 2: Insider trading decisions and future returns
Cumulative returns over a holding period of
Portfolios One month Six months One year
Panel A: Raw return
Silence
0.90a 5.34a 11.08a
(2.67) (3.29) (3.90)
Buy
1.22a 6.98a 14.64a
(3.68) (4.04) (4.70)
Sell
1.01a 6.26a 13.10a
(3.05) (3.91) (4.51)
Silence – Sell
-0.11 -0.93b -2.01a
[-1.51] [-2.46] [-2.63]
Buy – Sell
0.21c 0.72 1.55
[1.82] [1.16] [1.22]
Panel B: Returns adjusted by size and B/M
Silence
-0.15b -0.87a -1.74a
(-2.41) (-3.60) (-4.29)
Buy
0.12c 0.23 0.45
(1.76) (0.70) (0.77)
Sell
0.00 0.30 0.75
(0.01) (0.87) (1.26)
Silence – Sell
-0.15a -1.17a -2.50a
[-2.77] [-4.19] [-4.10]
Buy – Sell
0.12 -0.07 -0.30
[1.44] [-0.22] [-0.60]
The sample covers 264 monthly cross-sections from 1990 to 2011. This table presents the raw
(Panel A) and cumulative abnormal returns adjusted by size and B/M (Panel B) of portfolios
formed on preceding insider trading activity over a holding period of one, six, and 12 months,
respectively. The silence portfolio includes firms whose insiders do not trade over the trailing six
months; the buy and sell portfolios consist of firms whose insiders net buy and net sell over the
trailing six months, respectively. The rows “silence – sell” and “buy – sell” show the spreads
between the portfolios. T-statistics, shown in parentheses and square brackets, are based on
Newey-West standard errors. Superscripts a,
b, and
c denote statistical significance at the 1%, 5%,
and 10% levels, respectively. The construction of cumulative abnormal returns is described in
the Appendix.
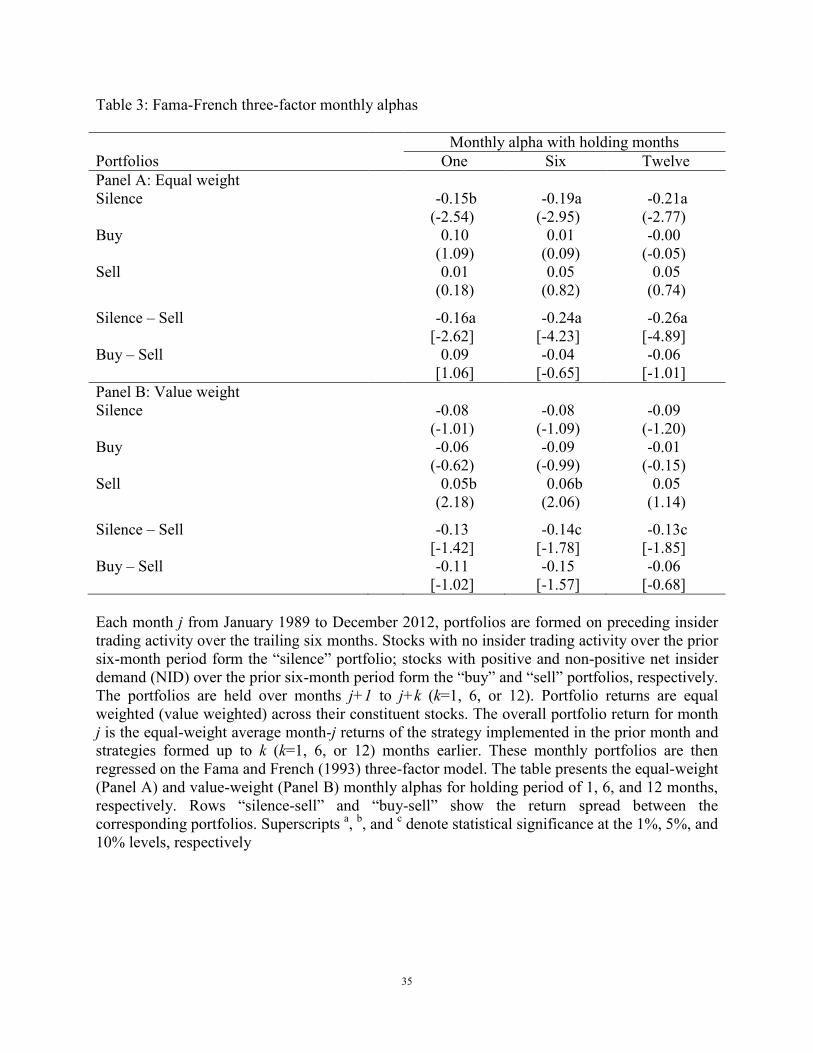
35
Table 3: Fama-French three-factor monthly alphas
Monthly alpha with holding months
Portfolios One Six Twelve
Panel A: Equal weight
Silence
-0.15b -0.19a -0.21a
(-2.54) (-2.95) (-2.77)
Buy
0.10 0.01 -0.00
(1.09) (0.09) (-0.05)
Sell
0.01 0.05 0.05
(0.18) (0.82) (0.74)
Silence – Sell
-0.16a -0.24a -0.26a
[-2.62] [-4.23] [-4.89]
Buy – Sell
0.09 -0.04 -0.06
[1.06] [-0.65] [-1.01]
Panel B: Value weight
Silence
-0.08 -0.08 -0.09
(-1.01) (-1.09) (-1.20)
Buy
-0.06 -0.09 -0.01
(-0.62) (-0.99) (-0.15)
Sell
0.05b 0.06b 0.05
(2.18) (2.06) (1.14)
Silence – Sell
-0.13 -0.14c -0.13c
[-1.42] [-1.78] [-1.85]
Buy – Sell
-0.11 -0.15 -0.06
[-1.02] [-1.57] [-0.68]
Each month j from January 1989 to December 2012, portfolios are formed on preceding insider
trading activity over the trailing six months. Stocks with no insider trading activity over the prior
six-month period form the “silence” portfolio; stocks with positive and non-positive net insider
demand (NID) over the prior six-month period form the “buy” and “sell” portfolios, respectively.
The portfolios are held over months j+1 to j+k (k=1, 6, or 12). Portfolio returns are equal
weighted (value weighted) across their constituent stocks. The overall portfolio return for month
j is the equal-weight average month-j returns of the strategy implemented in the prior month and
strategies formed up to k (k=1, 6, or 12) months earlier. These monthly portfolios are then
regressed on the Fama and French (1993) three-factor model. The table presents the equal-weight
(Panel A) and value-weight (Panel B) monthly alphas for holding period of 1, 6, and 12 months,
respectively. Rows “silence-sell” and “buy-sell” show the return spread between the
corresponding portfolios. Superscripts a,
b, and
c denote statistical significance at the 1%, 5%, and
10% levels, respectively
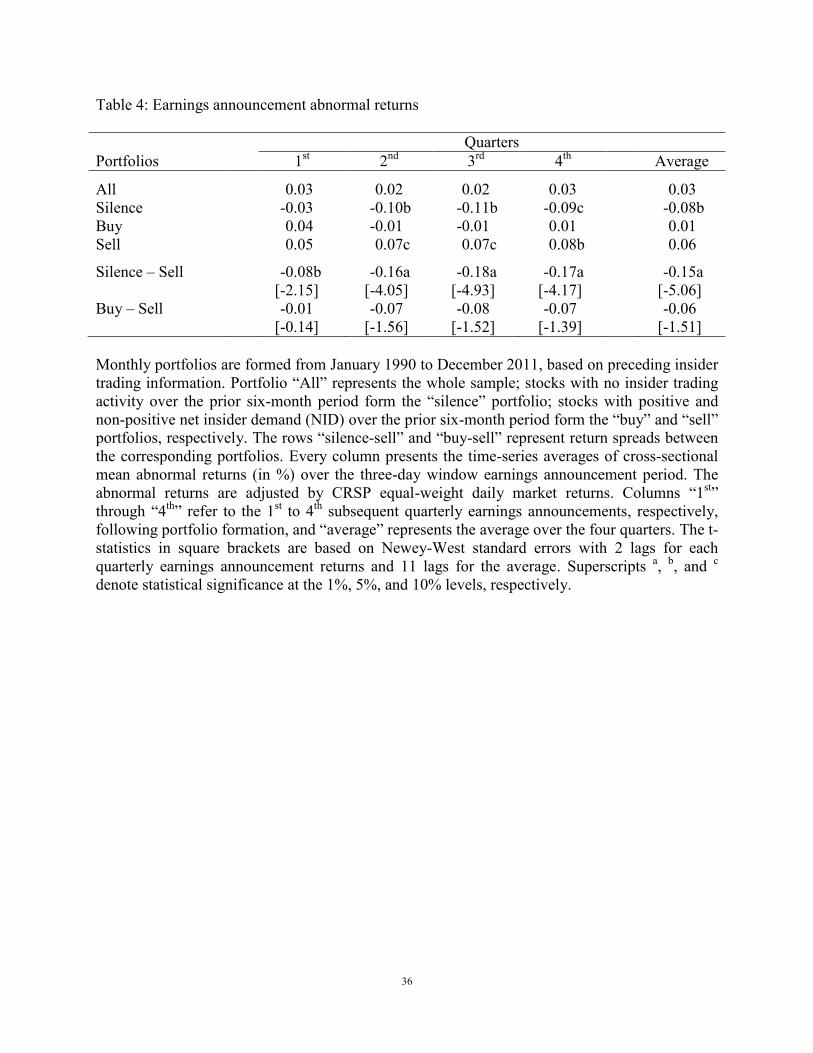
36
Table 4: Earnings announcement abnormal returns
Quarters
Portfolios 1st 2
nd 3
rd 4
th
Average
All
0.03 0.02 0.02 0.03
0.03
Silence
-0.03 -0.10b -0.11b -0.09c
-0.08b
Buy
0.04 -0.01 -0.01 0.01
0.01
Sell
0.05 0.07c 0.07c 0.08b
0.06
Silence – Sell
-0.08b -0.16a -0.18a -0.17a
-0.15a
[-2.15] [-4.05] [-4.93] [-4.17]
[-5.06]
Buy – Sell
-0.01 -0.07 -0.08 -0.07
-0.06
[-0.14] [-1.56] [-1.52] [-1.39] [-1.51]
Monthly portfolios are formed from January 1990 to December 2011, based on preceding insider
trading information. Portfolio “All” represents the whole sample; stocks with no insider trading
activity over the prior six-month period form the “silence” portfolio; stocks with positive and
non-positive net insider demand (NID) over the prior six-month period form the “buy” and “sell”
portfolios, respectively. The rows “silence-sell” and “buy-sell” represent return spreads between
the corresponding portfolios. Every column presents the time-series averages of cross-sectional
mean abnormal returns (in %) over the three-day window earnings announcement period. The
abnormal returns are adjusted by CRSP equal-weight daily market returns. Columns “1st”
through “4th
” refer to the 1st to 4
th subsequent quarterly earnings announcements, respectively,
following portfolio formation, and “average” represents the average over the four quarters. The t-
statistics in square brackets are based on Newey-West standard errors with 2 lags for each
quarterly earnings announcement returns and 11 lags for the average. Superscripts a,
b, and
c
denote statistical significance at the 1%, 5%, and 10% levels, respectively.
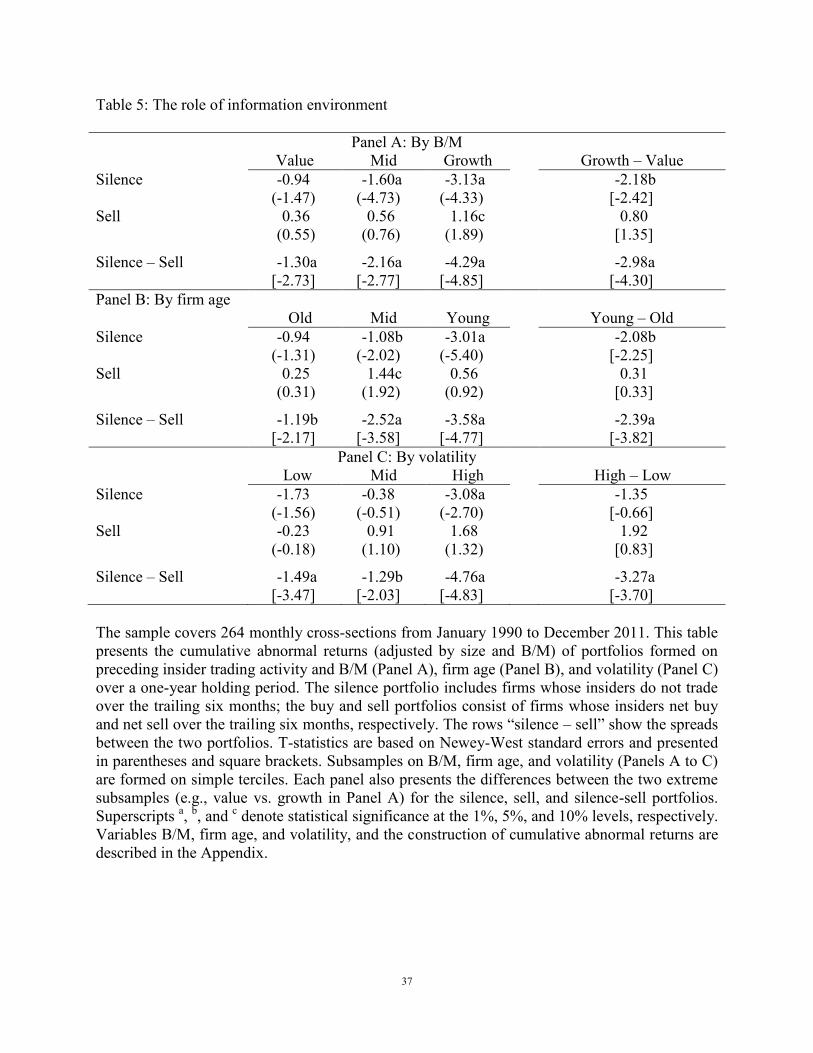
37
Table 5: The role of information environment
Panel A: By B/M
Value Mid Growth
Growth – Value
Silence -0.94 -1.60a -3.13a
-2.18b
(-1.47) (-4.73) (-4.33)
[-2.42]
Sell 0.36 0.56 1.16c
0.80
(0.55) (0.76) (1.89)
[1.35]
Silence – Sell -1.30a -2.16a -4.29a
-2.98a
[-2.73] [-2.77] [-4.85] [-4.30]
Panel B: By firm age
Old Mid Young
Young – Old
Silence -0.94 -1.08b -3.01a
-2.08b
(-1.31) (-2.02) (-5.40)
[-2.25]
Sell 0.25 1.44c 0.56
0.31
(0.31) (1.92) (0.92)
[0.33]
Silence – Sell -1.19b -2.52a -3.58a
-2.39a
[-2.17] [-3.58] [-4.77] [-3.82]
Panel C: By volatility
Low Mid High
High – Low
Silence -1.73 -0.38 -3.08a
-1.35
(-1.56) (-0.51) (-2.70)
[-0.66]
Sell -0.23 0.91 1.68
1.92
(-0.18) (1.10) (1.32)
[0.83]
Silence – Sell -1.49a -1.29b -4.76a
-3.27a
[-3.47] [-2.03] [-4.83] [-3.70]
The sample covers 264 monthly cross-sections from January 1990 to December 2011. This table
presents the cumulative abnormal returns (adjusted by size and B/M) of portfolios formed on
preceding insider trading activity and B/M (Panel A), firm age (Panel B), and volatility (Panel C)
over a one-year holding period. The silence portfolio includes firms whose insiders do not trade
over the trailing six months; the buy and sell portfolios consist of firms whose insiders net buy
and net sell over the trailing six months, respectively. The rows “silence – sell” show the spreads
between the two portfolios. T-statistics are based on Newey-West standard errors and presented
in parentheses and square brackets. Subsamples on B/M, firm age, and volatility (Panels A to C)
are formed on simple terciles. Each panel also presents the differences between the two extreme
subsamples (e.g., value vs. growth in Panel A) for the silence, sell, and silence-sell portfolios.
Superscripts a,
b, and
c denote statistical significance at the 1%, 5%, and 10% levels, respectively.
Variables B/M, firm age, and volatility, and the construction of cumulative abnormal returns are
described in the Appendix.
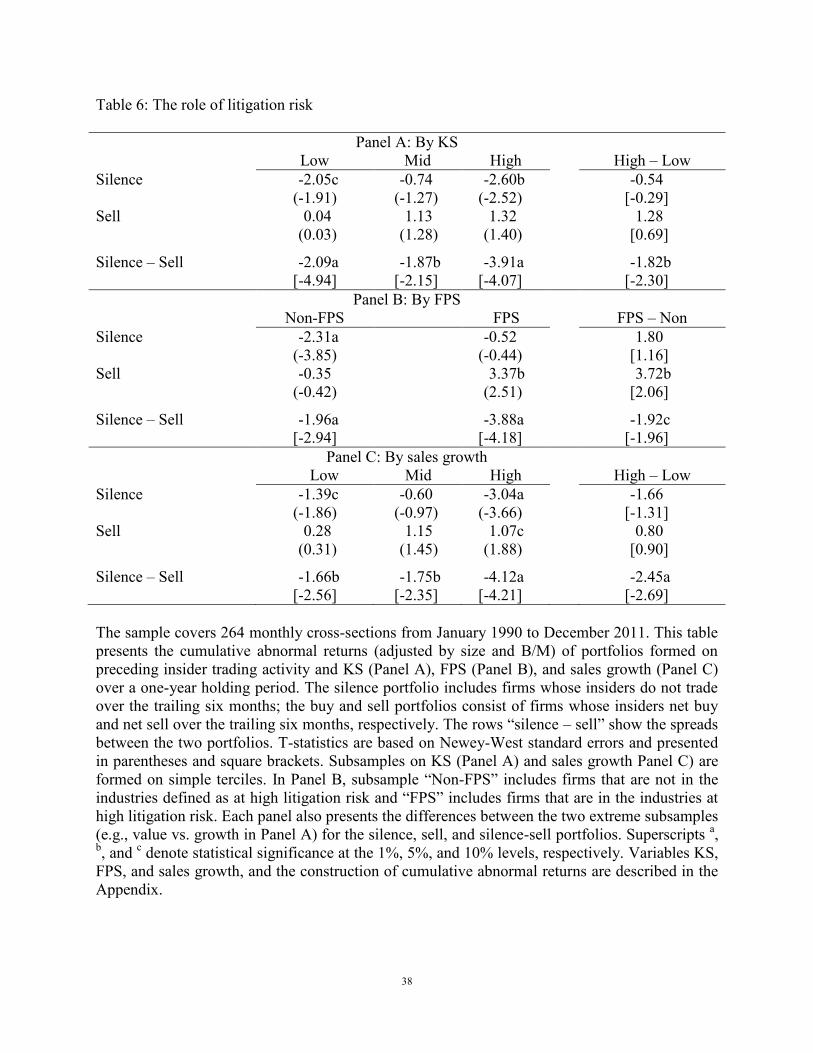
38
Table 6: The role of litigation risk
Panel A: By KS
Low Mid High
High – Low
Silence -2.05c -0.74 -2.60b
-0.54
(-1.91) (-1.27) (-2.52)
[-0.29]
Sell 0.04 1.13 1.32
1.28
(0.03) (1.28) (1.40)
[0.69]
Silence – Sell -2.09a -1.87b -3.91a
-1.82b
[-4.94] [-2.15] [-4.07] [-2.30]
Panel B: By FPS
Non-FPS
FPS
FPS – Non
Silence -2.31a
-0.52
1.80
(-3.85)
(-0.44)
[1.16]
Sell -0.35
3.37b
3.72b
(-0.42)
(2.51)
[2.06]
Silence – Sell -1.96a
-3.88a
-1.92c
[-2.94]
[-4.18] [-1.96]
Panel C: By sales growth
Low Mid High
High – Low
Silence -1.39c -0.60 -3.04a
-1.66
(-1.86) (-0.97) (-3.66)
[-1.31]
Sell 0.28 1.15 1.07c
0.80
(0.31) (1.45) (1.88)
[0.90]
Silence – Sell -1.66b -1.75b -4.12a
-2.45a
[-2.56] [-2.35] [-4.21] [-2.69]
The sample covers 264 monthly cross-sections from January 1990 to December 2011. This table
presents the cumulative abnormal returns (adjusted by size and B/M) of portfolios formed on
preceding insider trading activity and KS (Panel A), FPS (Panel B), and sales growth (Panel C)
over a one-year holding period. The silence portfolio includes firms whose insiders do not trade
over the trailing six months; the buy and sell portfolios consist of firms whose insiders net buy
and net sell over the trailing six months, respectively. The rows “silence – sell” show the spreads
between the two portfolios. T-statistics are based on Newey-West standard errors and presented
in parentheses and square brackets. Subsamples on KS (Panel A) and sales growth Panel C) are
formed on simple terciles. In Panel B, subsample “Non-FPS” includes firms that are not in the
industries defined as at high litigation risk and “FPS” includes firms that are in the industries at
high litigation risk. Each panel also presents the differences between the two extreme subsamples
(e.g., value vs. growth in Panel A) for the silence, sell, and silence-sell portfolios. Superscripts a,
b, and
c denote statistical significance at the 1%, 5%, and 10% levels, respectively. Variables KS,
FPS, and sales growth, and the construction of cumulative abnormal returns are described in the
Appendix.
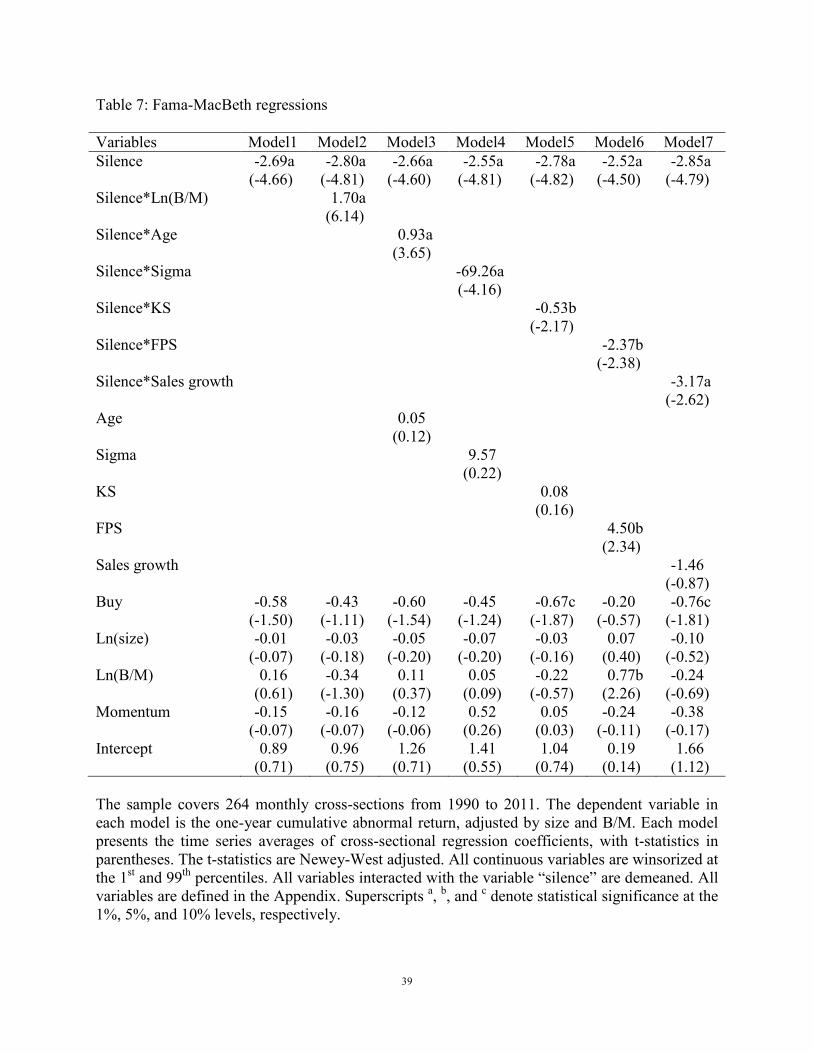
39
Table 7: Fama-MacBeth regressions
Variables Model1 Model2 Model3 Model4 Model5 Model6 Model7
Silence -2.69a -2.80a -2.66a -2.55a -2.78a -2.52a -2.85a
(-4.66) (-4.81) (-4.60) (-4.81) (-4.82) (-4.50) (-4.79)
Silence*Ln(B/M)
1.70a
(6.14)
Silence*Age
0.93a
(3.65)
Silence*Sigma
-69.26a
(-4.16)
Silence*KS
-0.53b
(-2.17)
Silence*FPS
-2.37b
(-2.38)
Silence*Sales growth
-3.17a
(-2.62)
Age
0.05
(0.12)
Sigma
9.57
(0.22)
KS
0.08
(0.16)
FPS
4.50b
(2.34)
Sales growth
-1.46
(-0.87)
Buy -0.58 -0.43 -0.60 -0.45 -0.67c -0.20 -0.76c
(-1.50) (-1.11) (-1.54) (-1.24) (-1.87) (-0.57) (-1.81)
Ln(size) -0.01 -0.03 -0.05 -0.07 -0.03 0.07 -0.10
(-0.07) (-0.18) (-0.20) (-0.20) (-0.16) (0.40) (-0.52)
Ln(B/M) 0.16 -0.34 0.11 0.05 -0.22 0.77b -0.24
(0.61) (-1.30) (0.37) (0.09) (-0.57) (2.26) (-0.69)
Momentum -0.15 -0.16 -0.12 0.52 0.05 -0.24 -0.38
(-0.07) (-0.07) (-0.06) (0.26) (0.03) (-0.11) (-0.17)
Intercept 0.89 0.96 1.26 1.41 1.04 0.19 1.66
(0.71) (0.75) (0.71) (0.55) (0.74) (0.14) (1.12)
The sample covers 264 monthly cross-sections from 1990 to 2011. The dependent variable in
each model is the one-year cumulative abnormal return, adjusted by size and B/M. Each model
presents the time series averages of cross-sectional regression coefficients, with t-statistics in
parentheses. The t-statistics are Newey-West adjusted. All continuous variables are winsorized at
the 1st and 99
th percentiles. All variables interacted with the variable “silence” are demeaned. All
variables are defined in the Appendix. Superscripts a,
b, and
c denote statistical significance at the
1%, 5%, and 10% levels, respectively.
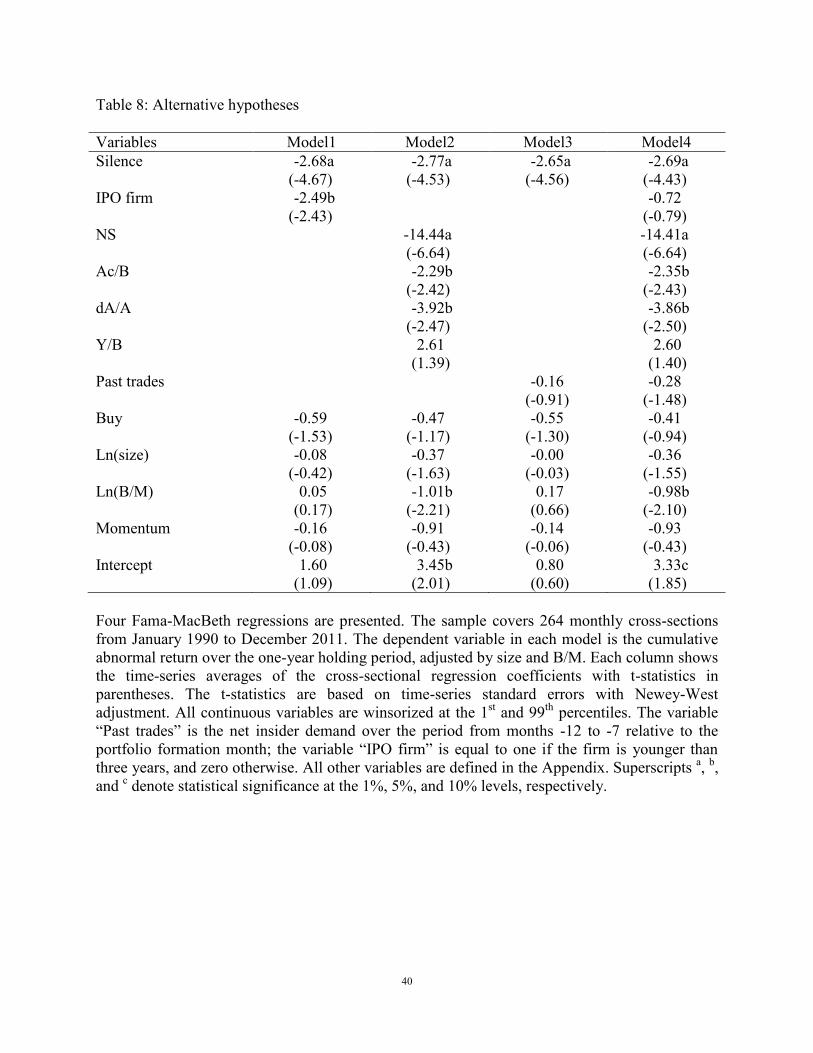
40
Table 8: Alternative hypotheses
Variables Model1 Model2 Model3 Model4
Silence -2.68a -2.77a -2.65a -2.69a
(-4.67) (-4.53) (-4.56) (-4.43)
IPO firm -2.49b
-0.72
(-2.43)
(-0.79)
NS
-14.44a
-14.41a
(-6.64)
(-6.64)
Ac/B
-2.29b
-2.35b
(-2.42)
(-2.43)
dA/A
-3.92b
-3.86b
(-2.47)
(-2.50)
Y/B
2.61
2.60
(1.39)
(1.40)
Past trades
-0.16 -0.28
(-0.91) (-1.48)
Buy -0.59 -0.47 -0.55 -0.41
(-1.53) (-1.17) (-1.30) (-0.94)
Ln(size) -0.08 -0.37 -0.00 -0.36
(-0.42) (-1.63) (-0.03) (-1.55)
Ln(B/M) 0.05 -1.01b 0.17 -0.98b
(0.17) (-2.21) (0.66) (-2.10)
Momentum -0.16 -0.91 -0.14 -0.93
(-0.08) (-0.43) (-0.06) (-0.43)
Intercept 1.60 3.45b 0.80 3.33c
(1.09) (2.01) (0.60) (1.85)
Four Fama-MacBeth regressions are presented. The sample covers 264 monthly cross-sections
from January 1990 to December 2011. The dependent variable in each model is the cumulative
abnormal return over the one-year holding period, adjusted by size and B/M. Each column shows
the time-series averages of the cross-sectional regression coefficients with t-statistics in
parentheses. The t-statistics are based on time-series standard errors with Newey-West
adjustment. All continuous variables are winsorized at the 1st and 99
th percentiles. The variable
“Past trades” is the net insider demand over the period from months -12 to -7 relative to the
portfolio formation month; the variable “IPO firm” is equal to one if the firm is younger than
three years, and zero otherwise. All other variables are defined in the Appendix. Superscripts a,
b,
and c denote statistical significance at the 1%, 5%, and 10% levels, respectively.
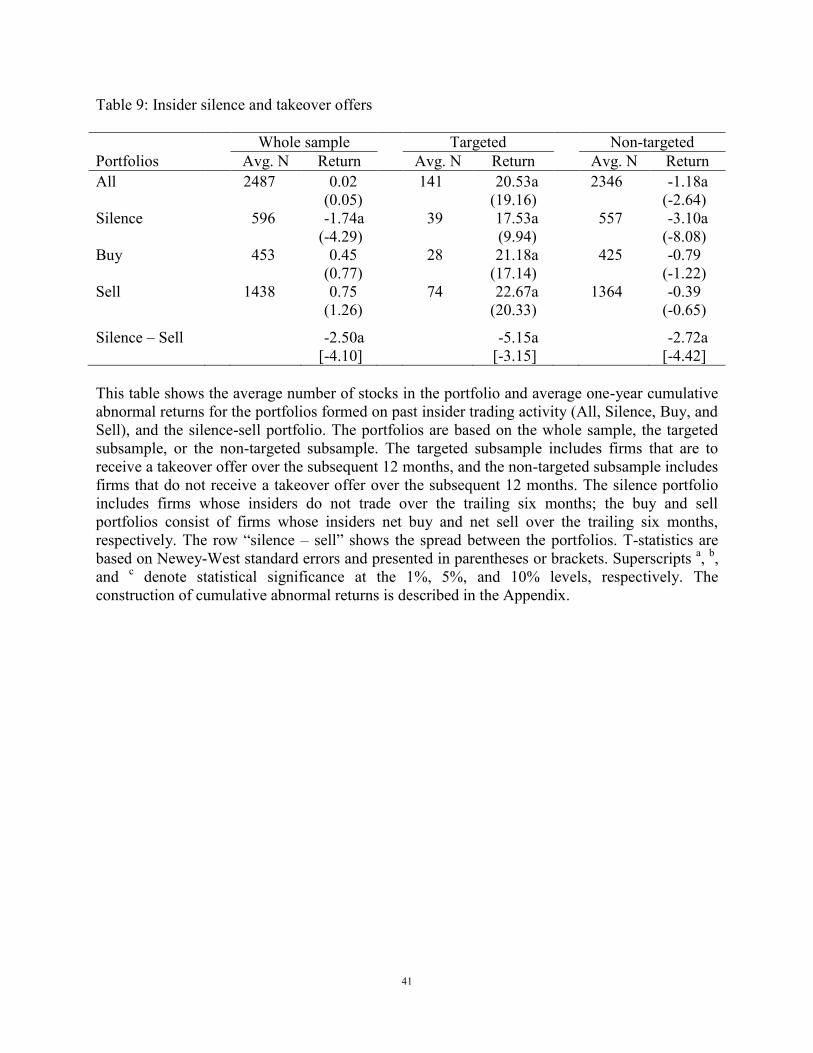
41
Table 9: Insider silence and takeover offers
Whole sample Targeted Non-targeted
Portfolios Avg. N Return
Avg. N Return
Avg. N Return
All
2487 0.02
141 20.53a
2346 -1.18a
(0.05)
(19.16)
(-2.64)
Silence
596 -1.74a
39 17.53a
557 -3.10a
(-4.29)
(9.94)
(-8.08)
Buy
453 0.45
28 21.18a
425 -0.79
(0.77)
(17.14)
(-1.22)
Sell
1438 0.75
74 22.67a
1364 -0.39
(1.26)
(20.33)
(-0.65)
Silence – Sell
-2.50a
-5.15a
-2.72a
[-4.10] [-3.15] [-4.42]
This table shows the average number of stocks in the portfolio and average one-year cumulative
abnormal returns for the portfolios formed on past insider trading activity (All, Silence, Buy, and
Sell), and the silence-sell portfolio. The portfolios are based on the whole sample, the targeted
subsample, or the non-targeted subsample. The targeted subsample includes firms that are to
receive a takeover offer over the subsequent 12 months, and the non-targeted subsample includes
firms that do not receive a takeover offer over the subsequent 12 months. The silence portfolio
includes firms whose insiders do not trade over the trailing six months; the buy and sell
portfolios consist of firms whose insiders net buy and net sell over the trailing six months,
respectively. The row “silence – sell” shows the spread between the portfolios. T-statistics are
based on Newey-West standard errors and presented in parentheses or brackets. Superscripts a,
b,
and c denote statistical significance at the 1%, 5%, and 10% levels, respectively. The
construction of cumulative abnormal returns is described in the Appendix.
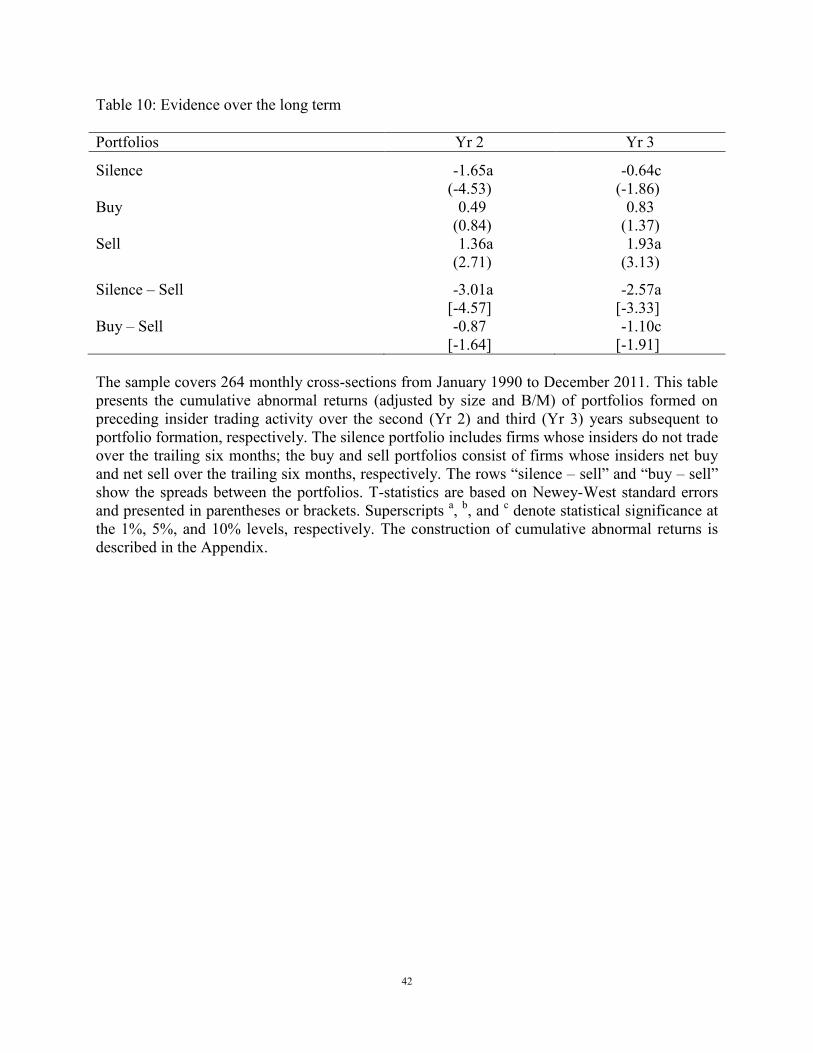
42
Table 10: Evidence over the long term
Portfolios Yr 2 Yr 3
Silence -1.65a -0.64c
(-4.53) (-1.86)
Buy 0.49 0.83
(0.84) (1.37)
Sell 1.36a 1.93a
(2.71) (3.13)
Silence – Sell -3.01a -2.57a
[-4.57] [-3.33]
Buy – Sell -0.87 -1.10c
[-1.64] [-1.91]
The sample covers 264 monthly cross-sections from January 1990 to December 2011. This table
presents the cumulative abnormal returns (adjusted by size and B/M) of portfolios formed on
preceding insider trading activity over the second (Yr 2) and third (Yr 3) years subsequent to
portfolio formation, respectively. The silence portfolio includes firms whose insiders do not trade
over the trailing six months; the buy and sell portfolios consist of firms whose insiders net buy
and net sell over the trailing six months, respectively. The rows “silence – sell” and “buy – sell”
show the spreads between the portfolios. T-statistics are based on Newey-West standard errors
and presented in parentheses or brackets. Superscripts a,
b, and
c denote statistical significance at
the 1%, 5%, and 10% levels, respectively. The construction of cumulative abnormal returns is
described in the Appendix.
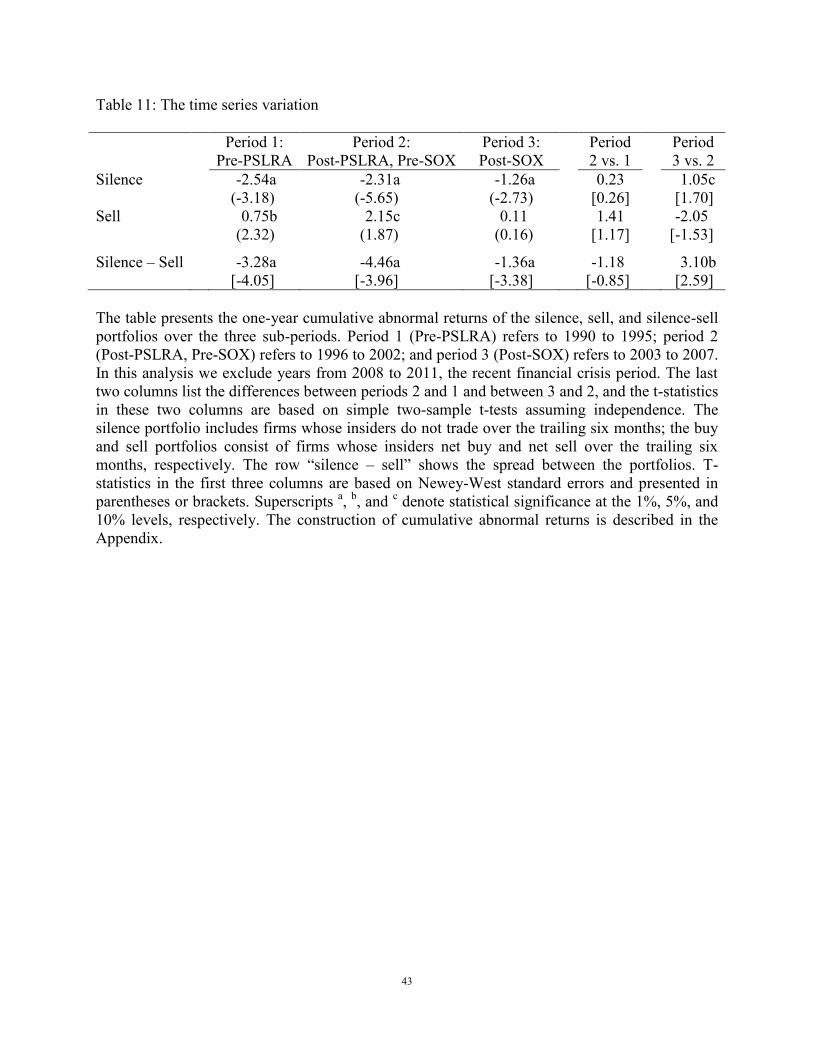
43
Table 11: The time series variation
Period 1: Period 2: Period 3:
Period
Period
Pre-PSLRA Post-PSLRA, Pre-SOX Post-SOX
2 vs. 1
3 vs. 2
Silence
-2.54a -2.31a -1.26a
0.23
1.05c
(-3.18) (-5.65) (-2.73)
[0.26]
[1.70]
Sell
0.75b 2.15c 0.11
1.41
-2.05
(2.32) (1.87) (0.16)
[1.17]
[-1.53]
Silence – Sell
-3.28a -4.46a -1.36a
-1.18
3.10b
[-4.05] [-3.96] [-3.38] [-0.85] [2.59]
The table presents the one-year cumulative abnormal returns of the silence, sell, and silence-sell
portfolios over the three sub-periods. Period 1 (Pre-PSLRA) refers to 1990 to 1995; period 2
(Post-PSLRA, Pre-SOX) refers to 1996 to 2002; and period 3 (Post-SOX) refers to 2003 to 2007.
In this analysis we exclude years from 2008 to 2011, the recent financial crisis period. The last
two columns list the differences between periods 2 and 1 and between 3 and 2, and the t-statistics
in these two columns are based on simple two-sample t-tests assuming independence. The
silence portfolio includes firms whose insiders do not trade over the trailing six months; the buy
and sell portfolios consist of firms whose insiders net buy and net sell over the trailing six
months, respectively. The row “silence – sell” shows the spread between the portfolios. T-
statistics in the first three columns are based on Newey-West standard errors and presented in
parentheses or brackets. Superscripts a,
b, and
c denote statistical significance at the 1%, 5%, and
10% levels, respectively. The construction of cumulative abnormal returns is described in the
Appendix.
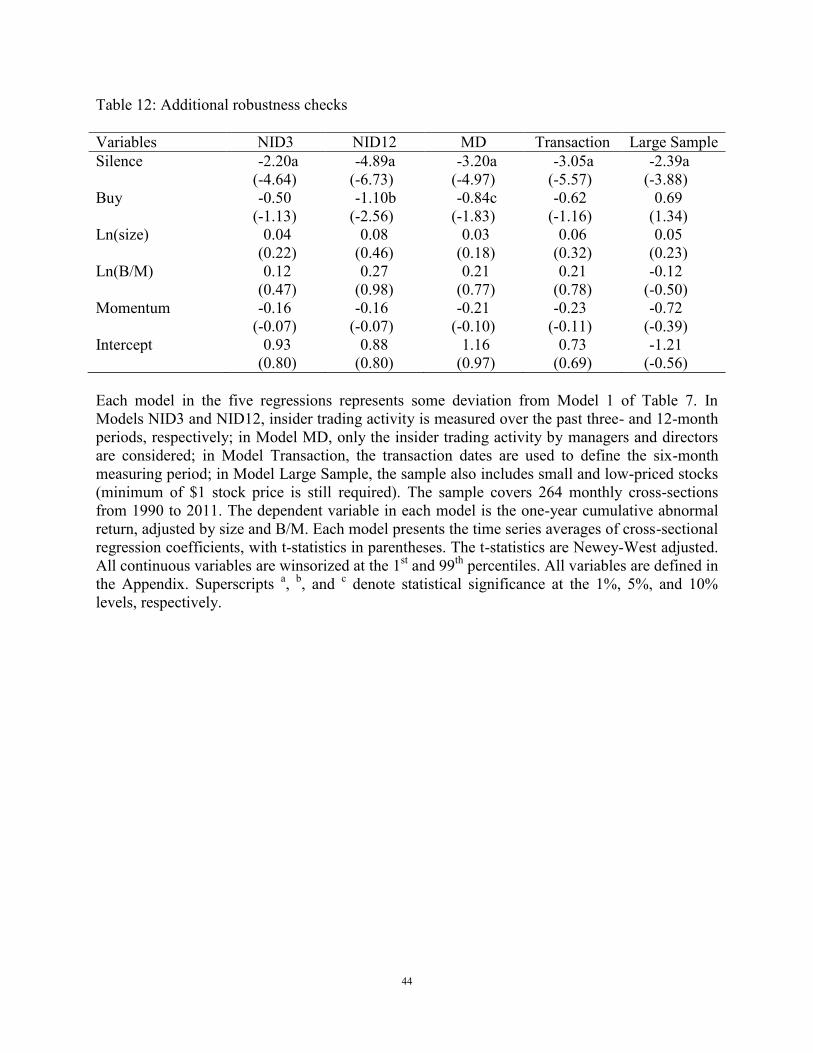
44
Table 12: Additional robustness checks
Variables NID3 NID12 MD Transaction Large Sample
Silence -2.20a -4.89a -3.20a -3.05a -2.39a
(-4.64) (-6.73) (-4.97) (-5.57) (-3.88)
Buy -0.50 -1.10b -0.84c -0.62 0.69
(-1.13) (-2.56) (-1.83) (-1.16) (1.34)
Ln(size) 0.04 0.08 0.03 0.06 0.05
(0.22) (0.46) (0.18) (0.32) (0.23)
Ln(B/M) 0.12 0.27 0.21 0.21 -0.12
(0.47) (0.98) (0.77) (0.78) (-0.50)
Momentum -0.16 -0.16 -0.21 -0.23 -0.72
(-0.07) (-0.07) (-0.10) (-0.11) (-0.39)
Intercept 0.93 0.88 1.16 0.73 -1.21
(0.80) (0.80) (0.97) (0.69) (-0.56)
Each model in the five regressions represents some deviation from Model 1 of Table 7. In
Models NID3 and NID12, insider trading activity is measured over the past three- and 12-month
periods, respectively; in Model MD, only the insider trading activity by managers and directors
are considered; in Model Transaction, the transaction dates are used to define the six-month
measuring period; in Model Large Sample, the sample also includes small and low-priced stocks
(minimum of $1 stock price is still required). The sample covers 264 monthly cross-sections
from 1990 to 2011. The dependent variable in each model is the one-year cumulative abnormal
return, adjusted by size and B/M. Each model presents the time series averages of cross-sectional
regression coefficients, with t-statistics in parentheses. The t-statistics are Newey-West adjusted.
All continuous variables are winsorized at the 1st and 99
th percentiles. All variables are defined in
the Appendix. Superscripts a,
b, and
c denote statistical significance at the 1%, 5%, and 10%
levels, respectively.
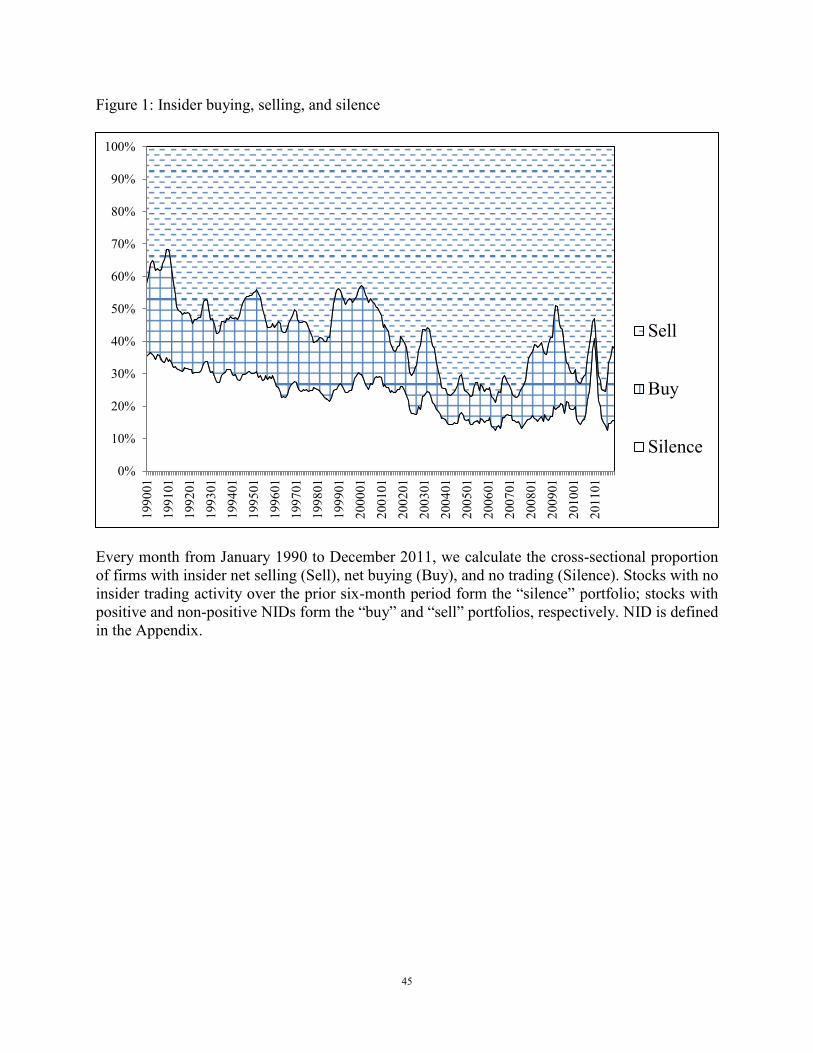
45
Figure 1: Insider buying, selling, and silence
Every month from January 1990 to December 2011, we calculate the cross-sectional proportion
of firms with insider net selling (Sell), net buying (Buy), and no trading (Silence). Stocks with no
insider trading activity over the prior six-month period form the “silence” portfolio; stocks with
positive and non-positive NIDs form the “buy” and “sell” portfolios, respectively. NID is defined
in the Appendix.
0%
10%
20%
30%
40%
50%
60%
70%
80%
90%
100%1
99
001
199
101
199
201
199
301
199
401
199
501
199
601
199
701
199
801
199
901
200
001
200
101
200
201
200
301
200
401
200
501
200
601
200
701
200
801
200
901
201
001
201
101
Sell
Buy
Silence
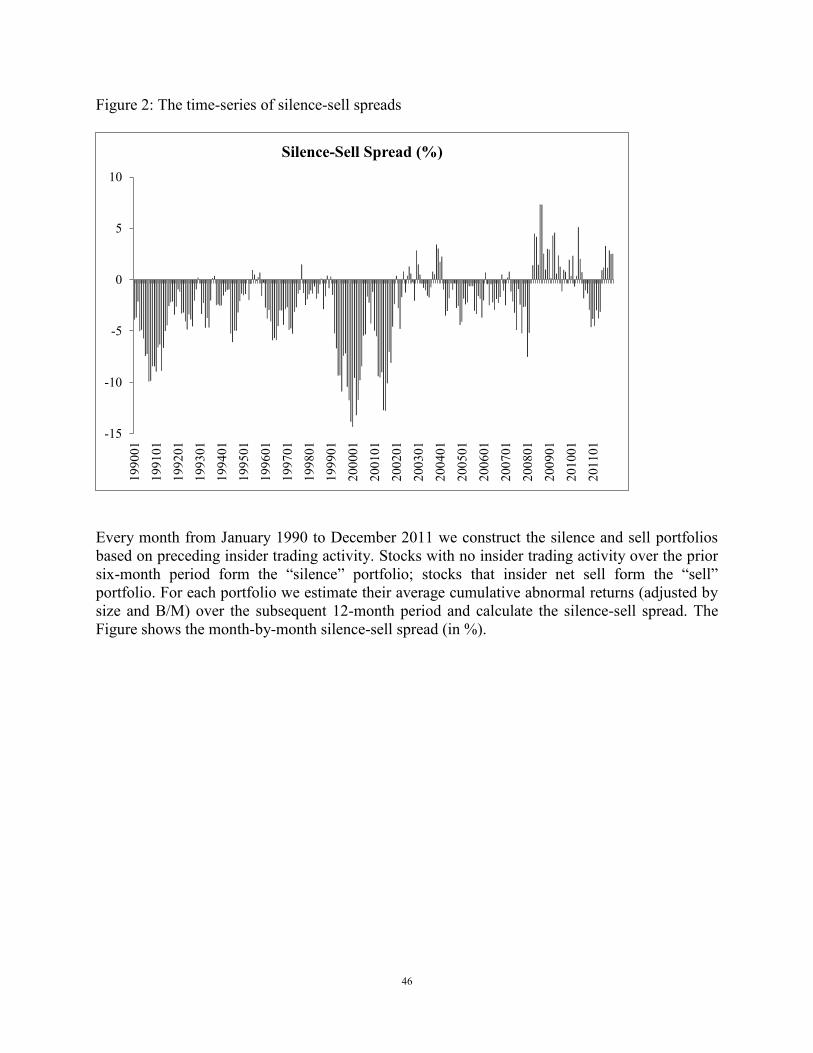
46
Figure 2: The time-series of silence-sell spreads
Every month from January 1990 to December 2011 we construct the silence and sell portfolios
based on preceding insider trading activity. Stocks with no insider trading activity over the prior
six-month period form the “silence” portfolio; stocks that insider net sell form the “sell”
portfolio. For each portfolio we estimate their average cumulative abnormal returns (adjusted by
size and B/M) over the subsequent 12-month period and calculate the silence-sell spread. The
Figure shows the month-by-month silence-sell spread (in %).
-15
-10
-5
0
5
10
199
001
199
101
199
201
199
301
199
401
199
501
199
601
199
701
199
801
199
901
200
001
200
101
200
201
200
301
200
401
200
501
200
601
200
701
200
801
200
901
201
001
201
101
Silence-Sell Spread (%)
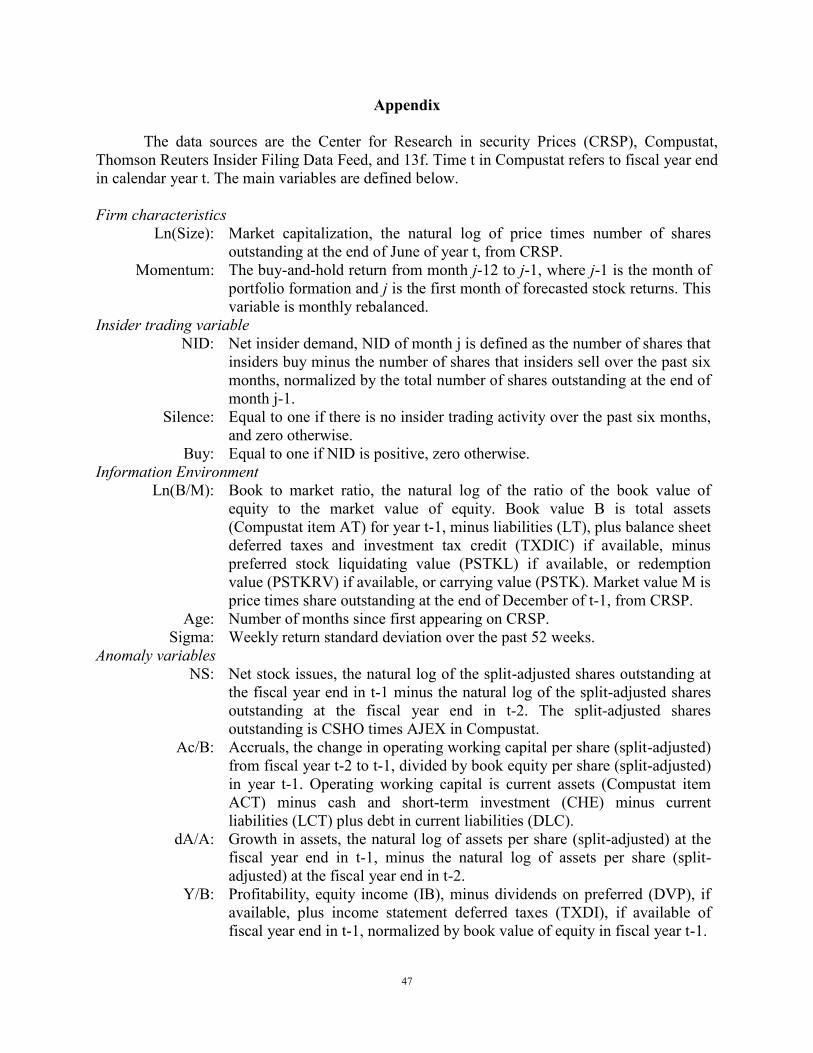
47
Appendix
The data sources are the Center for Research in security Prices (CRSP), Compustat,
Thomson Reuters Insider Filing Data Feed, and 13f. Time t in Compustat refers to fiscal year end
in calendar year t. The main variables are defined below.
Firm characteristics
Ln(Size): Market capitalization, the natural log of price times number of shares
outstanding at the end of June of year t, from CRSP.
Momentum: The buy-and-hold return from month j-12 to j-1, where j-1 is the month of
portfolio formation and j is the first month of forecasted stock returns. This
variable is monthly rebalanced.
Insider trading variable
NID: Net insider demand, NID of month j is defined as the number of shares that
insiders buy minus the number of shares that insiders sell over the past six
months, normalized by the total number of shares outstanding at the end of
month j-1.
Silence: Equal to one if there is no insider trading activity over the past six months,
and zero otherwise.
Buy: Equal to one if NID is positive, zero otherwise.
Information Environment
Ln(B/M): Book to market ratio, the natural log of the ratio of the book value of
equity to the market value of equity. Book value B is total assets
(Compustat item AT) for year t-1, minus liabilities (LT), plus balance sheet
deferred taxes and investment tax credit (TXDIC) if available, minus
preferred stock liquidating value (PSTKL) if available, or redemption
value (PSTKRV) if available, or carrying value (PSTK). Market value M is
price times share outstanding at the end of December of t-1, from CRSP.
Age: Number of months since first appearing on CRSP.
Sigma: Weekly return standard deviation over the past 52 weeks.
Anomaly variables
NS: Net stock issues, the natural log of the split-adjusted shares outstanding at
the fiscal year end in t-1 minus the natural log of the split-adjusted shares
outstanding at the fiscal year end in t-2. The split-adjusted shares
outstanding is CSHO times AJEX in Compustat.
Ac/B: Accruals, the change in operating working capital per share (split-adjusted)
from fiscal year t-2 to t-1, divided by book equity per share (split-adjusted)
in year t-1. Operating working capital is current assets (Compustat item
ACT) minus cash and short-term investment (CHE) minus current
liabilities (LCT) plus debt in current liabilities (DLC).
dA/A: Growth in assets, the natural log of assets per share (split-adjusted) at the
fiscal year end in t-1, minus the natural log of assets per share (split-
adjusted) at the fiscal year end in t-2.
Y/B: Profitability, equity income (IB), minus dividends on preferred (DVP), if
available, plus income statement deferred taxes (TXDI), if available of
fiscal year end in t-1, normalized by book value of equity in fiscal year t-1.
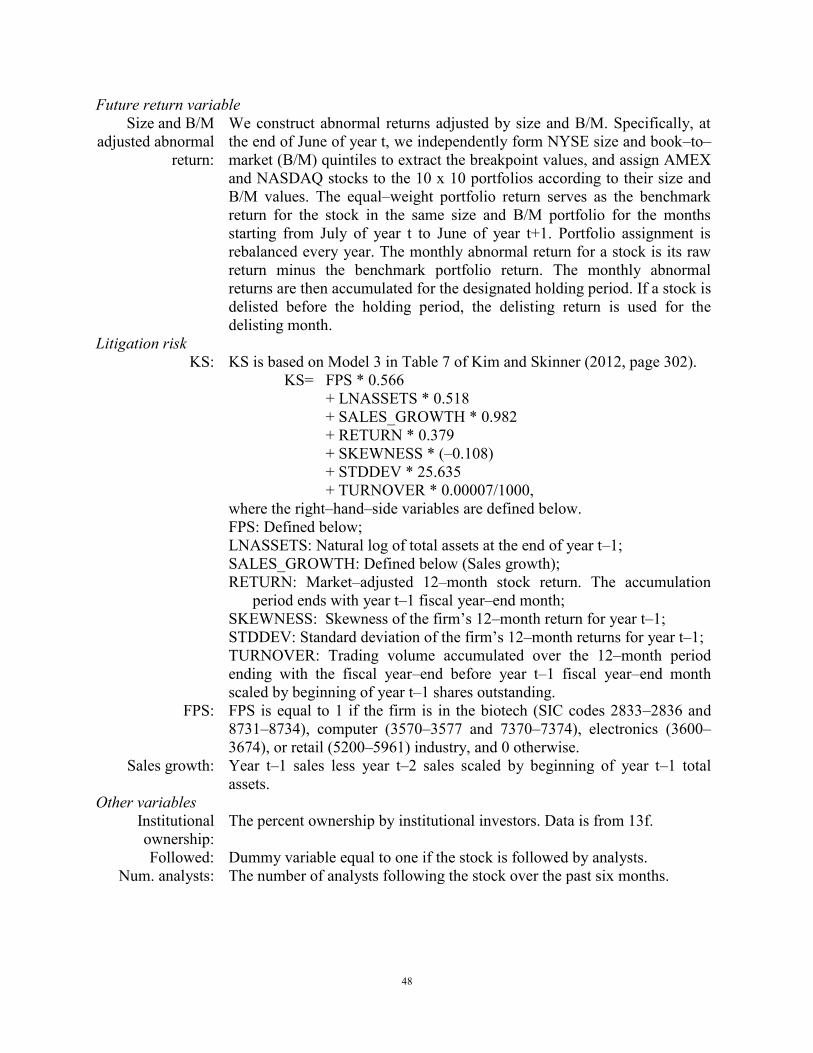
48
Future return variable
Size and B/M
adjusted abnormal
return:
We construct abnormal returns adjusted by size and B/M. Specifically, at
the end of June of year t, we independently form NYSE size and book–to–
market (B/M) quintiles to extract the breakpoint values, and assign AMEX
and NASDAQ stocks to the 10 x 10 portfolios according to their size and
B/M values. The equal–weight portfolio return serves as the benchmark
return for the stock in the same size and B/M portfolio for the months
starting from July of year t to June of year t+1. Portfolio assignment is
rebalanced every year. The monthly abnormal return for a stock is its raw
return minus the benchmark portfolio return. The monthly abnormal
returns are then accumulated for the designated holding period. If a stock is
delisted before the holding period, the delisting return is used for the
delisting month.
Litigation risk
KS: KS is based on Model 3 in Table 7 of Kim and Skinner (2012, page 302).
KS=
FPS * 0.566
+ LNASSETS * 0.518
+ SALES_GROWTH * 0.982
+ RETURN * 0.379
+ SKEWNESS * (–0.108)
+ STDDEV * 25.635
+ TURNOVER * 0.00007/1000,
where the right–hand–side variables are defined below.
FPS: Defined below;
LNASSETS: Natural log of total assets at the end of year t–1;
SALES_GROWTH: Defined below (Sales growth);
RETURN: Market–adjusted 12–month stock return. The accumulation
period ends with year t–1 fiscal year–end month;
SKEWNESS: Skewness of the firm’s 12–month return for year t–1;
STDDEV: Standard deviation of the firm’s 12–month returns for year t–1;
TURNOVER: Trading volume accumulated over the 12–month period
ending with the fiscal year–end before year t–1 fiscal year–end month
scaled by beginning of year t–1 shares outstanding.
FPS: FPS is equal to 1 if the firm is in the biotech (SIC codes 2833–2836 and
8731–8734), computer (3570–3577 and 7370–7374), electronics (3600–
3674), or retail (5200–5961) industry, and 0 otherwise.
Sales growth: Year t–1 sales less year t–2 sales scaled by beginning of year t–1 total
assets.
Other variables
Institutional
ownership:
The percent ownership by institutional investors. Data is from 13f.
Followed: Dummy variable equal to one if the stock is followed by analysts.
Num. analysts: The number of analysts following the stock over the past six months.