the southeast asian polyolefin industry - … · the polyolefin industry in malaysia is growing...
TRANSCRIPT
The Southeast Asian Polyolefin Industry Set to Emerge as a Key Market with Growing Demand and Capacity Additions GDCH009TR / Published April 2013
GDCH009TR / Published APR 2013 Page 2 The Southeast Asian Polyolefin Industry – Set to Emerge as a Key Market
with Growing Demand and Capacity Additions © GlobalData. This report is a licensed product and is not to be copied, reproduced, shared or resold in any form
Thailand is the Leading Player in the Southeast Asian Polyolefin Industry
Thailand is the regional powerhouse in the Southeast Asian polyolefin industry, with the largest consumption and production of polyethylene and polypropylene. The growth era of the Thai polyolefin industry started in the 1980s after the discovery of large natural gas reserves in the Gulf of Thailand, which provided abundant feedstock, such as ethane and propane, for olefin production.
Most of the polyolefin plants in Thailand are situated in Rayong in the eastern seaboard. The reason for the concentration of petrochemicals plants in the eastern seaboard is its proximity to sea routes, which facilitates the transportation of raw material and finished goods. The Thai polyolefin industry is in an advantageous position, not only due to the availability of abundant feedstock but also to the strong demand from the domestic and Chinese markets. With a polyolefin production capacity of approximately XX Million Metric ton per annum (MMtpa) in 2011, Thailand is poised to take advantage of the Chinese demand for polyolefins.
Insufficient Production Capacity has Made Indonesia a Polyolefin Importer
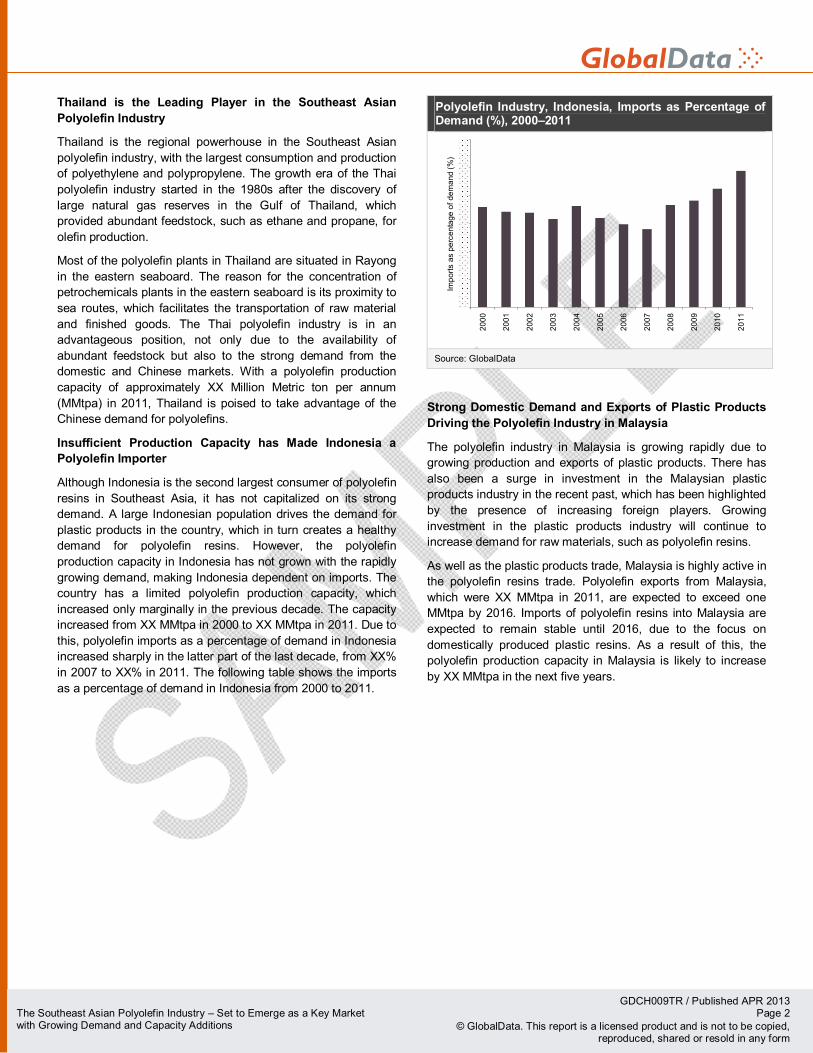
Although Indonesia is the second largest consumer of polyolefin resins in Southeast Asia, it has not capitalized on its strong demand. A large Indonesian population drives the demand for plastic products in the country, which in turn creates a healthy demand for polyolefin resins. However, the polyolefin production capacity in Indonesia has not grown with the rapidly growing demand, making Indonesia dependent on imports. The country has a limited polyolefin production capacity, which increased only marginally in the previous decade. The capacity increased from XX MMtpa in 2000 to XX MMtpa in 2011. Due to this, polyolefin imports as a percentage of demand in Indonesia increased sharply in the latter part of the last decade, from XX% in 2007 to XX% in 2011. The following table shows the imports as a percentage of demand in Indonesia from 2000 to 2011.
Polyolefin Industry, Indonesia, Imports as Percentage of Demand (%), 2000–2011
2000
2001
2002
2003
2004
2005
2006
2007
2008
2009
2010
2011
Impo
rts a
s pe
rcen
tage
of d
eman
d (%
)
Source: GlobalData
Strong Domestic Demand and Exports of Plastic Products Driving the Polyolefin Industry in Malaysia
The polyolefin industry in Malaysia is growing rapidly due to growing production and exports of plastic products. There has also been a surge in investment in the Malaysian plastic products industry in the recent past, which has been highlighted by the presence of increasing foreign players. Growing investment in the plastic products industry will continue to increase demand for raw materials, such as polyolefin resins.
As well as the plastic products trade, Malaysia is highly active in the polyolefin resins trade. Polyolefin exports from Malaysia, which were XX MMtpa in 2011, are expected to exceed one MMtpa by 2016. Imports of polyolefin resins into Malaysia are expected to remain stable until 2016, due to the focus on domestically produced plastic resins. As a result of this, the polyolefin production capacity in Malaysia is likely to increase by XX MMtpa in the next five years.
GDCH009TR / Published APR 2013 Page 4 The Southeast Asian Polyolefin Industry – Set to Emerge as a Key Market
with Growing Demand and Capacity Additions © GlobalData. This report is a licensed product and is not to be copied, reproduced, shared or resold in any form
1 Table of Contents 1 Table of Contents ............................................................................................................................ 4
1.1 List of Tables............................................................................................................................. 6 1.2 List of Figures............................................................................................................................ 7
2 Introduction ..................................................................................................................................... 8 2.1 Overview................................................................................................................................... 8 2.2 GlobalData Report Guidance ..................................................................................................... 9
3 The Southeast Asian Polyolefin Industry......................................................................................... 10 3.1 The Southeast Asian Polyolefin Industry – Overview ................................................................ 10 3.2 Polypropylene and Polyethylene are the Most Consumed Polymers in the World....................... 10
3.2.1 Polyethylene is the Most Consumed Polymer Resin in the World Due to Wide Variety of Applications.................................................................................................................... 10
3.2.2 Polypropylene is the Second Most Consumed Polymer Resin, with the Largest Demand from the Packaging Sector .............................................................................................. 11
3.3 Southeast Asian Polyolefin Industry – Market Dynamics ........................................................... 11 3.3.1 Southeast Asia Polyethylene Industry – Demand Growing at a Fast Pace ........................ 11 3.3.2 Southeast Asia Polypropylene Industry – Plant Expansions Driving Production................. 14
3.4 Strong Demand in China Presents Growth Opportunities to Major Polyolefin Producers in Southeast Asia........................................................................................................................ 16
4 Thailand Polyolefin Industry ........................................................................................................... 18 4.1 Thailand Polyethylene Industry – Market Dynamics .................................................................. 18
4.1.1 Thailand Polyethylene Industry – Installed Capacity......................................................... 18 4.1.2 Thailand Polyethylene Industry – Demand and Production Outlook .................................. 20 4.1.3 Thailand Polyethylene Industry – Trade Balance.............................................................. 22
4.2 Thailand Polypropylene Industry – Market Dynamics ................................................................ 25 4.2.1 Thailand Polypropylene Industry – Installed Capacity....................................................... 25 4.2.2 Thailand Polypropylene Industry – Demand and Production Outlook ................................ 27 4.2.3 Thailand Polypropylene Industry – Trade Balance............................................................ 29
4.3 Fast Growing Chinese and Other Southeast Asian Economies Provide Outlet for Polyolefin Exports ................................................................................................................................... 32
4.4 ASEAN Free Trade Agreement and China-ASEAN Free Trade Agreement to Increase Thailand’s Export Share........................................................................................................................... 33
4.5 Investment in Map ta Phut Industrial Estate has become Difficult Due to Recent Protests and Tougher Environmental Laws................................................................................................... 34
4.6 Political Instability Resulting in Declining Investor Sentiments ................................................... 34 5 Indonesia Polyolefin Industry.......................................................................................................... 35
5.1 Indonesia Polyethylene Industry – Market Dynamics ................................................................ 35 5.1.1 Indonesia Polyethylene Industry – Installed Capacity ....................................................... 35 5.1.2 Indonesia Polyethylene Industry – Demand and Production Outlook................................. 37 5.1.3 Indonesia Polyethylene Industry – Trade Balance............................................................ 39
5.2 Indonesia Polypropylene Industry – Market Dynamics .............................................................. 42 5.2.1 Indonesia Polypropylene Industry – Installed Capacity ..................................................... 42 5.2.2 Indonesia Polypropylene Industry – Demand and Production Outlook............................... 44 5.2.3 Indonesia Polypropylene Industry – Trade Balance.......................................................... 46
5.3 Large Population to Drive Polyolefin Demand........................................................................... 49 5.4 Insufficient Capacity Restricting the Growth of the Polyolefin Industry ....................................... 49 5.5 Underutilization of Plastic Packaging Capacity is Facilitating Imports of Finished Plastic Goods in
Indonesia ................................................................................................................................ 49 6 Malaysia Polyolefin Industry........................................................................................................... 50
6.1 Malaysia Polyethylene Industry – Market Dynamics.................................................................. 50 6.1.1 Malaysia Polyethylene Industry – Installed Capacity......................................................... 50 6.1.2 Malaysia Polyethylene Industry – Demand and Production Outlook.................................. 52 6.1.3 Malaysia Polyethylene Industry – Trade Balance ............................................................. 54
6.2 Malaysia Polypropylene Industry – Market Dynamics................................................................ 57 6.2.1 Malaysia Polypropylene Industry – Installed Capacity ...................................................... 57 6.2.2 Malaysia Polypropylene Industry – Demand and Production Outlook................................ 59 6.2.3 Malaysia Polypropylene Industry – Trade Balance ........................................................... 61
6.3 Strong Plastic Industry Led by the Packaging Sector to Drive Polyolefin Demand in Malaysia.... 64 6.4 Huge Oil and Gas Reserves Provide Abundant Feedstock for Olefin and Polyolefin Production . 64 6.5 Foreign Participation will Facilitate the Expansion of the Malaysian Petrochemicals Industry...... 65
GDCH009TR / Published APR 2013 Page 5 The Southeast Asian Polyolefin Industry – Set to Emerge as a Key Market
with Growing Demand and Capacity Additions © GlobalData. This report is a licensed product and is not to be copied, reproduced, shared or resold in any form
7 Singapore Polyolefin Industry......................................................................................................... 66 7.1 Singapore Polyethylene Industry – Market Dynamics................................................................ 66
7.1.1 Singapore Polyethylene Industry – Installed Capacity ...................................................... 66 7.1.2 Singapore Polyethylene Industry – Demand and Production Outlook................................ 68 7.1.3 Singapore Polyethylene Industry – Trade Balance ........................................................... 70
7.2 Singapore Polypropylene Industry – Market Dynamics.............................................................. 72 7.2.1 Singapore Polypropylene Industry – Installed Capacity .................................................... 72 7.2.2 Singapore Polypropylene Industry – Demand and Production Outlook.............................. 74 7.2.3 Singapore Polypropylene Industry – Trade Balance ......................................................... 76
7.3 Increasing Plastic Consumption in Asia-Pacific Resulting in Higher Polyolefin Exports from Singapore ............................................................................................................................... 78
7.4 Singapore has the Best Maritime Facilities for Exporting Polyolefin ........................................... 78 7.5 AFTA will Further Strengthen Singapore’s Position as a Gateway to Southeast Asia ................. 78
8 Vietnam Polyolefin Industry............................................................................................................ 79 8.1 Vietnam Polyethylene Industry – Market Dynamics................................................................... 79
8.1.1 Vietnam Polyethylene Industry – Installed Capacity ......................................................... 79 8.1.2 Vietnam Polyethylene Industry – Demand and Production Outlook................................... 79 8.1.3 Vietnam Polyethylene Industry – Trade Balance .............................................................. 81
8.2 Vietnam Polypropylene Industry – Market Dynamics................................................................. 84 8.2.1 Vietnam Polypropylene Industry – Installed Capacity ....................................................... 84 8.2.2 Vietnam Polypropylene Industry – Demand and Production Outlook................................. 85 8.2.3 Vietnam Polypropylene Industry – Trade Balance ............................................................ 87
8.3 Vietnam Needs to Increase Polyolefin Production to Capitalize on Growing Plastics Industry ..... 90 8.4 Duty Free Imports will Discourage Investment in the Domestic Polyolefin Industry..................... 90
9 The Philippines Polyolefin Industry ................................................................................................. 91 9.1 The Philippines Polyethylene Industry – Market Dynamics........................................................ 91
9.1.1 The Philippines Polyethylene Industry – Installed Capacity............................................... 91 9.1.2 The Philippines Polyethylene Industry – Demand and Production Outlook ........................ 93 9.1.3 The Philippines Polyethylene Industry – Trade Balance ................................................... 95
9.2 The Philippines Polypropylene Industry – Market Dynamics...................................................... 98 9.2.1 The Philippines Polypropylene Industry – Installed Capacity............................................. 98 9.2.2 The Philippines Polypropylene Industry – Demand and Production Outlook.................... 100 9.2.3 The Philippines Polypropylene Industry – Trade Balance ............................................... 102
9.3 Ban on Plastic Bags in the Philippines Can Severely Hurt the Polyolefin Industry .................... 105 9.4 Planned Olefin Complex will Address Ethylene and Propylene Supply Shortage...................... 105
10 Major Companies Active in the Southeast Asian Polyolefin Industry .............................................. 106 10.1 The Siam Cement Group....................................................................................................... 106
10.1.1 Business Overview ....................................................................................................... 106 10.1.2 Siam Cement Group – Polyolefin Capacity by Commodity.............................................. 107 10.1.3 Siam Cement Group – Polyolefin Plant Details .............................................................. 109 10.1.4 Siam Cement Group – Polyolefin Capacity by Country................................................... 110
10.2 PTT Global Chemical Public Company Limited....................................................................... 111 10.2.1 Business Overview ....................................................................................................... 111 10.2.2 PTT Global Chemical – Polyolefin Capacity by Country.................................................. 112 10.2.3 PTT Global Chemical Global – Chemical Polyolefin Capacity ......................................... 114 10.2.4 PTT Global Chemical – Polyolefin Capacity by Country.................................................. 114
10.3 Honam Petrochemicals Corporation....................................................................................... 115 10.3.1 Business Overview ....................................................................................................... 115 10.3.2 Honam Petrochemical Corporation – Polyolefin Capacity by Commodity ........................ 116 10.3.3 Honam Petrochemical Corporation – Polyolefin Plants Details........................................ 118 10.3.4 Honam Petrochemical Corporation – Polyolefin Capacity by Country.............................. 119
11 Appendix..................................................................................................................................... 120 11.1 Abbreviations ........................................................................................................................ 120 11.2 Bibliography .......................................................................................................................... 120 11.3 Definitions............................................................................................................................. 121
11.3.1 Installed Capacity ......................................................................................................... 121 11.3.2 Process........................................................................................................................ 121 11.3.3 Technology................................................................................................................... 121
11.4 GlobalData’s Research Methodology ..................................................................................... 121 11.4.1 Coverage ..................................................................................................................... 121 11.4.2 Secondary Research .................................................................................................... 122 11.4.3 Primary Research......................................................................................................... 122 11.4.4 Expert Panel Validation................................................................................................. 122
11.5 Contact Us ............................................................................................................................ 122
GDCH009TR / Published APR 2013 Page 6 The Southeast Asian Polyolefin Industry – Set to Emerge as a Key Market
with Growing Demand and Capacity Additions © GlobalData. This report is a licensed product and is not to be copied, reproduced, shared or resold in any form
11.6 Disclaimer ............................................................................................................................. 123
1.1 List of Tables Table 1: Southeast Asia Polyethylene Industry, Demand and Production (MMtpa), 2000–2016........... 13 Table 2: Southeast Asia Polypropylene Industry, Demand and Production (MMtpa), 2000–2016 ........ 15 Table 3: Southeast Asia Polyolefin Industry, Exports to China (MMtpa), 2000–2011........................... 17 Table 4: Polyethylene Industry, Thailand, Capacity (MMtpa), 2000–2016........................................... 19 Table 5: Polyethylene Industry, Thailand, Demand and Production (MMtpa), 2000–2016.................... 21 Table 6: Polyethylene Industry, Thailand, Imports and Exports (MMtpa), 2000–2016.......................... 23 Table 7: Polyethylene Industry, Thailand, Exports by Region (%), 2011 ............................................. 24 Table 8: Polypropylene Industry, Thailand, Capacity (MMtpa), 2000–2016......................................... 26 Table 9: Polypropylene Industry, Thailand, Demand and Production (MMtpa), 2000–2016 ................. 28 Table 10: Polypropylene Industry, Thailand, Imports and Exports (MMtpa), 2000–2016........................ 30 Table 11: Polypropylene Industry, Thailand, Exports by Region (%), 2011 ........................................... 31 Table 12: Polyolefin Industry, China, Demand (MMtpa), 2000–2016 .................................................... 33 Table 13: Polyethylene Industry, Indonesia, Capacity (MMtpa), 2000–2016 ......................................... 36 Table 14: Polyethylene Industry, Indonesia, Demand and Production (MMtpa), 2000–2016.................. 38 Table 15: Polyethylene Industry, Indonesia, Imports and Exports (MMtpa), 2000–2016........................ 40 Table 16: Polyethylene Industry, Indonesia, Imports Share by Region (%), 2011.................................. 41 Table 17: Polypropylene Industry, Indonesia, Capacity (MMtpa), 2000–2016 ....................................... 43 Table 18: Polypropylene Industry, Indonesia, Demand and Production (MMtpa), 2000–2016................ 45 Table 19: Polypropylene Industry, Indonesia, Imports and Exports (MMtpa), 2000–2016...................... 47 Table 20: Polypropylene Industry, Indonesia, Imports Share by Region (%), 2011................................ 48 Table 21: Polyethylene Industry, Malaysia, Capacity (MMtpa), 2000–2016........................................... 51 Table 22: Polyethylene Industry, Malaysia, Demand and Production (MMtpa), 2000–2016 ................... 53 Table 23: Polyethylene Industry, Malaysia, Imports and Exports (MMtpa), 2000–2016 ......................... 55 Table 24: Polyethylene Industry, Malaysia, Imports Share by Region (%), 2011................................... 56 Table 25: Polypropylene Industry, Malaysia, Capacity (MMtpa), 2000–2016 ........................................ 58 Table 26: Polypropylene Industry, Malaysia, Demand and Production (MMtpa), 2000–2016................. 60 Table 27: Polypropylene Industry, Malaysia, Imports and Exports (MMtpa), 2000–2016 ....................... 62 Table 28: Polypropylene Industry, Malaysia, Imports Share by Region (%), 2011................................. 63 Table 29: Plastic Product Industry, Malaysia, Number of Projects and Investment ($m), 2008–2012..... 65 Table 30: Polyethylene Industry, Singapore, Capacity (MMtpa), 2000–2016 ........................................ 67 Table 31: Polyethylene Industry, Singapore, Demand and Production (MMtpa), 2000–2016................. 69 Table 32: Polyethylene Industry, Singapore, Imports and Exports (MMtpa), 2000–2016 ....................... 71 Table 33: Polypropylene Industry, Singapore, Capacity (MMtpa), 2000–2016 ...................................... 73 Table 34: Polypropylene Industry, Singapore, Demand and Production (MMtpa), 2000–2016............... 75 Table 35: Polypropylene Industry, Singapore, Imports and Exports (MMtpa), 2000–2016 ..................... 77 Table 36: Polyethylene Industry, Vietnam, Demand (MMtpa), 2000–2016............................................ 80 Table 37: Polyethylene Industry, Vietnam, Imports and Exports (MMtpa), 2000–2016 .......................... 82 Table 38: Polyethylene Industry, Vietnam, Imports by Region (%), 2010.............................................. 83 Table 39: Polypropylene Industry, Vietnam, Capacity (MMtpa), 2010–2016 ......................................... 84 Table 40: Polypropylene Industry, Vietnam, Demand and Production (MMtpa), 2000–2016.................. 86 Table 41: Polypropylene Industry, Vietnam, Imports and Exports (MMtpa), 2000–2016 ........................ 88 Table 42: Polyethylene Industry, Vietnam, Imports by Region (%), 2010.............................................. 89 Table 43: Polyethylene Industry, Philippines, Capacity (MMtpa), 2000–2016........................................ 92 Table 44: Polyethylene Industry, Philippines, Demand and Production (MMtpa), 2000–2016................ 94 Table 45: Polyethylene Industry, Philippines, Imports and Exports (ktpa), 2000–2016 .......................... 96 Table 46: Polyethylene Industry, Philippines, Imports by Region (%), 2011 .......................................... 97 Table 47: Polypropylene Industry, Philippines, Capacity (MMtpa), 2000–2016 ..................................... 99 Table 48: Polypropylene Industry, Philippines, Demand and Production (MMtpa), 2000–2016............ 101 Table 49: Polypropylene Industry, Philippines, Imports and Exports (MMtpa), 2000–2016 .................. 103 Table 50: Polypropylene Industry, Philippines, Imports by Region (%), 2011...................................... 104 Table 51: The Siam Cement Group, Key Facts ................................................................................. 106 Table 52: Siam Cement Group, Southeast Asia, Polyolefin Capacity by Commodity, 2000–2016........ 108 Table 53: Siam Cement Group, Southeast Asia, Active Polyolefin Plants Details, 2011 ...................... 109 Table 54: Siam Cement Group, Southeast Asia, Polyolefin Capacity by Country, 2011....................... 110 Table 55: PTT Global Chemical Public Company Limited, Key Facts ................................................. 111 Table 56: PTT Global Chemical, Southeast Asia, Polyolefin Capacity by Commodity, 2000–2016 ...... 113 Table 57: PTT Global Chemical, Southeast Asia, Active Polyolefin Plants Details, 2011..................... 114 Table 58: Honam Petrochemical Corporation, Key Facts................................................................... 115
GDCH009TR / Published APR 2013 Page 7 The Southeast Asian Polyolefin Industry – Set to Emerge as a Key Market
with Growing Demand and Capacity Additions © GlobalData. This report is a licensed product and is not to be copied, reproduced, shared or resold in any form
Table 59: Honam Petrochemical Corporation, Southeast Asia, Polyolefin Capacity by Commodity, 2000–2016................................................................................................................................. 117
Table 60: Honam Petrochemical Corporation, Southeast Asia, Active Polyolefin Plants Details, 2011. 118 Table 61: Honam Petrochemical Corporation, Southeast Asia, Polyolefin Capacity by Country, 2011 . 119
1.2 List of Figures Figure 1: Southeast Asia Polyethylene Industry, Demand and Production (MMtpa), 2000–2016........... 12 Figure 2: Southeast Asia Polypropylene Industry, Demand and Production (MMtpa), 2000–2016 ........ 14 Figure 3: Southeast Asia Polyolefin Industry, Exports to China (MMtpa), 2000–2011........................... 16 Figure 4: Polyethylene Industry, Thailand, Capacity (MMtpa), 2000–2016........................................... 18 Figure 5: Polyethylene Industry, Thailand, Demand and Production (MMtpa), 2000–2016.................... 20 Figure 6: Polyethylene Industry, Thailand, Imports and Exports (MMtpa), 2000–2016.......................... 22 Figure 7: Polyethylene Industry, Thailand, Exports by Region (%), 2011 ............................................. 24 Figure 8: Polypropylene Industry, Thailand, Capacity (MMtpa), 2000–2016......................................... 25 Figure 9: Polypropylene Industry, Thailand, Demand and Production (MMtpa), 2000–2016 ................. 27 Figure 10: Polypropylene Industry, Thailand, Imports and Exports (MMtpa), 2000–2016........................ 29 Figure 11: Polypropylene Industry, Thailand, Exports by Region (%), 2011 ........................................... 31 Figure 12: Polyolefin Industry, China, Demand (MMtpa), 2000–2016 .................................................... 32 Figure 13: Polyethylene Industry, Indonesia, Capacity (MMtpa), 2000–2016 ......................................... 35 Figure 14: Polyethylene Industry, Indonesia, Demand and Production (MMtpa), 2000–2016.................. 37 Figure 15: Polyethylene Industry, Indonesia, Imports and Exports (MMtpa), 2000–2016........................ 39 Figure 16: Polyethylene Industry, Indonesia, Imports Share by Region (%), 2011.................................. 41 Figure 17: Polypropylene Industry, Indonesia, Capacity (MMtpa), 2000–2016 ....................................... 42 Figure 18: Polypropylene Industry, Indonesia, Demand and Production (MMtpa), 2000–2016................ 44 Figure 19: Polypropylene Industry, Indonesia, Imports and Exports (MMtpa), 2000–2016...................... 46 Figure 20: Polypropylene Industry, Indonesia, Imports Share by Region (%), 2011................................ 48 Figure 21: Polyethylene Industry, Malaysia, Capacity (MMtpa), 2000–2016........................................... 50 Figure 22: Polyethylene Industry, Malaysia, Demand and Production (MMtpa), 2000–2016 ................... 52 Figure 23: Polyethylene Industry, Malaysia, Imports and Exports (MMtpa), 2000–2016 ......................... 54 Figure 24: Polyethylene Industry, Malaysia, Imports Share by Region (%), 2011................................... 56 Figure 25: Polypropylene Industry, Malaysia, Capacity (MMtpa), 2000–2016 ........................................ 57 Figure 26: Polypropylene Industry, Malaysia, Demand and Production (MMtpa), 2000–2016................. 59 Figure 27: Polypropylene Industry, Malaysia, Imports and Exports (MMtpa), 2000–2016 ....................... 61 Figure 28: Polypropylene Industry, Malaysia, Imports Share by Region (%), 2011................................. 63 Figure 29: Plastic Product Industry, Malaysia, Domestic and Foreign Investment ($m), 2008–2012 ....... 65 Figure 30: Polyethylene Industry, Singapore, Capacity (MMtpa), 2000–2016 ........................................ 66 Figure 31: Polyethylene Industry, Singapore, Demand and Production (MMtpa), 2000–2016................. 68 Figure 32: Polyethylene Industry, Singapore, Imports and Exports (MMtpa), 2000–2016 ....................... 70 Figure 33: Polypropylene Industry, Singapore, Capacity (MMtpa), 2000–2016 ...................................... 72 Figure 34: Polypropylene Industry, Singapore, Demand and Production (MMtpa), 2000–2016............... 74 Figure 35: Polypropylene Industry, Singapore, Imports and Exports (MMtpa), 2000–2016 ..................... 76 Figure 36: Polyethylene Industry, Vietnam, Demand (MMtpa), 2000–2016............................................ 79 Figure 37: Polyethylene Industry, Vietnam, Imports and Exports (MMtpa), 2000–2016 .......................... 81 Figure 38: Polyethylene Industry, Vietnam, Imports by Region (%), 2010.............................................. 83 Figure 39: Polypropylene Industry, Vietnam, Capacity (MMtpa), 2010–2016 ......................................... 84 Figure 40: Polypropylene Industry, Vietnam, Demand and Production (MMtpa), 2000–2016.................. 85 Figure 41: Polypropylene Industry, Vietnam, Imports and Exports (MMtpa), 2000–2016 ........................ 87 Figure 42: Polypropylene Industry, Vietnam, Imports by Region (%), 2010............................................ 89 Figure 43: Polyethylene Industry, Philippines, Capacity (MMtpa), 2000–2016........................................ 91 Figure 44: Polyethylene Industry, Philippines, Demand and Production (MMtpa), 2000–2016................ 93 Figure 45: Polyethylene Industry, Philippines, Imports and Exports (ktpa), 2000–2016 .......................... 95 Figure 46: Polyethylene Industry, Philippines, Imports by Region (%), 2011 .......................................... 97 Figure 47: Polypropylene Industry, Philippines, Capacity (MMtpa), 2000–2016 ..................................... 98 Figure 48: Polypropylene Industry, Philippines, Demand and Production (MMtpa), 2000–2016............ 100 Figure 49: Polypropylene Industry, Philippines, Imports and Exports (MMtpa), 2000–2016 .................. 102 Figure 50: Polypropylene Industry, Philippines, Imports by Region (%), 2011...................................... 104 Figure 51: Siam Cement Group, Southeast Asia, Polyolefin Capacity by Commodity, 2000–2016........ 107 Figure 52: Siam Cement Group, Southeast Asia, Polyolefin Capacity by Country, 2011....................... 110 Figure 53: PTT Global Chemical, Southeast Asia, Polyolefin Capacity by Commodity, 2000–2016 ...... 112 Figure 54: Honam Petrochemical Corporation, Southeast Asia, Polyolefin Capacity by Commodity, 2000–
2016................................................................................................................................. 116 Figure 55: Honam Petrochemical Corporation, Southeast Asia, Polyolefin Capacity by Country, 2011 . 119
GDCH009TR / Published APR 2013 Page 8 The Southeast Asian Polyolefin Industry – Set to Emerge as a Key Market
with Growing Demand and Capacity Additions © GlobalData. This report is a licensed product and is not to be copied, reproduced, shared or resold in any form
2 Introduction
2.1 Overview Southeast Asia has emerged as a major region for the polyolefin industry due to strong demand growth. The demand for polyolefin in the region has grown at a Compound Annual Growth Rate (CAGR) of more than XX% in the last decade. The major countries in the region which are driving the growth of the polyolefin industry are Thailand, Malaysia and Indonesia. These countries are the largest contributors to polyolefin demand in the region. Singapore, on the contrary, does not have a high consumption but produces and exports huge quantities. It has now emerged as the major supplier of polyolefins in Southeast Asia, with a total export of XX Million Metric ton per annum (MMtpa) in 2011.
Countries such as Vietnam and the Philippines are relatively small markets for polyolefins. Vietnam has witnessed an impressive growth in polyolefin demand, however, the Philippines has witnessed a decline in demand. The Philippines’ polyethylene demand grew marginally in the previous decade, while polypropylene demand declined. From a supply perspective, the Philippines is better placed than Vietnam. The Philippines has polyolefin plants that satisfy its domestic demand for polyolefins easily, while Vietnam is highly dependent on imports, as it does not have any polyethylene plants, nor are any expected to come on-stream there in the next five years.
China is a lucrative market for polyolefin exporters in Thailand, Singapore and Malaysia. As China is expected to remain a net importer for the next five years, Thailand and Singapore can export significant additional quantities to China. Thailand has already ramped up its production capacity in the last three years, while Singapore will increase its capacity in the next five years. Malaysia can also take advantage of growing Chinese imports by increasing its production capability. Indonesia, on the other hand, needs to become self-sufficient in meeting its domestic polyolefin demand.
GDCH009TR / Published APR 2013 Page 9 The Southeast Asian Polyolefin Industry – Set to Emerge as a Key Market
with Growing Demand and Capacity Additions © GlobalData. This report is a licensed product and is not to be copied, reproduced, shared or resold in any form
2.2 GlobalData Report Guidance The report starts with an executive summary capturing the key points of the Southeast Asian polymer
industry. Products covered under polyolefins are polyethylene and polypropylene and the countries covered are Thailand, Indonesia, Malaysia, Singapore, Vietnam and the Philippines.
Chapter three highlights the main features of the Southeast Asian polymer industry and provides polyolefin demand and production figures from 2000 to 2016. It also discusses how the region can gain from the growing Chinese polyolefin market.
Chapter four provides the demand and supply scenario of the polyethylene and polypropylene industry in Thailand from 2000 to 2016. It also provides the installed polyolefin capacity and trade balance of the country from 2000 to 2016.
Chapter five provides the demand and supply scenario of the polyethylene and polypropylene industry in Indonesia from 2000 to 2016. It also provides the installed polyolefin capacity and trade balance of the country from 2000 to 2016.
Chapter six provides the demand and supply scenario of the polyethylene and polypropylene industry in Malaysia from 2000 to 2016. It also provides the installed polyolefin capacity and trade balance of the country from 2000 to 2016.
Chapter seven provides the demand and supply scenario of the polyethylene and polypropylene industry in Singapore from 2000 to 2016. It also provides the installed polyolefin capacity and trade balance of the country from 2000 to 2016.
Chapter eight provides the demand and supply scenario of the polyethylene and polypropylene industry in Vietnam from 2000 to 2016. It also provides the installed polyolefin capacity and trade balance of the country from 2000 to 2016.
Chapter nine provides the demand and supply scenario of the polyethylene and polypropylene industry in the Philippines from 2000 to 2016. It also provides the installed polyolefin capacity and trade balance of the country from 2000 to 2016.
Chapter ten provides profiles of the major companies active in the polyolefin sector in Southeast Asia. It provides the installed polyolefin capacity of the Siam Cement Group (SCG), PTT Global Chemical Public Company Limited (PTTGC) and the Honam Petrochemical Corporation (HPC). The chapter also provides details on these companies’ Southeast Asian polyolefin plants and classifies their polyolefin capacity by country.
GDCH009TR / Published APR 2013 Page 14 The Southeast Asian Polyolefin Industry – Set to Emerge as a Key Market
with Growing Demand and Capacity Additions © GlobalData. This report is a licensed product and is not to be copied, reproduced, shared or resold in any form
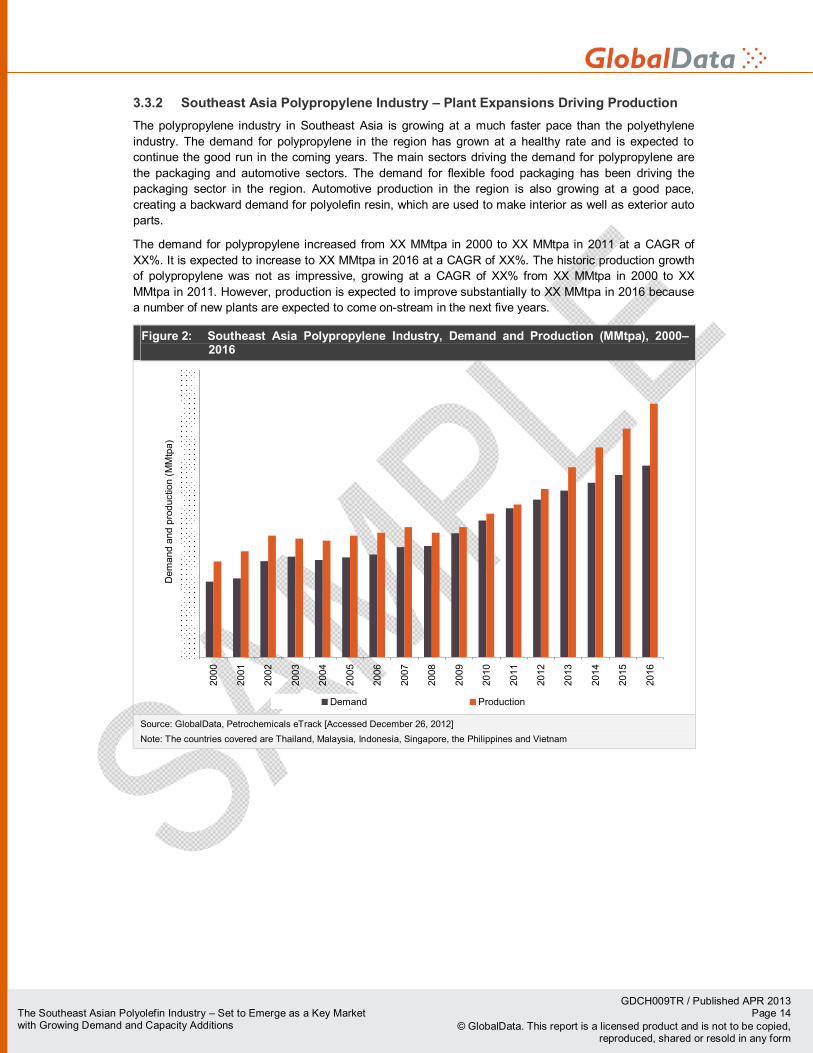
3.3.2 Southeast Asia Polypropylene Industry – Plant Expansions Driving Production The polypropylene industry in Southeast Asia is growing at a much faster pace than the polyethylene industry. The demand for polypropylene in the region has grown at a healthy rate and is expected to continue the good run in the coming years. The main sectors driving the demand for polypropylene are the packaging and automotive sectors. The demand for flexible food packaging has been driving the packaging sector in the region. Automotive production in the region is also growing at a good pace, creating a backward demand for polyolefin resin, which are used to make interior as well as exterior auto parts.
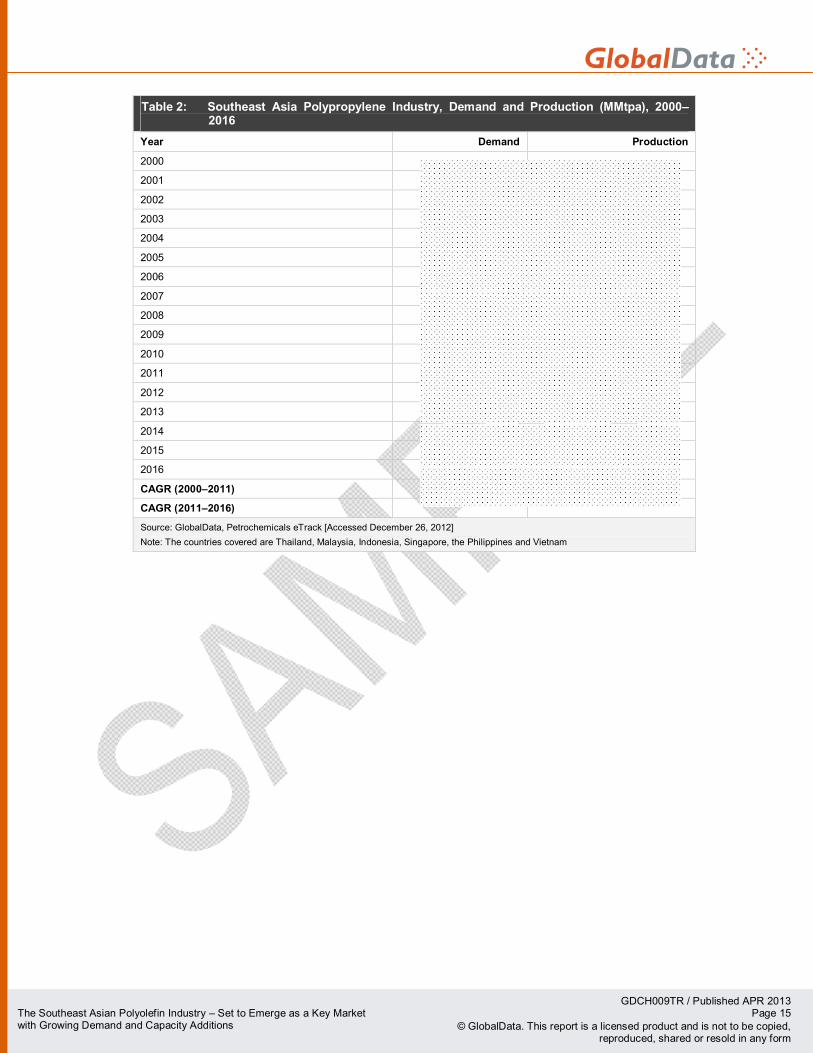
The demand for polypropylene increased from XX MMtpa in 2000 to XX MMtpa in 2011 at a CAGR of XX%. It is expected to increase to XX MMtpa in 2016 at a CAGR of XX%. The historic production growth of polypropylene was not as impressive, growing at a CAGR of XX% from XX MMtpa in 2000 to XX MMtpa in 2011. However, production is expected to improve substantially to XX MMtpa in 2016 because a number of new plants are expected to come on-stream in the next five years.
Figure 2: Southeast Asia Polypropylene Industry, Demand and Production (MMtpa), 2000–2016
2000
2001
2002
2003
2004
2005
2006
2007
2008
2009
2010
2011
2012
2013
2014
2015
2016
Dem
and
and
prod
uctio
n (M
Mtp
a)
Demand Production
Source: GlobalData, Petrochemicals eTrack [Accessed December 26, 2012] Note: The countries covered are Thailand, Malaysia, Indonesia, Singapore, the Philippines and Vietnam
GDCH009TR / Published APR 2013 Page 15 The Southeast Asian Polyolefin Industry – Set to Emerge as a Key Market
with Growing Demand and Capacity Additions © GlobalData. This report is a licensed product and is not to be copied, reproduced, shared or resold in any form
Table 2: Southeast Asia Polypropylene Industry, Demand and Production (MMtpa), 2000–2016
Year Demand Production
2000
2001
2002
2003
2004
2005
2006
2007
2008
2009
2010
2011
2012
2013
2014
2015
2016
CAGR (2000–2011)
CAGR (2011–2016)
Source: GlobalData, Petrochemicals eTrack [Accessed December 26, 2012] Note: The countries covered are Thailand, Malaysia, Indonesia, Singapore, the Philippines and Vietnam
GDCH009TR / Published APR 2013 Page 110 The Southeast Asian Polyolefin Industry – Set to Emerge as a Key Market
with Growing Demand and Capacity Additions © GlobalData. This report is a licensed product and is not to be copied, reproduced, shared or resold in any form
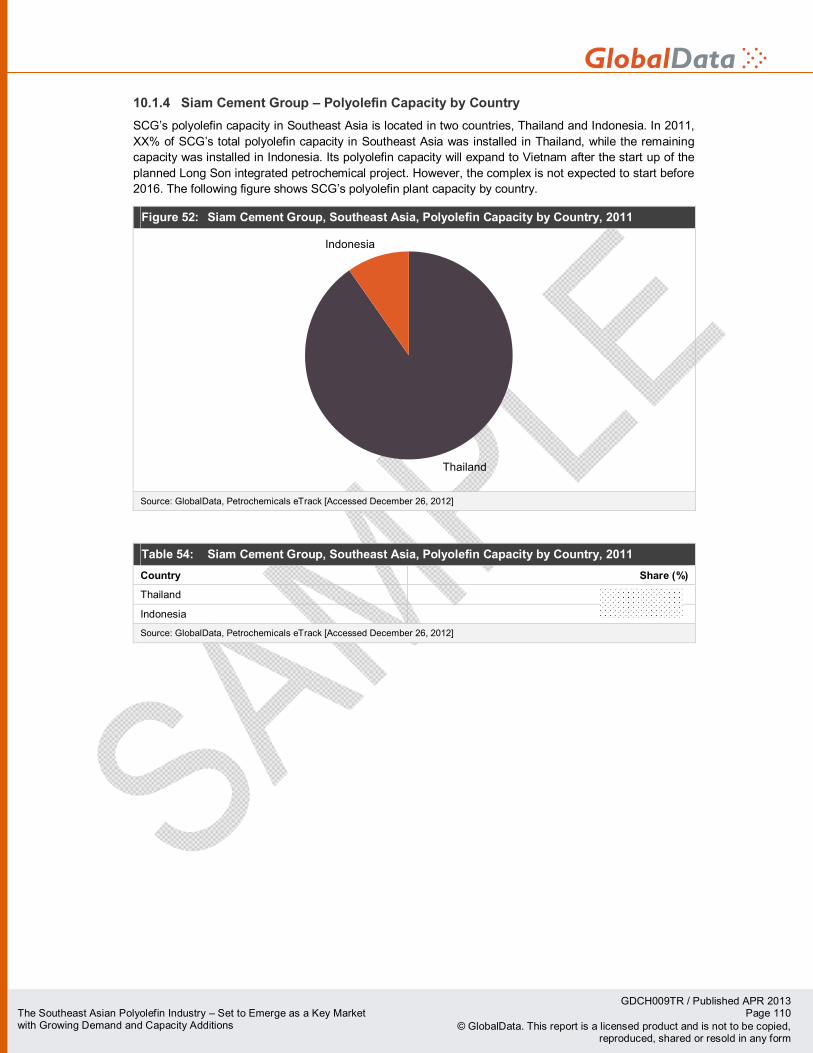
10.1.4 Siam Cement Group – Polyolefin Capacity by Country SCG’s polyolefin capacity in Southeast Asia is located in two countries, Thailand and Indonesia. In 2011, XX% of SCG’s total polyolefin capacity in Southeast Asia was installed in Thailand, while the remaining capacity was installed in Indonesia. Its polyolefin capacity will expand to Vietnam after the start up of the planned Long Son integrated petrochemical project. However, the complex is not expected to start before 2016. The following figure shows SCG’s polyolefin plant capacity by country.
Figure 52: Siam Cement Group, Southeast Asia, Polyolefin Capacity by Country, 2011
Thailand
Indonesia
Source: GlobalData, Petrochemicals eTrack [Accessed December 26, 2012]
Table 54: Siam Cement Group, Southeast Asia, Polyolefin Capacity by Country, 2011 Country Share (%)
Thailand
Indonesia
Source: GlobalData, Petrochemicals eTrack [Accessed December 26, 2012]
GDCH009TR / Published APR 2013 Page 120 The Southeast Asian Polyolefin Industry – Set to Emerge as a Key Market
with Growing Demand and Capacity Additions © GlobalData. This report is a licensed product and is not to be copied, reproduced, shared or resold in any form
11 Appendix
11.1 Abbreviations AFTA – ASEAN Free Trade Agreement
ASEAN – Association of Southeast Asian Nations
CAFTA – China-ASEAN Free Trade Agreement
CAGR – Compound Annual Growth Rate
GDP – Gross Domestic Product
HDPE – High Density Polyethylene
ktpa – thousand tons per annum
LDPE – Low Density Polyethylene
LLDPE – Linear Low Density Polyethylene
MIDA – Malaysian Investment Development Authority
MITI – Ministry Of International Trade and Industry
MPMA – Malaysian Plastic Manufacturer Association
MMtpa – Million Metric tons per annum
MYR – Malaysian Ringgit
NPCA – NPC Alliance Corporation
PTTGC – PTT Global Chemical Public Company Limited
RAPID – Refinery and Petrochemical Integrated Development
SCG – Siam Cement Group
11.2 Bibliography MIDA (2012). Malaysia Investment Performance 2011. Malaysian Investment Development Authority.
Available from: http://www.mida.gov.my/env3/uploads/PerformanceReport/2011/Report.pdf.
MIDA (2013). Malaysia Investment Performance 2012. Malaysian Investment Development Authority. Available from: http://www.mida.gov.my/env3/uploads/PerformanceReport/2012/MIPR2012_ENG.pdf.
MITI (2008). Industry Profile – Chemical Industry, Details of Approved Projects. Ministry of International Trade and Industry. Available from: http://www.miti.gov.my/cms/content.jsp?id=com.tms.cms.section.Section_44b61991-c0a8156f-628f628f-841b8080&rootid=com.tms.cms.section.Section_8ab4ec2a-7f000010-72f772f7-d6f41129. [Accessed on November 19, 2012].
Office of Chief Economist (2012). Indonesia Update – Euro Zone Crisis and National Banking Sector Resiliency. Bank Mandiri. Available from: http://www.bankmandiri.co.id/indonesia/eriview-pdf/MGDJ52029480.pdf.
MPMA (2012) via The Star. “Plastics industry seen growing at slow pace in H2”. The Star, October 3, 2012. Available from: http://biz.thestar.com.my/news/story.asp?file=/2012/10/3/business/12116315. [Accessed November 21, 2012].
UN Statistical Commission, 2012. Trade Data, Polyethylene - specific gravity <0.94 in primary forms 1996 – 2011 [database]. UN Comtrade. Available from: http://comtrade.un.org/db/mr/daCommoditiesResults.aspx?px=H1&cc=390110. [Accessed on November 23, 2012].

GDCH009TR / Published APR 2013 Page 121 The Southeast Asian Polyolefin Industry – Set to Emerge as a Key Market
with Growing Demand and Capacity Additions © GlobalData. This report is a licensed product and is not to be copied, reproduced, shared or resold in any form
Vietnam Trade Promotion Agency (2012). Vietnam’s plastic products export in first 9 months of 2012. Vietnam Trade Promotion Agency. Available from: http://www.vietrade.gov.vn/en/index.php?option=com_content&view=article&id=1618:vietnams-plastic-products-export-in-first-9-months-of-2012&catid=270:vietnam-industry-news&Itemid=232. [Accessed on December 19, 2012].
11.3 Definitions 11.3.1 Installed Capacity The maximum rated output of a plant under specific conditions designated by the manufacturer. The installed capacity is usually indicated in units of tons on a nameplate affixed to the plant.
11.3.2 Process A process is a combination of unit operations used in the manufacturing of petrochemicals to change the composition of chemicals.
11.3.3 Technology Technology is referred to as a technical process used in the petrochemical industry, which is developed by a specific business entity.
11.4 GlobalData’s Research Methodology GlobalData dedicated research and analysis teams consist of experienced professionals with a pedigree in marketing, market research and consulting backgrounds in the petrochemical industry and with advanced statistical expertise.
GlobalData adheres to the Codes of Practice of the Market Research Society (www.mrs.org.uk) and the Strategic and Competitive Intelligence Professionals (www.scip.org).
All GlobalData databases are continuously updated and revised. The following research methodology is followed for all databases and reports.
11.4.1 Coverage
The objective of updating GlobalData coverage is to ensure that it represents the most up to date vision of the industry possible
Changes in the industry taxonomy are built on the basis of extensive research of company, association and competitor sources
Company coverage is based on three key factors: market capitalization, revenues and media attention/innovation/market potential
An exhaustive search of 56 member exchanges is conducted and companies are prioritized on the basis of their market capitalization
The estimated revenues of all major companies, including private and governmental, are gathered and used to prioritize coverage
Companies which are making the news, or which are of particular interest due to their innovative approach are prioritized
GlobalData aims to cover all major news events and deals in the petrochemical industry, updated on a daily basis
The coverage is further streamlined and strengthened with additional inputs from GlobalData’s expert panel (see below).
GDCH009TR / Published APR 2013 Page 122 The Southeast Asian Polyolefin Industry – Set to Emerge as a Key Market
with Growing Demand and Capacity Additions © GlobalData. This report is a licensed product and is not to be copied, reproduced, shared or resold in any form
11.4.2 Secondary Research The research process begins with exhaustive secondary research on internal and external sources being carried out to source qualitative and quantitative information relating to each market.
The secondary research sources that are typically referred to include, but are not limited to:
Company websites, annual reports, financial reports, broker reports, investor presentations and SEC filings
Industry trade journals and other literature
Internal and external proprietary databases
National government documents, statistical databases and market reports
News articles, press releases and web-casts specific to the companies operating in the market.
11.4.3 Primary Research GlobalData conducts hundreds of primary interviews a year with industry participants and commentators in order to validate its data and analysis. A typical research interview fulfills the following functions:
It provides first-hand information on the market size, market trends, growth trends, competitive landscape, and future outlook
It helps in validating and strengthening the secondary research findings
It further develops the analysis team’s expertise and market understanding
Primary research involves e-mail correspondence and telephone interviews as well as face-to-face interviews for each market, category, segment and sub-segment across geographies.
The participants who typically take part in such a process include, but are not limited to:
Industry participants: CEOs, VPs, business development managers, market intelligence managers and national sales managers
Outside experts: investment bankers, valuation experts, research analysts and key opinion leaders specializing in the petrochemical industry
11.4.4 Expert Panel Validation GlobalData uses a panel of experts to cross verify research and forecast methodologies, and drive its analytical content.
The GlobalData expert panel comprises marketing managers, product specialists, international sales managers from petrochemical companies; academics from research universities and consultants from professional services companies.
GDCH009TR / Published APR 2013 Page 123 The Southeast Asian Polyolefin Industry – Set to Emerge as a Key Market
with Growing Demand and Capacity Additions © GlobalData. This report is a licensed product and is not to be copied, reproduced, shared or resold in any form
11.6 Disclaimer All Rights Reserved.
No part of this publication may be reproduced, stored in a retrieval system or transmitted in any form by any means, electronic, mechanical, photocopying, recording or otherwise without the prior permission of the publisher, GlobalData.