the spar group ltd preliminary summarised...
TRANSCRIPT

T H E S PA R G R O U P LT D
PRELIMINARY SUMMARISED
AUDITED RESULTSF O R T H E Y E A R E N D E D 30 S E P T E M B E R 2017
A N D C A S H D I V I D E N D D E C L A R AT I O N
SPAR IAS BOOKLET_11230_V19_14NOV_SA_1800.indd 47 2017/11/14 19:00

SPAR IAS BOOKLET_11230_V19_14NOV_SA_1800.indd 48 2017/11/14 19:00

1PRELIMINARY SUMMARISED AUDITED RESULTS FOR THE YEAR ENDED 30 SEPTEMBER 2017
CONTENTS
2 Summarised consolidated statement of profit or loss and other comprehensive income
3 Summarised consolidated statement of financial position
4 Summarised consolidated statement of changes in equity
5 Summarised consolidated statement of cash flows
6 Notes to the summarised consolidated financial results
18 Commentary
IBC Directorate and administration
SPAR IAS BOOKLET_11230_V19_14NOV_SA_1800.indd 1 2017/11/14 19:00

2 THE SPAR GROUP LTD
SUMMARISED CONSOLIDATED STATEMENT OF PROFIT OR LOSS AND OTHER COMPREHENSIVE INCOME
AUDITED YEAR ENDED SEPTEMBER
Rmillion%
Change 2017 2016
Revenue 5.4 97 174.2 92 227.3Turnover 5.3 95 461.1 90 688.5Cost of sales (85 830.2) (82 281.5)Gross profit 9 630.9 8 407.0Other income 1 713.1 1 538.8Net operating expenses 19.2 (8 760.6) (7 347.6)Trading profit 2 583.4 2 598.2BBBEE transactions (0.9) (20.9)Operating profit 0.2 2 582.5 2 577.3Other non-operating items (54.6) (24.5)Interest income 123.2 98.4Interest expense (113.2) (110.4)Finance costs including foreign exchange gains and losses (64.4) (106.5)Share of equity-accounted associate (losses)/income (8.8) 4.9Profit before taxation 1.0 2 464.7 2 439.2Income tax expense (644.6) (624.2)Profit for the year attributable to ordinary shareholders 0.3 1 820.1 1 815.0Other comprehensive incomeItems that will not be reclassified subsequently to profit or loss:
Actuarial gain/(loss) on post-retirement medical aid 11.4 (7.9)Deferred tax relating to actuarial gain/(loss) on post-retirement medical aid (3.2) 2.2
Actuarial gain/(loss) on retirement funds 432.1 (220.1)Deferred tax relating to actuarial gain/(loss) on retirement funds (67.9) 30.7
Items that may be reclassified subsequently to profit or loss:
Loss on cash flow hedge (4.6) (39.2)Tax relating to loss on cash flow hedge 0.6 11.0
Exchange differences from translation of foreign operations 42.0 (29.4)
Total comprehensive income 42.8 2 230.5 1 562.3EARNINGS PER SHAREBasic earnings per share (cents) (6.4) 945.2 1 010.0Diluted earnings per share (cents) (6.0) 939.1 999.5
SPAR IAS BOOKLET_11230_V19_14NOV_SA_1800.indd 2 2017/11/14 19:00

3PRELIMINARY SUMMARISED AUDITED RESULTS FOR THE YEAR ENDED 30 SEPTEMBER 2017
SUMMARISED CONSOLIDATED STATEMENT OF FINANCIAL POSITION
AUDITED YEAR ENDED SEPTEMBER
Rmillion Notes 2017 2016
ASSETSNon-current assets 11 438.4 10 610.4Property, plant and equipment 6 553.9 6 160.3Goodwill and intangible assets 4 162.2 4 008.3Investment in associates and joint ventures 117.3 38.4Other investments 57.7 54.2Operating lease receivables 125.4 100.5Loans 406.2 217.8Deferred taxation asset 15.7 30.9
Current assets 16 631.2 16 584.7Inventories 3 816.4 3 810.9Trade and other receivables 10 814.3 10 544.0Prepayments 78.1 75.4Operating lease receivables 60.7 63.4Loans 116.9 46.8Income tax recoverable 4.1 4.2Other current financial assets 0.2Cash and cash equivalents – SPAR 1 565.6 1 611.8Cash and cash equivalents – Guilds and trusts 174.9 428.2Assets held for sale 141.0 160.7Total assets 28 210.6 27 355.8EQUITY AND LIABILITIESCapital and reserves 6 575.0 5 642.9Stated capital 2 231.5 2 231.5Treasury shares (16.1) (18.7)Currency translation reserve 49.9 7.9Share-based payment reserve 293.0 261.1Equity reserve (717.0) (713.0)Hedging reserve (32.2) (28.2)Retained earnings 4 765.9 3 902.3
Non-current liabilities 7 350.1 7 590.1Deferred taxation liability 361.2 290.7Post-employment benefit obligations 940.2 1 392.2Financial liabilities 5 1 700.1 1 568.0Long-term borrowings 4 160.4 4 164.3Operating lease payables 141.4 116.0Other non-current financial liabilities 4.9Long-term provisions 41.9 58.9
Current liabilities 14 285.5 14 122.8Trade and other payables 13 452.7 13 162.5Current portion of long-term borrowings 364.4 265.9Operating lease payables 62.8 65.6Provisions 45.3 38.0Income tax liability 91.8 83.7Bank overdrafts 268.5 507.1
Total equity and liabilities 28 210.6 27 355.8
SPAR IAS BOOKLET_11230_V19_14NOV_SA_1800.indd 3 2017/11/14 19:00

4 THE SPAR GROUP LTD
SUMMARISED CONSOLIDATED STATEMENT OF CHANGES IN EQUITY
Rmill
ion
Stat
edca
pita
lTr
easu
rysh
ares
Curr
ency
tran
s-la
tion
rese
rve
Shar
e-ba
sed
paym
ent
rese
rve
Reta
ined
earn
ings
Equi
ty
rese
rve
Hed
ging
rese
rve
Non
-co
ntro
lling
inte
rest
Attr
ibu-
tabl
e to
ordi
nary
shar
e-ho
lder
s
Capi
tal a
nd re
serv
es a
t 30
Sept
embe
r 201
5 6
7.6
(26.
9) 3
7.3
425
.1
3 3
71.0
(545
.7)
–
–
3 3
28.4
Pr
ofit f
or th
e ye
ar a
ttrib
utab
le to
or
dina
ry s
hare
hold
ers
1 8
15.0
1 81
5.0
Loss
on
cash
flow
hed
ge (2
8.2)
(28.
2)Ac
tuar
ial lo
ss o
n po
st-r
etire
men
t med
ical
aid
(5.7
) (5
.7)
Actu
aria
l loss
on
retir
emen
t fun
ds (1
89.4
) (1
89.4
)Re
cogn
ition
of s
hare
-bas
ed p
aym
ents
41.
8 4
1.8
Take
-up
of s
hare
opt
ions
235
.5
(152
.5)
83.
0 Tr
ansf
er a
risin
g fro
m ta
ke-u
p of
sha
re o
ptio
ns 1
52.5
(1
52.5
) –
Tr
ansf
er a
risin
g fro
m c
losu
re o
f BB
BEE
trans
actio
n (2
16.5
) 2
16.5
–
Shar
e re
purc
hase
s (2
27.3
) (2
27.3
)Di
vide
nds
paid
(1 1
52.6
) (1
152
.6)
Issu
e of
sha
res
2 1
63.9
2
163
.9
Reco
gniti
on o
f BBB
EE tr
ansa
ctio
n 1
0.7
10.
7 N
on-c
ontro
lling
inte
rest
aris
ing
on b
usin
ess
acqu
isiti
on 3
84.8
3
84.8
Pu
rcha
se o
blig
atio
n of
non
-con
trollin
g in
tere
st (1
80.3
) (3
84.8
) (5
65.1
)Ex
chan
ge ra
te tr
ansl
atio
n(2
9.4)
13.
0 (1
6.4)
Capi
tal a
nd re
serv
es a
t 30
Sept
embe
r 201
6 2
231
.5
(18.
7) 7
.9
261
.1
3 9
02.3
(713
.0)
(28.
2) –
5
642
.9
Profi
t for
the
year
attr
ibut
able
to
ordi
nary
sha
reho
lder
s
1 8
20.1
1 8
20.1
Lo
ss o
n ca
sh fl
ow h
edge
(4.0
)(4
.0)
Actu
aria
l gai
n on
pos
t-re
tirem
ent m
edic
al a
id 8
.2 8
.2
Actu
aria
l gai
n on
retir
emen
t fun
ds 3
64.2
364
.2
Reco
gniti
on o
f sha
re-b
ased
pay
men
ts 3
3.3
33.
3 Ta
ke-u
p of
sha
re o
ptio
ns 1
31.0
(7
7.2)
53.
8 Tr
ansf
er a
risin
g fro
m ta
ke-u
p of
sha
re o
ptio
ns 7
7.2
(77.
2) –
Se
ttlem
ent o
f sha
re-b
ased
pay
men
ts 1
.4
(1.4
) –
Sh
are
repu
rcha
ses
(129
.8)
(129
.8)
Divi
dend
s pa
id (1
251
.7)
(1 2
51.7
)Ex
chan
ge ra
te tr
ansl
atio
n42
.0 (4
.0)
38.0
Capi
tal a
nd re
serv
es a
t 30
Sept
embe
r 201
7 2
231
.5
(16.
1) 4
9.9
293
.0
4 7
65.9
(7
17.0
) (3
2.2)
–
6 5
75.0
SPAR IAS BOOKLET_11230_V19_14NOV_SA_1800.indd 4 2017/11/14 19:00
5PRELIMINARY SUMMARISED AUDITED RESULTS FOR THE YEAR ENDED 30 SEPTEMBER 2017
Rmill
ion
Stat
edca
pita
lTr
easu
rysh
ares
Curr
ency
tran
s-la
tion
rese
rve
Shar
e-ba
sed
paym
ent
rese
rve
Reta
ined
earn
ings
Equi
ty
rese
rve
Hed
ging
rese
rve
Non
-co
ntro
lling
inte
rest
Attr
ibu-
tabl
e to
ordi
nary
shar
e-ho
lder
s
Capi
tal a
nd re
serv
es a
t 30
Sept
embe
r 201
5 6
7.6
(26.
9) 3
7.3
425
.1
3 3
71.0
(545
.7)
–
–
3 3
28.4
Pr
ofit f
or th
e ye
ar a
ttrib
utab
le to
or
dina
ry s
hare
hold
ers
1 8
15.0
1 81
5.0
Loss
on
cash
flow
hed
ge (2
8.2)
(28.
2)Ac
tuar
ial lo
ss o
n po
st-r
etire
men
t med
ical
aid
(5.7
) (5
.7)
Actu
aria
l loss
on
retir
emen
t fun
ds (1
89.4
) (1
89.4
)Re
cogn
ition
of s
hare
-bas
ed p
aym
ents
41.
8 4
1.8
Take
-up
of s
hare
opt
ions
235
.5
(152
.5)
83.
0 Tr
ansf
er a
risin
g fro
m ta
ke-u
p of
sha
re o
ptio
ns 1
52.5
(1
52.5
) –
Tr
ansf
er a
risin
g fro
m c
losu
re o
f BB
BEE
trans
actio
n (2
16.5
) 2
16.5
–
Shar
e re
purc
hase
s (2
27.3
) (2
27.3
)Di
vide
nds
paid
(1 1
52.6
) (1
152
.6)
Issu
e of
sha
res
2 1
63.9
2
163
.9
Reco
gniti
on o
f BBB
EE tr
ansa
ctio
n 1
0.7
10.
7 N
on-c
ontro
lling
inte
rest
aris
ing
on b
usin
ess
acqu
isiti
on 3
84.8
3
84.8
Pu
rcha
se o
blig
atio
n of
non
-con
trollin
g in
tere
st (1
80.3
) (3
84.8
) (5
65.1
)Ex
chan
ge ra
te tr
ansl
atio
n(2
9.4)
13.
0 (1
6.4)
Capi
tal a
nd re
serv
es a
t 30
Sept
embe
r 201
6 2
231
.5
(18.
7) 7
.9
261
.1
3 9
02.3
(713
.0)
(28.
2) –
5
642
.9
Profi
t for
the
year
attr
ibut
able
to
ordi
nary
sha
reho
lder
s
1 8
20.1
1 8
20.1
Lo
ss o
n ca
sh fl
ow h
edge
(4.0
)(4
.0)
Actu
aria
l gai
n on
pos
t-re
tirem
ent m
edic
al a
id 8
.2 8
.2
Actu
aria
l gai
n on
retir
emen
t fun
ds 3
64.2
364
.2
Reco
gniti
on o
f sha
re-b
ased
pay
men
ts 3
3.3
33.
3 Ta
ke-u
p of
sha
re o
ptio
ns 1
31.0
(7
7.2)
53.
8 Tr
ansf
er a
risin
g fro
m ta
ke-u
p of
sha
re o
ptio
ns 7
7.2
(77.
2) –
Se
ttlem
ent o
f sha
re-b
ased
pay
men
ts 1
.4
(1.4
) –
Sh
are
repu
rcha
ses
(129
.8)
(129
.8)
Divi
dend
s pa
id (1
251
.7)
(1 2
51.7
)Ex
chan
ge ra
te tr
ansl
atio
n42
.0 (4
.0)
38.0
Capi
tal a
nd re
serv
es a
t 30
Sept
embe
r 201
7 2
231
.5
(16.
1) 4
9.9
293
.0
4 7
65.9
(7
17.0
) (3
2.2)
–
6 5
75.0
SUMMARISED CONSOLIDATED STATEMENT OF CASH FLOWS
AUDITED YEAR ENDED SEPTEMBER
Rmillion Notes 2017 2016
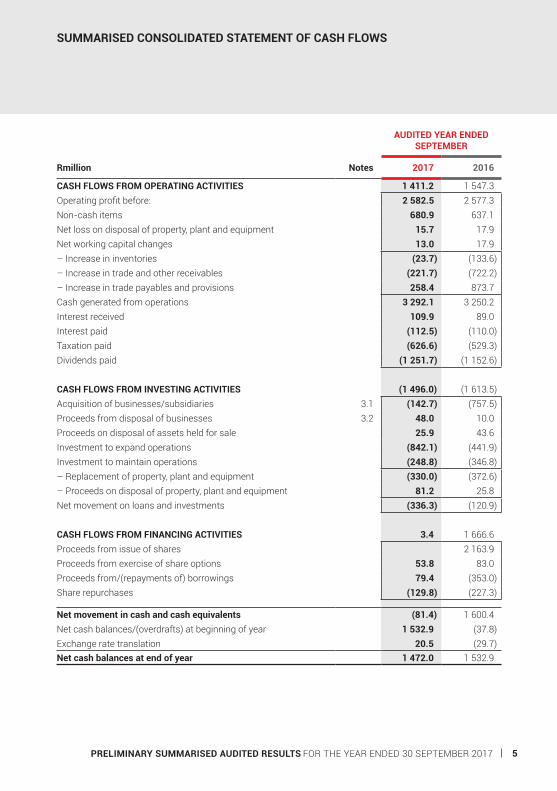
CASH FLOWS FROM OPERATING ACTIVITIES 1 411.2 1 547.3 Operating profit before: 2 582.5 2 577.3 Non-cash items 680.9 637.1 Net loss on disposal of property, plant and equipment 15.7 17.9 Net working capital changes 13.0 17.9 – Increase in inventories (23.7) (133.6)– Increase in trade and other receivables (221.7) (722.2)– Increase in trade payables and provisions 258.4 873.7 Cash generated from operations 3 292.1 3 250.2 Interest received 109.9 89.0 Interest paid (112.5) (110.0)Taxation paid (626.6) (529.3)Dividends paid (1 251.7) (1 152.6)
CASH FLOWS FROM INVESTING ACTIVITIES (1 496.0) (1 613.5)Acquisition of businesses/subsidiaries 3.1 (142.7) (757.5)Proceeds from disposal of businesses 3.2 48.0 10.0 Proceeds on disposal of assets held for sale 25.9 43.6 Investment to expand operations (842.1) (441.9)Investment to maintain operations (248.8) (346.8)– Replacement of property, plant and equipment (330.0) (372.6)– Proceeds on disposal of property, plant and equipment 81.2 25.8 Net movement on loans and investments (336.3) (120.9)
CASH FLOWS FROM FINANCING ACTIVITIES 3.4 1 666.6 Proceeds from issue of shares 2 163.9 Proceeds from exercise of share options 53.8 83.0 Proceeds from/(repayments of) borrowings 79.4 (353.0)Share repurchases (129.8) (227.3)
Net movement in cash and cash equivalents (81.4) 1 600.4 Net cash balances/(overdrafts) at beginning of year 1 532.9 (37.8)Exchange rate translation 20.5 (29.7)Net cash balances at end of year 1 472.0 1 532.9
SPAR IAS BOOKLET_11230_V19_14NOV_SA_1800.indd 5 2017/11/14 19:00

6 THE SPAR GROUP LTD
NOTES TO THE SUMMARISED CONSOLIDATED FINANCIAL RESULTS
1. BASIS OF PRESENTATION AND COMPLIANCE WITH IFRSThe preliminary summarised consolidated financial statements have been prepared in accordance with the framework concepts and the measurement and recognition requirements of International Financial Reporting Standards (IFRS), the SAICA Financial Reporting Guides as issued by the Accounting Practices Committee and Financial Reporting Pronouncements as issued by the Financial Reporting Standards Council and, as a minimum, contain the information as required by IAS 34: Interim Financial Reporting, the JSE Ltd Listings Requirements and the requirements of the Companies Act, 71 of 2008, as amended from time to time (Companies Act). The summarised consolidated financial statements have been prepared using accounting policies that comply with IFRS that are consistent with those applied in the consolidated financial statements for the year ended 30 September 2016.
In compliance with the disclosure requirements of the Companies Act, these preliminary summarised consolidated financial statements and the consolidated financial statements have been prepared under the supervision of Mr MW Godfrey CA(SA) (Group Financial Director) on behalf of The SPAR Group Ltd.
2. SALIENT STATISTICS AND HEADLINE EARNINGSAUDITED YEAR ENDED
SEPTEMBER
Rmillion%
Change 2017 2016
SALIENT STATISTICSHeadline earnings per share (cents) (6.6) 952.5 1 020.0 Diluted headline earnings per share (cents) (6.2) 946.4 1 009.4 Dividend per share (cents) 1.5 675.0 665.0 Net asset value per share (cents) 8.7 3 414.6 3 140.1 Operating profit margin (%) 2.7 2.8 Return on equity (%) 29.8 40.5HEADLINE EARNINGS RECONCILIATIONProfit for the year attributable to ordinary shareholders 1 820.1 1 815.0Adjusted for:Loss on disposal of property, plant and equipment 13.9 15.0– Gross 15.7 17.9– Tax effect (1.8) (2.9)Profit on disposal of assets held for sale (7.5) (3.0)Fair value adjustment to assets held for sale 1.2 1.4Impairment of goodwill 9.3 4.9Loss on disposal of associate interests 0.7Profit on disposal of businesses (2.8) (1.1)Headline earnings 1 834.2 1 832.9
SPAR IAS BOOKLET_11230_V19_14NOV_SA_1800.indd 6 2017/11/14 19:00

7PRELIMINARY SUMMARISED AUDITED RESULTS FOR THE YEAR ENDED 30 SEPTEMBER 2017
3. SEGMENTAL REPORTINGSegment accounting policies applied in the summarised consolidated financial statements are consistent with those adopted for the preparation of the consolidated financial statements.The principal segments of the group have been identified on a primary basis by geographical segment, which is representative of the internal reporting used for management purposes as well as the source and nature of business risks and returns.
The Chief Executive Officer (the Chief Operating Decision Maker) is of the opinion that the operations of the individual distribution centres within Southern Africa are substantially similar to one another and that the risks and returns of these distribution centres are likewise similar. The risks and returns of the Ireland and Switzerland operations are not considered to be similar to those within Southern Africa or each other.
As a result, the geographical segments of the group have been identified as Southern Africa, Ireland and Switzerland. All segment revenue and expenses are directly attributable to the segments. Segment assets and liabilities include all operating assets and liabilities used by a segment, with the exception of inter-segment assets and liabilities, and IFRS adjustments made by segments to their management report for the purposes of IFRS compliance. These assets and liabilities are all directly attributable to the segments.
SPAR IAS BOOKLET_11230_V19_14NOV_SA_1800.indd 7 2017/11/14 19:00

8 THE SPAR GROUP LTD
Analysis per reportable segment:
RmillionSouthern
Africa Ireland Switzerland
SwitzerlandIAS 19
adjustmentConsolidated
total
2017Total revenue 65 074.4 20 890.3 11 209.5 97 174.2 Operating profit 2 005.3 508.2 95.2 (26.2) 2 582.5 Profit before tax 1 933.0 465.8 92.1 (26.2) 2 464.7
Other informationInterest income 109.7 11.1 2.4 123.2 Interest expense 33.8 50.5 28.9 113.2 Depreciation 194.2 203.2 260.3 657.7
Statement of financial positionTotal assets 14 076.8 9 272.3 4 861.5 28 210.6 Total liabilities 10 070.8 7 364.7 3 791.7 408.4 21 635.6 2016Total revenue 62 232.3 23 471.5 6 523.5 92 227.3 Operating profit 2 057.3 487.8 45.0 (12.8) 2 577.3 Profit before tax 2 001.2 431.7 19.1 (12.8) 2 439.2
Other informationInterest income 86.8 10.1 1.5 98.4 Interest expense 42.3 51.4 16.7 110.4 Depreciation 174.3 213.9 143.2 531.4
Statement of financial positionTotal assets 13 521.2 8 741.5 5 093.1 27 355.8 Total liabilities 9 582.4 7 468.4 4 045.9 616.2 21 712.9
NOTES TO THE SUMMARISED CONSOLIDATED FINANCIAL RESULTS (CONTINUED)
SPAR IAS BOOKLET_11230_V19_14NOV_SA_1800.indd 8 2017/11/14 19:00

9PRELIMINARY SUMMARISED AUDITED RESULTS FOR THE YEAR ENDED 30 SEPTEMBER 2017
4. BUSINESS COMBINATIONS4.1 Retail stores acquired
During the course of the financial year, GCL 2016 Ltd (Gilletts), a subsidiary of the BWG Group, acquired the assets of four retail stores, and The SPAR Group Ltd acquired the assets of seven retail stores (2016: two retail stores). These acquisitions were funded from available cash resources. The principal activity of these acquisitions is that of retail trade and all its aspects. The stores were purchased in order to protect strategic sites, and the goodwill arising on the business combinations is a reflection of future turnover expected to be made by the group as a result of these acquisitions. The goodwill recognised on acquisition is not deductible for tax purposes.
Total acquisition costs for business acquisitions concluded during the 2017 financial year amounted to R3.0 million (2016: R21.0 million) and have been recognised as an expense in profit or loss in the ‘other non-operating items’ line.
Assets acquired and liabilities assumed at date of acquisition
2017 2016
Rmillion
UK retail
stores
SAretail
stores Total
SPARHolding
AG
GCL2016
Ltd
SAretail
stores Total
Assets 2.1 15.1 17.2 5 157.5 143.7 13.7 5 314.9Property, plant and equipment 15.1 15.1 2 873.8 14.6 13.7 2 902.1Other investments – 55.2 55.2Loans – 9.9 9.9Inventories 1.7 1.7 1 303.1 56.9 1 360.0Trade and other receivables 0.4 0.4 686.0 20.6 706.6
Provision for doubtful debts – (25.7) (25.7)Cash and cash equivalents – 255.2 51.6 306.8Liabilities – – – (4 195.5) (211.5) – (4 407.0)Post-employment benefit obligations – (732.5) (732.5)Long-term borrowings – (2 327.2) (126.3) (2 453.5)Trade and other payables – (990.1) (78.0) (1 068.1)Income tax liability – (3.3) (2.6) (5.9)Deferred taxation liability – (142.4) (4.6) (147.0)
Total identifiable net assets at fair value 2.1 15.1 17.2 962.0 (67.8) 13.7 907.9Goodwill arising from acquisition 15.2 107.3 122.5 332.5 363.2 42.0 737.7Non-controlling interest – (384.8) (384.8)Purchase consideration 17.3 122.4 139.7 909.7 295.4 55.7 1 260.8
Paid in cash 17.3 122.4 139.7 685.4 263.0 55.7 1 004.1Deferred consideration – 224.3 224.3Contingent consideration – 32.4 32.4
Cash and cash equivalents acquired – (255.2) (51.6) (306.8)Business acquisition costs 3.0 3.0 6.2 14.8 21.0Loss on cash flow hedge through OCI – 39.2 39.2Deferred consideration – (224.3) (224.3)Contingent consideration – (32.4) (32.4)Net cash outflow on acquisition 20.3 122.4 142.7 475.6 226.2 55.7 757.5
SPAR IAS BOOKLET_11230_V19_14NOV_SA_1800.indd 9 2017/11/14 19:00

10 THE SPAR GROUP LTD
NOTES TO THE SUMMARISED CONSOLIDATED FINANCIAL RESULTS (CONTINUED)
4.2 Assets and liabilities at date of disposalThe assets and liabilities disposed of relate to three South African retail stores (2016: one retail store).
Rmillion 2017 2016
Non-current assets 45.2 8.9Property, plant and equipment 6.4 8.9Goodwill 38.8Profit on disposal of businesses 2.8 1.1Proceeds 48.0 10.0
4.3 Contribution to results for the year
2017 2016
Rmillion
UK retail
stores
SA retail
stores Total
SPARHolding
AG
GCL2016
Ltd
SA retail
stores Total
Revenue 4.6 468.3 472.9 6 523.5 96.2 126.5 6 746.2Trading (losses)/profit before acquisition costs (0.5) (42.0) (42.5) 32.2 9.8 (11.4) 30.6
4.4 Finalisation of SPAR Holding AG (SPAR Switzerland) acquisitionThe initial accounting for the acquisition of SPAR Switzerland in 2016 was provisional for the value of intangible assets acquired as the valuation of these assets had not yet been completed. This process has now been concluded, which has resulted in no value being attributed to intangible assets acquired for this business combination, and no change to the initial goodwill arising on acquisition.
4.5 Finalisation of GCL 2016 Ltd (Gilletts) acquisitionThe initial accounting for the 2016 acquisition of Gilletts was provisional for the value of the repairs as a result of the dilapidation valuation, the contingent consideration, inventories, trade and other receivables, and trade and other payables. The working capital element of the acquisition was subject to a completion account process which required that the value of the working capital purchased at the date of acquisition be finalised. This process has now been concluded, and resulted in no material changes to the values disclosed for this business combination.
SPAR IAS BOOKLET_11230_V19_14NOV_SA_1800.indd 10 2017/11/14 19:00

11PRELIMINARY SUMMARISED AUDITED RESULTS FOR THE YEAR ENDED 30 SEPTEMBER 2017
5. FINANCIAL LIABILITIES
2017 2016
Present valueTIL JV Ltd 963.8 824.4SPAR Holding AG 736.3 743.6
1 700.1 1 568.0Undiscounted value TIL JV Ltd 1 194.1 1 094.2SPAR Holding AG 823.0 803.6
2 017.1 1 897.8
5.1 TIL JV LtdThe SPAR Group Ltd acquired a controlling shareholding of 80% in the BWG Group, which is held by TIL JV Ltd, a subsidiary of The SPAR Group Ltd, effective from 1 August 2014. The SPAR Group Ltd has agreed to acquire the remaining 20% shareholding from the non-controlling shareholders at specified future dates and in accordance with a determined valuation model. An election was made not to recognise a non-controlling interest, but to fair value the financial liability. The financial liability is calculated as the present value of the non-controlling interests share of the expected purchase value and discounted from the expected exercise dates to the reporting date. As at 30 September 2017, the financial liability was valued at R963.8 million (2016: R824.4 million) based on management’s expectation of future profit performance. The group has recognised 100% of the attributable profit.
Repayments will commence in December 2019 and continue in 2020 and 2022.
Interest is recorded in respect of this liability within finance costs using the effective interest rate method. The net exchange differences on the financial liability have been presented in finance costs. The estimated future purchase price is fair valued at each reporting date and any changes in the value of the liability as a result of changes in the assumptions used to estimate the future purchase price are recorded in profit or loss.
In 2017, a fair value adjustment was made to the TIL JV Ltd financial liability relating to changes in forecast profit assumptions. In 2016, there were no changes to these assumptions and therefore no fair value adjustment.
5.2 SPAR Holding AGThe SPAR Group Ltd acquired a controlling shareholding of 60% in the SPAR Holding AG, which is held by SAH Ltd, a wholly owned subsidiary of The SPAR Group Ltd, effective from 1 April 2016. Part of the purchase price of this 60% shareholding is a deferred consideration of CHF16.0 million, which will be paid between December 2020 and February 2021, with the purchase of the remaining 40% of SPAR Holding AG. The purchase of the remaining 40% shareholding is at a set price of CHF40.3 million. The total obligation of CHF56.3 million was accounted for as a financial liability at the present value of the obligation, discounted from the expected settlement date to the reporting date. An election was made not to recognise the non-controlling interest’s share of profits or losses in equity, but rather as the movement in the fair value of the discounted financial liability to purchase the remaining 40% shareholding.
Interest is recorded in respect of this liability within finance costs using the effective interest rate method. The net exchange differences on the financial liability have been presented in finance costs.
SPAR IAS BOOKLET_11230_V19_14NOV_SA_1800.indd 11 2017/11/14 19:00

12 THE SPAR GROUP LTD
NOTES TO THE SUMMARISED CONSOLIDATED FINANCIAL RESULTS (CONTINUED)
6. FINANCIAL RISK MANAGEMENT
2017 2016
Financial instruments classificationNet bank balances 1 472.0 1 532.9 Loans* 523.1 264.6 Other equity investments*** 57.7 54.2 Trade and other receivables* 10 814.3 10 544.0 Trade and other payables** (13 452.7) (13 162.5)FEC liability**** (4.9)FEC asset/(liability)*** 0.2 (0.7)Borrowings** (4 524.8) (4 430.2)Financial liabilities*** (1 700.1) (1 568.0)
* Classified under IAS 39 as loans and receivables.** Classified under IAS 39 as financial liabilities measured at amortised cost.*** Classified under IAS 39 as financial assets or liabilities at fair value through profit or loss.**** Designated as a hedging instrument.
Fair value hierarchyThe group’s financial instruments carried at fair value are classified into three categories defined as follows:
Level 1 financial instruments are those that are valued using unadjusted quoted prices in active markets for identical financial instruments. These instruments consist of the forward exchange contracts.
Level 2 financial instruments are those valued using techniques based primarily on observable market data. Instruments in this category are valued using quoted prices for similar instruments or identical instruments in markets that are not considered to be active; or valuation techniques where all the inputs that have a significant effect on the valuation are directly or indirectly based on observable market data. Financial instruments classified as level 2 are mainly comprised of other equity investments.
Level 3 financial instruments are those valued using techniques that incorporate information other than observable market data. Instruments in this category have been valued using a valuation technique where at least one input, which could have a significant effect on the instrument’s valuation, is not based on observable market data.
SPAR IAS BOOKLET_11230_V19_14NOV_SA_1800.indd 12 2017/11/14 19:00

13PRELIMINARY SUMMARISED AUDITED RESULTS FOR THE YEAR ENDED 30 SEPTEMBER 2017
The following financial instruments are carried at fair value and are further categorised into the appropriate fair value hierarchy:
Financial instruments
RmillionCarrying
valueFair value
Level 1Fair value
Level 2Fair value
Level 3
2017Other equity investments 55.3 55.3FEC liability designated as a hedging instrument (4.9) (4.9)FEC asset at fair value through profit or loss 0.2 0.2Financial liabilities (1 700.1) (1 700.1)Total (1 649.5) (4.7) 55.3 (1 700.1)2016Other equity investments 54.2 54.2FEC liability at fair value through profit or loss (0.7) (0.7)Financial liabilities (1 568.0) (1 568.0)Total (1 514.5) (0.7) 54.2 (1 568.0)
Level 2 valuation method and inputsThe level 2 financial instruments consist of the investment in Group Risk Holdings (Pty) Ltd (GRH) and the Hypo Vorarlberg bank security deposit. The value of the investment in GRH is based on the group’s premium contributions relative to other shareholders in GRH. The Hypo Vorarlberg bank security deposit is a portfolio of listed shares and bonds, the value of which are observable in the market.
Level 3 sensitivity informationThe fair value of the level 3 financial liabilities of R1 700.1 million (2016: R1 568.0 million) was estimated by applying an income approach valuation method, including a present value discount technique. The fair value measurement is based on significant inputs that are not observable in the market. Key inputs used in the valuation include the estimated future profit targets and the discount rates applied. The estimated profitability was based on historical performances but adjusted for expected growth.
The following factors were applied in calculating the financial liabilities at 30 September 2017:
TIL JV Ltd– Discount rate of 7.2% (2016: 7.2%)– Closing rand/euro exchange rate of 15.96 (2016: 15.59)
SPAR Holding AG– Discount rate of 2.0% (2016: 2.0%)– Closing rand/Swiss franc exchange rate of 13.95 (2016: 14.38)
SPAR IAS BOOKLET_11230_V19_14NOV_SA_1800.indd 13 2017/11/14 19:00

14 THE SPAR GROUP LTD
NOTES TO THE SUMMARISED CONSOLIDATED FINANCIAL RESULTS (CONTINUED)
The following tables show how the fair value of the level 3 financial liabilities would change in relation to the discount rate if the discount rate increased or decreased by 0.5%:
Discount rate%
Sensitivity% change
LiabilityRmillion
TIL JV Ltd2017Financial liability 7.2 0.5 (14.0)Financial liability 7.2 (0.5) 14.32016Financial liability 7.2 0.5 (15.8)Financial liability 7.2 (0.5) 16.2SPAR Holding AG2017Financial liability 2.0 0.5 (11.9)Financial liability 2.0 (0.5) 12.12016Financial liability 2.0 0.5 (15.5)Financial liability 2.0 (0.5) 16.1
SPAR IAS BOOKLET_11230_V19_14NOV_SA_1800.indd 14 2017/11/14 19:00

15PRELIMINARY SUMMARISED AUDITED RESULTS FOR THE YEAR ENDED 30 SEPTEMBER 2017
Movements in level 3 financial instruments carried at fair valueThe following tables show a reconciliation of the opening and closing balances of level 3 financial instruments carried at fair value:
Rmillion 2017 2016
TIL JV LtdBalance at beginning of year 824.4 729.8Finance costs recognised in profit or loss 60.1 96.3Net exchange differences arising during the period 27.7 (1.7)Fair value adjustment 51.6Balance at end of year 963.8 824.4SPAR Holding AGBalance at beginning of year 743.6 – Financial liability initially recognised 789.4Finance costs recognised in profit or loss 14.2 7.7Net exchange differences arising during the period (37.6) 4.2Foreign exchange translation 16.1 (57.7)Balance at end of year 736.3 743.6
Total financial liabilities 1 700.1 1 568.0
SPAR IAS BOOKLET_11230_V19_14NOV_SA_1800.indd 15 2017/11/14 19:00

16 THE SPAR GROUP LTD
NOTES TO THE SUMMARISED CONSOLIDATED FINANCIAL RESULTS (CONTINUED)
7. COMMITMENTS
RmillionLand andbuildings Other
7.1 Operating lease commitmentsFuture minimum lease payments due under non-cancellable operating leases:
2017Payable within one year 1 804.0 69.9Payable later than one year but not later than five years 5 495.4 144.0Payable later than five years 4 357.3 16.0Total 11 656.7 229.92016Payable within one year 1 596.6 71.5Payable later than one year but not later than five years 5 157.2 145.9Payable later than five years 4 193.9 14.0Total 10 947.7 231.4
7.2 Operating lease receivablesFuture minimum sub-lease receivables due under non-cancellable operating leases:
Rmillion 2017 2016
Receivable within one year 1 124.7 937.8Receivable later than one year but not later than five years 3 185.9 2 755.7Receivable later than five years 2 093.9 1 515.9Total operating lease receivables 6 404.5 5 209.4
7.3 Capital commitmentsContracted 549.8 322.0Approved but not contracted 94.8 154.6Total capital commitments 644.6 476.6
Capital commitments will be financed from group resources.
SPAR IAS BOOKLET_11230_V19_14NOV_SA_1800.indd 16 2017/11/14 19:00

17PRELIMINARY SUMMARISED AUDITED RESULTS FOR THE YEAR ENDED 30 SEPTEMBER 2017
8. CONTINGENT LIABILITIES
Rmillion 2017 2016
Guarantees issued in respect of the finance obligations 1 089.1 1 065.6– Loan guarantees 760.5 743.7– Rental guarantees 4.2 3.1– Customs and excise guarantees 155.9 152.3– IT retail computer equipment lease scheme 168.5 166.5
The board has limited guarantee facilities to R1 090.0 million (2016: R990.0 million) relating to Southern Africa.
9. EVENTS AFTER THE REPORTING DATE9.1 Acquisition of S Buys pharmaceutical wholesaler
The group purchased a 60% shareholding in a pharmaceutical wholesaler effective 1 October 2017. The consideration paid for these shares was R45.0 million. There is an additional contingent consideration of R29.9 million, calculated based on a multiple of the profit after tax as at the end of the entity’s August 2017 financial year.
This purchase was made in order to grow the Pharmacy at SPAR line of business, and the synergies as a result of this acquisition will be reflected in the value of the goodwill.
The group will purchase the remaining 40% shareholding between 30 September 2022 and 31 December 2022 for an amount based on the value of the remaining shareholders’ loan and the profit after tax for the 2022 financial year. This obligation to purchase the remaining shareholding will be recognised as a financial liability at the present value of the obligation, discounted from the expected settlement date to the reporting date. The non-controlling interest will be recognised at the proportionate share of the net assets of the business. An election has been made not to recognise the non-controlling interest’s share of profits or losses in equity, but rather as the movement in the fair value of the discounted financial liability to purchase the remaining 40% shareholding.
Assets acquired and liabilities assumed at date of acquisition are all provisional, as well as the financial liability, as these fair values are still in the process of being finalised.
9.2 Purchase of propertyThe group has purchased property to the value of R165.0 million, which is a shopping centre in Pinetown, KwaZulu-Natal, housing a range of tenants from which the company will derive rental income.
9.3 The directors are not aware of any matters or circumstances, other than the above, arising since the end of the financial year, which have or may significantly affect the financial position of the group or the results of its operations.
SPAR IAS BOOKLET_11230_V19_14NOV_SA_1800.indd 17 2017/11/14 19:00
18 THE SPAR GROUP LTD
COMMENTARY
HIGHLIGHTS
• Turnover up 5.3%• Profit before taxation up 1.0%• Net asset value per share up 8.7%• Annual dividend declared 675 cents per share
REVIEW OF TRADING RESULTS
The SPAR Group’s financial results for the year under review were modest, with turnover increasing by 5.3% and profit before tax by only 1.0%. These results reflect the weak state of consumer buying power and confidence, which has been exacerbated by retrenchments, political uncertainty and climatic challenges in South Africa. Increased price competition among retailers is evident. Despite these challenges, the group is encouraged by the strong performances from our business in Ireland and the early positive signs of the turnaround in Switzerland. Continued rand strength against the euro substantially eroded the European results on final consolidation. The group served a retail store network of 3 768 at year-end.
• SPAR Southern Africa experienced a significant slowdown in sales which, together with cost pressures, resulted in net margin contraction. The core SPAR business reported muted sales growth of 4.2% in difficult trading conditions. The liquor sales continued to achieve double-digit growth, despite an increasingly competitive retail sector. The building materials business reflected the performance of the whole industry and reported wholesale sales growth of 2.1%.
• The group’s operations in Ireland weathered deflationary pressures, with solid operating profit growth and market share gains across most of its retail brands. The SPAR and XL brands reported strong sales growth, while the successful integration of the Londis business into the BWG (SPAR Ireland) supply chain is being reflected in the 4.6% growth experienced by that brand. The Gilletts acquisition in South West England late last year further contributed to the impressive Irish result.
• SPAR Switzerland reversed a half-year loss as a result of early gains from implementing its plans to improve the retail offering. The results of this business are recognised for the full financial year, but only from 1 April 2016 acquisition date in the comparative.
SPAR IAS BOOKLET_11230_V19_14NOV_SA_1800.indd 18 2017/11/14 19:00

19PRELIMINARY SUMMARISED AUDITED RESULTS FOR THE YEAR ENDED 30 SEPTEMBER 2017
FINANCIAL REVIEW
Summary segmental analysis
Rmillion Southern Africa Ireland SwitzerlandThe SPAR Group Ltd
Income statementTurnover 64 500.8 20 528.7 10 431.6 95 461.1
Gross profit 5 269.0 2 487.0 1 874.9 9 630.9
Operating profit 2 005.3 508.2 69.0 2 582.5
Profit before taxation 1 933.0 465.8 65.9 2 464.7
Reported group turnover grew to R95.5 billion (2016: R90.7 billion). Tough overall trading conditions in Southern Africa led to a 4.5% growth in turnover to R64.5 billion (2016: R61.7 billion) in the region. The BWG Group contributed R20.5 billion (2016: R23.1 billion) to group turnover, reflecting a very positive 1.5% euro-denominated growth. However, the euro’s approximate 10.0% weakening against the rand over the year eroded the strong trading performance in Ireland. SPAR Switzerland, contributed 10.9% of the group’s turnover for its first full period of consolidation.
SPAR’s gross margin continues to be buoyed by its offshore businesses, which service the higher margin convenience sector, increasing to 10.1% (2016: 9.3%) during the year to finish at R9.6 billion, of which 45.3% was generated in the northern hemisphere. In line with its strategy, SPAR Southern Africa continued to support its retailers through better pricing, and gross margins declined marginally to 8.17% (2016: 8.24%). In Ireland, the contribution from Gilletts, (acquired July 2016), as well as increasing perishables volumes contributed to higher margins. The Swiss business enjoys higher gross margins of 18.0%, as a result of operating in the convenience sector.
The SPAR Group reported a total operating profit of R2.6 billion, up 0.2% from the previous year (2016: R2.6 billion). In Southern Africa, operating profit decreased 2.5%, as tough trading conditions eroded margins and increased costs were associated with stores acquired and subsidised. SPAR Ireland contributed R508.2 million, representing an increase of 4.2%. SPAR Switzerland added R69.0 million, after adjusting for an IFRS pension charge of R26.2 million.
The group’s profit before tax was up 1.0% to R2.5 billion (2016: R2.4 billion). The Southern African operations benefited from net interest income of R75.9 million (2016: R44.5 million) while lower finance costs in Ireland also had a positive impact. The group’s profit after tax improved marginally by 0.3% to R1.8 billion (2016: R1.8 billion), impacted by an increased effective tax rate. Reported headline earnings were flat at R1.8 billion, but increased 1.2% on a normalised basis after adjusting for the fair value adjustment and foreign exchange adjustments to financial liabilities.
The issue of shares to fund the Irish and Swiss acquisitions, as well as to settle the BBBEE share scheme that vested in August 2016 resulted in an increased effective number of ranking shares in the current year. This impacted the headline earnings per share causing it to decrease 6.6% to 952.5 cents (2016: 1 020.0 cents). The board approved a final dividend of 435 cents per share, resulting in a total annual dividend of 675 cents per share representing a growth of 1.5%.
SPAR’s ongoing focus on working capital management supported cash generation from operations which increased 1.3% to R3.3 billion. Overall cash flow was, however, negatively impacted by weaker operating profit performance in Southern Africa, but this was offset by cash inflows from operations in Ireland, as well as proceeds from borrowings in Ireland.
SPAR IAS BOOKLET_11230_V19_14NOV_SA_1800.indd 19 2017/11/14 19:00

20 THE SPAR GROUP LTD
COMMENTARY (CONTINUED)
Capital expenditure increased to R1 090.9 million (2016: R788.7 million). This comprised R516.0 million (2016: R339.5 million) in Southern Africa, including the expansion of the Western Cape and North Rand perishables facilities, as well as the acquisition of the West Rand property for future distribution centre development. In Ireland and Switzerland, capital expenditure amounted to R354.1 million (2016: R325.6 million) and R220.8 million (2016: R123.6 million) respectively, which was utilised for retail store refurbishments and technology upgrades.
Budgeted capital expenditure for the year ahead in Southern Africa, amounting to R666.0 million (2016: R752.0 million), includes the purchase of additional land in the Eastern Cape for a new dry warehouse facility, the acquisition of a retail property in KwaZulu-Natal and further technology investments. In Ireland, budgeted capital projects address a wide range of retail development projects. In Switzerland, CHF26.0 million has been budgeted in 2018 for retail investments and upgrades to cash-and-carry premises. It is anticipated that the foreign subsidiaries will fund all capital expenditure from their own cash flows.
GEOGRAPHICAL REVIEW
Southern AfricaThe turnover of SPAR Southern Africa increased 4.5% in a highly competitive retail market despite double-digit liquor sales growth. Internally measured food inflation for the year was reported at 6.0%, significantly lower than at the half year due to declining commodity prices in the second half.
Operating expenses were up 8.7% (2016: 11.9%) underpinned by increased marketing and selling costs. Volumes processed through the seven distribution centres decreased 2.6% during the year to 224.5 million cases (2016: 226.4 million cases).
SPAR Southern Africa recorded a 3.4% decrease in profit before tax to R1.9 billion (2016: R2.0 billion), which was boosted by net interest income of R75.9 million (2016: R44.5 million).
Combined food and liquor retail sales, which allow for a better industry comparison, increased by 5.3%. The performance of SPAR stores was impacted by lower consumer spending with retail turnover growth of 4.5% to R76.5 billion (2016: R73.2 billion) and like-for-like growth of 4.2%. Wholesale turnover increased 4.2% to R51.7 billion while demand for SPAR-branded products grew 9.7% during the year, with total sales of R8.0 billion. SPAR’s total house brand sales have increased to R10.2 billion.
The group maintained a selective approach to new store development to ensure the viability of all proposed expansion projects. Total retail space growth increased 1.7% (2016: 1.5%). A number of new developments continue to be delayed by property developers. SPAR continued to drive store refurbishments to meet evolving consumer preferences, with 149 stores being revamped (2016: 167 stores) in the year. A net 13 stores were opened during the year, bringing the total store numbers to 903 by 30 September 2017.
TOPS at SPAR has extended its double-digit growth trajectory, achieving a 12.4% increase in reported retail turnover to R10.0 billion (2016: R8.9 billion) while extensive store upgrades supported same-store turnover growth of 9.7%. Wholesale turnover was up 11.2% to R5.8 billion (2016: R5.2 billion). Despite ongoing delays in obtaining liquor licences, 51 new TOPS stores opened and the brand closed the year with 733 stores. The total retail liquor space increased 5.8% for the period. The majority of stores have converted to the new TOPS at SPAR logo and 50 stores were revamped.
Build it delivered a 4.3% increase in retail sales to R12.2 billion (2016: R11.7 billion) while same-store growth amounted to 1.1%, reflecting the tough trading environment and low inflation that is impacting the whole industry. Wholesale turnover grew 2.1% to R7.1 billion. Cement inflation was measured at approximately 2.0% with strong price recovery in the second half of the year. Demand for the Build it house brand continues to grow with sales improving 18.7% to R338.6 million for the period. At year-end, Build it’s store network stood at 368 stores, including 27 new Build it outlets opened during the year.
SPAR IAS BOOKLET_11230_V19_14NOV_SA_1800.indd 20 2017/11/14 19:00

21PRELIMINARY SUMMARISED AUDITED RESULTS FOR THE YEAR ENDED 30 SEPTEMBER 2017
IrelandIn euro-denominated currency, turnover increased by 1.5% to €1.4 billion. The BWG Group reported a 11.1% decrease in turnover to R20.5 billion (2016: R23.1 billion), largely due to exchange rate fluctuations. This was partially offset by Gilletts’ contribution (acquired July 2016), included for the whole year compared to three months in the prior year and strong performances from most of the other brands. The grocery market remained in a deflationary cycle with reported internal deflation of 2.0% for food and non-alcoholic beverages and deflation of 0.8% for alcohol and tobacco products in the year to September 2017 (Source: Irish Central Statistics).
The turnover and profit contributions of the Londis business continue to exceed plan, with sales growth of 4.6%. The XL and SPAR brands gained market share with sales growth of 6.6% and 4.2% respectively. EUROSPAR delivered strong sales growth compared to its supermarket peers. The BWG Wines and Spirits and BWG Foodservice businesses delivered excellent results with sales increasing 17.8% and 13.2% respectively. The turnover contribution of Appleby Westward, operating in South West England, declined 12.6% in euro terms, or 4.9% in sterling currency terms. This was substantially due to the loss of two independent groups of stores.
BWG Group’s euro-denominated margin increased to 11.2% as it reacted rapidly to the deflationary market conditions. Operating profit grew 4.2% to R508.2 million (2016: R487.8 million) while profit before tax was up 7.9% to R465.8 million (2016: R431.7 million). In euro terms profit before tax increased 21.8%.
Total store numbers across BWG Group’s store formats at 30 September 2017 was 1 330 stores, with 73 new stores opened during the year.
SwitzerlandA majority stake in SPAR Switzerland, acquired effective 1 April 2016, was consolidated for the full year compared to six months in the prior year. Sales for the second six months were down 3.1% in local currency terms, in line with the negative growth reported across all retail. Swiss food retail inflation increased 0.3% year-on-year to end September 2017 (Source: Federal Statistical Office). Driving sales at both the retail and wholesale level in Switzerland remains a key priority for SPAR to improve this acquisition’s business performance, including the roll out of category management practices to optimise retail performance.
The gross operating margin, which is higher than in other regions due to the nature of product distributed, increased to 18.0% (2016: 14.0%) and is considered sustainable as all product is supplied ex-warehouse. Furthermore, SPAR Switzerland is highly exposed to the convenience sector that commands higher margins.
SPAR Switzerland’s operating profit increased to R69.0 million (2016: R32.2 million). Cost saving plans were implemented in all areas of the business, however, SPAR Switzerland’s higher inherent cost structure reflects its greater exposure to retail due to its large proportion of corporate owned stores and TopCC cash-and-carry outlets. This business typically incurs selling and marketing expenditure amounting to some 70% of its overheads (at least double that of the rest of the group). An IAS 19 pension liability charge of R26.2 million (2016: R12.8 million) also impacted reported expenses.
Profit before tax amounted to R65.9 million (2016: R6.3 million). However, adjusting for the extraordinary IFRS pension charge and a financial liability relating to the future minority purchase obligation, the reported figure increases to R68.7 million (2016: R31.0 million). The actions taken during the last six months by the new management team at SPAR Switzerland are starting to achieve results and the focus on improving the retail offering will continue in the year ahead.
SPAR IAS BOOKLET_11230_V19_14NOV_SA_1800.indd 21 2017/11/14 19:00

22 THE SPAR GROUP LTD
COMMENTARY (CONTINUED)
PROSPECTS
In Southern Africa, despite the expectation that political and economic uncertainties will continue, SPAR remains committed to driving its key strategic focus areas to support retailer profitability and deliver real business growth. These initiatives include ongoing, significant investments in the group’s distribution network, competitive pricing and ensuring a comprehensive product range.
The BWG Group’s growth outlook remains cautious as economic uncertainty in the region continues. Local management have reacted to the prevailing market conditions and are confident of delivering further strong results. This business will be evaluating further potential acquisition opportunities to expand its offering to consumers, while improving services to the existing retail network.
The results achieved in this period are early signs that the turnaround strategy being implemented in Switzerland has started delivering the expected benefits. The management team will continue to focus on retail performance to deliver SPAR’s expected returns.
With its geographically diversified businesses comprising well-established retail brands in its chosen markets, SPAR’s board and management are confident that the group is well placed to continue creating value for shareholders.
AUDIT OPINION
The auditors, Deloitte & Touche, have issued their opinion on the consolidated financial statements for the year ended 30 September 2017. The audit was conducted in accordance with International Standards on Auditing. They have issued an unmodified opinion. A copy of the auditor’s report together with a copy of the audited consolidated financial statements is available for inspection at the company’s registered office. These preliminary summarised consolidated financial statements have been derived from the consolidated financial statements and are consistent in all material respects with the consolidated financial statements. These preliminary summarised consolidated financial statements for the year ended 30 September 2017, have been audited by the group’s auditors who have issued an unmodified opinion. The auditor’s report does not necessarily report on all of the information contained in these preliminary summarised consolidated financial statements. Shareholders are advised that in order to obtain a full understanding of the nature of the auditor’s engagement, they should obtain a copy of that report together with the accompanying preliminary summarised consolidated financial statements from the company’s registered office. Any reference to future financial information included in this announcement has not been reviewed or reported on by the auditors.
SPAR IAS BOOKLET_11230_V19_14NOV_SA_1800.indd 22 2017/11/14 19:00

23PRELIMINARY SUMMARISED AUDITED RESULTS FOR THE YEAR ENDED 30 SEPTEMBER 2017
DECLARATION OF ORDINARY DIVIDEND
Notice is hereby given that a gross final cash dividend of 435 cents per share has been declared by the board in respect of the year ended 30 September 2017. The dividend has been declared out of income reserves.
This brings the total gross dividend for the year to 675 cents (2016: 665 cents) per ordinary share.
The salient dates for the payment of the final dividend are detailed below:
Last day to trade cum-dividend Tuesday, 5 December 2017Shares to commence trading ex-dividend Wednesday, 6 December 2017Record date Friday, 8 December 2017Payment of dividend Monday, 11 December 2017
Shareholders will not be permitted to dematerialise or rematerialise their shares between Wednesday, 6 December 2017 and Friday, 8 December 2017, both days inclusive.
In terms of South African taxation legislation effective from 1 April 2012, the following additional information is disclosed:
• the South African local dividend tax rate is 20% (2016: 15%);• the net local dividend amount is 348 cents per share for shareholders liable to pay tax on dividends and
435 cents per share for shareholders exempt from such dividend tax;• the issued share capital of The SPAR Group Ltd is 192 602 355 ordinary shares; and• The SPAR Group Ltd’s tax reference number is 9285/168/20/0.
By order of the board
MJ HoganCompany Secretary
Pinetown14 November 2017
SPAR IAS BOOKLET_11230_V19_14NOV_SA_1800.indd 23 2017/11/14 19:00

GREYMATTER & FINCH # 11230
DIRECTORATE AND ADMINISTRATION
DIRECTORS: MJ Hankinson* (Chairman), GO O’Connor (Chief Executive Officer), MW Godfrey, WA Hook, MP Madi*, M Mashologu*, HK Mehta*, P Mnganga*, R Venter, CF Wells*
* Non-executive
Company Secretary: MJ Hogan
THE SPAR GROUP LTD (“SPAR” or “the company” or “the group”)Registration number: 1967/001572/06ISIN: ZAE000058517JSE share code: SPP
Registered office22 Chancery LanePO Box 1589Pinetown3600
Transfer secretariesLink Market Services South Africa (Pty) LtdPO Box 4844Johannesburg2000
AuditorsDeloitte & TouchePO Box 243Durban4000
SponsorOne CapitalPO Box 784573Sandton2146
BankersRand Merchant Bank, a division of FirstRand Bank LtdPO Box 4130The SquareUmhlanga Rocks4021
AttorneysGarlicke & BousfieldPO Box 1219Umhlanga Rocks4320
Websitewww.spar.co.za
SPAR IAS BOOKLET_11230_V19_14NOV_SA_1800.indd 4 2017/11/14 19:00

SPAR IAS BOOKLET_11230_V19_14NOV_SA_1800.indd 24 2017/11/14 19:00