the standard 2 jun05
TRANSCRIPT
8/8/2019 The Standard 2 Jun05
http://slidepdf.com/reader/full/the-standard-2-jun05 1/43

8/8/2019 The Standard 2 Jun05
http://slidepdf.com/reader/full/the-standard-2-jun05 2/43

8/8/2019 The Standard 2 Jun05
http://slidepdf.com/reader/full/the-standard-2-jun05 3/43

8/8/2019 The Standard 2 Jun05
http://slidepdf.com/reader/full/the-standard-2-jun05 4/43

8/8/2019 The Standard 2 Jun05
http://slidepdf.com/reader/full/the-standard-2-jun05 5/43

8/8/2019 The Standard 2 Jun05
http://slidepdf.com/reader/full/the-standard-2-jun05 6/43

8/8/2019 The Standard 2 Jun05
http://slidepdf.com/reader/full/the-standard-2-jun05 7/43
8/8/2019 The Standard 2 Jun05
http://slidepdf.com/reader/full/the-standard-2-jun05 8/43
8/8/2019 The Standard 2 Jun05
http://slidepdf.com/reader/full/the-standard-2-jun05 9/43

8/8/2019 The Standard 2 Jun05
http://slidepdf.com/reader/full/the-standard-2-jun05 10/43

8/8/2019 The Standard 2 Jun05
http://slidepdf.com/reader/full/the-standard-2-jun05 11/43
8/8/2019 The Standard 2 Jun05
http://slidepdf.com/reader/full/the-standard-2-jun05 12/43

8/8/2019 The Standard 2 Jun05
http://slidepdf.com/reader/full/the-standard-2-jun05 13/43
8/8/2019 The Standard 2 Jun05
http://slidepdf.com/reader/full/the-standard-2-jun05 14/43

8/8/2019 The Standard 2 Jun05
http://slidepdf.com/reader/full/the-standard-2-jun05 15/43
8/8/2019 The Standard 2 Jun05
http://slidepdf.com/reader/full/the-standard-2-jun05 16/43

8/8/2019 The Standard 2 Jun05
http://slidepdf.com/reader/full/the-standard-2-jun05 17/43
8/8/2019 The Standard 2 Jun05
http://slidepdf.com/reader/full/the-standard-2-jun05 18/43

8/8/2019 The Standard 2 Jun05
http://slidepdf.com/reader/full/the-standard-2-jun05 19/43
June 2005 The Standard MQD
Vol. 19, No. 2 The Newsletter of the Measurement Quality Division, American Society for Quality Page 19
congruent with increasing / enhancing ones com- prehension of a certification programs body of knowledge. Note: RUs must be substantiated bysupporting documentation to be valid. For eachrecertification activity there is a specific number of RUs allotted as well as a maximum number of RUsthat will be accepted for each activity. CCT recerti-fication requires a minimum of 18 RUs over a 3year period. Recertification activities, RU creditsand their maximum totals allowed are:
Table 1
Note: Employment RU credit must fall in the perti-nent certification(s) body of knowledge. All recer-tification activities must fall in the pertinent certifi-cation(s) body of knowledge or be directly job en-hancing/related. CEU is Continuing Education
Unit, FT is Full Time, PT is Part Time
Information about RU’s may be found at http://www.asq.org/cert/recert/rucredits/requirements.html .
Acceptable documentation for substantiating par-ticipation in a recertification activity includes, butis not limited to:
• Conference name badges, program agendas,attendance registration sheets • Past and present employment verification let-ters • Professional society meeting attendance re-ceipts • Letters of participation and/or continuing ser-
vice on professional society committees • Student transcripts • Training records—certificates, course outlines,employee training records, attendance rosters • Instructor records of courses taught (for in-structor credit) Letters from clients whom you have serviced (for self-employed)
Let us now discuss the recertification process. Therecertification process is essentially broken downinto three steps: 1) Documenting (logging) recerti-fication activities, 2) Obtaining documented evi-dence of participation and 3) Submitting them toASQ headquarters along with a completed Appli-cation for RU Credits Recertification. A RU Cred-its journal and Application for RU Credits Recerti-fication may be found at:
http://www.asq.org/cert/recert/rucredits/application.html
To make the ASQ recertification process as un- problematic as possible it is highly recommendedthat recertification activity attendees document(log) the activity and obtain documented evidenceof participation as soon as practical. This reducesthe chances of forgetting to document (log) the ac-tivity and increases the likelihood that documentedevidence of participation is obtainable (it is oftennext to impossible to obtain documented evidence
(Continued from page 8)
(Continued on page 22)
8/8/2019 The Standard 2 Jun05
http://slidepdf.com/reader/full/the-standard-2-jun05 20/43
June 2005 The Standard MQD
Vol. 19, No. 2 The Newsletter of the Measurement Quality Division, American Society for Quality Page 20
pointment as a Master Chief Instructor at the DODSchool at the Lowry AFB, establishing his qualifi-cations for expressing the facts he was presentingherein.
——“I am qualified to offer an opinion onthe differ-ence between education and training. At all times the purpose of the Lowry CalibrationSchool was to train Calibrators. ..”——
———“Our purpose and goal as DOD Cali-bration Instructors was to train a CalibrationTechnician to perform a routine calibration, and how to document that calibration properly accord-ing to the individual service's requirements. Whenthe Calibrator graduated from Lowry AFB, he wascapable of entering a calibration laboratory and calibrating a piece of test equipment. Within that
framework, we were very successful. With time and experience, that trainee could become a very com-
petent Calibrator. It has never been the intention,the goal or the mission of this or any DOD training
facility to educate Metrologists. It must be firmlystated that the DOD schools are training facilitiesand not educational institu-tions. It must be re-membered that despite the location of the Lowryschool on an Air Force facility, it is not an Air Force School, it is a DOD school delegated to the
Air Force to operate for the benefit of whichever organizations DOD may designate.”——
——“Equally important is what we did not train them to do . We did not train them to write acalibration procedure; we did not train them todesign a calibration process; we did not train themin error analysis, we did not train them in deter-mining calibration intervals; we did not teach themmathematics, chemistry or phys-ics; we did not
teach them to be engineers or Metrologists.”— — —
——“Military trained Calibrators should be proud of their title and training. If they want tobecome Metrologists, they should go back toschool and study engineering or a science and earnan appro-priate degree. I realize that there are not many institutions of higher learning educating in-dividuals to become Metrologists. I have to admit that I do not know of a single college or university
(Continued from page 14) t h a t o f f e r s a f o u r - y e a r d e g r e ein Metrology. However, a formal technical/
professional degree can provide the proper back-ground to enable one to become a Metrologist withadditional study and experience.”——
——“I too have been following Butler Commu-nity College over the years. I realize that it is a thismoment only a two year institution but, it gives mehope that at last some reputa-ble institution will at last take on the task of providing indus-try with creditable, Professional Metrologists.This country desperately requires formally edu-
cated Professional Metrolo-gists.”——
Remember that letter was written to me nine yearsago and that none of the italicized text above ismine. It all came from the best possible authority.If any of you should like a copy of the completetext, just ask and I shall be happy to send you acopy. However, this was not the only thing thatClaude wrote. Most of you should be able to re-member that in circa 1991-92 friendly aircraft shotdown a US Army helicopter over Northern Iraqkilling all onboard including several importantKurdish civilian officials who were traveling as
passengers. Using his personal expertise in IFFtechnology and data published through the severalnews sources, Claude, sitting in his home in Ken-tucky, was able to analyze the probable cause of this failure. He wrote a “White Paper” on the sub-
ject focusing the blame directly on the incompati- ble calibration policies among the three services.This document eventually found its way into thehands of a US Senator who was so impressed thathe had it read into the Congressional Record . Thisaction caused Congress to force the US Air Forceto cease the cover up and to openly investigate. If any of you should like a copy of that “White Pa-
per”, I will be pleased to oblige.
A couple of issues ago, I told you about Professor Louis Hart, of the West Liberty State College, inWest Liberty, West Virginia, and his efforts to es-tablish a Measurement Science Curriculum withinthat institution. I asked each of you to write him aletter supporting his efforts; a letter that he mightuse to support those efforts before his academicmanagement. Your response was underwhelming—
(Continued on page 21)

8/8/2019 The Standard 2 Jun05
http://slidepdf.com/reader/full/the-standard-2-jun05 21/43
June 2005 The Standard MQD
Vol. 19, No. 2 The Newsletter of the Measurement Quality Division, American Society for Quality Page 21
shame on you all! I am told that there are in excessof ten thousand potential readers of this column; of that number, only one individual took the time towrite Dr. Hart a letter of support. Our congratula-tions to STEVE SCOTT of the Duffy Tool &Stamping Co., of Muncie, Indiana. Steve was theonly one to write such a letter, he copied me and afine letter it was. Thank you, Steve, and I knowthat Dr. Hart thanks you also.
Now let us get down to reviewing that new book that I promised at the outset of this column:
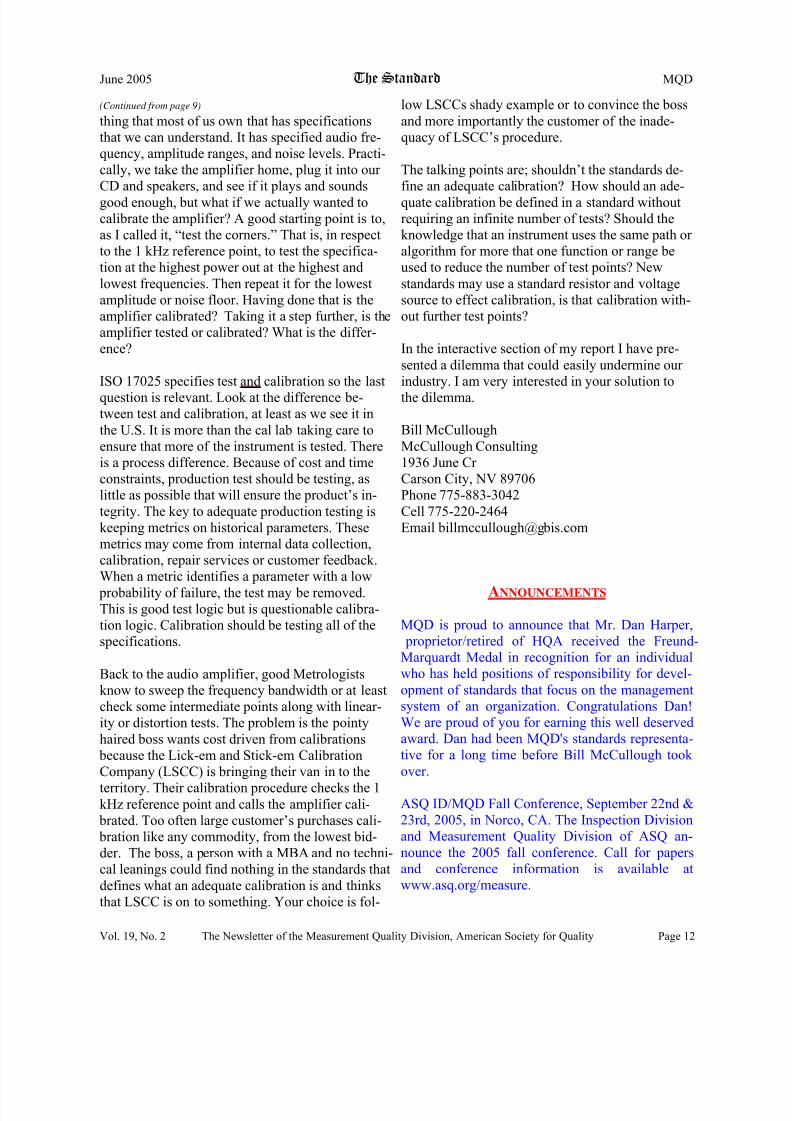
Title: METROLOGY HAND-BOOK, THE
Editor: Bucher, Jay L.ISBN: 0-87689-620-3LOC#: 2004-003464Publisher: ASQ Quality Press
Milwaukee, WisconsinCopywrite: 2004Price: $95.00 USD List Price; $75.00
to ASQ Members if orderedfrom ASQ headquarters. [It isimportant to note that our ownMQD receives a sizable rebatewhen ordered from ASQHeadquarters.] (Amazon price$53.55, but no rebate to MQD)
You may recall a couple of issues ago I reviewed a book with nearly the same title. i.e., Metrology, theScience of Measurement Handbook by NobuoSuga. However, the resemblance ends there. Mr.Suga’s work is an excellent loose leaf bound, ‘howto do it’, Mitutoyo ‘catalogue cum text book’, lim-ited to the discipline of Dimensional Metrology.An excellent elementary text in itself, but of anentirely different breed than what we are reviewinghere.
Our tome of interest is a hardbound volume con-sisting of 544 pages and 98 illustrations/ figures/tables, (with a supplemental CD ROM). It is not atextbook in the customary sense but rather a com-
pendium of monographs covering a broad spectrumof disciplines, by eight different authors, compiled,unified, and edited by Mr. Bucher. It consists of seven major sections or parts, divided into forty-two chapters. It also includes seven appendices, a
(Continued from page 20) bibliography, and biographies of the eight contrib-uting authors.At first glance, the sheer scope and depth of theinventory of ingredients comprising this volumecan be overwhelming especially to the neophyte
beginning or contemplating a career in Metrology.But when one, already an advanced advisee in theMeasurement Sciences, the author’s and Editor’sapproach becomes quite logical. Part I gives a brief historical background of the science as is usuallydone in most texts on the subject. Part II in sixteenchapters covers a detailed overview of Quality Sys-tems applicable to Metrology practice, includingrecommendations of certificates, labels, standards,calibration intervals, traceability, records, and other applicable documentation.
Part III brings another five chapters covering the basic Concepts of Metrology a subject vital to any-one organizing or managing a viable Metrologyorganization. Part IV provides a refresher course of another five chapters in the use of Mathematics andStatistics as applied to the practice of Metrology.Part V in a single chapter discusses the use of thosemathematical concepts in the determination of Measurement Uncertainty. Part VI entitled Meas-urement Parameters provides an introduction toseveral of the more common technical disciplineswithin the extremely broad scope of Metrology
The subject matter of Part VII, “MANAGING AMETROLOGY DEPARTMENT OR CALIBRA-TION LABORATORY” could have been a entireshelf of ponderous volumes in itself, but the author,Mr. Bucher himself has managed to condense itinto seven chapters of thirty-six pages. The in-cluded CD-ROM contains much of the resourcematerial included in the tables in the hard copy (Ihave already copied it to the Reference Folder onmy hard drive for quick reference when I am writ-ing.) The only major complaint I have found so far is in Chapter 22, wherein his explanation of howwork around specified but unavailable equipment,he specifically names actual items of equipment bymanufacture and model number. Such specific des-ignations, even allowing that the mentioned gear isobsolete and no longer available on the market, isnever the less a tacit recommendation for that spe-cific item. Specific recommendations, tacit or oth
(Continued on page 22)
8/8/2019 The Standard 2 Jun05
http://slidepdf.com/reader/full/the-standard-2-jun05 22/43
June 2005 The Standard MQD
Vol. 19, No. 2 The Newsletter of the Measurement Quality Division, American Society for Quality Page 22
(Continued from page 21)
erwise, of any commercial article in references of this sort are quite out of line.
This book is obviously not a primer, that is an ele-mentary how to do it text for the raw green neo-
phyte in the Metrology/Calibration field; however,it could be a very desirable item for such an indi-vidual to keep nearby if he intends to upgrade him-self. On the other hand, I can seriously recommendthat it be on the bookshelf of every Senior Calibra-
tor, Senior Metrology Technician, MetrologicalEngineer, Metrologist, and AdministrativeMetrologist. And don’t forget, order it from ASQHeadquarters.
This column has been a little longer than usual, butas I said in the beginning, we had many things todiscuss this time. If you would like either of thetwo documents I mentioned earlier or, want to ar-gue with me, I can be reached at the same oldstand. And before I forget it, please write a letter of encouragement to Professor Hart at West Liberty
State College and copy me.
Phil Painchaud1110 West Dorothy DriveBrea, CA. 92821-2017Phone: 714-529-6604FAX: 714-529-1109E-Mail:
[email protected] or [email protected]
(Continued from page 3)
I leave the division with good experiences and alittle wiser. I will not be completely gone as I willvolunteer my duties as Program Chair arrangingconferences and hosting sessions at other confer-ences.
It has been a pleasure serving you.
Sincerely,Dilip A. ShahE = mc3 Solutions197 Great Oaks Trail #130Wadsworth, Ohio 44281-8215Voice (330) 328-4400 / Fax (330) 336-3974E-mail: [email protected]
of participation years after a conference / meetingwas attended). Remember to get completion certifi-cates for any corporate mandated courses such aselectrical safety and hazardous material trainingthat may be germane to a certifications body of knowledge. Also many conferences and seminarshave been granted CEU credits by academic insti-tutions and, if applicable, can be used for recertifi-cation credits (check with conference/seminar ad-ministrators). Lastly, take advantage of multimediatraining and meeting opportunities that can be usedfor recertification credit such as web casts and netmeetings. The key to a relatively painless ASQrecertification experience is to take advantage of recertification credit opportunities and to documentthem as soon as possible
(Continued from page 19)
Another optical illusion…This is the Ouchi illusion, named after Japaneseartist Hajime Ouchi. As you scan your eyes over the figure the center disc appears to move.
Volunteers aren't paid...Not because they're worthless,but because they're priceless
Please consider volunteering with MQD. If anyonehas questions or needs more information, contactany officer or committee chair.
Thank You!

8/8/2019 The Standard 2 Jun05
http://slidepdf.com/reader/full/the-standard-2-jun05 23/43
June 2005 The Standard MQD
Vol. 19, No. 2 The Newsletter of the Measurement Quality Division, American Society for Quality Page 23
Please join us for the Measurement Quality Division Sponsored session (Session 7C: 10:45 AM – 12:15PM) at National Conference of Standards Laboratory International (NCSLI) on Wednesday, August 10,2005. For information about the NCSLI Conference, please see the conference brochure elsewhere in thenewsletter or visit http://www.ncsli.org/conference/2005/
Speaker: Keith Bennett Title: Understanding Test Uncertainty Ratio Helps Improve Calibration Service
Abstract: Test and measurement equipment (T&ME) must be periodically calibrated to ensure it's op-erating within its specified parameters. Of course, the uncertainty of the system used to cali-
brate the equipment shouldn't add appreciable error to this process. As TURs decrease theconfidence of the UUT being in tolerance also decreases.
Speaker: Graeme Payne
Title: The Metrology Handbook: Experiences of a Virtual Team
Abstract: Publication of The Metrology Handbook in April 2004 marked the end of a year-long teameffort. While working on the book itself, the team members also learned a lot about working
effectively together as members of a nationwide virtual team, use of enabling technologythat did not exist a few years earlier, and the intricate details of writing for book publication.All of the team members are actively working in metrology as engineers, technicians, man-agers, consultants, educators or auditors; none have written anything longer than a technicalreport before. They were able to deliver the completed work on time, and the book is now inits second printing. The things they learned about the process of working on this project can
be applied in many other areas. Speaker: Dilip Shah
Title: ASQ’s Certified Calibration Technician Exam Update
Abstract: The ASQ’s Certified Calibration Technician (CCT) Exam has now been offered for morethan two years and over 400 candidates have passed the exam since its first offering in Juneof 2003. This presentation provides the report on the exam progress, industry acceptanceand the body of knowledge covered. Misconceptions on the expectation of the exam are pre-sented. The Measurement Quality Division’s involvement with the exam sponsorship, de-velopment and exam volunteer opportunities are discussed.
Speaker: Christopher L. Grachanen
Title: Metrology Job Description Initiative
Abstract: In 2005, the U.S. Department of Labor, Bureau of Labor Statistics will be soliciting inputfor updates and additions to the Standard Occupational Classification (SOC) listing for thenext formal release. The SOC system is used by all Federal statistical agencies to classifyworkers into occupational categories for the purpose of collecting, calculating, and dissemi-nating data. The SOC is updated every ten years. The last SOC update was completed in2000. The SOC's current job descriptions for calibration practitioners are inaccurate in com-municating job expectations. Educators use the SOC to provide students with career guid-ance information. Without faithful job descriptions, it is unlikely that prospective candidateswill be steered into the Metrology field by educators. In addition, demographic information,such as how many folks are in the Metrology profession, how many folks are leaving the
profession, etc., can not be accurately determined. In an effort to remedy these shortcomingsthe American Society for Quality (ASQ) Measurement Quality Division (MQD) has teamedup with the National Conference of Standards Laboratories International (NCSLI) to createthe Metrology Job Description (MJD) Initiative.

8/8/2019 The Standard 2 Jun05
http://slidepdf.com/reader/full/the-standard-2-jun05 24/43
June 2005 The Standard MQD
Vol. 19, No. 2 The Newsletter of the Measurement Quality Division, American Society for Quality Page 24
CORRECT AND IMPROVED GAGE R&R MEASUREMENT STUDIES*By Dr. Donald S. Ermer
Why Do We Need Correct Quality Measurement Studies?
Many manufacturers are using statistical tools like Statistical Process Control(SPC) and Design of Experiments (DOE) to monitor and improve productquality and process productivity However, if the data collected are not accu-rate and precise, they do not represent the true characteristics of the part or
product being measured even though organizations are using the quality im- provement tools correctly. Therefore, it is very important to have a validquality measurement study beforehand to ensure that the gage R&R data col-lected are accurate and precise, and that the power of SPC and DOE are fullyutilized. Accuracy, i.e., no bias, is the function of calibration and is per-
formed before a correct measurement study of the precisions of the gage and its operators.
In this paper, the “Gage” R&R study in the AIAG manual (1) is reviewed for its weakness in determin-ing the true capability of the different parts of the measurement system. Then the paper uses a geometri-cal approach to describe the components of the total measurement variance. This shows why the stan-dard deviations or measurement errors of the equipment, appraiser, and product in the AIAG Method arenot additive and cannot be compared directly in a ratio. A useful worksheet for correctly executing ameasurement process capability study is also provided, which combines the advantages of the improvedmeasurement study discussed in the paper. The proposed method also uses the correct d 2* values (d 2 when k<25) and a small correction factor in the Average Range Method for the product or part variation.
The Gage R&R Study in the AIAG Manual
The Repeatability and Reproducibility (R&R) study in the AIAG Manual (1) uses a data collection sys-tem that is very well structured and very helpful in collecting the proper data. However, the data arethen used to calculate the standard measurement errors or standard deviations of the equipment, ap-
praiser and product. The total measurement error or standard deviation is then obtained by taking thesquare root of the sum of the squares of the equipment, appraiser and the product standard deviations.
Next, the measurement ratios are calculated by comparing the equipment and the appraiser standard de-viations to the total measurement error or total standard deviation. These ratios are used to see how sig-nificant the effects of the equipment, appraiser, and the product error variations are on the total measure-ment system. Table 1 shows a summary of all the calculations that are used in this method, but only onestandard deviation is used, instead of finding a 95% Confidence Interval as in (1).
Unfortunately, there are two errors in the above AIAG R&R study. The first one is a minor incorrectcalculation of the part variation; i.e., there should be a correction factor which accounts for the variationinduced by the measuring equipment. If this correction factor (although it may be very small) is not fig-ured into the calculation, then equipment variation would be “counted double” in the total variation.
The second and most significant error is that the final Variation Ratios (e.g., %EV, %AV, and %PV) arecalculated using standard deviations instead of variances, and the results obtained exaggerates the pro-
portional effects of the equipment, appraiser, and part variation, as shown in the second column of Table2, the AIAG Method. Therefore, this incorrect type of study cannot provide an index of whether thecomponents of the measurement process are capable for the part or product under study.
*A more complete paper by Ermer and Yang E-Hok was originally published in the Winter 1997 issue of TheStandard , and then was republished in the June 1998 edition of Contributed Publications of the MQD.

8/8/2019 The Standard 2 Jun05
http://slidepdf.com/reader/full/the-standard-2-jun05 25/43
June 2005 The Standard MQD
Vol. 19, No. 2 The Newsletter of the Measurement Quality Division, American Society for Quality Page 25
The Correct Calculation of R&R
The measurement equipment error and product variation can be related by the following equation, as-suming that measurement error is independent of the product variation within a range defined by thenatural process limits for the specified product.
(1)where
= Variance of Actual Product Measurement
= True Variance of Product
= Variance of Measurement Equipment Error
The above relationship can also be represented by a right triangle as shown in Figure 1. For example, if
sm=5, s e=3, and s p=4, then 3 2 + 42 = 52, and , which is NOT equal to
, and which is NOT equal to . This is a simple illustra-
tion of some of the misleading results for the final variation ratios in the AIAG method. Thus, a unit
change in either the True Product Standard Deviation ( σ p), or the standard deviation for Measurement
Equipment Error ( σ e), will not result in a unit change in the Standard Deviation for the Actual Product
Measurements ( σ m). On the other hand, one unit change in the True Product Variance ( ) or
Measurement Equipment Error Variance ( ) will respond to one unit change in the Variance of
Actual Product Measurement ( ), since , i.e., .
e pm 222 σ σ σ +=
m2
σ
p2
σ
e2
σ
36.0259
53
2
2
==
64.02516
54
and;60.053
2
2
=== 8.054 =
p2
σ
e2
σ
m2
σ e pm222
σ σ σ += e pmσ σ σ +≠

8/8/2019 The Standard 2 Jun05
http://slidepdf.com/reader/full/the-standard-2-jun05 26/43
June 2005 The Standard MQD
Vol. 19, No. 2 The Newsletter of the Measurement Quality Division, American Society for Quality Page 26
This shows that part of the results of the Gage R&R Report in the AIAG method is incorrect and there-fore the person doing the study should use variances to find the true % R&R ratio values instead of thestandard deviations where:
(2)
(3)and = Average of all of the within ranges of the trials for each part
= Range of the actual parts averages
= 1.128 and 1.6926 for 2 and 3 trials respectively from Table 5 (assuming n=10 parts andk=3 appraisers)
= 2.48 and 3.18 (see at bottom of Table 5) for 5 and 10 parts respectively and k=1; andsee Table 5 for other d 2* values (2).
Thus, if a correct R&R measurement analysis is not used, all the on-line or off-line quality improvementefforts could lead to incorrect results and very limited product quality improvements.
Introduction of Appraiser Variation (A.V.) Although the above proper variances indicate the capability of the measurement process, they are onlygood when one operator is measuring the product, i.e., the appraiser variance is assumed to be insignifi-cant. In actual situations, it is very difficult to isolate or eliminate the appraiser error in the measure-ment process. Therefore, it is necessary to include the operator or appraiser variance(BC), as shown inFigure 2, where:
= Appraiser/operator variation (4)
= Range of the operator averages
= 1.41 and 1.91 (see first row of Table 5) for 2 and 3 operators respectively.
With the addition of appraiser variation, the relationship among all the variances is changed as follows
(4): (5)
ee d
WR
,2
ˆ =σ
md
R pm
,2*
ˆ =σ
WR p R
ed ,2
md
,2
*
0,2*ˆ 0
0
d
R=σ
0 R
0,2*d
oe pm2222
σ σ σ σ ++=′
8/8/2019 The Standard 2 Jun05
http://slidepdf.com/reader/full/the-standard-2-jun05 27/43
June 2005 The Standard MQD
Vol. 19, No. 2 The Newsletter of the Measurement Quality Division, American Society for Quality Page 27
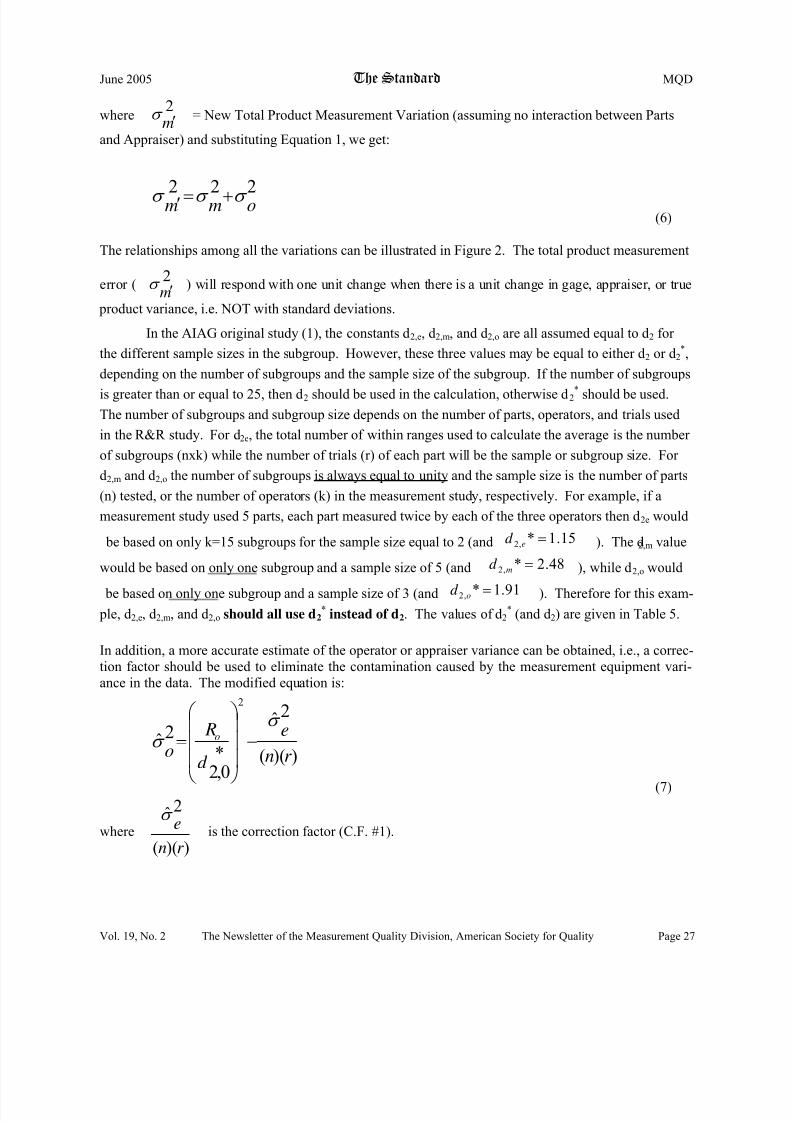
where = New Total Product Measurement Variation (assuming no interaction between Parts
and Appraiser) and substituting Equation 1, we get:
(6)
The relationships among all the variations can be illustrated in Figure 2. The total product measurement
error ( ) will respond with one unit change when there is a unit change in gage, appraiser, or true
product variance, i.e. NOT with standard deviations.
In the AIAG original study (1), the constants d 2,e, d2,m, and d 2,o are all assumed equal to d 2 for the different sample sizes in the subgroup. However, these three values may be equal to either d 2 or d 2
*,depending on the number of subgroups and the sample size of the subgroup. If the number of subgroups
is greater than or equal to 25, then d 2 should be used in the calculation, otherwise d 2* should be used.The number of subgroups and subgroup size depends on the number of parts, operators, and trials usedin the R&R study. For d 2e, the total number of within ranges used to calculate the average is the number of subgroups (nxk) while the number of trials (r) of each part will be the sample or subgroup size. For d2,m and d 2,o the number of subgroups is always equal to unity and the sample size is the number of parts(n) tested, or the number of operators (k) in the measurement study, respectively. For example, if ameasurement study used 5 parts, each part measured twice by each of the three operators then d 2e would
be based on only k=15 subgroups for the sample size equal to 2 (and ). The d 2,m value
would be based on only one subgroup and a sample size of 5 (and ), while d 2,o would
be based on only one subgroup and a sample size of 3 (and ). Therefore for this exam- ple, d 2,e, d2,m, and d 2,o should all use d 2
* instead of d 2. The values of d 2* (and d 2) are given in Table 5.
In addition, a more accurate estimate of the operator or appraiser variance can be obtained, i.e., a correc-tion factor should be used to eliminate the contamination caused by the measurement equipment vari-ance in the data. The modified equation is:
(7)
where is the correction factor (C.F. #1).
m′2
σ
omm 222 σ σ σ +=′
m′2
σ
15.1*,2=
ed
48.2*,2=
md
91.1*,2 =od
))((
2ˆ
0,2*
2ˆ
2
r ne
d
Ro
oσ
σ −⎟
⎟
⎟
⎠
⎞
⎜
⎜
⎜
⎝
⎛ =
))((
2ˆ
r ne
σ

8/8/2019 The Standard 2 Jun05
http://slidepdf.com/reader/full/the-standard-2-jun05 28/43
June 2005 The Standard MQD
Vol. 19, No. 2 The Newsletter of the Measurement Quality Division, American Society for Quality Page 28
The estimation of the true product or part variation can be improved by also including a correction factor in its calculation, although it will not be large. The correction factor is similar to C.F. #1 but with a dif-ferent denominator in the last term. The improved estimation of the part or product variation is as fol-lows:
(8)
where is the relatively small correction factor (C.F. #2)
Given the changes above, the new measurement study will be more accurate, as well as correct.
Summarizing the Results Obtained by Different R&R Studies
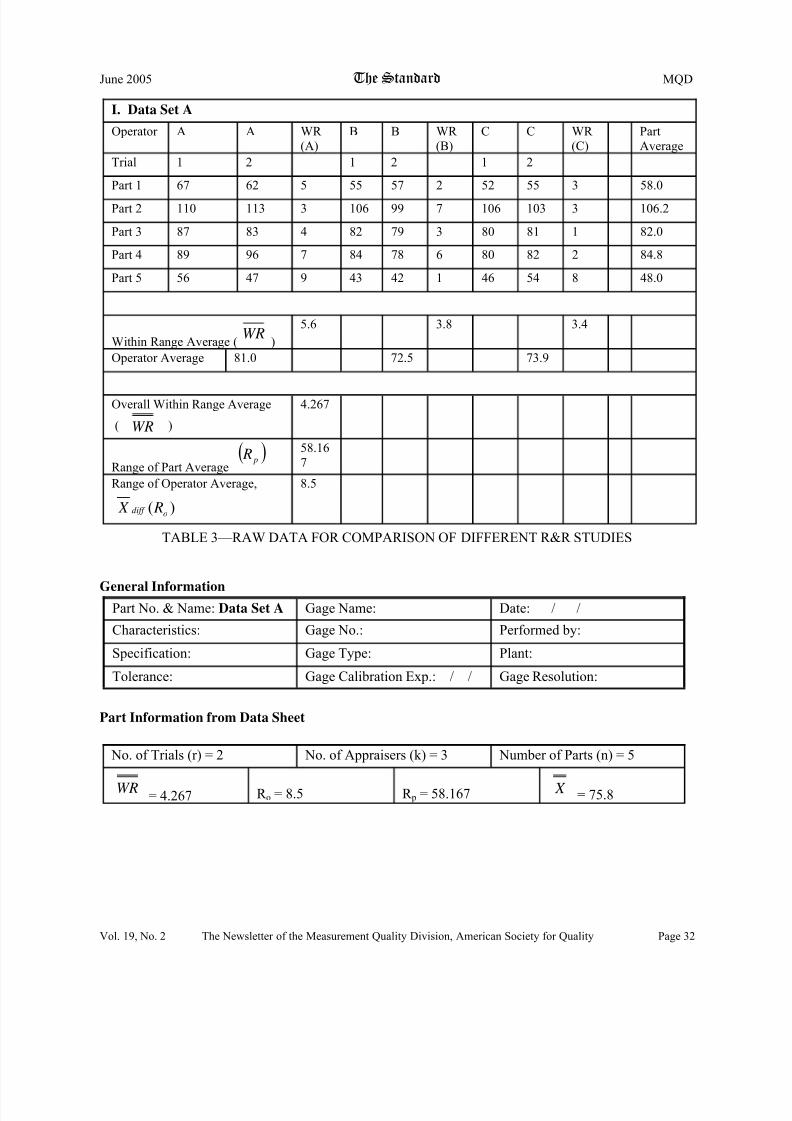
Table 2 shows the results of using different Gage R&R studies on the same set of measurement datafrom Table 3 (Data Set A), where the ANOVA Method is the most accurate since it uses all of the data,not just the ranges. The last column shows the correct percent variations calculated from the NewMethod described in the previous section. It should be noted that with the New Method, the % Repeat-ability and the % Reproducibility and % Part Variation add up to 100%, which is not true with the AIAGMethod (1). Comparing the AIAG R&R Method (1) with the ANOVA (for the Random Effects Model)Method, which uses all of the data for its analysis, and the NEW method, it can be seen that the GageR&R from AIAG exaggerates the effect of the percentages for E.V., A.V. and P.V.; that is, the %E.V.,%A.V., and %P.V. as obtained in the AIAG R&R study are incorrectly greater than the actual results, asshown in the second column. This is due to their incorrect approach of comparing the standard devia-tions to the total standard deviation versus the correct approach of using the additive law of variances.
This mistake in the AIAG R&R study could lead to a judgment that the measurement process is incapa- ble when the measurement process is actually capable (4). Thus, mistakes like these will mislead theorganization to direct their improvement effort to improve a capable measurement process, while thesame effort should be used in reducing the process or product variance.
The results of the ANOVA Method and New Method agreed closely. This can be seen by comparing theresults from the ANOVA method with the New Method in Table 2, i.e., the third column versus thefourth column. Therefore the NEW Method should be employed for a proper measurement processstudy, as given in Table 4.
Solving the Identified Problem Areas of the Measurement Process
The next step will be solving any identified problems and improving the measurement process capabilityor resolution (6). For a measurement process with a problem in the equipment/gage variation area, thereare several steps to check for the root cause of the problem. The first step is to check whether the meas-urement system has an adequate number of decimal places; i.e., a resolution good enough for measuringthe product variation. If the actual product measurement unit is larger than the gage standard division or unit, the measurement unit is considered inadequate for the product. That is, the gage is not capable to
perform a measurement that requires such accuracy. If this problem of resolution occurs, one must con-sider using a measurement unit that is smaller than the gage standard division.
))((
2ˆ
,2*
2ˆ
2
r k e
md
R p
p σ σ −
⎟
⎟⎟
⎠
⎞
⎜
⎜⎜
⎝
⎛ =
))((
2ˆ
r k e
σ
8/8/2019 The Standard 2 Jun05
http://slidepdf.com/reader/full/the-standard-2-jun05 29/43
June 2005 The Standard MQD
Vol. 19, No. 2 The Newsletter of the Measurement Quality Division, American Society for Quality Page 29
However, if the measurement unit cannot be changed, then the organization has to use an alternate gageor measuring device with better resolution to perform the measurement. For example, if the measure-ment unit of a data set is 0.01, then the gage standard division must be smaller than 0.01, e.g., .001, inorder to have a resolution good enough for the study.
Another possible area in the improvement of gage accuracy is to calibrate the gage on a regular basis.Although most of the measurement gage manufacturers provide calibration services to their customers, itis the gage users’ responsibilities to make sure their gages are calibrated before a Gage R&R Study. Theusers should also make sure that their gages are performing at the standard claimed by the gage manu-facturers (7).
When an operator bias effect is detected, the problem can be temporarily solved by offsetting the amountof bias to all the measurements made by that particular appraiser. However, the long term solution is tounderstand why that appraiser/operator has a bias on all the measurements; whereas, when an appraiser inconsistency effect is detected, the questionable operator is usually having problems using the equip-ment properly. For example, they may not align the product correctly before taking a measurement or have a problem reading the finer marks on the gage. Also, they may not have clear instructions onwhich part of the product should be measured. Many of these problems are the result of insufficienttraining of the appraiser or an ineffective training program. Therefore, either the operator will need toundergo a training program or a new training program will be needed for effective gage measurements,depending on the situation.
If the measurement problems cannot be identified by the above methods, there are many tools availableto help finding the root cause. Some examples are DOE and some of the other basic quality tools (e.g.,Fishbone diagram, Check sheet, Scatter Plot, Pareto Diagram, etc.). No matter what type of quality toolis used, it is always important to have the personnel that are affected by the problem involved in the
problem solving process. This will provide a better understanding of the measurement problem and fa-cilitate communications within the company.
Summary
A graphical analysis helps in understanding the components of the measurement system, and their rela-tive importance. Current AIAG R&R methods may be misleading, and should be modified according tothe methods given in this paper. At the same time, with the widespread availability of computers, appro-
priate software could be used to calculate the correct d 2* values and the correction for part variation as a basis for a more precise variable measurement study. Thus, this paper shows how important reliablemeasurement data and its analysis is, and hopefully will help all quality conscientious organizations fur-ther improve the quality of their products and the productivity of their processes.
Donald S. Ermer, Ph.D., P.E., & CMfg.E.Procter & Gamble Bascom Professor Emeritus in Total QualityDepartments of Industrial & Systems Engineering and Mechanical EngineeringUniversity of Wisconsin-Madison1513 University AvenueMadison, WI 53706Phone: 608-262-2557FAX: 608-265-2316Email: [email protected]

8/8/2019 The Standard 2 Jun05
http://slidepdf.com/reader/full/the-standard-2-jun05 30/43

8/8/2019 The Standard 2 Jun05
http://slidepdf.com/reader/full/the-standard-2-jun05 31/43
June 2005 The Standard MQD
Vol. 19, No. 2 The Newsletter of the Measurement Quality Division, American Society for Quality Page 31
Table 1—SUMMARY OF EQUATIONS (FOR ONE STANDARD DEVIATION) USED INTHE AIAG GAGE R&R STUDY(1)
TABLE 2—SUMMARY OF RESULTS FROM DIFFERENT R&R STUDIES(DATA SET A IN TABLE 3)
Repeatability-EquipmentVariation (E.V.)
1*.. K WRV E ==Avg. of the within range of the trials of
each part ( )
WR
e R
%E.V.=100[E.V./T.V.] Trials (r)
K 1
2
4.56
3
3.05Reproducibility-Appraiser Variation (A.V.) ( )
r nV E
K X V A Diff *
.).(*..
22
2−= = Range of the operator averages (R 0)
Diff X
%A.V.=100[A.V./T.V.]n=number of partsr=number of trials
Operators (k)K 2
23.65
32.70
Part Variation(P.V.)
P.V.=R p*K 3 R p=Range of the part averages
%P.V.=100[P.V./T.V.] Parts (n)K 3
52.08
101.62
Repeatability
and Reproduci- bility (R&R)
R&R=%R&R=100[R&R/T.V.]
22
.).(.).( V AV E + %R&R<10%--process is capable
10%<R&R<20%--barely capableover 20%--requires improvement
Total Variation(T.V.)
T.V.=22 .).()&( V P R R +
MEASUREMENTUNIT ANALYSIS
I
AIAG Method
II
ANOVA (uses allof the data)
III
NEW Method(using d 2
*, andVariances)
IV E.V. 3.783 4.41 3.710
A.V. 4.286 3.50 4.293
R&R 5.717 5.63 5.674
P.V. 23.45 23.05 23.43
T.V. 24.13 23.71 24.11
%(E.V./T.V.) 15.68% 3.45% 2.45%
%(A.V./T.V.) 17.76% 2.18% 3.09%
%(P.V./T.V.)
TOTAL
97.18%
”130.62%”
94.37%
100.00%
94.46%
100.00%
8/8/2019 The Standard 2 Jun05
http://slidepdf.com/reader/full/the-standard-2-jun05 32/43
June 2005 The Standard MQD
Vol. 19, No. 2 The Newsletter of the Measurement Quality Division, American Society for Quality Page 32
TABLE 3—RAW DATA FOR COMPARISON OF DIFFERENT R&R STUDIES
General Information
Part Information from Data Sheet
I. Data Set A
Operator A A WR (A)
B B WR (B)
C C WR (C)
PartAverage
Trial 1 2 1 2 1 2
Part 1 67 62 5 55 57 2 52 55 3 58.0
Part 2 110 113 3 106 99 7 106 103 3 106.2
Part 3 87 83 4 82 79 3 80 81 1 82.0
Part 4 89 96 7 84 78 6 80 82 2 84.8
Part 5 56 47 9 43 42 1 46 54 8 48.0
Within Range Average ( )WR5.6 3.8 3.4
Operator Average 81.0 72.5 73.9
Overall Within Range Average
( )WR
4.267
Range of Part Average( ) p R 58.16
7
Range of Operator Average,
)( odiff R X
8.5
Part No. & Name: Data Set A Gage Name: Date: / /
Characteristics: Gage No.: Performed by:
Specification: Gage Type: Plant:
Tolerance: Gage Calibration Exp.: / / Gage Resolution:
No. of Trials (r) = 2 No. of Appraisers (k) = 3 Number of Parts (n) = 5
= 4.267 WR R o = 8.5 R p = 58.167 = 75.8 X

8/8/2019 The Standard 2 Jun05
http://slidepdf.com/reader/full/the-standard-2-jun05 33/43
June 2005 The Standard MQD
Vol. 19, No. 2 The Newsletter of the Measurement Quality Division, American Society for Quality Page 33
TABLE 4—OUTPUT FOR “NEW” METHOD
Measurement Unit Analysis
Repeatability—Equipment Variation (E.V.)
E.V. == 4.267/1.15 = 3.71 = σ e
ed WR ,2*/
%45.2100)11.24()710.3(
100.).(.).(
2
2
2
2
=×=×V T V E
Reproducibility—Appraiser Variation (A.V.)
A.V. =
== 4.293 = σ o
⎟⎟
⎠
⎞⎜⎜
⎝
⎛ ×
−⎟⎟
⎠
⎞⎜⎜
⎝
⎛
r nV E
d R
o
o2
2
,2
..*
⎟ ⎠ ⎞
⎜⎝ ⎛ −⎟
⎠ ⎞
⎜⎝ ⎛
1076.13
91.15.8
2
%09.3100)11.24()293.4(
100.).(.).(
2
2
2
2
=×=×V T V A
Repeatability and Reproducibility (R&R)
R&R =
== 5.674
22 .... V AV E +
22 )293.4()710.3( +
%54.5100)11.24()674.5(
100.).(
)&(2
2
2
2
=×=×V T R R
Product or Part Variation
P.V. =
== 23.43 = σ p
⎟⎟ ⎠ ⎞⎜⎜
⎝ ⎛ ×−⎟⎟ ⎠
⎞⎜⎜
⎝ ⎛
r k V E
d R
m
p2
2
,2
..*
⎟ ⎠ ⎞
⎜⎝ ⎛ −⎟
⎠ ⎞
⎜⎝ ⎛
676.13
48.2167.58
2
%46.94100
)11.24(
)43.23(100
.).(
.).(2
2
2
2
=×=×V T
V P
Total Variation
T.V. =
== 24.11
( ) 22 .).(& V P R R +
22 )43.23()674.5( +
Check: 94.46% + 3.09% + 2.45% = 100%

8/8/2019 The Standard 2 Jun05
http://slidepdf.com/reader/full/the-standard-2-jun05 34/43
June 2005 The Standard MQD
Vol. 19, No. 2 The Newsletter of the Measurement Quality Division, American Society for Quality Page 34
TABLE 5—CONSTANTS FOR CONVERTING A RANGE TO A STANDARD DEVIATION
Values of d 2*, d2, and d 3 Sample Size (n)
Number of subgroups (k)
2 3 4 5 6 7
1 1.41 1.91 2.24 2.48 2.67 2.83 2 1.28 1.81 2.15 2.40 2.60 2.77 3 1.23 1.77 2.12 2.38 2.58 2.75 4 1.21 1.75 2.11 2.37 2.57 2.74 5 1.19 1.74 2.10 2.36 2.56 2.73 6 1.18 1.73 2.09 2.35 2.56 2.73 7 1.17 1.73 2.09 2.35 2.55 2.72 8 1.17 1.72 2.08 2.35 2.55 2.72 9 1.16 1.72 2.08 2.34 2.55 2.72
10 1.16 1.72 2.08 2.34 2.55 2.72 11 1.16 1.71 2.08 2.34 2.55 2.72 12 1.15 1.71 2.07 2.34 2.55 2.72 13 1.15 1.71 2.07 2.34 2.55 2.71 14 1.15 1.71 2.07 2.34 2.54 2.71 15 1.15 1.71 2.07 2.34 2.54 2.71 16 1.15 1.71 2.07 2.34 2.54 2.71 17 1.15 1.71 2.07 2.34 2.54 2.71
18 1.15 1.71 2.07 2.33 2.54 2.71 19 1.14 1.70 2.07 2.33 2.54 2.71 20 1.14 1.70 2.07 2.33 2.54 2.71 25 1.14 1.70 2.07 30 1.14 1.70 50 1.13
d2 1.128 1.6926 2.0588 2.3258 2.5344 2.7044
d3 0.8525 0.8884 0.8798 0.8641 0.8480 0.8332
Source: A.J. Duncan, “The Use of Ranges in Comparing Variabilities,” Ind.Qual. Control, Vol. 40, No. 5, February, 1955; No. 8, April, 1955. (note for k=1and n=10, d 2* = 3.18 )

8/8/2019 The Standard 2 Jun05
http://slidepdf.com/reader/full/the-standard-2-jun05 35/43
June 2005 The Standard MQD
Vol. 19, No. 2 The Newsletter of the Measurement Quality Division, American Society for Quality Page 35
Chair (2003-2005),Program Chair (2005-2006)Joe Simmons Scholarship MQD RepresentativeDilip A. ShahE = mc3 Solutions197 Great Oaks Trail #130Wadsworth, Ohio 44281-8215Voice (330) 328-4400 / Fax (330) 336-3974E-mail: [email protected], [email protected]
Chair-Elect, Examining ChairGraeme C. PayneGK Systems, Inc.4440 Weston Drive SW, Suite BLilburn, GA 30047 USAVoice: (770) 931-4004 / Fax (866) 887-9344E-mail: [email protected]
TreasurerKarl WigdalPromega Corp.5445 East Cheryl ParkwayMadison, WI 53711Voice (608) 277-2633 / Fax (608) 277-2516E-mail: [email protected]
Secretary, Newsletter Editor/Publisher,Share Point AdministratorJay L. Bucher Bucherview Metrology Services6700 Royal View Dr.
De Forest, WI 53532-2775Voice (608) 277-2522 / Fax (608) 846-4269E-mail: [email protected],[email protected]
Certification Chair, Website Manager,NCSL International Representative Christopher L. GrachanenManager, Houston Metrology Group Hewlett-PackardP. O. Box 692000 MS070110Houston, TX 77269-2000Voice (281) 518-8486 / Fax (281) 518-7275E-mail: [email protected]
Standards Committee RepresentativeBill McCulloughMcCullough Consulting1936 June Cr Carson City, NV 89706Voice: (775) 883-3042 Fax: (775) 883-3042Cell: (775) 220-6424E-mail: [email protected]
Immediate Past Chair / Nominating ChairDuane AllenU. S. Navy,P. O. Box 5000, Code MS11,Corona, CA 92878-5000Voice (909) 273-4783 / Fax (909) 273-4599E-mail: [email protected]
Joe Simmons Scholarship Norm Belecki7413 Mill Run Dr Derwood, MD 20855-1156Voice (301) 869-4520E-mail: [email protected]
HistorianKeela Sniadach
Promega Corp.5445 East Cheryl ParkwayMadison, WI 53711Voice (608) 298-4681 / Fax (608) 277-2516E-mail: [email protected]
Regional Councilors Region 5Richard A. Litts100 Evergreen Dr Downingtown, PAE-mail: [email protected]
Region 7Randy D. Farmer Metrology Solutions1488 Via HaciendaChula Vista, CA 91913(619) 934-4948 / (858) 688-2672 cellE-mail: [email protected]
Region 14Keith BennettTranscatVoice (713) 465-4395E-mail: [email protected]
ASQ Division AdministratorMs. Karen Prosser Voice (800) 248-1946, x7471E-mail: [email protected]
M EASUREMENT Q UALITY DIVISION O FFICERS AND C OMMITTEE C HAIRS

8/8/2019 The Standard 2 Jun05
http://slidepdf.com/reader/full/the-standard-2-jun05 36/43
June 2005 The Standard MQD
Vol. 19, No. 2 The Newsletter of the Measurement Quality Division, American Society for Quality Page 36
Region 1 (CT, MA, ME, NH, RI, VT)Volunteer Opportunity!
Region 2 (NJ, NY, PA)
Volunteer Opportunity!
Region 3 (CT, NJ, NY)
Mr. Eduardo M. HeidelbergPfizer Parlin, NJ 08859E-mail: [email protected]
Region 4 (Canada)
Mr. Alexander T. C. LauExxonMobilWhitby, ON L1R 1R1E-mail: [email protected]
Region 5 (DC, DE, MD, PA, VA)
Mr. Richard A. Litts
Litts Quality TechnologiesDownington, PA 19335E-mail: [email protected]
Region 6 (AK, CA, HI, ID, MT, OR, UT, WA,WY)
Volunteer Opportunity!
Region 7 (AZ, CA, NV, part of Mexico)
Mr. Randy D. Farmer Metrology Solutions
Chula Vista, CA 91913E-mail: [email protected]
Region 8 (OH, PA)
Volunteer Opportunity!
Region 9 (IN, KY, OH)
Volunteer Opportunity!
Region 10 (OH, MI)
Volunteer Opportunity!
Region 11 (NC, SC, TN, VA)
Volunteer Opportunity!
Region 12 (IL, MN, ND, SD, WI)
Dr. Donald S. Ermer ASQ Fellow; Eugene L. Grant Medal(2001)University of Wisconsin—MadisonMadison, WI 53706E-mail: [email protected]
Region 13 (CO, IA, KS, MO, NE, SD, WY)
Volunteer Opportunity!
Region 14 (AR, LA, NM, OK, TX, part of Mexico)
Mr. R. Keith BennettTRANSCATKingwood, TX 77339E-mail: [email protected]
Region 15 (AL, FL, GA, LA, MS, Puerto Rico)
Mr. E. Bryan Miller ASQ FellowBryan Miller Consulting
Florence, AL 35633E-mail: [email protected]
Region 25 (all other countries)
Volunteer Opportunity!
ASQ M EASUREMENT Q UALITY D IVISION R EGIONAL C OUNCILORS
Regional Councilors represent the Division to members and Sections in theirgeographic areas. Regional Councilors are appointed for renewable two-year
terms, and are advisory members of the Division leadership team.

8/8/2019 The Standard 2 Jun05
http://slidepdf.com/reader/full/the-standard-2-jun05 37/43
Advances in Scienceand Technology –Their Impact on Metrology
Advances in Scienceand Technology –Their Impact on Metrology
R
2005NCSLI Workshop
& Symposium
Washington, DCAugust 7–11, 2005
WashingtonHilton & Towers
Get the know-how you need – now!
• Learn from top experts
• Network with your colleagues
• Discover innovative solutions and services
Get the know-how you need – now!
• Learn from top experts
• Network with your colleagues
• Discover innovative solutions and services
303-440-3339 • www.ncsli.org/conference/

8/8/2019 The Standard 2 Jun05
http://slidepdf.com/reader/full/the-standard-2-jun05 38/43
Advances in Science and Technology continue at an ever increasing rate. This is especially true in the fields of Medicine, Nanotechnology, Biology, andSpace Sciences. The 2005 NCSLI Workshop and Symposium, to be held in Washington, DC, is designed to provide a forum for people in metrology andcalibration to learn, and to share ideas. To help people in the world of calibration meet the challenges created by these advances, the 2005 NCSLIWorkshop and Symposium includes workshops covering quality, management, and international issues, plus many technical sessions that provide aperson with education in the latest advances in standards and calibration processes.
Also, there are many NCSLI working committees that will be meeting to discuss issues of mutual interest, including the development of the future Z540standards, intrinsic standards, ISO standards, Small Business needs, etc. You are invited to become active and begin working with peers from aroundthe world in setting the direction metrology will take in the future.
KEYNOTE
Dr. Hratch G. Semerjian is the acting
director of NIST. As the U.S. NationalMetrology Institute (NMI), NIST isconstantly expanding the frontiers of
measurement to promote innovation, advance U.S.manufacturing, facilitate trade, improve public safety and
security, and improve the quality of life. Through cuttingedge research in areas as diverse as nanotechnology,
biotechnology, quantum computing, and homelandsecurity, NIST supports U.S. industry needs for new andunique metrology and measurement services. While NIST
is expanding its measurement capabilities into new areas,it is continuing to address the measurement challenges
posed in creating an “electronic” kilogram and measuringfrequency to the femtosecond level.
The commissioning of NIST's new Advanced Measurement
Laboratory in 2004 has provided NIST scientists andengineers with a unique facility that allows both cutting
edge research andstate-of-the-artmeasurement capabil-
ities. These include theprovision of calibrations,
standard referencematerials (SRM's),standard reference data (SRD) and accreditation of labora-
tories, both for calibration and testing. The servicesthemselves, and the ways in which they are provided, are
being improved, as NIST strives to meet new demands byits customers and by changing technology. Dr. Semerjian
will describe NIST's response to today's measurement and
standards challenges.
TECHNICAL PROGRAM SUMMARYThe 2005 NCSLI Technical Program will cover ten sessions spread over four days, with over150 speakers and panelists covering a wide range of metrology topics and issues. Because ofthe strength of the abstracts received, the Technical Program has been expanded from five tosix parallel tracks in each session this year.
PLENARY SESSIONS: DEVELOPMENTS IN NATIONAL MEASUREMENT SYSTEMSTHE BIPM, ILAC, AND MRA
> Management of the UK National Measurement System> Experiences of the National Measurement Institute of Japan>
BIPM/ILAC Collaboration> Issues for NMIs in the Asia Pacific Metrology Program (APMP)> The ILAC MRA Mark
SPECIAL TOPICS
> 2005 NCSLI Benchmarking Survey> 2005 State Laboratory Program Workload Survey> Update on the Revision of the VIM> Status of the GUM Supplements
TECHNICAL PRESENTATIONS
> ISO 17025 Revision and Laboratory Accreditation> Traceability Issues in Industrial Laboratories> Temperature Calibration at Fixed Points> Pressure, Mass, Capacitance, AC, and Flow Measurements> NIST Optical Short Courses> Dimensional Measurements and Temperature Control> Legal Metrology Issues> Uncertainty Evaluations and Software
PANEL DISCUSSIONS
> Future of Metrology Education and Training> Metrology Educators Forum> Measurement Needs in the Year 2020> Testing Laboratory Calibration Needs> Equipment Management Forum> ASQ Certified Calibration Technician> Small Business Panel> Conventional vs. Bayesian Statistical Methods
ADVANCES IN SCIENCE AND TECHNOLOGY —THEIR IMPACT ON METROLOGY
.
.
.
.
.
.
.
.
.
.
.
.
.
.
.
.
.
.
.
.
.
.
.
.
.
.
.
.
.
.
.
.
.
.
.
.
.
.
.
.
.
.
.
.
.
.
.
.
.
.
.
.
.
.
.
.
.
.
.
.
.
.
.
.
.
.
.
.
.
.
.
.
.
.
.
.
.
.
.
www.ncsli.org

8/8/2019 The Standard 2 Jun05
http://slidepdf.com/reader/full/the-standard-2-jun05 39/43
A.K.O. Inc.A2LAACLASSAcuCal, IncorporatedAgilent TechnologiesAMETEK, Test & Calibration Inst.Andeen-Hagerling, Inc.Army Primary Standards LaboratoryARTELAsia Pacific Metrology ProgrammeAssetSmartATC, Inc.BAE SYSTEMSBeamex
Bios International CorporationBlue Mountain Quality Resources, Inc.Brother International CorporationBruel & KjaerBuck Research Instruments, LLCCal Lab MagazineCal Lab SolutionsClarke-Hess Communication ResearchColorado Engineering ExperimentStation, Inc.CondecCrystal EngineeringData ProofDavis Inotek InstrumentsDH Instruments
DH-Budenberg Inc.
Diversified Data Systems, Inc.Dynamic Technology, Inc.East Hills InstrumentsEdison ESIElectronic Development LabsESSCO Calibration LaboratoryEUROMETEXELONFlow Dynamics, IncFlow SystemsFluke CorporationGE Infrastructure SensingGE Instrumentation ServicesGE Pressurements
GE Ruska Instrument CorporationGIDEPGuildline Instruments Inc.Hart ScientificHeusser NeweighICL Calibration Laboratories, Inc.IET Labs, Inc.IndySoftINSCO MetrologyInstrulab Inc.Instrument Rental LabsInterface, Inc.International Accreditation Service, Inc.ISOTECH North AmericaKaymont Consolidated
King Nutronics Corporation
Laboratory Accreditation BureauLockheed Martin Technical OperationsMasy Systems, Inc.Measurements InternationalMensor CorporationMetronom U.S. Inc.Mettler ToledoNACLANational Assoc. For Proficiency TestingNational Physical LaboratoryNational Research Council of CanadaNaval Surface Warfare CenterNavy Primary Standards LaboratoryNIST/Calibration Program
NIST/NVLAPNorthrop Grumman CorporationNorthwest MetrologyNorvada, LLCOak Ridge Metrology CenterOn Time Support, Inc.OPTO-CAL, Inc.Pacific Edge, Inc.Parameter Generation & Control, Inc.Paroscientific, Inc.PolySciencePond Engineering Laboratories, Inc.Prime Technology, LLCProcess Instruments, Inc.QUAMETEC
RH Systems
Rice Lake Weighing SystemsRichard J. Bagan, Inc.Rohde & Schwarz, IncSanSueB SoftwareSartorius Corp.SIMSIMCO ElectronicsSolance TechnologiesStandards Council of CanadaSypris Test & MeasurementTAC/TourAndoverControlsTEGAM, Inc.TektronixTesto Inc.
The Bionetics CorporationThe Modal Shop, Inc.Thunder Scientific Corp.Tovey Engineering, Inc.TranscatTroemner, LLCUnified Industries IncorporatedUniversal Label TechnologiesVaisala, Inc.VeriteqWestern Environmental Corp.Workplace TrainingWyle LaboratoriesYokogawa Corporation of America
Get the KNOWLEDGE you need-now!NCSLI brings metrology to life. You meet face-to-face with the top expertsin their field. “You can learn more in three days at an NCSLI Workshopand Symposium than you may ever learn on your own!”
Discover the keys to success with NCSLINCSLI focuses on giving you the knowledge you need to solve your
metrology and business problems, from accreditation to quality systemsto uncertainty analysis to procedures. From the experts you’ll discoverwhat’s important (and what’s not), and how to make it all work for youright now.
Learn what you NEED to know about metrologyWith dozens of NCSLI technical, quality, and management sessions tochoose from – including committee meetings and impromptu discussions– you can discuss your ideas and learn.
Learn from expertsNCSLI gives you a unique opportunity to expand your education andconquer your technical challenges in an in-depth, friendly, and relaxed,personal setting. Educational sessions are presented by leading experts,
and include the likes of the acting director of NIST, well-known scientists,and corporate pros, all dedicated to your success. This mix of expertiseensures that you get the real story on how it all works.
Explore hot solutions and servicesIn the Exhibition Hall you’ll discover what’s new in calibration hardwareand software. You’ll also find innovative software and management tools.Best of all, you meet and talk to calibration education and trainingorganizations, and effectively determine what will best work for you.
Network with your colleaguesNCSLI attracts high-caliber attendees from around the world, so you canlearn from them, as well as at the technical sessions and social events.You will develop a valuable network of peers. And you’ll make friends –good business starts with a handshake.
Boost your smarts, skills, and success
There is no better investment than in yourself. Come to the 2005 NCSLIConference and see your knowledge grow and expand. In just a few daysyou’ll gain abundant new ideas, insight, and detailed know-how you cannot get anywhere else. Don’t miss this year’s unique opportunity!
Lunch with the SpeakersAt NCSLI you’re welcomed into the community and are provided lunchevery day at discussion round-tables! What better way to meet and learnthan by joining the speakers during lunch? Ask questions, share yoursolutions, and learn more about current topics.
Who should attend?The technical, educational and quality sessions are valuable for technicalexecutives and managers, scientists, consultants, engineers, tech
administrators, business solution providers, trainers, and anyone whowants to learn about the top products, key technologies and bestpractices in metrology.
Team up to win .. . and save moneyTo get the maximum benefit, don’t miss out on any of the educationalsessions and workshops. Bring colleagues with you! By registering threeor more people from your organization, you can effectively cover all ofthe sessions and thereby take home the maximum knowledge. Plus, theteam can focus on priority projects free from office distractions.
BENEFITS OF ATTENDING
EXHIBITORS .
.
.
.
.
.
.
.
.
.
.
.
.
.
.
.
.
.
.
.
.
.
.
.
.
.
.
.
.
.
.
.
.
.
.
.
.
.
.
.
.
.
.
.
.
.
.
.
.
.
.
.
.
.
.
.
.
.
.
.
.
.
.
.
.
.
.
.
.
.
.
.
.
.
.
.
.
.
.
.
.
.
.
.
.
.
.
.
.
.
.
.
.
.
.
.
.
.
.
.
.
.
.
.
.
.
.
.
.
.
.
.
.
.
.
.
.
.
.
.
.
.
.
.
.
.
.
.
.
.
.
.
.
.
.
.
.
.
.
.
.
.
.
.
.
.
.
.
.
.

8/8/2019 The Standard 2 Jun05
http://slidepdf.com/reader/full/the-standard-2-jun05 40/43
NIST TOURSA special opportunity to tour the new NIST Advanced Measurement Laboratories (AML).All Day Friday – very limited attendance space.
> Category 1: Physical/Dimensional LabsThe Standard Kilogram; Dimensional Metrology: Ultra-High Accuracy Coordinate; The NIST Small Force Metrology Laboratory.Maximum number of participants: 36.
> Category 2: Electrical LabsVoltage Metrology; Resistance Metrology; Power and Energy Metrology. Maximum number of participants: 36.
> Category 3: Optical/Physics Labs.High Accuracy Cryogenic Radiometry; Spectral Irradiance and Radiance Responsivity using Uniform Sources (SIRCUS);Quantum Information Processing with Neutral-Atom Qubits. Maximum number of participants: 36.
> Category 4: NIST Center for Neutron Research (NCNR) and Advanced Measurement Laboratory (AML) Nanofabrication FacilityNIST Center for Neutron Research and Nanofabrication Facility. Maximum number of participants: 24.
TUTORIALS
SATURDAY, AUGUST 6 8:00 — 12:00 PM HALF DAY SESSIONS
> T1 Fundamentals of Temperature Calibration Ron Ainsworth and Tom Wiandt
> T2 Balance and Scale Calibration and Use Val Miller
SATURDAY, AUGUST 6 1:00 — 5 :00 PM HALF-DAY SESSIONS
> T3 Temperature Calibration Uncertainty Analysis Ron Ainswoth and Tom Wiandt
> T4 Balance and Scale, and Weighing Process Uncertainties Val Miller
> T5 Measurement Uncertainty Made Easy Mike Ouelette
SUNDAY, AUGUST 7 8:00 — 12:00 PM HALF DAY SESSIONS
> T6 Very Low Pressure Calibration Kurt Kurtz, Mike Bair, Matt Daniels
> T7 Practical Modeling of Measurements for the Uncertainty Evaluation Klaus-Dieter Sommer
> T8 Laboratory Accreditation: The Process from A to Z Dana Leaman
> T9 Running an Effective Laboratory: The Measurements Beyond Metrology Gregg Powell and Malcolm Smith
> T10 Good, Bad, or Indeterminate: Using Guardbands to Help Make the Call David Deaver
> T11 Measurement of Customer Satisfaction: An Application of “Soft” Metrology Jean Claude Krynicki
SUNDAY, AUGUST 7 1:00 — 5:00 PM HALF DAY SESSIONS
> T12 Very Low Pressure Applications Kurt Kurtz, Mike Bair, Matt Daniels> T13 Evaluating Measurement Uncertainty in Chemical Laboratories Wolfgang Richter, Klaus-Dieter Sommer
> T14 Pipette Calibration and Use: Methods for Reducing Variability via Uncertainty Analysis Ron Ainsworth, Tom Wiandtand Bench-top Verification
> T15 Force Calibration: Methods and Uncertainties Mike Tovey
> T16 The Shocking Aspects of ESD: Things You Should Know About Electronic Discharge Patrick Andre
> T17 Measurement System Analysis Handbook for the Automotive Industry Steve Stahley
FRIDAY, AUGUST 12 8:00 — 12:00 PM HALF DAY SESSIONS
> T18 Advanced Topics in Uncertainty Analysis Howard Castrup
> T19 Laboratory Data Management: If the Data Don’t Match, the Answers Won’t Hatch Don Wyatt
> T20 Inventory Data Normalization: The Whys, Whats, and Techniques Charlie Motzko
. . . . . . . . . . . . . . . . . . . . . . . . . . . . . . . . . . . . . . . . . . . . . . . . . . . . . . . . . . . . . . . . . . . . . . . . . . . . . . . . . . . . . . . . . . . . . . .
Discover how to identify, manage, and master your measurement challenges at NCSLI 2005 .
www.ncsli.org

8/8/2019 The Standard 2 Jun05
http://slidepdf.com/reader/full/the-standard-2-jun05 41/43
PLATINUM SPONSORS
GOLD SPONSORS
SILVER SPONSORS
NCSLI PRESIDENT’S RECEPTION SPONSOR
SCHEDULE
WASHINGTONHILTON & TOWERS
1919 Connecticut Avenue NWWashington, DC 20009202-483-3000Group Code: NSL
SATURDAY AUGUST 6
> 8:00 AM – 12:00 PM Tutorials: T1, T2
> 1:00 PM – 5:00 PM Tutorials: T3, T4, T5
SUNDAY AUGUST 7
> 8:00 AM – 12:00 PM Tutorials: T6, T7, T8, T9, T10, T11
> 1:00 PM – 5:00 PM Tutorials: T12, T13, T14, T15, T16, T17
> 7:00 PM – 9:00 PM Exhibitors’ Reception
MONDAY AUGUST 8
> 8:00 AM – 8:30 AM Exhibit Viewing
> 8:00 AM – 5:00 PM Registration
> 8:30 AM – 9:00 AM Introduction to NCSL International
> 9:00 AM – 10:00 AM Conference Opening / Keynote
> 10:00 AM – 10:45 AM Exhibit Viewing
> 10:45 AM – 12:15 PM Technical Sessions
> 12:15 PM – 1:45 PM Lunch
> 1:45 PM – 2:30 PM Exhibit Viewing
> 2:30 PM – 4:00 PM Technical Sessions
> 4:00 PM – 4:30 PM Exhibit Viewing
> 4:15 PM – 6:00 PM Committee Meetings
> 6:00 PM – 8:00 PM NCSLI President’s Reception
TUESDAY AUGUST 9
> 8:00 AM - 8:30 AM Exhibit Viewing
> 8:30 AM - 10:00 AM Plenary Session
> 10:00 AM - 10:45 AM Exhibit Viewing
> 10:45 AM - 12:15 PM Technical Sessions
> 12:15 PM - 1:45 PM Lunch
> 1:45 PM - 2:30 PM Exhibit Viewing
> 2:30 PM - 4:00 PM Technical Sessions
> 4:00 PM - 4:30 PM Exhibit Viewing
> 4:15 PM - 6:00 PM Committee Meetings
> 7:00 PM - 10:30 PM NCSLI Annual Banquet
WEDNESDAY AUGUST 10
> 8:00 AM - 8:30 AM Exhibit Viewing
> 8:30 AM - 10:00 AM Plenary Session
> 10:00 AM - 10:45 AM Exhibit Viewing
> 10:45 AM - 12:15 PM Technical Sessions
> 12:15 PM - 1:45 PM Lunch
> 1:45 PM - 2:30 PM Exhibit Viewing
> 2:30 PM Exhibits Closed
> 2:30 PM - 4:00 PM Technical Sessions
> 4:15 PM - 6:00 PM Committee Meetings
> 6:00 PM - 10:30 PM International Event
THURSDAY AUGUST 11
> 8:00 PM – 8:30 PM Continental Buffet
> 8:30 AM – 10:00 AM Technical Sessions
> 10:00 AM – 10:45 AM Break
> 10:45 AM – 12:15 PM Technical Sessions
> 12:15 PM – 1:45 PM Lunch
> 1:45 PM – 3:15 PM Technical Sessions
FRIDAY AUGUST 12
> 8:00 AM – 12:00 PM Tutorials: T18, T19, T20
> 9:00 AM – 4:00 PM NIST Tours
ROOM RATES
Single - $153Double – $163Towers single – $185Towers double - $195
8/8/2019 The Standard 2 Jun05
http://slidepdf.com/reader/full/the-standard-2-jun05 42/43
NCSLI promotes competitiveness and success of its members by improving the quality of products and services through excellence in calibration, testing, and metrology education and training.
NCSL INTERNATIONAL2995 Wilderness Place, Suite 107Boulder, Colorado 80301-5404
REGISTER NOW!Via the web at www.ncsli.org/conference/
Register by May 3rd and save up to $150
For registration questions and answers,please call 303-440-3339
R
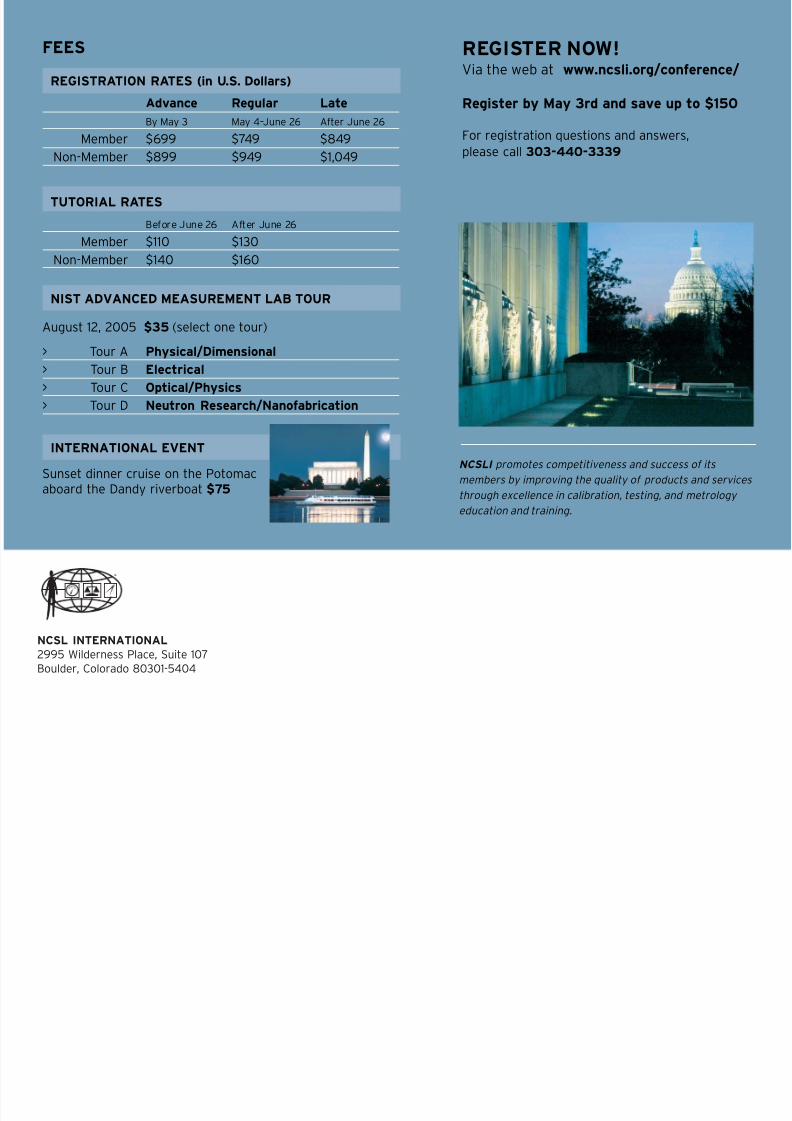
FEES
REGISTRATION RATES (in U.S. Dollars)
Advance Regular LateBy May 3 May 4–June 26 After June 26
Member $699 $749 $849Non-Member $899 $949 $1,049
TUTORIAL RATES
Before June 26 After June 26
Member $110 $130Non-Member $140 $160
NIST ADVANCED MEASUREMENT LAB TOUR
August 12, 2005 $35 (select one tour)
> Tour A Physical/Dimensional> Tour B Electrical
> Tour C Optical/Physics> Tour D Neutron Research/Nanofabrication
INTERNATIONAL EVENT
Sunset dinner cruise on the Potomacaboard the Dandy riverboat $75

8/8/2019 The Standard 2 Jun05
http://slidepdf.com/reader/full/the-standard-2-jun05 43/43
Authors
LAB MANAGEMENT ACCREDITATION TECHNOLOGY MATH AND STATS
AUTOMATION OF MEASUREMENT RF AND MICROWAVE
MSC features topics of interest to the test, metrology & calibration, and precision
measurement communities. MSC exists to promote education and professionalism in themeasurement science and related disciplines. Technical and managerial experts in themeasurement sciences are invited to lead sessions, panel discussions, and to presentpapers or workshops on topics of importance to the global measurement community.Participants from government, aerospace, medical, and environmental backgroundsmeet to share the most up-to-date information.
You are invited to participate in the 2006 Conference by presenting a paper on anytopic of interest to those involved in the application of measurement disciplines.
Please notify the Program Chairman as soon as possible of your interest.The deadline for submitting your abstract is April 30, 2005. To present
at MSC, you must submit a paper.
If you are interested in developing a technical session, pleasecontact the Program Chairman. Send your name, address,telephone number, and a short biographical sketch to theProgram Chairman and indicate your area of interest.Preference will be given to the developers with a full slate of papers.
MSC has an extensive tutorial workshop program, which arehalf-day (4-hour) instructional seminars. You are invited to
submit a tutorial workshop proposal in addition to, or instead of, aconference paper.
CALL FOR PAPERSM e a s u r e m e n t S c i e n c e C o n f e r e n c e
Disneyland Hotel, Anaheim, February 27 – March 3, 2006
“ T h e S c i e n c e , Te c h n o l o g y, a n d C o n t r o l o f M e a s u r e m e n t s ”P a s t , P r e s e n t , a n d F u t u r e
Session Developers
Tutorial Workshops
Suggested Topics
PROPOSED TRACKS
Technical TopicsElectrical Pressure Resistance Capacitance
Temperature Vibration Time Frequency
Mass Gas, Liquid Flow Humidity RF & Microwave
Air Quality Optical Short Wave Light Transducers Verification
Coordinate Measuring Machines Automation Advanced Technologies (NANO, etc.)
FieldsChemical Process Manufacturing PharmaceuticalEnvironmental Medical Biological Homeland Defense
Management TopicsTraceability Laboratory Accreditation Laws & Regulations
Interval Adjustment Procedures Development Automation
M E A S U R E M E N T S C I E N C E
C O N F E R E N C E
2 0 0 6