the standard for synthetic assets: mirror
TRANSCRIPT

The Standard For Synthetic Assets:Mirror
DeFi’s 1-To-N Opportunity
Mirror: a synthetic assets protocol
December 3, 2020
Author: Ninor Mansor, Ninos Mansor
Contributions From: Michael Arrington, Ron Palmeri, Heather Harde

Disclosure
Arrington XRP Capital and/or its affiliates (collectively “Arrington XRP Capital”) has a financial inter-
est in the success of the Terra-Luna ecosystem, including affiliated ecosystems, initiatives and projects
(collectively “Terra-Luna Ecosystem”). Arrington XRP Capital currently owns Luna tokens, owns equity
in the affiliated payments company Chai, and, once yield farming of Mirror tokens begins, will own Mirror
tokens.
As of the publication date of this report, Arrington XRP Capital, others that contributed to this report,
and those that we have directly shared our research with, are supporters of Mirror and the Terra-Luna
Ecosystem and stand to realize the gains upon MainNet launch through various manners of participation.
All content in this report represent the opinions of Arrington XRP Capital. Arrington XRP Capital has
obtained all information herein from sources they believe to be accurate and reliable. However, such
information is presented “as is”, without warranty of any kind – whether express or implied.
This document is for informational purposes only and is not intended as an official recommendation or
confirmation of any transaction. All market prices, data and other information are not warranted as to
completeness or accuracy, are based upon selected public market data, and reflect prevailing conditions
and Arrington XRP Capital’s views as of this date, all of which are accordingly subject to change without
notice. Arrington XRP Capital has no obligation to continue offering reports regarding the project.
Reports are prepared as of the date(s) indicated and may become unreliable because of subsequent
market or economic circumstances.
Any investment involves substantial risks, including, but not limited to, pricing volatility, inadequate
liquidity, and the potential complete loss of principal. This report’s estimated fundamental value only
represents a best efforts estimate of the potential fundamental valuation of a specific token, and is not
expressed as, or implied as, assessments of the quality of a token, a summary of past performance, or an
actionable investment strategy for an investor.
This document does not in any way constitute an offer or solicitation of an offer to buy or sell any
investment or token discussed herein.
The information contained in this document may include, or incorporate by reference, forward-looking
statements, which would include any statements that are not statements of historical fact. These forward-
looking statements may turn out to be wrong and can be affected by inaccurate assumptions or by known
or unknown risks, uncertainties and other factors, most of which are beyond Arrington XRP Capital’s
control. Investors should conduct independent due diligence, with assistance from professional financial,
legal and tax experts, on all tokens discussed in this document and develop a stand-alone judgment of
the relevant markets prior to making any investment decision.
1
Executive Summary
The emerging world of synthetic assets is one of DeFi’s most powerful bridges into traditional financial
markets. With the backdrop of macro change accelerated by COVID-19, we argue that synthetic assets
can create a gravitational pull on capital, as investor appetite moves deeper into the risk spectrum.
Notably, we examine the growing international demand for US equities and the challenges faced by
investors in the existing e-brokerage model.
This context leads us into the primary focus of the report, Mirror: a new protocol for synthetic asset
creation. Mirror synthesizes the primary innovations of DeFi – including Automated Market Makers
(AMMs), oracles, stablecoins and liquidity mining – to enable permissionless minting and trading of
traditional assets. Mirror is uniquely positioned as a capital efficient system using stablecoins, reducing
collateralization requirements to only 150%, a vast improvement over comparable systems which are
typically collateralized upwards of 300-400%.
Mirror will launch with support for a select number of US equities, and will decentralize ownership of its
native governance token MIR via a community-first distribution strategy.
2

Contents
Disclosure 1
Executive Summary 2
1 DeFi + TradFi: The 1-To-N Opportunity 4
2 An Insatiable Thirst For Risk 6
2.1 The Evolving Macro Landscape . . . . . . . . . . . . . . . . . . . . . . . . . . . . . . . . . 6
2.2 Global Black Hole: US Foreign Direct Investment (FDI) . . . . . . . . . . . . . . . . . . . 7
2.3 The Equity Derivatives Monster . . . . . . . . . . . . . . . . . . . . . . . . . . . . . . . . 9
3 The Promise of DeFi Synthetics 12
4 Mirror: The Standard For Tokenized Crypto Synthetics 14
4.1 Protocol Considerations . . . . . . . . . . . . . . . . . . . . . . . . . . . . . . . . . . . . . 14
4.2 Mirror Mechanism Design . . . . . . . . . . . . . . . . . . . . . . . . . . . . . . . . . . . . 14
4.2.1 Collateralization . . . . . . . . . . . . . . . . . . . . . . . . . . . . . . . . . . . . . 14
4.2.2 Synthetic Creation / Closure Dynamics . . . . . . . . . . . . . . . . . . . . . . . . 16
4.2.3 Risk Management . . . . . . . . . . . . . . . . . . . . . . . . . . . . . . . . . . . . 16
4.2.4 Price Oracle . . . . . . . . . . . . . . . . . . . . . . . . . . . . . . . . . . . . . . . . 17
4.2.5 Decentralized Exchange . . . . . . . . . . . . . . . . . . . . . . . . . . . . . . . . . 17
4.3 Architecture . . . . . . . . . . . . . . . . . . . . . . . . . . . . . . . . . . . . . . . . . . . . 17
4.3.1 Technical Infrastructure . . . . . . . . . . . . . . . . . . . . . . . . . . . . . . . . . 17
4.3.2 Economic Primitives . . . . . . . . . . . . . . . . . . . . . . . . . . . . . . . . . . . 18
4.4 Distributing Ownership: MIR Governance Token . . . . . . . . . . . . . . . . . . . . . . . 18
5 Conclusion: The Future of TradDeFi 21
3

1 DeFi + TradFi: The 1-To-N Opportunity
The Birth of DeFi
2020 will be remembered as a year of unprecedented financial repurposing. Old systems unravelled
and the world reimagined capital markets overnight. This story applies to everything from central bank
intervention to the corporate treasurer’s search for hard assets. Crypto’s great repurposing centers on the
rise of DeFi, where decentralized infrastructure transformed into rails for a new, permissionless financial
system.
This boom in Decentralized Finance (DeFi) leveraged existing crypto-networks and liquidity. Promising
permissionless, protocol-level primitives to rival legacy institutions, the narrative is very different to
other FinTech innovations. DeFi does not simply improve the user experience of banking; it dismantles it
altogether. Rather than repackaging finance, DeFi repurposes finance; competing directly with the legacy
financial system through new settlement layers that are equipped with their own units of account.
Despite a tumultuous ride, DeFi’s boom-bust cycle has delivered beyond promise alone. The growth
in decentralized liquidity is undeniable: in just under a year, DeFi’s Total Value Locked (TVL) has
risen from a mere $675 million to over $14 billion (December 2020)1. Secured by growing trust in Ether
as primary collateral, this rise represents one of the few “0-to-1” innovations in cryptocurrency, perhaps
second to the invention of Bitcoin. By spurring the invention of protocols for trustless lending, borrowing,
exchange, stablecoins, yield and insurance, it is not a question of “if” DeFi will approach escape velocity,
but “when” and “how”.
The Broader Context
In parallel to this crypto-native transformation, the macro environment has forced the world into un-
chartered monetary waters. Central banks have voyaged into no-man’s land and it is not clear if or when
they re-emerge. This journey includes everything from negative rates to quantitative easing and yield
curve control.
These experiments have almost universally increased risk appetite. The purchasing power of the unin-
vested is in perpetual decay. Real inflation measures at 1-2% annually2, yet 10 year government bonds
lag behind3. From retail to institutional, this reality has led to a flight into risk, particularly in the form
of US equities.
TradDeFi
Peter Thiel’s notion of the “0-to-1” invention is vertical: it creates something new. A “1-to-N” application
is horizontal, scaling what has been created4. DeFi’s foundations are 0-1, but what are the applications
that scale Total Value Locked to hundreds of billions or even trillions in value?
We believe the merging of Traditional Finance (TradFi) and DeFi – “TradDeFi” – is one of the most
compelling 1-to-N opportunities. This will take many forms. In this report, we will focus on one appli-
cation: crypto-synthetic assets. These assets are one of DeFi’s most obvious Trojan Horses into legacy
1url: https://defipulse.com/.2url: https://www.bls.gov/news.release/cpi.nr0.htm.3url: https://www.treasury.gov/resource-center/data-chart-center/interest-rates/pages/textview.aspx?
data=yield.4Peter Thiel. Zero to One. Notes on Startups, or How to Build the Future. The Crown Publishing Group, 2014. url:
http://www.zerotoonebook.com/.
4

markets, leveraging the openness of crypto while feeding on the insatiable demand for markets like US
equities.
Mirror: Tokenizing Synthetic Assets
In this report, we present the fundamental case for synthetic assets in terms of demand and technological
innovation. What is the latent demand for assets? Why is DeFi uniquely suited as a platform for
synthetics?
Once we lay this fundamental groundwork, we will then analyze Mirror, a DeFi protocol built on the Terra
blockchain, designed for permissionless and capital efficient minting and exchange of synthetics.
5

2 An Insatiable Thirst For Risk
The world is tumbling toward risk assets at every turn. In this section, we discuss how the macro
landscape is driving retail and institutional investors toward US equities and derivatives.
2.1 The Evolving Macro Landscape
In response to COVID-19, central banks embraced sweeping changes to monetary policy. Across the globe,
central banks cut interest rates and followed these measures with creative support packages. The scale of
monetary intervention, in many cases, rivals the response following 2008’s Great Financial Crisis.
1960 1970 1980 1990 2000 2010 20200.0
2.5
5.0
7.5
10.0
12.5
15.0
17.5
20.0
Percent
EffectiveFederalFundsRateEffectiveFederalFundsRate
Source:BoardofGovernorsoftheFederalReserveSystem(US) fred.stlouisfed.org
(a) Federal Funds Rate from the early 1960s5.
1985 1990 1995 2000 2005 2010 2015 20200
2,000
4,000
6,000
8,000
10,000
12,000
14,000
16,000
18,000
20,000
Billion
sofDollars
M2MoneyStockM2MoneyStock
Source:BoardofGovernorsoftheFederalReserveSystem(US) fred.stlouisfed.org
(b) M2 Money Stock from the early 1980s6.
2004 2006 2008 2010 2012 2014 2016 2018 20200
1,000,000
2,000,000
3,000,000
4,000,000
5,000,000
6,000,000
7,000,000
8,000,000
MillionsofU
.S.D
ollars
Assets:TotalAssets:TotalAssets(LessEliminationsfromConsolidation):WednesdayLevelAssets:TotalAssets:TotalAssets(LessEliminationsfromConsolidation):WednesdayLevel
Source:BoardofGovernorsoftheFederalReserveSystem(US) fred.stlouisfed.org
(c) Federal Reserve balance sheet from the early 2000s7.
1970 1975 1980 1985 1990 1995 2000 2005 2010 2015 202020
40
60
80
100
120
140
Percen
tofG
DP
FederalDebt:TotalPublicDebtasPercentofGrossDomesticProductFederalDebt:TotalPublicDebtasPercentofGrossDomesticProduct
Source:FederalReserveBankofSt.Louis fred.stlouisfed.org
(d) Federal Debt to GDP ratio from the mid 1960s8.
Figure 1: Historical US macroeconomic factors.
↓ interest rates, ↑ money supply, ↑ balance sheet and ↑ public debt.
In the United States alone, monetary policy has ranged from:
• Reducing the effective federal funds rate target to a range of 0% to 0.25%, effectively instituting a
Zero Interest Rate Policy (ZIRP). While the Federal Reserve has committed to avoiding negative
rates, it remains to be seen if this position will be maintained into the future, as other central banks
consider and adopt negative rates (e.g. the Bank of England9 and European Central Bank10).
5url: https://fred.stlouisfed.org/series/FEDFUNDS.6url: https://fred.stlouisfed.org/series/M2.7url: https://fred.stlouisfed.org/series/WALCL.8url: https://fred.stlouisfed.org/series/GFDEGDQ188S.9url: https://www.reuters.com/article/britain-boe-rates-idUSKBN27L08Z.
10url: https://www.ecb.europa.eu/pub/economic-bulletin/articles/2020/html/ecb.ebart202003_02~4768be84e7.
en.html.
6

• Slashing the reserve requirement ratio for all depository institutions to 0%, allowing for “infinite”
lending leverage11.
• Announcing an ongoing $700 billion quantitative easing package to repurchase US Treasury’s and
mortgage backed securities12.
The implications of these policies are evident in the historical charts in Figure 1: interest rates stand near
the zero-lower-bound, the M2 money supply has grown by approximately 22% in 2020 and the Federal
Reserve’s balance sheet has almost doubled from $4 trillion to $7 trillion.
Central bankers were not alone in these efforts. Governments complemented these policies with an
aggressive fiscal response. Record stimulus bills pervaded the European Union13 and the United States14,
each passing packages exceeding $2 trillion. In the US today, total public debt as a percentage of Gross
Domestic Product stands at 135%, rising 28% in a single quarter.
While many remain astounded at the disconnect between 2020’s productivity slump and booming financial
markets, the answer lives in this monetary expansion. Central banks have forced the investor’s hand.
In the face of $17 trillion of negative yielding bonds15, investors have found refuge in risky investments
across a range of asset classes.
2.2 Global Black Hole: US Foreign Direct Investment (FDI)
Amidst a backdrop of global easing and investor desperation, the US remains the strongest global recipient
of Foreign Direct Investment (FDI), as per Figure 2. As of 2019, foreign holdings of US equities amounted
to $8.6 trillion16, representing 10% year-on-year growth from 2018. In the same period, the US received
the largest FDI inflows of all countries, followed by China and Singapore.
This trend accelerated rapidly during the pandemic. As of the end of March 2020, Figure 3 shows
international investors composed 16% of the corporate equity market, with net inflows into US equities
exceeding $187 billion during Q1 202019. This trend continued into May, with foreign inflows into US
equities amounting to $79.7 billion20, an all time high.
As per Figure 4, the largest sources of FDI are developed countries, including Japan, Canada, Germany,
the UK, Ireland and South Korea. Notably, the fastest growing sources of FDI are less developed and
developing nations, including Kuwait, Thailand, Chile, Brazil and Turkey.
11url: https://www.federalreserve.gov/monetarypolicy/reservereq.htm.12url: https://www.federalreserve.gov/newsevents/pressreleases/monetary20200315a.htm.13url: https://ec.europa.eu/info/strategy/recovery-plan-europe_en.14url: https://home.treasury.gov/policy-issues/cares.15url: https://www.bloomberg.com/news/articles/2020- 11- 06/negative- yielding- debt- hits- record- 17-
trillion-on-bond-rally.16Foreign Portfolio Holdings of U.S. Securities as of June 28, 2019. Department of the Treasury, Federal Reserve Bank
of New York, Board of Governors of the Federal Reserve System, 2020. url: https://ticdata.treasury.gov/Publish/
shl2019r.pdf.17Foreign Portfolio Holdings of U.S. Securities as of June 28, 2019. Department of the Treasury, Federal Reserve Bank
of New York, Board of Governors of the Federal Reserve System, 2020. url: https://ticdata.treasury.gov/Publish/
shl2019r.pdf.18United Nations Conference on Trade and Development (UNCTAD). World Investment Report 2020. United Nations,
2020. url: https://unctad.org/system/files/official-document/wir2020_en.pdf.19url: https://www.foxbusiness.com/markets/foreigners-biggest-buyers-u-s-stocks-2020-goldman-sachs.20url: https://www.reuters.com/article/us-usa-treasury-securities-idUSKCN24H3AT.21Goldman Sachs.22url: https://www.selectusa.gov/servlet/servlet.FileDownload?file=015t00000003D9M.
7

0
2,000
4,000
6,000
8,000
Bill
ion
s of d
olla
rs
2007
2008
2009
2010
2011
2012
2013
2014
2015
2016
2017
2018
2019
Total
0
200
400
600
800
1,000
0
200
400
600
800
1,000
0
200
400
600
800
1,000
2007
2008
2009
2010
2011
2012
2013
2014
2015
2016
2017
2018
2019
2007
2008
2009
2010
2011
2012
2013
2014
2015
2016
2017
2018
2019
2007
2008
2009
2010
2011
2012
2013
2014
2015
2016
2017
2018
2019
2007
2008
2009
2010
2011
2012
2013
2014
2015
2016
2017
2018
2019
2007
2008
2009
2010
2011
2012
2013
2014
2015
2016
2017
2018
2019
2007
2008
2009
2010
2011
2012
2013
2014
2015
2016
2017
2018
2019
Cayman Islands United Kingdom
Canada Luxembourg
Japan Ireland
Common stock Fund shares Other
Bill
ions
of dolla
rs
Top 6 Countries as of 2019
As of End−June
Exhibit 12: Foreign Holdings of U.S. Equities by Major Investing Country and Equity Type
26
(a) Total US FDI inflows from the early 2000s (bil-
lions)17.
12 World Investment Report 2020 International Production Beyond the Pandemic
commodity-exporting economies (e.g. Nigeria, the Sudan). Few countries received higher inflows in 2019. Flows to Egypt – the largest recipient of FDI in Africa – increased by 11 per cent to $9 billion. In 2019, FDI flows into developing Asia declined by 5 per cent, to $474 billion. Despite the decline, it remained the largest FDI recipient region, hosting more than 30 per cent of global FDI flows. The decline was driven primarily by a 34 per cent fall in Hong Kong, China. The largest five recipients were China, Hong Kong, China, Singapore, India and Indonesia. With reported inflows reaching an all-time high, China continued to be the second largest FDI recipient after the United States. FDI flows to Latin America and the Caribbean (excluding financial centres) increased by 10 per cent to $164 billion. FDI rose in Brazil, Chile, Colombia and Peru, much of it in commodities, although investment in utilities and services increased as well. In 2019, Latin America and the Caribbean also became a hotspot for FDI in renewable energy. Transition economies saw FDI inflows increase by 59 per cent, to $55 billion, prompted by a recovery of FDI in the Russian Federation, an uptick in Ukraine following two years of decline and an increase in newly liberalizing Uzbekistan.
FDI in!ows, top 20 host economies, 2018 and 2019 (Billions of dollars)Figure I.7.
20182019
(x) = 2018 ranking
246
141
92
84
78-28
72
68
59
51
50
36
36
34
33
32
27
24
23
21
18
254
138
80
114
60
104
65
42
43
74
68
38
35
13
33
6
21
4
21
United States (1)
China (2)
Singapore (5)
Netherlands (3)
Ireland (189)
Brazil (9)
Hong Kong, China (4)
United Kingdom (8)
India (12)
Canada (11)
Germany (6)
Australia (7)
France (13)
Mexico (14)
Russian Federation (21)
Italy (15)
Cyprus (38)
Indonesia (17)
Sweden (49)
Israel (16)
Source: UNCTAD, FDI/MNE database (www.unctad.org/fdistatistics).
(b) FDI inflows across the top 20 host economies, 2018
and 2019 (billions)18. The US remains the largest recip-
ient of FDI.
Figure 2: Historical US Foreign Direct Investment statistics.
Figure 3: Ownership breakdown of the US equity market21.
Foreign investor ownership has grown from under 1% in the early 1950s to 16% today.
It’s hard to overstate the gravitational pull of US assets in the current paradigm. Foreign inflows have
continued pouring in over a decade and accelerated during a global pandemic and monetary transforma-
tion.
In the end, loose money and unbridled stimulus is not a US-centric theme. It is worldwide, and in many
cases, US assets are the best available hedge on interventionist excess. Investors continue to seek Dollar-
denominated investments, pessimistically as a hedge on inflation and optimistically as a bet on the US’
pioneering role in technological progress.
8

(a) Largest sources of FDI in the US. (b) Fastest growing sources of FDI in the US.
Figure 4: US FDI statistics for 2019, segmented by country of origin22.
2.3 The Equity Derivatives Monster
Size and Scope
The insatiable demand for US assets is the first leg of this crypto-synthetics story. The second is the size
and scope of equity derivatives more broadly. Exchange-traded equity derivatives are a rapidly growing
market around the world. In 2019, equity derivatives volumes saw a year-on-year increase of 18.4%, with
the single largest annual volume since 2010, as per Figure 5. This surpassed growth across all other
derivative types (commodity, interest rate, currency etc.).
12
5 EQUITY DERIVATIVES • Overall, equity derivative volumes increased by 18.4% in 2019, driven by rises across single stock
futures (16.2%), stock index options (41.8%) and stock index futures (18.6%), while single stock options decreased by 3.7%.
• Volumes increased by 9.3% in the Americas and by 37.6% in the Asia-Pacific region, while the EMEA region fell by 2% compared with 2018. Volume traded consists of 39.4% in the Americas, 45.8% in Asia-Pacific and 14.8% in EMEA.
• In 2019, equity derivative volumes exceeded 16.1 billion contracts, the highest level in the period under review.
Figure 9: Volumes of equity derivatives (billions of contracts)
0
2
4
6
8
10
12
14
16
18
0
1
2
3
4
5
6
7
2010 2011 2012 2013 2014 2015 2016 2017 2018 2019
Tota
l vol
umes
(bill
ions
of c
ontr
acts
)
Volu
mes
per
ass
et c
lass
(bili
ons o
f con
trac
ts)
Total Single Stock Options Single Stock Futures
Stock Index Options Stock Index Futures
Figure 5: Total global volume of equity derivatives contracts23.
Figure 6 illustrates the vast majority of growth stems from a focus on stock index futures and single stock
futures:
• Stock index futures volumes achieved 18.6% growth, accounting for 24.8% of overall equity deriva-
23The WFE’s Derivatives Report 2019. World Federation of Exchanges, 2020. url: https://www.world-exchanges.
org/storage/app/media/IOMA%202020/FH1.2019%20IOMA%20report_%20v13.pdf.
9

tives volume. The Americas were the largest contributor, accounting for 49.8% of the expansion.
• Single stock futures lagged closely behind at 16.2%, accounting for 10.5% of equity derivatives
volume. In this case, the Asia-Pacific region was the key contributor, accounting for 56.7% of the
growth, with the Korea Exchange, National Indian Stock Exchange of Index and Eurex Exchange
processing 66.1% of all volumes.
19
Stock index futures
• Stock index futures volumes were up 18.6% on 2018 with volumes of 4 billion. • They are the fourth most actively traded derivatives product type and the third equity derivative,
accounting for 12% of overall derivatives volumes and 24.8% equity derivatives volumes. • Volumes were down in Asia-Pacific by 1.4% and in EMEA by 10.7%, while the Americas witnessed a
significant increase of 49.8% due to B3 – Brasil Bolsa Balcao and CME Group. • The top three exchanges (in terms of volumes traded) – two from the Americas region and one from
the EMEA region - accounted for 70% of total volumes traded.
Figure 13: Stock index futures
A. Volumes and yearly change
B. Share of volume by region
C. Share of volume by exchange
Other30.1%
B3 - Brasil Bolsa Balcão38.1%
CME Group18.6%
Eurex13.2%
0% 10% 20% 30% 40% 50% 60% 70% 80% 90% 100%
Americas55.6%
APAC23.8%
EMEA20.6%
0% 10% 20% 30% 40% 50% 60% 70% 80% 90% 100%
0.00 0.50 1.00 1.50 2.00 2.50
Americas
APAC
EMEA
Volumes (in billions)
2018 2019
49.8%
-1.4%
-10.7%
-20.0% 0.0% 20.0% 40.0% 60.0%
Annual growth rate
(a) Stock index futures.
15
Single stock futures
• Single stock futures volumes were up 16.2% in 2019, with 1.7 billion contracts traded. • They remained the least actively traded equity derivatives product type accounting for 10.5% of equity
derivatives volumes. • The Asia-Pacific and EMEA regions, which together accounted for most of the global volume (56.2%
and 42.9% respectively), saw volumes increase by 13.3% and 17.5% respectively. In the Americas region the increase is mostly due to B3 – Brasil Bolsa Balsao, which introduced this product line in 2019.
• Three exchanges, Korea Exchange, the National Stock Exchange of India and Eurex Exchange, continue to account for the majority (66%) of total volumes traded.
Figure 11: Single stock futures
Note: Percentages shown may not always add up to 100% due to rounding.
A. Volumes and yearly change
B. Share of volume by region
C. Share of volume by exchange
Other34%
Korea Exchange36.9%
National Stock Exchange of India
15.3%
Eurex13.9%
0% 10% 20% 30% 40% 50% 60% 70% 80% 90% 100%
Americas0.9%
APAC56.7%
EMEA42.4%
0% 10% 20% 30% 40% 50% 60% 70% 80% 90% 100%
0.00 0.10 0.20 0.30 0.40 0.50 0.60 0.70 0.80 0.90 1.00
Americas
APAC
EMEA
Volumes (in billions)
2018 2019
1202.8%
13.3%
14.9%
-20.0% 480.0% 980.0% 1480.0%
Annual growth rate
(b) Single stock futures.
Figure 6: Global equity derivatives statistics24.
Retail Mania
The retail investor is at the centre of this growing demand for US equities and global equity derivatives.
The stock market is no longer the exclusive purview of Wall Street’s suits, whether in New York, London
or Tokyo. The growth in Main Street’s role is best captured by the post-pandemic boom in retail trading,
a pattern demonstrated in Figure 7. Yet, arguably, this was simply the acceleration of a secular trend,
one that was foreshadowed by the 2019 growth statistics in stock index and single stock futures.
In Q1 2020 alone, the average number of revenue generating trades (DARTs) increased between 72-
144% across electronic brokers including Charles Schwab, TD Ameritrade, E-Trade and Interactive Bro-
kers25.
Accelerated by an industry-wide trend toward zero-commissions trading, retail demand for US equities
drove over 1.2 million new users to Fidelity in Q127 and a further 3 million users to Robinhood in the
first four months of 202028. In an ironic twist, the retail trader may have outsmarted the typical hedge
fund manager29, ignoring gloomy sentiment and rushing to the market after a +30% drawdown in the
S&P500 and NASDAQ.
24The WFE’s Derivatives Report 2019. World Federation of Exchanges, 2020. url: https://www.world-exchanges.
org/storage/app/media/IOMA%202020/FH1.2019%20IOMA%20report_%20v13.pdf.25url: https://www.cnbc.com/2020/05/13/trading-volume-for-electronic-brokers-doubled-last-quarter-and-
shows-no-signs-of-letting-up.html.26url: https://www.bloombergquint.com/businessweek/how-robinhood-s-addictive-app-made-trading-a-covid-
pandemic-pastime.27url: https://www.cnbc.com/2020/06/17/robinhood-drives-retail-trading-renaissance-during-markets-wild-
ride.html.28url: https://www.cnbc.com/2020/08/21/robinhood-is-having-a-moment-users-should-be-careful.html.29url: https://www.cnbc.com/video/2020/06/08/why-stanley-druckenmiller-says-hes-been-humbled-by-the-
market-comeback.html.
10

Figure 7: Retail equity trading volume26.
Bringing Equities to Crypto
In light of this retail mania, cryptocurrency exchanges have also begun their foray into equity offerings.
Building a bridge between crypto and traditional assets, FTX recently launched the trading of tokenized
US stocks30. These tokens are:
• Fully reserved and redeemable on request, representing a claim on the underlying asset.
• Custodied by the licensed German financial institution CM-Equity.
• Traded on spot markets against US dollar stablecoins.
• Traded on leveraged futures markets, marked against the spot pair with unrestricted collateral
(including BTC or ETH).
• Restricted to a set of popular technology stocks.
• Tradeable 24/7.
While not the first attempt at bridging the crypto-equity divide (1Broker31 and Abra32 were first to
market, but experienced major regulatory challenges), we are eager to monitor trading volumes and open
interest over the coming year. The success or failure of FTX’s offering may signal the level of latent
demand for equities within crypto alone.
30url: https://help.ftx.com/hc/en-us/articles/360051229472-Tokenized-Stocks.31url: https://www.sec.gov/news/press-release/2018-218.32url: https://www.sec.gov/news/press-release/2020-153.
11

3 The Promise of DeFi Synthetics
The E-Broker Sleight of Hand
The current landscape for electronic brokerage is relatively concentrated. There are five to six major
players, including the likes of Robinhood, TD Ameritrade and Charles Schwab. Many of these giants
have come under criticism for opaque and non-transparent order flow.
The industry-wide trend of eliminating trade commissions is not a free lunch. While alluring marketing
for retail investors, zero commissions simply shift fee extraction down the value chain. Instead of charging
fees on trades, e-brokers now sell order flow directly to market makers who then profit from the bid-ask
spread.
Incentives have become muddled. Brokers would once focus on guaranteeing best execution for their
clients, but is today simply a race to offload order flow to the highest bidder? Notably, platforms which
can attract the least sophisticated investors are likely to sell their order flow for a higher price. Currently,
Robinhood charges the most for its order flow on equity and options markets, as per Figure 8. What
does this imply about the sophistication of the Robinhood user base?
Figure 8: Payment for order flow from major retail brokers33.
Transparency of DeFi
DeFi’s emergence presents an opportunity to disrupt the legacy e-broker and expand traditional market
exposure to anyone capable of using crypto.
A decentralized and permissionless system to trade equities has a number of advantages over the e-broker
model:
• 24/7 Trading – The ability to trade synthetic assets at any time of the day, regardless of market
open or close.
• Decentralized Exchange – The ability to trade synthetic assets via on-chain DEXs, with the liquidity
benefits of Automated Market Makers (AMMs).
33url: https://www.cnbc.com/2020/08/13/how-robinhood-makes-money-on-customer-trades-despite-making-it-
free.html.
12

• Protocol Composability – The ability to leverage/lend synthetic assets as collateral in onchain lend-
ing/borrowing protocols.
• Transparent Fees – Understand exactly how fees are charged on trading and execution.
• No Counterparty Risk – Assuming correct protocol and oracle function, maintain exposure to an
asset without centralised exchange risk.
13
4 Mirror: The Standard For Tokenized Crypto Synthetics
In this section, we now introduce Mirror, a protocol for the creation and exchange of permissionless
synthetic assets, built on the Terra blockchain. We will do this by first mapping out the critical protocol
considerations for any crypto-synthetics product and Mirror’s proposed solutions.
We believe Mirror will bring the vision of crypto-synthetics to life. It is one of the few capital-efficient
crypto economic systems bridging traditional markets with DeFi, building on the TradDeFi paradigm.
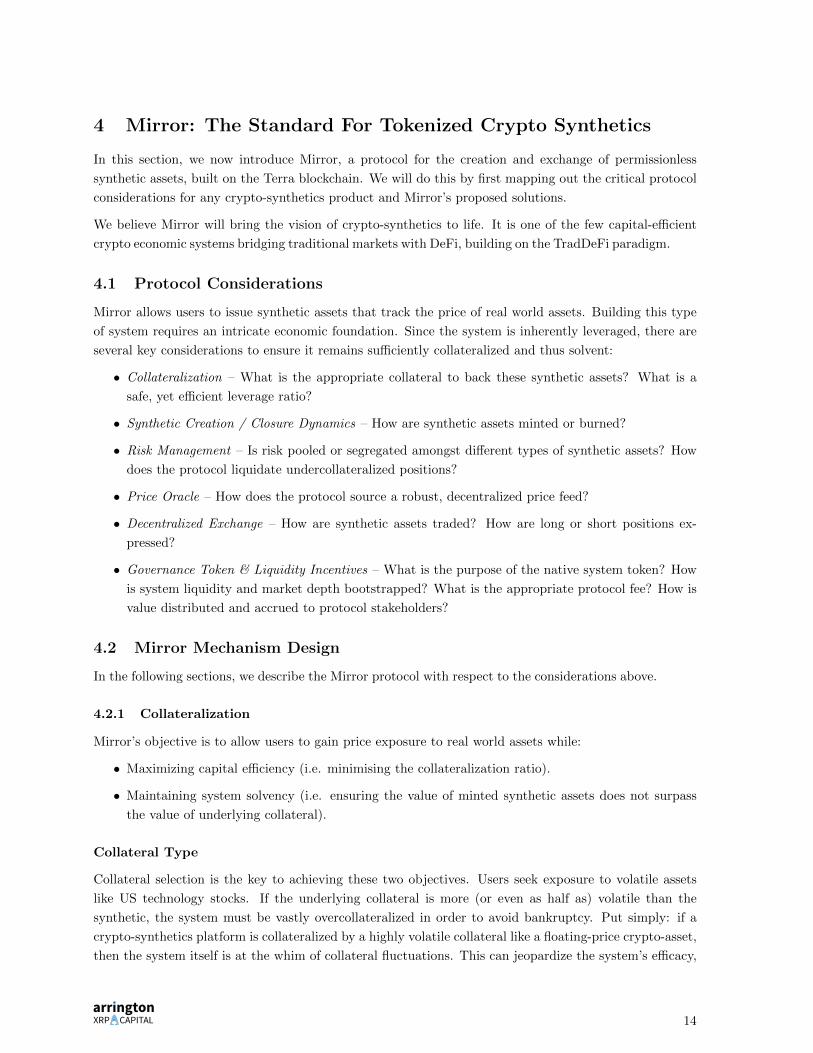
4.1 Protocol Considerations
Mirror allows users to issue synthetic assets that track the price of real world assets. Building this type
of system requires an intricate economic foundation. Since the system is inherently leveraged, there are
several key considerations to ensure it remains sufficiently collateralized and thus solvent:
• Collateralization – What is the appropriate collateral to back these synthetic assets? What is a
safe, yet efficient leverage ratio?
• Synthetic Creation / Closure Dynamics – How are synthetic assets minted or burned?
• Risk Management – Is risk pooled or segregated amongst different types of synthetic assets? How
does the protocol liquidate undercollateralized positions?
• Price Oracle – How does the protocol source a robust, decentralized price feed?
• Decentralized Exchange – How are synthetic assets traded? How are long or short positions ex-
pressed?
• Governance Token & Liquidity Incentives – What is the purpose of the native system token? How
is system liquidity and market depth bootstrapped? What is the appropriate protocol fee? How is
value distributed and accrued to protocol stakeholders?
4.2 Mirror Mechanism Design
In the following sections, we describe the Mirror protocol with respect to the considerations above.
4.2.1 Collateralization
Mirror’s objective is to allow users to gain price exposure to real world assets while:
• Maximizing capital efficiency (i.e. minimising the collateralization ratio).
• Maintaining system solvency (i.e. ensuring the value of minted synthetic assets does not surpass
the value of underlying collateral).
Collateral Type
Collateral selection is the key to achieving these two objectives. Users seek exposure to volatile assets
like US technology stocks. If the underlying collateral is more (or even as half as) volatile than the
synthetic, the system must be vastly overcollateralized in order to avoid bankruptcy. Put simply: if a
crypto-synthetics platform is collateralized by a highly volatile collateral like a floating-price crypto-asset,
then the system itself is at the whim of collateral fluctuations. This can jeopardize the system’s efficacy,
14

since users seek capital efficient exposure to the synthetic asset itself , not the underlying
collateral.
In the ideal case, the collateral asset should:
• Exhibit a low standard deviation in price over long time frames.
• Trade in a relatively liquid market that can absorb sudden market orders without significant slip-
page.
Given these considerations, Mirror opts for stablecoin as the collateral type, initially TerraUSD (UST),
generated by the Terra blockchain. While TerraUSD is new to Terra, its Korean Won counterpart
TerraKRW (KRT) has traded for over a year under high demand conditions. Namely, TerraKRW today
powers Chai, one of the largest e-commerce wallets in Korea, which hosts over 2 million users and
generates $1.2 billion in annualized transaction volume34. Figure 9 shows KRT has demonstrated price
stability over its history, with a mean of 0.99 KRW per KRT and a standard deviation of 0.006 since
mid-2019. TerraKRW currently trades with approximately $1 million of daily volume, and we expect
TerraUST to achieve similar traction as a US dollar pegged stablecoin.
Figure 9: Historical KRTKRW price from mid-201935.
Collateralization Ratio
Mirror opts for a minimum collateralization ratio of 150%. In other words, for every $1 of collateral, users
can mint a maximum of $0.67 worth of synthetics. Stablecoin collateral unlocks this degree of capital
efficiency, contrasting systems that rely on crypto-assets as collateral.
Leveraged Trading: Synthetic Assets As Collateral
In Mirror, users can also use the synthetic assets themselves as collateral for further minting. This allows
for leveraged trades. If a synthetic is used as collateral, the minimum collateralization ratio rises to
200%.
34url: https://medium.com/terra-money/announcing-terrausd-ust-the-interchain-stablecoin-53eab0f8f0ac.35url: https://www.coingecko.com/en/coins/terra-krw.
15

4.2.2 Synthetic Creation / Closure Dynamics
On Mirror, any user can propose new markets. Once approved by holders of the native governance token
(discussed in Section 4.4), the market will open for collateral deposits and synthetic asset creation via
Collateralized Debt Positions (CDPs).
As discussed in Section 4.2.1, assets minted on Mirror with stablecoin collateral have a minimum collat-
eralization ratio of 150%:
CR =SC
SAV≥ 150%
where CR = Collateralization Ratio
SC = Stablecoin Collateral
SAV = Synthetic Asset Value
Given the stability of the underlying collateral, the collateralization ratio is inversely proportional to the
Synthetic Asset Value. Considering a CDP with a CR of 150%:
• If the value of the synthetic rises, then the position becomes undercollateralized
• If the value of the synthetic falls, then the position becomes overcollateralized.
In other words, minting on the Mirror protocol via stablecoins represents a short position on the synthetic,
unless the synthetic itself is used as minting collateral (which represents a leveraged long position on the
synthetic). Minting operations with stablecoin collateral may become the domain of short sellers or
sophisticated market makers, as well as yield farmers who accrue trading fees while hedging this net
short exposure elsewhere.
Once minted, synthetic assets are freely transferable on the Terra blockchain. Synthetic assets can be
burned at any time, redeeming the underlying collateral. Minting and burning is the equivalent of
increasing or decreasing the total “open interest” on the synthetic.
4.2.3 Risk Management
If a CDP falls below the minimum collateralization ratio, the system auctions off the collateral at a
20% discount to anyone able to cover the CDPs synthetic asset. This liquidation auction mechanism
incentivises sophisticated participants to mint – or purchase on the market via Terraswap (discussed in
Section 4.2.5) – the required synthetic and redeem the discounted collateral. System solvency relies on
the proper functioning of this mechanism over time.
Mirror segregates risk management. Collateral in one market is only available to that particular market.
The protocol can thus support assets with differing volatility profiles without exposing the entire system
to insolvency risk.
If Mirror took a pooled risk approach instead – where all synthetic assets were issued against a single
reserve of stablecoins – then the collateralization ratio would have to be calibrated to the highest volatility
asset. This again reduces capital efficiency and creates unnecessary burdens on the system.
In our view, pooled collateral is suboptimal. Why should the collateral requirements be the same between
US 30 Year Treasury Bonds and US West Texas Intermediate Oil?
16
The tradeoff with Mirror’s segregated approach is that liquidity cannot be aggregated and each synthetic
market must independently accrue market depth.
4.2.4 Price Oracle
The price oracle is one of the most important components of the system, providing mark-to-market pricing
for all synthetic assets and ultimately determining a position’s solvency. In Mirror, the system uses an
onchain oracle provided by Band Protocol36. The oracle posts prices every 6 seconds, roughly the block
time of the Terra blockchain.
4.2.5 Decentralized Exchange
Mirror implements a Constant-Function Automated Market Maker (CFMM) – Terraswap – as a decen-
tralized exchange mechanism for trading synthetic assets against stablecoins. This is equivalent to simply
transferring ownership to another party, since there is no change in CDP status and total open interest
does not change (unlike minting or burning).
The CFMM employs a constant-product function, like Uniswap, based on the equation x× y = k. Each
market is by default a 50:50 pair between the synthetic asset and the TerraUSD stablecoin. One important
difference is that each pair can be optimised to the volatility of its particular synthetic asset, allowing for
the customization of minimum and maximum spreads as well as commissions.
4.3 Architecture
Mirror is deployed on Terra, a high performance blockchain that powers a family of algorithmic stable-
coins. Terra provides both the technical infrastructure as well as the economic primitives at the core of
Mirror.
4.3.1 Technical Infrastructure
Terra is built on Tendermint37, a delegated-proof-of-stake consensus technology utilized by the Cosmos
ecosystem. The Tendermint blockchain is capable of over 1,000 transactions per second, with sub-10
second blocktimes. The latest upgrade to the Columbus-4 MainNet integrated CosmWasm38, enabling
Terra to embed a WebAssembly runtime environment and facilitate expressive smart contracts.
These characteristics make it a strong fit for a leveraged synthetic asset protocol like Mirror:
• Oracle updates can occur every ≈ 6 seconds, approximately the block time. Compared to other
platforms, the higher poll rate translates into greater protocol safety, as the system can regularly
confirm CDP solvency.
• High throughput translates into high certainty in trade execution. This is critical during liquidation
events, where auction participants bid on discounted collateral and have short windows to execute
on arbitrage opportunities.
36url: https://bandprotocol.com.37url: https://tendermint.com.38url: https://agora.terra.money/t/col-4-upgrade-governance-proposal/246.
17

4.3.2 Economic Primitives
Beyond these technical foundations, Terra’s stablecoin system underpins Mirror collateral. While a full
discussion of Terra is beyond the scope of this paper, it is important to outline the basic operation.
The economic foundations of Terra are similar to today’s central bank monetary policy39. Using the US
as an illustrative example:
1. During economic booms, the economy expands, driving demand for the US Dollar. The Federal
Reserve responds by raising rates, and/or auctioning off new US Treasury Debt (bonds). Both of
these have the effect of reducing the supply of the US Dollar, and “slowing down” the economy.
2. During economic busts, the economy contracts, reducing demand for the US Dollar. The Fed
responds by dropping rates, and/or buying back US Treasury Debt from the market (Quantitative
Easing, Yield Curve Control etc.). Both of these have the effect of increasing the supply of the US
Dollar, “stimulating” the economy.
The Terra Protocol functions in a similar way to the ”Central Bank Protocol” described above, instead
the central bank is replaced by the supply of the native token LUNA and the currency is replaced with
TerraUSD:
1. When the Terra Protocol economy is growing, demand for TerraUSD rises, causing the
stablecoin to trade at a premium. The Terra Protocol responds by minting TerraUSD and buying
back LUNA. This increases the supply of TerraUSD and thus restores the peg back down to parity.
The LUNA ”bought back” by the protocol is called seigniorage, the value captured by printing and
selling a currency at zero cost. The seigniorage gains are partially burnt, making LUNA scarcer,
and the remaining portion is sent to the protocol treasury.
2. When the Terra Protocol economy is contracting, demand for TerraUSD falls, causing the
stablecoin to trade at a discount. The Terra Protocol responds by minting LUNA and selling for
TerraUSD. This has the effect of decreasing the supply of TerraUSD, restoring the peg back up to
parity. In this case, all the repurchased TerraUSD is burnt, and none is sent to the treasury.
This economic design is a simple yet elegant adaptation of modern monetary policy. It creates the
foundation for permissionless stablecoins, and is validated by TerraKRW, which has historically traded
extremely close to parity. Mirror is launching with support for TerraUSD, but is likely to support the
entire family of Terra stablecoins in the future.
4.4 Distributing Ownership: MIR Governance Token
The Mirror governance token (MIR) is the native asset of the protocol. The token governs system
parameters, including minimum collateralisation ratios, supported collateral and supported synthetic
assets. Users must stake MIR to participate in protocol voting.
To incentivise liquidity for Mirror assets, MIR will be rewarded to Terraswap LPs who provide liquidity
in Terraswap pools. This will encourage the minting of synthetic assets and bootstrap initial liquidity
for users seeking long exposure to synthetics.
MIR’s value accrual extends beyond qualitative governance benefits. From initial launch, two mechanisms
will directly tie protocol usage to the MIR token, providing a benchmark for valuation and sustainable
39Terra Money: Stability and Adoption. Terraform Labs, 2019. url: https://terra.money/Terra_White_paper.pdf.
18

incentives for ongoing liquidity provision:
• Trading Fees – Terraswap fees are configured to 0.3% of trading volume, where 0.25% is redistributed
to pool LPs and the remaining 0.05% to MIR token stakers. These fees will enabled post launch
once Terraswap achieves sufficient liquidity and volume
• CDP Closure – CDP closure incurs a 1% fee on stablecoin collateral. This fee is aggregated daily
and used to repurchase MIR tokens on Terraswap. Purchased tokens are redistributed to LPs who
provide liquidity to the MIR pair on Terraswap. These fees are enabled immediately from launch.
In line with Table 1, Mirror takes a community first approach to governance, adopting a token distribution
strategy which rewards both Mirror protocol contributors and broader DeFi participants. There is no
team controlled pre-mine, and all tokens are allocated as AMM liquidity mining rewards, as well as an
airdrop to token holders in the Uniswap and Terra ecosystems.
19
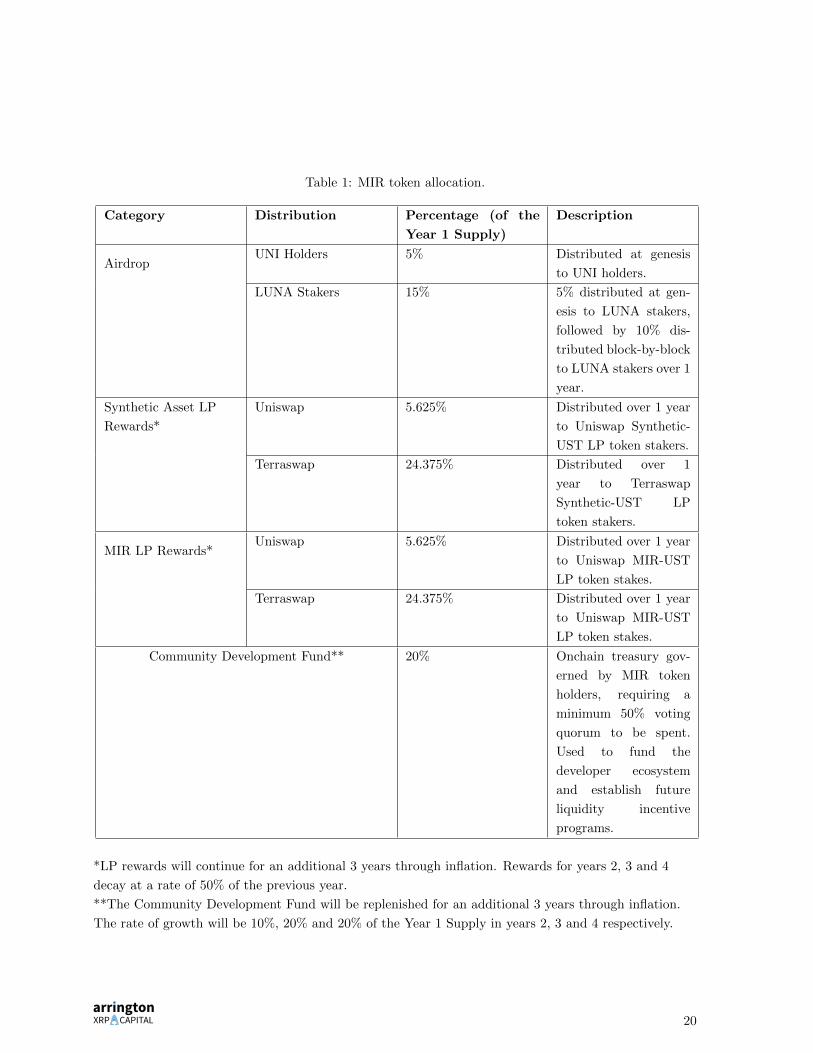
Table 1: MIR token allocation.
Category Distribution Percentage (of the
Year 1 Supply)
Description
AirdropUNI Holders 5% Distributed at genesis
to UNI holders.
LUNA Stakers 15% 5% distributed at gen-
esis to LUNA stakers,
followed by 10% dis-
tributed block-by-block
to LUNA stakers over 1
year.
Synthetic Asset LP
Rewards*
Uniswap 5.625% Distributed over 1 year
to Uniswap Synthetic-
UST LP token stakers.
Terraswap 24.375% Distributed over 1
year to Terraswap
Synthetic-UST LP
token stakers.
MIR LP Rewards*Uniswap 5.625% Distributed over 1 year
to Uniswap MIR-UST
LP token stakes.
Terraswap 24.375% Distributed over 1 year
to Uniswap MIR-UST
LP token stakes.
Community Development Fund** 20% Onchain treasury gov-
erned by MIR token
holders, requiring a
minimum 50% voting
quorum to be spent.
Used to fund the
developer ecosystem
and establish future
liquidity incentive
programs.
*LP rewards will continue for an additional 3 years through inflation. Rewards for years 2, 3 and 4
decay at a rate of 50% of the previous year.
**The Community Development Fund will be replenished for an additional 3 years through inflation.
The rate of growth will be 10%, 20% and 20% of the Year 1 Supply in years 2, 3 and 4 respectively.
20

5 Conclusion: The Future of TradDeFi
Today’s uncharted monetary landscape is matched only by the radical experiments in DeFi. We believe
that synthetic asset creation is one of the most compelling opportunities for these two worlds to come
together. Synthetic assets are DeFi’s “1-to-N” opportunity to absorb capital seeking a home in global
and diverse markets without permission from gatekeepers.
Mirror is Terra’s answer to synthetic assets, leveraging a performant blockchain and economic model
to invent a protocol where any asset can be “mirrored” on-chain. It represents a unique alternative to
centralised exchanges and e-brokerage platforms, with 24/7, on-chain, capital efficient minting, settlement
and trading of US equities. In the future, almost any asset will be tradeable on Mirror.
DeFi will continue to flourish and inevitably charge its way into the corridors of traditional finance with
open and transparent financial systems. Synthetic assets are at the heart of this quest to reimagine,
among other things, financial markets. We are excited to watch Mirror’s economic and technical vision
come to life and ultimately set the standard for synthetic asset creation and trading.
21