the standardisation of all the main raven progressive ... · the standardisation of all the main...
TRANSCRIPT

Chapter 10
The Standardisation of all the Main RavenProgressive Matrices Tests in Slovenia*
Dusica BobenCenter za psihodiagnosticna sredstva Ljubljana
Abstract
The Standard Progressive Matrices (and possibly other RPM tests) were used in the former Yugoslavia (of which Slovenia formed a part) since at least the early 1960s. More recently, i.e. since 1999, the CPM, SPM, SPM Plus, and APM have been standardised in Slovenia. In each case, new item analyses were carried out and the tests shown to work in similar ways to other countries and, within Slovenia, for different ability and socio-economic groups. As far as comparative norms are concerned, it seems that, allowing for the universal increase in norms over time, the Slovenian norms are similar to those obtained in other European countries.
Introduction
Let me fi rst briefl y introduce Slovenia: its history, population, school system and test use.
Slovenia and its Population
Slovenia is a small Central European country with a rich history. It gained its independence in 1991. Before that, the Slovene people lived in different countries, political regimes and cultural circles. Until World War I, Slovenians lived in the Austro-Hungarian Empire. After World
* A version of this paper containing more details on the results of the item analyses and other topics is available on the Web Psych Empiricist: http://WPE.info
Dusica Boben 289
War I, they united with other Slavic peoples in the Kingdom of Serbs, Croats and Slovenes. After World War II, most of the Slovenians lived in Yugoslavia. Nowadays, some Slovenians still live in Austria, Italy, Hungary, and Croatia.
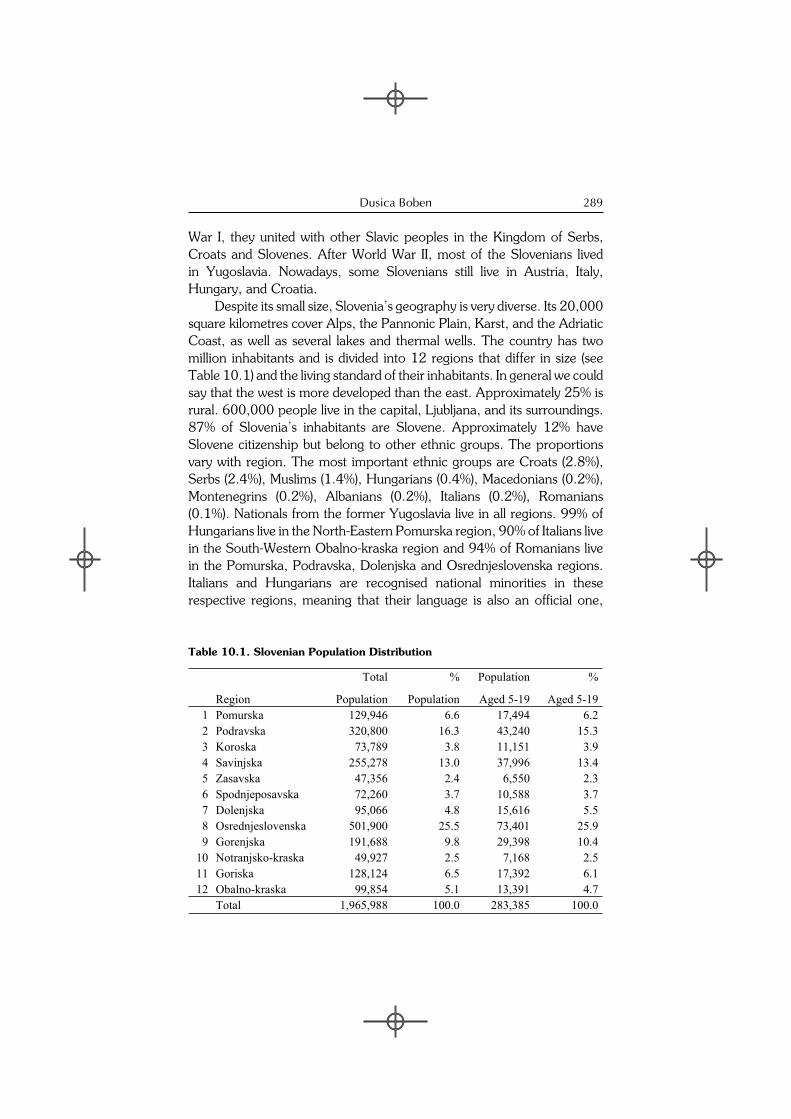
Despite its small size, Slovenia’s geography is very diverse. Its 20,000 square kilometres cover Alps, the Pannonic Plain, Karst, and the Adriatic Coast, as well as several lakes and thermal wells. The country has two million inhabitants and is divided into 12 regions that differ in size (see Table 10.1) and the living standard of their inhabitants. In general we could say that the west is more developed than the east. Approximately 25% is rural. 600,000 people live in the capital, Ljubljana, and its surroundings. 87% of Slovenia’s inhabitants are Slovene. Approximately 12% have Slovene citizenship but belong to other ethnic groups. The proportions vary with region. The most important ethnic groups are Croats (2.8%), Serbs (2.4%), Muslims (1.4%), Hungarians (0.4%), Macedonians (0.2%), Montenegrins (0.2%), Albanians (0.2%), Italians (0.2%), Romanians (0.1%). Nationals from the former Yugoslavia live in all regions. 99% of Hungarians live in the North-Eastern Pomurska region, 90% of Italians live in the South-Western Obalno-kraska region and 94% of Romanians live in the Pomurska, Podravska, Dolenjska and Osrednjeslovenska regions. Italians and Hungarians are recognised national minorities in these respective regions, meaning that their language is also an offi cial one,
Table 10.1. Slovenian Population Distribution
Region
Total
Population
%
Population
Population
Aged 5-19
%
Aged 5-19 1 Pomurska 129,946 6.6 17,494 6.22 Podravska 320,800 16.3 43,240 15.33 Koroska 73,789 3.8 11,151 3.94 Savinjska 255,278 13.0 37,996 13.45 Zasavska 47,356 2.4 6,550 2.36 Spodnjeposavska 72,260 3.7 10,588 3.77 Dolenjska 95,066 4.8 15,616 5.58 Osrednjeslovenska 501,900 25.5 73,401 25.99 Gorenjska 191,688 9.8 29,398 10.4
10 Notranjsko-kraska 49,927 2.5 7,168 2.511 Goriska 128,124 6.5 17,392 6.112 Obalno-kraska 99,854 5.1 13,391 4.7
Total 1,965,988 100.0 283,385 100.0
Chapter 10: RPM in Slovenia290
including use in education. The majority of the inhabitants of Slovenia are Roman Catholics Statisticne Informacije (Rapid Reports) 1992, 1997.
The number of inhabitants of Slovenia is constantly slightly decreasing. There are approximately 22,000 -- 27,000 children in one generation. The average proportion between the sexes is 51:49 (males-females).
School System
In 1990 Slovenia began to reform its school system. After the reform, obligatory schooling starts at six years of age (formerly seven) and lasts nine years. Before that, the so called “preschool”, which was not obligatory, had been organised for six-year old children, followed by compulsory eight-year primary school. Regarding the new school system, one of the biggest changes as to the content and organisational level is working with children with special needs.
After completing compulsory education at a primary school, adoles-cents have the opportunity to continue their education at one of the sec-ondary schools. These basically belong to three categories: general sec-ondary schools (gimnazija, roughly equivalent to the German Gymnasium,that lasts four years and prepares their students for university study; pro-fessional secondary schools, that last four years; and vocational schools that can last from 2½ years to 4 years. Secondary schooling is not compulsory. About 98% of adolescents embark on it but only two thirds fi nish it successfully.
Tests and Testing
Applied psychology and psychological testing in Slovenia dates back to the period before World War II. Vlado Schmidt, referred to as the pioneer of applied psychology (Pe jak, 1983), was also the fi rst to work on adaptations of group psychological tests (Lapajne, 1997). An independent Chair of Psychology within the Faculty of Arts of the University of Ljubljana was only founded in 1950. After that, systematic work on psychological tests began. In 1977, Center za psihodiagnosticna sredstva was founded. At that time it was one of the units of the state Agency for Work Productivity. Via its centres in different parts of the country, this Agency developed psychological tests in the Serbian and Croat languages as well as Slovenian.
After Slovenia gained independence in 1991 and changed its political and economic system, work continued and the need for internationally recognised work of high quality grew. The circumstances in which
Dusica Boben 291
psychologists work changed as well with the coming of liberal economy. Test developers had greater accessibility to foreign tests. Although demands increased fi nancial means remained scarce.
Historical Sketch of the Usage of Raven’s Progressive Matrices (RPM) in Slovenia
According to MacIntosh (1998), the RPM are one of the most widely used tests of general cognitive ability. In the course of an international survey, Oakland (1995) found that the RPM are the second most widely used psychological tests in the world. It is probably unnecessary to underline the presence of RPM in practical work as well as in basic research. The reasons for this are numerous: Simple, individual or group administration, and non-verbal items that can be used regardless of language and culture. Numerous references cited in the RPM Manual prove that RPM tests are indeed present in all of the fi ve continents. Immediately after (re)publication all three forms of the RPM became the best selling tests in Slovenia.
The Standard Progressive Matrices (SPM) has been used in Slovenia since the beginning of the sixties, at which time Slovenia formed part of Yugoslavia. The fi rst attempt to provide a manual for the test dates back to 1966, when the state agency for the productivity of work (Zavod SRS za produktivnost dela) published the so-called “Test information”, which presented data from the 1957 edition of the British manual and data from Vito Ahtik’s 1955 research on the test (that took place in Ljubljana). At that time, the SPM was mainly used in Slovenia to normalise primary school classes. After several years of use, psychologists began slowly to refrain from using the SPM for this purpose, as the results failed to express normal distribution. It was believed that the increase in scores was due to too great famiarity with the SPM items, although we now know that it was due to the so-called “Flynn’s effect”. Other RPM forms were not available.
In 1996, Center za psihodiagnosticna sredstva signed an adaptation agreement for all of Raven’s tests (matrices and verbal scales) with J. C. Raven Ltd. We began to standardize the three classical forms: CPM, SPM and APM for pupils and young people aged 6 to 19. Simultaneously we gathered data for students and adults but, since these samples were not representative of the general population the results will not be summa-rised here.
The programme to standardise the classical form of the CPM, the classical form of the SPM and the APM II began in 1997. The fi rst four
Chapter 10: RPM in Slovenia292
volumes of the Slovenian translation of the Manual were published in 1999 (Raven, Raven, & Court, 1999a,b,c&d). The project was carried out at the Center za psihodiagnosticna sredstva under the leadership of Dušica Boben, in co-operation with several Slovene psychologists and students of psychology, and under the supervision and with the help of John and Jean Raven. The psychometric data from the standardisation were published in a supplement to the SPM Manual: “The Slovene Standardisation of RPM” in 2003.
However, as elsewhere in the world, it became apparent that norms for the SPM-Plus were necessary. The main reason was that a reform of the educational system included a recommendation that the RPM be used to identify talented children among primary school students. As the introduction of the nine-year primary school system was a gradual one, the identifi cation of talented students took place both in the fourth and in the eighth grade of primary school. In practice, however, the SPM proved to be too easy for students of the eighth grade. On the other hand, the APM proved to be too diffi cult and lacking adequate norms for younger students. In 2004, the decision to standardise the SPM-Plus for children between age 10.5 and 14.5 was made. This standardisation was completed in 2005 and resulted in the norms published in a supplement to the SPM-Plus Manual (“Slovenske norme za mladostnike v primerjavi z drugimi normami” -- Slovenian norms for adolescents in comparison to other norms).
In 2006, as part of dissertation research carried out by two psychology students (de Reggi, 2007, Klop i , 2007), SPM-Plus norms for adolescents aged 14 to 17 and adults aged 38 to 53 were collected. The results for adolescents were analysed using item response theory in addition to the classical test theory.
We also started to adapt the Mill Hill Vocabulary Scales. Two pilot studies were performed (Plut, 2003, Žalik, 2003) using a sample of primary school students. This adaptation has not yet been completed, and is not, therefore, included in this presentation.
In the remainder of this chapter, the results of the standardisation of the CPM, SPM and APM in 1998 will be presented, together with those from the standardisation of the SPM-Plus for children and adolescents in 2005 and 2006. These data will be compared with results obtained in other countries. Most of the analyses reported below have been conducted according to classical test theory.
Dusica Boben 293
CPM Standardisation, 1998
Sampling and the Sample
Population of primary school students
The samples for the standardisation of all three Classic versions of the tests (CPM, SPM and APM) were drawn at the same time following a stratifi ed random sampling procedure. First, schools were randomly selected from a list of all schools (Research results, 1996). The number of schools was set according to regions and proportionally to the number of children in a certain region. Altogether, we chose 42 schools: 29 primary and 13 secondary schools (vocational, professional, and general). The schools were requested to take part in the project and if one of them refused, another was selected from the same region using the same key. At some schools we collected data for all three tests. At others, only data for one or two tests were collected. In the CPM sample we also included children from special schools. In the CPM and the SPM samples we included one primary and one secondary bilingual school.
We assumed that the regional sampling system would capture children from more and less developed parts of the country, and children of different social-economic status. No data regarding the education and ethnic origins was collected. Altogether, 49% of data collected was from Eastern Slovenia (regions 1 to 7), 28% from Central Slovenia (including Ljubljana), and 23% from Western Slovenia (regions 9 to 12). The percentage of data collected in the different regions corresponds to the proportion of children in those regions.
The data collection coordinators at individual schools were requested to select one class from each grade. Parents of the selected children were sent a written presentation of the project and a request for co-operation. Very few requests were refused. Testing took place in 1998 and was performed by school psychologists, psychologists of the Center za psihodiagnosticna sredstva, and assisted by several fi nal year psychology students. An educational event was organised for the test administrators, where the project of standardisation was presented, and test administrators were trained to administer the test (testing instructions, conditions etc…). Testing was performed as group testing, it took place at the schools in time of lectures and without time limitation. Data was processed using STATISTICA software (StatSoft, 1999). The norms were calculated by John and Jean Raven.
Chapter 10: RPM in Slovenia294
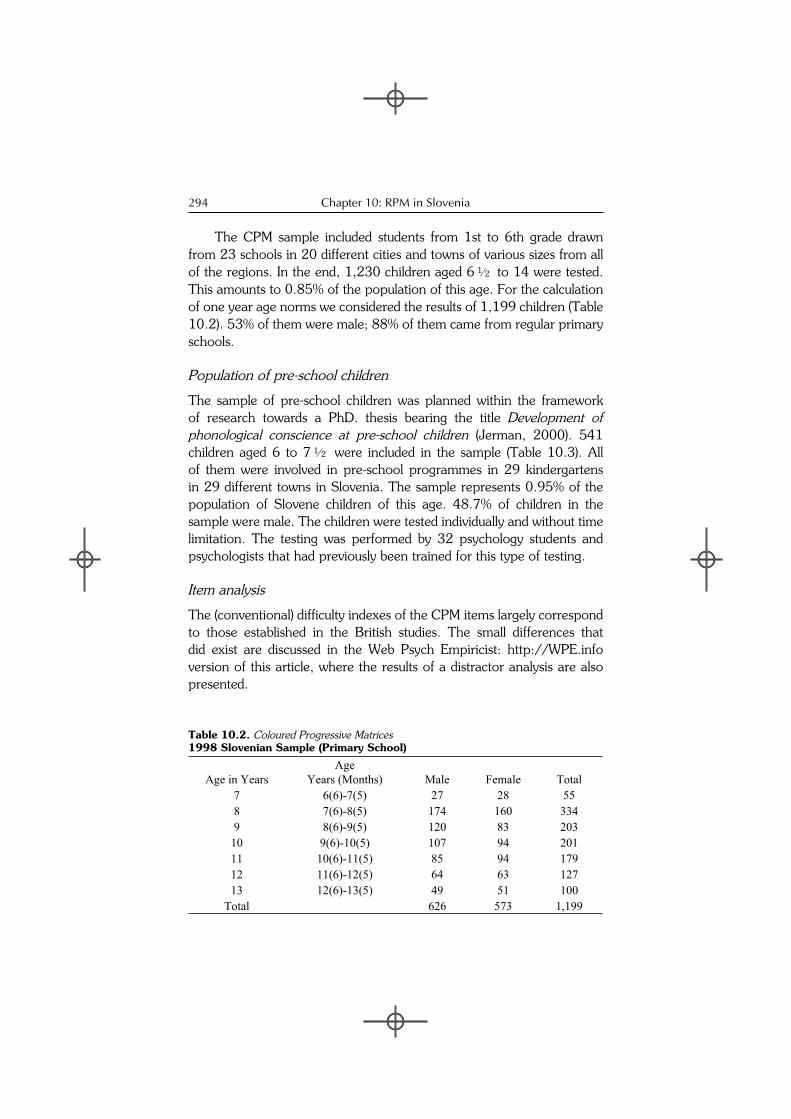
The CPM sample included students from 1st to 6th grade drawn from 23 schools in 20 different cities and towns of various sizes from all of the regions. In the end, 1,230 children aged 6½ to 14 were tested. This amounts to 0.85% of the population of this age. For the calculation of one year age norms we considered the results of 1,199 children (Table 10.2). 53% of them were male; 88% of them came from regular primary schools.
Population of pre-school children
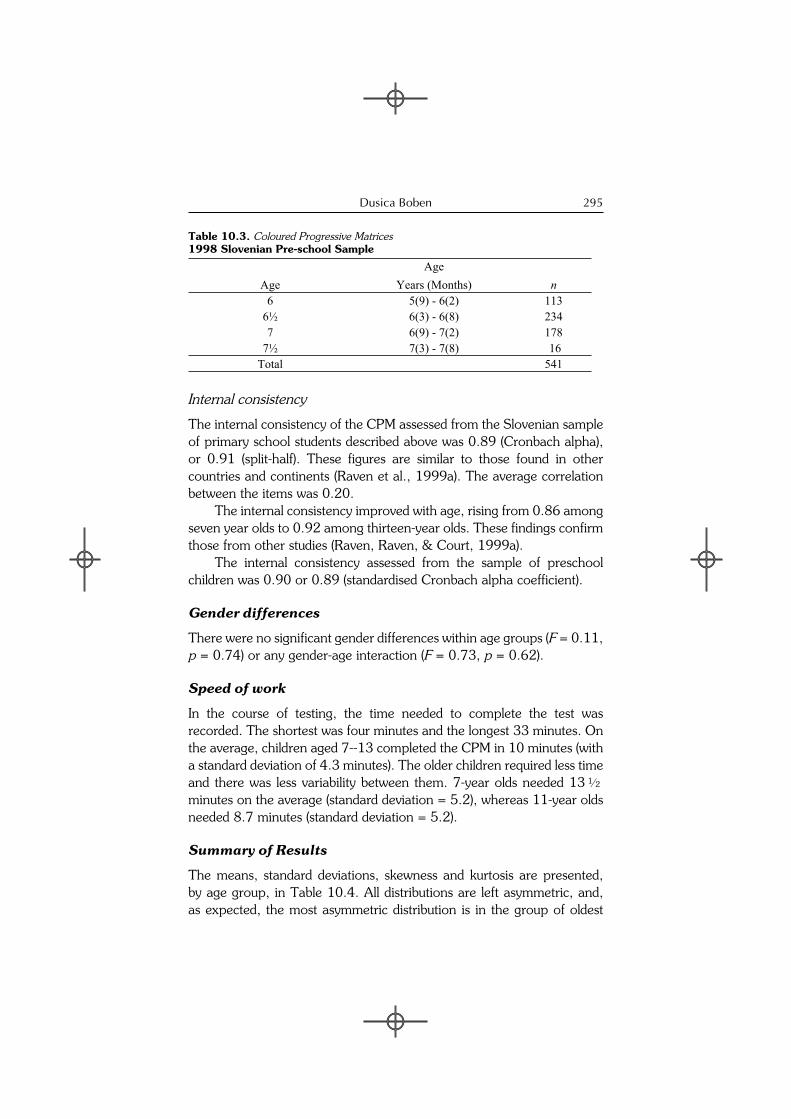
The sample of pre-school children was planned within the framework of research towards a PhD. thesis bearing the title Development of phonological conscience at pre-school children (Jerman, 2000). 541 children aged 6 to 7½ were included in the sample (Table 10.3). All of them were involved in pre-school programmes in 29 kindergartens in 29 different towns in Slovenia. The sample represents 0.95% of the population of Slovene children of this age. 48.7% of children in the sample were male. The children were tested individually and without time limitation. The testing was performed by 32 psychology students and psychologists that had previously been trained for this type of testing.
Item analysis
The (conventional) diffi culty indexes of the CPM items largely correspond to those established in the British studies. The small differences that did exist are discussed in the Web Psych Empiricist: http://WPE.info version of this article, where the results of a distractor analysis are also presented.
Table 10.2. Coloured Progressive Matrices 1998 Slovenian Sample (Primary School)
Age in YearsAge
Years (Months) Male Female Total7 6(6)-7(5) 27 28 558 7(6)-8(5) 174 160 3349 8(6)-9(5) 120 83 20310 9(6)-10(5) 107 94 20111 10(6)-11(5) 85 94 17912 11(6)-12(5) 64 63 12713 12(6)-13(5) 49 51 100
Total 626 573 1,199
Dusica Boben 295
Internal consistency
The internal consistency of the CPM assessed from the Slovenian sample of primary school students described above was 0.89 (Cronbach alpha), or 0.91 (split-half). These fi gures are similar to those found in other countries and continents (Raven et al., 1999a). The average correlation between the items was 0.20.
The internal consistency improved with age, rising from 0.86 among seven year olds to 0.92 among thirteen-year olds. These fi ndings confi rm those from other studies (Raven, Raven, & Court, 1999a).
The internal consistency assessed from the sample of preschool children was 0.90 or 0.89 (standardised Cronbach alpha coeffi cient).
Gender differences
There were no signifi cant gender differences within age groups (F = 0.11, p = 0.74) or any gender-age interaction (F = 0.73, p = 0.62).
Speed of work
In the course of testing, the time needed to complete the test was recorded. The shortest was four minutes and the longest 33 minutes. On the average, children aged 7--13 completed the CPM in 10 minutes (with a standard deviation of 4.3 minutes). The older children required less time and there was less variability between them. 7-year olds needed 13½ minutes on the average (standard deviation = 5.2), whereas 11-year olds needed 8.7 minutes (standard deviation = 5.2).
Summary of Results
The means, standard deviations, skewness and kurtosis are presented, by age group, in Table 10.4. All distributions are left asymmetric, and, as expected, the most asymmetric distribution is in the group of oldest
Table 10.3. Coloured Progressive Matrices1998 Slovenian Pre-school Sample
AgeAge
Years (Months) n6 5(9) - 6(2) 113
6½ 6(3) - 6(8) 2347 6(9) - 7(2) 178
7½ 7(3) - 7(8) 16Total 541

Chapter 10: RPM in Slovenia296
children. None of the distributions is explicitly bimodal, as are some found in the literature (e.g. Raven, 1981). The detailed normative data will be presented and discussed later.
SPM Standardisation, 1998
Sampling and the Sample
As described in the previous section, the SPM sample was drawn at the same time as the CPM one. The SPM sample included secondary pupils as well as primary school pupils.
The expression “secondary school” in this context refers to all three categories of secondary school: vocational, professional, and general (“gimnazije”). Thus it included students of educational programmes lasting three years, preparing them for vocations such as hairdressers, painters, car mechanics etc., students enrolled in educational programmes lasting four or fi ve years and awarding professional qualifi cations such as mechanical technician, chemistry technician, construction technician, and students enrolled in general ‘gimnazija’ programmes.
Overall, it covered students from the 1st to the 8th year at 10 primary schools and students of the fi rst and second year at 14 secondary schools -- altogether 1,556 children and adolescents aged 7½--18 years (Table 10.5). This amounts to 0.6 percent of the population. The youngest and
Table 10.4. Coloured Progressive MatricesMean (M), Standard Deviation (SD), Skewness And Kurtosis for Different Age Groups
AgeAge
Years (Months) n M SD Skewness KurtosisPre-School
6 5(9)-6(2) 113 22.8 6.3 -0.79 0.206½ 6(3)-6(8) 234 22.8 6.7 -0.81 -0.077 6(9)-7(2) 178 24.6 7.1 -0.64 -0.22
Primary School7 6(6)-7(5) 54 25.2 5.8 -1.04 1,448 7(6)-8(5) 334 25.9 5.8 -0.83 0,689 8(6)-9(5) 203 27.5 5.9 -0.88 0,2610 9(6)-10(5) 200 28.7 5.9 -1.28 1,2311 10(6)-11(5) 179 30.2 4.8 -1.32 1,83
12-13 11(6)-13(5) 227 31.1 5.8 -1.77 2.68

Dusica Boben 297
oldest students were somewhat under represented. 53% of the sample were male students.
Item analysis
In general, the diffi culty indexes for the SPM items match the original British ones very well. The differences are discussed in the Web Psych Empiricist version of this article. The correlations between the item diffi culties established separately within age group ranged from 0.76 (between 8- and 18-year olds) to 0.99 between two “neighbouring” age groups. These are comparable to the information from Great Britain (Raven, 1981). As with the CPM, a distractor analysis was also carried out and the results reported in the WPE version of this article.
Internal consistency
Both Cronbach alpha and split-half internal consistency indices were .95. The average correlation between the items was 0.22. Cronbach alphas calculated within one year age groups varied only slightly around the overall fi gure. Hence, there are no great differences between older and younger children, like the ones they discovered in Great Britain (Raven, 1981).
Table 10.5. Standard Progressive Matrices1998 Slovenian Sample
AgeAge
Years (Months) Male Female n8 7(6)-8(5) 53 46 999 8(6)-9(5) 71 57 12810 9(6)-10(5) 60 55 11511 10(6)-11(5) 73 52 12512 11(6)-12(5) 58 65 12313 12(6)-13(5) 55 61 11614 13(6)-14(5) 65 67 13215 14(6)-15(5) 70 74 14416 15(6)-16(5) 146 137 28317 16(6)-17(5) 115 96 21118 17(6)-18(5) 51 29 80
Total 817 739 1,556
Chapter 10: RPM in Slovenia298
Gender and age differences
Anova shows that subgroups differ in statistically signifi cant ways in relation to sex (F = 13.13, p = 0.00) and age group (one year intervals) from 8 to 18 years (F = 76.48, p = 0.00), but not regarding the interaction between them (F = 0.65, p = 0.77). A more detailed analysis shows that sex differences occur only in the older age groups. T-tests revealed statistically signifi cant differences for age groups of 16-year olds (p = 0.02), 17-year olds (p = 0.01) and 18-year olds (p = 0.04). Nevertheless, statistically signifi cant differences regarding sex were not confi rmed by Tukey’s HSD test for individual subgroups, separated by age. The bar diagrams in Figure 10.1 show the frequency distribution of raw scores for males and females. The females scored slightly higher in all age groups. In Great Britain, higher results were only achieved by girls older than 12 (Raven, 1981). Perhaps, in the Slovenian situation, the larger differences between the sexes at age of 16 to 18 could be explained by motivation.
Raw scores distributions and descriptive statistics
The average time required to complete the test was 25 minutes (SD = 6.7) The minimum was 8 minutes and the maximum 33 minutes.
Means, standard deviations, skewness and kurtosis for males and females combined for individual age groups from age 8--18 are presented in Table 10.6.
All distributions, except the one for the 8-year olds’ age group, are left asymmetric. The distributions for the 8 and 9-year old groups are bimodal, as in the British 1979 standardisation (Raven, 1981). For ages 9, 10½ and 12, bimodality also appears as in the Irish 1972 standardisation (Raven, 1981). As peaks appear at different values of the raw result and disappear at larger sub-samples, Raven (1981) suggests that they may be due to variance in the quality of the samples that is inevitably associated with random sampling. Other explanations are also possible, for example the adoption of different strategies for solving the problems (Lake, in Raven, 1981).

Dusica Boben 299
Table 10.6. Standard Progressive MatricesMean (M), Standard Deviation (SD), Skewness and Kurtosis for Different Age Groups
AgeAge
Years (Months) n M SD Skewness Kurtosis8 7(6)-8(5) 99 24.8 9.2 0.17 -0.779 8(6)-9(5) 128 30.3 10.8 -0.36 -1.0210 9(6)-10(5) 115 36.0 9.2 -0.29 -0.4511 10(6)-11(5) 125 38.4 9.8 -1.00 0.6012 11(6)-12(5) 123 42.1 7.8 -0.91 0.7813 12(6)-13(5) 116 42.9 9.1 -1.35 2.2814 13(6)-14(5) 132 42.6 9.0 -1.21 1.9015 14(6)-15(5) 144 45.8 8.9 -1.40 2.3516 15(6)-16(5) 283 45.5 8.9 -1.46 3.1617 16(6)-17(5) 211 46.0 9.1 -1.40 1.8218 17(6)-18(5) 80 46.4 7.7 -0.88 0.46
Figure 10.1. Standard Progressive MatricesDistribution of Scores by Gender
Raw score Raw score
N
SEX: male
0
36
72
108
144
180
216
-5 0 5 10 15 20 25 30 35 40 45 50 55 60 65 70
SEX: female
-5 0 5 10 15 20 25 30 35 40 45 50 55 60 65 70
Chapter 10: RPM in Slovenia300
SPM Plus Standardisation in 2005 and 2006
Sampling and the Sample
Adolescents aged 12 to 14
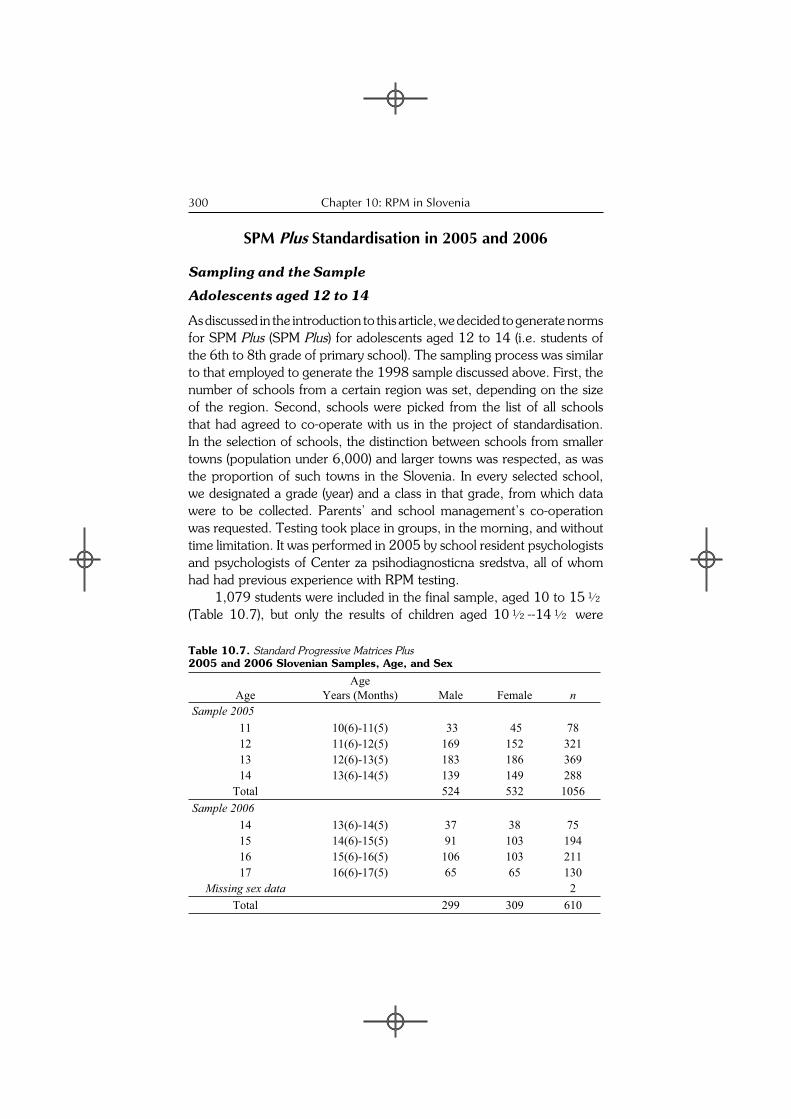
As discussed in the introduction to this article, we decided to generate norms for SPM Plus (SPM Plus) for adolescents aged 12 to 14 (i.e. students of the 6th to 8th grade of primary school). The sampling process was similar to that employed to generate the 1998 sample discussed above. First, the number of schools from a certain region was set, depending on the size of the region. Second, schools were picked from the list of all schools that had agreed to co-operate with us in the project of standardisation. In the selection of schools, the distinction between schools from smaller towns (population under 6,000) and larger towns was respected, as was the proportion of such towns in the Slovenia. In every selected school, we designated a grade (year) and a class in that grade, from which data were to be collected. Parents’ and school management’s co-operation was requested. Testing took place in groups, in the morning, and without time limitation. It was performed in 2005 by school resident psychologists and psychologists of Center za psihodiagnosticna sredstva, all of whom had had previous experience with RPM testing.
1,079 students were included in the fi nal sample, aged 10 to 15½ (Table 10.7), but only the results of children aged 10½--14½ were
Table 10.7. Standard Progressive Matrices Plus2005 and 2006 Slovenian Samples, Age, and Sex
AgeAge
Years (Months) Male Female nSample 2005
11 10(6)-11(5) 33 45 7812 11(6)-12(5) 169 152 32113 12(6)-13(5) 183 186 36914 13(6)-14(5) 139 149 288
Total 524 532 1056Sample 2006
14 13(6)-14(5) 37 38 7515 14(6)-15(5) 91 103 19416 15(6)-16(5) 106 103 21117 16(6)-17(5) 65 65 130
Missing sex data 2Total 299 309 610
Dusica Boben 301
included in our analyses. There were 1,056 such students. 50% of students included in the sample were female. 29% came from schools in towns with less than 6,000 inhabitants. Both these fi gures correspond well to the proportion in the population. Altogether, 25 primary schools took part in the project, 18-19 for each sub-sample.
15- and 17-year old adolescents
In 2006, Center za psihodiagnosticna sredstva agreed to co-operate in a project leading towards a graduation thesis entitled “Psychometriccharacteristics of Raven’s SPM-Plus regarding Slovene adolescents” (de Reggi, 2007). The target population consisted of students of the ninth grade of primary school and of the fi rst and second year of secondary schools. Schools were selected, as in the other research projects, according to the proportion of the population of the individual region. Regions with smaller populations were joined to neighbouring regions so that they are commonly represented in the sample. Ten primary schools and 10 secondary schools (three general secondary schools, fi ve professional secondary schools, and two vocational schools) from all over the country were included in the sample. Schools, within the statistical region and educational programme categories, were selected randomly using a telephone directory. Principals from two schools declined co-operation but very few parents did so.
Testing was performed by resident school psychologists and psychologists from Center za psihodiagnosticna sredstva. There was no time limit.
The fi nal sample included 610 adolescents, aged 14 to 17 (Table 10.7). Among them, 184 were students of the 9th grade of primary school, 225 of them were students of the fi rst year of secondary school and 201 were students of the second year of secondary school. 49% of the students in the sample were male. There were fewer 14-year olds (n= 75), as this age group was not the target group of the project, as the norms for this age group had already been collected.
Item analyses
The correlation between the item diffi culties for the SPM Plus (calculated in the traditional way - i.e. proportion choosing the correct answer) established separately in the fi rst and the second samples described above was 0.998 (or 1.00 to two decimal places). These item diffi culties also correspond to those published in the British Manual. It is important to
Chapter 10: RPM in Slovenia302
note, however, that, as in the UK, the item diffi culties do not increase steadily within Sets. The largest deviations are around B8-B12, C4-C8, and D6-D10. There is also a large discrepancy between the most diffi cult items of set C and the easiest items of set D. As explained in the original Manual (Raven et al 2000, updated 2004), this arose from the need to merge items from different Sets in the Parallel version of the Classic Standard Progressive Matrices to make room for the more diffi cult items in the SPM Plus. Despite these deviations from the, in some senses, ideal order of items, the net effect has, as can be seen from the graphs of item diffi culties published in Raven et al (2000, updated 2004) and in the chapters reporting the results of the Romanian standardization of the SPM Plus in this volume, been the production of a test having an almost linear relationship between total score and item diffi culty and an almost linear Test Characteristic Curve. This has enormous benefi ts from the point of view of avoiding misinterpretations of research and the calculation of change scores.
De Reggi re-analysed the data using a three-parameter Item Response Theory model (as operationalised in Bilog-MG software [(Du Toit, 2003)] and compared her results with the Romanian data reported elsewhere in this volume. The correlation between the conventional item diffi culties (as reported above) and those derived from the IRT based procedures was 0.95, and the correlation between the IRT-based diffi culty parameters from the Slovenian and Romanian sample was also 0.95. The greatest deviation can be observed at extreme values and can probably be attributed to the narrower age base of the Slovenian sample.
Distractor analysis revealed that misleading distractors (cases where adolescents chose one of the false answers more often than the correct one) are most often to be found in Set E, which is, of course, the most diffi cult Set. (This can be understood as the test administration instructions encourage guessing.) Similar results were found for the last items of sets C and D.
Internal consistency
Like most of the authors of other chapters in this book, we sought to assess the internal consistency of the SPM Plus without fully appreciating the inappropriateness of intercorrelating the items of IRT-based tests (as explained in the General Introduction to this book). The Cronbach alpha coeffi cient derived from our sample of 1079 was 0.81, and the standardised Cronbach Alpha 0.80. The split half coeffi cient was 0.83. The average correlation between items was 0.06. These fi gures are all
Dusica Boben 303
slightly lower than those for the Classic SPM for Slovene adolescents (Boben, 2003) and are probably due to the restricted range of scores in the sample (the test is, like the Classic SPM, intended for use with all age groups from 5 to 80 years of age). Nevertheless, they are relatively high compared with other tests and similar to those for the SPM Plus published by others (e. g. Mateši , 2000b, Dobrean et al., 2005)
Although the internal consistency varies with age group, the differences are small. It is lowest among 12-year olds (0.79), and highest among 11 and 13-year olds (0.82).
The internal consistency index (Cronbach alpha) of the SPM Plus for the second sample (n = 610) was 0.82, varying across age groups from 0.78 to 0.83. The standard error of measurement was 2.59 and standard error of estimate 2.34 (de Reggi, 2007).
Gender and age differences
The data from the fi rst sample were checked for age and sex differences. Anova confi rmed age group differences (F = 13.22, p = 0.00), but not differences between the sexes (F = 3.33, p = 0.07), which, considering numerous other researches, could be expected. Detailed analysis also showed that girls were better at solving the SPM Plus than boys in the subgroup of 11-year olds, which was the smallest group (t = -3.42, p = 0.001). This can probably be attributed to the size of the sample, which was too small and allowed different motivation of tested students to affect the results. Girls, on the average, achieved better results than boys in all of the age groups and in the entire sample. The results of the Romanian research for the entire sample were similar (Raven, Raven, & Court, 2004). Girls in Slovenia also achieve slightly higher results with the SPM (Boben, 2003).
Similar calculations were performed by de Reggi (2007). She found statistically insignifi cant differences between the sexes, with slightly higher average results in favour of girls aged 15--17. There were no statistically signifi cant differences between age groups in this sample. The higher the year of tested students, the higher the average results, with one exception: 17-year olds achieved a lower average value than students who were two years younger. There were statistically signifi cant differences between different categories of secondary schools: Students of vocational schools achieved results that were below the average values of the sample, whereas students of general secondary schools (“gimnazija”) achieved results higher than the average results of the sample.
Chapter 10: RPM in Slovenia304
Raw scores distributions and descriptive statistics
In the fi rst sample, the average time required to complete the SPM Pluswas between 30 minutes (11-year olds; SD = 12.6) and 34 minutes (14-year olds; SD = 13.2). The variability in the time required was highest among the oldest adolescents, and practically the same in the case of other tested adolescents -- approximately 12½ minutes. The average time required to complete the test increases with the age.
In the second sample (n= 610), the average time taken to complete the test was very similar in all of the age groups -- approximately 26 minutes. Only variability differs between age groups, being greatest in the group of 17-year olds (9 minutes) and smallest in the group of 14-year olds (7.5 minutes).
The within-age frequency distributions for the SPM Plus test in the Slovenian sample are normal, as was the case for the Classic SPM for this age (11--14 years). The descriptive statistics are summarised in Table 10.8. Average SPM Plus scores increase with age. All distributions are somewhat left symmetric, i.e. positioned towards higher results. The Kurtosis among 11-year olds was less satisfactory, but probably due to the sample as differences between the sex groups are also greater. This was also true of 14-year olds, the achievements of whom also differ from results from the other sample. In general, we can observe that average results in the 2006 sample are lower, although one would - because of the Flynn effect - expect higher results. The results of the 17-year olds are the most surprising in the sense that the average score does not fi t into the general tendency of scores to increase with age. The most probable explanation of this is lower motivation level, however another hypothesis is that socio-economic status was not explicitly controlled in the selection of the sample.
APM Standardisation, 1998
Sampling and the Sample
As mentioned earlier, the sample for the APM standardisation was drawn at the same time as that for the CPM and Classic SPM. Testing was carried out in groups, without time limitations. Only the APM II data were processed, although the APM I was used to present instructions and to check whether participants were capable of solving the test.
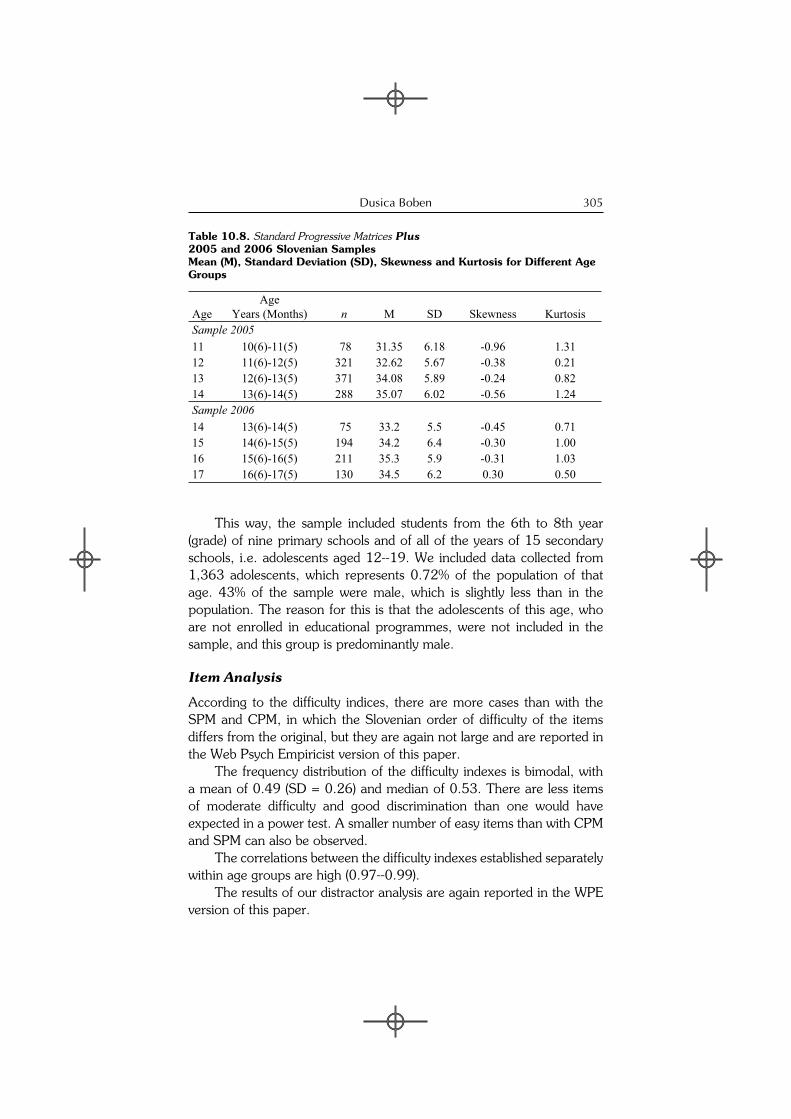
Dusica Boben 305
This way, the sample included students from the 6th to 8th year (grade) of nine primary schools and of all of the years of 15 secondary schools, i.e. adolescents aged 12--19. We included data collected from 1,363 adolescents, which represents 0.72% of the population of that age. 43% of the sample were male, which is slightly less than in the population. The reason for this is that the adolescents of this age, who are not enrolled in educational programmes, were not included in the sample, and this group is predominantly male.
Item Analysis
According to the diffi culty indices, there are more cases than with the SPM and CPM, in which the Slovenian order of diffi culty of the items differs from the original, but they are again not large and are reported in the Web Psych Empiricist version of this paper.
The frequency distribution of the diffi culty indexes is bimodal, with a mean of 0.49 (SD = 0.26) and median of 0.53. There are less items of moderate diffi culty and good discrimination than one would have expected in a power test. A smaller number of easy items than with CPM and SPM can also be observed.
The correlations between the diffi culty indexes established separately within age groups are high (0.97--0.99).
The results of our distractor analysis are again reported in the WPE version of this paper.
Table 10.8. Standard Progressive Matrices Plus2005 and 2006 Slovenian SamplesMean (M), Standard Deviation (SD), Skewness and Kurtosis for Different Age Groups
AgeAge
Years (Months) n M SD Skewness Kurtosis Sample 200511 10(6)-11(5) 78 31.35 6.18 -0.96 1.3112 11(6)-12(5) 321 32.62 5.67 -0.38 0.2113 12(6)-13(5) 371 34.08 5.89 -0.24 0.8214 13(6)-14(5) 288 35.07 6.02 -0.56 1.24Sample 200614 13(6)-14(5) 75 33.2 5.5 -0.45 0.7115 14(6)-15(5) 194 34.2 6.4 -0.30 1.0016 15(6)-16(5) 211 35.3 5.9 -0.31 1.0317 16(6)-17(5) 130 34.5 6.2 0.30 0.50
Chapter 10: RPM in Slovenia306
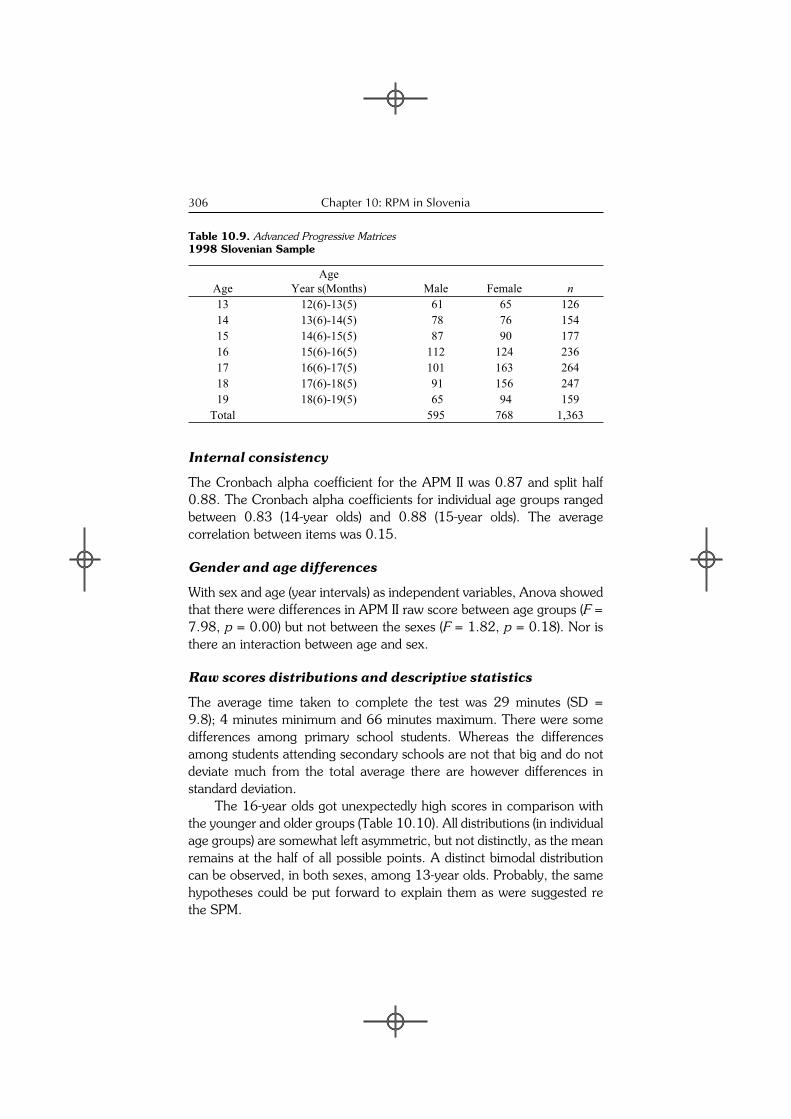
Internal consistency
The Cronbach alpha coeffi cient for the APM II was 0.87 and split half 0.88. The Cronbach alpha coeffi cients for individual age groups ranged between 0.83 (14-year olds) and 0.88 (15-year olds). The average correlation between items was 0.15.
Gender and age differences
With sex and age (year intervals) as independent variables, Anova showed that there were differences in APM II raw score between age groups (F = 7.98, p = 0.00) but not between the sexes (F = 1.82, p = 0.18). Nor is there an interaction between age and sex.
Raw scores distributions and descriptive statistics
The average time taken to complete the test was 29 minutes (SD = 9.8); 4 minutes minimum and 66 minutes maximum. There were some differences among primary school students. Whereas the differences among students attending secondary schools are not that big and do not deviate much from the total average there are however differences in standard deviation.
The 16-year olds got unexpectedly high scores in comparison with the younger and older groups (Table 10.10). All distributions (in individual age groups) are somewhat left asymmetric, but not distinctly, as the mean remains at the half of all possible points. A distinct bimodal distribution can be observed, in both sexes, among 13-year olds. Probably, the same hypotheses could be put forward to explain them as were suggested re the SPM.
Table 10.9. Advanced Progressive Matrices1998 Slovenian Sample
AgeAge
Year s(Months) Male Female n13 12(6)-13(5) 61 65 12614 13(6)-14(5) 78 76 15415 14(6)-15(5) 87 90 17716 15(6)-16(5) 112 124 23617 16(6)-17(5) 101 163 26418 17(6)-18(5) 91 156 24719 18(6)-19(5) 65 94 159
Total 595 768 1,363
Dusica Boben 307
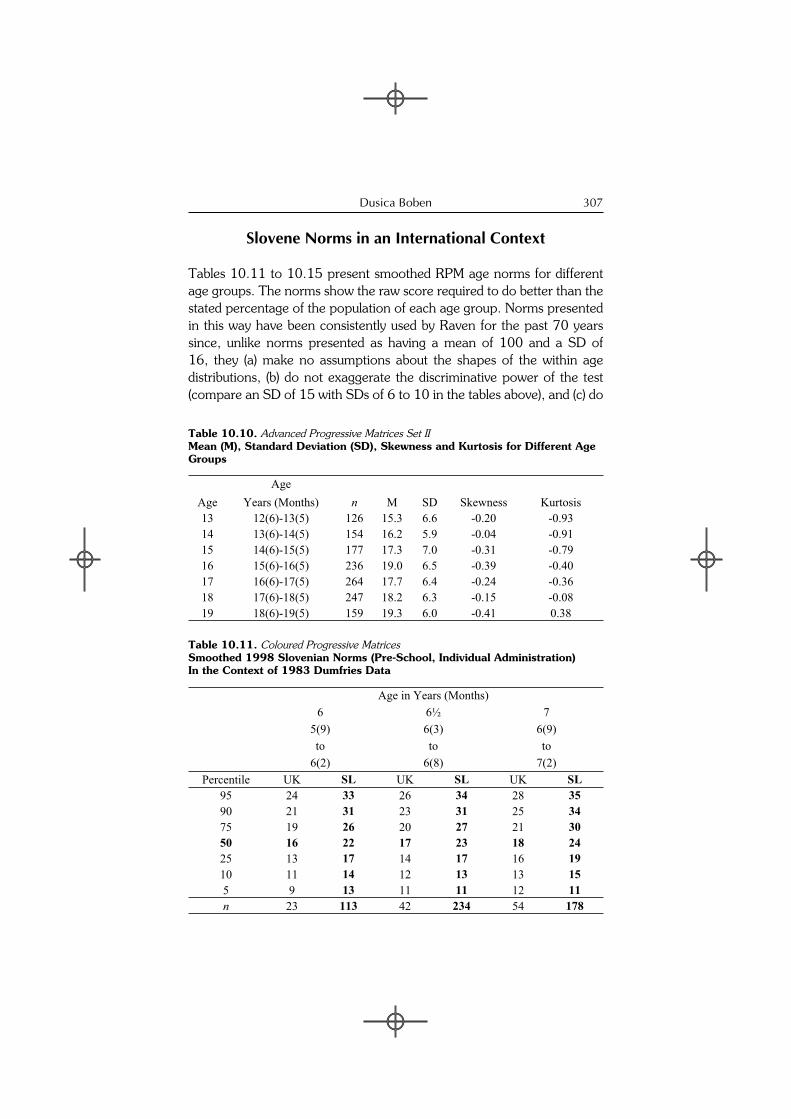
Table 10.11. Coloured Progressive MatricesSmoothed 1998 Slovenian Norms (Pre-School, Individual Administration)In the Context of 1983 Dumfries Data
Age in Years (Months)6 6½ 7
5(9) 6(3) 6(9)to to to
6(2) 6(8) 7(2)Percentile UK SL UK SL UK SL
95 24 33 26 34 28 3590 21 31 23 31 25 3475 19 26 20 27 21 3050 16 22 17 23 18 2425 13 17 14 17 16 1910 11 14 12 13 13 155 9 13 11 11 12 11n 23 113 42 234 54 178
Slovene Norms in an International Context
Tables 10.11 to 10.15 present smoothed RPM age norms for different age groups. The norms show the raw score required to do better than the stated percentage of the population of each age group. Norms presented in this way have been consistently used by Raven for the past 70 years since, unlike norms presented as having a mean of 100 and a SD of 16, they (a) make no assumptions about the shapes of the within age distributions, (b) do not exaggerate the discriminative power of the test (compare an SD of 15 with SDs of 6 to 10 in the tables above), and (c) do
Table 10.10. Advanced Progressive Matrices Set IIMean (M), Standard Deviation (SD), Skewness and Kurtosis for Different Age Groups
AgeAge
Years (Months) n M SD Skewness Kurtosis13 12(6)-13(5) 126 15.3 6.6 -0.20 -0.9314 13(6)-14(5) 154 16.2 5.9 -0.04 -0.9115 14(6)-15(5) 177 17.3 7.0 -0.31 -0.7916 15(6)-16(5) 236 19.0 6.5 -0.39 -0.4017 16(6)-17(5) 264 17.7 6.4 -0.24 -0.3618 17(6)-18(5) 247 18.2 6.3 -0.15 -0.0819 18(6)-19(5) 159 19.3 6.0 -0.41 0.38
Chapter 10: RPM in Slovenia308
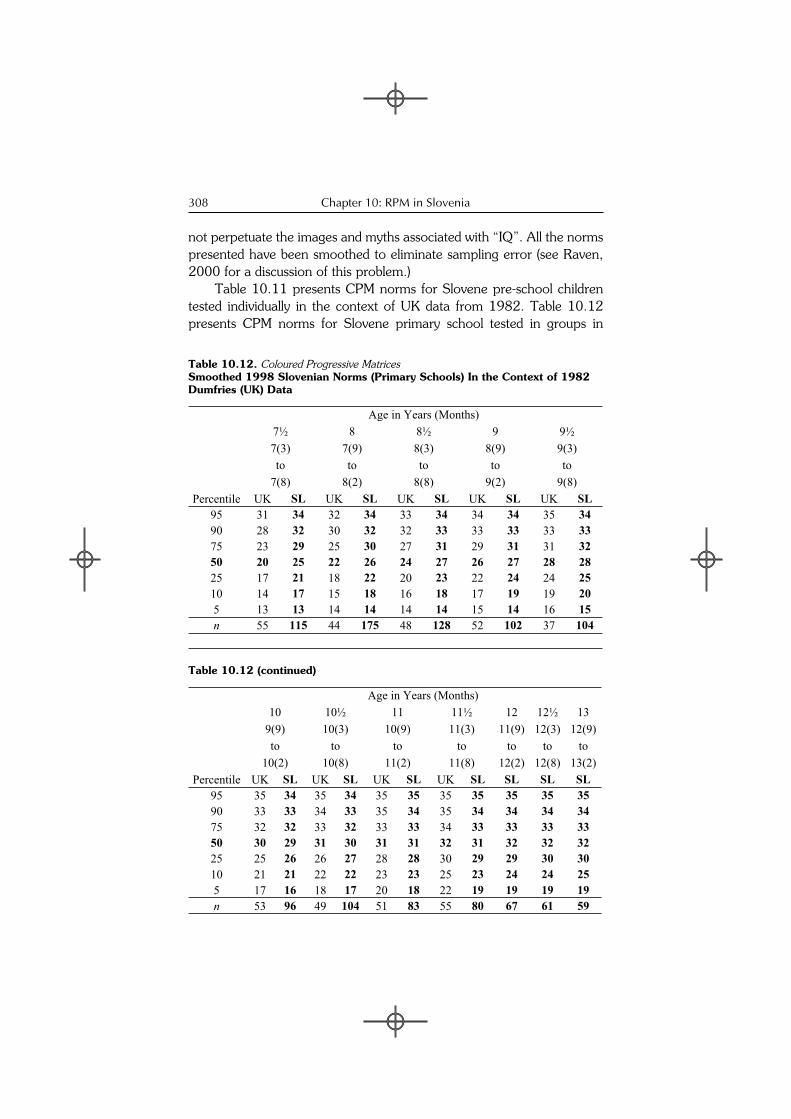
not perpetuate the images and myths associated with “IQ”. All the norms presented have been smoothed to eliminate sampling error (see Raven, 2000 for a discussion of this problem.)
Table 10.11 presents CPM norms for Slovene pre-school children tested individually in the context of UK data from 1982. Table 10.12 presents CPM norms for Slovene primary school tested in groups in
Table 10.12. Coloured Progressive MatricesSmoothed 1998 Slovenian Norms (Primary Schools) In the Context of 1982 Dumfries (UK) Data
Age in Years (Months)7½ 8 8½ 9 9½7(3) 7(9) 8(3) 8(9) 9(3)to to to to to
7(8) 8(2) 8(8) 9(2) 9(8)Percentile UK SL UK SL UK SL UK SL UK SL
95 31 34 32 34 33 34 34 34 35 3490 28 32 30 32 32 33 33 33 33 3375 23 29 25 30 27 31 29 31 31 3250 20 25 22 26 24 27 26 27 28 2825 17 21 18 22 20 23 22 24 24 2510 14 17 15 18 16 18 17 19 19 205 13 13 14 14 14 14 15 14 16 15n 55 115 44 175 48 128 52 102 37 104
Table 10.12 (continued)
Age in Years (Months)10 10½ 11 11½ 12 12½ 13
9(9) 10(3) 10(9) 11(3) 11(9) 12(3) 12(9)to to to to to to to
10(2) 10(8) 11(2) 11(8) 12(2) 12(8) 13(2)Percentile UK SL UK SL UK SL UK SL SL SL SL
95 35 34 35 34 35 35 35 35 35 35 3590 33 33 34 33 35 34 35 34 34 34 3475 32 32 33 32 33 33 34 33 33 33 3350 30 29 31 30 31 31 32 31 32 32 3225 25 26 26 27 28 28 30 29 29 30 3010 21 21 22 22 23 23 25 23 24 24 255 17 16 18 17 20 18 22 19 19 19 19n 53 96 49 104 51 83 55 80 67 61 59

Dusica Boben 309
Table 10.13. Standard Progressive Matrices1998 Slovenian Smoothed Norms In the Context of 1979 British Data
Age in Years (Months)8 9 10 11 12
7(9) 7(6) 8(9) 8(6) 9(9) 9(6) 10(9) 10(6) 11(9) 11(6)to to to to to to to to to to
8(2) 8(5) 9(2) 9(5) 10(2) 10(5) 11(2) 11(5) 12(2) 12(5)Percentile UK SL UK SL UK SL UK SL UK SL
95 40 40 44 46 48 48 50 50 52 5290 38 37 42 42 46 46 48 48 50 5075 33 32 38 39 42 43 44 45 46 4750 25 23 33 31 38 36 40 40 41 4225 17 18 25 22 32 28 34 33 37 3710 14 12 17 16 23 20 29 24 31 305 12 10 14 11 17 14 24 17 26 23n 174 99 166 128 172 115 187 125 164 123
Table 10.13 continued
Age in Years (Months)13 14 15 16 17 18
12(9) 12(6) 13(9) 13(6) 14(9) 14(6) 15(6) 16(6) 17(6)to to to to to to to to to
13(2) 13(5) 14(2) 14(5) 15(2) 15(5) 16(5) 17(5) 18(5)Percentile UK SL UK SL UK SL SL SL SL
95 54 53 55 54 57 55 56 56 5690 52 51 54 52 55 53 54 54 5475 49 48 50 49 51 50 51 52 5250 43 43 45 44 47 45 46 48 4925 39 38 42 39 42 40 41 41 4210 33 32 36 33 36 35 35 35 365 28 25 30 26 33 26 27 29 30n 185 116 196 132 191 144 283 211 80
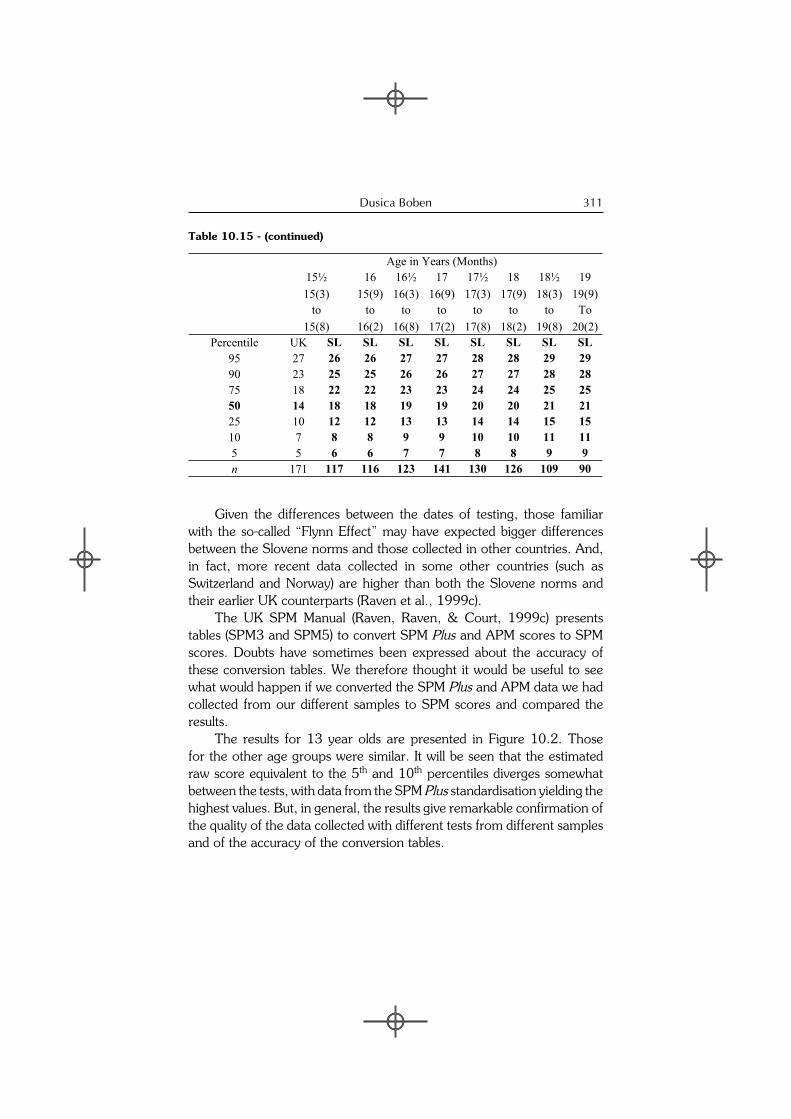
the context of the previously mentioned UK data. Table 10.13 presents Classic SPM norms for Slovenia in the context of the 1979 British data. Table 10.14 presents the Slovenian SPM Plus norms (from the fi rst sample) in the context of German (D), American (FB), Romanian (RO), Croatian (HR) and Polish (PL) data. Table 10.15 presents the Slovenian APM II norms in the context of British 1979 data.
By and large, the Slovene norms are remarkably similar to those obtained in other countries. The one exception seems to be that the

Chapter 10: RPM in Slovenia310
Slovenian CPM norms for young children tested individually are well above those for the comparison group from the UK. The children in the UK group were, however, only tested individually if they could not cope with the answer sheets on their own. So the higher scores would seem, almost certainly, to be a product of individual testing.
Table 10.14. Standard Progressive Matrices PlusComparison of Slovenian, German, Fort Bend (Texas), Romanian, Croation, and Polish Norms
Age in Years (Months) 11 12 13 14 14 14 14 14½ 14½ 15 15 15
10(6) 11(6) 12(6) 13(6) 13(9) 13(9) 13.5 14(3) 14(9)to to to to to to to to to
11(5) 12(5) 13(5) 14(5) 14(2) 14(2) 15.5 14(8) 15(2)Percentile SL SL SL SL D FB RO HR RO PL D FB
95 40 42 43 45 43 44 41 44 42 49 45 4690 37 40 41 42 40 41 39 42 40.1 48 43 4375 35 37 38 39 37 39 35 38 35 44 40 4050 32 33 34 35 33 36 31 35 31 39 36 3725 28 29 30 32 29 32 24 31 25 36 32 3410 24 25 27 28 26 30 18 27 19 33 29 315 21 23 24 25 24 27 15 21 15 30 27 29n 78 321 371 288 181 24 69 295 70 98 523 24
Table 10.15. Advanced Progressive MatricesSmoothed 1998 Slovenian Norms In the Context of 1979 UK Data
Age in Years (Months)12½ 13 13½ 14 14½ 15
12(3) 12(9) 13(3) 13(9) 14(3) 14(9)to to to to to to
12(8) 13(2) 13(8) 14(2) 14(8) 15(2)Percentile SL SL SL UK SL UK SL UK SL
95 23 23 24 23 24 25 25 26 2590 22 22 23 22 23 22 24 23 2475 19 19 20 17 20 17 21 18 2150 15 15 16 12 16 13 17 14 1725 9 9 10 10 10 10 11 10 1110 5 5 6 7 6 7 7 7 75 3 3 4 4 4 5 5 5 5n 50 62 75 196 66 189 84 191 71
Dusica Boben 311
Given the differences between the dates of testing, those familiar with the so-called “Flynn Effect” may have expected bigger differences between the Slovene norms and those collected in other countries. And, in fact, more recent data collected in some other countries (such as Switzerland and Norway) are higher than both the Slovene norms and their earlier UK counterparts (Raven et al., 1999c).
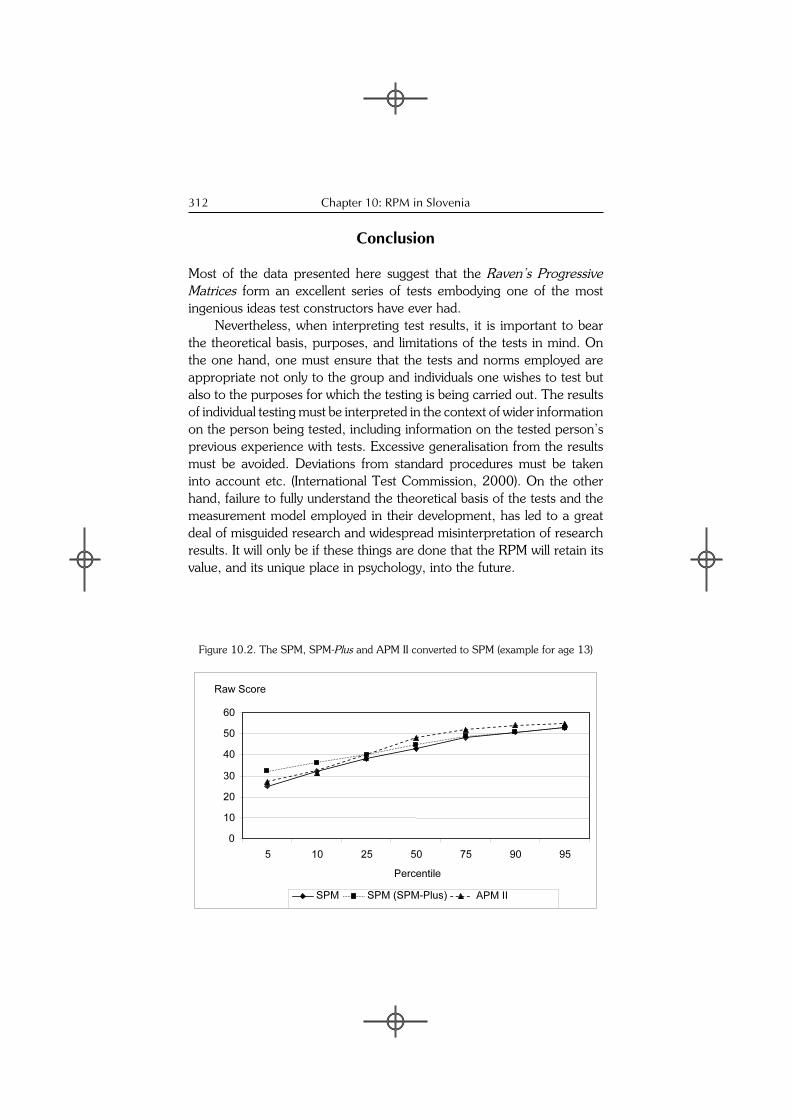
The UK SPM Manual (Raven, Raven, & Court, 1999c) presents tables (SPM3 and SPM5) to convert SPM Plus and APM scores to SPM scores. Doubts have sometimes been expressed about the accuracy of these conversion tables. We therefore thought it would be useful to see what would happen if we converted the SPM Plus and APM data we had collected from our different samples to SPM scores and compared the results.
The results for 13 year olds are presented in Figure 10.2. Those for the other age groups were similar. It will be seen that the estimated raw score equivalent to the 5th and 10th percentiles diverges somewhat between the tests, with data from the SPM Plus standardisation yielding the highest values. But, in general, the results give remarkable confi rmation of the quality of the data collected with different tests from different samples and of the accuracy of the conversion tables.
Table 10.15 - (continued)
Age in Years (Months)15½ 16 16½ 17 17½ 18 18½ 19
15(3) 15(9) 16(3) 16(9) 17(3) 17(9) 18(3) 19(9)to to to to to to to To
15(8) 16(2) 16(8) 17(2) 17(8) 18(2) 19(8) 20(2)Percentile UK SL SL SL SL SL SL SL SL
95 27 26 26 27 27 28 28 29 2990 23 25 25 26 26 27 27 28 2875 18 22 22 23 23 24 24 25 2550 14 18 18 19 19 20 20 21 2125 10 12 12 13 13 14 14 15 1510 7 8 8 9 9 10 10 11 115 5 6 6 7 7 8 8 9 9n 171 117 116 123 141 130 126 109 90
Chapter 10: RPM in Slovenia312
Conclusion
Most of the data presented here suggest that the Raven’s Progressive Matrices form an excellent series of tests embodying one of the most ingenious ideas test constructors have ever had.
Nevertheless, when interpreting test results, it is important to bear the theoretical basis, purposes, and limitations of the tests in mind. On the one hand, one must ensure that the tests and norms employed are appropriate not only to the group and individuals one wishes to test but also to the purposes for which the testing is being carried out. The results of individual testing must be interpreted in the context of wider information on the person being tested, including information on the tested person’s previous experience with tests. Excessive generalisation from the results must be avoided. Deviations from standard procedures must be taken into account etc. (International Test Commission, 2000). On the other hand, failure to fully understand the theoretical basis of the tests and the measurement model employed in their development, has led to a great deal of misguided research and widespread misinterpretation of research results. It will only be if these things are done that the RPM will retain its value, and its unique place in psychology, into the future.
Figure 10.2. The SPM, SPM-Plus and APM II converted to SPM (example for age 13)
0
10
20
30
40
50
60
5 10 25 50 75 90 95
Percentile
Raw Score
SPM SPM (SPM-Plus) APM II
Dusica Boben 313
References
Boben, D. (2003). Priro nik za Ravnove progresivne matrice in besedne lestvice. Slovenska standardizacija Ravnovih progresivnih matric: norme CPM, SPM, APM. [Manual for Raven’s Progressive Matrices and Vocabulary Scales. Slovenian Standardization of Raven’s Progressive Matrices: CPM, SPM, AMP norms.] Ljubljana: Center za psihodiagnosticna sredstva.
Boben, D. (2005). Priro nik za Ravnove progresivne matrice in besedne lestvice. SPM-Plus, Slovenske norme za mladostnike v primerjavi z drugimi normami : do-datek 3. zvezka priro nika (SPM). [Manual for Raven’s Progressive Matrices and Vocabulary Scales. SPM-Plus; Slovenian norms for adolescents in comparison to other norms. Supplement to Section 3.] Ljubljana: Center za psihodiagnosticna sredstva.
De Reggi, M. (2007). Psihometri ne zna ilnosti Ravnovih standardnih progresivnih mat-ric, oblika plus, pri slovenskih mladostnikih. Diplomsko delo. [Psychometric charac-teristics of Raven’s SPM-Plus regarding Slovene adolescents. Diploma.]Ljubljana:Univerza v Ljubljani. Filozofska fakulteta. Oddelek za psihologijo.
Dobrean (Domuta), A., Comsa, M., Rusu, C. (2005). In R. Balazsi, Romanian standard-ization of Raven’s Standard Progressive Matrices Plus. Budimpešta: 8EECPA.
International Test Commission (2000). International Guidelines for Test Use.Jerman, J. (2000). Ugotavljanje razvoja fonološkega zavedanja pri predšolskih otrocih.
Doktorska disertacija. [Development of phonological conscience at pre-school children. PhD Thesis.] Ljubljana: Univerza v Ljubljani, Pedagoška fakulteta, Oddelek za defektologijo.
Klop i , A. (2007). Standardizacija Testa nizov in analiza Flynnovega u inka. Diplomsko delo. [Test Series Standardization and Flynn Effect Analyses. Diploma.] Ljubljana:Univerza v Ljubljani. Filozofska fakulteta. Oddelek za psihologijo.
Lapajne, Z. (1997). Vlado Schmidt (1910-1997) in prvi slovenski skupinski testi inteli-gentnosti. [Vlado Schmidt (1910-1997) and fi rst Slovene group intelligence test.] TESTinfo, novice Centra za psihodiagnosticna sredstva, letnik 2, št. 1.
Mateši , K. (2000). Relations between results on Raven Progressive Matrices Plus sets and school achievement. Review of Psychology, 7(1-2), 75-82.
MacKintosh, N. J. (1998). IQ and Human Intelligence. Oxford: Oxford University Press.
Pe jak, V. (1983). Nastajanje psihologije. [Beginning of Psychology.] Ljubljana: Dopisna delavska univerza Univerzum.
Plut, M. (2003). Merske lastnosti poskusne verzije Besedne lestvice inteligentnosti Mill Hill. Diplomsko delo. [Psychometric characteristics of experimental version of Mill Hill Vocabulary Scales. Diploma.] Ljubljana: Univerza v Ljubljani, Filozofska fakulteta, Oddelek za psihologijo.
Raven, J. (1981). Manual for Raven’s Progressive Matrices and Vocabulary Scales. Research Supplement No. 1: The 1979 British Standardisation of the Standard Progressive Matrices and Mill Hill Vocabulary Scales, Together With Comparative Date from Earlier Studies in the UK, US, Canada, Germany and Ireland. San Antonio, TX: Harcourt Assessment.
Chapter 10: RPM in Slovenia314
Raven, J. (2000). The Raven’s Progressive Matrices: Change and stability over culture and time. Cognitive Psychology, 41, 1-48.
Raven, J., Raven, J. C. & Court, J. H. (1999a). Priro nik za Ravnove progresivne matrice in besedne lestvice. 1. zvezek: Splošni pregled. [Manual for Raven’s Progressive Matrices and Vocabulary Scales. Section 1: General Overview] Ljubljana: Center za psihodiagnosticna sredstva.
Raven, J., Raven, J. C., & Court, J. H. (1999b). Priro nik za Ravnove progresivne matrice in besedne lestvice. 2. zvezek: Barvne progresivne matrice. . [Manual for Raven’s Progressive Matrices and Vocabulary Scales. Section 2: CPM] Ljubljana:Center za psihodiagnosticna sredstva.
Raven, J., Raven, J. C., & Court, J. H. (1999c). Priro nik za Ravnove progresivne ma-trice in besedne lestvice. 3. zvezek: Standardne progresivne matrice. . [Manual for Raven’s Progressive Matrices and Vocabulary Scales. Section 3: SPM] Ljubljana:Center za psihodiagnosticna sredstva.
Raven, J., Raven, J. C., & Court, J. H. (1999d). Priro nik za Ravnove progresivne matrice in besedne lestvice. 4. zvezek: Zahtevne progresivne matrice. [Manual for Raven’s Progressive Matrices and Vocabulary Scales. Section 4: APM] Ljubljana:Center za psihodiagnosticna sredstva.
Raven, J., Raven, J. C., & Court, J. H. (2000, updated 2004). Manual for Raven’s Progressive Matrices and Vocabulary Scales. Section 3: The Standard Progressive Matrices, Iincluding the Parallel and Plus Versions. San Antonio, TX: Harcourt Assessment.
Raven, J., Raven, J. C., & Court, J. H. (2004). Manual for Raven’s Progressive Matrices and Vocabulary Scales, Section 3: Standard Progressive Matrices. SanAntonio, TX: Harcourt Assessment.
Rezultati raziskovanj. Seznam šol s splošnimi podatki ob za etku šolskega leta 1995/96. [Research results. List of schools in the beginning of school year 1995/96.] (1996). Ljubljana: Statisti ni urad Republike Slovenije.
Oakland, T. (1995). 44 country survey shows intenational test use patterns. PsychologyInternational, 6(1), Winter, 7.
Statisti ne informacije [Rapid Reports] (1992). Ljubljana: Statisti ni urad Republike Slovenije.
Statisti ne informacije [Rapid Reports] (1997). Ljubljana: Statisti ni urad Republike Slovenije.
Statistica for Windows. (1995). StatSoft Inc. Žalik, E. (2003). Slovenska priredba besedne lestvice izbirnega tipa Mill Hill. Diplomsko
delo. [Slovene adaptation of multiple-choice form of the Mill Hill Vocabulary Scales. Diploma.] Ljubljana: Univerza v Ljubljani, Filozofska fakulteta, Oddelek za psihologijo.