the state of european retail banking in 2015 … · the state of european retail banking in 2015...
TRANSCRIPT

THE STATE OF EUROPEAN RETAIL BANKING IN 2015
CONSTRUCTING A SUSTAINABLE SUPPLY-SIDE
Financial Services


CONTENTS
INTRODUCTION 5
1. PROFIT POOLS 6
MARKET DEFINITION 6
2014 RETAIL AND BUSINESS BANKING PERFORMANCE 6
2. CUSTOMER EXPERIENCE 10
DIGITAL BANKING AND CUSTOMER SATISFACTION 10
SWITCHING AND CUSTOMER EXPERIENCE 11
MASS-AFFLUENT 13
THE YOUNG AND THE OLD 14
3. FUTURE PROSPECTS 15
MARKET TRENDS 15
OPEN QUESTIONS AND ALTERNATIVE SCENARIOS 16
4. MANAGEMENT AGENDA 19
NEAR-TERM RESPONSES TO ECONOMIC AND REGULATORY PRESSURES 19
DEVELOPING A NEW BUSINESS MODEL 20
REFERENCE MATERIAL – METHODOLOGIES 21
REFERENCE MATERIAL – TERMINOLOGIES AND SCOPE 22


INTRODUCTION
The next 5 years will be a vital period for the European retail banking supply side. Management teams face
challenges on multiple fronts. Regulation continues to be a defining feature of the market in a range of areas,
from financial resource requirements, to sales protocols, to bank conduct, to payments mechanisms to name but
a few. The underlying economic and interest rate backdrop in many countries remains a difficult one. New forms
of competition are emerging – smaller “challenger banks”, growing roles for financial intermediaries, many new
non‑bank players. Changes in customer behaviour and technology are demanding fast‑paced responses and the
re‑invention of both distribution models and processes.
One can easily imagine a very negative scenario for traditional retail banks: overwhelmed by legacy balance sheets
and conduct issues, losing out to new competition and more disruptive business models, losing control of the
customer interface, struggling under the weight of regulation, and hamstrung by legacy systems and operating
models. This may indeed be the fate of some players.
There is also of course a more positive scenario: that retail banks step‑up to the plate and use their strengths in
brand, customer base and product to lead the evolution of the sector towards better outcomes for customers and
shareholders, meeting the immediate challenges resulting from new regulation and the economic position, and the
requirement to evolve a much more customer‑friendly, more technologically enabled business model.
We see many reasons for banks to be confident they can deliver the more positive outcome. The retail banking
sector is, at its heart, reasonably profitable and delivering a solid overall underlying core RoE of 14% in the European
market as a whole (after adjusting for the many one‑off P&L impacts and regulator fines). Many countries deliver
average core underlying RoEs over 15% in retail banking. Customer experiences are improving, aided by the shift
to digital channels. In many cases, financial resource management and cost management efforts are bearing fruit. Technology and changing customer behaviour offers a chance to develop this position further in ways that can
benefit everyone: better services and experiences for customers; lower costs and slicker operating models for the
banks themselves.
This report builds on our previous annual publications to provide an updated review of the state of Europe’s largest
retail and business banking markets. The report is structured into 4 sections:
1. European retail and business banking profit pools: a detailed, country level review of profitability and the underlying drivers.
2. Customer experience: a customer‑level view of the experiences delivered by their banks.
3. Market outlook: a view of the trends impacting the market over the next 5 years.
4. Management agenda: our views on the challenges and opportunities for bank management teams.
Copyright © 2015 Oliver Wyman 5

1. PROFIT POOLS
MARKET DEFINITION
This report uses a broad definition of European retail and business banking:
• Customers: including both individuals and small businesses (less than €25 MM turnover), excluding private banking.
• Products: core banking products (current accounts, savings, mortgages, loans, cards), bancassurance and investments.
• Countries: focus on Europe’s largest markets (France, Germany, Italy, Russia, Spain, Sweden, Turkey, United Kingdom).
For more details see the methodology section at the end of this report.
2014 RETAIL AND BUSINESS BANKING PERFORMANCE
Profit pools from retail and business banking activities were flat overall in the markets covered in our study, although
this observation clouds some significant changes at market level combined with some major currency movements
for non‑Eurozone markets. Revenues grew slightly over 2013–2014 (in € terms) with the mix of product and segment
volumes broadly stable.
Exhibit 1: Retail and business banking profit before tax over time
BREAKDOWN AT COUNTRY LEVEL (IN %, TOTAL IN €BN )
France
Spain
Germany
Sweden
Italy
Turkey
CAGR: -3%
Russia
UK
91
2011
17
19
18
653
10
22
87
2012
15
16
8
11
53
13
28
85
2013
17
17
8
16
236
31
83
2014
16
19
5
10
646
34
Source: Oliver Wyman Profit Pool Analysis 2015
Copyright © 2015 Oliver Wyman 6

Exhibit 2: Breakdown of retail and business banking revenue pools (€BN, 2011–2014)
81
19
78
22
78
22
79
21
Individuals
Smallbusiness
335349 349 355
2011 2012 2013 2014
16
21
16
9
1126
19
15
19
13
13
92
8
20
16
19
13
16
9 26
18
15
19
13
15
926
20
France
Spain
Germany
Sweden
Italy
Turkey
Russia
UK
335349 349 355
2011 2012 2013 2014
14
14
74
15
20
74656
15
16
73
19
18
4 365 5
16
17
83
18
17
1 3657
16
16
83
17
16
4365
6
Savings
Personal loans
Mortgages
OverdraftsCredit cards
Small business assets
Current accounts
BancassuranceSmall business liabilities
Retail investmentsALM revenues
2011
335349 349 355
2012 2013 2014
BREAKDOWN AT COUNTRY LEVEL BREAKDOWN AT SEGMENT LEVEL BREAKDOWN AT PRODUCT LEVEL
IN %, TOTAL IN €BN IN %, TOTAL IN €BN IN %, TOTAL IN €BN
Source: Oliver Wyman Profit Pool Analysis 2015
Turning to RoE, across the markets we looked at, “Core Underlying RoE” remained solid (though as in all banking
markets, many variants of RoE metrics can be usefully measured). Core Underlying RoE is defined as the underlying
return from retail and business banking, and as such does not include exceptional costs due to restructuring or
conduct fines. Importantly it also does not adjust for bank specific capital deductions (particularly due to goodwill)
that require those banks to hold additional equity and so often drive lower RoEs for individual banks than the Core
Underlying RoE seen in the market.
Exhibit 3: Definition of “Core Underlying RoE”
INCLUDED IN CORE UNDERLYING RoE EXCLUDED FROM CORE UNDERLYING RoE
• Profits from retail and business banking products (see appendix for list)
• Retail banking costs based on divisional reporting
• Credit losses
• Equity calculated as 12% of RWAs
• Profits from specialist products (e.g. student loans)
• Exceptional costs booked at group level
• Conduct fines and provisions
• Additional equity required due to bank specific deductions (e.g. goodwill) or other constraints (e.g. stress tests, leverage ratio)
There were some marked differences at a country level. We saw a major decline in profitability in Russia, driven by
an expected growth in credit losses and continued improvements in the UK, Spain and Sweden driven by improved
volume growth and lower credit losses. All other markets were broadly flat in terms of profitability between 2013
and 2014. Yet with the exceptions of Spain and Italy, core RoEs across European retail and business banking markets
remained healthy, reemphasising the importance of this business to overall bank profitability and pointing to a more
promising future for bank performance if legacy issues (non‑core portfolios, legacy conduct provisions) dissipate.
Provided that pricing and profitability can be maintained in these markets (for example against the headwinds of low
interest rates) then the outlook is promising.
Copyright © 2015 Oliver Wyman 7

Small business banking remains structurally lower‑return than banking for individuals in all markets. This is partly
due to the exclusion of the more profitable mid‑large business sector, but is also indicative of the large opportunity
in business model and proposition redesign and corresponding improvements in efficiency and effectiveness.
Exhibit 4: Small business vs. retail banking RoEs
2014, IN %
BREAKDOWN OF EMEA RETAIL BANKING CORE UNDERLYING RoE
14
5
21
Small business
Retail Banking sector
Individuals
Note: RoEs normalised with capital calculated as a percentage of RWAs, represented by the average of the Top 5 banks’ Core Tier 1 ratio in each country. ALM margin has been allocated at segment level in the RoE calculation. UK figures excluding PPI redress. Source: Oliver Wyman Profit Pool Analysis 2015
The performance by country in our study shows less homogeneity than in previous years with only France and
Germany as well as the UK and Sweden showing similar characteristics now at the country level.
• UK and Sweden, having re‑priced their assets (due to the nature of mortgage pricing in particular), avoided large credit losses and aggressive market deposit pricing and had the highest return markets on a per capita basis.
• Turkey has stabilised following a significant decline in its retail & business banking profitability but the outlook remains uncertain.
• France and Germany have lower profit per capita and profits/GDP than the markets above due to a greater reliance on liabilities where margins have been pushed down by lower interest rates and slower growth and heavier cost bases have constrained profit enhancement opportunities.
• Italy has low absolute returns due to high credit losses and low structural margins due to legacy asset margins and squeezed liability margins.
• Spain is now in recovery mode having restructured its assets and banking industry and improved profitability as a result.
• Russia has suffered with massively higher credit losses and a weaker exchange rate affecting profits in € terms. A weaker macroeconomy in 2014/15 points to continued difficulties.
Copyright © 2015 Oliver Wyman 8

Exhibit 5: Drivers of profitability across countries
FRANCE GERMANY ITALY RUSSIA SPAIN SWEDEN TURKEY UKNET INTEREST MARGIN
NON-INTEREST INCOME
TOTAL REVENUE MARGIN (INCL. ALM)
COST: INCOME
COST OF RISK
POST TAX RoE
Position relative to European average: Worse than European average At European average Better than European average
Source: Oliver Wyman analysis based on the 8 largest European markets (Spain, Italy, France, Germany, UK, Sweden, Turkey, Russia)
Copyright © 2015 Oliver Wyman 9

2. CUSTOMER EXPERIENCE
This section considers the customer view on the experiences delivered by their banks across EMEA. In particular we
note four points:
• Growing demand for digital banking services; and greater customer satisfaction levels from digital channels than branch channels.
• A clear link between switching levels, customer experience, and satisfaction rates within country markets; though this relationship not holding true for country‑level comparisons.
• Across Europe, a mass‑affluent segment that is relatively dissatisfied with the banking services it is provided with.
• Across Europe, younger customers generally more dissatisfied than older ones.
We examine each of these in turn below.
DIGITAL BANKING AND CUSTOMER SATISFACTION
Looking across EMEA, the level of digitisation of banking sales and services is far from uniform across countries.
Some markets – notably the UK and Nordic markets – have seen strong and rapid digitisation. Others – such as
Italy – have seen this same trend move more slowly. In almost all countries however our customer survey work shows
a clear trend: customers enjoy using digital channels; and enjoy using branches much less. This is creating a range of
challenges for banks:
• Digital extension: the need to extend digital capabilities to more banking customers.
• Digital arms‑race: the need to digitise more capabilities and processes, in both sales and servicing.
• Branch network restructuring: the need to fundamentally re‑think the role of the branch network across many dimensions – in‑branch staffing levels and roles; numbers and locations of branches; branch formats and layouts; mix of SME banking vs. retail banking roles.
Exhibit 6: Digital delight and branch hassle
BRANCH DIGITAL
Delight Hassle Net delight rate Delight Hassle Net delight rate
France 44% 14% 30% 51% 4% 46%
Italy 69% 16% 53% 75% 11% 64%
Spain 67% 15% 52% 74% 5% 69%
UK 46% 12% 34% 63% 4% 59%
XX Below average XX At average XX Above average
Note: Net delight rate defined as “Delight rate minus hassle rate” Source: Oliver Wyman proprietary Customer Experience Surveys conducted in France, Italy, Spain and UK between 2014 and 2015
Copyright © 2015 Oliver Wyman 10

SWITCHING AND CUSTOMER EXPERIENCE
We have long believed that banks should invest in improved customer experiences and make improved customer
satisfaction levels a priority for senior management. This is not only for the good of the end‑customer; we believe this
is an economic imperative for banks, in an environment where barriers to switching banking providers are falling,
new entrants/alternative providers are present in many markets, and backbook retention levels remain vital for the
economics of most banks.
Exhibit 7: Link between customer satisfaction and switching
Individual banks
CUSTOMER SATISFACTION VS. ACTUAL SWITCHING RATE (UK EXAMPLE)
6.4 6.8 7.2 7.6 8.0 8.4 8.80.0
SATISFACTION (0–10 SCALE)
SWITCHING RATE OVER THE PAST 12 MONTHS (% OF LOST CUSTOMERS)
Note: Overall satisfaction 0‑10 scale used where 0=not at all satisfied, 5=neutral, and 10=extremely satisfied ; switching rate is calculated as the number of lost customers in the last 12 months over the total number of surveyed customers of the bank Source: Oliver Wyman Customer Experience Survey conducted in UK in 2014
Looking in more detail at the causes of customer dissatisfaction, again common factors across countries can be discerned:
Exhibit 8: Reasons for switching
12
5
8
21
38
23
11
15
9
6
33
22
563
12
11
6
26
24
17
14
16
5
7
24
28
3
10
8
My banking environment changed (branch closed, I moved, etc.)
I was dissatisfied with products and services
I wanted to consolidate my financial relationships
My referent person was moved
I was not happy with my bank's reputation
I was dissatisfied with online and/or mobile offering
I was dissatisfied with product benefits and pricing
Others
France Italy Sweden UK
MAIN REASONS FOR SWITCHING BANK % OF RESPONSES
Note: % of all responses to Oliver Wyman Customer Experience surveys, covering France, Italy, Sweden and UK – several responses allowed Source: Oliver Wyman Customer Experience Surveys 2015
Copyright © 2015 Oliver Wyman 11
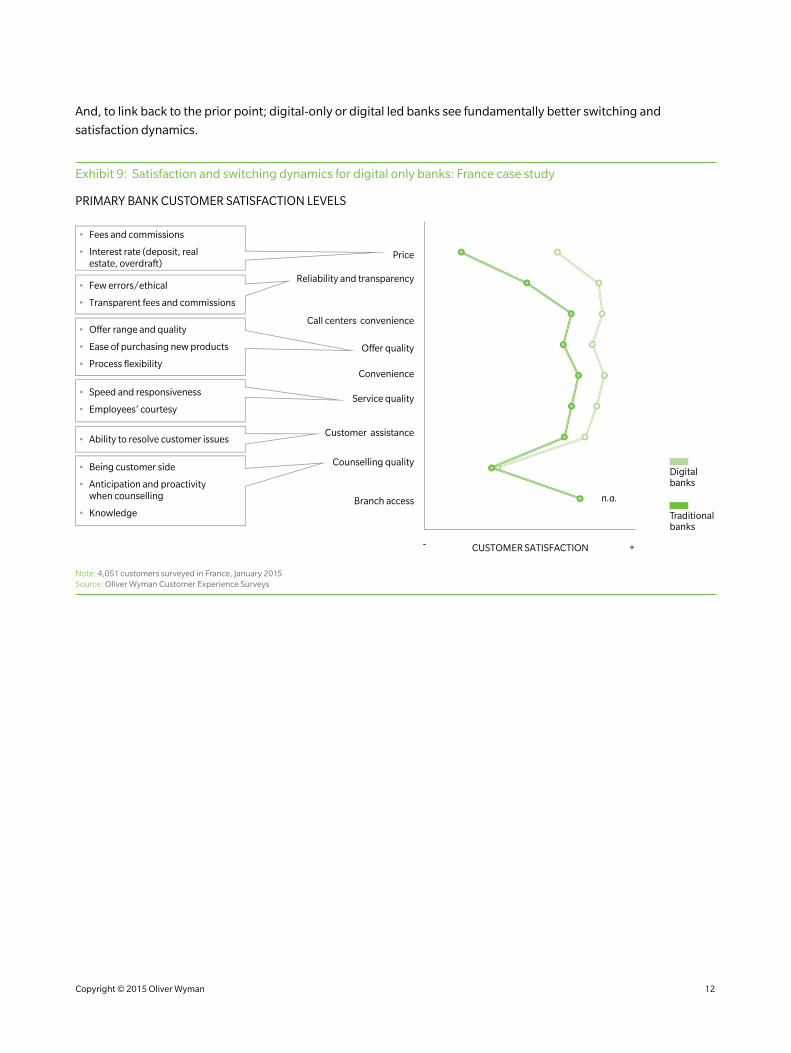
And, to link back to the prior point; digital‑only or digital led banks see fundamentally better switching and
satisfaction dynamics.
Exhibit 9: Satisfaction and switching dynamics for digital only banks: France case study
PRIMARY BANK CUSTOMER SATISFACTION LEVELS
Price
Branch access
Convenience
O�er quality
Reliability and transparency
Customer assistance
Counselling quality
Service quality
Call centers convenience
n.a.
CUSTOMER SATISFACTION +-
• Being customer side
• Anticipation and proactivity when counselling
• Knowledge
• Speed and responsiveness
• Employees’ courtesy
• O�er range and quality
• Ease of purchasing new products
• Process flexibility
• Fees and commissions
• Interest rate (deposit, real estate, overdraft)
• Few errors/ethical
• Transparent fees and commissions
• Ability to resolve customer issues
Traditional banks
Digitalbanks
Note: 4,051 customers surveyed in France, January 2015 Source: Oliver Wyman Customer Experience Surveys
Copyright © 2015 Oliver Wyman 12

MASS-AFFLUENT
Dealing with the more complex banking needs that come with above‑average wealth or income levels must
be a terrible burden across the continent, the affluent segment is clearly a group that is less satisfied with its
banking services, across Europe.
Exhibit 10: Dissatisfied rich
Switch considerers
13
14
Switchers9
14
Delight rate45
46
Hassle rate8
7
Overall sat
More switchconsideration
(+9%)
More switchers(+67%)
More delighted(+2%)
Less hassled(-4%)
Less satisfied(-2%)
Affluent customers are…
More switchconsideration
(+67%)
More switchers(+133%)
Less delighted(-13%)
More hassled(+43%)
Less satisfied(-7%)
Affluent customers are…
71
70
Switch considerers
6
10
Switchers9
21
Delight rate61
53
Hassle rate7
10
Overall sat75
70
UK FRANCE
Mass
Affluent
Source: Oliver Wyman Customer Experience Surveys 2015
Although many commentators may have an inherent lack of sympathy with this customer segment, we believe this
trend is both understandable, and vitally important for competitive dynamics.
First and most obviously, the demands from the affluent upon their banks are more complex: for both in investment
product needs and in core banking and payments services. Second this is a segment which has not been dealt with
well by the supply‑side in general:
• “Relationship manager” models are becoming outdated and often simply cannot be afforded, for sub‑private banking markets.
• The definition of the segment by banks is often poor; both too broad (propositions designed for too many different needs) and too simplistic (basic income or wealth hurdles).
• Product innovation has been limited – very few banks offer truly distinct products to the mass‑affluent segment (despite the fundamental difference in credit risk, product usage, and product demand between the mass‑affluent and mass segments).
Copyright © 2015 Oliver Wyman 13
THE YOUNG AND THE OLD
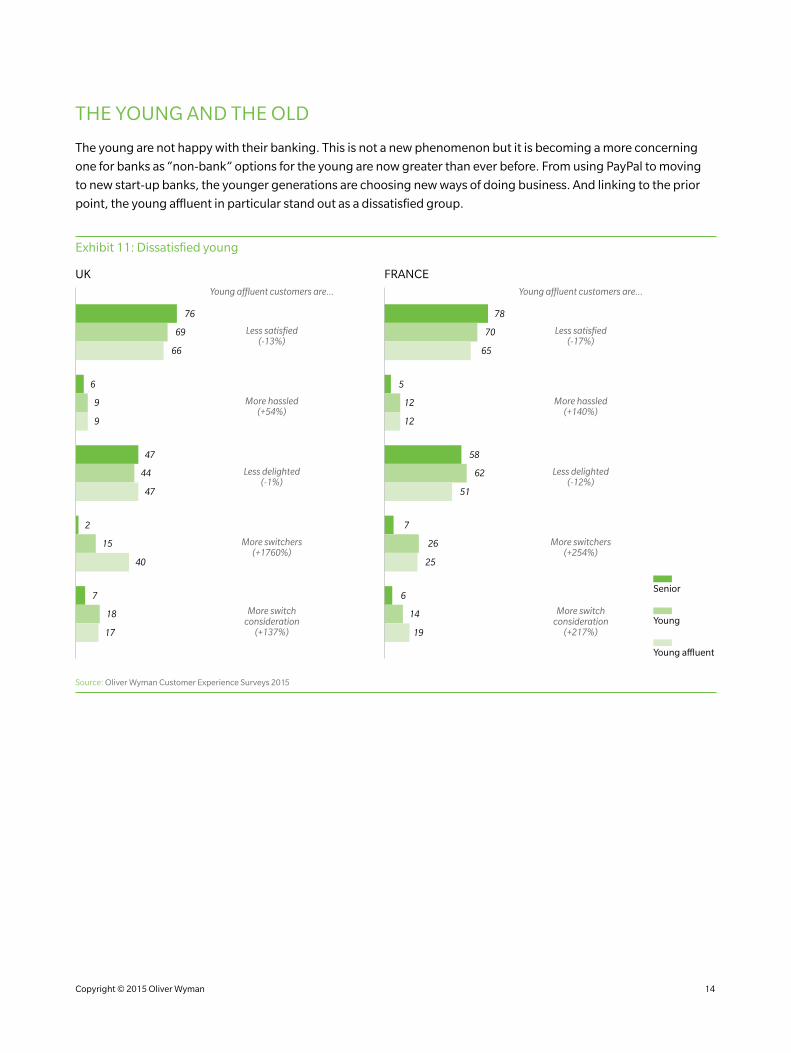
The young are not happy with their banking. This is not a new phenomenon but it is becoming a more concerning
one for banks as “non‑bank” options for the young are now greater than ever before. From using PayPal to moving
to new start‑up banks, the younger generations are choosing new ways of doing business. And linking to the prior
point, the young affluent in particular stand out as a dissatisfied group.
Exhibit 11: Dissatisfied young
More switchconsideration
(+137%)
More switchers(+1760%)
Less delighted(-1%)
More hassled(+54%)
Less satisfied(-13%)
Young affluent customers are…
76
69
66
6
9
9
47
44
47
2
15
40
7
18
17
More switchconsideration
(+217%)
More switchers(+254%)
Less delighted(-12%)
More hassled(+140%)
Less satisfied(-17%)
Young affluent customers are…
78
70
65
5
12
12
58
62
51
7
26
25
6
14
19
UK FRANCE
Young
Senior
Young affluent
Source: Oliver Wyman Customer Experience Surveys 2015
Copyright © 2015 Oliver Wyman 14

3. FUTURE PROSPECTS
MARKET TRENDS
Retail banking markets were historically characterised by a lack of dynamism and change. Product and channel
innovation was low. The supply‑side in each country was relatively static. Most customers banked with the same
bank forever. Today, there are several linked factors that are changing this situation, potentially radically:
• Technological factors. Mobile and online banking capabilities have already changed the industry significantly – and generally changes so far have been very positive (better outcomes and satisfaction levels for customers; more efficient operating models for banks). We see further technological evolution of these mobile and online platforms – in particular expansions of product sales/servicing capabilities, and easier to use, more robust customer interfaces. We anticipate further technology‑driven changes in the payments space in particular – both consumer‑facing changes (e.g. in ever‑easier point‑of‑sale activity, in foreign currency payments venues) and infrastructure changes (fundamentally slicker and quicker payments capabilities).
• Macroeconomic factors. Many EU markets remain challenged, with rising NPL rates and low growth. The interest rate environment remains a challenging one. In this context, many countries are likely to see accelerated supply‑side changes through both organic activity (customers moving to safer banks) and inorganic, regulatory‑led changes.
• Behavioural factors. Three trends in particular stand out here. First, linked to the above, the growing willingness of banking customers to embrace online and mobile services. We certainly see this trend continuing. Second, the growing willingness of customers to use financial services from non‑bank providers – whether for payments solutions, or more fundamental banking product provision. Third, gradual reductions in historical customer inertia and growing willingness to switch banking provider (though still, customer inertia remaining a major feature of banking in most markets).
• Regulatory factors. Since 2008, regulation has changed financial services as a whole quite fundamentally, and retail banking is no different. The industry is now faced with more stringent capital and liquidity requirements, more regulated sales processes, and more transparent and tougher conduct regulation (in the UK and now in continental Europe as well). In retail banking, we consider all of these trends as still in‑flight and with further to go over the next 5 years.
• Competitive factors. There are meaningful new entrants and potential in the retail banking business – specialist payments firms, supermarkets, Apple/Google/Amazon, new financial intermediaries, new “challenger banks” – the list is a long one. Revenues that have been historically owned by banks are being attacked, in some cases directly, in other cases more indirectly.
Copyright © 2015 Oliver Wyman 15

OPEN QUESTIONS AND ALTERNATIVE SCENARIOS
So how will the industry be different in the future? We point below to four open questions and alternative scenarios
around these.
To what extent will customers move to the best banks?
Historically the answer was “not very much…and anyway the banks are all the same”. We believe that the factors in
the prior section are certainly accentuating the customer‑facing differences between banks on many dimensions,
in particular:
• Products and pricing competitiveness: differences in innovation levels, and in raw operating/capital efficiency levels that feed through to pricing.
• Quality of the mobile and online offering: again, major differences here between banks in and across countries.
• Evolution of the branch channel: an industry‑wide need to evolve, but banks likely with very different levels of success in both making branches relevant for customers in new ways, and in cost management.
• Overall customer experience and brand: differences already existing and likely expanding going forward.
• Creditworthiness: in troubled markets, customers will continue to gravitate to the banks that are (or are perceived as) more creditworthy.
The key question is to what extent these effects will be recognised in customer‑driven market share movements. It is
certainly possible that the historical inertia effects remain and that market share movements remain small; our view
however is that this dynamic will loosen somewhat and market shares will begin to move towards the better banks.
To what extent will banks still own their own customer interface?
There is certainly an outcome where banks lose control of the customer interface, through a mix of face‑to‑face
intermediaries (for e.g. large scale borrowing and investment products) and online aggregators (expanded
price comparison sites plus current‑account aggregation). In extremis, banks would become product
providers, infrastructure owners, and balance sheet owners but not be direct distributors, and not have much of
a customer facing, cross‑product “relationship” role. Less extreme versions of this have banks maintaining their
customer‑facing relationship roles alongside more product‑led channels.
Copyright © 2015 Oliver Wyman 16

To what extent will technology/competition/regulation change the payments market?
The level of Fintech investment in the payments and transaction banking market is significant, covering a wide range
of areas.
Exhibit 12: Fintech Funding
2008
1.01.7 1.8 2.2
2.6
4.0
12.1
~2.5
0.01
2009 2010 2011 2012 2013 2014
2008–2013CAGR: +32%
2014CAGR: +70%
>200xgreater
Total Fintech Funding
Combined market cap of 29 G-SIFIs*2
GLOBAL FINTECH FUNDING*1, $ BN 2008–2014
FINTECH FUNDING GREW AT 71% CAGR LAST YEAR...
SELECTED 2014 KEY FIGURES, $ TN
BUT ONLY REPRESENTS <0.5% OF TOTAL G-SIFI MARKET CAPITALIZATION
*1 Non‑exhaustive list of large deals in FinTech in 2014*2 30 G‑SIFIs as of November 2014; BPCE excluded from total (market cap not available)Sources: Bloomberg, CB Insights
Copyright © 2015 Oliver Wyman 17

The level of success of this investment is still to be seen, but certainly there will be meaningful impacts on banks.
And in parallel with this, PSD2 is acting as a major force for change in the industry.
Exhibit 13: PSD2 landscape and scope
SCOPE OF DIRECTIVES
CARD SPECIFIC (INC. MIF) BROADER PAYMENTS
• Interchange caps
• Separation of scheme and processing
• Abolition of the Honour All Cards Rule (HACR)
• Co‑branding/co‑badging rights for card issuers
• Ban on surcharging (if interchange caps apply)
• Ban on geographical discrimination in card issuing/ merchant acquiring within EU
• Access to customer accounts by third party payment providers (PISPs and AISPs)
• Liability allocation for transactions with multiple PSPs
• Increased transparency of charges and payments
• Stiffer customer authentication rules
OBJECTIVES OF REGULATIONS
• More competition – create level playing field across the EU based on common, open standards with no geographical discrimination; limit current domination of two card schemes, reduce payment costs due to greater competition.
• More innovation – increase innovation incentives by allowing winners to reap rewards in a larger integrated EU market, support entry by more efficient players by enforcing transparent and fair pricing practices.
• More choice and transparency for customers – ensure customers have a choice of payment options with visible cost implications of their payment decisions, creating an environment steering customers to more efficient payment methods.
• More payment security and customer trust – guard safety of payments at POS, support development of more secure and safer remote payments, especially e‑commerce and mobile payments.
In extreme scenarios, banks could lose control of many parts of the value chain in the payments market; in less
extreme scenarios banks could retain or even extend their roles.
How much further will regulators adjust the structure and economics of the retail banking business?
This remains a core question for the industry on multiple dimensions; we would highlight the main
uncertainties over:
• How much further conduct‑related regulation moves, particularly on pricing/product structure issues.
• The extent to which further rounds of capital/liquidity regulation are pursued.
• The extent to which regulators are required to forcibly change the supply‑side structure in stressed markets.
Copyright © 2015 Oliver Wyman 18
4. MANAGEMENT AGENDA
We suggest a 2‑part agenda for European retail banking management teams. First, near‑term responses to the very
immediate economic and regulatory pressures faced. Second, the requirement to develop a new business model
that reflects the fundamental changes underway in customer behaviour, technology, and competition.
NEAR-TERM RESPONSES TO ECONOMIC AND REGULATORY PRESSURES
We suggest 6 agenda‑points here:
1. Look afresh at the non‑customer‑facing cost base. The industry has seen some progress on cost efficiency post‑crisis but not enough in many countries. And at the same time, the mix of technology and process re‑engineering offers powerful cost reduction potential for many areas of banking infrastructure.
2. Be scientific in your approach to new credit origination, selecting upfront and pursuing the worthy borrowers, as the faster and smarter players will act swiftly to capture them.
3. Actively manage RWA/capital/balance sheet allocations across the business. Given new rules around capital (RWA calculations, leverage ratio, stress testing, structural add‑ons etc), banks must review how they most effectively use financial resources in chosen business lines.
4. Explicitly manage conduct and customer fairness issues. Too much banking profit historically came from inappropriate sources; high back book margins coming from customer inertia; opaque fees; very high‑margin insurance/investment products, etc. The downside of this has been clear: erosion of customer trust, and in some cases, regulatory fines. Some markets – notably the UK – have seen significant action from the banks to better manage these issues. More remains to be done, particularly in continental Europe.
5. Position for the rates environment. For many parts of the Eurozone this likely means the range of strategies needed to live with low interest rates (e.g. development of fee based revenue streams; development of new brokerage products, consideration of peer‑to‑peer products; fundamental repricing of deposit products). For other countries – notably the UK – this means positioning for (at some point) rising rates and consideration of the value to be released from the deposit base.
6. Get ahead of your NPLs. In many EMEA markets, coping with the still mounting wave of NPLs is a huge challenge. Invest in NPL management across a spectrum of strategies ranging from efficient collection, to restructuring inhouse, to outsourcing and to selling, depending on your size, capabilities and the stage of maturity of your market.
Copyright © 2015 Oliver Wyman 19

DEVELOPING A NEW BUSINESS MODEL
The above will be necessary but not sufficient for bank management teams. Beyond this, you will need to craft and
advance a longer term agenda which will position your retail bank for the more structural challenges ahead. We
suggest 6 further agenda points:
1. Radically redesign your client service and distribution model. The bank of the future will have half the number of branches (or less) and a service level aligned to the digital leaders. How far are you from this? And what is the long term trajectory to get there? The required work will have three components:
− Rethink your branch model for the long term: how many? To do what? With what capabilities and roles?
− People strategy: how you move from the current culture, competence, diversity and mix to the target ones? How much can you change the people vs substitute the people?
− Develop your long term digital strategy. Partnering or competing with digital banks and Fintech? What approach to the challenge from aggregators? How much money to invest and where?
2. Commit to the development of a new cards & payments business. The cards and payments market is changing fast, driven by regulation (e.g. interchange regulation, broader PSD II regulation), new forms of competition (Paypal; the many small Fintech firms; potentially Google/Amazon/Apple), and customer behaviours (more mobile payments, reducing cash usage, greater adoption of low‑touch payments technologies). This requires banks to rethink their approach quite fundamentally across customer‑facing and infrastructure issues. Incumbent, traditional models are unlikely to be maintained.
3. Sharpen customer segmentation and proposition design. Particularly in the SME and mass‑affluent areas, customer propositions are not sufficiently distinctive. There is market share to be won in these segments in many countries from treating these segments better, and delivering more precisely to their product and servicing needs.
4. Digitally re‑engineer your processes. Particularly account opening/complex credit origination activities stand out as areas with significant scope for re‑engineering – saving costs and improving customer experience. The opportunity offered by end to end automation of banking processes enabled by a digital customer front‑end has received much discussion time but has often been put on the “too difficult” list by banks.
5. Rethink your participation levels more fundamentally, with a view to making more radical changes in areas where you do not have a competitive advantage. Look to exit, outsource, or create consortia around businesses or activities where you are challenged. This could span from specific product areas, to back office infrastructures, to parts of IT, to specific businesses, to specific client segments, to NPL management.
6. Define an active partnership strategy with adjacent sectors. From Fintech, to retailing, to real estate intermediation, to information/media, to industrial value chains. Look at these spaces as channels to feed clients to your services and offer their services to your clients.
Copyright © 2015 Oliver Wyman 20

REFERENCE MATERIAL – METHODOLOGIES
Oliver Wyman has created a proprietary database on European Retail and Small Business Banking that measures the
size of this market in eight European countries and across all Retail and Small Business products and services.
Since creating this database in 2010, we have calculated profit pools annually as a performance benchmark for the
European retail banks.
The database includes all key components of a P&L statement: volumes, net interest income, fees and commissions,
operating costs, credit loss provisions, tax and profit.
It also provides a breakdown of normalised core underlying RoE at country and segment levels (Individuals and
Small Business) with capital calculated as risk‑weighted assets multiplied by average Core Tier 1 ratio in each
country (weighted average of the Top 5 banks).
The profit pool analysis encompasses all products and services offered by a retail bank: mortgages, personal loans,
credit cards, overdraft and revolving lines, current accounts, instant‑access deposits, notice deposits, term deposits,
other country‑specific saving products, bancassurance, investment products, loans to small businesses and small
business deposits. It also includes related Asset and Liability Management management (ALM) products.
In the database, we only account for products and services provided by retail banks. As a consequence insurance
companies and private banks’ revenues are excluded. For example, if a retail bank offers an insurance product
manufactured by an insurance company, we consider in the revenue pool only the distribution commission paid to
the bank for distributing the product.
The data provided at country level covers the total retail and small business banking activity in that specific country,
provided by both local and foreign banks.
Copyright © 2015 Oliver Wyman 21

REFERENCE MATERIAL – TERMINOLOGIES AND SCOPE
COUNTRY SCOPE
The database includes eight European countries:
• France
• Germany
• Italy
• Russia
• Spain
• Sweden
• Turkey
• United Kingdom
PRODUCTS AND SERVICES
The database includes all products and services offered
by a retail bank:
• Mortgages: loans issued to finance home purchases/upgrades.
• Personal loans: unsecured loans, used for a variety reasons including durable goods, or as a cheaper borrowing alternative than overdrafts/credit card borrowing.
• Overdrafts and revolving lines: revolving facility attached to current accounts.
• Credit cards: form of unsecured credit offered in most retail banking markets. We consider two forms: delayed debit cards and revolving credit cards.
• Loans to Small Business: used for different purposes (investments, invoice, factoring, leasing, etc.) by Small Business enterprises.
• Current accounts: principal banking account used by individuals or Small Business and services attached, providing instant‑access to funds (e.g. through electronic transfers, withdrawals or a linked debit card).
• Instant‑access deposits: non‑current account deposits which are immediately accessible, yet are more frequently used for savings; these accounts often receive a small rate of interest.
• Notice deposits: deposits with a pre‑agreed period
of notice; early withdrawal leads to loss of interest.
• Term deposits: “locked in” deposits for an agreed
period of time; early withdrawal will incur a penalty.
• Other country‑specific savings: French regulated and unregulated livrets, bonds issued to retail customers.
• Bancassurance: commission‑driven products distributed through the retail banking channels; main products include PPI, P&C and life insurance.
• Investment products: commission‑driven products distributed through the retail banking channels; products include mutual funds and other collective investment schemes, direct holdings in listed stocks and shares, and direct holdings in government and other bonds.
PROFIT AND LOSS (P&L) COMPONENTS AND RETURN ON EQUITY (ROE)
All components of the P&L statement have been
analysed and gathered in the database:
• Net interest income: difference between customer interest rates paid/received and funding cost based on matched duration market rates.
• Fees and commissions: non‑interest income received from customers or third‑parties to distribute insurance or investment products.
• Operating costs: all operating costs calculated based upon the market‑observed cost/income ratio.
• Cost of risk: calculated based upon the industry observed weighted average cost of risk.
• ALM margin: revenue value generated by duration mismatch between assets and liabilities.
• Risk weighted assets: include credit risk and operational risk RWAs; amount is calculated based on a percentage of asset balances, which vary product by product to reflect risk of each asset class appropriately.
• Capital ratio: weighted average Core Tier 1 ratio of the largest banks in each country.
• Equity: risk weighted assets multiplied by the capital ratio.
• Return on Equity: total profit after tax in a given country or in a given segment divided by Equity.
Copyright © 2015 Oliver Wyman 22


THE STATE OF EUROPEAN RETAIL BANKING IN 2015
CONSTRUCTING A SUSTAINABLE SUPPLY-SIDE
Oliver Wyman is a global leader in management consulting that combines deep industry knowledge with specialised expertise in strategy, operations, risk management, and organisation transformation.
For more information please contact the marketing department by email at [email protected] or by phone at one of the following locations:
EMEA
+44 20 7333 8333
AMERICAS
+1 212 541 8100
ASIA PACIFIC
+65 6510 9700
Copyright © 2015 Oliver Wyman
All rights reserved. This report may not be reproduced or redistributed, in whole or in part, without the written permission of Oliver Wyman and Oliver Wyman accepts no liability whatsoever for the actions of third parties in this respect.
The information and opinions in this report were prepared by Oliver Wyman. This report is not investment advice and should not be relied on for such advice or as a substitute for consultation with professional accountants, tax, legal or financial advisors. Oliver Wyman has made every effort to use reliable, up-to-date and comprehensive information and analysis, but all information is provided without warranty of any kind, express or implied. Oliver Wyman disclaims any responsibility to update the information or conclusions in this report. Oliver Wyman accepts no liability for any loss arising from any action taken or refrained from as a result of information contained in this report or any reports or sources of information referred to herein, or for any consequential, special or similar damages even if advised of the possibility of such damages. The report is not an offer to buy or sell securities or a solicitation of an offer to buy or sell securities. This report may not be sold without the written consent of Oliver Wyman.
CONTACT
www.oliverwyman.com
JASON QUARRY
[email protected]+44 20 7852 7567
SIMON LOW
[email protected]+44 20 7852 7550
GIOVANNI VIANI
[email protected]+39 02 3057 7504
VANESSA LOPES RODRIGUES
[email protected]+33 173 044 616
MARIA D’ARPA
[email protected]+44 20 7852 7293