the state of fintech - pwc: audit and assurance ... · pdf file03 global state of fintech 04...
TRANSCRIPT

THE
STAT
E O
F FI
NTE
CH
THE STATE OF FINTECH
THE
STAT
E O
F FI
NTE
CH
Executive SummaryFinTech has transformed our daily lives thanks to personalised access to robo-advisors, innovative mobile payment solutions, instant cross-border transactions and many other applications. The evolving trend of FinTech products and services empower consumers and small businesses in ways that were unimaginable in the past. The potential disruptive innovation FinTechs bring in turn attracts significant funding from investors seeking the next BIG thing.
This report draws out parallels seen between general tech trends on a macro scale and correlates them to the impact on FinTech. One highlight shows how China and India are spearheading the advancements that are shaping global trends in this sector. The cumulative total of FinTech investments in China alone outweighs all FinTech investments made in the entirety of the rest of the Asia Pacific region. The East is now in a position to innovate and not just adopt ideas coming from the west.
FinTech might already seem mature, given the vast amount of funding poured into it, the increasing number of FinTech startups and corporate innovations being engineered today. Such a claim may have seemed farfetched 5 years ago when the level of funding in the FinTech industry stood at a meagre US$3.1m! Fast-forward to 2017, and in the first quarter alone, US$1.8bn has already been injected into the sector globally.
The future of FinTech remains bright, in spite of claims that the current upward trend is a bubble. The World Bank Group (WBG) estimates that 42% of the global population still do not have access to a formal financial system. This presents a hugeopportunity to be tackled by FinTechs that cannot be addressed by traditional Financial Institutions. There are still untapped or new emerging markets waiting to be discovered. Asia has the largest percentage of the under-banked population and a large growing middle class who will soon need new solutions to address their wealth management and banking needs.
Together, Startupbootcamp and PwC have put together this report to provide a holistic view of the FinTech industry, starting from its current state, discussing where FinTech is headed, and the technological advances and geographical context that willlead it there. 2
THE
STAT
E O
F FI
NTE
CH
3
Global Tech Trends01
Global FinTech Trends02
Global State of FinTech03
The Future of Fintech in Asia Pacific04
Content
THE
STAT
E O
F FI
NTE
CH
GLOBALTECH TRENDS
THE
STAT
E O
F FI
NTE
CH
5
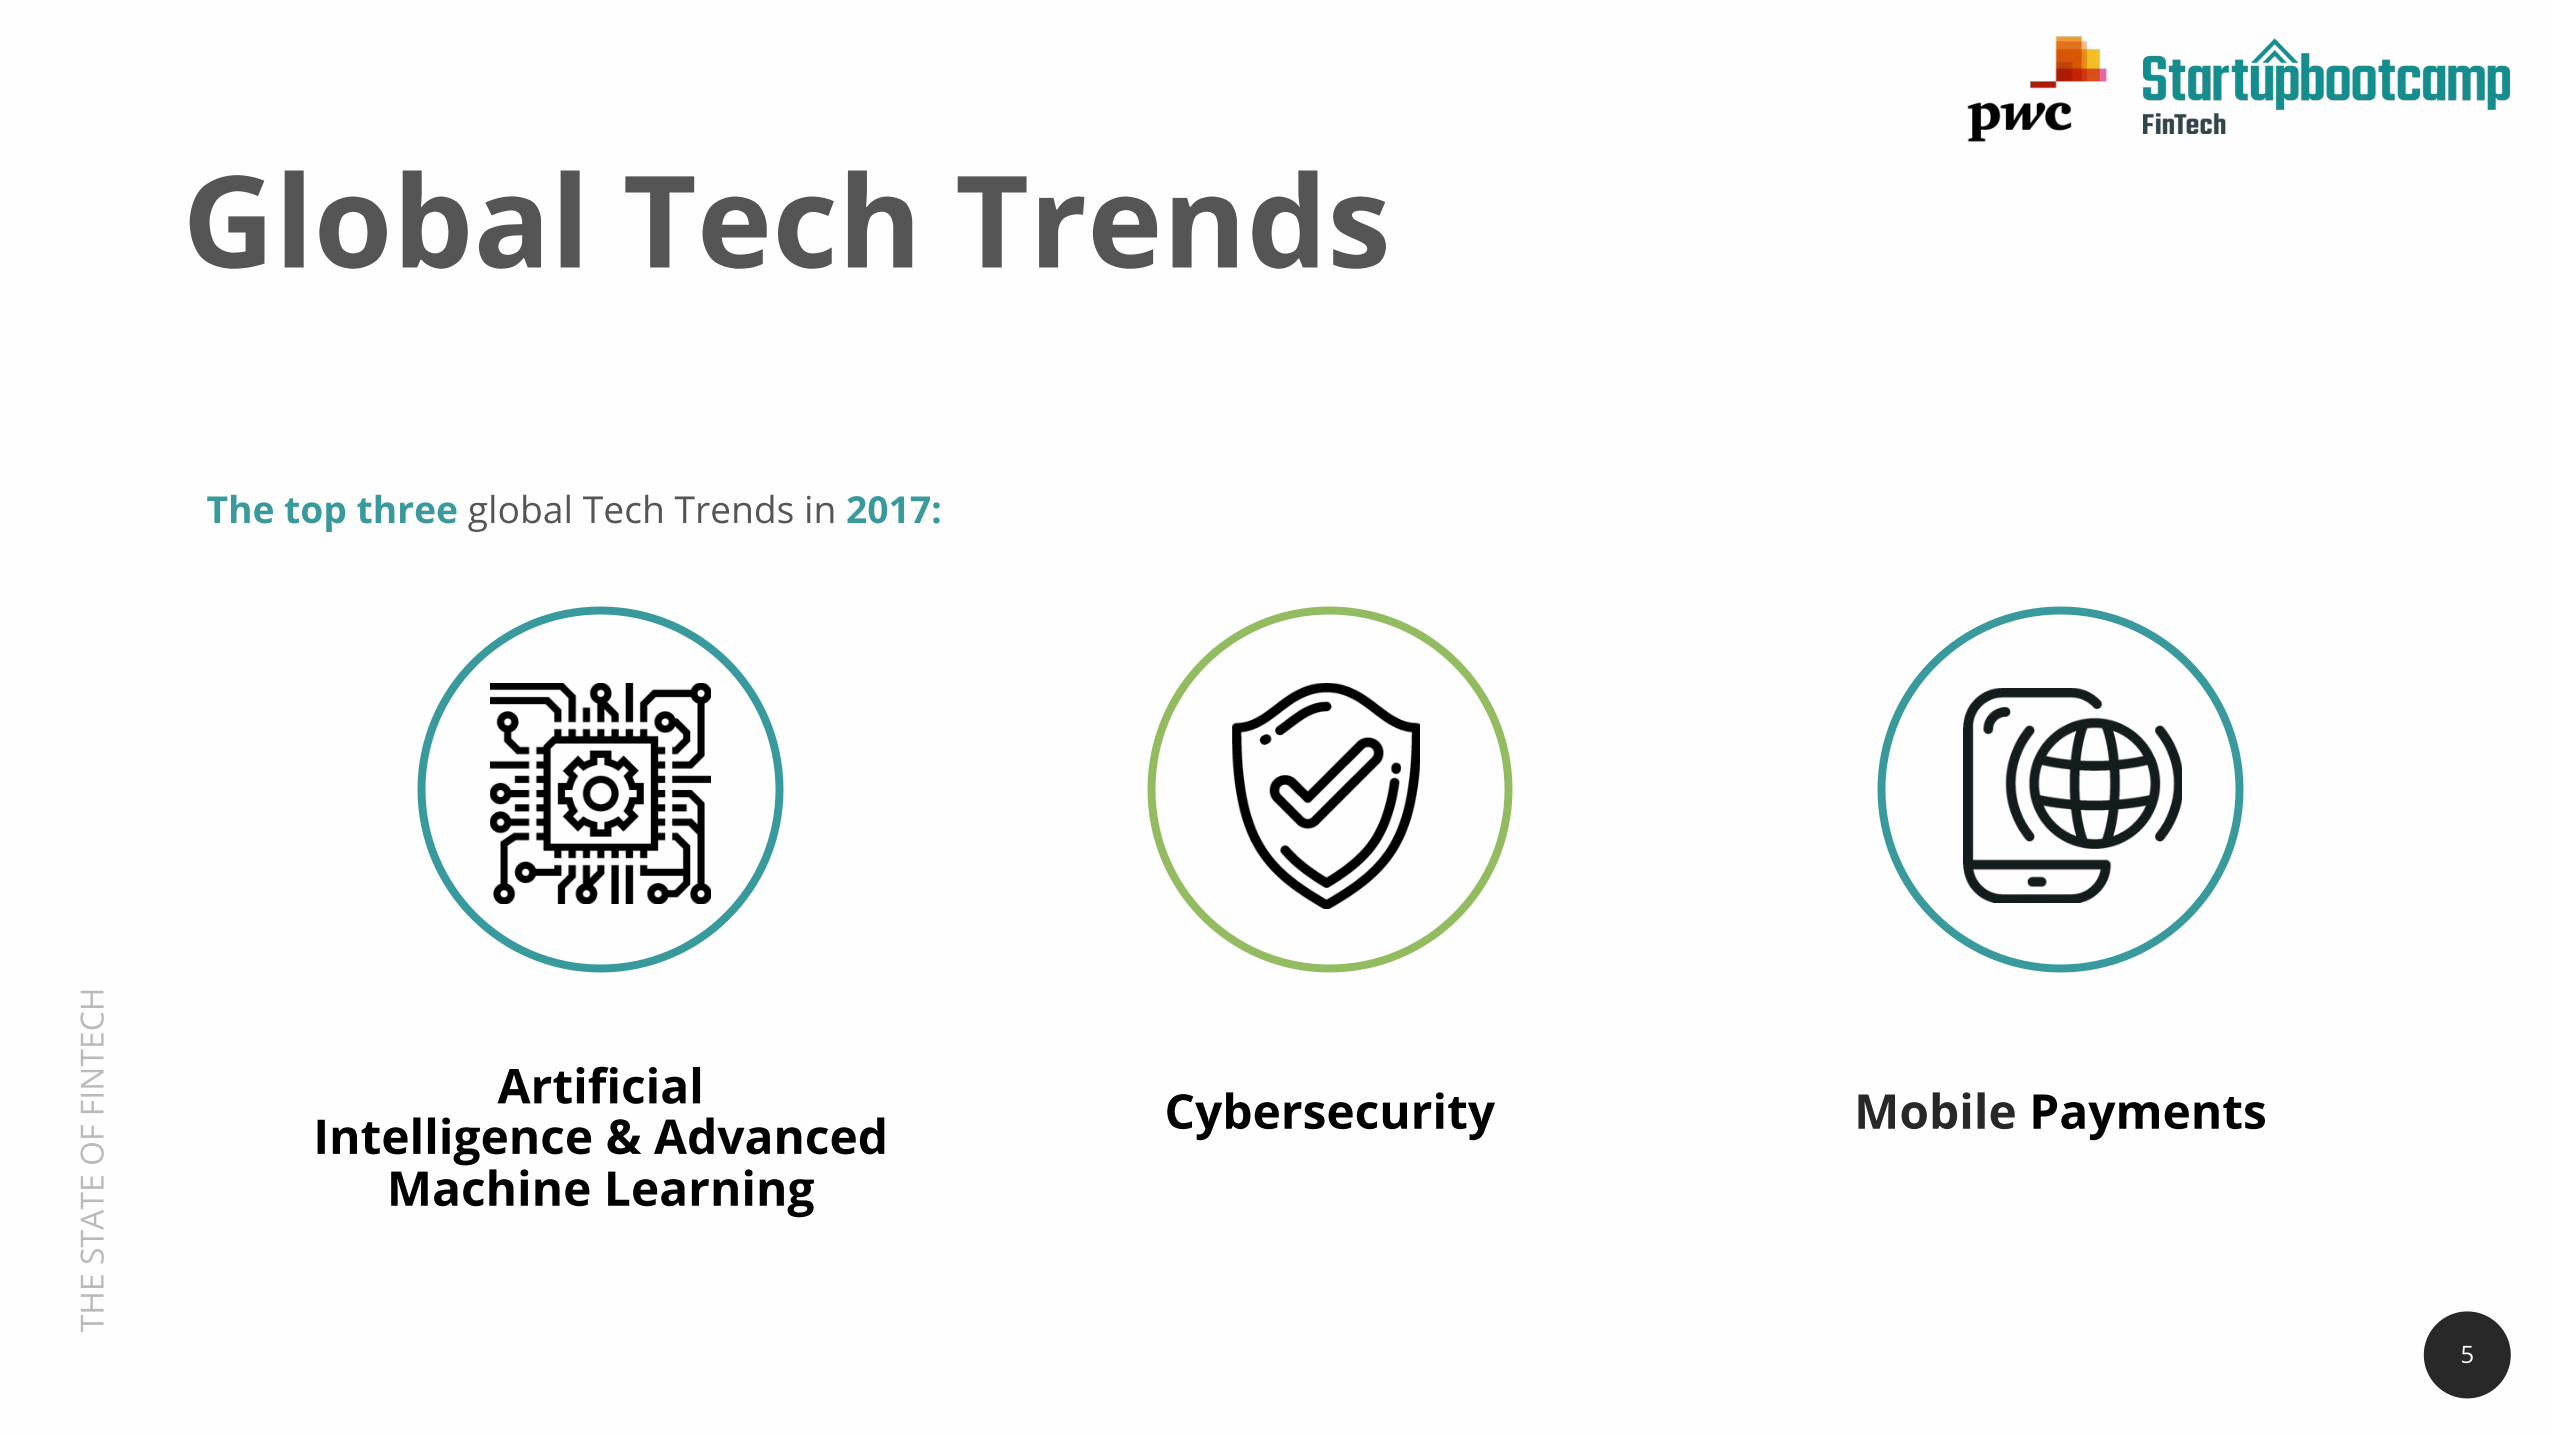
Global Tech Trends
The top three global Tech Trends in 2017:
Mobile PaymentsArtificialIntelligence & Advanced
Machine Learning
z
Cybersecurity
THE
STAT
E O
F FI
NTE
CH
6
Artificial Intelligence & Advanced Machine Learning
“We’re at an inflection point where artificial intelligence can help business makebetter and faster decisions. It requires an open mind—and a willingness tochange—to take advantage of it.”
Source: The human factor: Working with machines to make big decisions – PwC
6
Global Tech Trends: AI

THE
STAT
E O
F FI
NTE
CH
Data Abundance Fuels Powerful Machine Learning Models
The abundance of data has enabled platforms to scale andgenerate new models as shown by the exponential growth innumber of AI related software projects being developed atGoogle.
At Startupbootcamp, we have noticed that an increasednumber of start-ups are putting data driven decision makingand AI into the core of their products whereas many largecorporations are still relying on intuition and experience whenit comes to making big decisions.
7
2012 2013 2014 2015
600
0
2700
2100
1800
900
2400
1500
1200
300
No. of software projects at Google using Deep Learning
Source: Google
Global Tech Trends: AI
THE
STAT
E O
F FI
NTE
CH
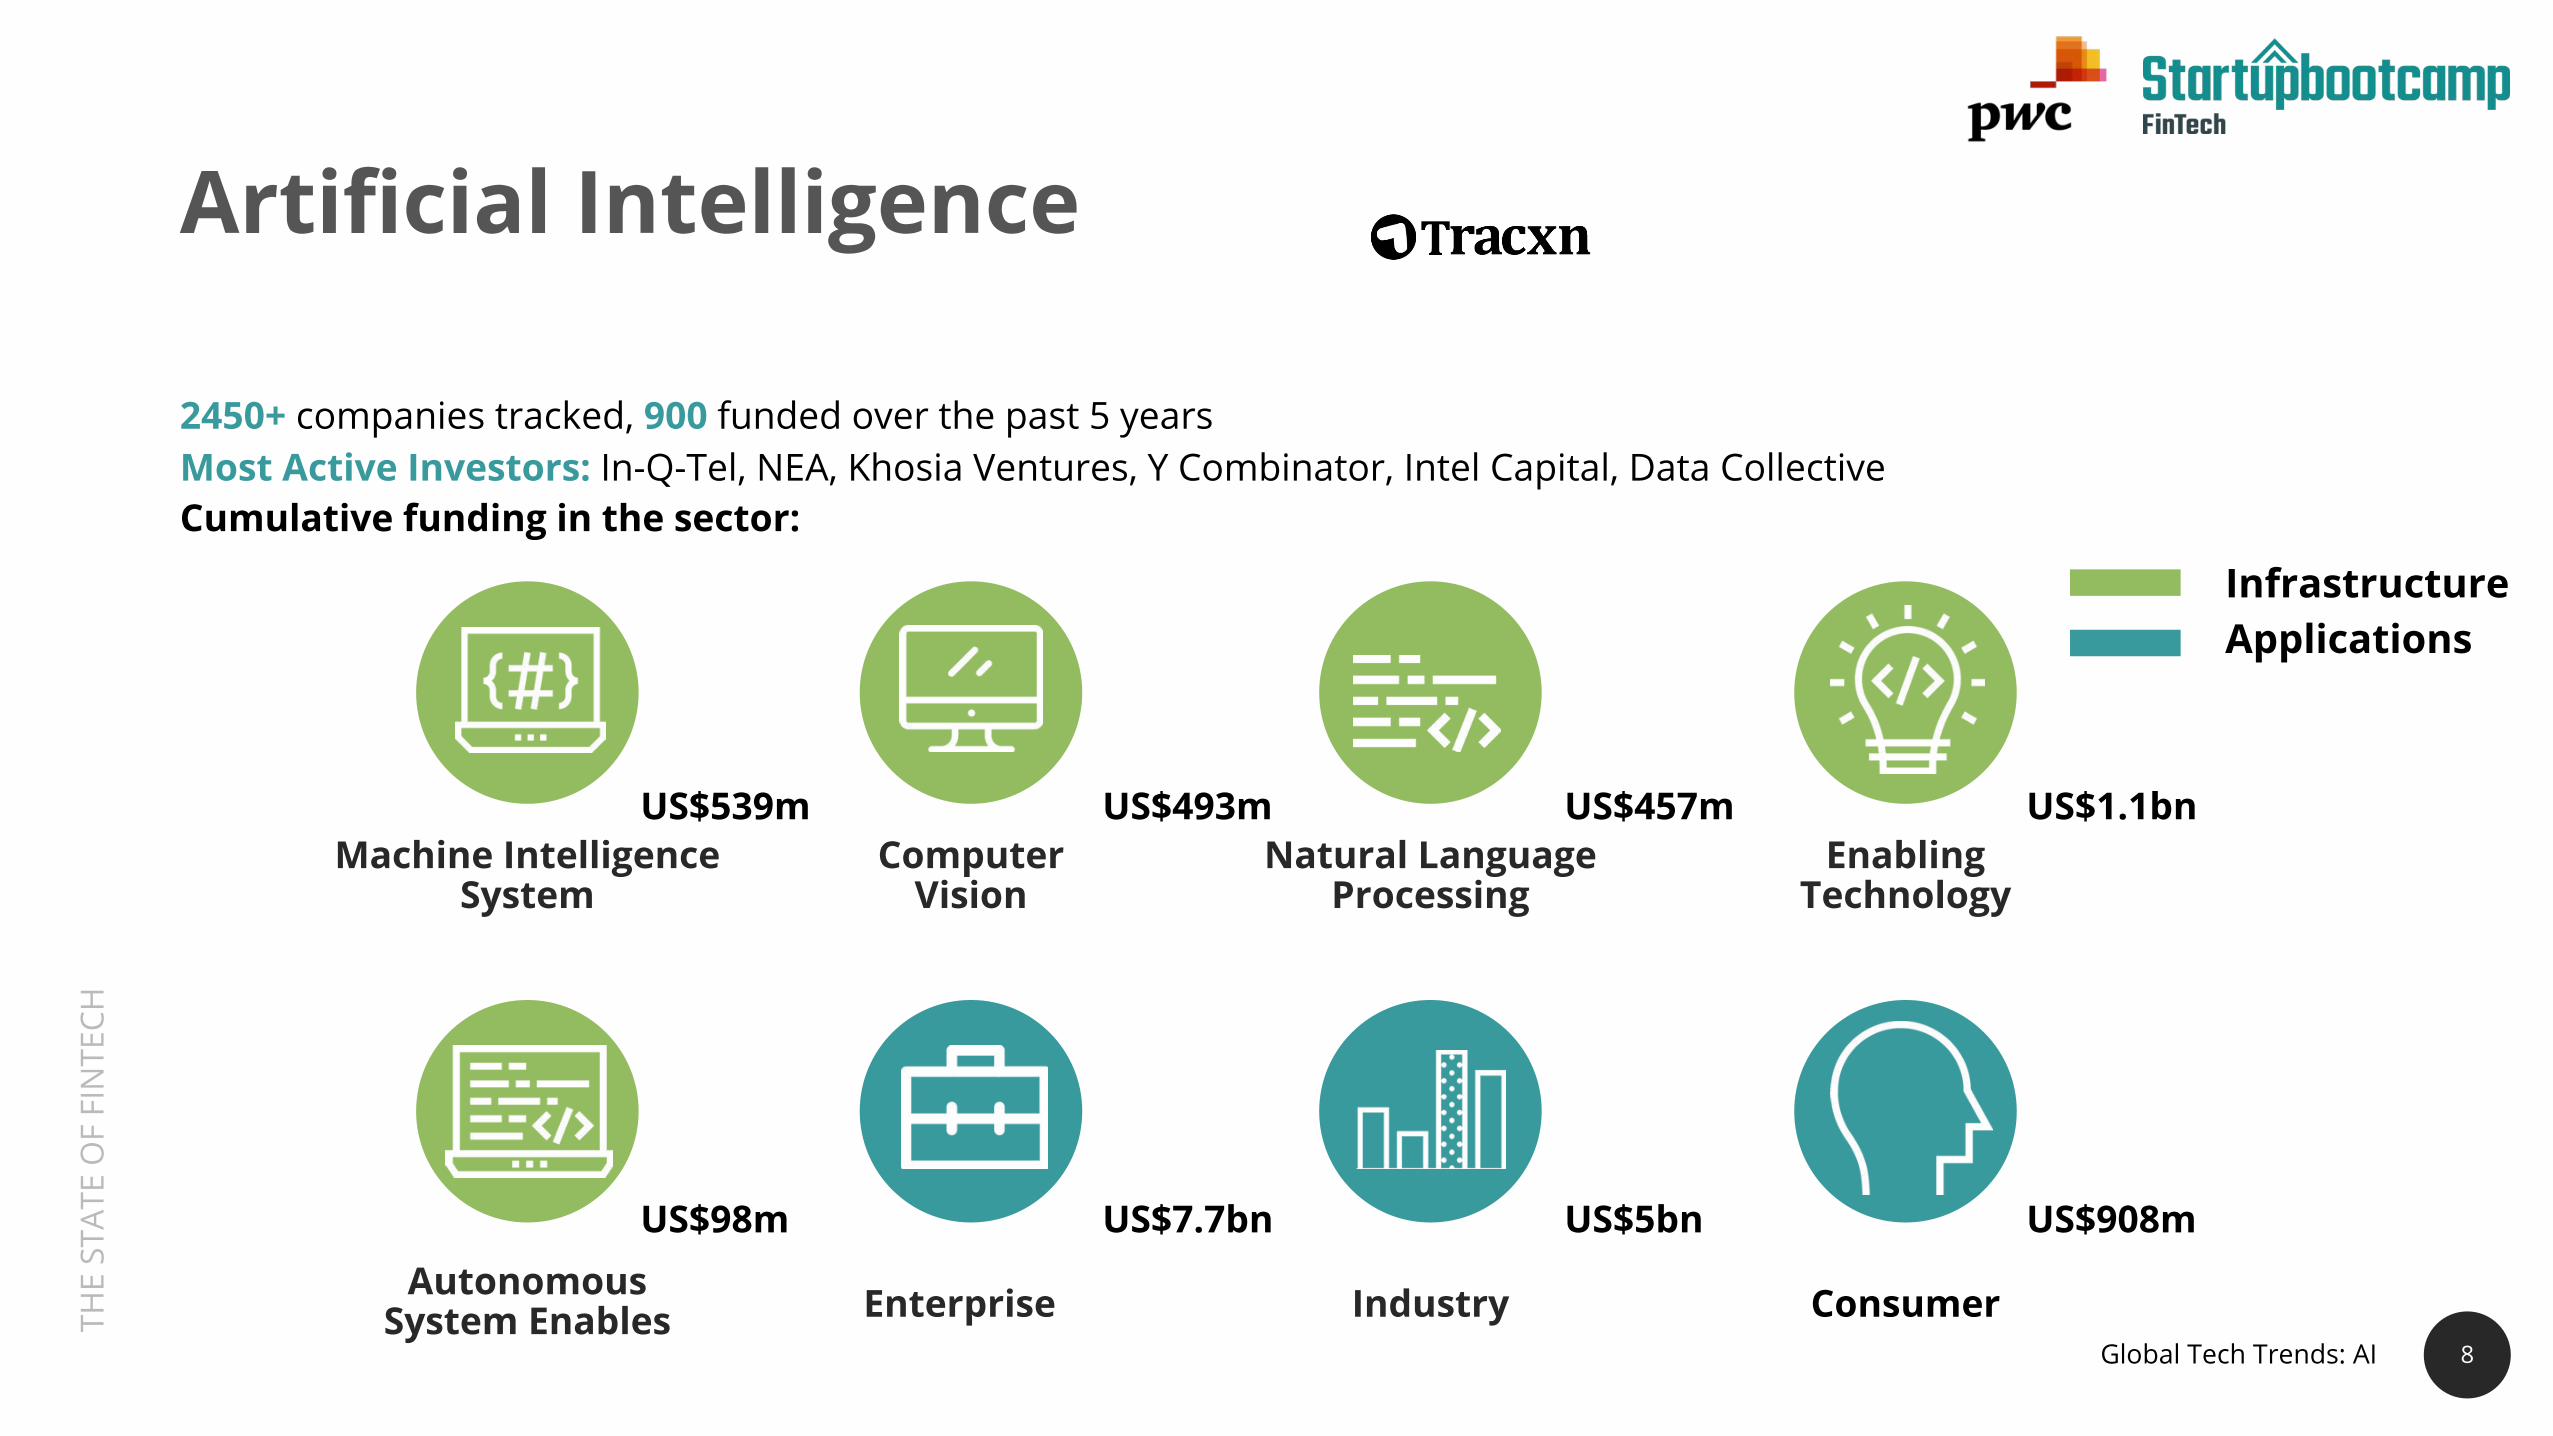
US$539m US$493m US$457m US$1.1bnMachine Intelligence
SystemComputer
VisionNatural Language
ProcessingEnabling
Technology
Autonomous System Enables Enterprise ConsumerIndustry
US$98m US$7.7bn US$5bn US$908m
8
Artificial Intelligence
2450+ companies tracked, 900 funded over the past 5 yearsMost Active Investors: In-Q-Tel, NEA, Khosia Ventures, Y Combinator, Intel Capital, Data CollectiveCumulative funding in the sector:
InfrastructureApplications
Global Tech Trends: AI

THE
STAT
E O
F FI
NTE
CH
Machine Intelligence Systems / US$539m
Computer Vision / US$493m
Natural Language Processing / US$457m
Enabling Technology / US$1.1bn
Autonomous System Enablers / US$98m
US$2.7bnInfrastructure
US$13.bnApplications
9
Funding Highlights - AI
Over the past 10 years AI applications in the enterprise, industry and consumer sectors have received a cumulative fundingof US$13bn whereas AI enabling infrastructure received US$2.7bn over the same period.Cumulative funding in the sector:
Enterprise / US$7.7bn
Industry / US$5.0bn
Consumer / US$908m
9Global Tech Trends: AI
THE
STAT
E O
F FI
NTE
CH
10
Observations - AI
We are at an inflection point where corporations are realising that artificial intelligencecan supplement human judgement with data-driven insights and fundamentallychange the way they make decisions.
Within the US$13bn invested in AI applications, US$7.7bn has been invested inenterprise as more and more corporations realise that they need to be fasterand more sophisticated when it comes to making important decisions. Executivesare now looking at mixing mind and machine to leverage data, understand risk, andgain a competitive edge.
On the flip side, US$1.1bn has been invested in infrastructure enablingtechnology. We believe that funding in this segment will increase in the near future asit is the backbone for many AI applications.
Global Tech Trends: AI

THE
STAT
E O
F FI
NTE
CH
Cyber attacks have steadily increased over timeand in 2015, damage reported exceededUS$1bn for the first time in history.
Damage caused by cyber crime is on the rise:Data sourced from the FBI’s internet crimecomplaint center (IC3) reveals that reportedcyber crime damage has more than doubledover the past 5 years and experts areexpecting the frequency of the attacks tocontinue to rise.
11
Cybersecurity
2011 2012 2013 2014 2015
250
0
1250
1000
750
500
485.25
581.44
781.84 800.49
1, 070.71
Amount of Monetary Damage Caused by Reported Cyber Crime (in millions U.S. dollars)
Source: FBI; IC3 US Department Justice, 2016
01
02
Global Tech Trends: Cybersecurity
THE
STAT
E O
F FI
NTE
CH
Big Banks Join Forces Against Cybercriminal Networks
As cyber threats become increasingly sophisticated, many financial institutions arecoming together to share critical threat intelligence with peers, industry groups andgovernment agencies.
In 2016, for the first time ever, 8 of the largest US banks including JPMorgan, Bankof America and Goldman Sachs joined forces to share best practices on fightingcybercrime.
In fact, PwC’s recent Global State of Information Security Survey in 2017 revealed that55% of surveyed CIOs and CSOs worldwide collaborate with external partners toimprove security and reduce risk.
This leads us to believe that there will be more cross industry collaboration to fightpowerful cybercrime networks.
12Global Tech Trends: Cybersecurity

THE
STAT
E O
F FI
NTE
CH
US$718m
US$4.2bn US$451m
EnterpriseSecurity
13
3130+ companies in the sector, 964funded in past 5 years
EndpointSecurity
EmailSecurity
ApplicationSecurity
Software Suites
US$1bn
Anti-Fraud
US$1bn US$3.6bn US$1.5bn
NetworkSecurity
loTSecurity
BYODSecurity
WebsiteSecurity
US$4.2bn US$1bn
Cumulative funding in the sectorGlobal Tech Trends: Cybersecurity

THE
STAT
E O
F FI
NTE
CH
US$193m US$2.5bn US$20m
US$125m US$2.5bn US$1.6mUS$689m
EnterpriseSecurity
14
Most Active Investors: Intel Capital, Sequoia, BVP, NEA, Accel, KPCB, Paladin Capital, Greylock
IndustrialSecurity
ServerSecurity
DataSecurity
Identity & AccessManagement
US$2bn
CloudSecurity
DatabaseSecurity
SecurityAnalytics
Threat Intelligence
Cumulative funding in the sectorGlobal Tech Trends: Cybersecurity

THE
STAT
E O
F FI
NTE
CH
US$451mIoT Security
US$4.2bnNetwork Security
15
Funding Highlights - Cybersecurity
The network security segment has received the largest amount of funding with a total of US$4.2bn to date. However,the proliferation of smart devices has led to a rise in cyberattacks as these provide more access points (RFID, GPS, WiFi,etc.) and have historically been shipped with outdated software. And, although investments in this space have beenhistorically low, we can expect funding to increase going forward.
Cumulative funding in the sector:
Inside Secure (1995, IPO) Palo Alto Networks (2005, IPO)
Global Tech Trends: Cybersecurity

THE
STAT
E O
F FI
NTE
CH
PwC’s latest Global State of Information Security Surveyrevealed that:
62% of respondents worldwide have an Internet ofThings security strategy in place or are currentlyimplementing this strategy
Globally, 46% of surveyed organisations areinvesting in a security strategy for the Internet ofThings over the next 12 months
While network security has and will continue to attract alarge part of investments, we believe that investments inIoT security will grow as more and more organisationsadopt IoT security strategies.
Observations -Cybersecurity
01
02
THE
STAT
E O
F FI
NTE
CH
17
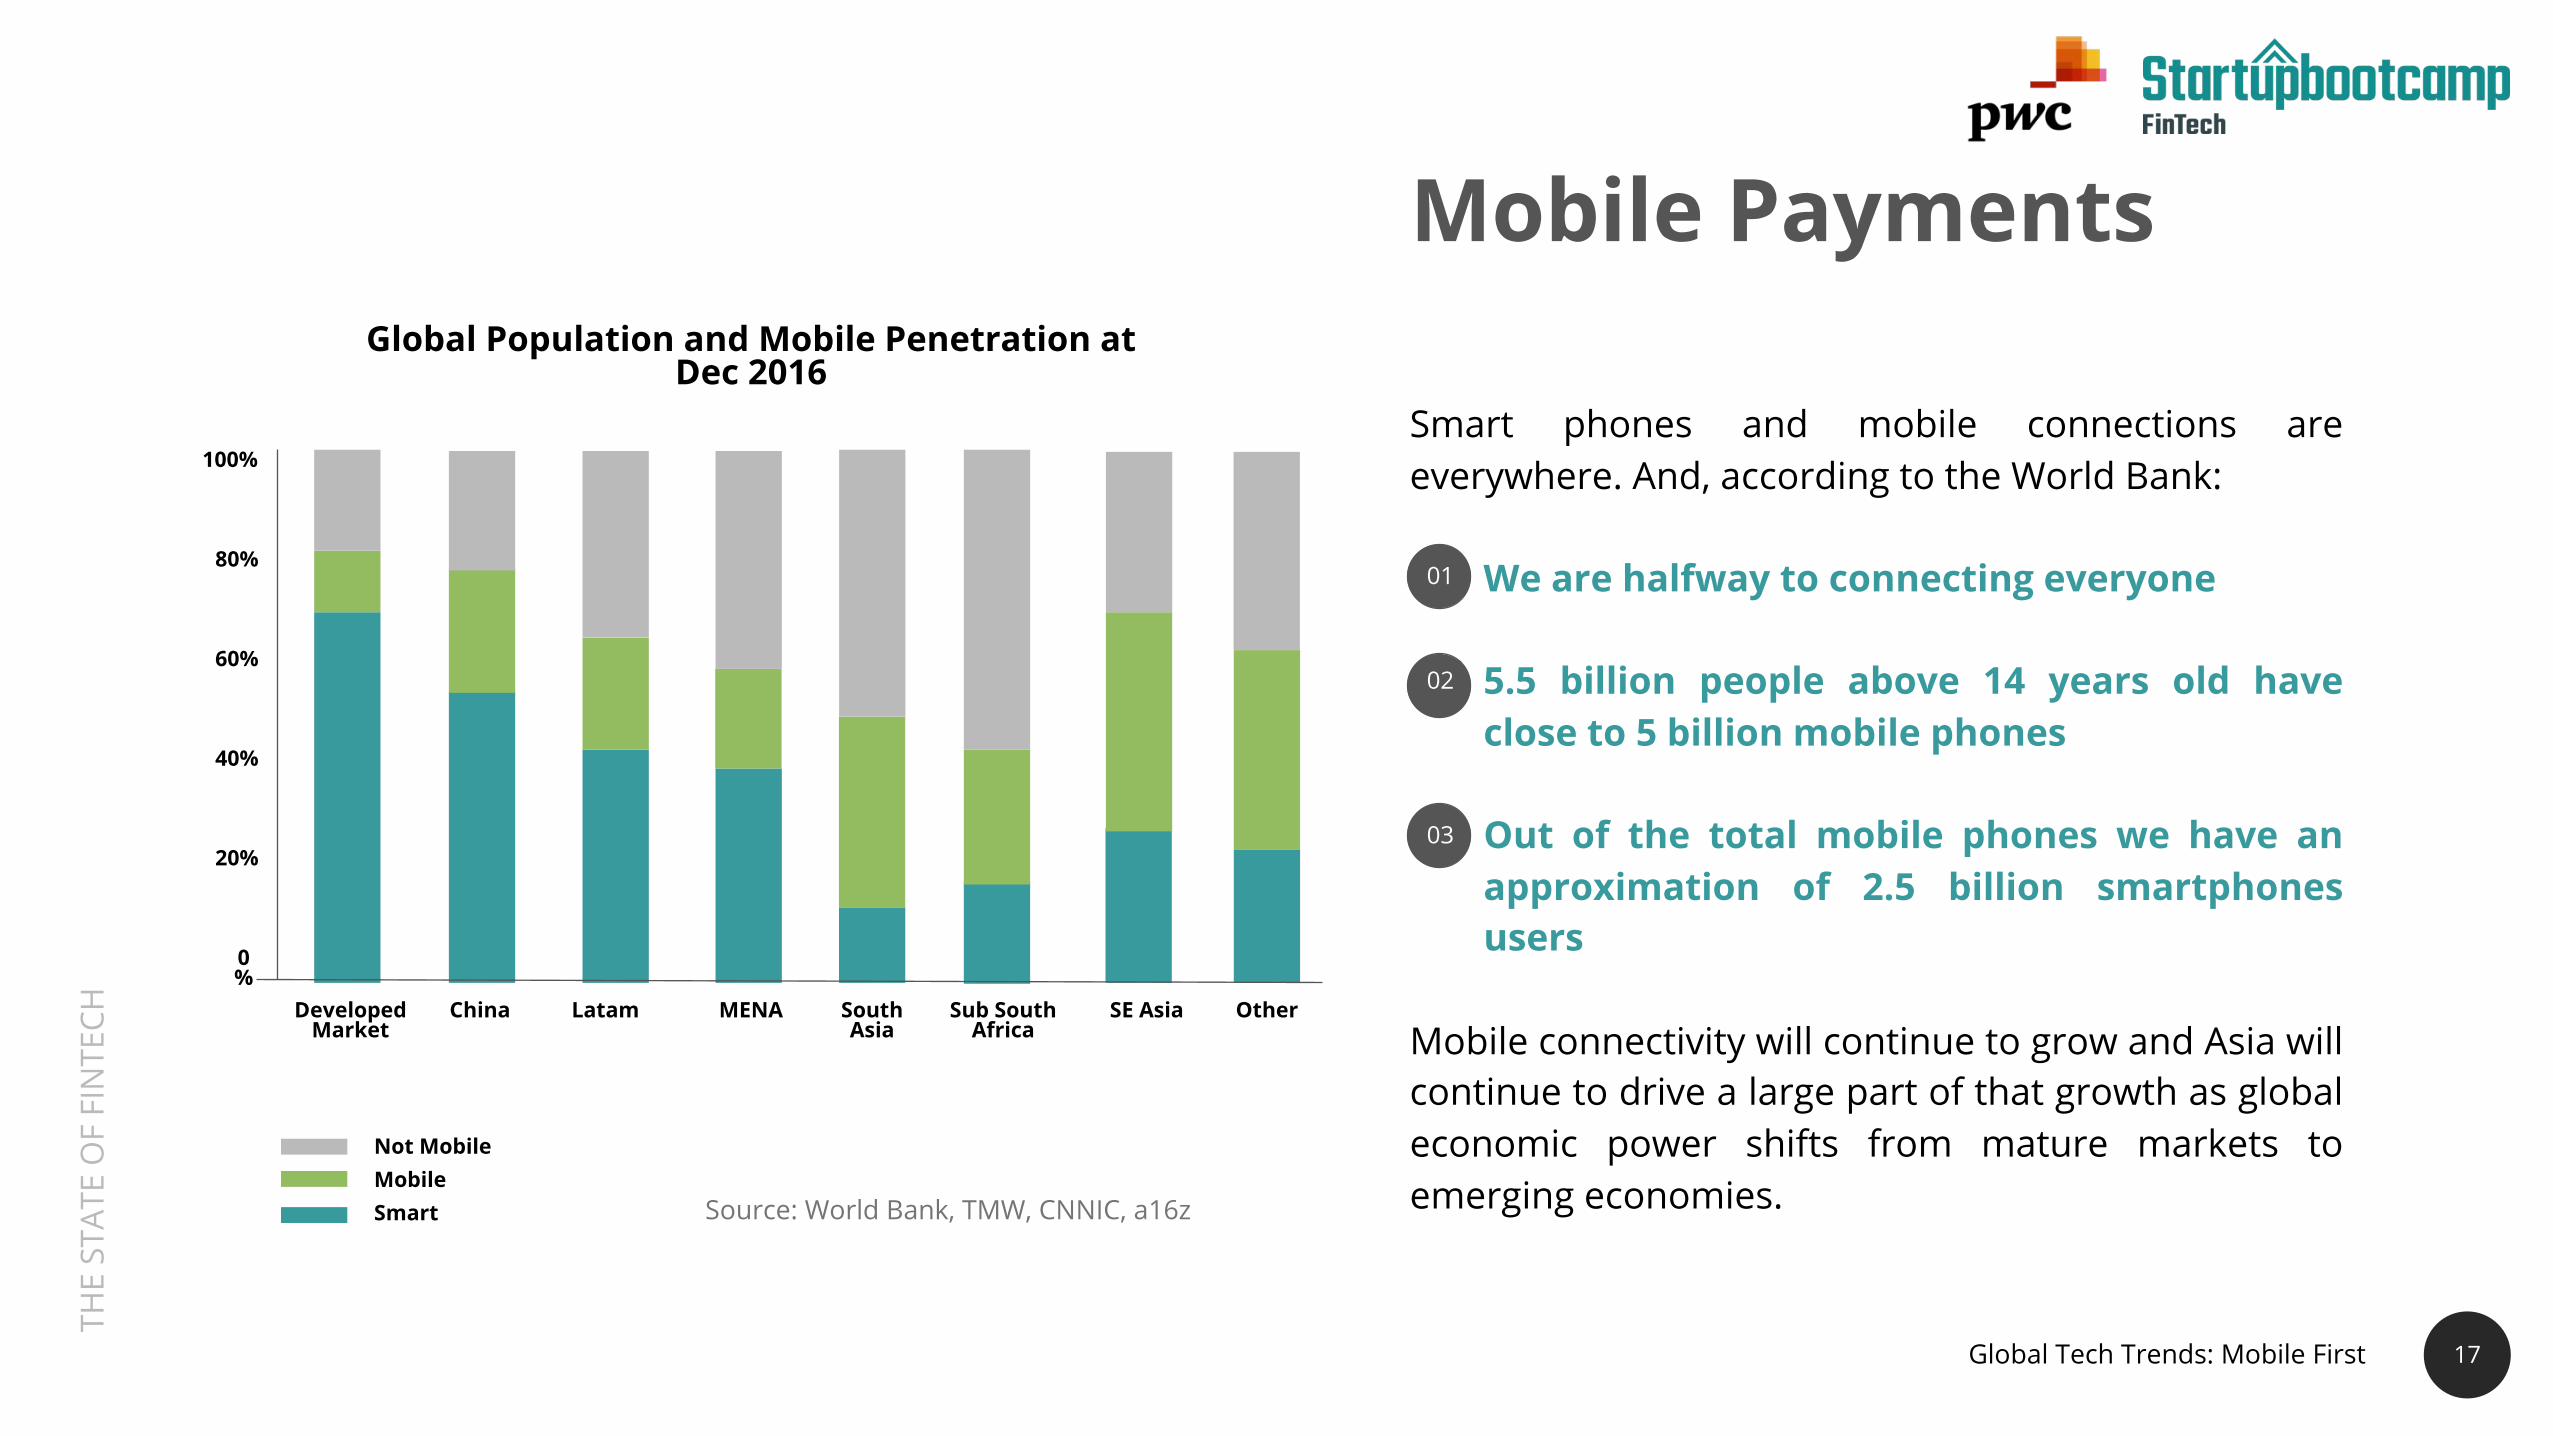
Smart phones and mobile connections areeverywhere. And, according to the World Bank:
We are halfway to connecting everyone
5.5 billion people above 14 years old haveclose to 5 billion mobile phones
Out of the total mobile phones we have anapproximation of 2.5 billion smartphonesusers
Mobile connectivity will continue to grow and Asia willcontinue to drive a large part of that growth as globaleconomic power shifts from mature markets toemerging economies.
Mobile PaymentsGlobal Population and Mobile Penetration at
Dec 2016
DevelopedMarket
China Latam MENA SouthAsia
Sub SouthAfrica
SE Asia
20%
0%
100%
80%
60%
40%
Other
MobileSmart
Not Mobile
Source: World Bank, TMW, CNNIC, a16z
01
02
03
17
Global Tech Trends: Mobile First
THE
STAT
E O
F FI
NTE
CH
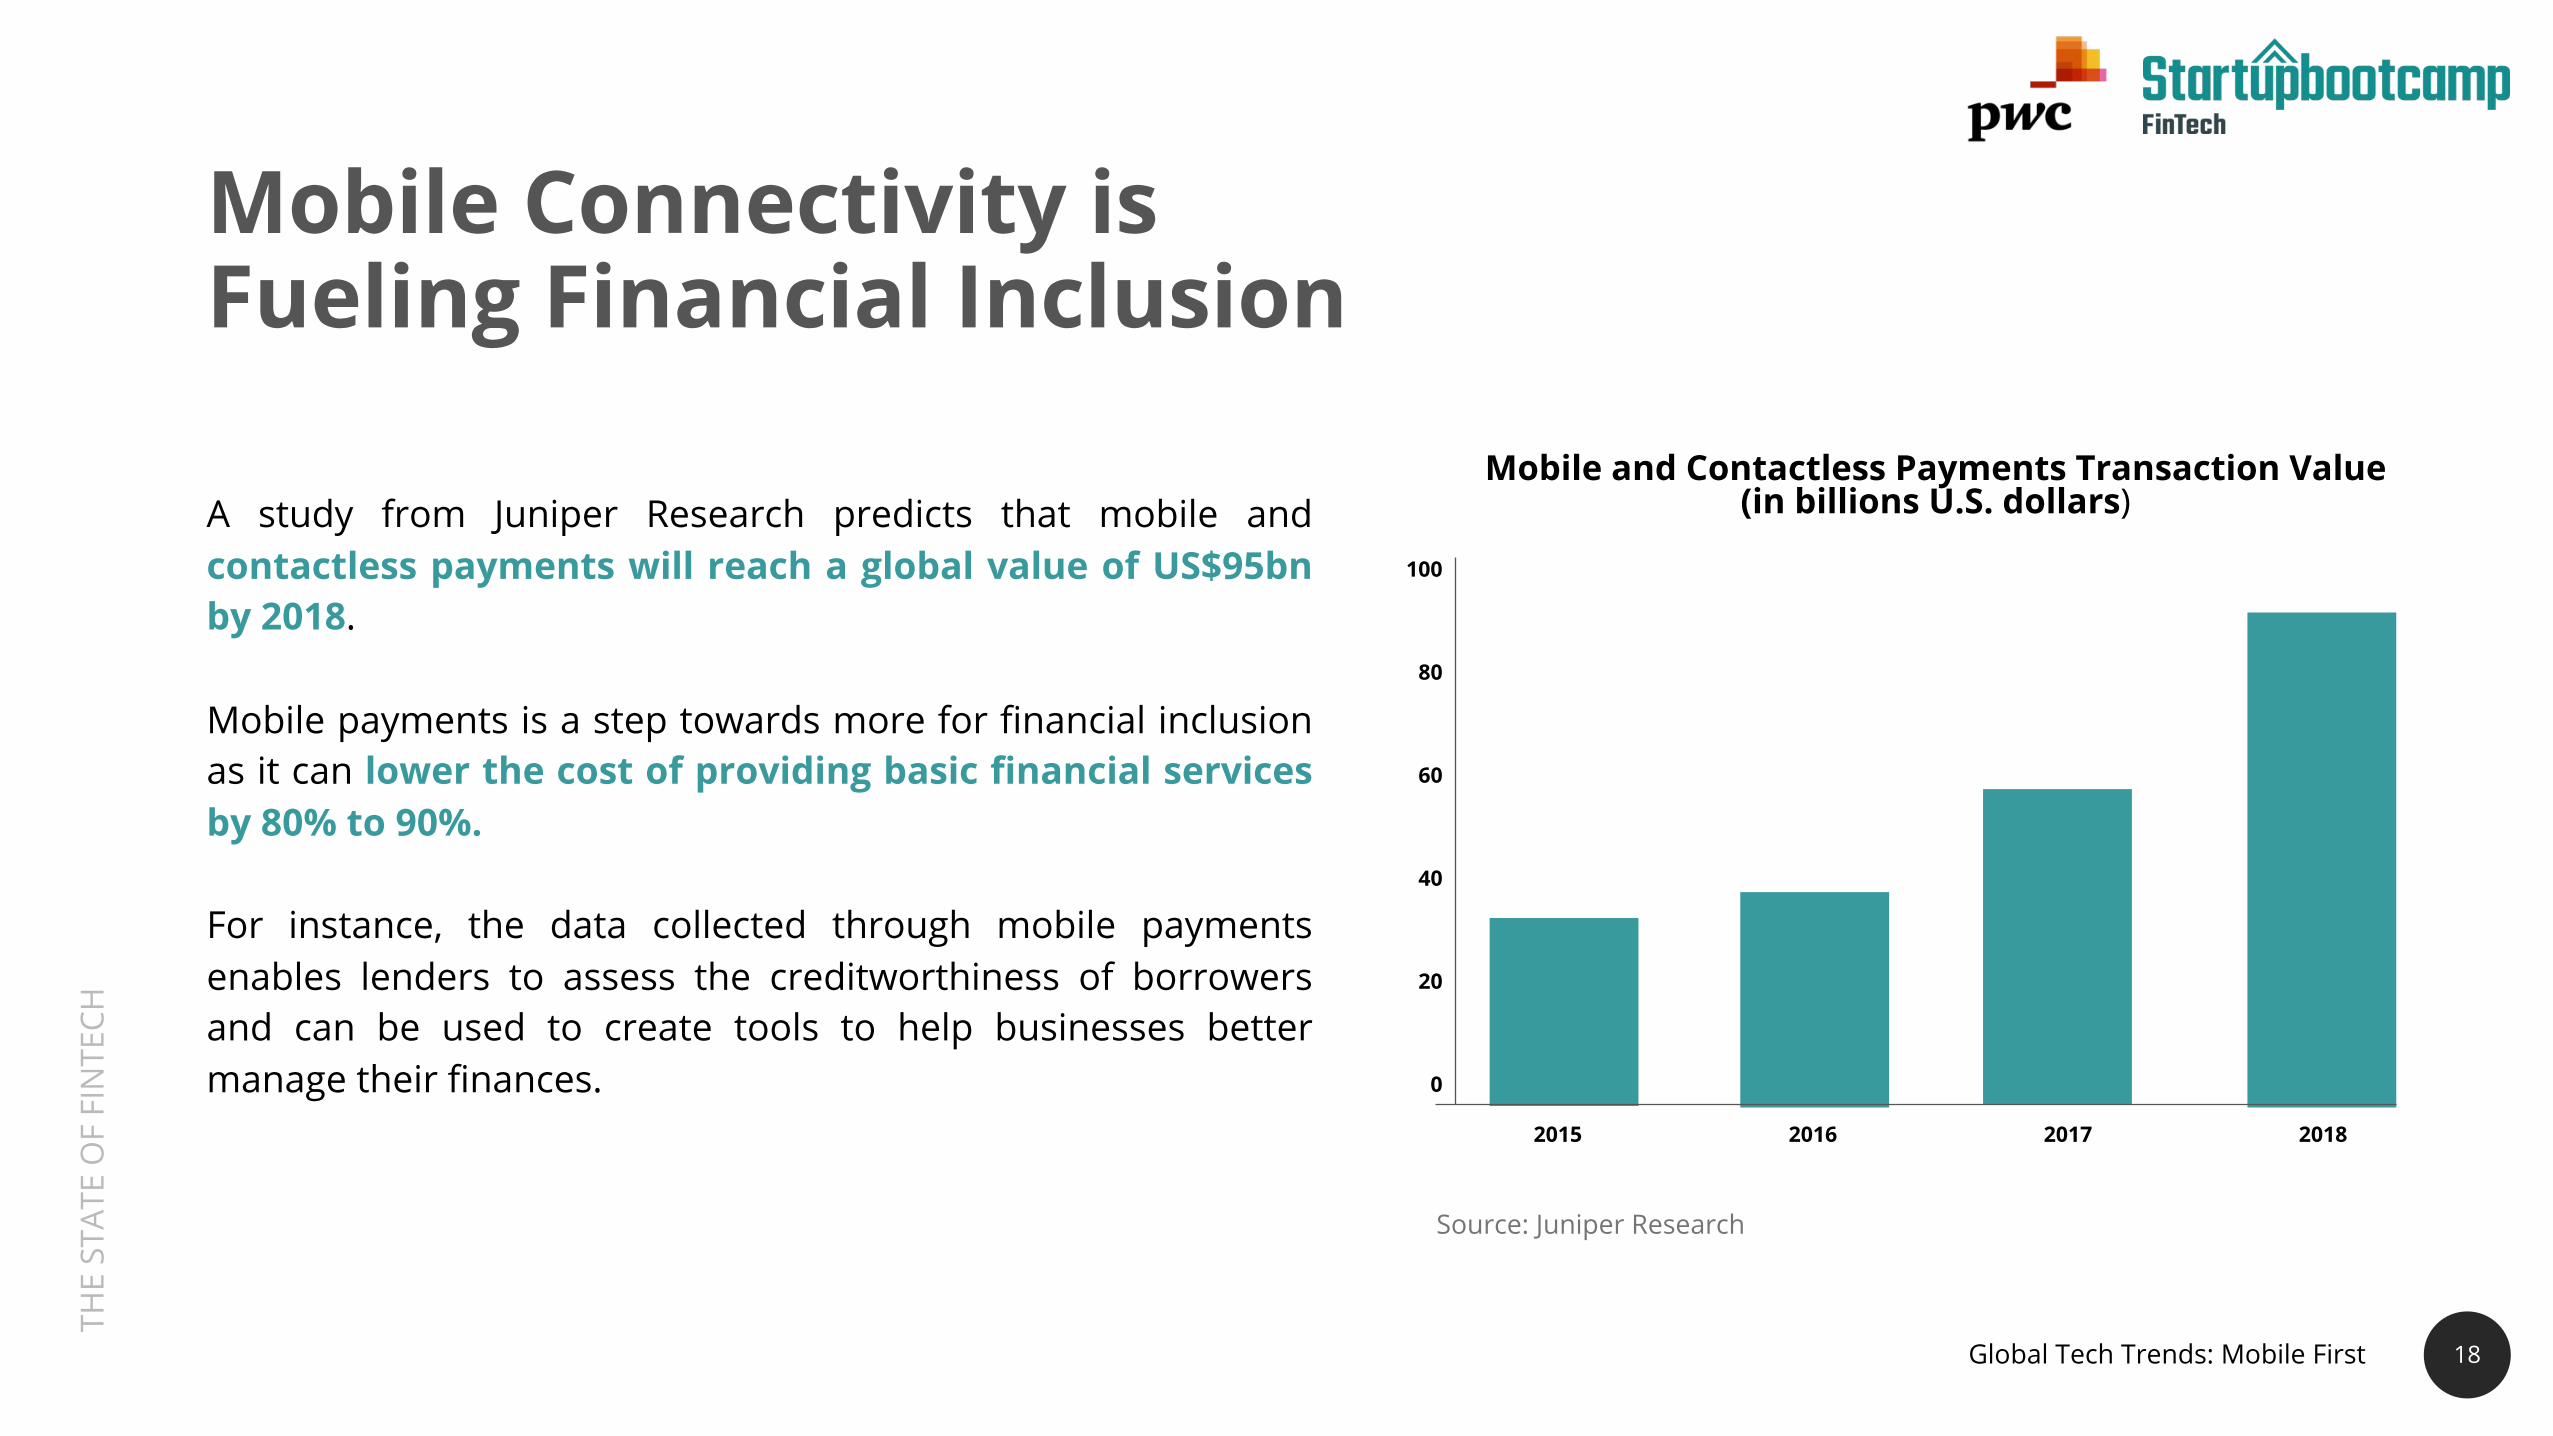
Mobile Connectivity is Fueling Financial Inclusion
A study from Juniper Research predicts that mobile andcontactless payments will reach a global value of US$95bnby 2018.
Mobile payments is a step towards more for financial inclusionas it can lower the cost of providing basic financial servicesby 80% to 90%.
For instance, the data collected through mobile paymentsenables lenders to assess the creditworthiness of borrowersand can be used to create tools to help businesses bettermanage their finances.
18
2015 2016 2017 2018
0
100
60
40
80
20
Mobile and Contactless Payments Transaction Value (in billions U.S. dollars)
Source: Juniper Research
Global Tech Trends: Mobile First

THE
STAT
E O
F FI
NTE
CH
US$354m US$528m US$18m US$146m
US$2.2bn US$2.4bn US$247m
19
Mobile Payments
1510+ companies in the sector, 369 funded in past 5 yearsMost Active Investors: Sequoia Captial, Entree Capital, Accel PartnersCumulative funding in the sector:
Technology Multi-Solutions Payment GatewayWearables
m-POS Wallet Carrier Billing
19Global Tech Trends: Mobile First

THE
STAT
E O
F FI
NTE
CH
Semi Closed / Paytm (2010, US$1.9bn)
P2P Money / Venmo (2009, US$1.3m, Acq.)
White Label / Mozido (2008, US$302m)
US$2.4bnWallet
20
In mobile first technologies, mobile wallets have attracted US$2.4bn in cumulative investment over the past 10 years.
Cumulative funding in the sector:
Funding Highlights – Mobile Payments
Global Tech Trends: Mobile First
THE
STAT
E O
F FI
NTE
CH
21
The advancement of technology combined with ongoinginfrastructure improvements has increased mobile phonepenetration over the past years. This in turn has led towidespread adoption of mobile wallets.
Rather than waiting a generation for incomes to rise andtraditional banks to extend their reach, emergingeconomies have the opportunity to leverage mobiletechnologies to provide digital financial services for all,which in turn can rapidly unlock economic opportunity andaccelerate social development.
Observations -Mobile Payments
21
Global Tech Trends: Mobile First
THE
STAT
E O
F FI
NTE
CH
GLOBAL FINTECH TRENDS

THE
STAT
E O
F FI
NTE
CH
23
Global FinTech Trends
Top three global FinTech Trends in 2017:
India World’s First
Unified Payments Interface
Big Data Infrastructure and Analytics
z
Chinese Dragon Leading the tide of FinTech wave in Asia
THE
STAT
E O
F FI
NTE
CH
24
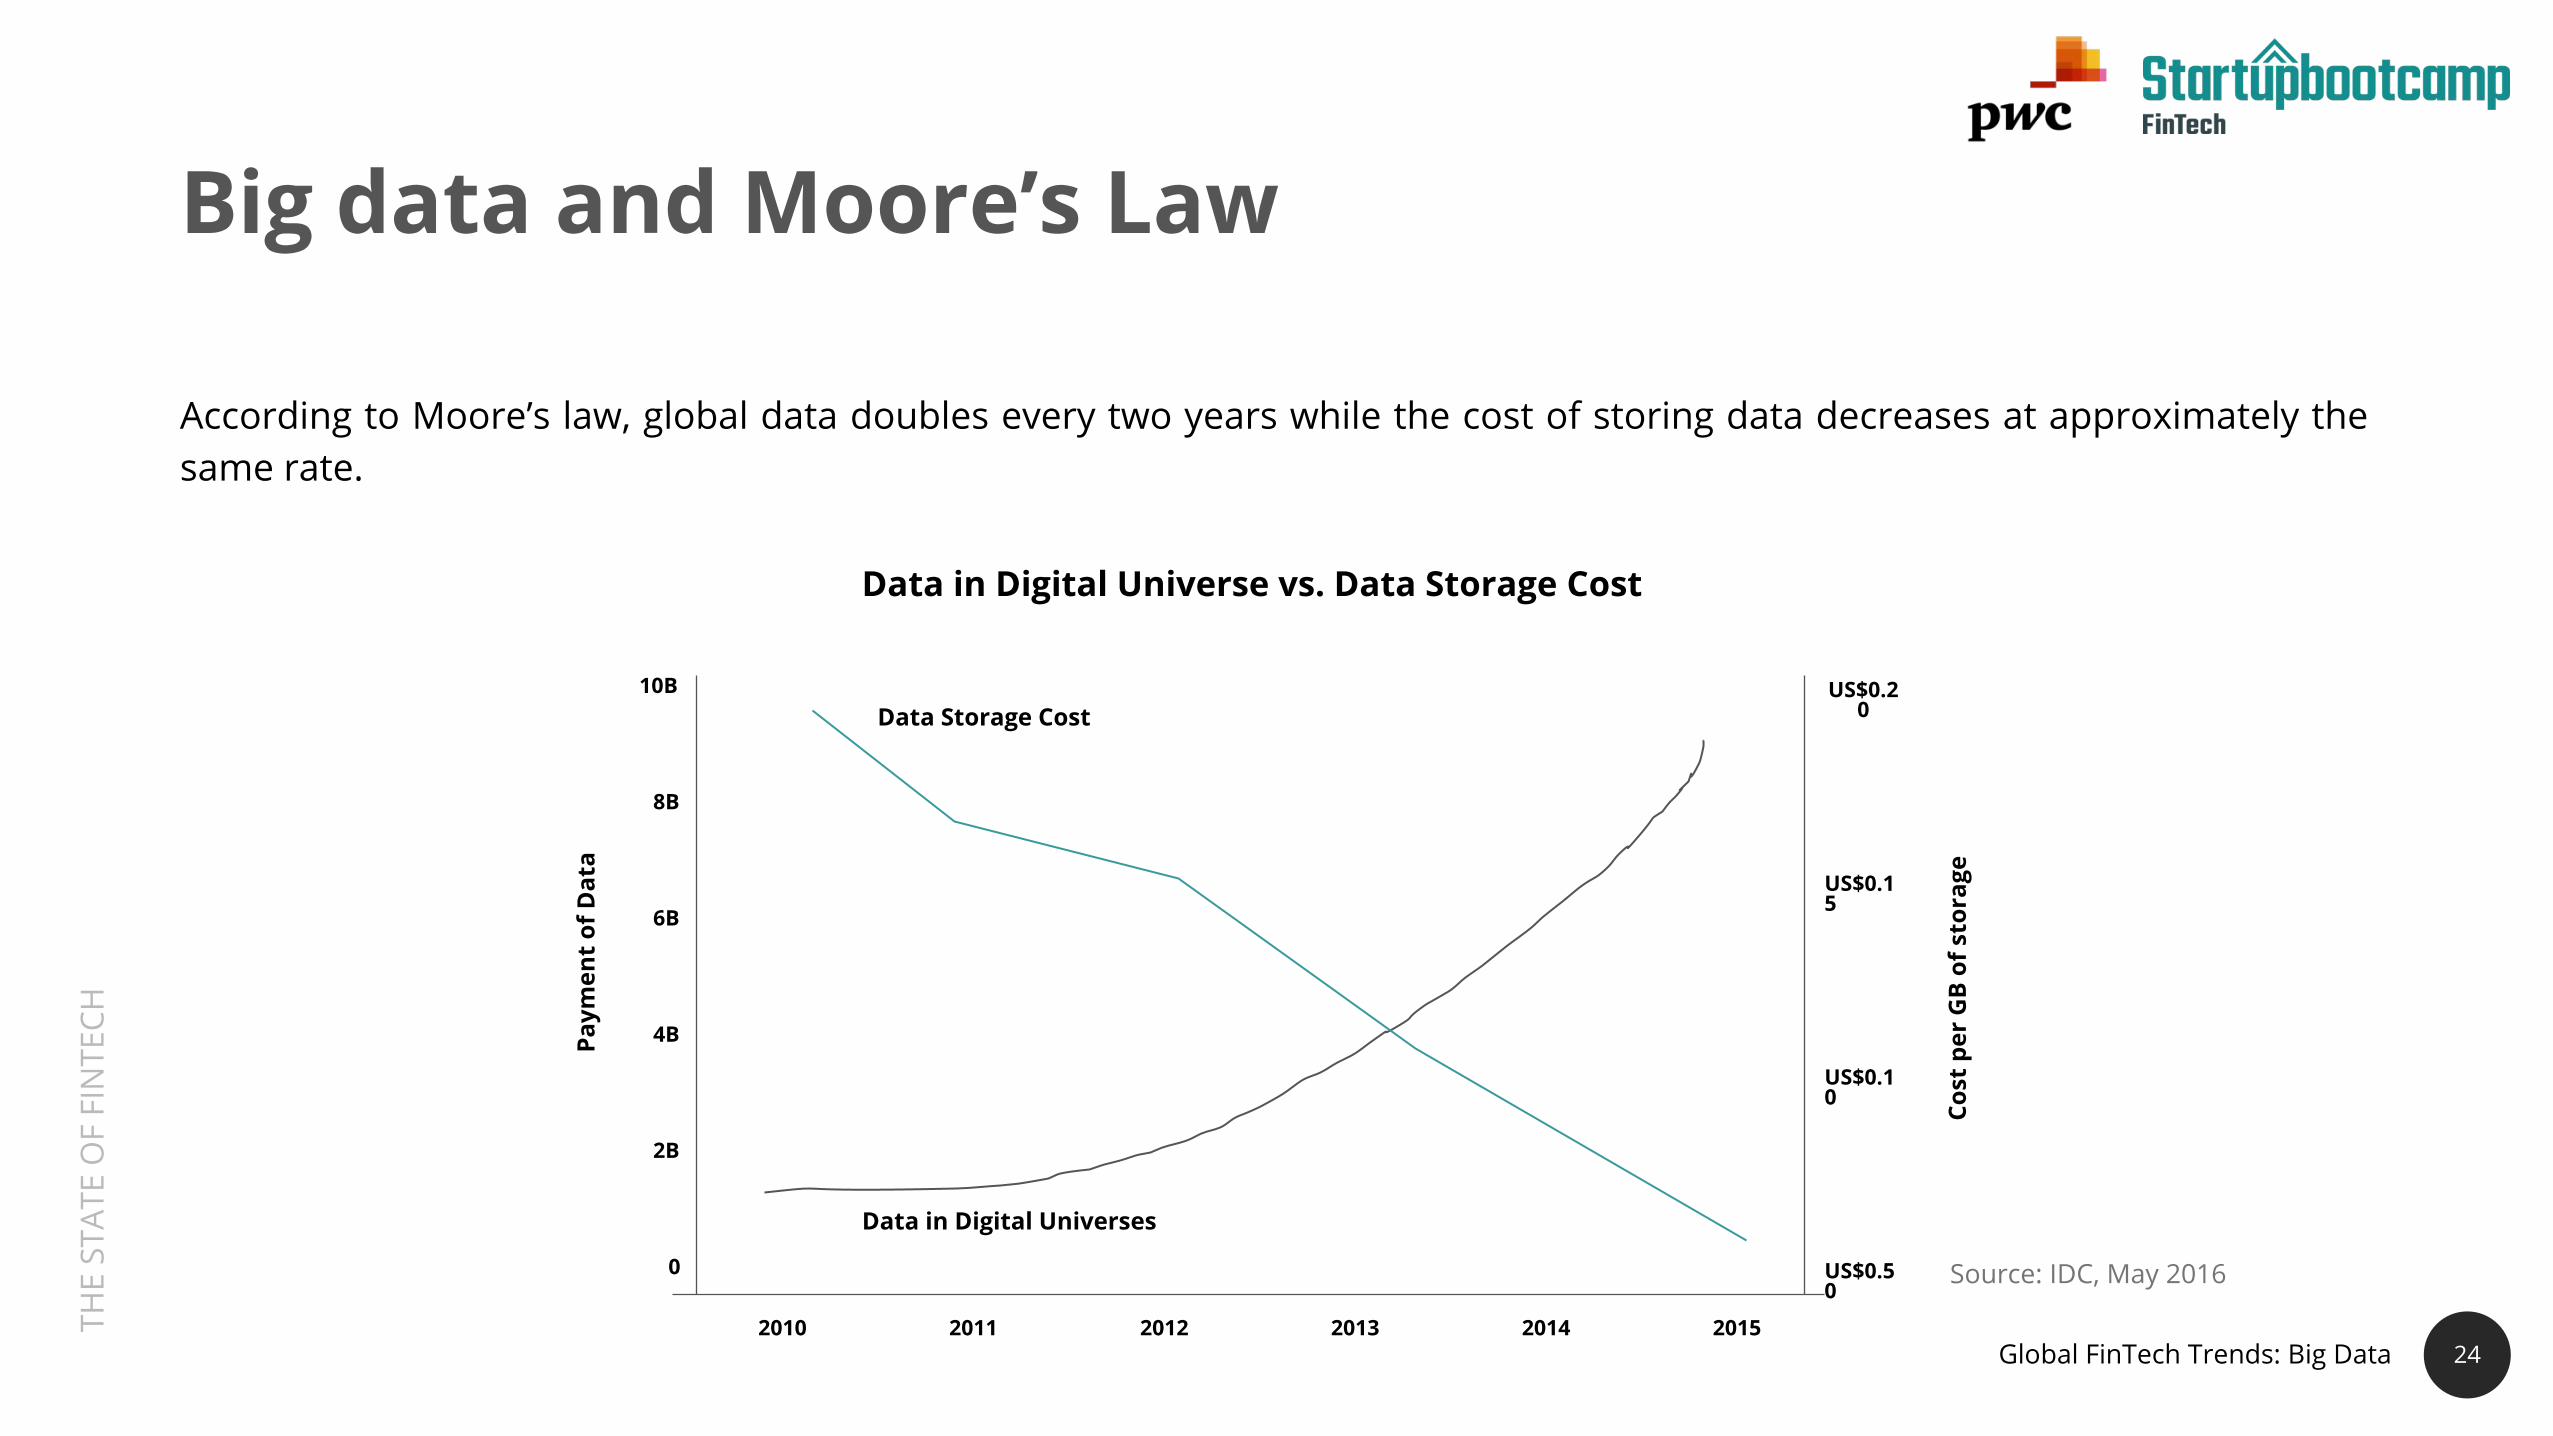
Big data and Moore’s Law
According to Moore’s law, global data doubles every two years while the cost of storing data decreases at approximately thesame rate.
2010 2011 2012 2013 2014 2015
2B
0
10B
8B
6B
4B
US$0.10
US$0.50
US$0.20
US$0.15
Data in Digital Universe vs. Data Storage CostPa
ymen
t of
Dat
a
Cost
per
GB
of s
tora
ge
Data in Digital Universes
Data Storage Cost
Source: IDC, May 2016
Global FinTech Trends: Big Data
THE
STAT
E O
F FI
NTE
CH
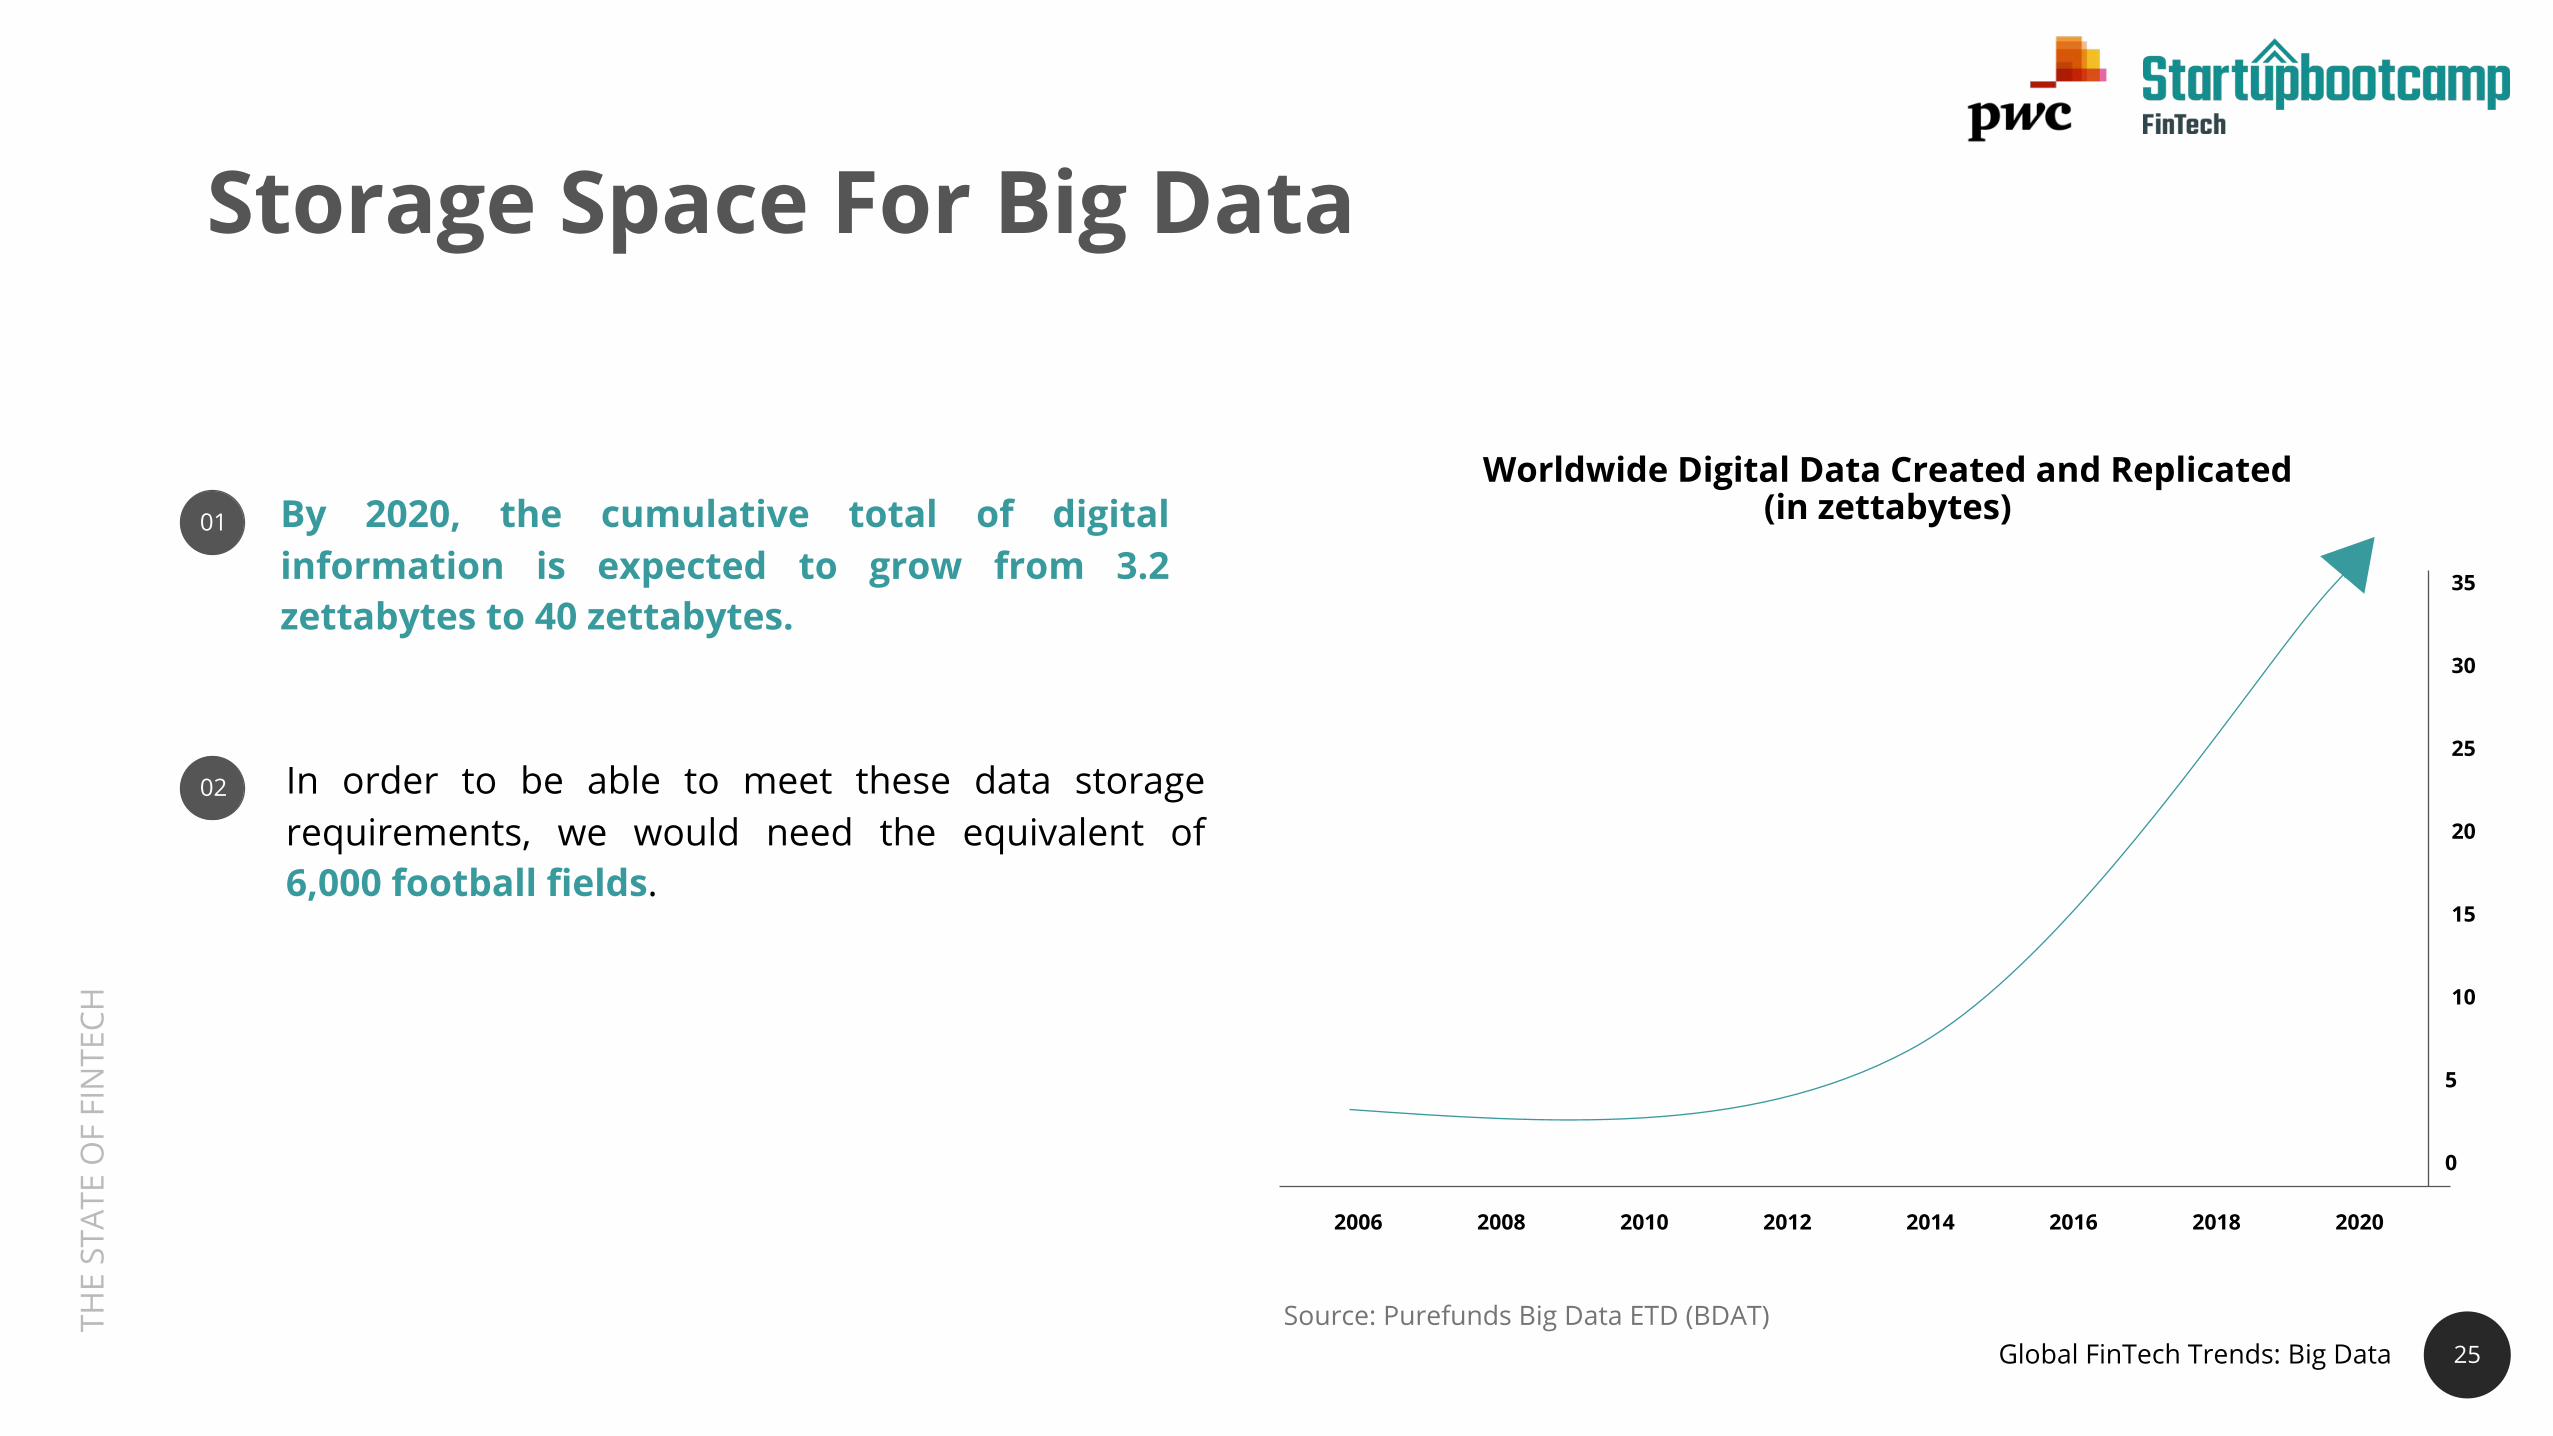
Storage Space For Big Data
By 2020, the cumulative total of digitalinformation is expected to grow from 3.2zettabytes to 40 zettabytes.
2018201420102006
10
0
35
30
15
25
20
5
Worldwide Digital Data Created and Replicated (in zettabytes)
2020201620122008
25Source: Purefunds Big Data ETD (BDAT)
01
02 In order to be able to meet these data storagerequirements, we would need the equivalent of6,000 football fields.
Global FinTech Trends: Big Data

THE
STAT
E O
F FI
NTE
CH
26
Scalend, part of the Startupbootcamp FinTech Singapore 2017 cohort,provides a ready to use data and insights discovery platform geared tosolve data challenges faced by financial services companies.
The platform brings data residing in multiple silos to a central secure datalake and applies machine learning and AI to generate customer journeys,fraud, and risk scores. Scalend’s mission is to deliver actionable insightsnow.
Ravi MadhiraCo-founder, Scalend Technologies
26
Global FinTech Trends: Big Data

THE
STAT
E O
F FI
NTE
CH
US$862m US$1.3bn US$161m
US$1.4bn US$1bn US$266m
27
Big Data Infrastructure
250+ companies in the sector, US$4.9bn in funding over the past 5 yearsMost Active Investors: Data Collective, Accel, NEA, Intel CapitalCumulative funding in the sector:
ManagementTools
OperationalProcessing Application
Big Data Stack AnalyticalProcessing Real Time Processing
27Global FinTech Trends: Big Data

THE
STAT
E O
F FI
NTE
CH
US$226m US$2.7bn US$131m
US$985m US$989m US$897m
28
Big Data Analytics
480+ companies in the sector, US$5.78bn in funding over the past 5 yearsMost Active Investors: In-Q-Tel, Accel Partners, Andreessen Horowitz, NEA, IntelCumulative funding in the sector:
Data SciencePlatform
StreamingData Analytics
ContextualData Analytics
Verticals DataAnalytics Data Preparation
Global FinTech Trends: Big Data

THE
STAT
E O
F FI
NTE
CH
Verticals / US$985m
Data Analytics / US$989m
Data Preparation / US$867m
Big Data Analytics Suite / IPO
Data Science Platform / US$226m
Contextual Data Analytics / US$2.7bn
29
Funding Highlights – Big Data
Over the past year, Big Data Infrastructure and Big Data Analytics received a total funding of US$748m & US$1bn respectively.
Cumulative funding in the sector:
Big Data Stack / US$1.4bn
Analytical Processing / US$493m
Real Time Processing / US$266m
Management Tools / US$862m
Operational Processing / US$1.3bn
Application / US$161m
US$748mBig Data Infrastructure
US$1bnBig Data Analytics
Streaming Data Analytics / US$131m
Global FinTech Trends: Big Data
THE
STAT
E O
F FI
NTE
CH
30
Observations - Big Data
As technology advances, Big Data must have the necessary infrastructure in order toperform in-depth analytics. This is why both segments are highly correlated when itcomes to funding.
Both Big Data Infrastructure and Analytics have seen considerable investments overthe past year, this can be explained by:
More Financial Institutions taking advantage of what the cloud can offer interms of protection and scale resulting in increases in infrastructure investment
An increasing amount of Financial Institutions building data driven insightsinto strategic decision making
As a result, we believe that investments in both infrastructure as well as data andanalytics will continue to grow in the near future as more and more FinancialInstitutions put data at the heart of their strategy.
01
02
Global FinTech Trends: Big Data
THE
STAT
E O
F FI
NTE
CH
31
Chinese Dragons Are Leading The Tide of a Rising FinTech Wave in Asia
According to the Economist, mainland China’s middle class isexpected to account for more than a third of its population by2030. By then, 35% of the population wil have annual disposableincome in excess of US US$10,000, up from about 10 per centtoday.
And, while in the West, the major FinTech hubs (London, New Yorkand Silicon Valley) have been innovating through incrementalchanges, China’s technology giants have been revolutionising manyaspects of the financial services industry.
Countrywide adoption of FinTech by a growing tech savvypopulation, combined with considerable investments inbreakthrough innovation, leads us to believe that China willcontinue to lead in FinTech innovation.
31
Global FinTech Trends: Chinese Dragon
THE
STAT
E O
F FI
NTE
CH
China Dominates Asia PacificInvestmentsCurrently, total investment in China is higher than thecombined investments from the rest of the countries inAsia Pacific. Some of the key reasons why China isdominating the FinTech space include:
China’s Internet giants were the first to marketwhen it came to developing e-commerce third-partypayments. And, as a result, they now control 80%of the Chinese mobile payment marketChina’s eight FinTech unicorns have raised atotal of US$9.4bn in funding and have acombined valuation of US$96.4bnThe four biggest FinTech unicorns in the worldare Chinese: Ant Financial (US$60bn), Lufax(US$18.5bn), JD Finance (US$7bn), and Qufenqi(US$5.9bn)
32
01
02
03

THE
STAT
E O
F FI
NTE
CH
US$49m US$1.2bn US$1.2bn US$128m
US$1.3bn US$35m US$1.1bn US$1.8m
US$7.8bn US$7.4bn US$938m US$83m
FinTech China
33
940+ companies in the sector, 163 received funding rounds exceeding US$10m
Most Active Investors: Sequoia Capital, IDG, Matrix Partners, K2VC
InsurTech MobilePayments
Crypto currency
ConsumerFinance
Investment Tech RemittanceBanking Tech
EnterpriseFinance
Horizontal Crowdfunding Alternative Lending Payment
Cumulative funding in the sectorGlobal FinTech Trends: Chinese Dragon
THE
STAT
E O
F FI
NTE
CH
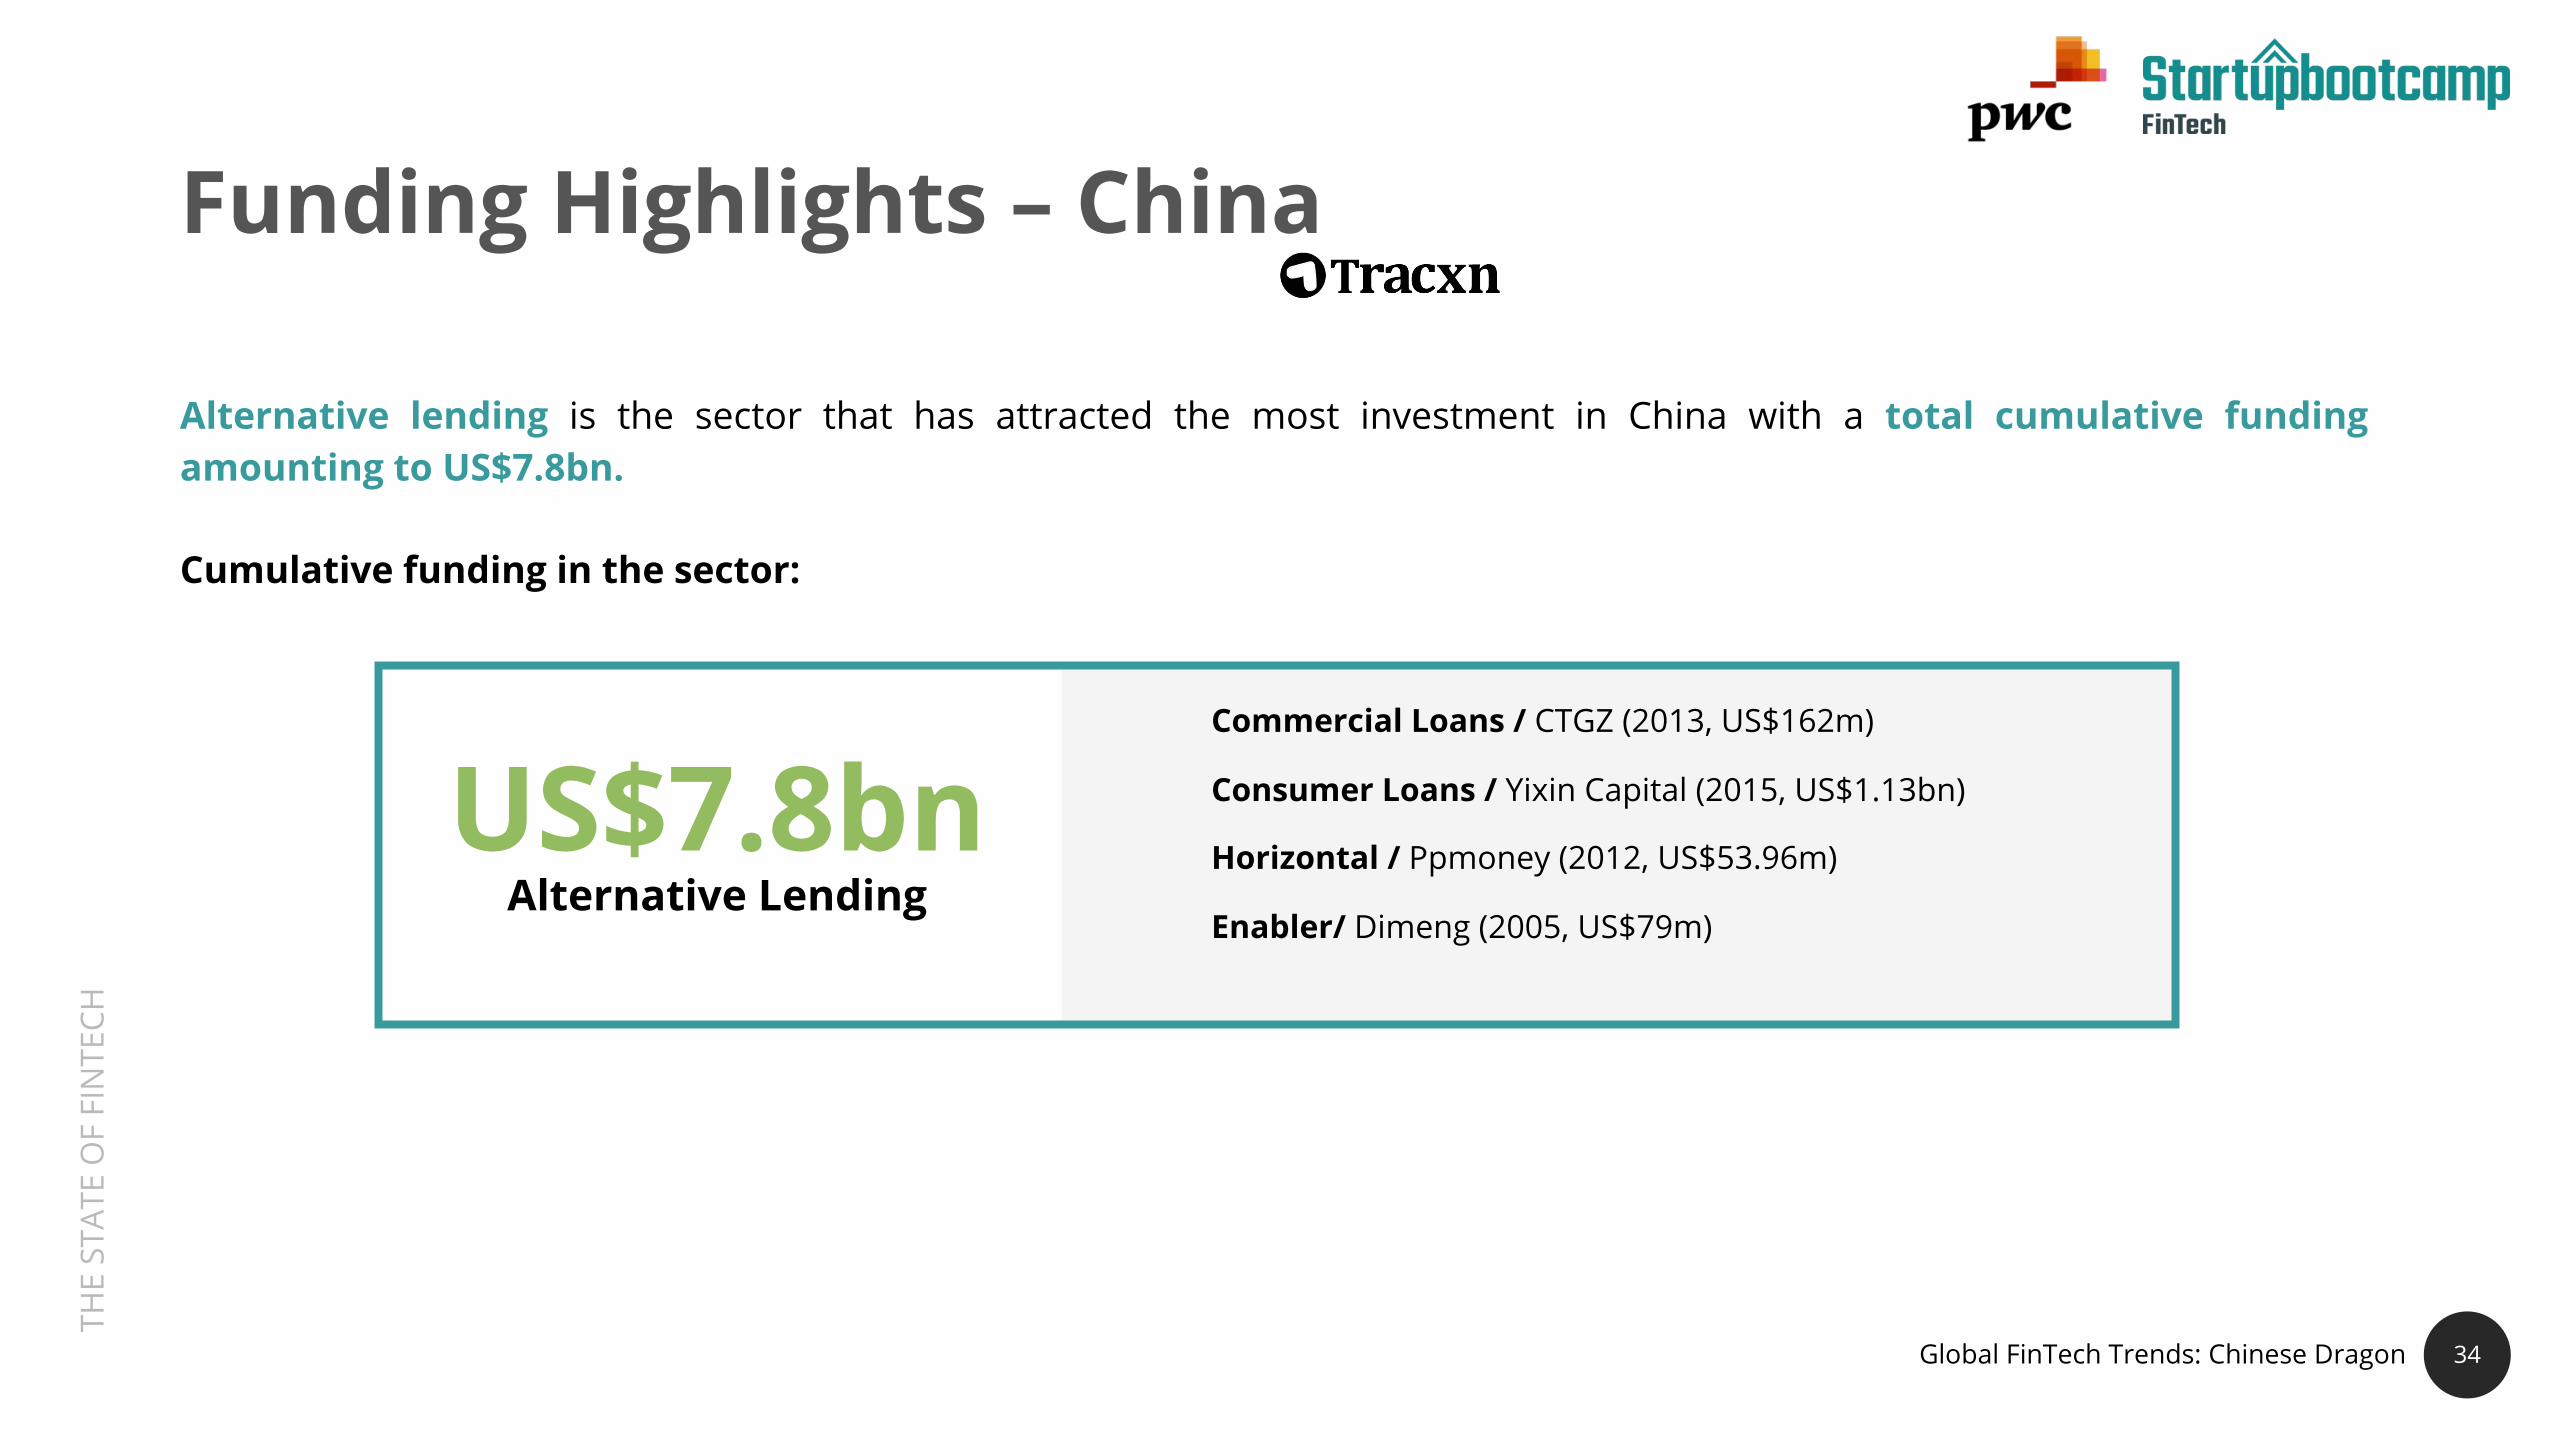
US$7.8bnAlternative Lending
Commercial Loans / CTGZ (2013, US$162m)
Consumer Loans / Yixin Capital (2015, US$1.13bn)
Horizontal / Ppmoney (2012, US$53.96m)
Enabler/ Dimeng (2005, US$79m)
34
Alternative lending is the sector that has attracted the most investment in China with a total cumulative fundingamounting to US$7.8bn.
Cumulative funding in the sector:
Funding Highlights – China
Global FinTech Trends: Chinese Dragon

THE
STAT
E O
F FI
NTE
CH
35
Observations - China
Alternative lending is the FinTech trend that has attracted the most investments inChina. This has been driven by:
High demand for business and personal borrowing that remains unmet bythe traditional state-owned bank systemInternet and technology platforms with huge market scale diversifying intonew market segments
A historically unrestricted sector that remained unchecked by regulators
Low barriers to entry combined with widespread internet access fueled a proliferationof alternative lending platforms in China.
While some great platforms have emerged many have turned out to be giant Ponzischemes – the most famous one being Euzabao where the founder allegedly escapedwith over US$7.2bn from over 1 million investors. As a result of this Beijing has starteda nationwide crackdown on alternative lending platforms.
01
02
03
35
Global FinTech Trends: Chinese Dragon

THE
STAT
E O
F FI
NTE
CH
36
India Leading The Way For Digital BankingIndia has taken a number of steps that have ultimately enabled the launch ofpure play digital banks, these include:
Aadhaar, launched in 2009 aims to provide a unique identification to allcitizens of India. The authentication is based on biometrics and althoughthis was originally intended to facilitate the delivery of governmentwelfare services, it has now become an important part of customeronboarding and digital KYC verification
The United Payments Interface aims to make peer to peer transactions asfast and as easy as sending a text message. The other integral focus of UPIis interoperability (i.e. allowing transactions across banks).
01
02
36
Global FinTech Trends: India
THE
STAT
E O
F FI
NTE
CH
37
India: World's First Unified Payment Interface
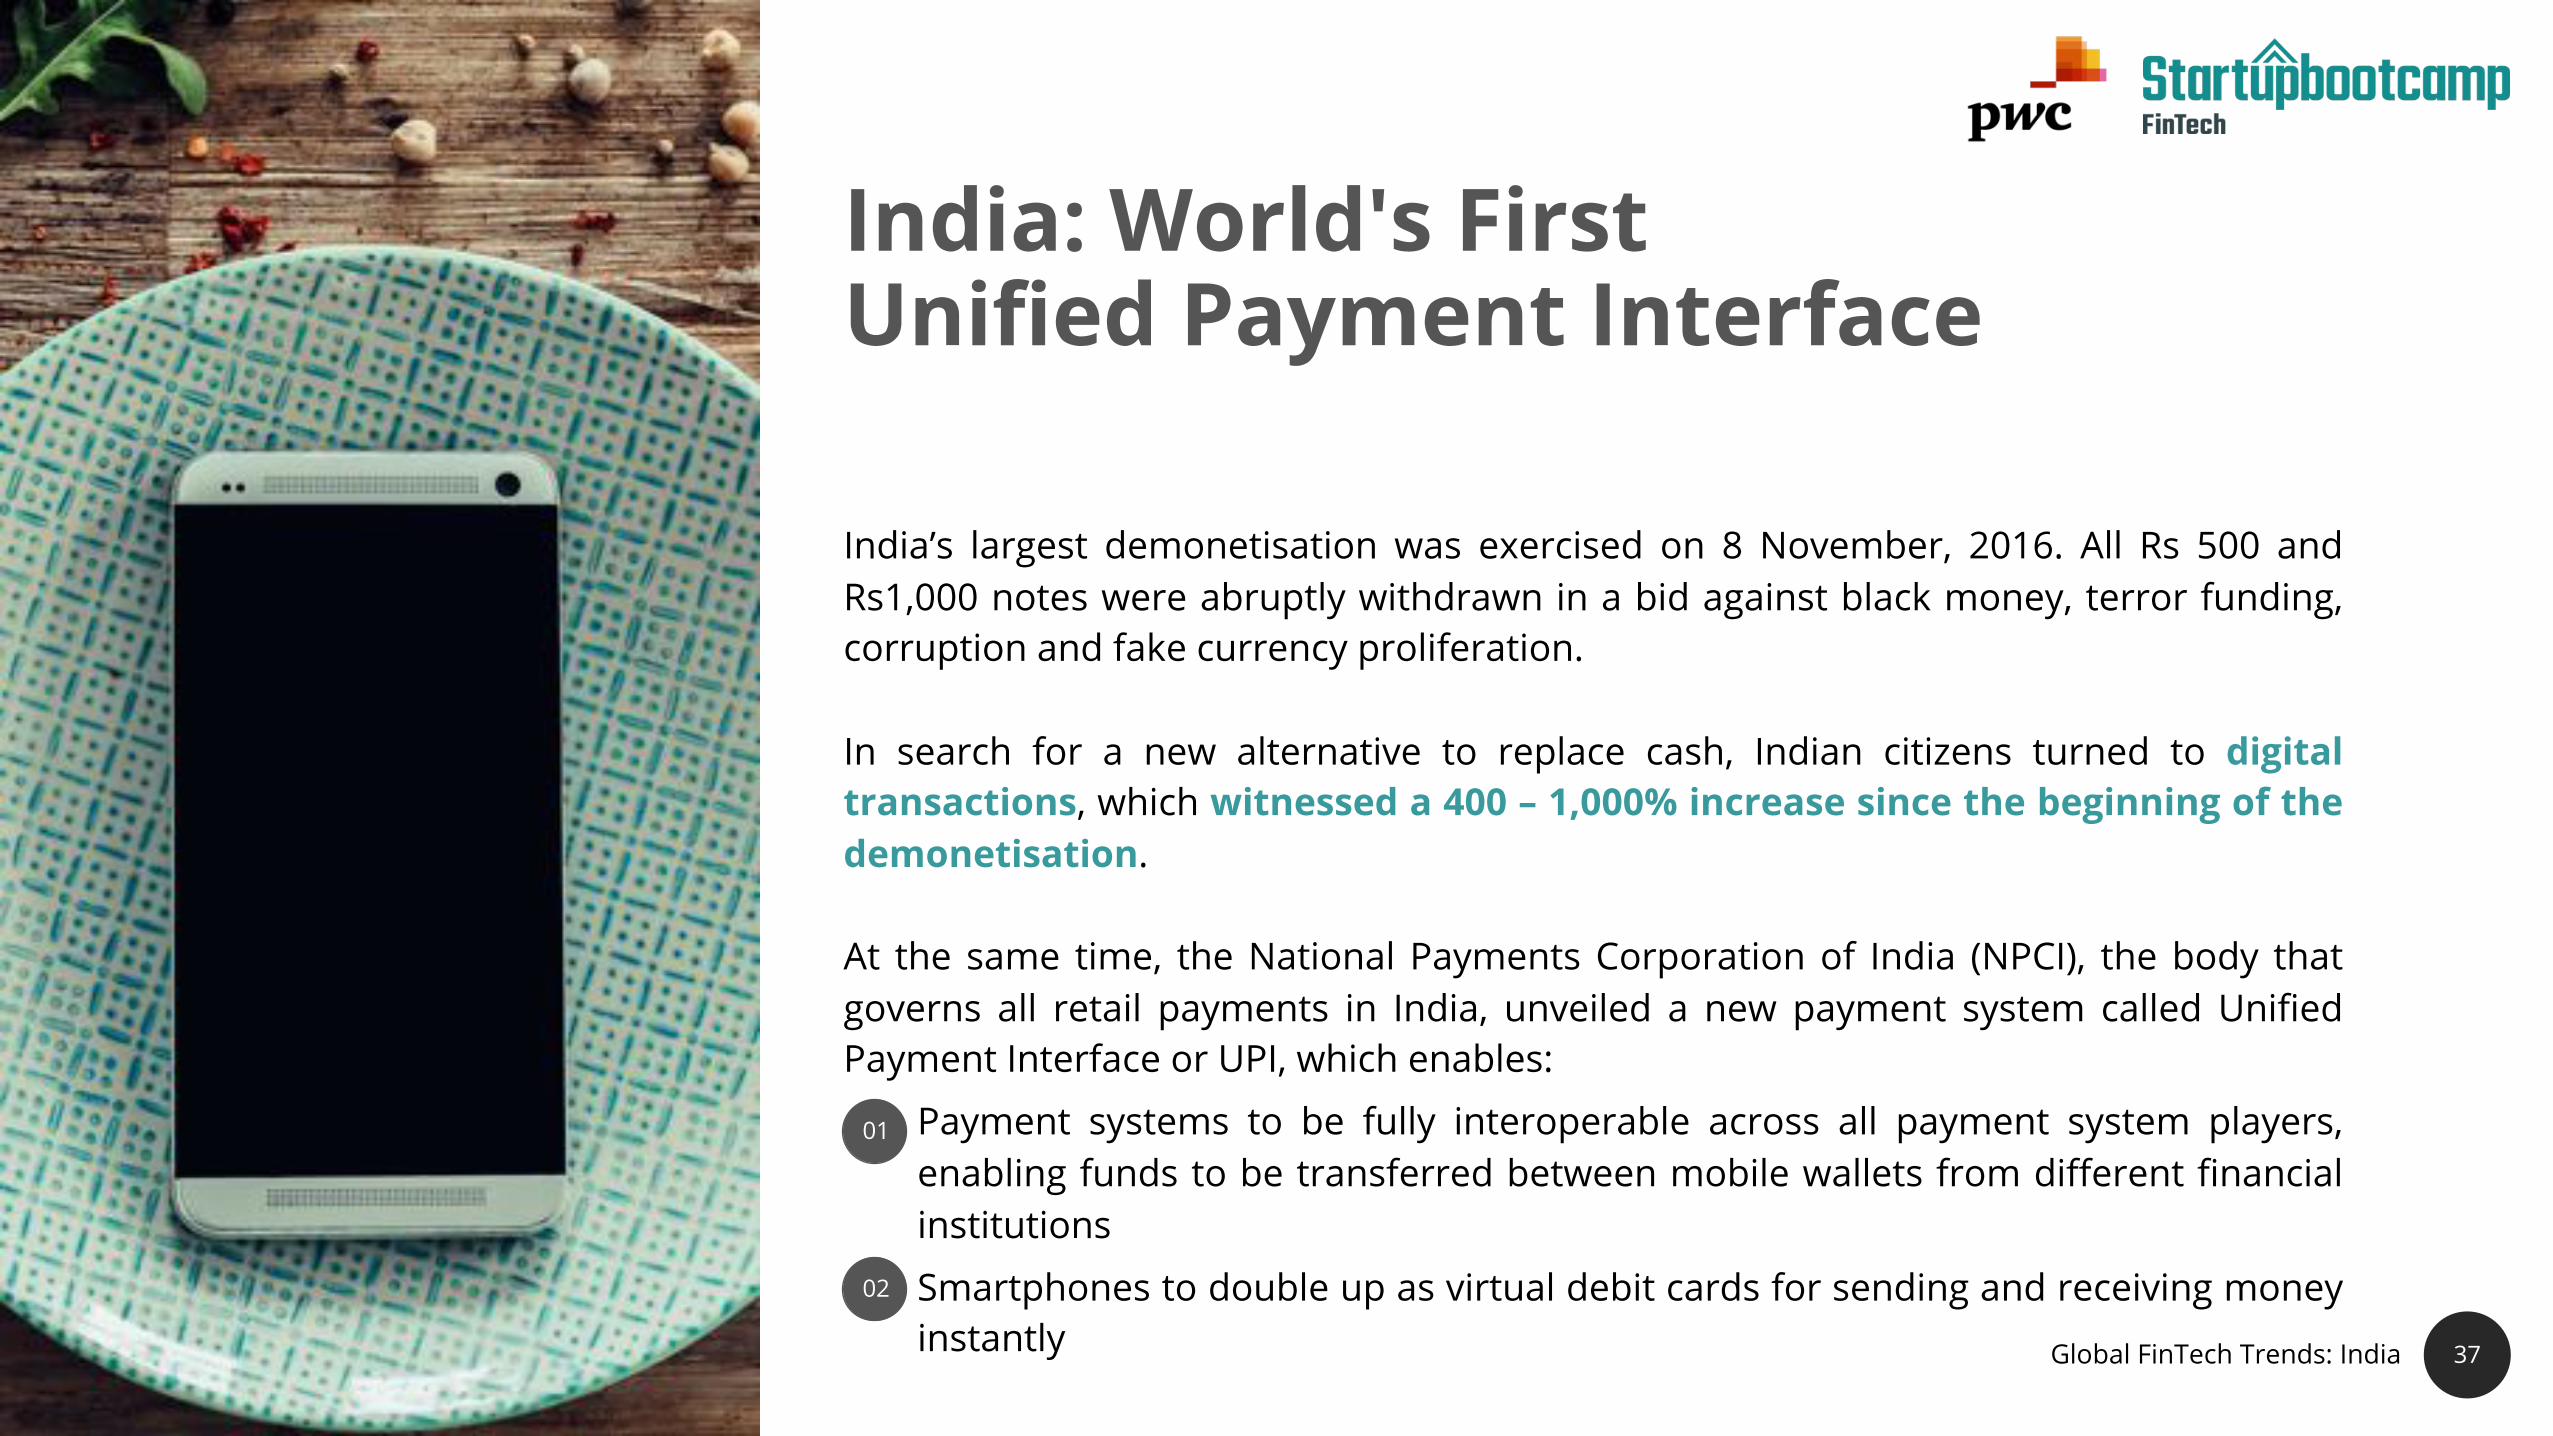
India’s largest demonetisation was exercised on 8 November, 2016. All Rs 500 andRs1,000 notes were abruptly withdrawn in a bid against black money, terror funding,corruption and fake currency proliferation.
In search for a new alternative to replace cash, Indian citizens turned to digitaltransactions, which witnessed a 400 – 1,000% increase since the beginning of thedemonetisation.
At the same time, the National Payments Corporation of India (NPCI), the body thatgoverns all retail payments in India, unveiled a new payment system called UnifiedPayment Interface or UPI, which enables:
Payment systems to be fully interoperable across all payment system players,enabling funds to be transferred between mobile wallets from different financialinstitutions
Smartphones to double up as virtual debit cards for sending and receiving moneyinstantly
01
02
37
Global FinTech Trends: India
THE
STAT
E O
F FI
NTE
CH
As a result of the demonetization and the development of UPI:
Digital transactions grown by 4x in volume and value across various modesfrom wallets to cards and interbank transfers from a year earlier
Card transactions at point of sale (PoS) terminals at merchant locations havesurged
The number of debit card transactions rose to more than 1 billion in Januaryfrom 817 million last yearThe number of ATM transactions have remained constant at around 700 million,the incremental growth has been driven mostly by card swipes at PoS terminals.
The government has also been promoting smartphone-based transactions throughthe UPI and the Bharat Interface for Money (BHIM). Both use the Immediate PaymentService (IMPS), which has seen a 160% increase in number of transactions amountingto 67 million in March up from 26 million one year ago.
Payments Industry in India
01
02
03
04
38Global FinTech Trends: India
THE
STAT
E O
F FI
NTE
CH
39
Over the last five years, we have invested over S$5 billion in our technology andinfrastructure, enabling us to develop products and platforms to meet our customers’needs. From re-architecting our technology infrastructure to transforming our front end,we are becoming digital to the core. The bank’s customers, both individuals andcorporates alike, are increasingly engaging and transacting more with us digitally. Someexamples of our new services include digibank, India’s first branchless, paperless andsignature-less bank; DBS iWealth, a platform that allows clients to conduct their bankingtransactions, manage their wealth and trade; and online account opening for SMEs.Coupled with a focus on agile methodology and journey thinking, we have been able toimprove our speed to market and overall customer experience. This translates to moredigitally-engaged customers, and higher returns per customer.
We have rewired many parts of the bank, and changed the mindset of our employees. Itis now easier for us to work with startups and we have partnered over 10 a year to delivernew products and services to our customers and staff. Through our talent managementhackathons, our employees are also given the opportunity to learn and work withstartups. We have also used hackathons to hire tech talent, interns and managementassociates.
Neal CrossChief Innovation Officer
39
Global FinTech Trends: India
“

THE
STAT
E O
F FI
NTE
CH
US$131m US$38m US$2.5bn
US$338m US$49m US$1.8m
US$396m US$64m US$527m US$4m
FinTech India
40
1650+ companies in the sector, 213 were funded the past 5 years
Most Active Investors: Sequoia Capital, Accel Partners, Blume Ventures
InsurTech MobilePayments
ConsumerFinance
Investment Tech RemittanceBanking Tech
Software for Institutional
Investor
Crowdfunding Lending Payment
Cumulative funding in the sectorGlobal FinTech Trends: India

THE
STAT
E O
F FI
NTE
CH
US$2.5bnMobile Payments
Wallet / Paytm (2010, US$2.16bn)
mPOS / Ezetap (2011, US$35m)
Money Transfer / Chillr (2013, US$7.5m)
Payment Technology/ Juspay (2012, US$5.8m)
41
Over the past year, payments has attracted the largest part of investments in India, this is explained by a combination ofmature payment platforms expanding into new markets as well as the demonetisation of Indian currency.
Cumulative funding in the sector:
Funding Highlights - India
41Global FinTech Trends: India

THE
STAT
E O
F FI
NTE
CH
Observations - India
The introduction of UPI has been a game changer in theIndian FinTech scene.
There has been a convergence of interest of variousstakeholders, which has created an enablingenvironment for the development of mobile payments— the regulations on Payments Banks, the CentralGovernment’s focus on financial inclusion and the nearuniversal coverage of Aadhaar as a digital identity.
While closed loop platforms with remittances at the coreof their proposition have worked successfully in otherparts of the developing world, similar attempts in Indiahave had limited success. A standardised interoperablesystem such as the UPI is a necessity for a multi-stakeholder ecosystem such as India.
42Global FinTech Trends: India

THE
STAT
E O
F FI
NTE
CH
GLOBAL STATE OF FINTECH

THE
STAT
E O
F FI
NTE
CH
44
Global FinTech Funding
Source: Tracxn, March 2017
01
02
In Q1 2017, US$1.8bn has been invested inFinTech globally and, at the current run rate,both deals and funding are on track to increasein 2017.
It is worth noting that in 2016, there was anincrease in funding of US$2.7B but a decreasein the number of funding rounds. 651
1003
1452
1845
1675
Global FinTech Funding
Number of Funding Rounds
Funding Amount (in USD billions)
2012 2013 2014 2015 2016
3.1
4.3
14.0
20.8
23.5
5
0
25
20
15
10
600
200
2000
1600
1000
400
0
1800
1400
1200
800
Num
ber
of F
undi
ng R
ound
s
Fund
ing
Am
ount
(US$
B)Global State of Fintech

THE
STAT
E O
F FI
NTE
CH
45
Geographical Analysis - Fintech
18,400+ companies in the sector, 4000+ funded since 2012Most Active Investors: Startupbootcamp, 500 Startups, Y Combinator
Percentage of Companies
Percentage of Funded
North-America
South-America
Europe MENAAPAC Others
28%20
0
100
80
60
40
% o
f fu
nded
% o
f Co
mpa
nies
38%
1.9%
24.8%
3.9%
29%
2.7%
40%
1.5%4.2%20
0
100
80
60
40
24%
2.4% Source: Tracxn, March 2017
Global FinTech Companies and Funding
Global State of Fintech
THE
STAT
E O
F FI
NTE
CH
46
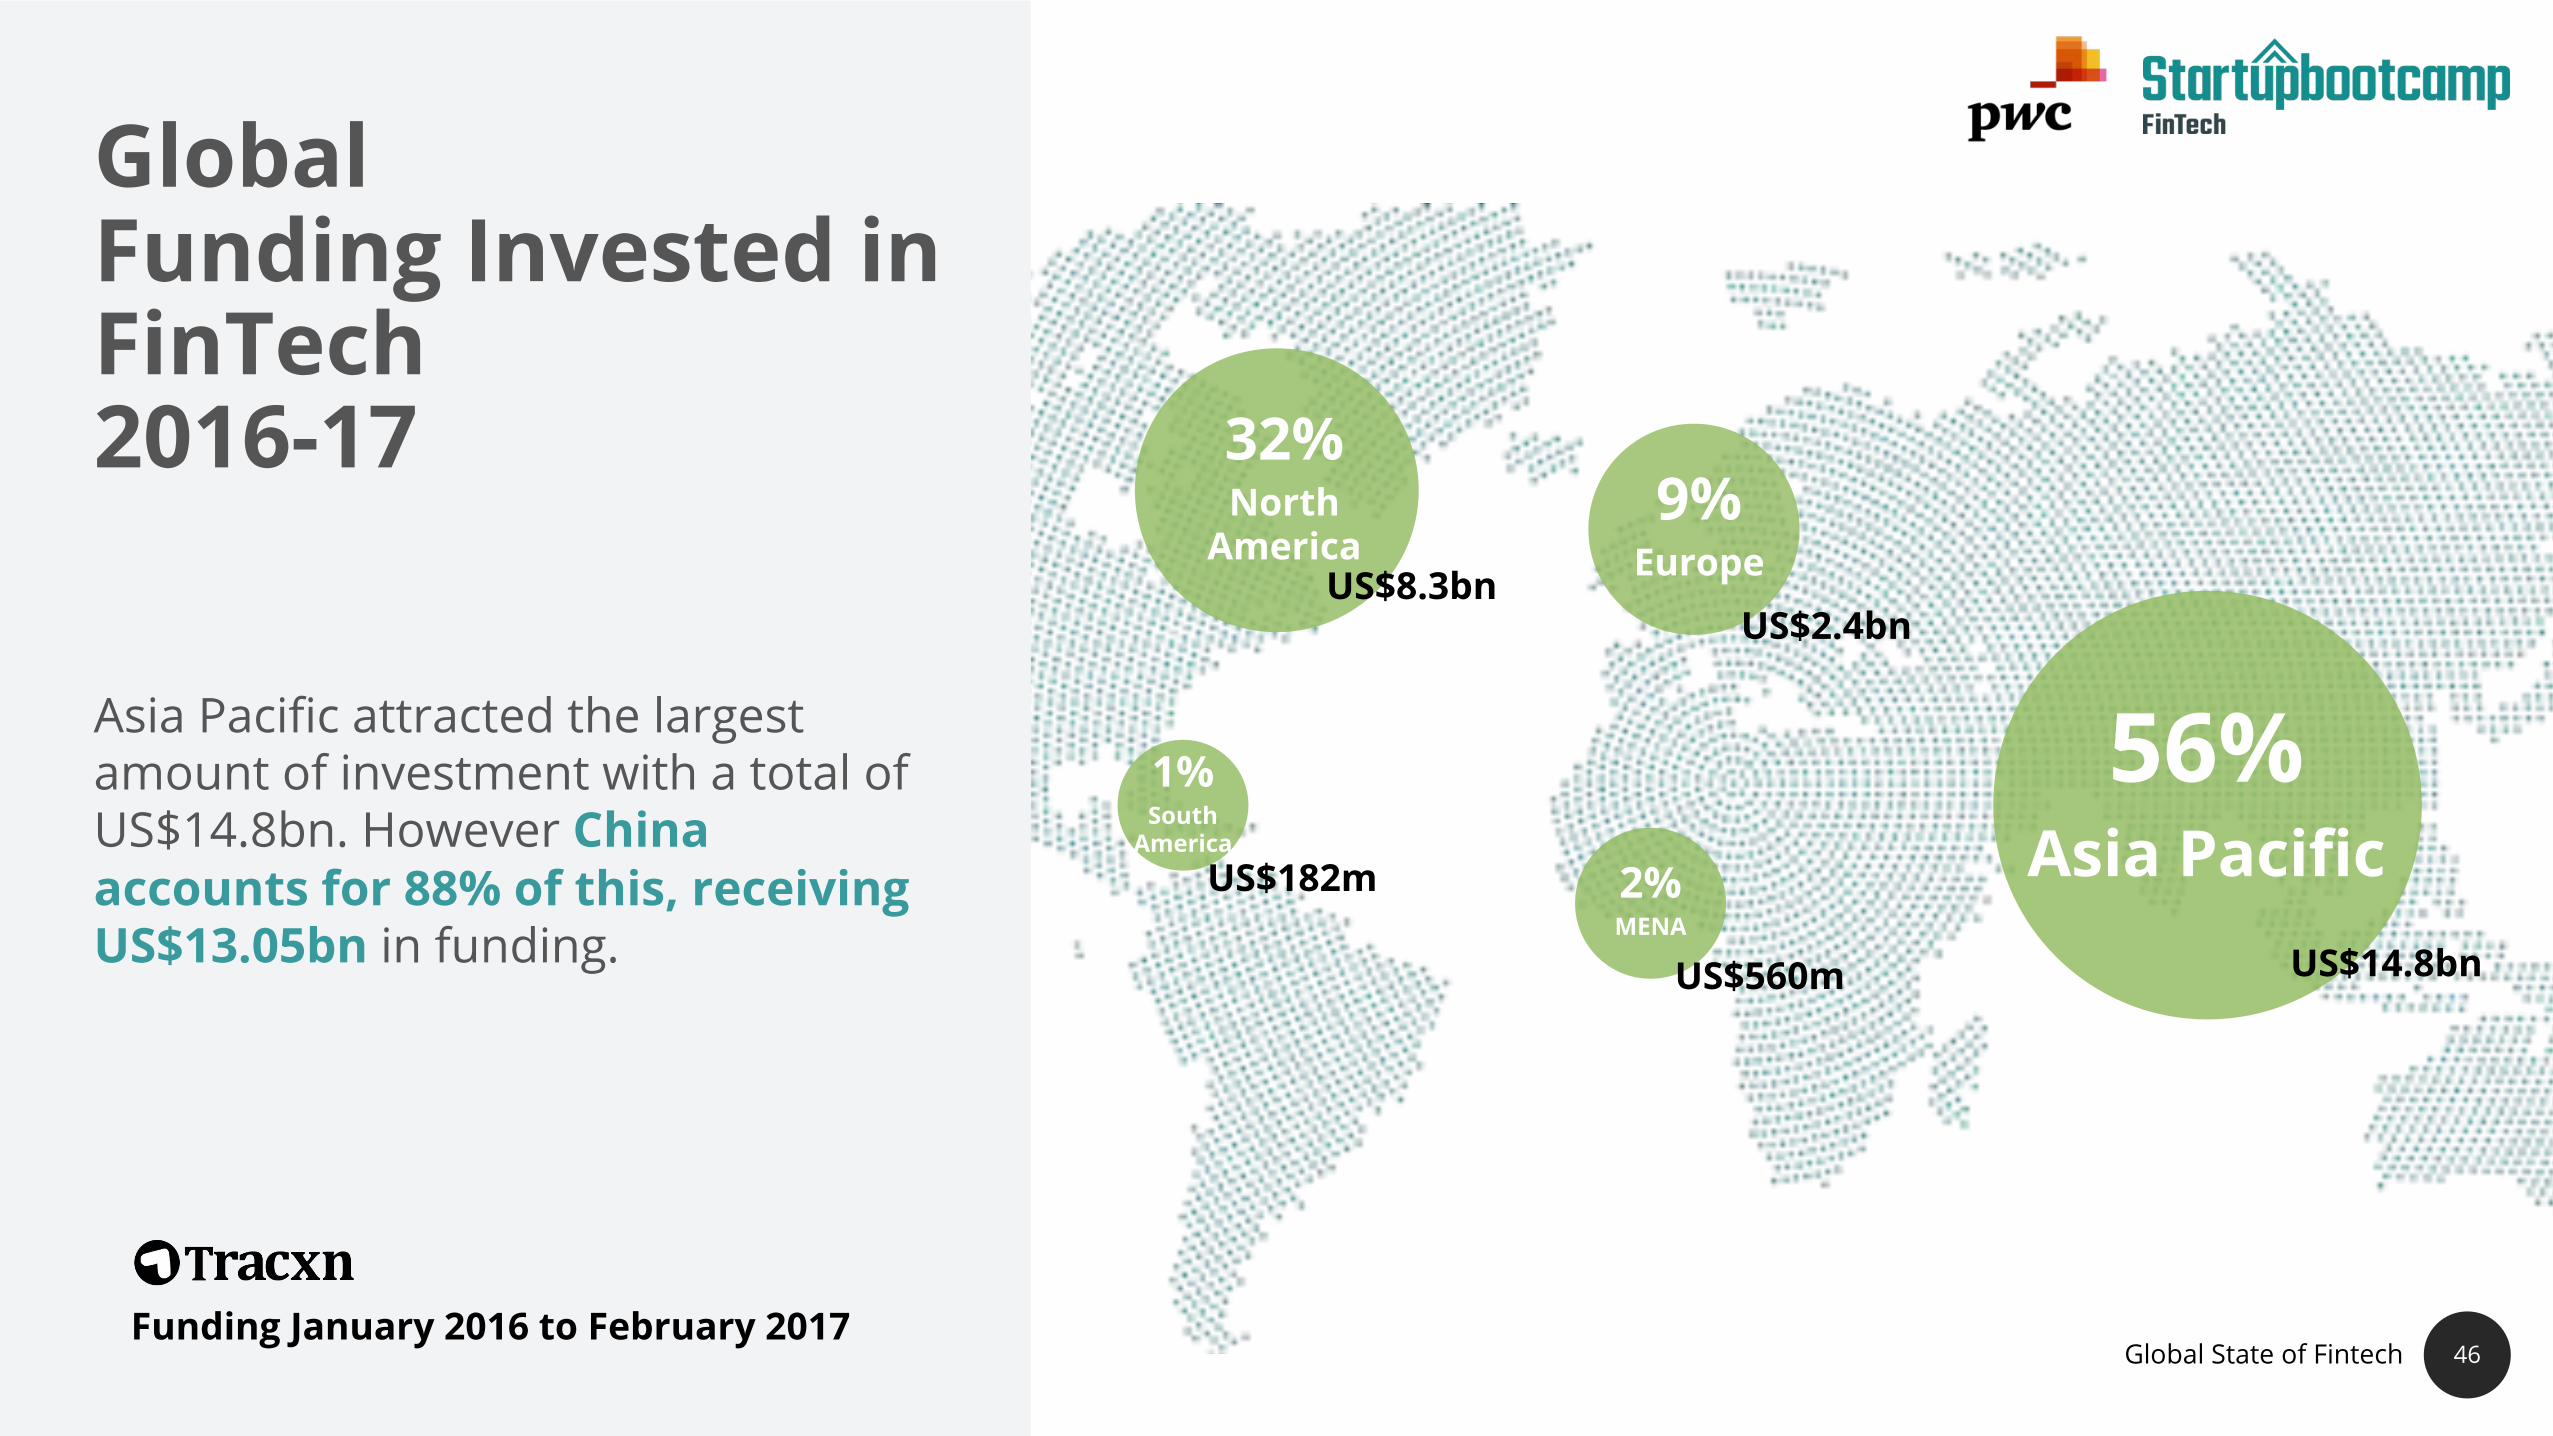
Global Funding Invested in FinTech2016-17 32%
North America
US$8.3bn
1%South
AmericaUS$182m
9%Europe
US$2.4bn
2%MENA
US$560m
56%Asia Pacific
US$14.8bn
Asia Pacific attracted the largest amount of investment with a total of US$14.8bn. However China accounts for 88% of this, receiving US$13.05bn in funding.
Funding January 2016 to February 2017Global State of Fintech

THE
STAT
E O
F FI
NTE
CH
US$6.3bn US$6.1bn US$1.4bn US$583m
US$2.1bn US$1.2bn US$1.1bn US$7.9bn
US$6.1bn US$24.3bn US$857m US$7.2bn
US$13bn
47
Global Funding Invested in FinTech
InsuranceTech BlockchainConsumer
FinanceRobo
Advisors
Bitcoin Banking TechRemittance Crowdfunding
Lending Finance &Account
MobilePayment
InvestmentTech
Payments
18,400+ companies in the sector, 4000+ funded since 2012Most Active Investors:Startupbootcamp, 500 Startups, Y Combinator
Cumulative funding in the sector
THE
STAT
E O
F FI
NTE
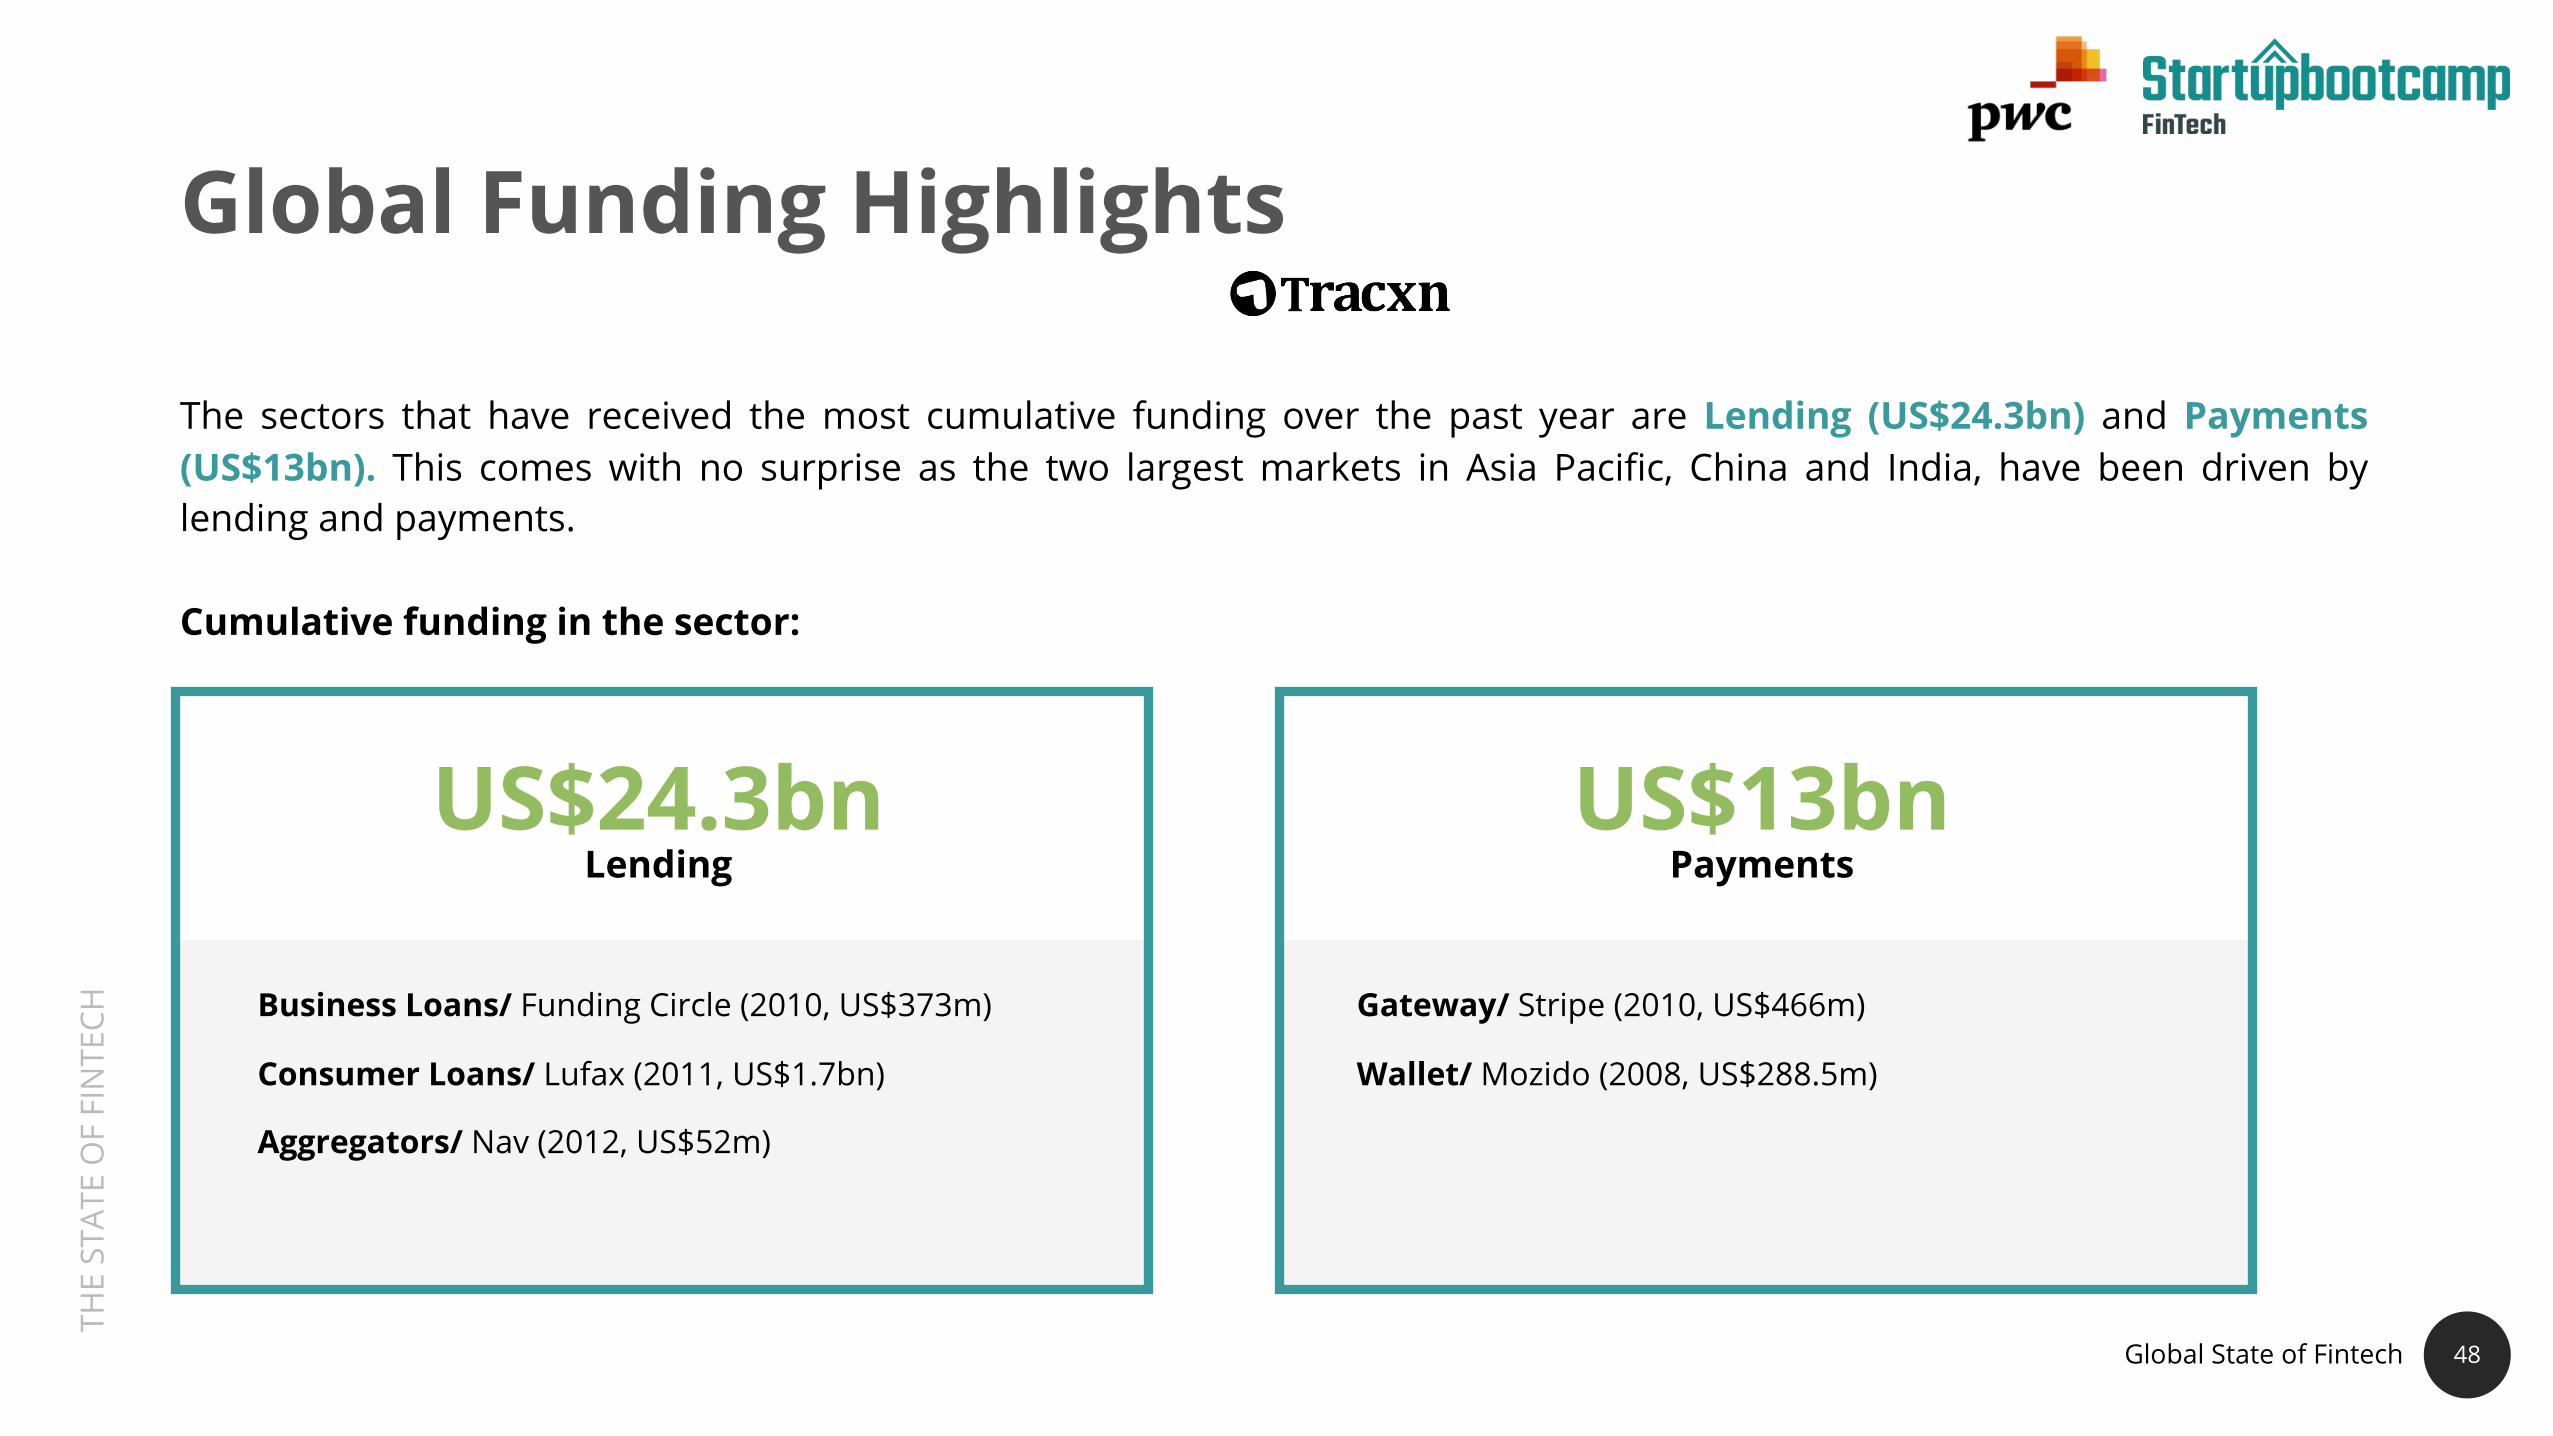
CH Business Loans/ Funding Circle (2010, US$373m)
Consumer Loans/ Lufax (2011, US$1.7bn)
Aggregators/ Nav (2012, US$52m)
US$24.3bnLending
US$13bnPayments
48
Global Funding Highlights
The sectors that have received the most cumulative funding over the past year are Lending (US$24.3bn) and Payments(US$13bn). This comes with no surprise as the two largest markets in Asia Pacific, China and India, have been driven bylending and payments.
Cumulative funding in the sector:
Gateway/ Stripe (2010, US$466m)
Wallet/ Mozido (2008, US$288.5m)
Global State of Fintech

THE
STAT
E O
F FI
NTE
CH
The Future of FinTech Asia Pacific

THE
STAT
E O
F FI
NTE
CH
The Future of FinTech
50
Financial Inclusion
WealthManagement RegTech InsurTech
01 02 03 04

THE
STAT
E O
F FI
NTE
CH
Financial Inclusion
51
The unmet deposit demand from theun(der)banked demographic isestimated to represent US$360bn.
The World Bank Group (WBG),estimates that 2 billion or 42% of theglobal adult population does not haveaccess to basic financial services.
We believe that addressing theun(der)banked community, which islargely located in Asia Pacific, presentssizeable opportunities for bothstartups and corporates.
*Organization for Economic Co-Operation and Development
MiddleEast
Sub-SaharanAfrica
SouthAsia
Latin America&
Caribbean
Europe&
Central Asia
East Asia&
Pacific
20
0
100
80
60
40
14%
34%
46%
51% 52%
69%
94%
High-incomeOECD*
countries
Source: Global Findex Database, 2014
Percentage of adults with traditional bank account
The Future of FinTech in Asia Pacific: Financial Inclusion
THE
STAT
E O
F FI
NTE
CH
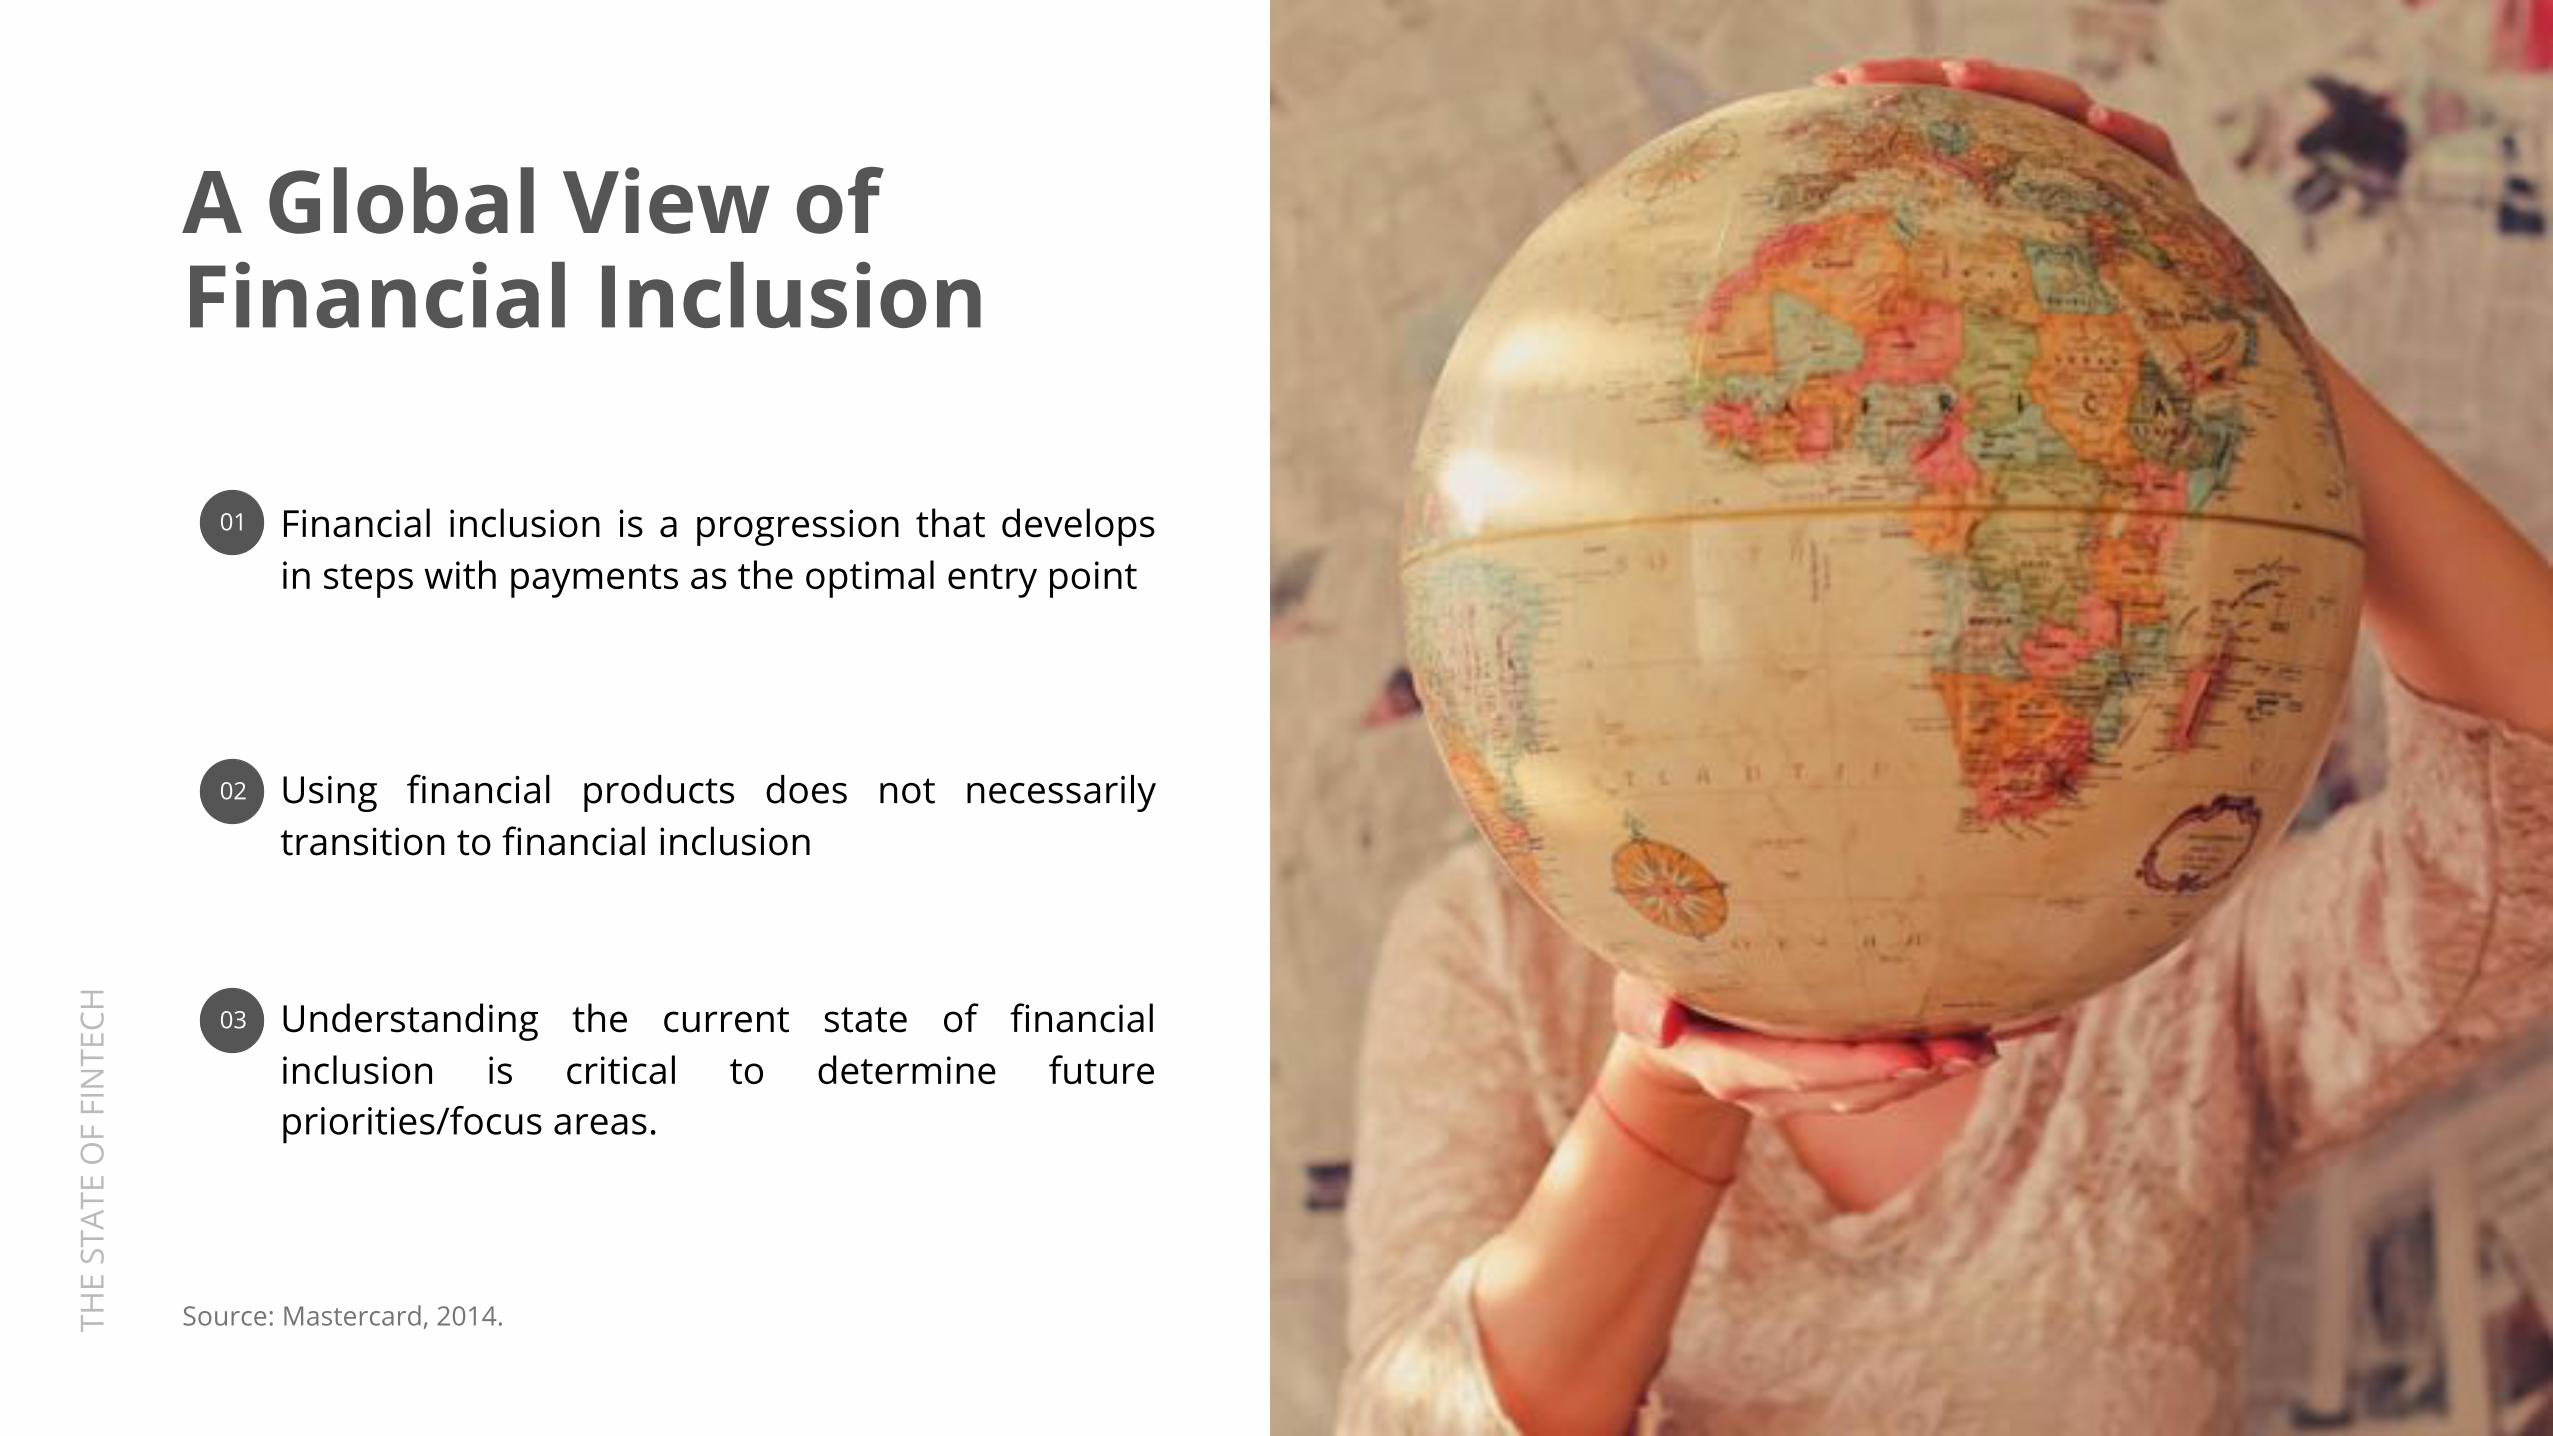
A Global View of Financial Inclusion
52
Financial inclusion is a progression that developsin steps with payments as the optimal entry point
Using financial products does not necessarilytransition to financial inclusion
Understanding the current state of financialinclusion is critical to determine futurepriorities/focus areas.
01
02
03
Source: Mastercard, 2014.
THE
STAT
E O
F FI
NTE
CH
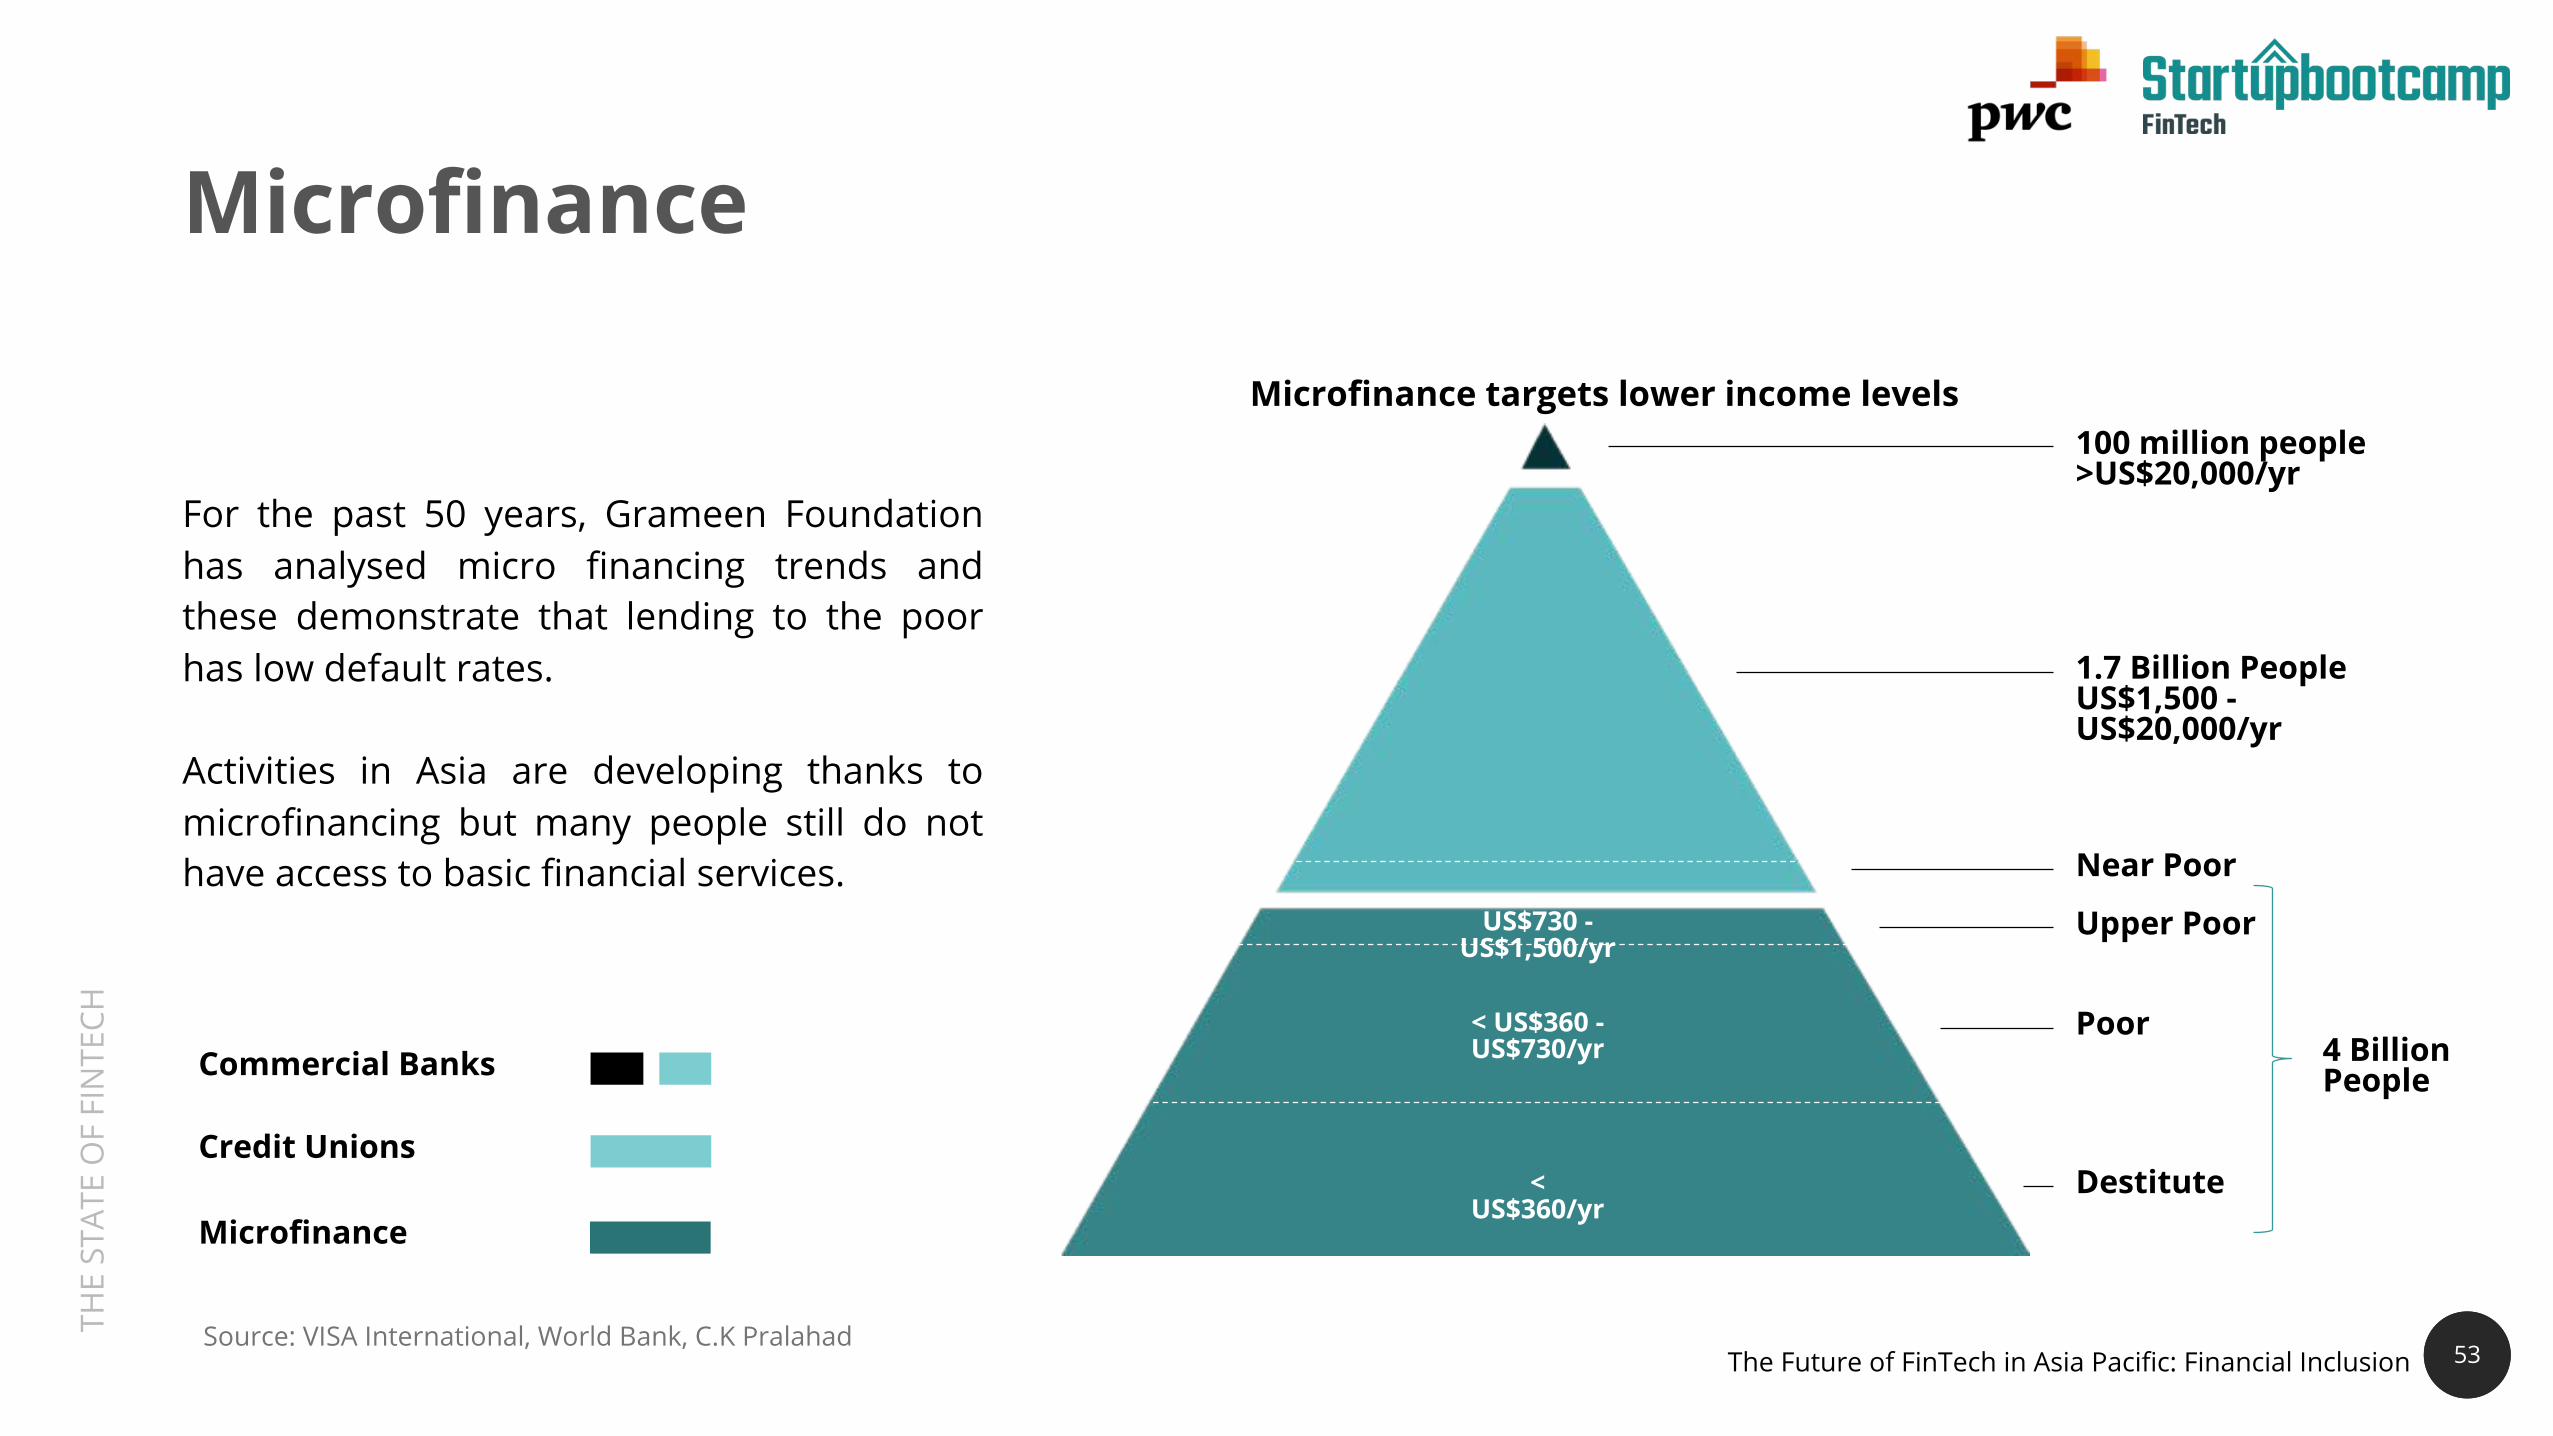
Microfinance
53
For the past 50 years, Grameen Foundationhas analysed micro financing trends andthese demonstrate that lending to the poorhas low default rates.
Activities in Asia are developing thanks tomicrofinancing but many people still do nothave access to basic financial services.
< US$360/yr
< US$360 -US$730/yr
US$730 -US$1,500/yr
Microfinance
Credit Unions
Commercial Banks
1.7 Billion PeopleUS$1,500 -US$20,000/yr
Near Poor
Upper Poor
Destitute
Poor
100 million people>US$20,000/yr
Source: VISA International, World Bank, C.K Pralahad
4 Billion People
Microfinance targets lower income levels
The Future of FinTech in Asia Pacific: Financial Inclusion
THE
STAT
E O
F FI
NTE
CH
54
Asia has the highest percentage of unbanked population in theworld (21% in China, 47% in India and 64% in Indonesia).
This is due to a number of factors:
Banks are difficult to access for people living in remoteareas
Remittance and money transfer is not cost effectivewhen transferring small amounts
Financial institutions have not historically focused onsmall businesses leaving a funding gap in the market
Micro-finance For The Unbanked
01
02
03
54
The Future of FinTech in Asia Pacific: Financial Inclusion
THE
STAT
E O
F FI
NTE
CH
•Microfinance is growing, this trend is primarily drivenby:
Microfinance Drivers
High levels of mobile phone penetration in Asia,which in turn has led to the rise of internetplatforms with massive scale.
01
Technology companies now have moretransaction data than banks and they arefunneling this into alternative lending platforms.
02
THE
STAT
E O
F FI
NTE
CH
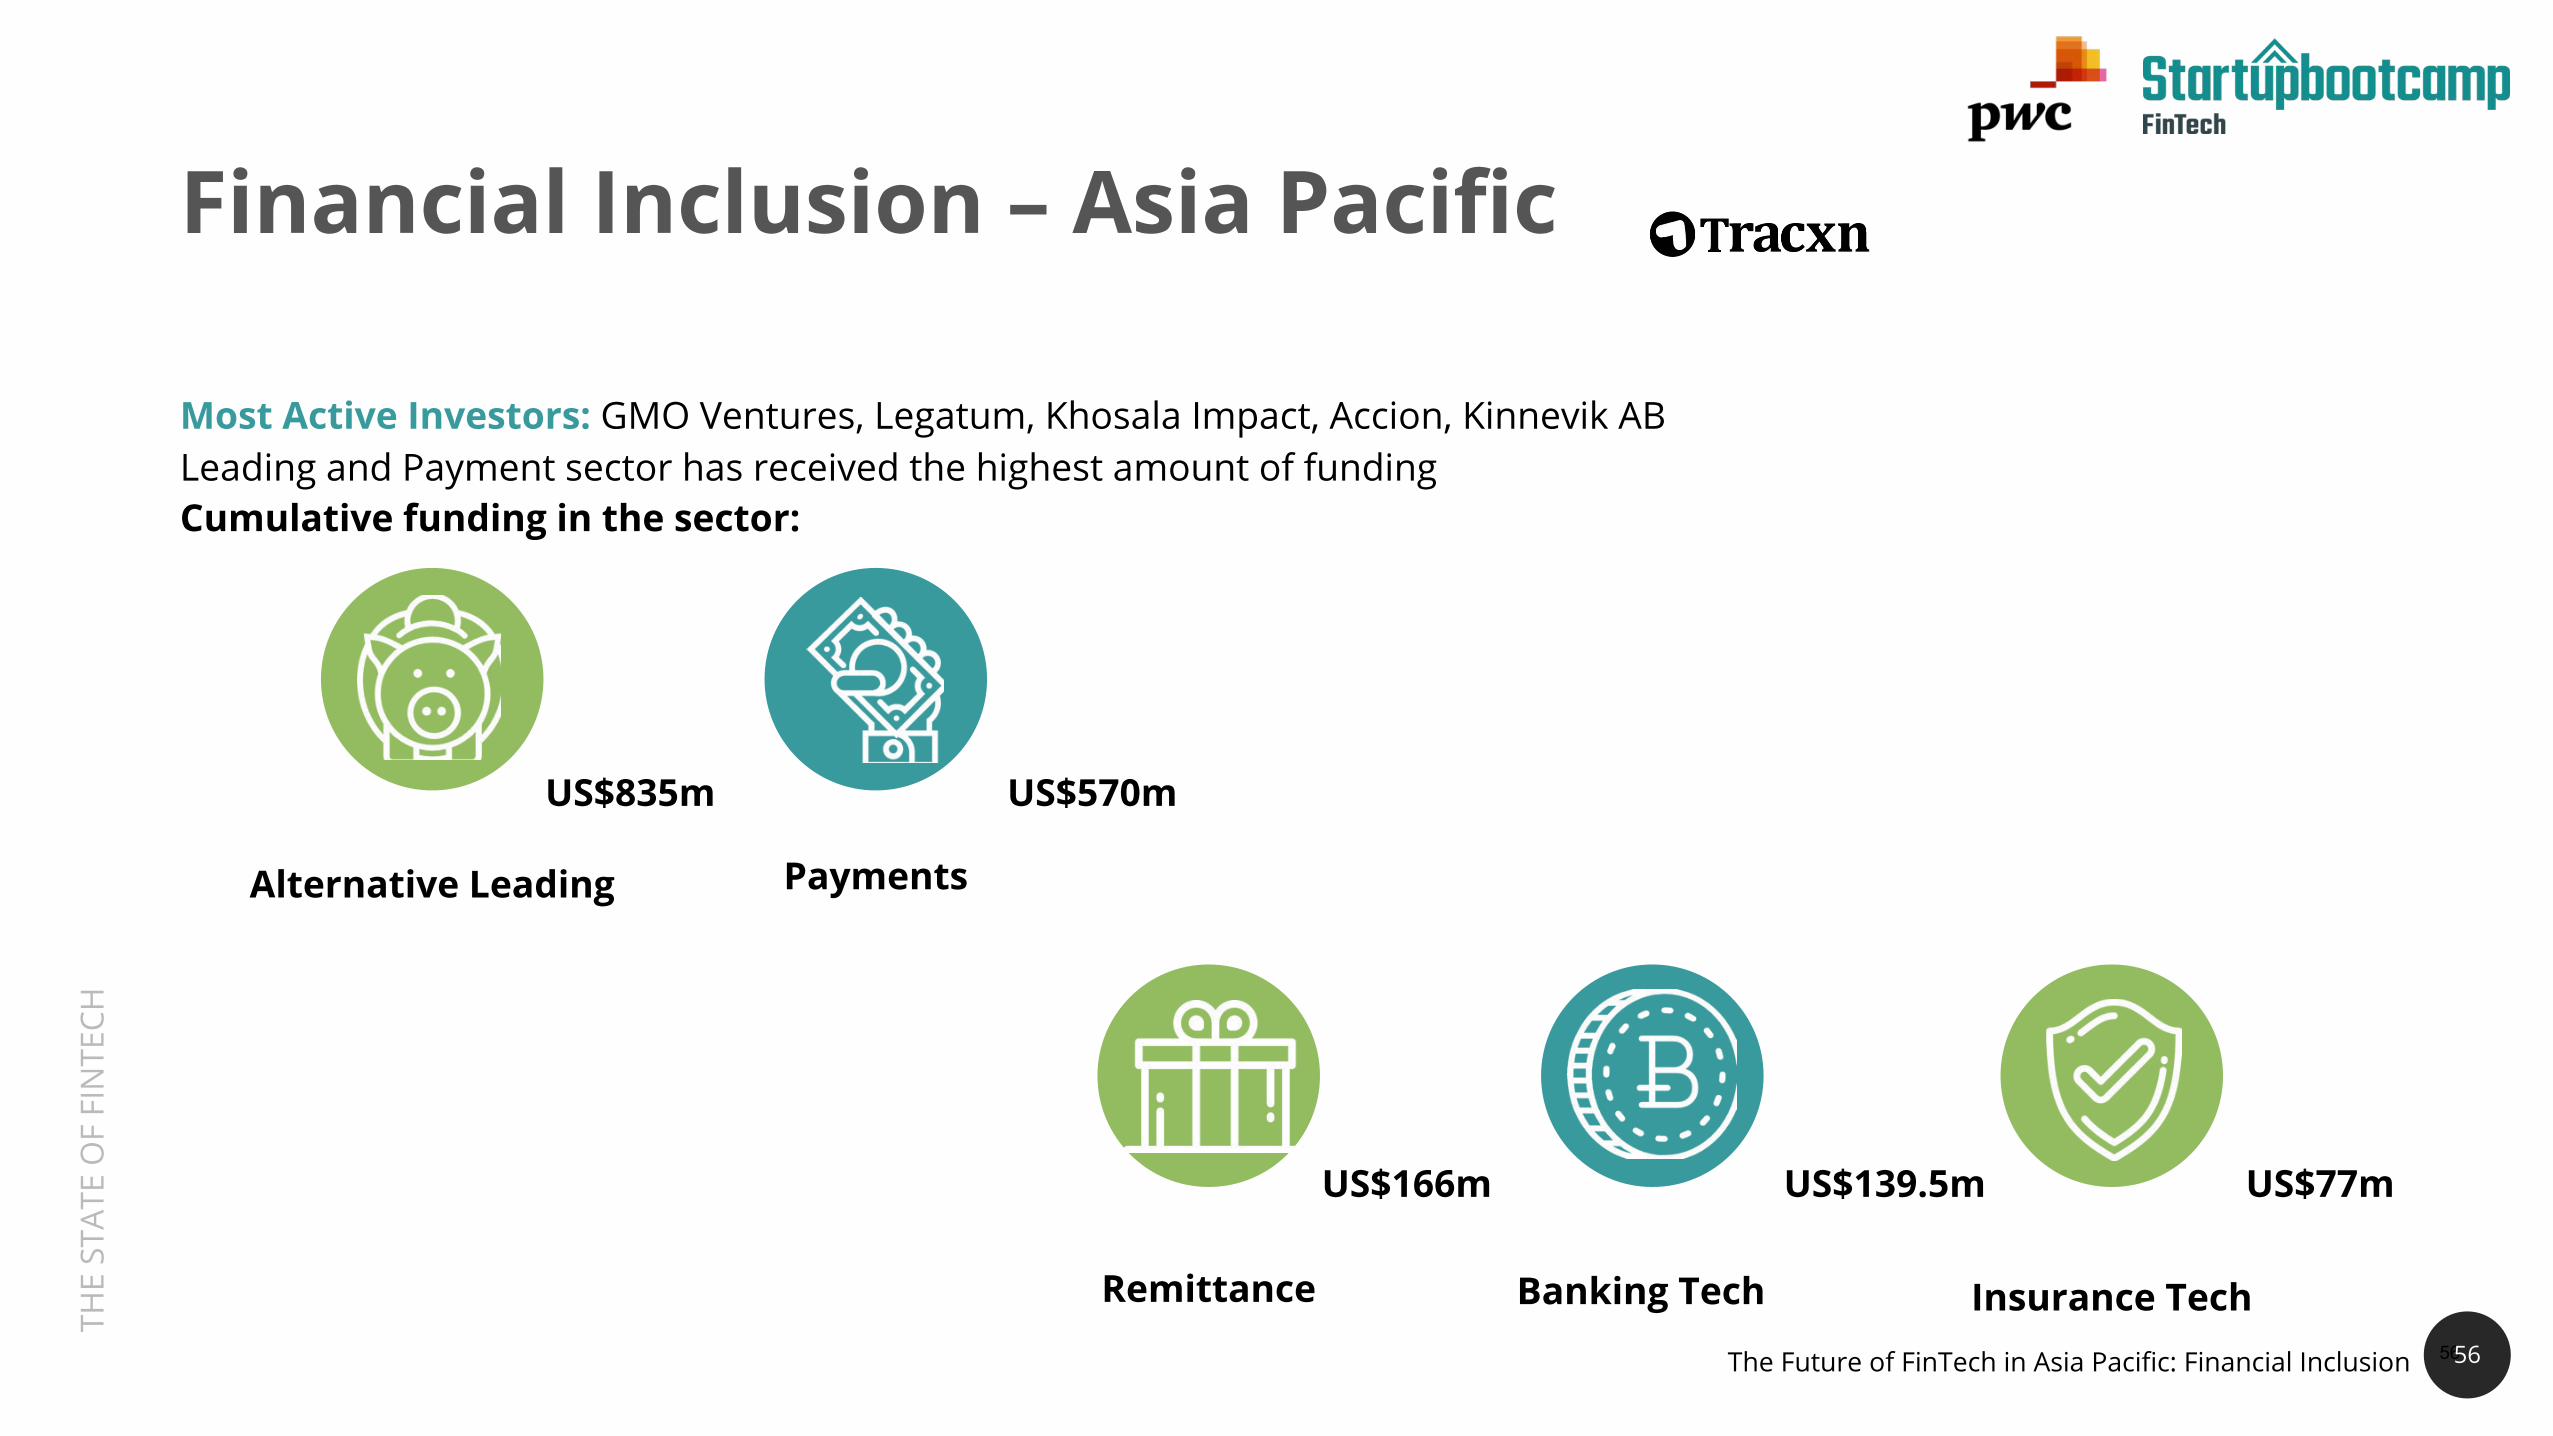
US$835m US$570m
US$166m US$139.5m US$77m
56
Financial Inclusion – Asia Pacific
Most Active Investors: GMO Ventures, Legatum, Khosala Impact, Accion, Kinnevik ABLeading and Payment sector has received the highest amount of fundingCumulative funding in the sector:
Alternative Leading Payments
Remittance Banking Tech Insurance Tech56The Future of FinTech in Asia Pacific: Financial Inclusion
THE
STAT
E O
F FI
NTE
CH
57
Financial Inclusion – Asia Pacific
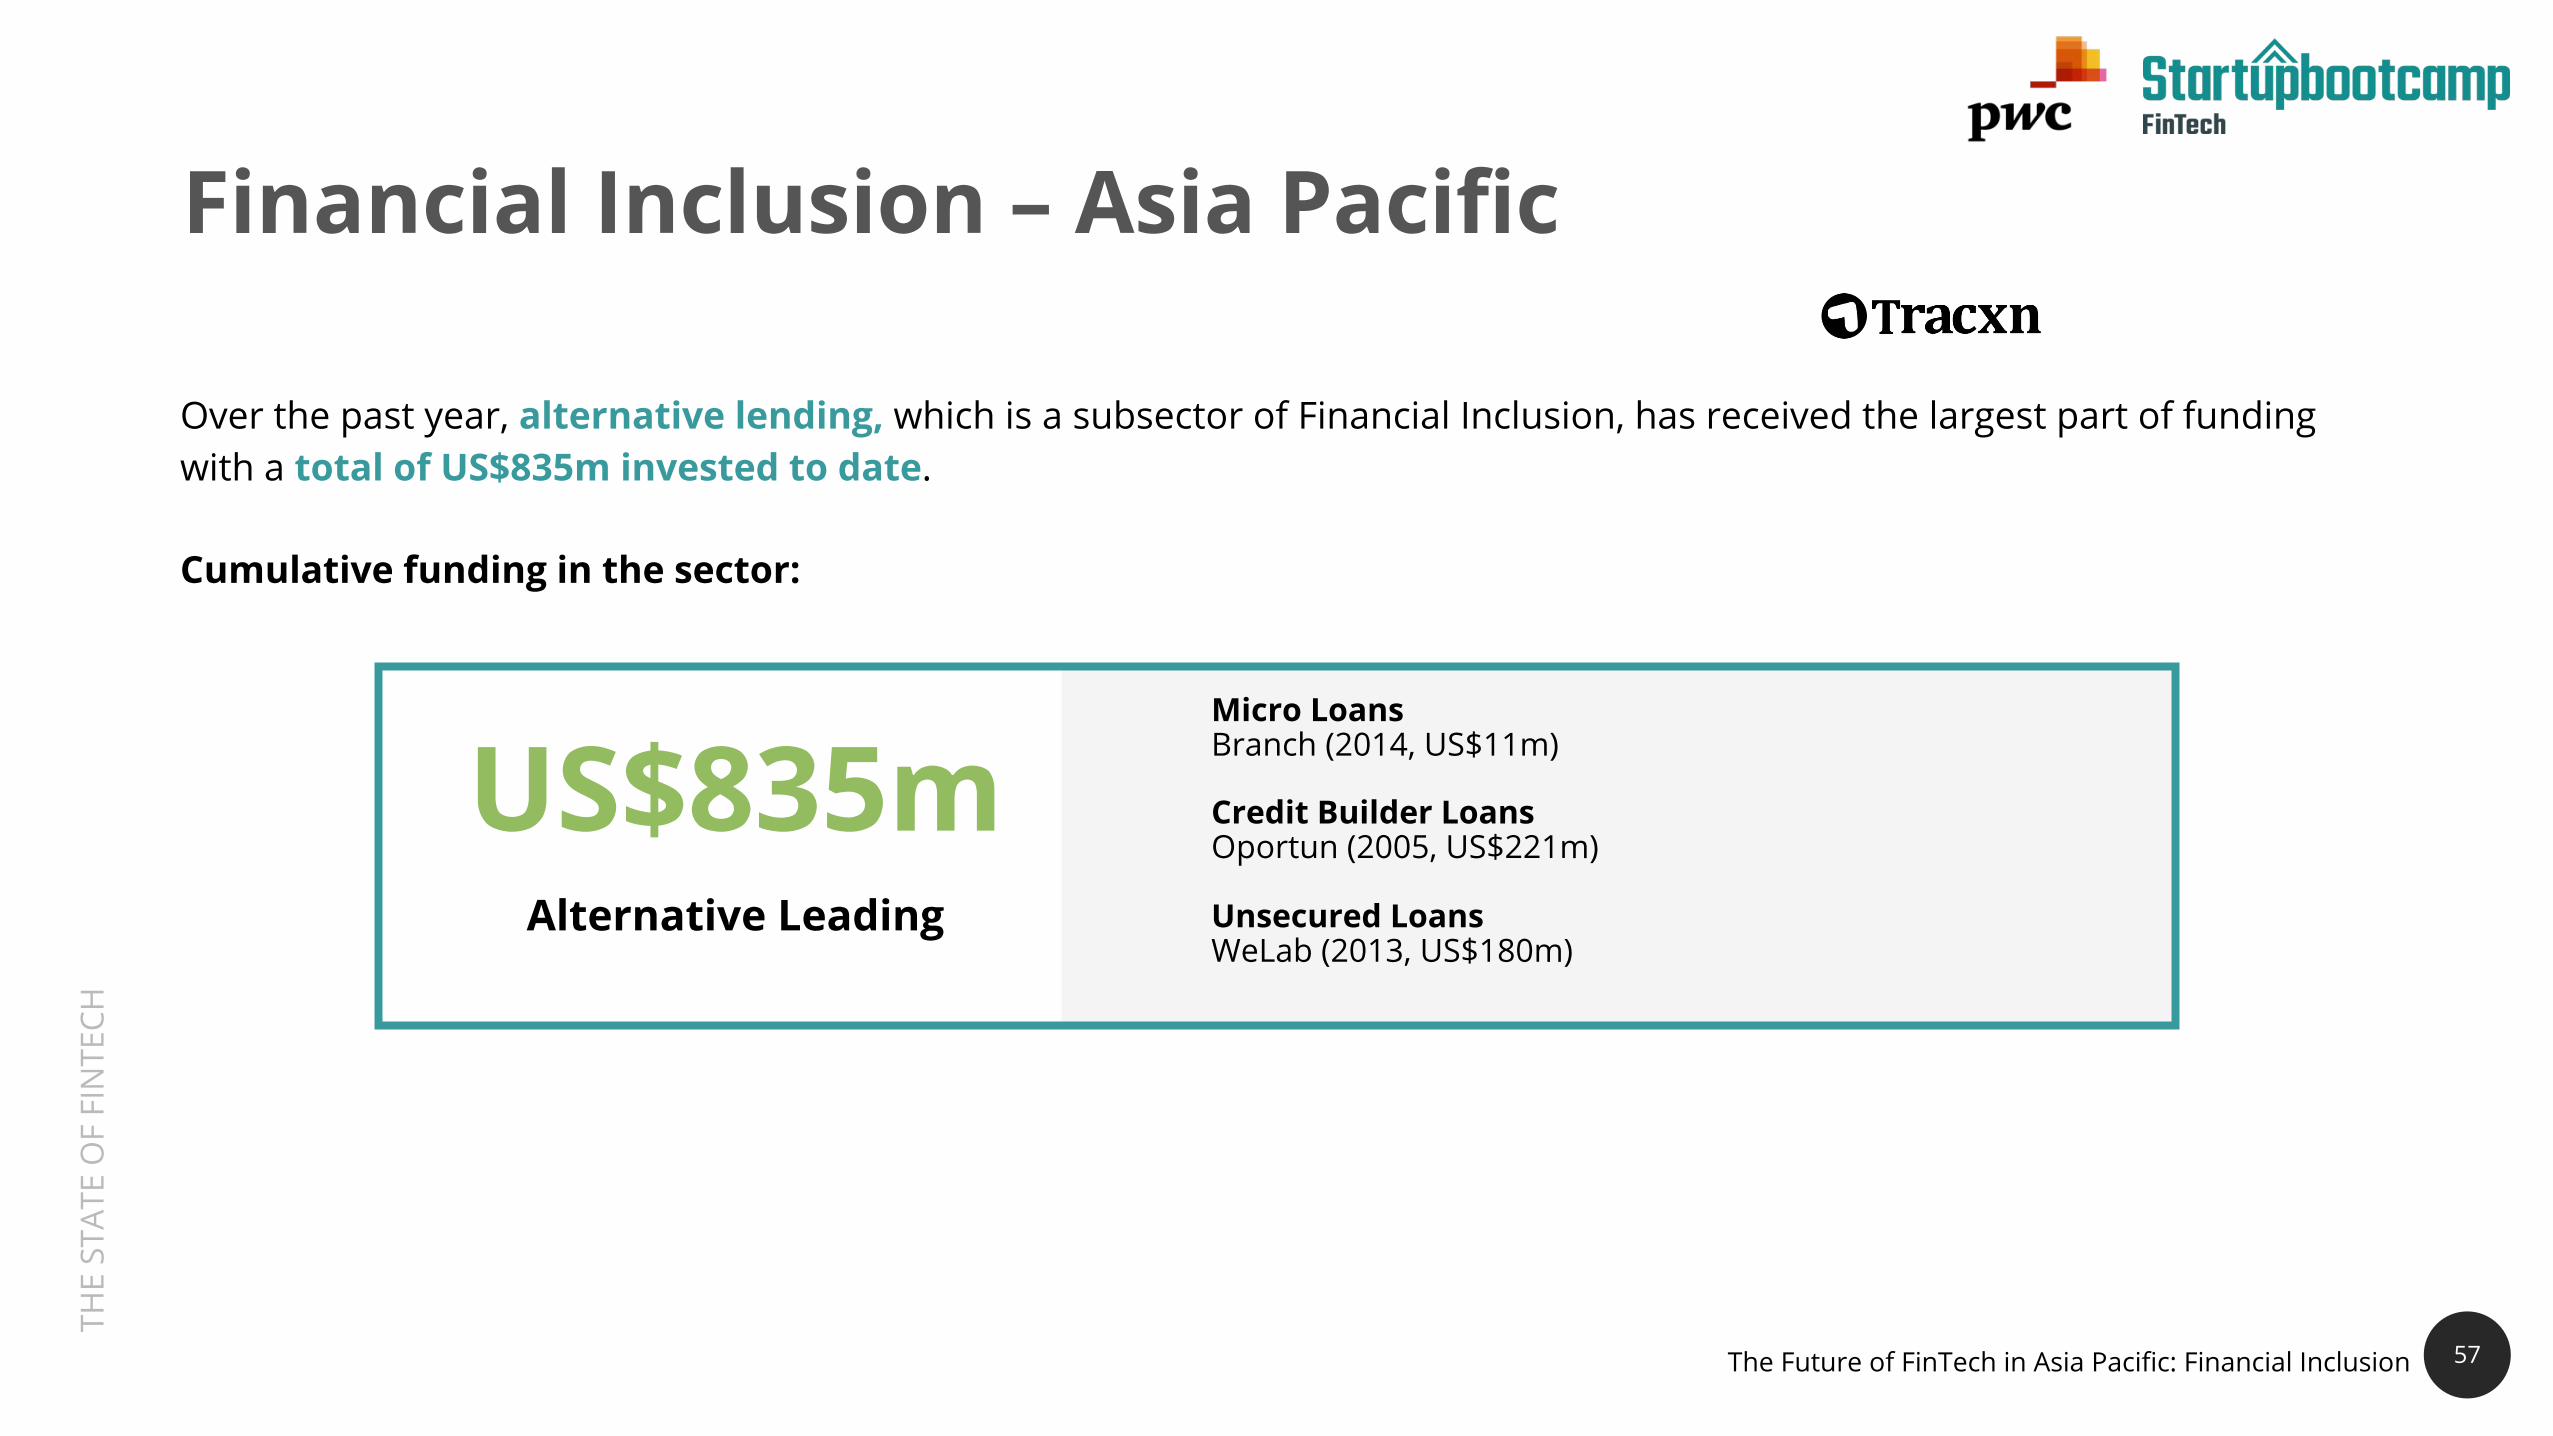
Over the past year, alternative lending, which is a subsector of Financial Inclusion, has received the largest part of fundingwith a total of US$835m invested to date.
Cumulative funding in the sector:
US$835mAlternative Leading
Micro LoansBranch (2014, US$11m)
Credit Builder LoansOportun (2005, US$221m)
Unsecured LoansWeLab (2013, US$180m)
The Future of FinTech in Asia Pacific: Financial Inclusion

THE
STAT
E O
F FI
NTE
CH
58
A study by Microfinance Information Exchange (MIX),revealed that the Asian microfinance market standsunrivalled in scale.
Institutions facilitating microfinance in Asia willcontinue to play a critical role in improving access tofinance for entrepreneurs, families and smallbusiness owners. And Asia is a prime market foralternative lenders, who usually use alternativemeans to assess creditworthiness, foregoingtraditional credit scores altogether.
As a result, we believe that investments in microfinancing will continue to grow and fuel economies indeveloping markets.
Observations –Financial Inclusion
58The Future of FinTech in Asia Pacific: Financial Inclusion

THE
STAT
E O
F FI
NTE
CH
59
Expectation Gap Between Technology Capabilities And Demand in Wealth ManagementWhile high net worth individuals (HNWIs) enthusiastically adopt new technologies, thewealth management sector is one of the least tech literate segments of the FinancialServices industry.
PwC’s recent survey on the Wealth Management “Sink or Swim” revealed that 69% of highnet worth individuals use online banking but only 1 out of 4 wealth managers offerdigital channels that go beyond email.
Additionally, by 2020, millennials and generation X will control over half of allinvestable assets and wealth management companies need to have a strategy to on-board and retain these generations of digital natives.
We see this as an opportunity for Wealth Managers to partner with FinTech companies toleverage on each others’ strengths to build products and services that cater for this wealthytech savvy generation.
59
The Future of FinTech in Asia Pacific: Wealth Management

THE
STAT
E O
F FI
NTE
CH
60
Intelligent Things Are Disrupting the Wealth Management Sector
Digital financial advice based on mathematical
rules or algorithms
A suite of technologies and applications that
provide information of users to the providers
A computer program that engages in a conversation via
auditory or textual methods
Internet of Things Chatbots Robo-advisors
The Future of FinTech in Asia Pacific: Wealth Management

THE
STAT
E O
F FI
NTE
CH
61
Intelligent things are creating both opportunities andchallenges for the wealth management industry.
The internet of things provides Wealth Managerswith new data on their customers’ behaviour anddaily routines
Chatbots enable wealth managers to provide24/7 assistance and digital concierge services
Robo-advisors allow wealth managementcompanies to effectively serve the mass-affluentsegment, thus expanding their client base
Intelligent things bring both threats and opportunities
The rise of Robo-advisorsAnalysts estimate robo-advisors, including
those run by banks will over see US$2.2. trillion
2016 2017 2018 2019 2020
0.4
0.0
2.2T
1.6
1.2
0.8
Shift from non-invested assets
Shift from invested assets
0.2
1.4
1.0
0.6
2.0
1.8
Source: A.T. Kearney
01
02
03
The Future of FinTech in Asia Pacific: Wealth Management

THE
STAT
E O
F FI
NTE
CH
62
Opportunities Bought by The Rise of Robo-advisors
•Robo-advisors bring many opportunities towealth managers, some of these include:
•Helping to deliver a low to high touchtoolkit that will free up relationship andportfolio managers to spend more timeon value add activities
•Capturing a larger share of investableassets that a client may choose toallocate across different wealth solutions
•Allowing Wealth Management firms toeffectively serve a mass affluent clientele
of all HNWIs use robo-advisors
14%
6%
NorthAmerica
23%Europe
13%
Asia-Pacific
Source: PwC Strategy & Global Wealth Management Survey 2016
01
02
03
HNWIs around the globe utilising robo- advisors
The Future of FinTech in Asia Pacific: Wealth Management

THE
STAT
E O
F FI
NTE
CH
63
By 2020, wealthy individuals will see their wealth managers as the trusted advisor. Notonly do they trust their wealth managers with financial matters, they also trust thattheir financial advice takes into account their wider family and social needs and theirlife aspirations. A financial butler is another way of looking at this relationship.
Two important pillars that will support this - the digitalization of the wealthmanagement business and making advice the core business, not products.
The successful wealth managers of tomorrow will be client centric and will usetechnology to deliver personalised services to their clients. They will be able to minedata intelligently and use the insights to drive meaningful conversations with theirclients. The future relationship between high net worth individuals and their assetmanagers will be founded on trust and value; not on products and fees.
Julia Leong, Partner, PwC Singapore
63
The Future of FinTech in Asia Pacific: Wealth Management
“

THE
STAT
E O
F FI
NTE
CH
US$158m US$818m
US$10m US$6.4bn US$1.33bn
64
Wealth Management – Asia Pacific
900+ companies in the sector, 203 funded in last 5 years, US$6.7B invested in 2016–17.Most Active Investors: Sequoia Capital, K2VC, 500 StartupsCumulative funding in the sector:
Wealth Management
Personal Finance Management Platform
FinancialLiteracy Conglomerate Financial Product
Aggregators
64The Future of FinTech in Asia Pacific: Wealth Management
THE
STAT
E O
F FI
NTE
CH
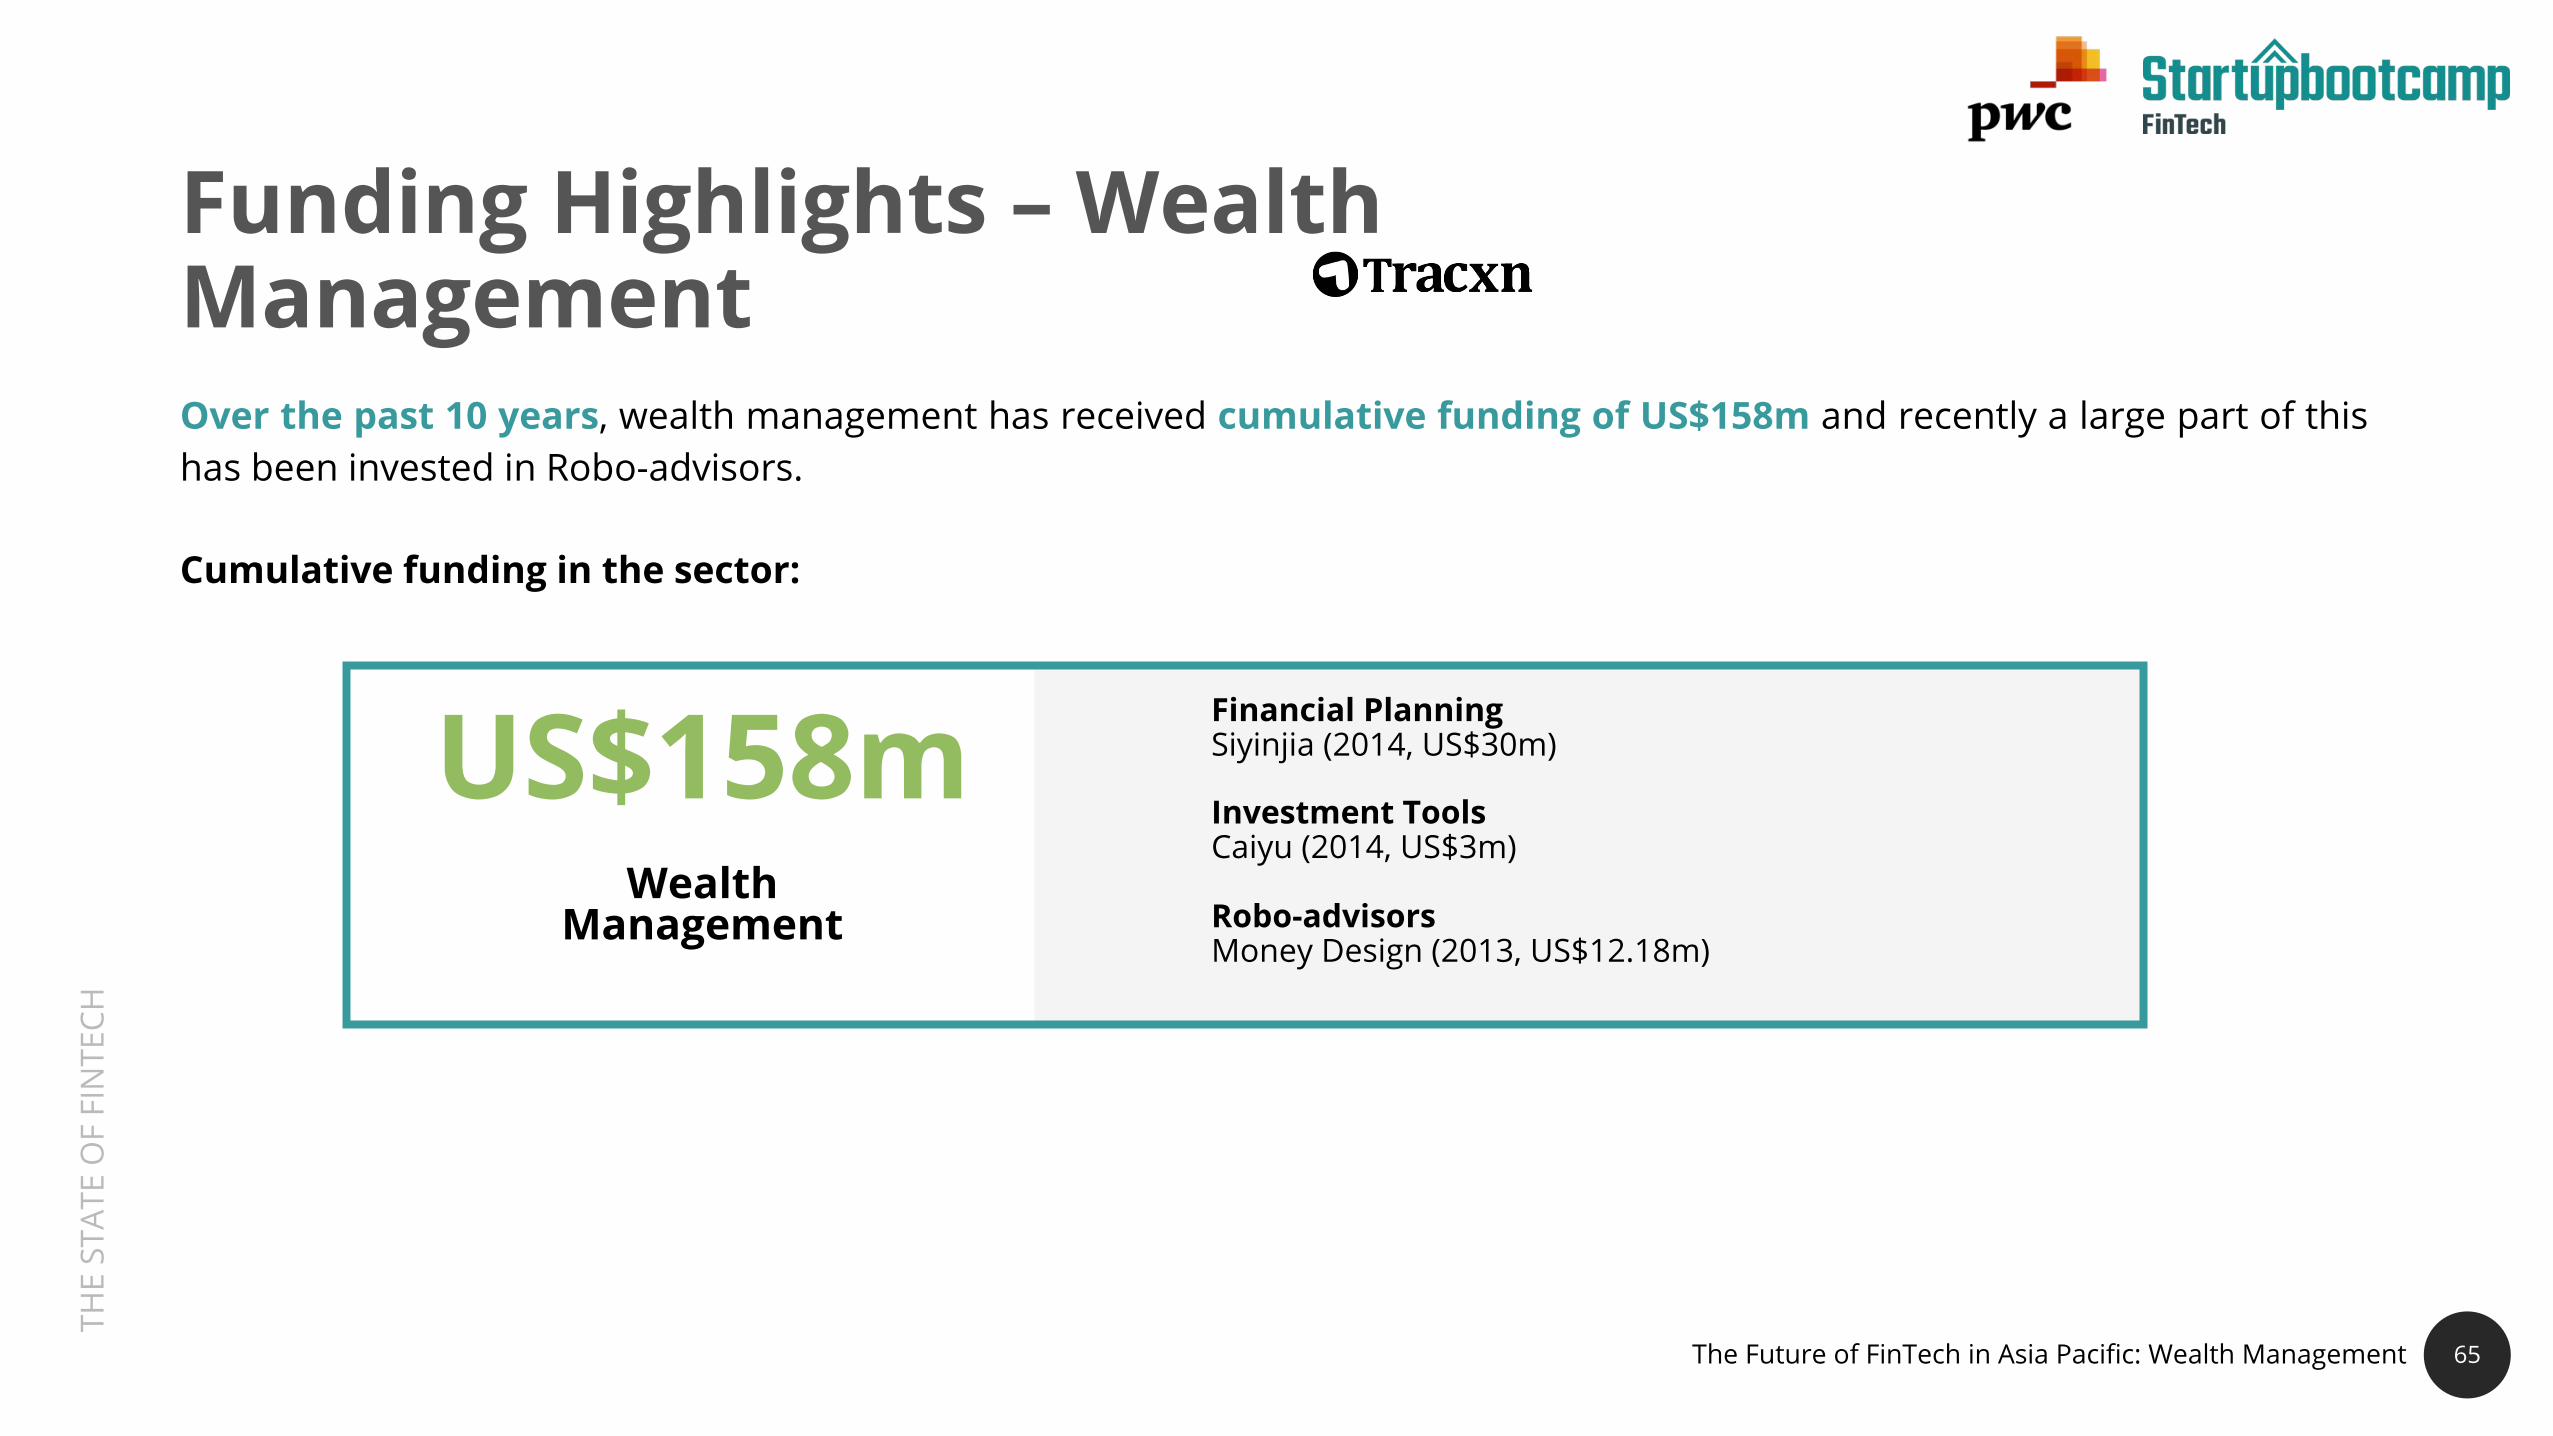
Financial PlanningSiyinjia (2014, US$30m)
Investment ToolsCaiyu (2014, US$3m)
Robo-advisorsMoney Design (2013, US$12.18m)
US$158mWealth
Management
65
Funding Highlights – Wealth ManagementOver the past 10 years, wealth management has received cumulative funding of US$158m and recently a large part of thishas been invested in Robo-advisors.
Cumulative funding in the sector:
The Future of FinTech in Asia Pacific: Wealth Management

THE
STAT
E O
F FI
NTE
CH
66
To date, the segments that have received the largest amountsof funding are diversified FinTech companies such as AntFinancial; these have received cumulative funding of US$6.4bnto date. The second largest investment category are financialproduct aggregators that have received cumulative funding ofUS$1.33bn.
Given the technology expectations gap and the opportunitiesbought by automation we can expect to see more and moreemerging technologies being adopted by tech savvy WealthManagers. However, incumbents that fail to put technology inthe heart of their strategy run the risk of becoming irrelevant.
Observations –Wealth Management
66
The Future of FinTech in Asia Pacific: Wealth Management

THE
STAT
E O
F FI
NTE
CH
67
RegTech, a Sector on the Rise
Ever since the 2008 financial crisis, regulators have been tighteninglegislation.
Banks have responded to this by hiring thousands of complianceofficers, thus solving an important problem by increasingheadcount. This is even more the case in Asia where banks need todeal with many different regulatory regimes.
Currently 80% of the AML budget of banks is related to headcountas many background checks are still done manually by large AMLteams. And, while complex cases will continue to require humanoversight, many of the lower-risk checks could be automated.
And, unlike in FinTech, where there is some element of disruptionand competition, RegTech is an area where all parties benefit fromworking together. Which is why at Startupbootcamp we believethat RegTech is a sector on the rise.

THE
STAT
E O
F FI
NTE
CH
US$819mUS$61.9m
RegTech Asia Pacific RegTech Global
280+ companies in the sector, 60+ funded in last 5 years, US$771m invested in 2016 – 2017.
Most Active Investors: Startupbootcamp, IDG Ventures India, Sequoia Capital, IDG Capital Partners
1300+ companies in the sector, 320+ funded in last 5 years, US$2.23bn invested in 2016 – 2017.
Most Active Investors: Startupbootcamp, Plug & Play Tech Centre, Sequoia Capital, Intel Capital
Funding Highlights – Wealth Management
68
Cumulative Funding
SUMMARY
CATEGORY
Globally, US$819m has been invested in RegTech however, only 61.9% of this has been invested in Asia Pacific
The Future of FinTech in Asia Pacific: RegTech
THE
STAT
E O
F FI
NTE
CH
Observations –Wealth Management
The total funding of RegTech in Asia Pacificrepresents less than 10% of the global RegTechfunding.
While there are many RegTech startups in Europe,Australia and India, there are surprisingly very fewRegTech startups in Singapore and Hong Kong, whichare the two major financial hubs in Asia.
Given the central role that the regulators have had indriving the FinTech agenda in both Singapore andHong Kong, we believe that there will be a rise in bothgovernment and non-governmental initiatives in theRegtech sector.

THE
STAT
E O
F FI
NTE
CH
70
Picture 2020 in a urban centre somewhere in Asia. Insurance has changed. Insurance companies have changed, in fact some of them are unrecognisable. Customers are asking for brands by name and are giving insurance companies credit for “changing their lives” by helping them avoid risk. Health has become a central part of what insurance companies deliver. And much of the friction of buying insurance has been smoothed out, thanks to a couple of dozen Insurtechs that have stepped up and reimagined small bits of the way insurance used to be done. Agents are now augmented advisors. Claims are seamless and automatic. Solutions are intelligent and tailored. Further, risk products are being embedded into other categories. Behind all this is software enabling change through APIs. Still, some insurers and many insurtechs have fallen far behind and have been slow to let go or slow to partner. The customers of those brands who have taken the lead are the real winners.
Zia ZamanChief Innovation Officer
The Future of FinTech in Asia Pacific: InsurTech
“

THE
STAT
E O
F FI
NTE
CH
Insurance Companies are Embracing Emerging Technologies
This year, PwC’s Global FinTech Survey revealed that in 2017,more than half insurance companies deal with FinTechwhereas in 2016 32% of insurance companies surveyeddid not deal with FinTech at all.
Insurance companies are now turning to FinTech to:
Reach and serve their clients in a highly targetedmanner
Quantify and identify risk through sophisticated datamodels and analytics
71 71
58%
45%
30%
21%
More than half of the insurers are actively monitoring FinTech to respond competitively
Almost half of the insurers are already engaging in partnerships with FinTech companies
One- third of the respondents are hiring services from FinTech companies to improve internal operations and services
21% of incumbents set up start- up programs to incubate FinTech companies
Source: PwC Global FinTech Survey 2017
01
02
The Future of FinTech in Asia Pacific: InsurTech

THE
STAT
E O
F FI
NTE
CH
How InsurTechEmpowers Incumbents
72
InsurTech Involvement
Working with startups and fast growing technology companies, whether this is through open innovation programs or through strategic partnerships, will enable insurance companies to learn and innovate at a faster pace.
New Product Development
Involvement in InsurTech will help incumbents rethink the way that they deliver products and services by taking a customer centric view.
Exploration
Incumbents are actively monitoring new trends and innovations. Many of these have established a presence in key innovation hubs to learn about the latest trends and technologies.
Sandbox testing
Setting up sandbox environments will enable incumbents test solutions and analyse results while minimizing risks.
The Future of FinTech in Asia Pacific: InsurTech

THE
STAT
E O
F FI
NTE
CH
US$931m US$53m US$34m
US$331m US$74m US$9m
73
InsurTech – Asia Pacific
280+ companies in the sector, 70+ funded in last 5 yearsMost Active Investors: Startupbootcamp, K2VC (Xianfeng Evergreen), CBC Capital , DW FundCumulative funding in the sector:
Internet-FirstInsurers
EmployerInsurance
P2PInsurance
DistributionPlatform Enablers Claims Management
& Resolution73The Future of FinTech in Asia Pacific: InsurTech
THE
STAT
E O
F FI
NTE
CH
US$931mInternet –First
Insurers
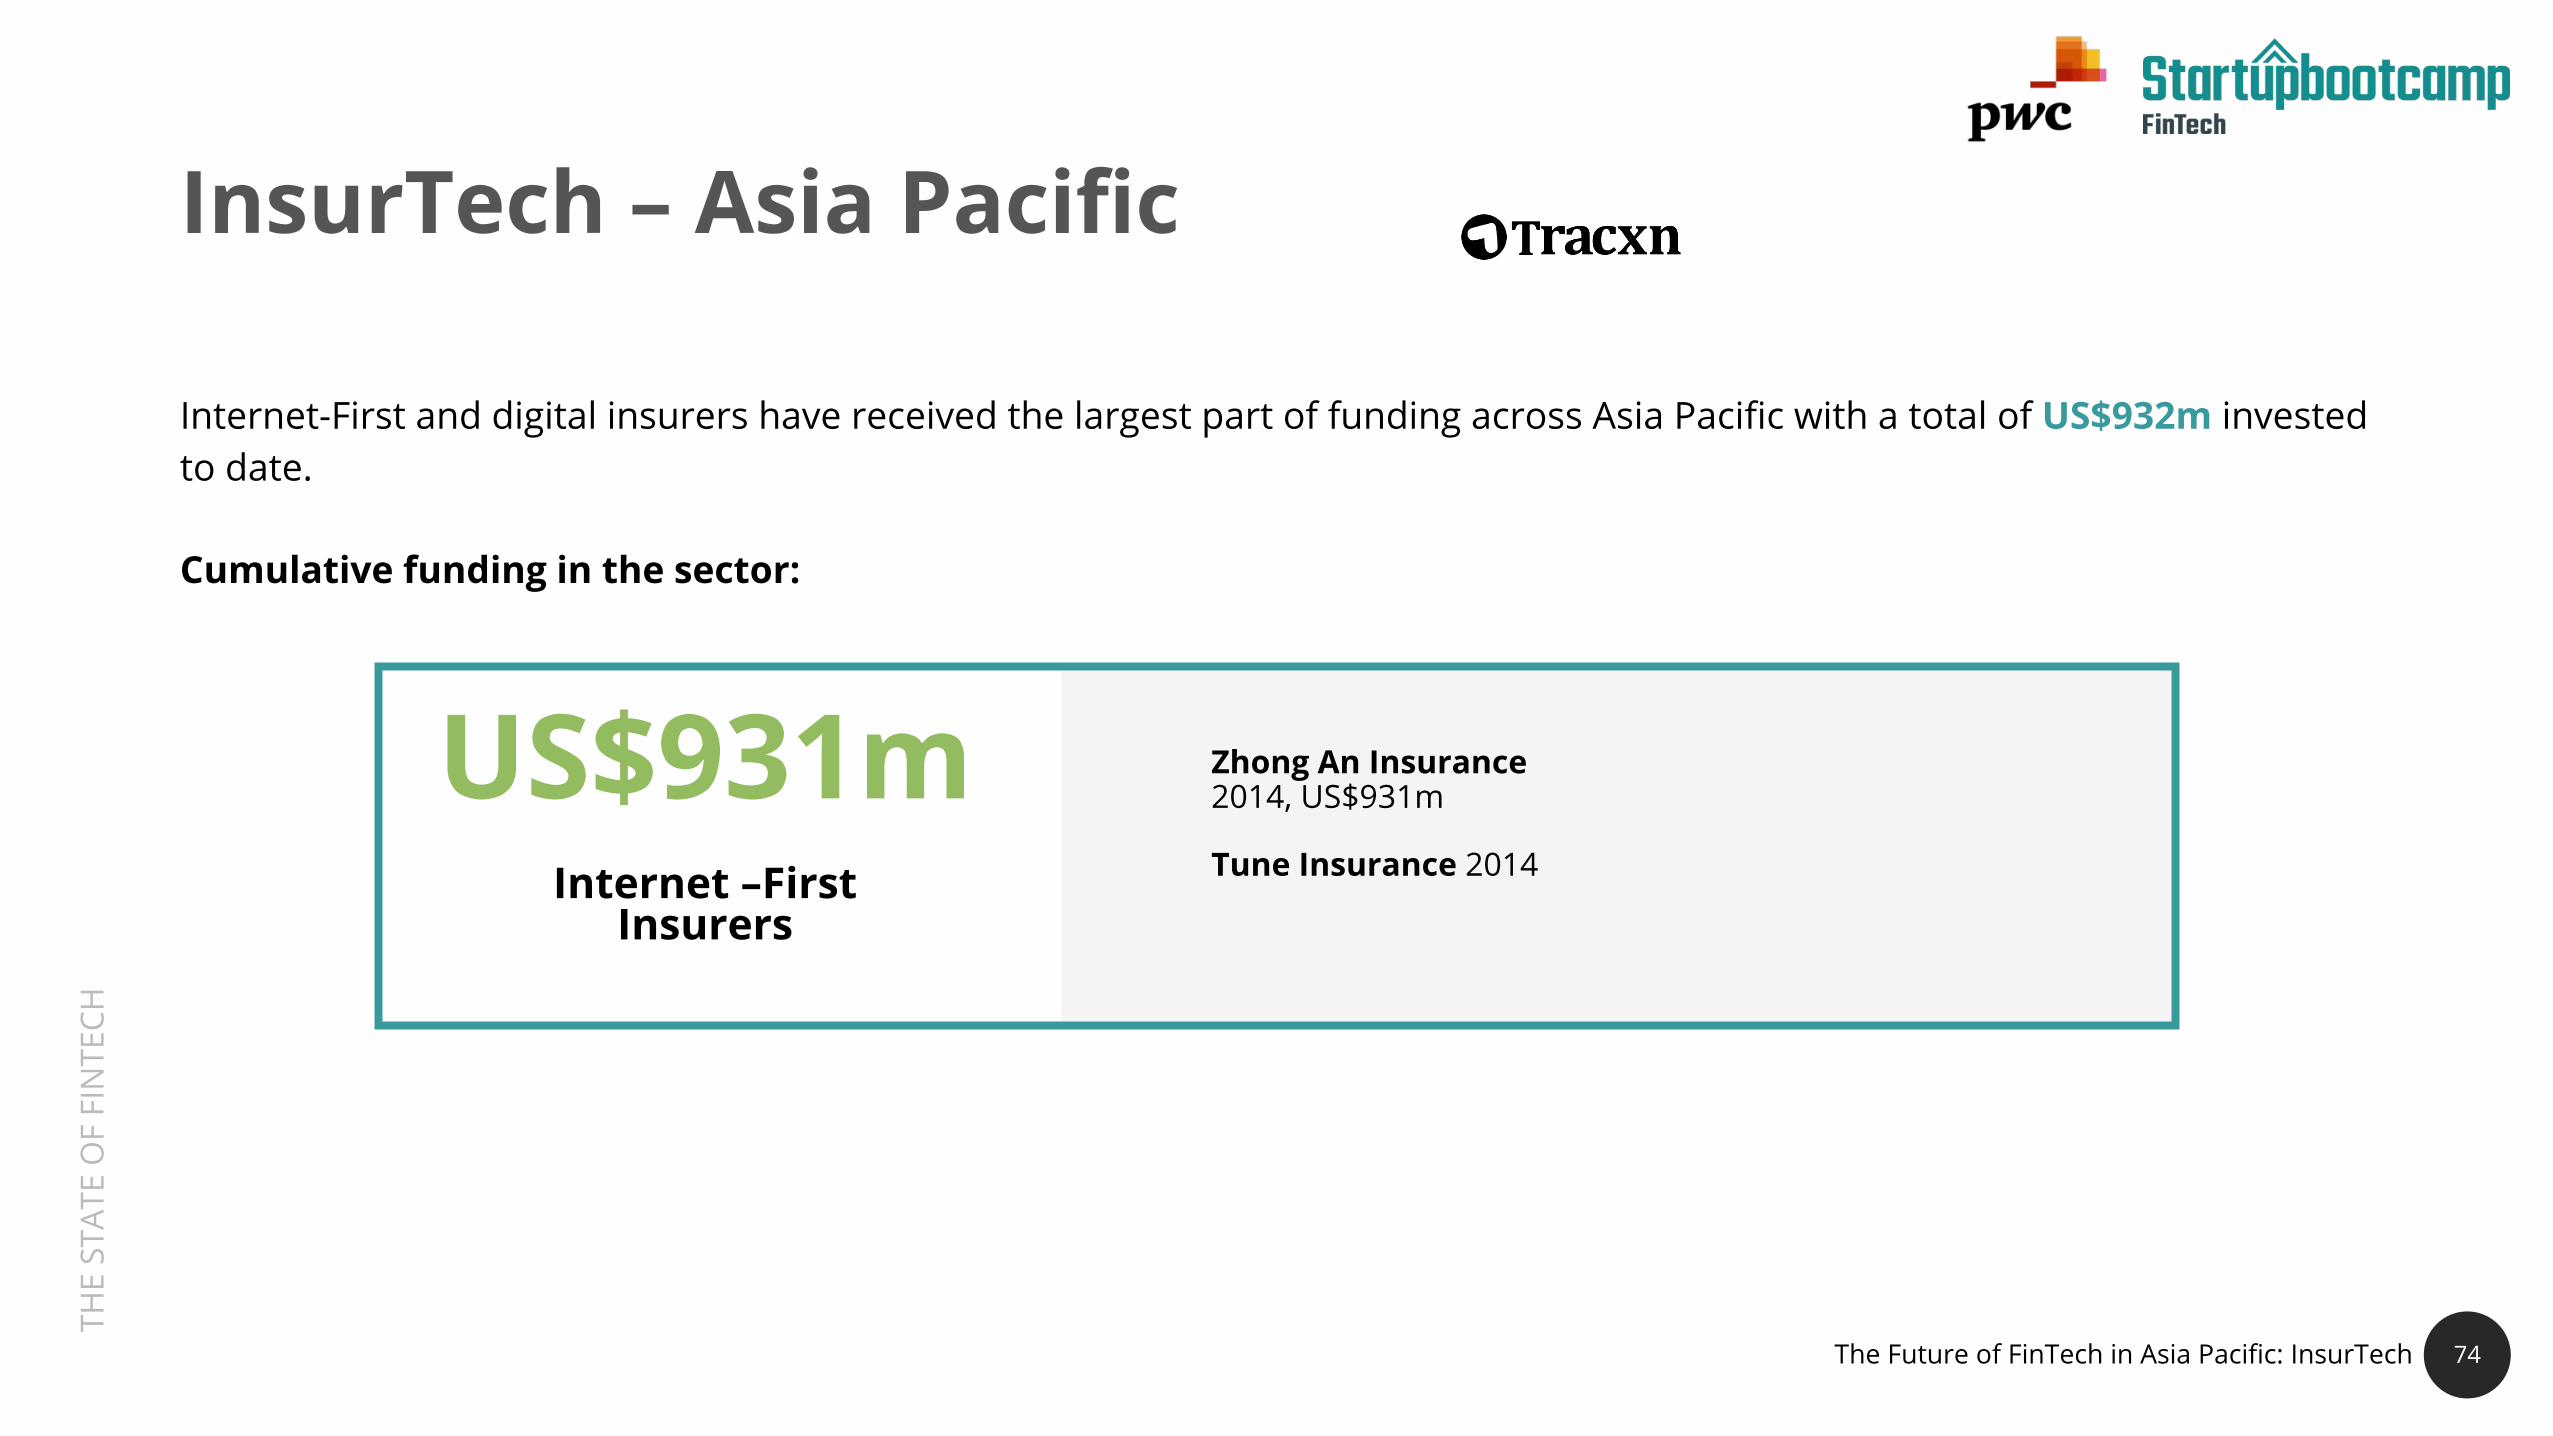
Zhong An Insurance2014, US$931m
Tune Insurance 2014
74
InsurTech – Asia Pacific
Internet-First and digital insurers have received the largest part of funding across Asia Pacific with a total of US$932m investedto date.
Cumulative funding in the sector:
The Future of FinTech in Asia Pacific: InsurTech
THE
STAT
E O
F FI
NTE
CH
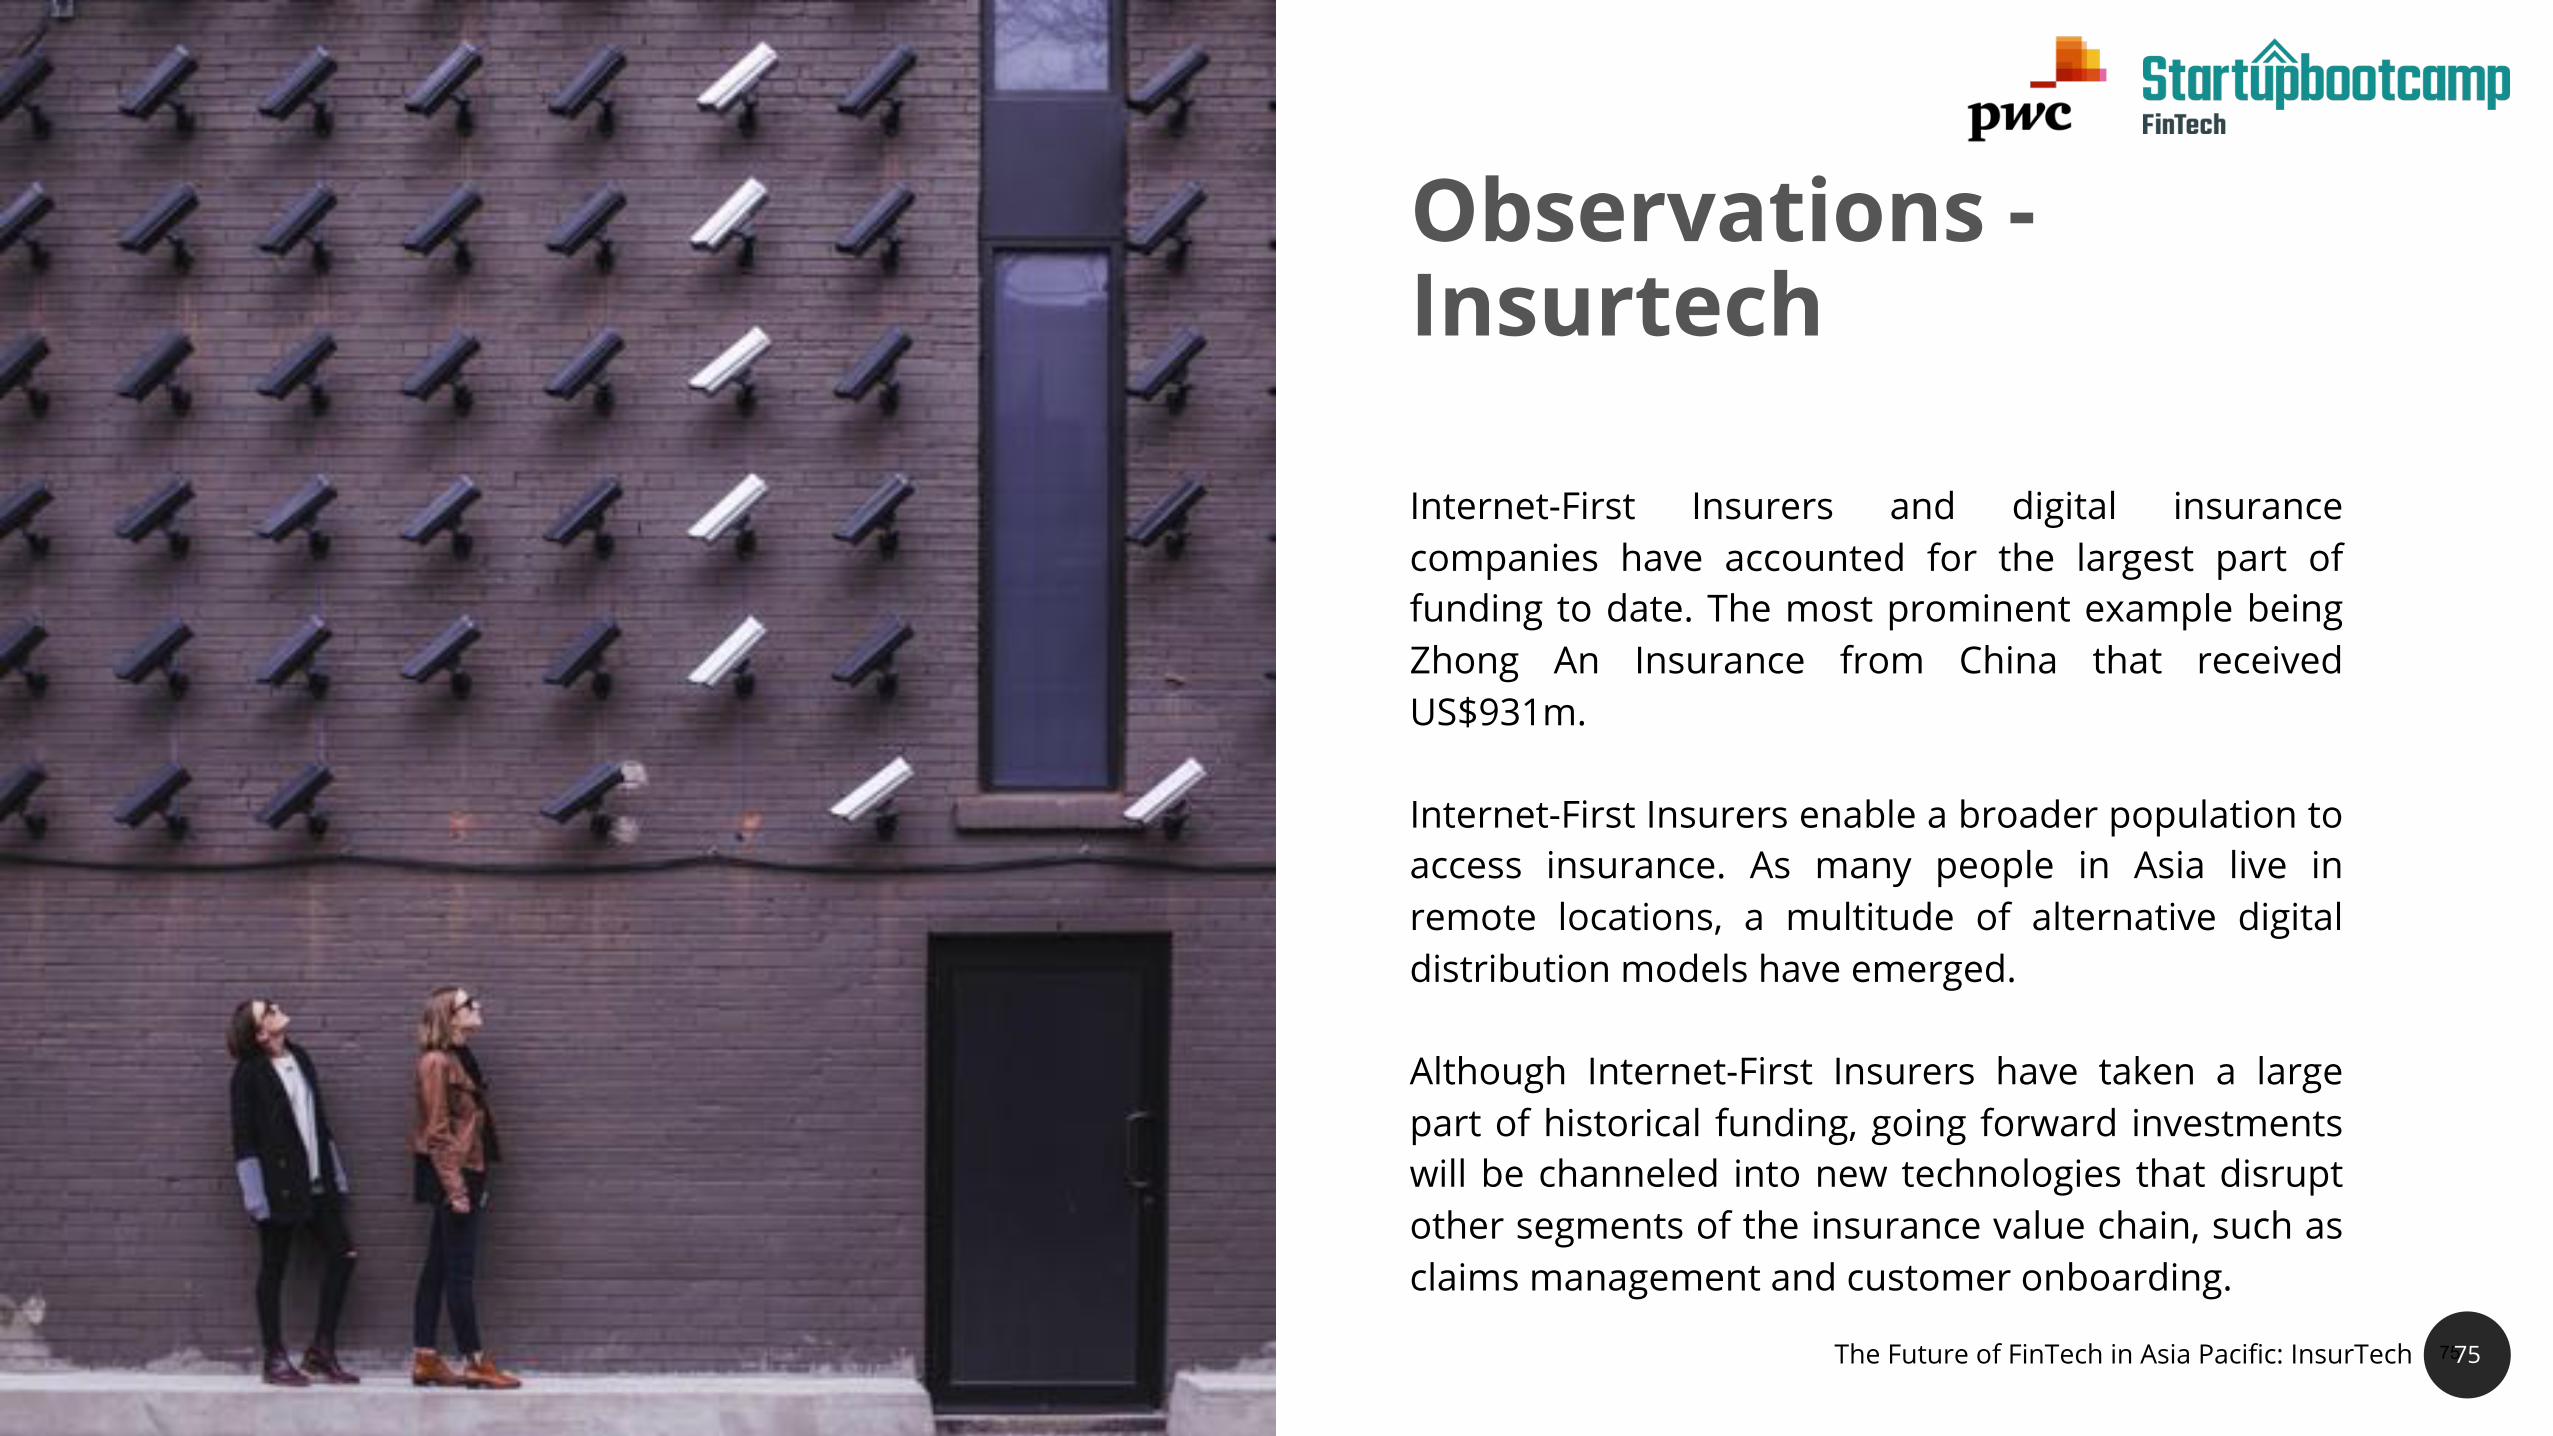
Internet-First Insurers and digital insurancecompanies have accounted for the largest part offunding to date. The most prominent example beingZhong An Insurance from China that receivedUS$931m.
Internet-First Insurers enable a broader population toaccess insurance. As many people in Asia live inremote locations, a multitude of alternative digitaldistribution models have emerged.
Although Internet-First Insurers have taken a largepart of historical funding, going forward investmentswill be channeled into new technologies that disruptother segments of the insurance value chain, such asclaims management and customer onboarding.
Observations -Insurtech
7575The Future of FinTech in Asia Pacific: InsurTech

THE
STAT
E O
F FI
NTE
CH
Conclusion
THE
STAT
E O
F FI
NTE
CH
Conclusion
77
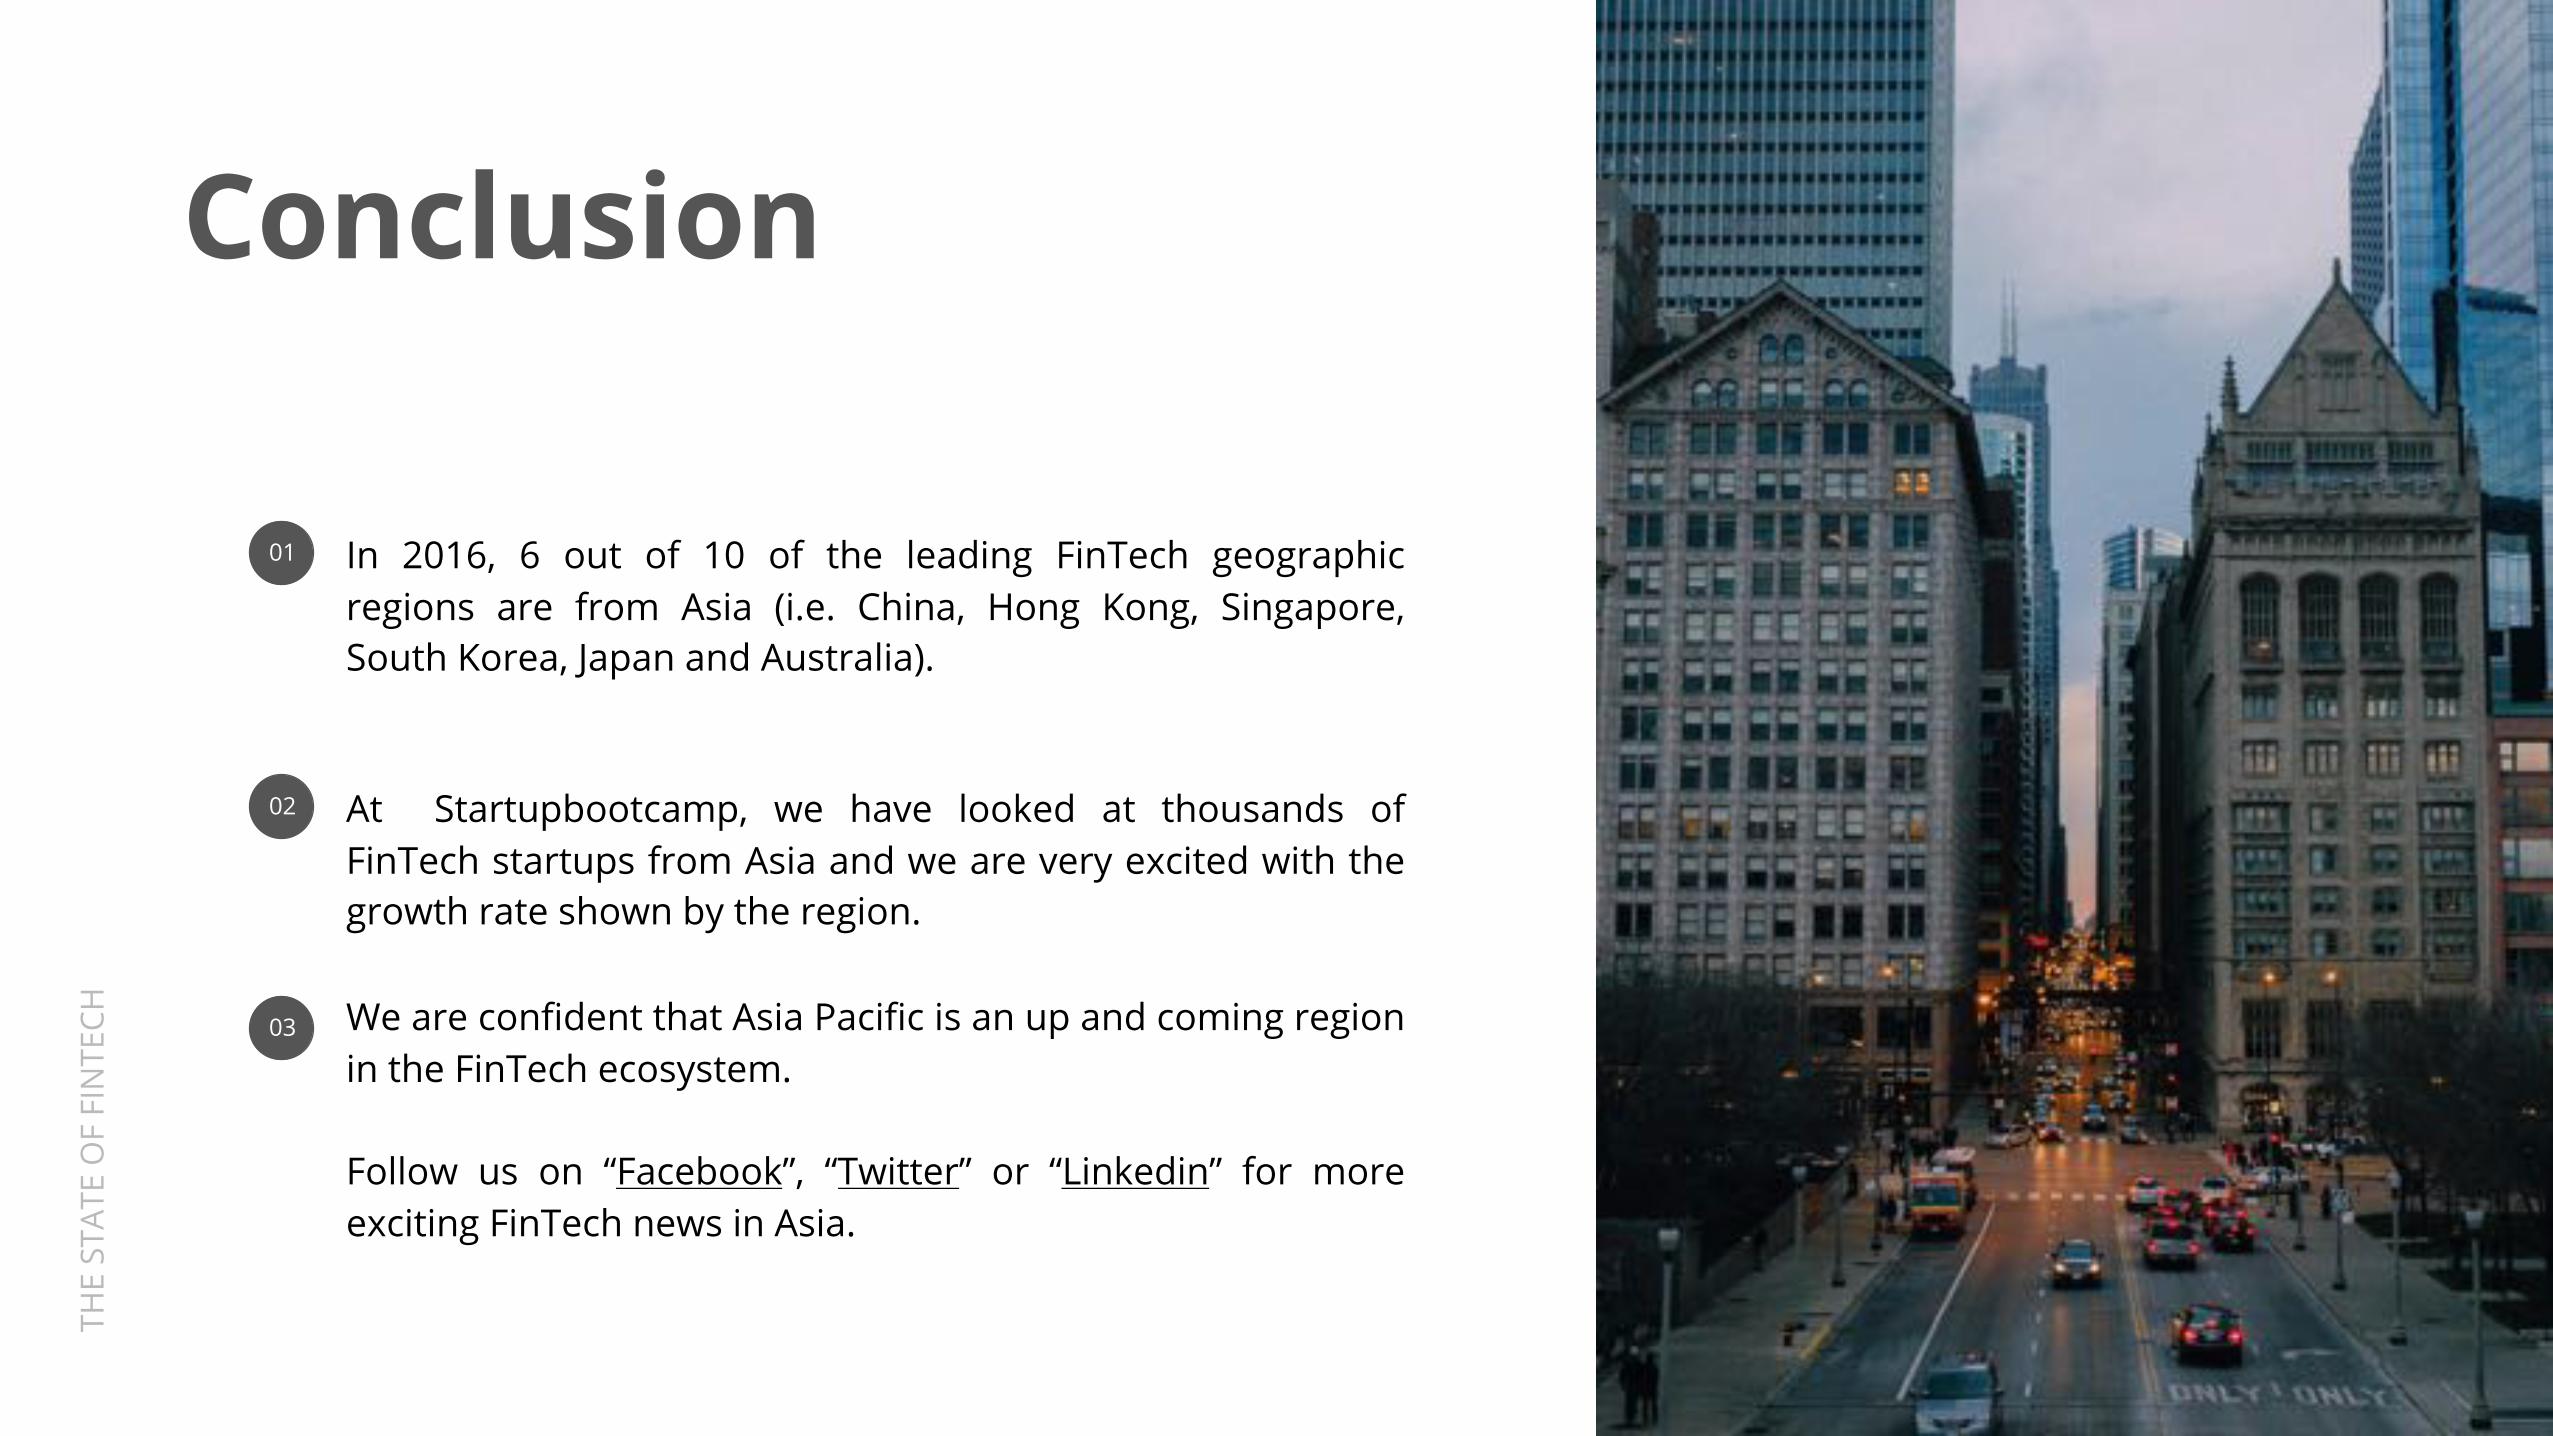
In 2016, 6 out of 10 of the leading FinTech geographicregions are from Asia (i.e. China, Hong Kong, Singapore,South Korea, Japan and Australia).
01
At Startupbootcamp, we have looked at thousands ofFinTech startups from Asia and we are very excited with thegrowth rate shown by the region.
02
We are confident that Asia Pacific is an up and coming regionin the FinTech ecosystem.
Follow us on “Facebook”, “Twitter” or “Linkedin” for moreexciting FinTech news in Asia.
03

THE
STAT
E O
F FI
NTE
CH
Startupbootcamp
STAR
TUPB
OO
TCAM
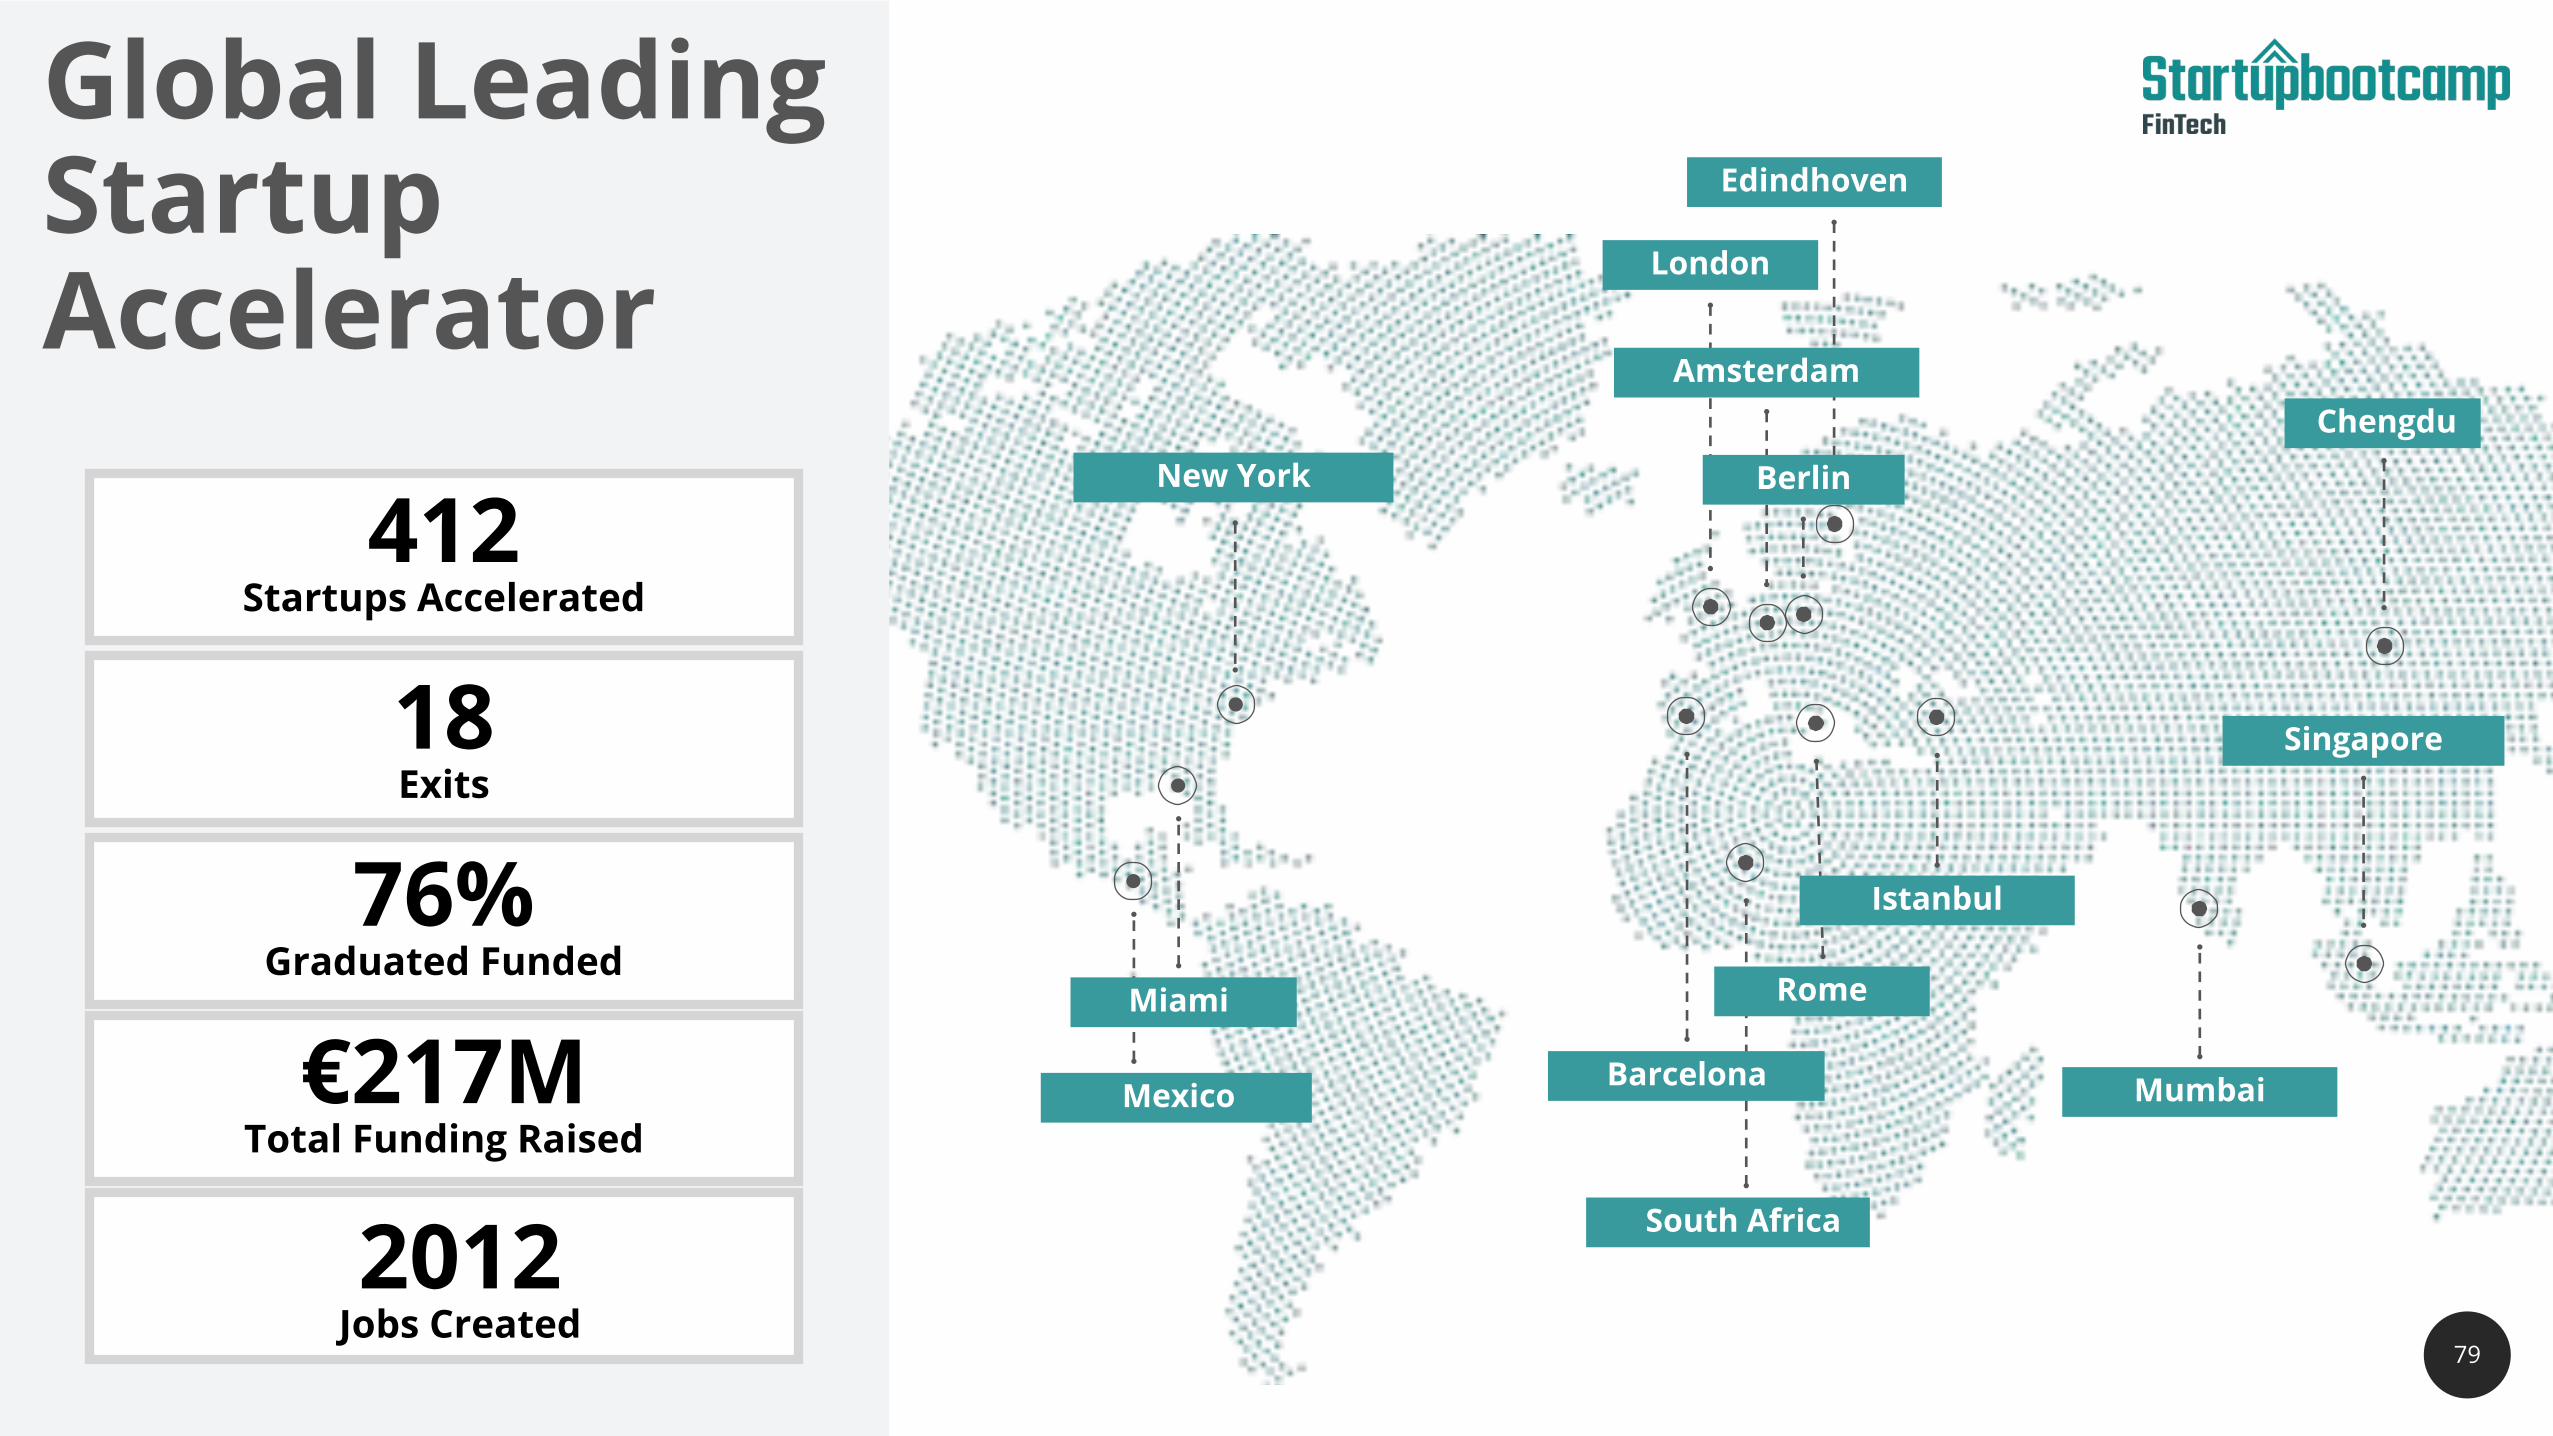
PGlobal Leading Startup Accelerator
18Exits
76%Graduated Funded
€217MTotal Funding Raised
2012Jobs Created
412Startups Accelerated
79
South Africa
Mexico
Edindhoven
New York
Miami
Barcelona
Istanbul
Rome
Singapore
London
Amsterdam
Berlin
Chengdu
Mumbai
STAR
TUPB
OO
TCAM
P
80
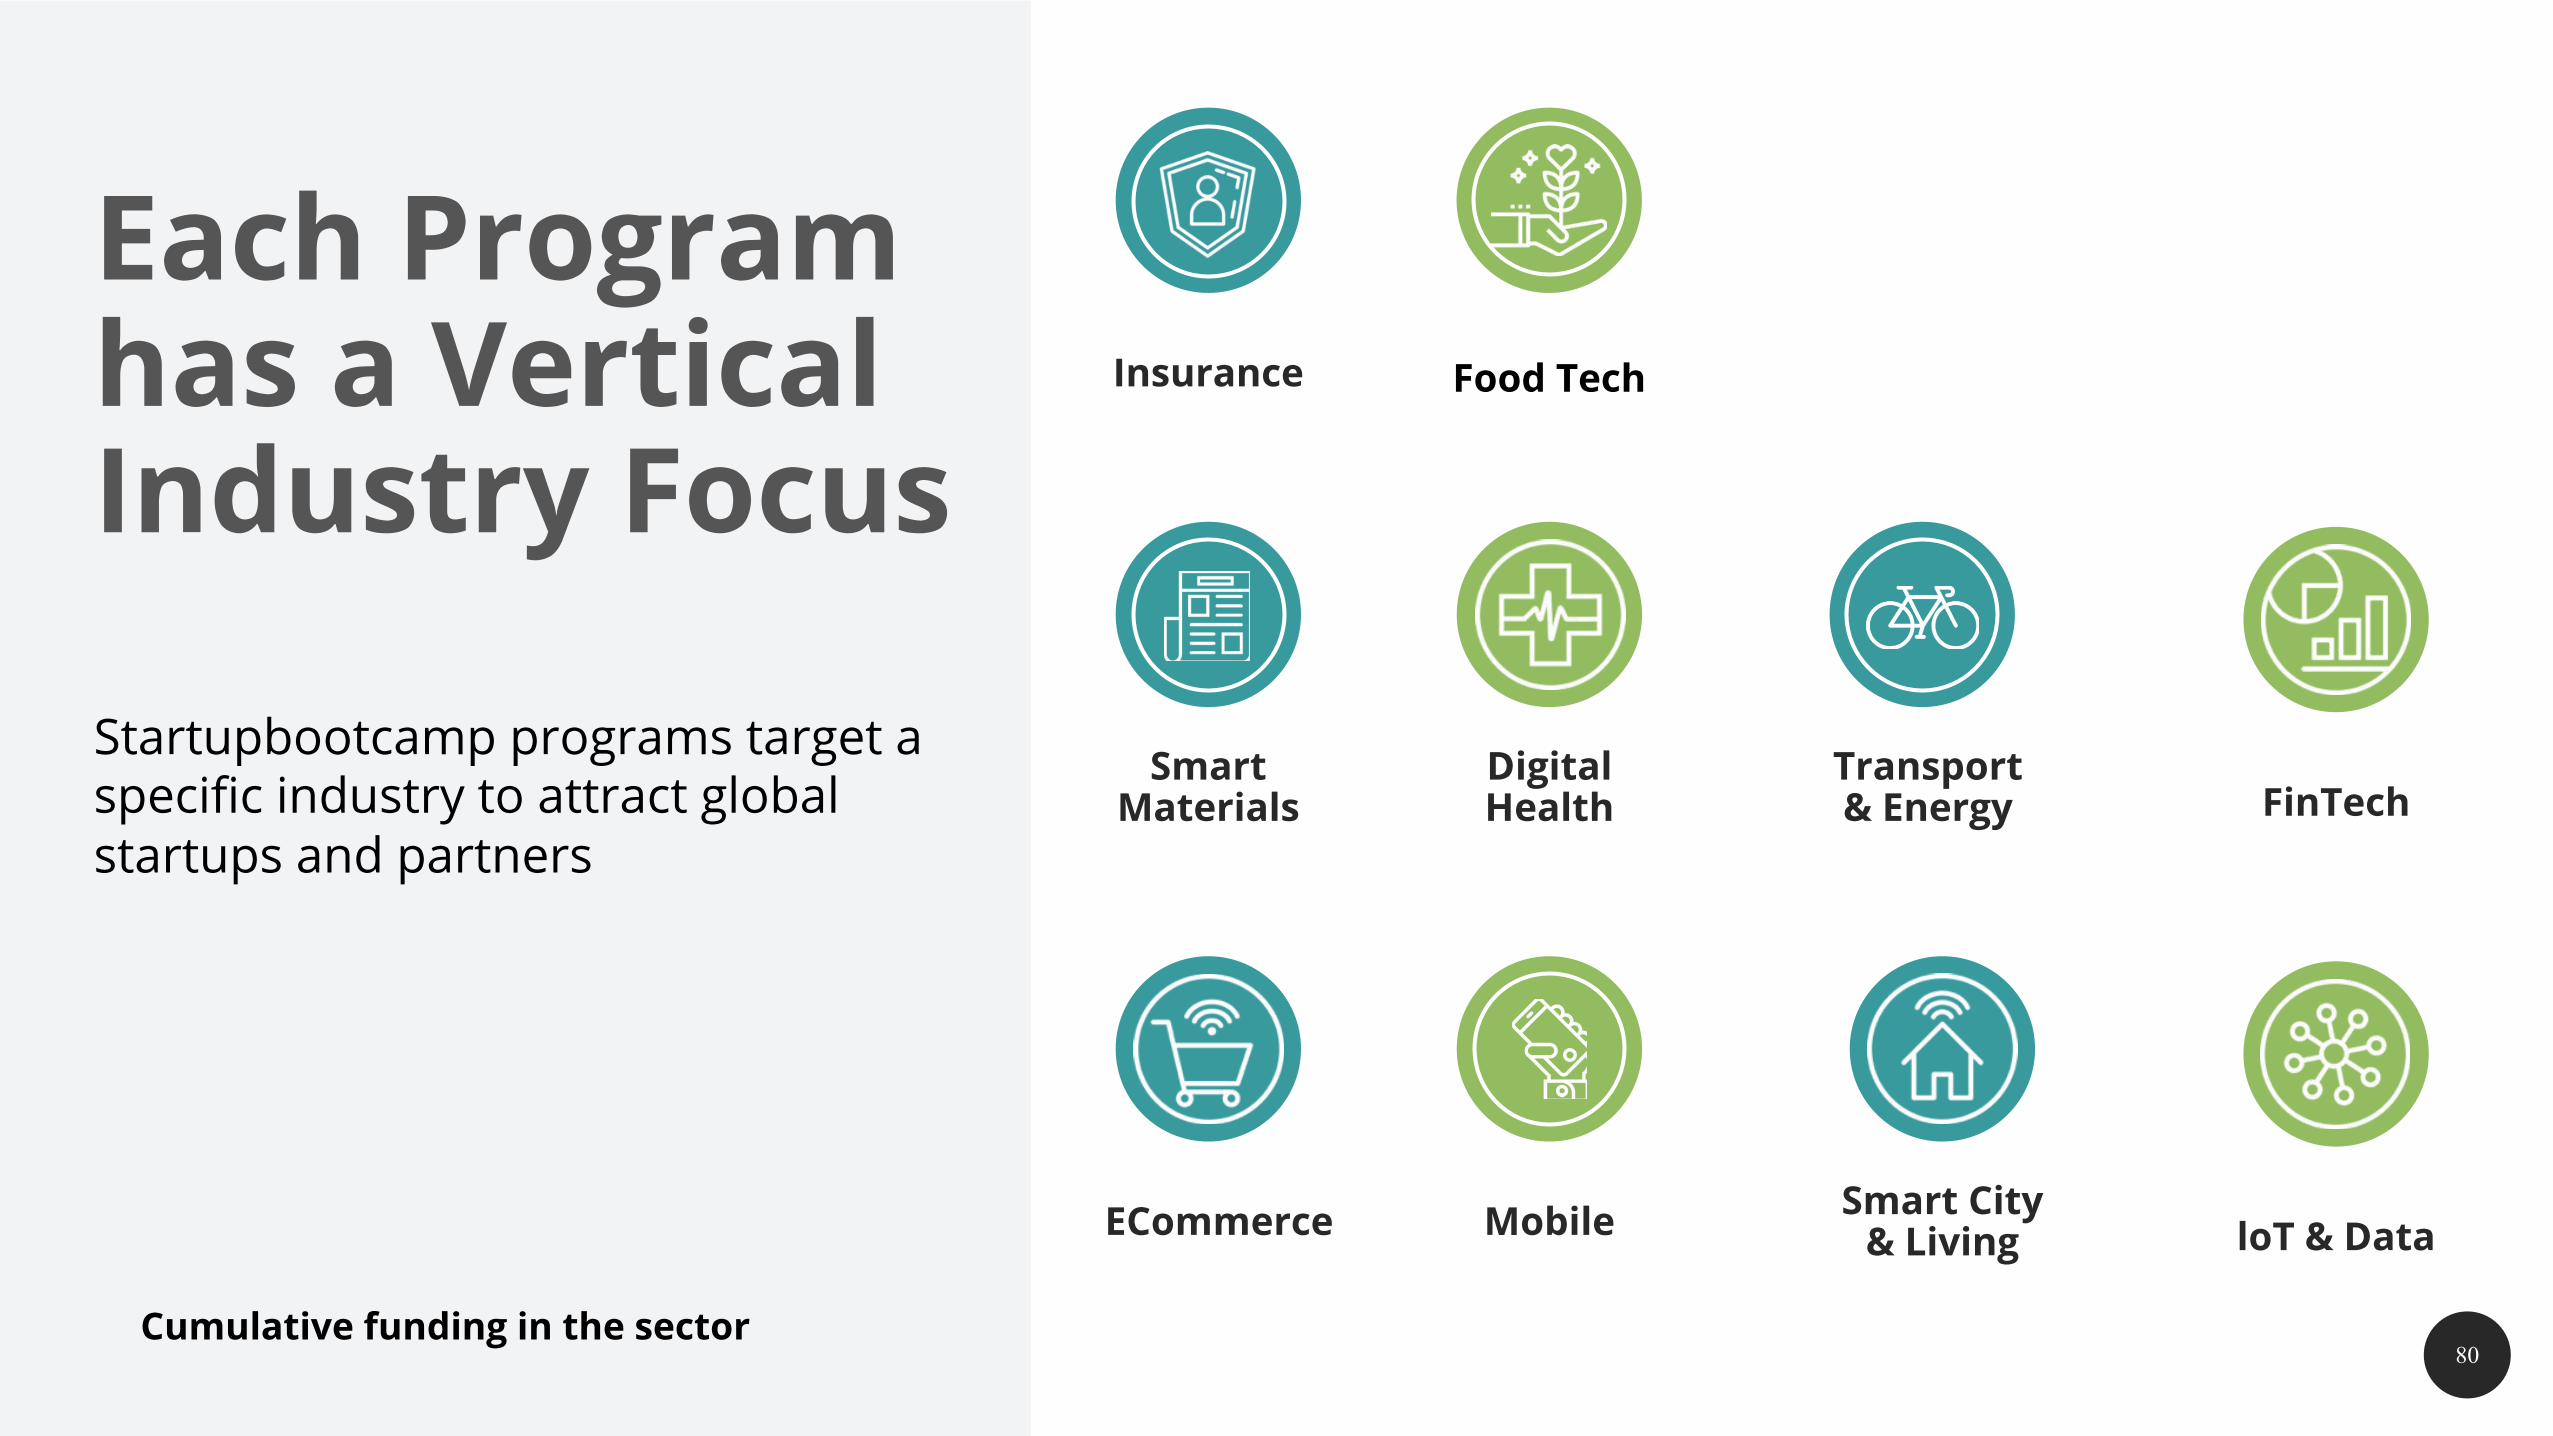
Each Program has a Vertical Industry Focus
Startupbootcamp programs target a specific industry to attract global startups and partners
Smart City& Living loT & DataECommerce
DigitalHealth FinTech
SmartMaterials
Transport & Energy
Insurance
Mobile
Food Tech
Cumulative funding in the sector
STAR
TUPB
OO
TCAM
P
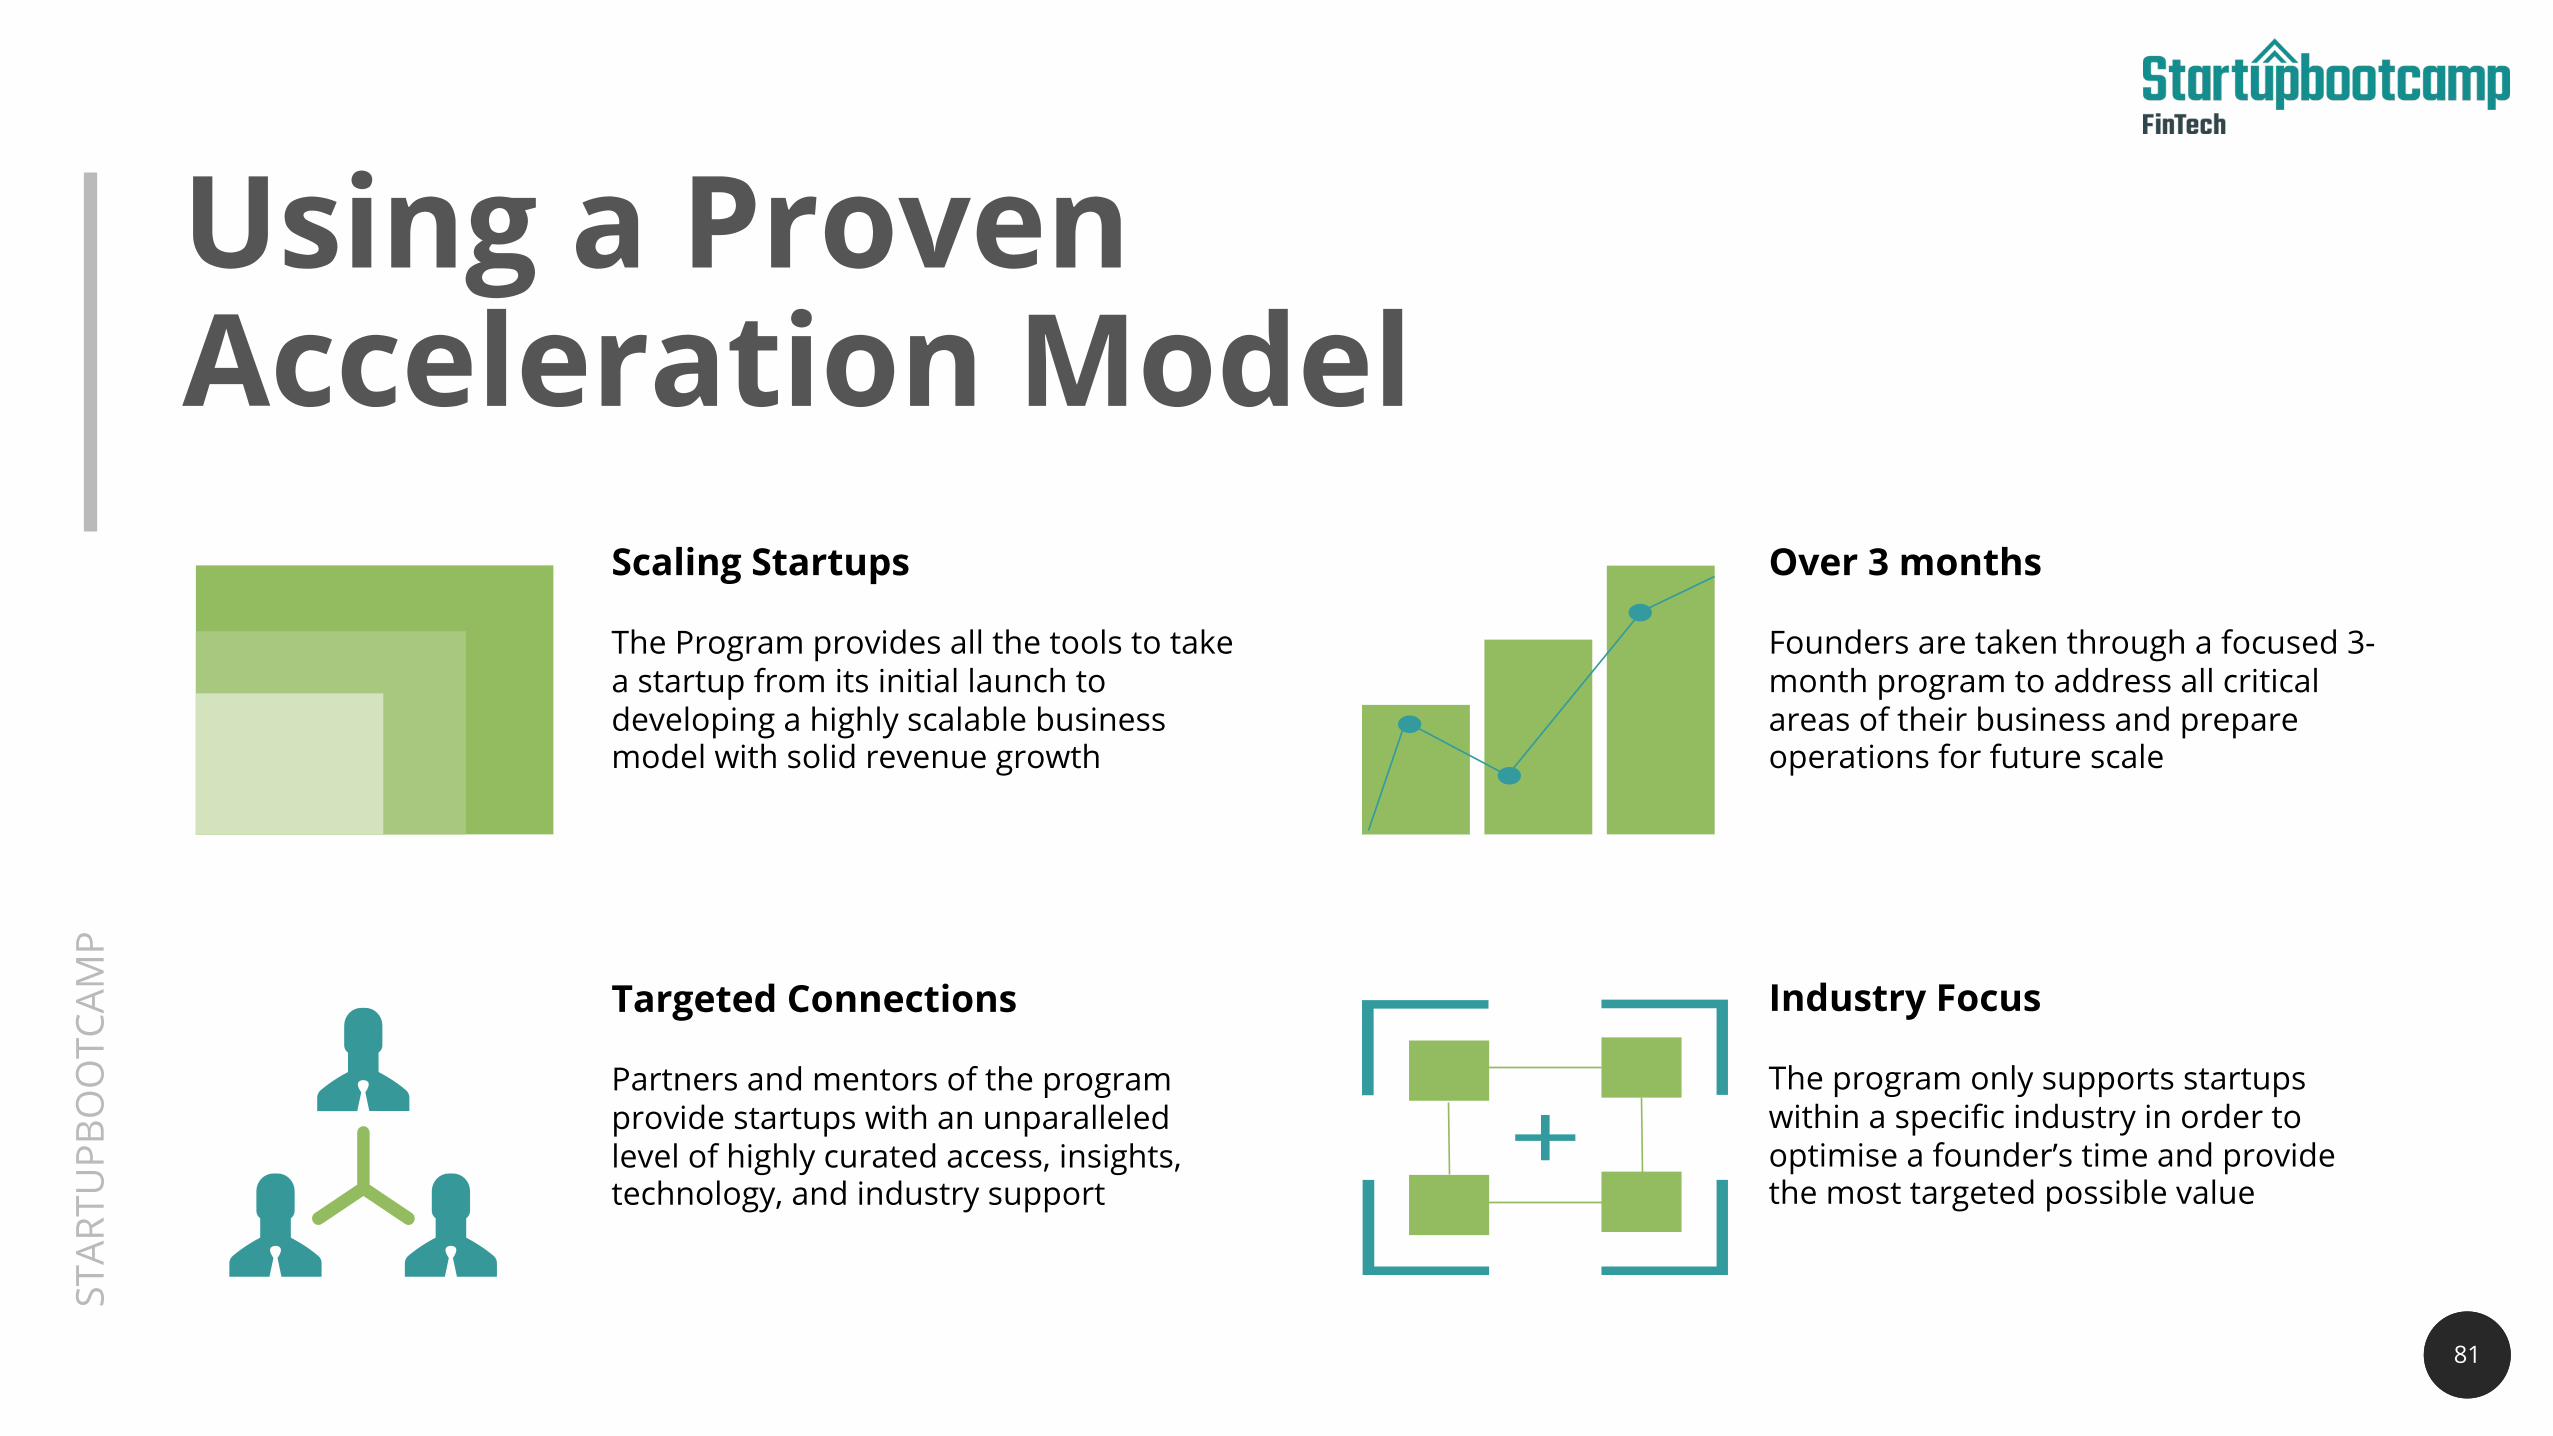
Using a ProvenAcceleration Model
81
Over 3 months
Founders are taken through a focused 3-month program to address all critical areas of their business and prepare operations for future scale
Industry Focus
The program only supports startups within a specific industry in order to optimise a founder’s time and provide the most targeted possible value
Scaling Startups
The Program provides all the tools to take a startup from its initial launch to developing a highly scalable business model with solid revenue growth
Targeted Connections
Partners and mentors of the program provide startups with an unparalleled level of highly curated access, insights, technology, and industry support

THE
STAT
E O
F FI
NTE
CH
82
412STARTUPSACCELERATED

STAR
TUPB
OO
TCAM
P
83
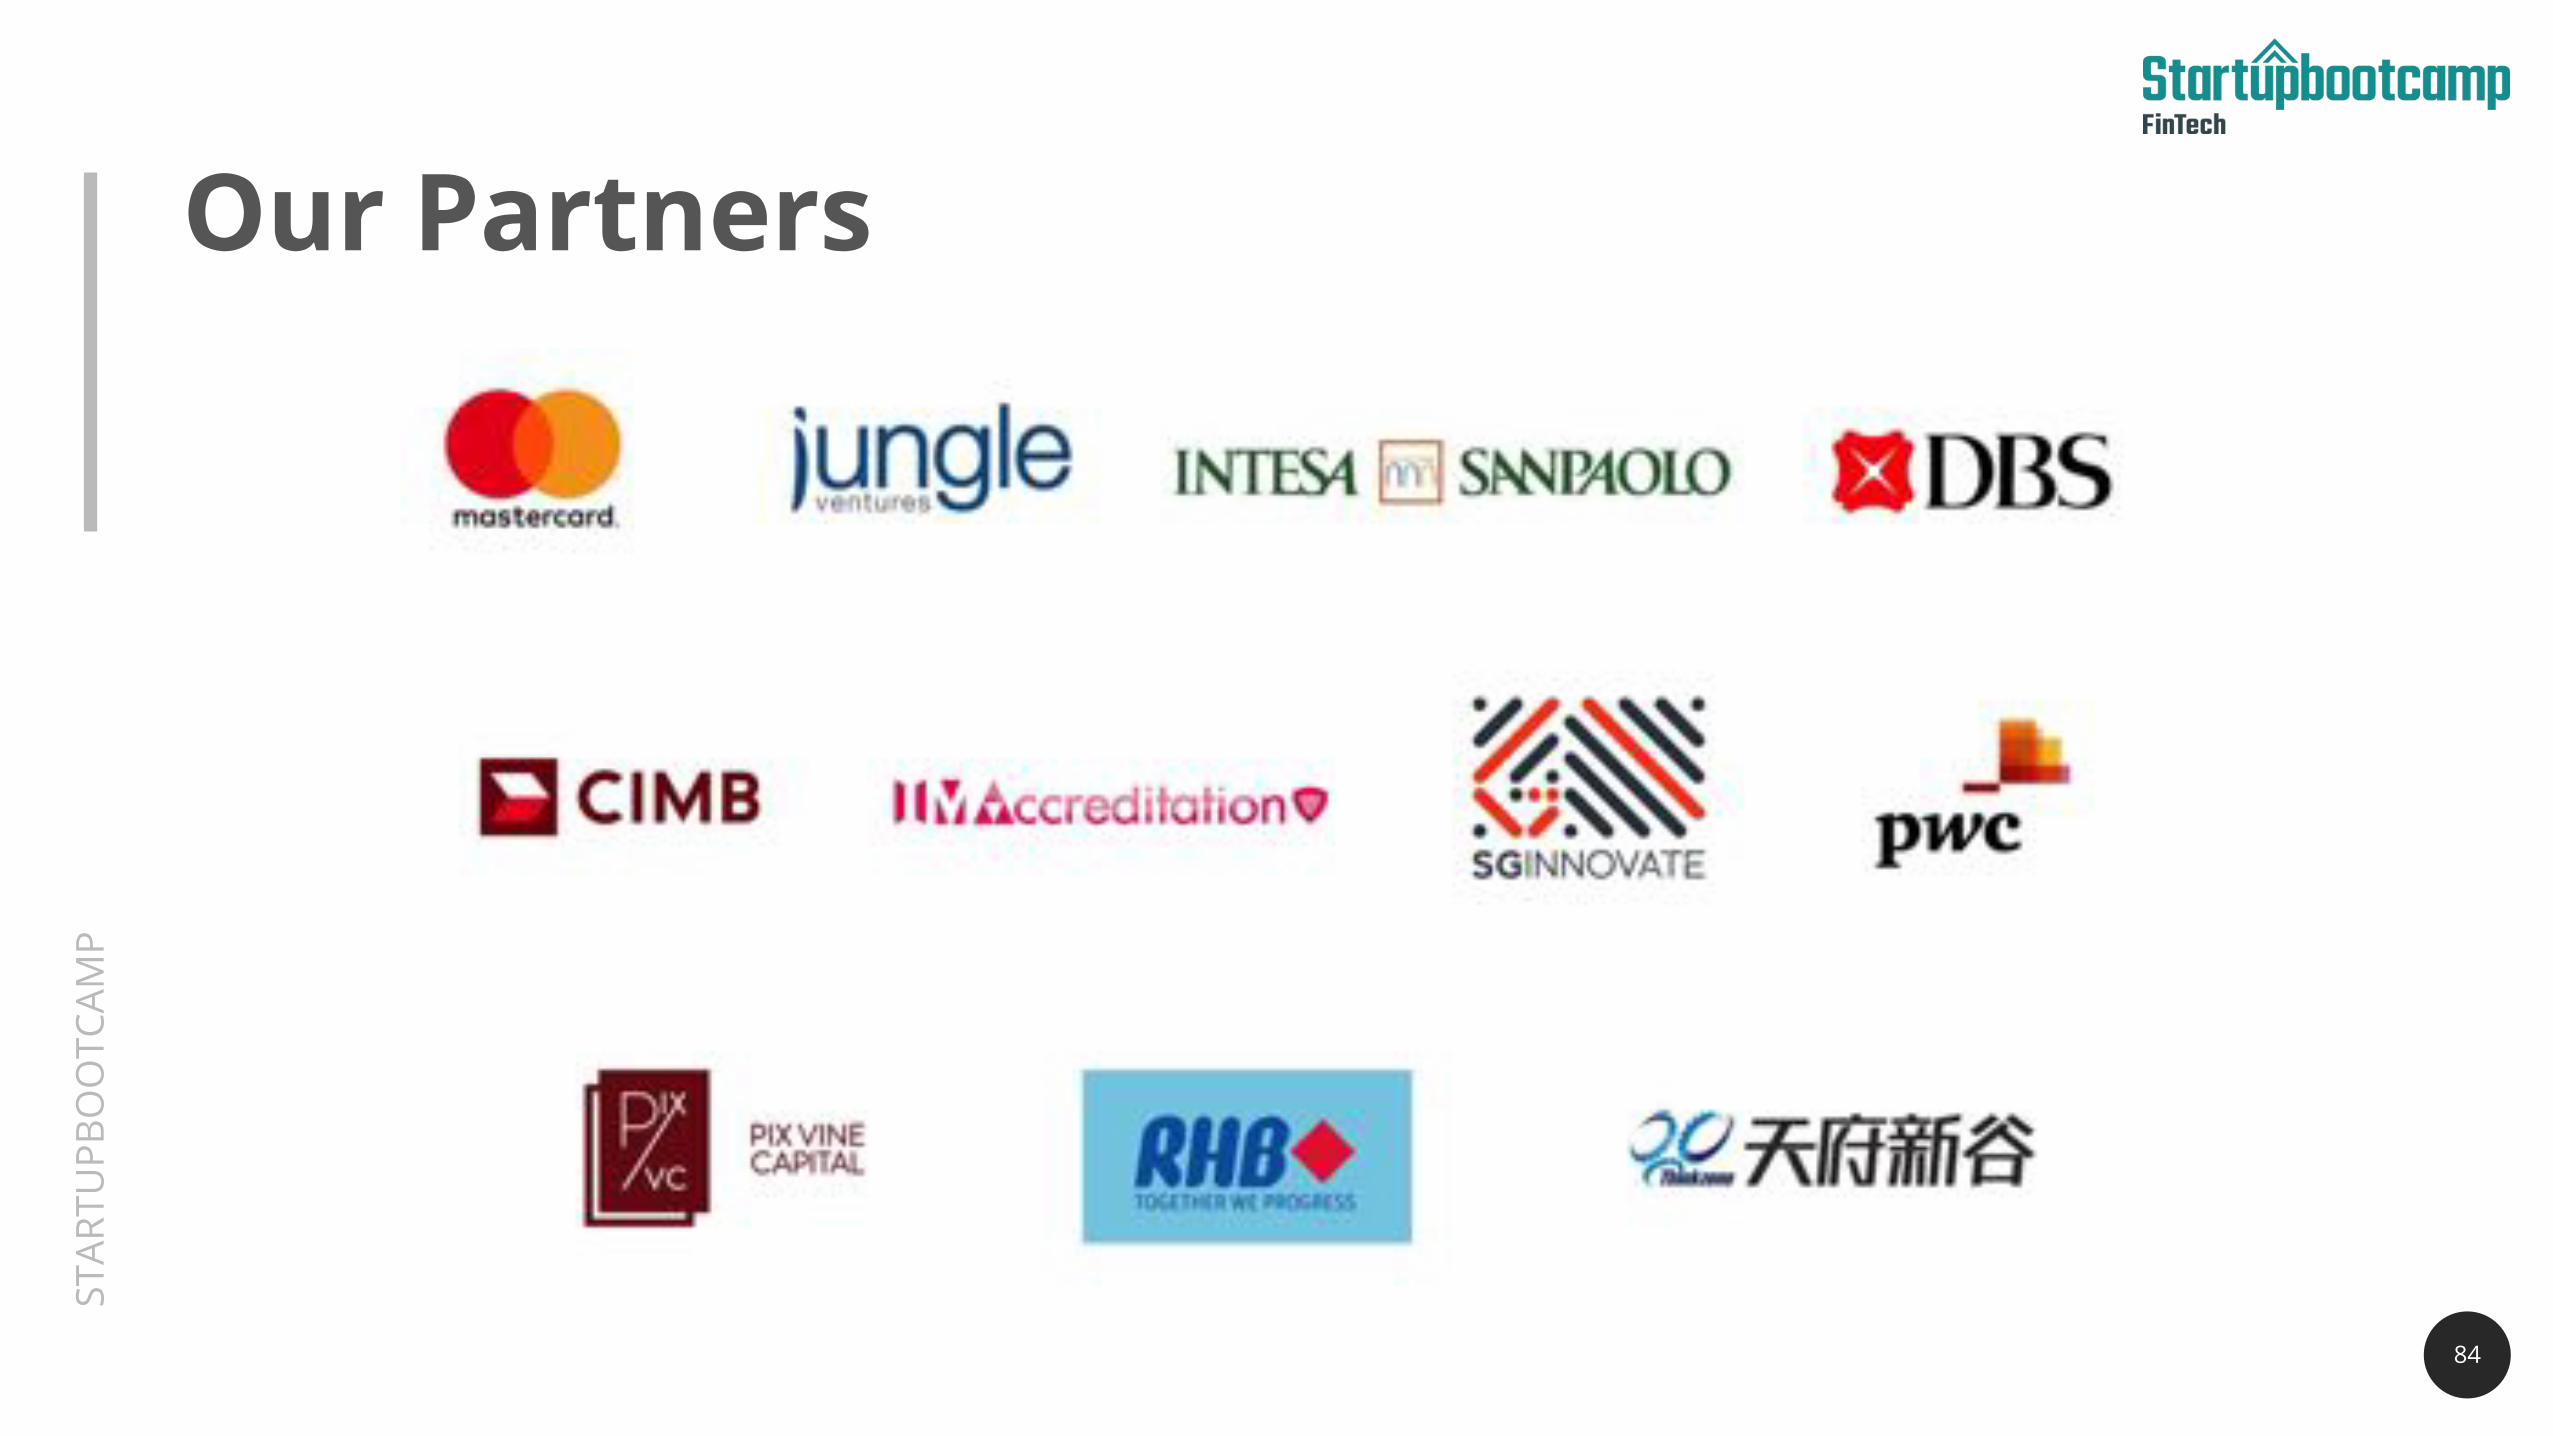
Whilst Delivering Results to 100+ partners
Examples of Startupbootcamp Partners
STAR
TUPB
OO
TCAM
P
Our Partners
84

THE
STAT
E O
F FI
NTE
CH
85
Building Trust in Society And Solving Important Problems

THE
STAT
E O
F FI
NTE
CH
THE
STAT
E O
F FI
NTE
CH
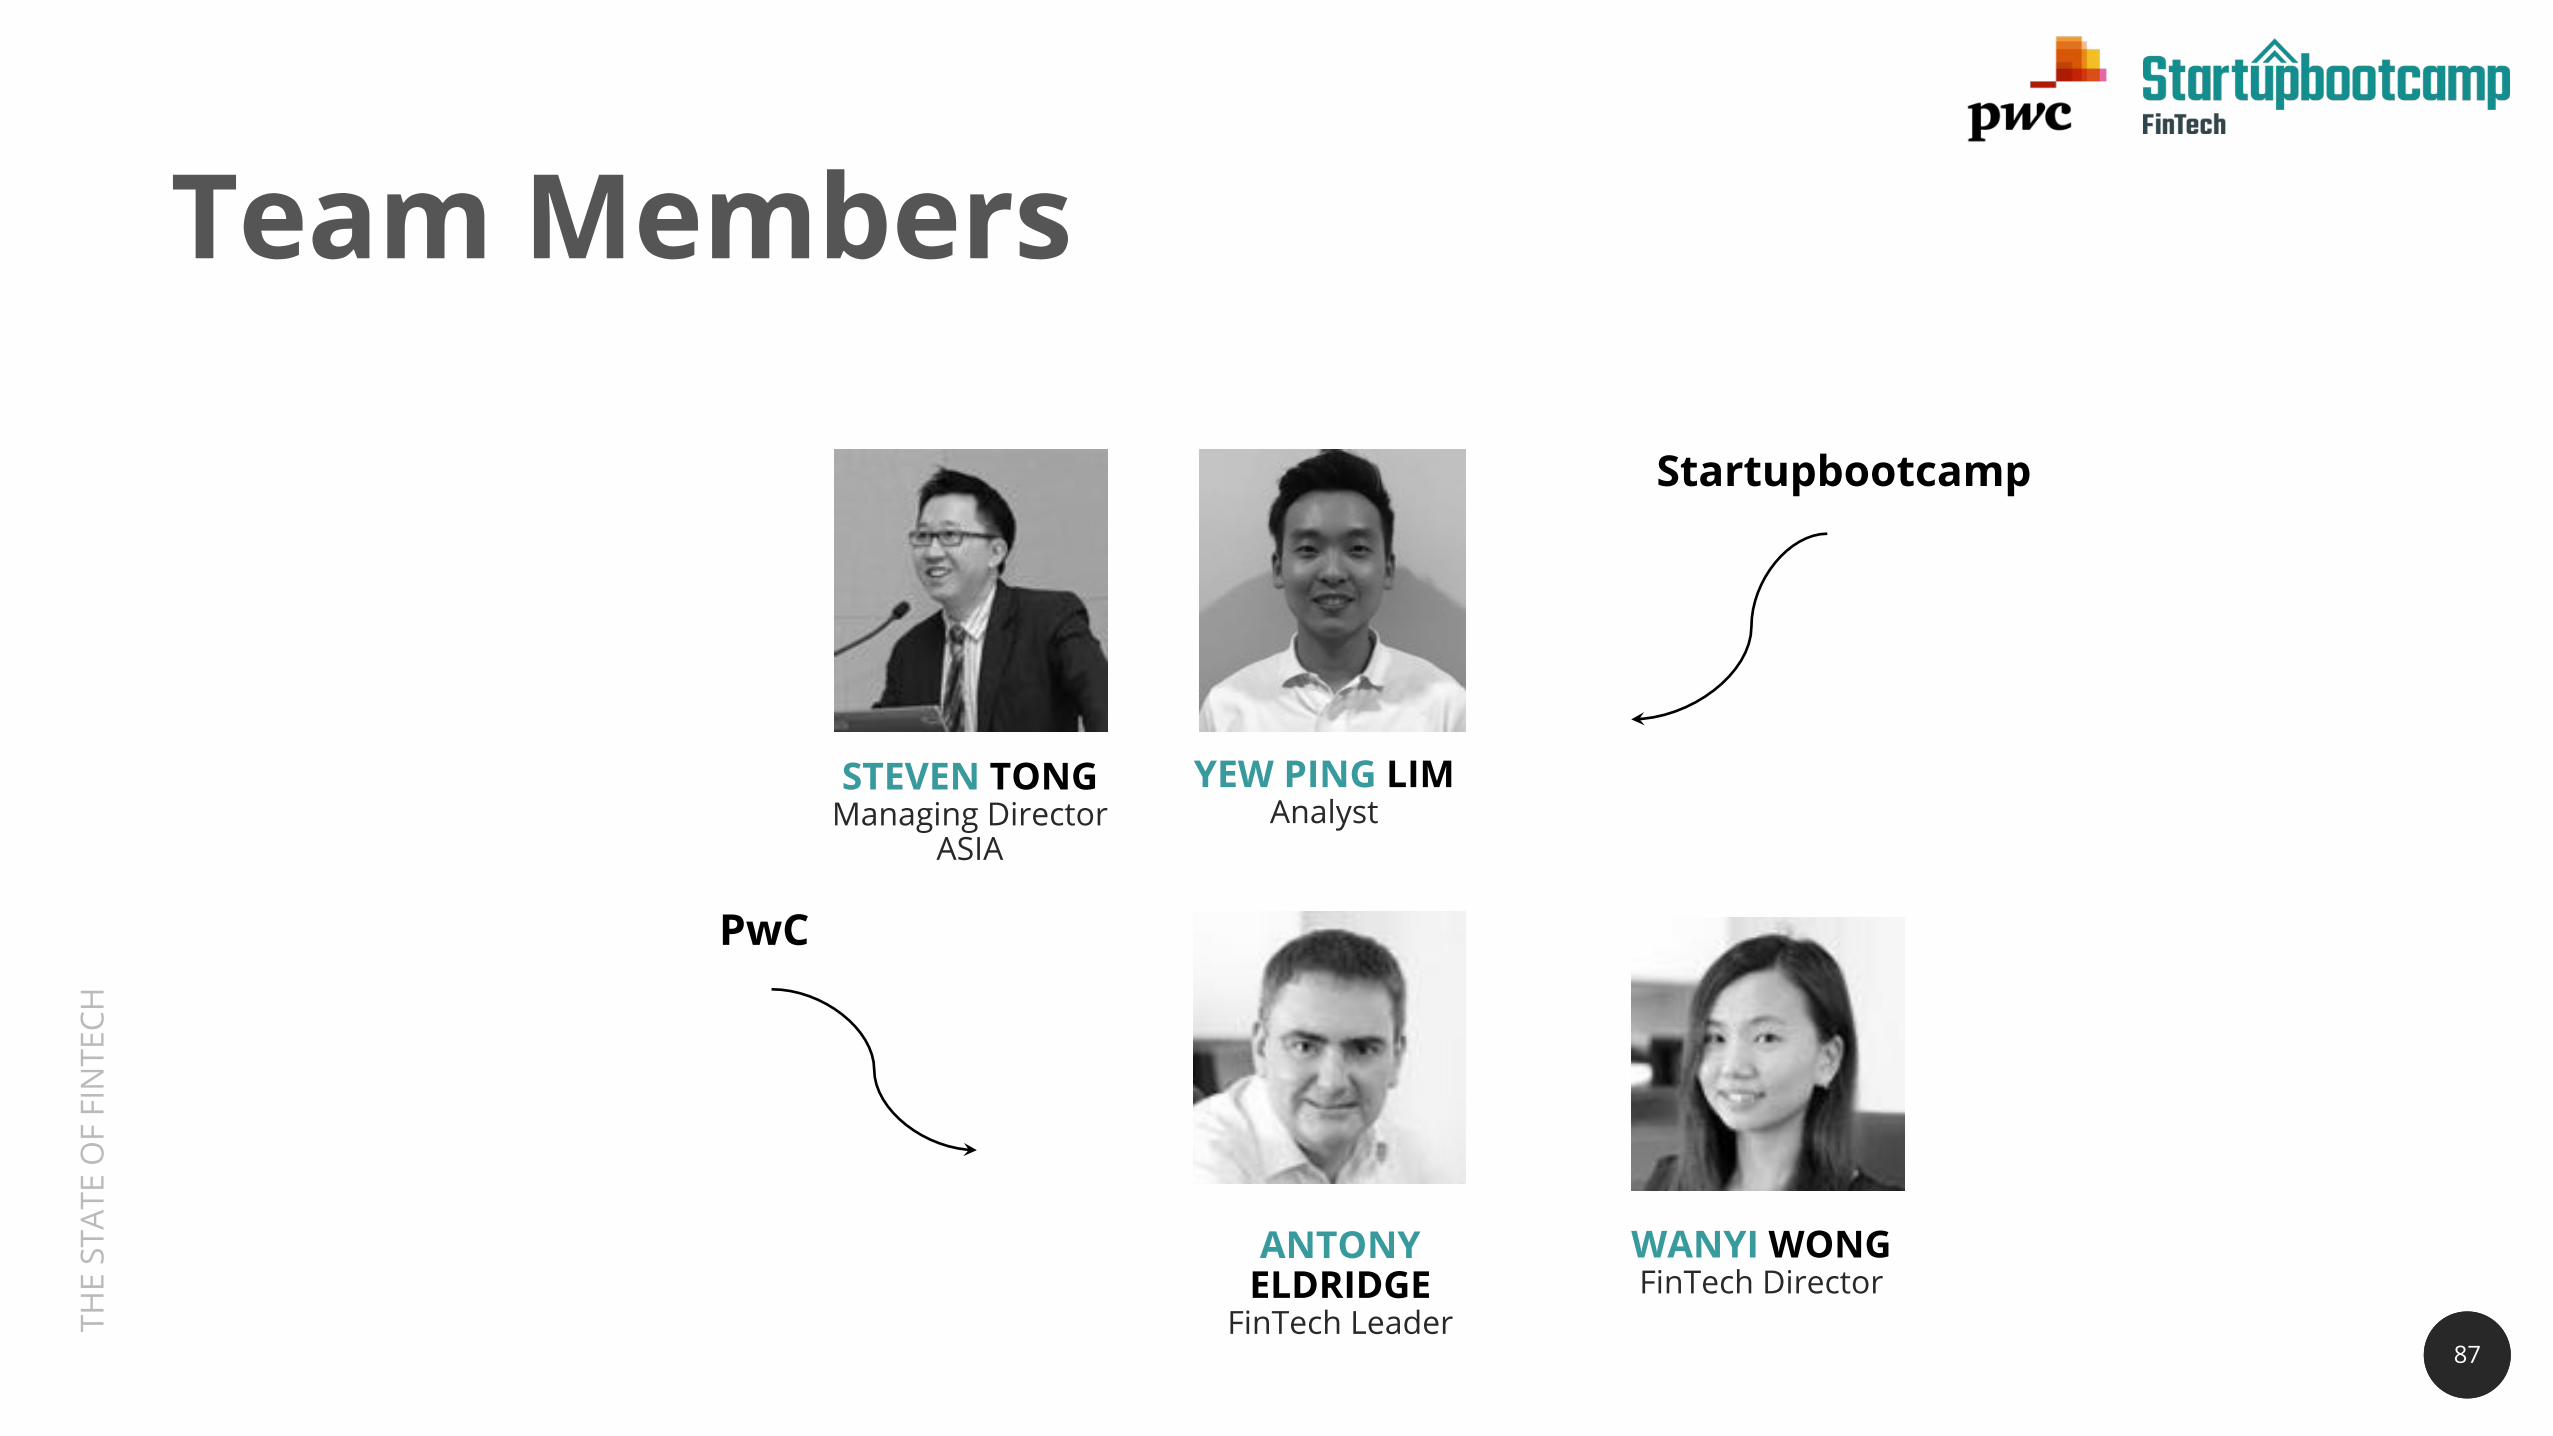
Team Members
87
STEVEN TONGManaging Director
ASIA
YEW PING LIMAnalyst
ANTONY ELDRIDGE
FinTech Leader
WANYI WONGFinTech Director
Startupbootcamp
PwC

THE
STAT
E O
F FI
NTE
CH
88
Come Talk To Us…Steven TongManaging [email protected]
Antony EldridgeFinTech [email protected]
Wanyi WongFinTech [email protected]
THE
STAT
E O
F FI
NTE
CH
Thank You