the state of nirvana - · pdf filethe state of inside ... to indicators. ... this seminar will...
TRANSCRIPT
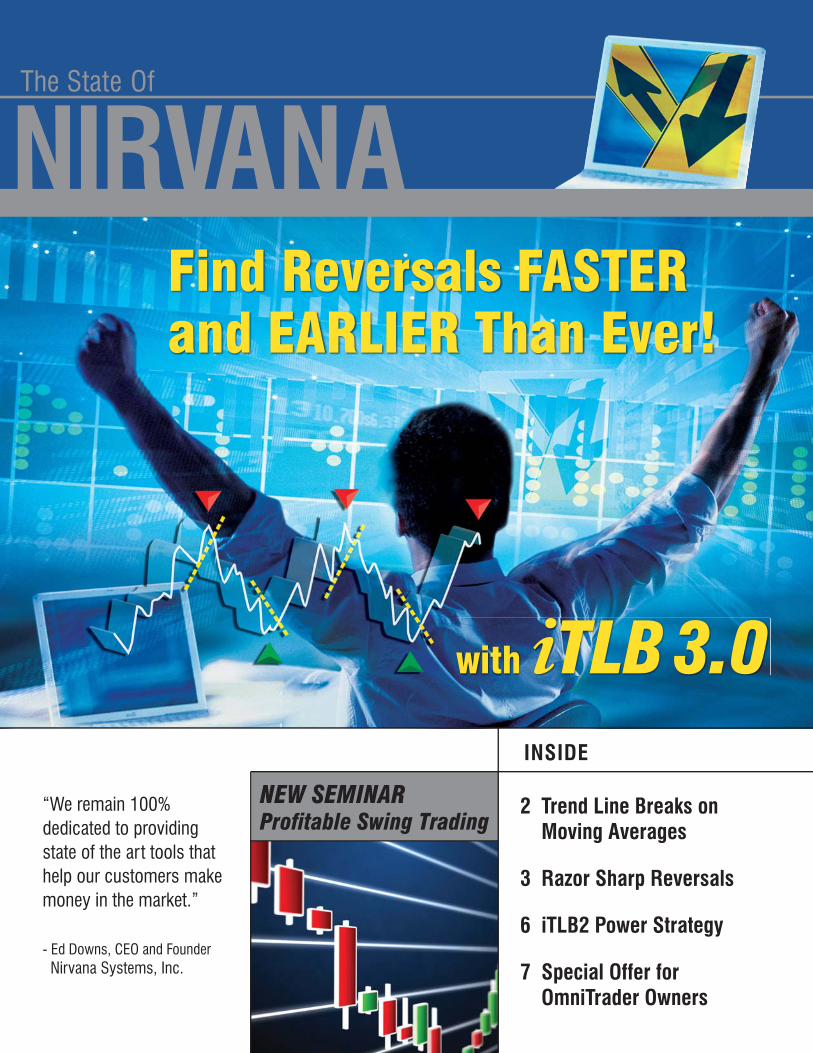
2 Trend Line Breaks on Moving Averages
3 Razor Sharp Reversals
6 iTLB2 Power Strategy
7 Special Offer for OmniTrader Owners
NIRVANAThe State Of
INSIDE
“We remain 100%dedicated to providingstate of the art tools thathelp our customers makemoney in the market.”
- Ed Downs, CEO and Founder Nirvana Systems, Inc.
NEW SEMINARProfi table Swing Trading
Find Reversals FASTERand EARLIER Than Ever!
with iTLB 3.0

Here at Nirvana, we teach a philosophy
called Trade the Moves. Th e really great
thing about this method is that it doesn’t
matter what the market does—if you can
catch the early reversals in trend—you
can make quick, consistent profi ts.
All of us would like to catch the fi rst
bar of a new move. In fact, if we could
catch it one or two bars AHEAD of
the move, that would be fabulous! And
that’s exactly what the iTLB plug-in is
designed to do, by applying Trend Lines
to Indicators.
For iTLB 2.0, we applied the iTLB
concept to several “oscillators”, including
RSI, Stochastics, Momentum, and more.
Th en, in iTLB 3.0, we added the Bull/
Bear indicators. Th e resulting Systems
identify the sharpest, cleanest reversals
of any technique available to traders, and
the new Bull/Bear Strategy is generating
the highest profi ts of all (see page 5).
But the BIG NEWS in iTLB 3.0 is
the application of iTLB to Moving
Averages. Th is brand new technique has
us very excited, because of the unique
characteristics of Moving Averages.
On this page, you can see a few examples.
By applying automatic, dynamic Trend
Lines to Moving Averages of varying
periods, we can get fabulous medium and
longer term Signals based on changes in
trend direction.
How do the new iTLB Signals compare
to Signals on traditional price trend line
breaks? Th ere are times when the Moving
Average trend lines are very close to price
trend lines. However, Moving Averages
often fi lter out noise in the price data,
which means a good trend line can
be detected even if price movement is
somewhat erratic.
New in iTLB 3.0
2
Here are some signals on BHI from the new TLB Moving Average (MA) Break Strategy, which uses the iTLB-MA System. Note how well this technique captures excellent entry points on short term trend reversals.
More Signals from the TLB MA Break Strategy on TER. In this case, the moving averages help handle price “noise” and identify the trend. Note how well the Strategy captured the trend reversals.

3
Trend Lines on Moving Averages are also more
adaptive to price movement. When a chart forms
a Trading Range, Moving Averages will adapt to
the highs and lows formed by the range. When
the chart starts trending again, the Moving
Averages will space out their reversal point to
generate longer term lines.
Th e Systems provided in iTLB 3.0 are completely
confi gurable. You can create Strategies with
any of the fi ve diff erent moving averages
in OmniTrader or VisualTrader—Simple,
Exponential, Adaptive, Weighted or Zero Lag
Exponential (we have found the latter to work
best in our testing).
Th e new iTLB Moving Average System provides
outstanding trend-reversal Signals—a perfect
complement to the iTLB Signals generated on
classic indicators. We call them Razor Sharp
Reversals; keep reading to discover why!
Trend Line Breaks on Moving Averages!
Outstanding Trend Entries: the TLB MA Break Strategy provides powerful signals in the direction of the primary trend. In this illustration, the strategy identifi es short term corrections that provide optimal entry points on PCP.
The RSI Trend Line Break (RSI-TLB) System: Sudden reversals in momentum are often indicative of a change in trend. Notice that most of these Signals occur on the earliest possible bar of the reversal.
Razor Sharp ReversalsMany indicators provide leading information.
Take Momentum for example. Th is popular
indicator measures the movement of prices
up or down, forming a plot that rises or falls
between two values. What happens if price
stops going down?
Notice I didn’t say, “What happens if price
reverses?” I said, “What happens if price
stops going down?” Th ere is a big diff erence.
When price stops going down, momentum
turns up, and you can see that in the indicator.
But we only want to trade the best and
“sharpest” reversals, which generally occur
when Momentum and other indicators
decisively break a prior trend. What is the
best way to determine a sudden change in
trend? A Trend Line Break, of course!
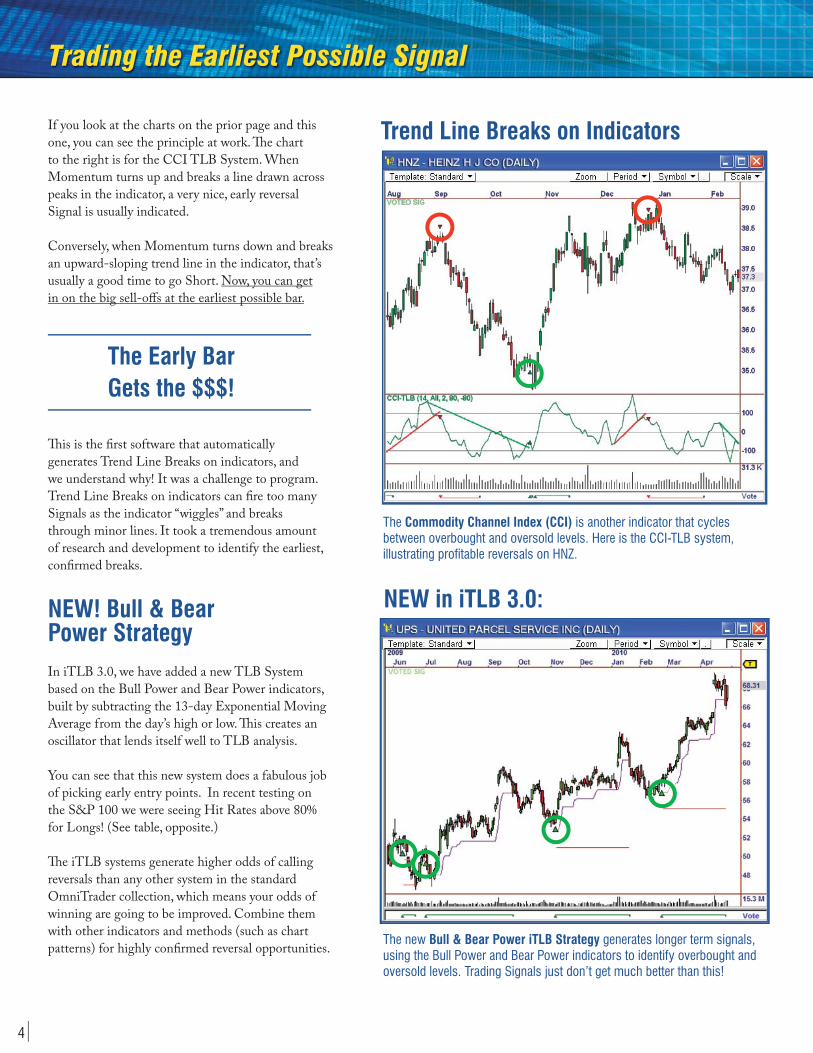
If you look at the charts on the prior page and this
one, you can see the principle at work. Th e chart
to the right is for the CCI TLB System. When
Momentum turns up and breaks a line drawn across
peaks in the indicator, a very nice, early reversal
Signal is usually indicated.
Conversely, when Momentum turns down and breaks
an upward-sloping trend line in the indicator, that’s
usually a good time to go Short. Now, you can get
in on the big sell-off s at the earliest possible bar.
The Early Bar Gets the $$$!
Th is is the fi rst software that automatically
generates Trend Line Breaks on indicators, and
we understand why! It was a challenge to program.
Trend Line Breaks on indicators can fi re too many
Signals as the indicator “wiggles” and breaks
through minor lines. It took a tremendous amount
of research and development to identify the earliest,
confi rmed breaks.
NEW! Bull & Bear Power StrategyIn iTLB 3.0, we have added a new TLB System
based on the Bull Power and Bear Power indicators,
built by subtracting the 13-day Exponential Moving
Average from the day’s high or low. Th is creates an
oscillator that lends itself well to TLB analysis.
You can see that this new system does a fabulous job
of picking early entry points. In recent testing on
the S&P 100 we were seeing Hit Rates above 80%
for Longs! (See table, opposite.)
Th e iTLB systems generate higher odds of calling
reversals than any other system in the standard
OmniTrader collection, which means your odds of
winning are going to be improved. Combine them
with other indicators and methods (such as chart
patterns) for highly confi rmed reversal opportunities.
4
Trend Line Breaks on Indicators
NEW in iTLB 3.0:
The new Bull & Bear Power iTLB Strategy generates longer term signals, using the Bull Power and Bear Power indicators to identify overbought and oversold levels. Trading Signals just don’t get much better than this!
The Commodity Channel Index (CCI) is another indicator that cycles between overbought and oversold levels. Here is the CCI-TLB system, illustrating profi table reversals on HNZ.
Trading the Earliest Possible Signal

5
Outstanding Reversal SignalsTh e iTLB Strategies work amazingly well on stocks.
Th e chart to the right illustrates how well iTLB
Strategies can fi nd powerful reversals. In the chart
shown, the June downturn in BEAV was detected
when 3 of the systems fi red Short within a few bars.
Th e Long reversal in late July was fortuitous, as the
stock rallied 65% after the Signal.
Th e iTLB concept also works well on Mutual
Funds. Mutual Funds can hold trends for long
periods of time and then suddenly reverse. Th e
iTLB method catches these reversals, allowing
investors to switch between Mutual Funds at
optimal times.
Th e iTLB 3.0 plug-in is a powerful addition for
your OmniTrader tool box. Th e great thing about
OmniTrader, of course, is you can activate these
Strategies in addition to others you are already
using to fi nd the earliest confi rmed reversals in
your list. And iTLB fi nds them quicker than
any other method!
These Signals on BE Aerospace illustrate the iTLB Reversal Strategy. When multiple iTLB systems fi re at the same time, there is usually a strong reversal indicated.
STRONG PERFORMANCEThe iTLB Strategies shown here generated 70% to 80% Hit Rates from 5/1/09 to 5/1/10 when tested against stocks in the S&P 100 index.
The new iTLB Strategies were over 75% accurate (statistics generated for Long trades only), with iTLB Bull/Bear generating an accuracy of 82%!
These statistics are impressive when you consider the fact that these are mechanical strategies!
Tests performed on stocks in the S&P 100:
Strategy Trades Accuracy
iTLB LNRH Strategy 191 81% iTLB MACDH Strategy 69 70% iTLB MFI Strategy 21 76% iTLB Power Strategy(ST) 110 75% iTLB Power Strategy(LT) 42 74%iTLB RSI 123 72%
NEW! in iTLB 3.0:
iTLB Bull/Bear 152 82% iTLB MA Break 236 76%

Swing Trading is the essence of our Trade the
Moves concept. In conjunction with the release of iTLB 3.0, Jeff Drake and Jeremy Williams have created a new info-packed Seminar titled Profi table Swing Trading based on the iTLB concept.
While the seminar does illustrate use of the iTLB 3.0 Plug-in, it is much more than a user manual. It’s a comprehensive review of profi table Swing Trading methods, focused on using the iTLB concept for low-risk Entries. Once an Entry Signal is identifi ed, Trade Management becomes very important. An entire section is devoted to this topic.
This seminar will help any customer who is engaged in Swing Trading to understand what the best setups look like, and how to trade them. It’s a great addition to the iTLB 3.0 Suite, and can be acquired with the plug-in at a greatly reduced cost.
Profi table Swing Trading Featuring iTLB 3.0
6
Since we fi rst released the iTLB Trading Systems, we
have continued to experiment with them to produce
even better Strategies that use the concept. Th e best
outcome of this eff ort is the iTLB2 Power Strategy.
Consistently Profi table
Th e iTLB2 Power Strategy works by voting ALL of
our iTLB Systems together, and only fi ring Signals
when a majority says “BUY” or “SELL” (see example,
right). It is simply amazing how well this works.
Testing on stocks in the S&P 100, the Strategy has
been consistently profi table over the past 5 years.
And over the past year, over 74% of the Signals have
made money.
An Incredible Value
Th e iTLB2 Power Strategy is just another testament
to the power of the iTLB concept. In the same way
we used the iTLB Systems to create iTLB Power,
you can use them to create your own Strategies in
Strategy Builder. Th e iTLB package off ers incredible
value for our OmniTrader users. I guarantee you
won’t fi nd ANY System that has shown itself to be
this accurate or this profi table at this price.
Extra Bonus!
The AMAZING iTLB2 Power Strategy
iTLB Power in Action. When multiple iTLB Systems fi re Long within a few bars, a Long Signal is generated. A STRONG MOVE usually follows from this point, as shown in this chart for KLIC.
75% Accurate!
Profi table Swing TradingSeminar Contents
· Using Momentum for Profi table Trading· Identifying Changes in Momentum· Classic Momentum Trades· The Anatomy of a Swing Trade· The Indicator Trend Line Break Concept· Profi table Swing Trade Management· The New iTLB 3.0 Plug-in· The iTLB Momentum Strategies· The iTLB Power Strategies· The NEW iTLB 3.0 Strategies

7000 N. MoPac, Suite 425Austin, Texas 78731 USAToll Free 1. 800. 880. 0338
www.omnitrader.com
PRESORTEDFIRST CLASS MAIL
U.S. POSTAGEPAID
AUSTIN, TXPERMIT #1546
Indicator Trend Line Break Plug-in
iTLB 3.0