the state of queensland charities - qut eprintseprints.qut.edu.au/84654/1/wp65 state of...
TRANSCRIPT

The State Of Queensland Charities
An examination of the first Annual Information Statements of charities
operating in Queensland
ACPNS Working Paper no. 65
Prof Myles McGregor-Lowndes
Marie Crittall
ii Working Paper No. 65
The Australian Centre for Philanthropy and Nonprofit Studies (ACPNS)
is a specialist research and teaching unit within the
Queensland University of Technology Business School in Brisbane, Australia.
It seeks to promote the understanding of philanthropy and nonprofit issues by drawing upon
academics from many disciplines and working closely with nonprofit practitioners, intermediaries
and government departments. The mission of the Centre is “to bring to the community the benefits
of teaching, research, technology and service relevant to the philanthropic and nonprofit
communities”, with a theme of “For the common good”.
A list of the Centre’s publications is available from http://www.bus.qut.edu.au/research/cpns/
and digital downloads are available via QUT ePrints at http://eprints.qut.edu.au/
This work was made possible by a generous gift of the Community Services Industry Alliance.
CRICOS Code: 00213J
Queensland University of Technology June 2015.
Data correct as of 31 October 2014.
iii Working Paper No. 65
Executive Summary
The advent of the Australian Charities and Not-for-profits Commission (ACNC) in 2012 and
submission of Annual Information Statements (AIS) in 2013 by those charities which registered with
them, have allowed new measures to be taken of charities and their activities. In September 2014
the ACNC in conjunction with Curtin University Not-for-profit Initiative released a report on the first
AIS and combined it with some ATO data from the Australian Business Register, Business Activity
Statements and PAYG summaries.1 The AIS data were also made available digitally through the
Australian Government Data Repository.2
This report examines the filed AIS data for Queensland charities and compares it with the overall
Australian population of charities.3
How Many Charities are there in Queensland?
- 8,020 charities are resident in Queensland, which equates to 18.1% of total Australian charities
(44,352).4
- 2,558 non-Queensland resident charities operate in Queensland to make up a total of 10,578
charities operating in Queensland which is 23.9% of total Australian charities.
Do Queensland Charities Operate in Other Areas in Australia?
- 6.3% of Queensland based charities operate in other states and territories.
- 28.3% of charities which operate in Queensland also operate in other states and territories.
How Big are Charities Operating in Queensland?
- Most (65.4%) of the Queensland operating charities are considered small charities with annual
revenue less than $250,000. The Australian average across all charities is 68.3%.
- Medium sized charities (annual revenue between $250,000 and $999,999) make up 15.9% of
Queensland operating charities. The Australian average across all charities is 15.1%.
- The remaining 18.6% of charities are considered large charities with annual revenue of more
than $1,000,000. The Australian average across all charities is 16.6%.
- Queensland has a greater percentage of large charities than the other states and territories. Of
the 2,019 large charities which operate in Queensland, over half (1,102) are from Queensland
resident charities. The remaining large charities mainly reside in NSW (20.7%), VIC (13.5%) and
ACT (3.6%).
1 Knight, P.A. and D.J. Gilchrist (214) Australian Charities 2014: The First report on Charities Registered with the
Australian Charities and Not-for-profits Commission, Report for the Australian Charities and Not-for-profits Commission, Melbourne. 2 Available under ACNC on http://data.gov.au
3 Refer Appendix 1 for notes on the data
4 952 charities did not record their state of residence. Of these, 164 charities listed that they only operate in
Queensland. As such these have been recoded so that they are based in Queensland.

iv Working Paper No. 65
How Many Full- and Part-time Staff are Employed by Queensland Charities?
- 8,200 operating charities reported employing 156,429 full-time staff which is equivalent to
6.64% of the Queensland workforce.
- 10% of Queensland operating charities employ 92.2% of all full-time charity staff in Queensland
- 8,581 operating charities reported employing 143,323 part-time staff, which is 13.77% of the
Queensland workforce.
- 10% of Queensland charities employ 89.3% of part-time staff employed by all charities in
Queensland.
- 12.55% of the total Queensland workforce were employed by charities operating in Queensland.
- The average number of full-time staff was 20. However this was skewed by several charities with
a large number of full-time staff. The median number of full-time staff was 1 with the most
common response being 0.
- The average number of part-time staff (17) was again affected by several charities with a large
number of staff. The median number of part-time staff was 1 and no part-time staff was the
most common response.
- For charities resident in Queensland, the average number of full-time staff was 15.59 and the
average number of part-time staff was 15.15.
How Many Volunteers are Engaged by Queensland Charities?
- 9,560 operating charities reported engaging 1,110,816 volunteers.
- 10% of charities engage 84.2% of volunteers.
- The average number of volunteers was 117. However, this was skewed once again: the median
number was 12, and 0 was the most common response.5 For all Australian charities, the mean
number of volunteers was 65 (the median was 11 volunteers).
What are Queensland Charities’ Purposes?
- The ‘Other’ category was the most common response with 47.4% of Queensland operating
charities specifying this category followed by the ‘Advancement of Education’ with 38.8%. The
‘Provision of Child Care Services’ was the least common response with 6.8% of all Queensland
operating charities reporting this purpose.
What are Queensland Charities’ Main Activities?
- Religious activities (26.2%), other activities (16.9%) and other education (9.9%) are the main
activities of Queensland operating charities.
Who are the Main Beneficiaries of Queensland Charities?
- The general community in Australia was the most commonly reported beneficiary overall with
53.8% of charities operating in Queensland specifying this category.
- Other major beneficiaries included children (51.5%), youth (42.3%), women (37.6%) and men
(33.3%).
5 The 441 Queensland rural fire brigades all reported their number of volunteers as 35,453. This is the
approximate overall number of volunteers for the Rural Fire Service Queensland. As such the data was changed to reflect this and each brigade was allocated 80 volunteers.

v Working Paper No. 65
- For charities Australia wide, the most commonly reported beneficiary group was children with
49.8% of all charities specifying this category. The general community in Australia was the
second most reported beneficiary (45.6%). This was followed by youth (36.8%) and women
(32.2%).
When were Queensland Charities Established?
- The mean year of establishment was 1981, with the median being 1992;6 only 9,
204 Queensland operating charities provided this information on their registration form.
- The most common response year of establishment was 1922. Overall, the mean year of
establishment for all Australian charities was 1978.
What Reporting Obligations do Queensland Charities Have?
- 1,945 Queensland operating charities have reporting obligations to Commonwealth agencies,
predominantly to DoHA, FaHCSIA and DEEWR.7
- With state reporting, 27.7% of Queensland operating charities have reporting obligations in
Queensland.
- The mean number of hours spent completing reporting obligations in charities in the previous 12
months was 192.89 hours.
Where do Queensland Charities Operate Overseas?
- 449 or 5.6% of Queensland resident charities specified at least one country outside Australia
that they operate in.
- 1,163 or 11.0% of Queensland operating charities specified at least one country outside
Australia that they operate in.
- Of this 63.6% listed only one country outside Australia; 9.1% listed two countries while 6.6%
listed three countries.
- The most frequently reported country was New Zealand (21.5% of charities that listed an
overseas location reported New Zealand), followed by India and Papua New Guinea. Overall, the
most frequently reported overseas countries in which Australian charities operate are India, The
Philippines and New Zealand.
- Charities indicate on the AIS in three sections their involvement overseas. 21.1% of Queensland
operating charities indicated they operated overseas compared to 15% of all Australian charities.
6 The ‘mean’ is a measure of the average calculated by adding together all the scores and dividing the total by
the number of scores. The ‘median’ is the middle value in the list of numbers (an equal number of scores above and below). 7 DoHA = Department of Health and Ageing, FaHCSIA = Department of Families, Housing, Community Services
and Indigenous Affairs, DEEWR = Department of Education, Employment and Workplace Relations.
vi Working Paper No. 65
Table of Contents Executive Summary ................................................................................................................................ iii
Table of Contents ................................................................................................................................... vi
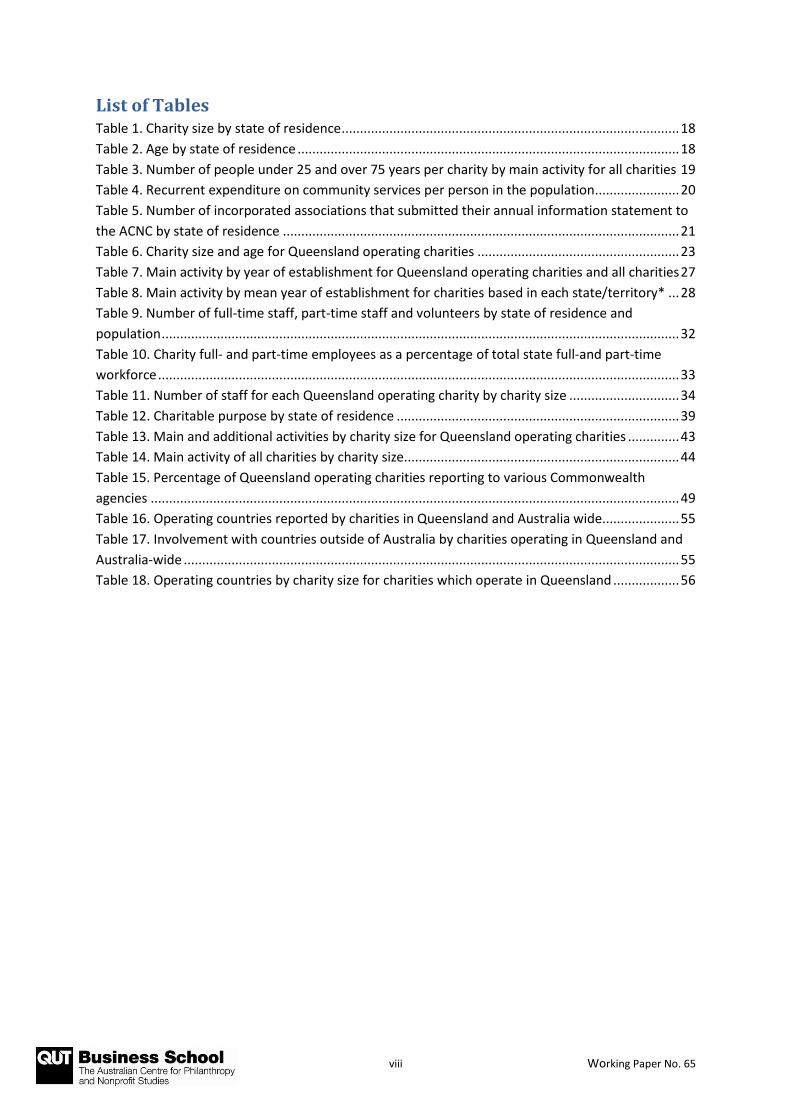
List of Tables ........................................................................................................................................ viii
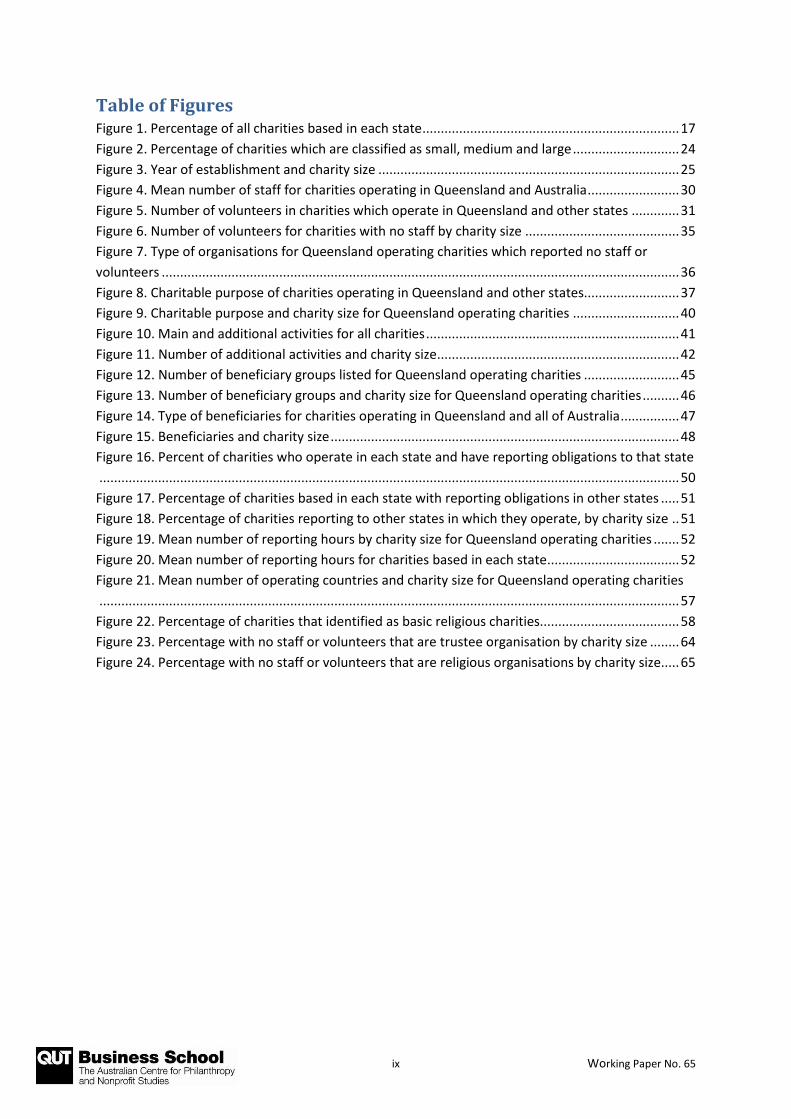
Table of Figures ...................................................................................................................................... ix
Introduction .......................................................................................................................................... 10
What is the background to this data collection? .................................................................................. 12
Some useful definitions and concepts .................................................................................................. 14
What is the difference between a charity and a nonprofit organisation? ....................................... 14
What is the difference between a resident and operating charity? ................................................. 14
What is the difference between a small, medium and large charity? .............................................. 15
What is a Basic Religious Charity? .................................................................................................... 15
The difference between mean, average and median ....................................................................... 15
How does Queensland compare on its number of charities? .............................................................. 16
Number of charities per capita ......................................................................................................... 17
Expenditure on community services ................................................................................................. 20
Comparison against numbers of not for profit associations in Queensland .................................... 21
Queensland fundraising registration ................................................................................................ 21
What is the distribution of size for Queensland charities?................................................................... 23
When were Queensland charities established? ................................................................................... 25
Year of establishment and charity size ............................................................................................. 25
Year of establishment and main activity........................................................................................... 26
Year of establishment for Queensland operating charities .......................................................... 26
Year of establishment for charities based in each state ............................................................... 27
How many people work and volunteer for Queensland charities? ...................................................... 29
Full-time staff .................................................................................................................................... 29
Part-time staff ................................................................................................................................... 29
Volunteers ......................................................................................................................................... 30
Employment and population ............................................................................................................ 31
Employment and charity size ............................................................................................................ 33
What are the purposes of Queensland charities? ................................................................................ 37
Charitable purpose by state of residence ......................................................................................... 38
Charitable purpose and charity size .................................................................................................. 40
What activities do Queensland charities undertake? ........................................................................... 41
vii Working Paper No. 65
The number of additional activities .................................................................................................. 42
Additional activities and charity size................................................................................................. 42
Type of activities and charity size ..................................................................................................... 42
Who are the beneficiaries of Queensland charities? ............................................................................ 45
Number of beneficiary groups for Queensland operating charities ................................................. 45
Number of beneficiary groups by charity size for Queensland operating charities ......................... 45
Type of beneficiaries for Queensland operating charities ................................................................ 46
Type of beneficiaries and charity size for Queensland operating charities ...................................... 47
Type of beneficiaries and charity size for charities based in each state ........................................... 48
What are the reporting obligations of Queensland charities? ............................................................. 49
Reporting to Commonwealth agencies and departments – Queensland operating charities ......... 49
Reporting to other states and territories .......................................................................................... 50
Charity size and reporting to other states and territories – All charities ......................................... 51
How many Queensland charities operate overseas and where do they operate? .............................. 54
Operating Countries and Charity Size – Queensland operating charities ......................................... 56
Number of countries and charity size for Queensland operating charities ...................................... 57
Top 10 operating countries by charity size and state of residence .................................................. 57
How many Basic Religious Charities (BRCs) are there in Queensland? ................................................ 58
References ............................................................................................................................................ 59
Appendices ............................................................................................................................................ 60
Appendix 1. Data cleansing ............................................................................................................... 61
Appendix 2. Number of people under 25 and over 75 years per charity by main activity for
charities resident in each state ......................................................................................................... 62
Appendix 3. Types of charities with no staff or volunteers by charity size ...................................... 64
Appendix 4. Charitable purpose by state and charity size ............................................................... 66
Appendix 5. Main activity by charity size for charities based in each state ..................................... 69
Appendix 6. Beneficiary groups and charity size for charities based in each state .......................... 73
Appendix 7. Top 10 operating countries by charity size for charities based in each state .............. 82
viii Working Paper No. 65
List of Tables Table 1. Charity size by state of residence ............................................................................................ 18
Table 2. Age by state of residence ........................................................................................................ 18
Table 3. Number of people under 25 and over 75 years per charity by main activity for all charities 19
Table 4. Recurrent expenditure on community services per person in the population ....................... 20
Table 5. Number of incorporated associations that submitted their annual information statement to
the ACNC by state of residence ............................................................................................................ 21
Table 6. Charity size and age for Queensland operating charities ....................................................... 23
Table 7. Main activity by year of establishment for Queensland operating charities and all charities 27
Table 8. Main activity by mean year of establishment for charities based in each state/territory* ... 28
Table 9. Number of full-time staff, part-time staff and volunteers by state of residence and
population ............................................................................................................................................. 32
Table 10. Charity full- and part-time employees as a percentage of total state full-and part-time
workforce .............................................................................................................................................. 33
Table 11. Number of staff for each Queensland operating charity by charity size .............................. 34
Table 12. Charitable purpose by state of residence ............................................................................. 39
Table 13. Main and additional activities by charity size for Queensland operating charities .............. 43
Table 14. Main activity of all charities by charity size........................................................................... 44
Table 15. Percentage of Queensland operating charities reporting to various Commonwealth
agencies ................................................................................................................................................ 49
Table 16. Operating countries reported by charities in Queensland and Australia wide..................... 55
Table 17. Involvement with countries outside of Australia by charities operating in Queensland and
Australia-wide ....................................................................................................................................... 55
Table 18. Operating countries by charity size for charities which operate in Queensland .................. 56
ix Working Paper No. 65
Table of Figures Figure 1. Percentage of all charities based in each state ...................................................................... 17
Figure 2. Percentage of charities which are classified as small, medium and large ............................. 24
Figure 3. Year of establishment and charity size .................................................................................. 25
Figure 4. Mean number of staff for charities operating in Queensland and Australia ......................... 30
Figure 5. Number of volunteers in charities which operate in Queensland and other states ............. 31
Figure 6. Number of volunteers for charities with no staff by charity size .......................................... 35
Figure 7. Type of organisations for Queensland operating charities which reported no staff or
volunteers ............................................................................................................................................. 36
Figure 8. Charitable purpose of charities operating in Queensland and other states.......................... 37
Figure 9. Charitable purpose and charity size for Queensland operating charities ............................. 40
Figure 10. Main and additional activities for all charities ..................................................................... 41
Figure 11. Number of additional activities and charity size.................................................................. 42
Figure 12. Number of beneficiary groups listed for Queensland operating charities .......................... 45
Figure 13. Number of beneficiary groups and charity size for Queensland operating charities .......... 46
Figure 14. Type of beneficiaries for charities operating in Queensland and all of Australia ................ 47
Figure 15. Beneficiaries and charity size ............................................................................................... 48
Figure 16. Percent of charities who operate in each state and have reporting obligations to that state
.............................................................................................................................................................. 50
Figure 17. Percentage of charities based in each state with reporting obligations in other states ..... 51
Figure 18. Percentage of charities reporting to other states in which they operate, by charity size .. 51
Figure 19. Mean number of reporting hours by charity size for Queensland operating charities ....... 52
Figure 20. Mean number of reporting hours for charities based in each state .................................... 52
Figure 21. Mean number of operating countries and charity size for Queensland operating charities
.............................................................................................................................................................. 57
Figure 22. Percentage of charities that identified as basic religious charities...................................... 58
Figure 23. Percentage with no staff or volunteers that are trustee organisation by charity size ........ 64
Figure 24. Percentage with no staff or volunteers that are religious organisations by charity size..... 65

10 Working Paper No. 65
Introduction
Why is Tracking Nonprofit Data Useful?
Being able to track the vital statistics of the nonprofit sector is an essential policy tool for
governments, nonprofit organisations themselves, and those businesses and foundations that seek
to support charitable causes. Such information assists in making judgements about a range of issues.
From an economic frame of reference, are there too many or too few organisations delivering
services or infrastructure now, and for the future? Those interested in civil society might want to
understand the production of nonprofit organisations relative to that produced by the State,
business or family and the nature of volunteers in this production. This informs the debate over
which sector should deliver particular services. It also enables better prediction of the consequences
for the nonprofit sector of another sector’s activities, for example government funding changes,
incursion of the business sector, or families seeking or withdrawing from nonprofit service
consumption. Finally, in the long-running debate about whether the nonprofit sector requires
regulation, the big questions about what parts of it should be regulated and how this should be
achieved can only be answered appropriately with knowledge about the vital characteristics of the
sector.
This policy tool has been a very crude or even a non-existent instrument in Australia compared to
what has been available in other OECD countries such the USA, the UK and Canada. One of the
barriers to creating this tool in Australia was that state based regulators did not collect the same or
even comparable information. Often they did not have any means of collecting information or
making it digitally available to the public. The main repository of national regulatory information was
the Australian Taxation Office (ATO) which, unlike any other OECD fiscal regulator, only required
taxation returns from a handful of nonprofit tax entities. The Australia Bureau of Statistics (ABS) has
pioneered national accounts for the sector by bringing together ATO material not normally available
to the public, and through special purpose national surveys. This did not generally allow for a drilling
down into nonprofit specific purposes or geographic locations.
The establishment of the Australian Charities and Not-for-profits Commission (ACNC) has allowed a
better policy tool to be developed due to the legislative requirement for registered charities to
provide an Annual Information Statement (AIS), and adoption of digital technologies that allow
complete data sets to be available to the general public in a timely fashion. This has not been
without controversy about its cost imposition on organisations or possible infringement of privacy.
What Does this Paper Seek to Do?
This paper attempts to take the first returns filed with the ACNC and explore the specific data that
relates to Queensland. It should be considered in the light of the Curtin University Report prepared
in 2014 for the ACNC taking a national view of the first ACNC returns.8
8 Knight, P. A. and D. J. Gilchrist, (2014), Australian Charities 2014: The First Report on Charities Registered with
the Australian Charities and Not-for-profits Commission, Report for the Australian Charities and Not-for-profits Commission, Melbourne available at http://acnc.gov.au/curtincharitiesreport2013

11 Working Paper No. 65
In 2010, the Queensland Council of Social Service (QCOSS) skilfully attempted to bring together a
number of sources to describe the activities of community service organisations in Queensland.9 At
that time in Queensland there were 2,253 organisations which provided community services
(including aged care, child care, residential care and social assistance). An estimated 1,210
economically significant nonprofit organisations operated in the community services sector, mostly
in areas other than child care and residential aged care. Overall, there were an estimated 66,000
volunteers in the Queensland community services sector (in the year to June 2009) contributing an
average of 92.9 hours each per year.10 It is important to note that this QCOSS study is not directly
comparable to the ACNC data. QCOSS surveyed community service organisations, and there are an
unknown number of community service organisations which are not charities. The ACNC first AIS
returns data captures only charities that have registered with the ACNC as it is voluntary. This paper
draws out those charities resident in Queensland or operating in Queensland that have filed a
return.11
Although the charities responded well to the first AIS, not all filed their AIS within the time period
and some failed to complete the full return. It also became evident in the analysis of the returns that
some of the material supplied may not be accurate because of misunderstanding of what was being
requested. Detailed notes on data cleansing and assumptions are available in Appendix 1.
The paper looks at the following questions:
What is the background to this data collection?
How does Queensland compare on its number of charities?
What is the distribution of size for Queensland charities?
When were Queensland charities established?
How many people work and volunteer for Queensland charities?
What are the purposes of Queensland charities?
What activities do Queensland charities undertake?
Who are the beneficiaries of Queensland charities?
What are the reporting obligations of Queensland charities?
How many Queensland charities operate overseas and where do they operate?
How many Basic Religious Charities are there in Queensland?
9 The main data sources for this report are Australian Bureau of Statistics (2010), Productivity Commission
(2010), Australian Institute for Health and Welfare (2007) and Australian Institute for Health and Welfare (2009). 10
Norton, M, The Queensland Community Services Sector 2010, Work Futures Pty Ltd. 11
The data is publicly available at http://www.data.gov.au/dataset/acnc-2013ais

12 Working Paper No. 65
What is the background to this data collection?
‘The Australian Charities and Not-for-profits Commission (ACNC) is the independent national
regulator of charities. The ACNC has been set up to achieve the following objects:
maintain, protect and enhance public trust and confidence in the sector through
increased accountability and transparency
support and sustain a robust, vibrant, independent and innovative not-for-profit
sector
promote the reduction of unnecessary regulatory obligations on the sector.’12
In order to be included on the ACNC register, an organisation must be nonprofit, have a charitable
purpose13 and be for the public benefit. If the ATO had previously considered an organisation to be a
charity, it was transferred to the ACNC registry. Such registered charities must also have an
Australian Business Number, comply with governance standards and not be a type of organisation
that cannot be registered.14
The ACNC has developed a free and searchable public register of registered charities. As part of their
aim to develop a ‘report-once, use-often’ framework, charities on the register must submit an
Annual Information Statement (AIS) detailing their purpose, beneficiaries, size and reporting
requirements.
For charities which are private ancillary funds (PAFs) information can be withheld from the register
and AIS datasets on request. This includes some funds that used to be called ‘income tax exempt
funds’ (ITEFs). Generally this information is withheld if it may lead to the identification of individual
donors. This information has not yet been published to allow time to ensure all withholding
applications have been submitted and processed so that PAFs which do not wish their data made
available are withheld from the AIS dataset. For other charities, withholding of information can
occur if the information is commercially sensitive and it could cause harm, is inaccurate, confusing or
misleading, is offensive, could endanger public safety, or is covered by ACNC regulations.
The size of the charity also affects the amount of information that needs to be reported. Small
charities only need to submit an Annual Information Statement. From 2014 onwards the Annual
Information Statements include basic financial questions. Medium and large charities also need to
submit a financial report. For large charities this must be audited. All financial reports need to
include:
12
Australian Charities and Not-for-profits Commission (2013) 13
The Charities Act (2013) (Cth) lists twelve charitable purposes: advancing health, education, social or public welfare, religion, culture, promoting reconciliation, promoting or protecting human rights, advancing the security or safety of Australia or the Australian public, preventing or relieving the suffering of animals, advancing the natural environment, promoting or opposing a change to any matter established by law, policy, or practice, other purposes beneficial to the general public (more information is provided on the ACNC website http://acnc.gov.au/ACNC/Register_my_charity/Who_can_register/Typ_char/ACNC/Reg/TypesCharPurp.aspx?hkey=2bb8e414-8396-4278-953c-8cb080a70c0a) 14
Organisations that cannot be registered include: political parties, government entities or those engaged in or supporting terrorist or other criminal activities. Individuals and partnerships also cannot be registered.
13 Working Paper No. 65
financial statements for the reporting period;
notes to the financial statements;
a responsible persons' declaration about the statements and notes.
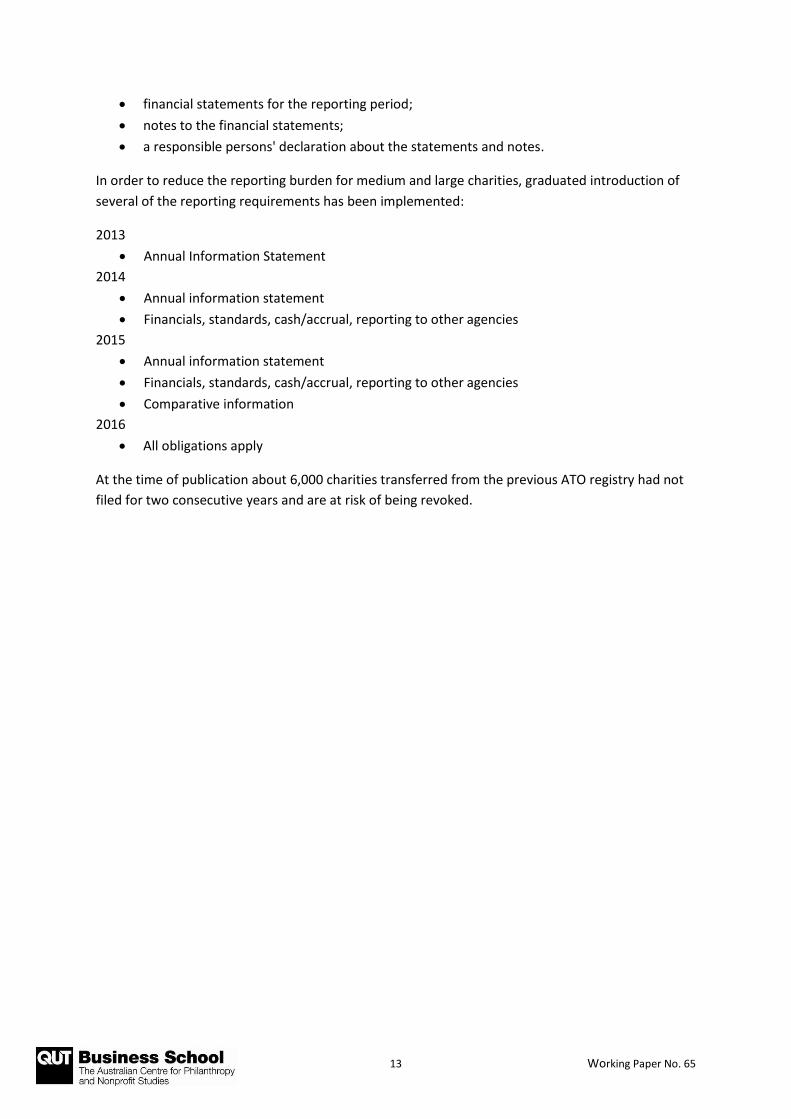
In order to reduce the reporting burden for medium and large charities, graduated introduction of
several of the reporting requirements has been implemented:
2013
Annual Information Statement
2014
Annual information statement
Financials, standards, cash/accrual, reporting to other agencies
2015
Annual information statement
Financials, standards, cash/accrual, reporting to other agencies
Comparative information
2016
All obligations apply
At the time of publication about 6,000 charities transferred from the previous ATO registry had not
filed for two consecutive years and are at risk of being revoked.
14 Working Paper No. 65
Some useful definitions and concepts
What is the difference between a charity and a nonprofit organisation? In this paper a charity is an organisation that is registered with the ACNC. A charity can adopt a
number of legal structures such as unincorporated entity, incorporated association, company, or
trust, provided it is for a charitable purpose in the public benefit.
Charitable purposes are technically defined as:
a) advancing health;
b) advancing education;
c) advancing social or public welfare;
d) advancing religion;
e) advancing culture;
f) promoting reconciliation, mutual respect and tolerance between groups of individuals that
are in Australia;
g) promoting or protecting human rights;
h) advancing the security or safety of Australia or the Australian public;
i) preventing or relieving the suffering of animals;
j) advancing the natural environment;
k) any other purpose beneficial to the general public that may reasonably be regarded as
analogous to, or within the spirit of, any of the purposes mentioned in paragraphs (a) to (j);
l) promoting or opposing a change to any matter established by law, policy or practice in the
Commonwealth, a State, a Territory or another country, if:
i. in the case of promoting a change—the change is in furtherance or in aid of one or
more of the purposes mentioned in paragraphs (a) to (k); or
ii. in the case of opposing a change—the change is in opposition to, or in hindrance of,
one or more of the purposes mentioned in those paragraphs.15
Generally, a nonprofit (or not-for-profit) is an organisation that does not operate for the profit,
personal gain or other benefit of particular people (for example, its members, the people who run it
or their friends or relatives). All charities are nonprofits, but not all nonprofits are charities.
What is the difference between a resident and operating charity? Charities were asked to provide their business address, including their postcode and state. This has
been taken as state of residence and is referred to as such throughout this report. Charities were
also asked to indicate the states and territories in which they carried on their charitable activities
and we refer to this as ‘operating in’. Charities may operate in multiple states however they can only
list one state of residence.
15
Sections 7 and 12 of ACNC Act.

15 Working Paper No. 65
What is the difference between a small, medium and large charity? The ACNC has three different charity size categories (small, medium, large) based on annual
revenue:
small charity – annual revenue is less than $250 000;
medium charity – annual revenue is $250 000 or more, but less than $1 million;
large charity – annual revenue is $1 million or more.
Revenue is income that arises in the course of ordinary activities of a charity. Revenue can also be
called sales, fees, interest, dividends or royalties. A charity needs to calculate its revenue by using
the Australian Accounting Standards (AAS), which are set by the Australian Accounting Standards
Board (AASB).16
What is a Basic Religious Charity? Charities which qualify as basic religious charities are exempt from reporting all financial information
(both in the AIS and as a separate annual financial report) regardless of the size of the organisation.
They also do not have to comply with governance standards.17 A basic religious charity must meet all
of the following requirements:
It must be registered as a subtype of charity for the advancement of religion;
It must not be registered as any other subtype of charity (for example, could not also be
registered for the subtype of advancing education);
It must not be a body corporate registered under the Corporations Act 2001, an Indigenous
corporation (under the Corporations (Aboriginal and Torres Strait Islander) Act 2006), a
corporation registered under the Companies Act 1985 of Norfolk Island, or an incorporated
association in any state or territory;
It must not be endorsed as a Deductible Gift Recipient (DGR) itself (however it can be
endorsed to operate DGR funds, institutions or authorities as long as their total revenue is
less than $250 000 for the particular financial year);
The ACNC must not have allowed it to report as part of a group; and
It must not have received more than $100 000 in government grants in the current financial
year or either of the previous two financial years.
The difference between mean, average and median The mean is the average where you add up the numbers for all items and then divide by the number
of items. The median is the middle value in the list of numbers. Both are ways of reporting the
average.
16
For further explanation refer to the ACNC website at http://acnc.gov.au/ACNC/FTS/Fact_CharSize.aspx 17
Governance standards are: 1. purposes and not-for-profit nature of a registered entity; 2. accountability to members; 3. compliance with Australian laws; 4. suitability of responsible persons; 5. duties of responsible persons. More information can be found at http://www.acnc.gov.au/ACNC/Manage/Governance/ACNC/Edu/GovStds_overview.aspx

16 Working Paper No. 65
How does Queensland compare on its number of charities?
Queensland has 8,020 charities that reside in the state with a further 2,558 charities resident in
other states or territories but operating in Queensland. So, a total of 10,578 of charities who
provided their Annual Information Statement (AIS) operate in Queensland, which amounts to 23.9%
of Australia’s charities. Nearly all of resident Queensland charities (93.7%) operate only in
Queensland.18 It appears that Queensland is not a magnet location for charities that operate
nationally.
The question that is often asked is - are there too many or two few charities operating in a
geographical area or activity? The attempts to answer this question often quickly descend into views
about economies of scale in large organisations versus small organisations that are nimble and close
to communities and causes. The AIS data allows some exploration of how many charities there are in
a state and their broad activities.
Future years will allow exploration of the births and deaths of charities in areas and activities as new
AISs are filed and the ACNC register is cleaned and verified. We know in relation to creation of for-
profit business entities that there is a longer term decline in business entity creation. During 2012-13
the stock of businesses declined by around 60,000 entities with over 300,000 exits.19 Major charity
registers around the world usually follow a pattern where the number of charity entries is the same
or slightly more than the number of charity exits, but until the ACNC verifies the register inherited
from the ATO this will not be apparent.20 In the meantime, we can start to explore how Queensland
compares with other Australian states on a range of measures.
18
That is, the only Australian jurisdiction for these charities is Queensland. They may operate overseas as well. 19
Productivity Commission, 2014, Business Set-up, Transfer and Closure, Productivity Commission Issues Paper, (December 2014), p 5. 20
This often depends on the activity of the regulator in ceasing charities that are inactive, as, unlike business exits, few are forced through formal insolvency.
17 Working Paper No. 65
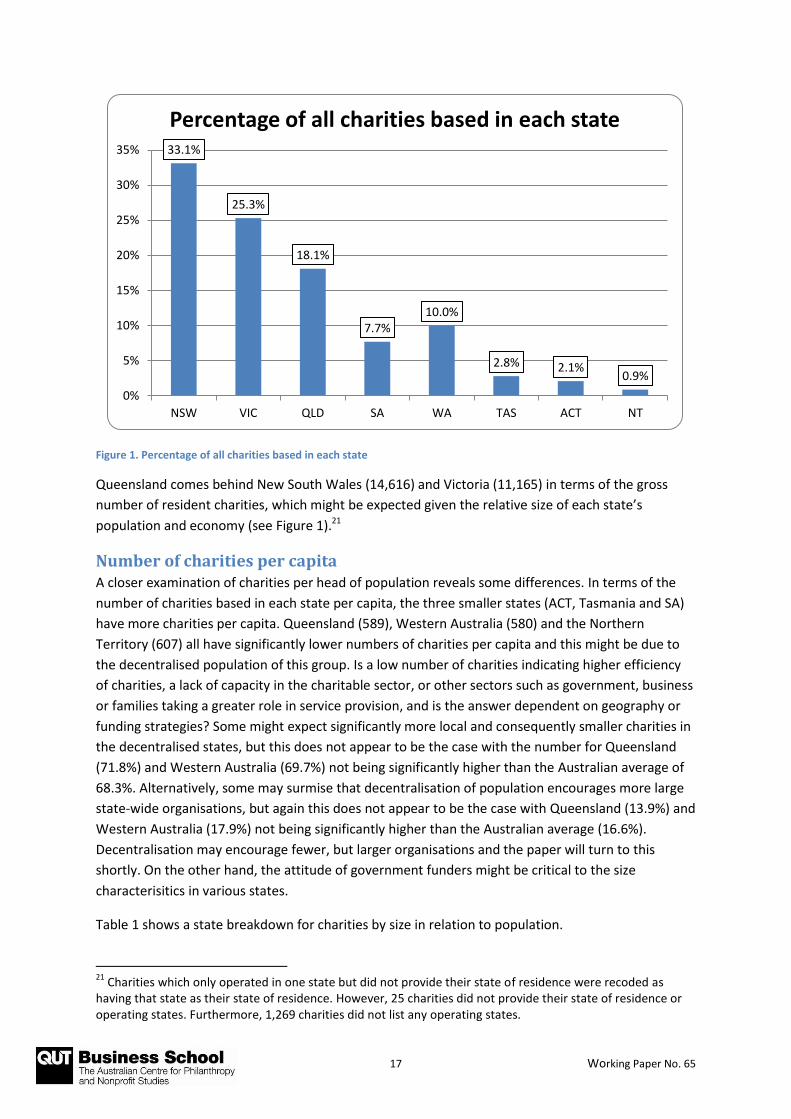
Figure 1. Percentage of all charities based in each state
Queensland comes behind New South Wales (14,616) and Victoria (11,165) in terms of the gross
number of resident charities, which might be expected given the relative size of each state’s
population and economy (see Figure 1).21
Number of charities per capita A closer examination of charities per head of population reveals some differences. In terms of the
number of charities based in each state per capita, the three smaller states (ACT, Tasmania and SA)
have more charities per capita. Queensland (589), Western Australia (580) and the Northern
Territory (607) all have significantly lower numbers of charities per capita and this might be due to
the decentralised population of this group. Is a low number of charities indicating higher efficiency
of charities, a lack of capacity in the charitable sector, or other sectors such as government, business
or families taking a greater role in service provision, and is the answer dependent on geography or
funding strategies? Some might expect significantly more local and consequently smaller charities in
the decentralised states, but this does not appear to be the case with the number for Queensland
(71.8%) and Western Australia (69.7%) not being significantly higher than the Australian average of
68.3%. Alternatively, some may surmise that decentralisation of population encourages more large
state-wide organisations, but again this does not appear to be the case with Queensland (13.9%) and
Western Australia (17.9%) not being significantly higher than the Australian average (16.6%).
Decentralisation may encourage fewer, but larger organisations and the paper will turn to this
shortly. On the other hand, the attitude of government funders might be critical to the size
characterisitics in various states.
Table 1 shows a state breakdown for charities by size in relation to population.
21
Charities which only operated in one state but did not provide their state of residence were recoded as having that state as their state of residence. However, 25 charities did not provide their state of residence or operating states. Furthermore, 1,269 charities did not list any operating states.
33.1%
25.3%
18.1%
7.7% 10.0%
2.8% 2.1% 0.9%
0%
5%
10%
15%
20%
25%
30%
35%
NSW VIC QLD SA WA TAS ACT NT
Percentage of all charities based in each state
18 Working Paper No. 65
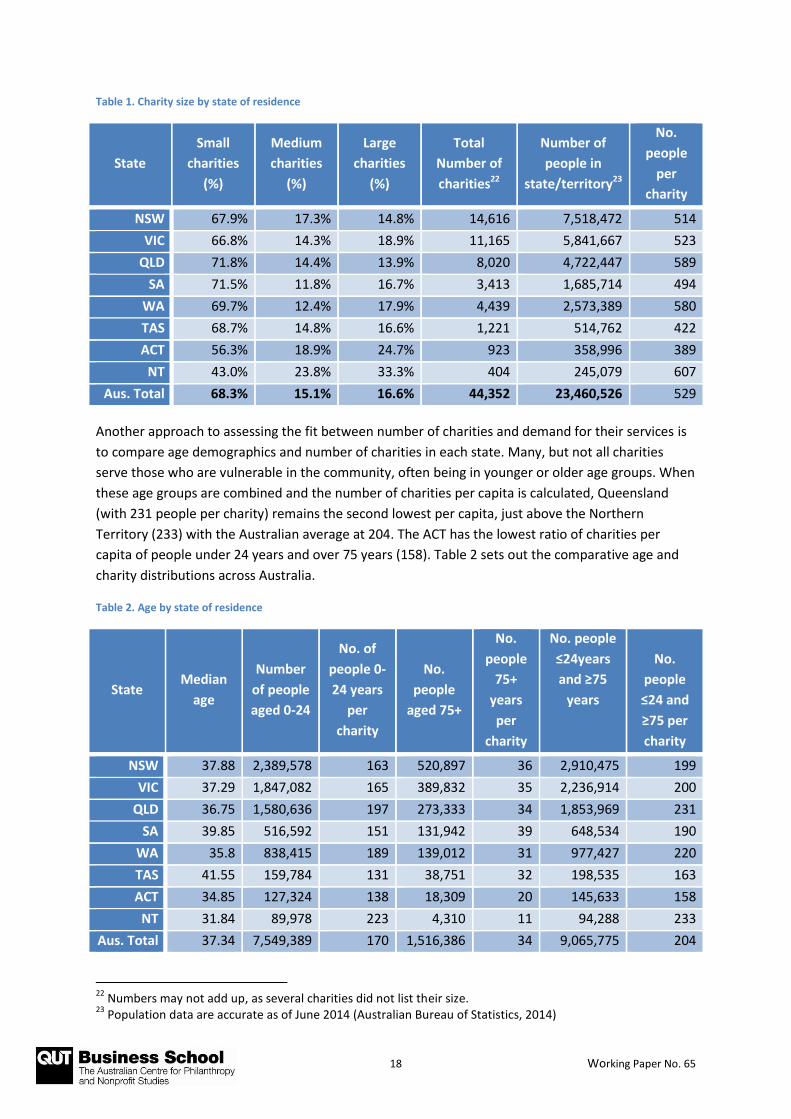
Table 1. Charity size by state of residence
State
Small
charities
(%)
Medium
charities
(%)
Large
charities
(%)
Total
Number of
charities22
Number of
people in
state/territory23
No.
people
per
charity
NSW 67.9% 17.3% 14.8% 14,616 7,518,472 514
VIC 66.8% 14.3% 18.9% 11,165 5,841,667 523
QLD 71.8% 14.4% 13.9% 8,020 4,722,447 589
SA 71.5% 11.8% 16.7% 3,413 1,685,714 494
WA 69.7% 12.4% 17.9% 4,439 2,573,389 580
TAS 68.7% 14.8% 16.6% 1,221 514,762 422
ACT 56.3% 18.9% 24.7% 923 358,996 389
NT 43.0% 23.8% 33.3% 404 245,079 607
Aus. Total 68.3% 15.1% 16.6% 44,352 23,460,526 529
Another approach to assessing the fit between number of charities and demand for their services is
to compare age demographics and number of charities in each state. Many, but not all charities
serve those who are vulnerable in the community, often being in younger or older age groups. When
these age groups are combined and the number of charities per capita is calculated, Queensland
(with 231 people per charity) remains the second lowest per capita, just above the Northern
Territory (233) with the Australian average at 204. The ACT has the lowest ratio of charities per
capita of people under 24 years and over 75 years (158). Table 2 sets out the comparative age and
charity distributions across Australia.
Table 2. Age by state of residence
State Median
age
Number
of people
aged 0-24
No. of
people 0-
24 years
per
charity
No.
people
aged 75+
No.
people
75+
years
per
charity
No. people
≤24years
and ≥75
years
No.
people
≤24 and
≥75 per
charity
NSW 37.88 2,389,578 163 520,897 36 2,910,475 199
VIC 37.29 1,847,082 165 389,832 35 2,236,914 200
QLD 36.75 1,580,636 197 273,333 34 1,853,969 231
SA 39.85 516,592 151 131,942 39 648,534 190
WA 35.8 838,415 189 139,012 31 977,427 220
TAS 41.55 159,784 131 38,751 32 198,535 163
ACT 34.85 127,324 138 18,309 20 145,633 158
NT 31.84 89,978 223 4,310 11 94,288 233
Aus. Total 37.34 7,549,389 170 1,516,386 34 9,065,775 204
22
Numbers may not add up, as several charities did not list their size. 23
Population data are accurate as of June 2014 (Australian Bureau of Statistics, 2014)

19 Working Paper No. 65
It may be that this measure is of more use when only those charities with a main activity that
involves serving youth or the elderly are examined. Table 3 sets out the ratio of people under 24 and
over 75 per charity by the main activity recorded on their AIS. Appendix 2 shows this breakdown for
each state and territory, along with more detailed main activity breakdown of this data.
Table 3. Number of people under 25 and over 75 years per charity by main activity for all charities
Main Activity
Australia Total
No. charities with
this purpose
No. people ≤24
per charity
No. people ≥ 75
years per charity
Aged care activities 1,237 6,103 1,226
Emergency and relief 1,128 6,693 1,344
Employment and training 427 17,680 3,551
Higher education 515 14,659 2,944
Hospital services and rehabilitation
activities 274 27,553 5,534
Housing activities 645 11,704 2,351
Income support and maintenance 107 70,555 14,172
Law and legal activities 177 42,652 8,567
Mental health and crisis intervention 337 22,402 4,500
Primary and secondary education 3,191 2,366 475
Religious activities 11,352 665 134
Social services 1,235 6,113 1,228
Sports 149 50,667 10,177
Other education 3,114 2,424 487
Other health service delivery 1,076 7,016 1,409
Other recreation and social club activity 507 14,890 2,991
Other 4,036 1,871 376
Total 44,352 7,549,389 1,516,386
Aged care activities
In terms of aged care activities, Tasmania has the smallest ratio of people aged 75 years and over
per charity with 635. This was followed by the Australian Capital Territory at 832 people in this age
group per charity. Victoria came out with the highest number of people per charity with 1,611
people aged 75 years or over per charity. The average for all of Australia was 1,226 people in this
aged group per charity with the main activity of aged care activities. Queensland had 1,148 people
aged 75 years and over per charity.
Health services
For charities with a main activity of hospital services and rehabilitation activities, Tasmania has the
smallest ratio of people aged 75 years and over per charity with 2,768. This was followed by the
Northern Territory (4,310 people 75 years and over per charity) and South Australia (5,075 people
per charity). When other health service delivery is examined however, the Northern Territory has
the smallest ratio with 180 people 75 years and over per charity. The ACT (763 people per charity)

20 Working Paper No. 65
and Tasmania (881 people per charity) are also states which have a low number of people 75 years
per charity with this purpose. Queensland has 6,667 people aged 75 or over per charity with such
activities.
Education
When examining primary and secondary education, the ACT has the smallest ratio with 1,744 people
under 24 years per charity with this main activity. This is also the case when the main activity is
higher education (with 5,536 people under 24 years for each charity with this main activity) or when
other education (with 1,463 people under 24 years per charity). Queensland has 2,359 people under
24 years per primary and secondary education charity and 19,044 people under 24 years for higher
education charity and 2,595 for the category other education.
Employment and training
For charities with a main activity of employment and training, Tasmania had the smallest ratio of
people less than 24 years per charity (7,263). This was followed by the Northern Territory at 9,998
people in this age group per charity. Queensland has 22,908 persons under 24 years per charity with
only the ACT being higher at 25,465 persons under 24 years per charity.
Expenditure on community services Another comparator which might be useful is the amount spent per capita on community services in
each state, as charities often receive substantial grant funding. Are charity numbers driven by more
government funding flowing into the sector? Does such funding result in consolidation of the charity
population or do charities increase in number to fill the gap of insufficient government funding? The
Queensland government ($1887.30 per capita) allocates less than the national average ($2025.90
per capita) with only Victoria ($1799.00) and the ACT ($1878.00) being lower per capita in allocation.
Both Victoria and the ACT have lower numbers of people per charity (523 and 389 respectively) than
the national average of 539 residents per charity, with Queensland coming in at 589 residents per
charity (see Table 4). Could this be explained by Queensland having a number of large charities
serving the population? This is examined shortly.
Table 4. Recurrent expenditure on community services per person in the population
State Total number of
charities
Expenditure on community
services per person
Total number of people per charity
NT 404 $3,997.80 607
TAS 1,221 $2,123.60 422
NSW 14,616 $2,093.80 514
WA 4,439 $2,040.10 580
SA 3,413 $1,978.90 494
QLD 8,020 $1,887.30 589
ACT 923 $1,878.80 389
VIC 11,165 $1,799.00 523
Australia wide 44,352 $2,025.90 539

21 Working Paper No. 65
Comparison against numbers of not for profit associations in Queensland Queensland had 23,000 incorporated associations on its register during the period of the 2013 AIS,
and 2,281 (28.4%) ACNC charities that filed their AIS indicated that they were incorporated
associations resident in Queensland.24 ACNC examination of the ABN register suggests that there are
some 4,200 incorporated association charities. Decade old departmental survey data suggests that
over a third of the register’s organisations are sporting bodies, with another third being service
clubs, community purpose and recreational orientated organisations. A search of the AIS data also
shows that 4,445 charities are companies,25 and 1,755 (16.6%) of these charities operate in
Queensland. This is likely to be an underestimate of the number, as companies limited by guarantee
are able to omit the word ‘Limited’ from their formal name on application to ASIC.
Table 5. Number of incorporated associations that submitted their annual information statement to the ACNC by state of residence
State Small Medium Large Total
Number Percentage Number Percentage Number Percentage Number Percentage
NSW 2,981 29.6% 1,004 40.0% 425 19.8% 4,379 30%
VIC 2,259 30.5% 690 43.5% 569 27.1% 3,548 31.8%
QLD 1,462 25.6% 464 40.6% 338 30.6% 2,281 28.4%
SA 1,089 44.8% 268 66.8% 357 63.0% 1,723 50.5%
WA 1,351 43.9% 344 62.9% 407 51.6% 2,213 47.8%
TAS 302 36.2% 115 63.9% 110 55.0% 532 43.6%
ACT 214 41.6% 79 45.7% 76 33.6% 374 40.5%
NT 84 48.8% 51 53.7% 64 48.1% 203 50.2%
Aust.
TOTAL 9,713 32.3% 3,024 45.4% 2,355 32.3% 15,212 34.3%
Queensland fundraising registration The Queensland Office of Fair Trading maintains a register of organisations which are required to
seek approval to raise funds from the public in Queensland. No person ‘shall make or cause to be
made or assist in making any appeal for support for any purpose’ unless they are registered as a
charity or are an association that has a sanction to collect for a ‘community purpose’.26 Recognised
religious denominations, parents and citizens associations and hospital foundations are not required
to be registered.
As at the date of this publication there were 4,208 associations on the Collections Act register with
1,634 being registered as charities and 2,574 being Community Purpose Associations. Comparing the
Collections Act register with the ACNC register is difficult because of differences in recording formal
names of charities, however we have used our best attempts to clean the data.
24
A search of the AIS data was undertaken to determine the number of organisations that included ‘Inc.’ or ‘Incorporated’ as part of their formal name. 25
A search of the AIS data was undertaken to determine the number of organisations that included ‘Ltd’ or ‘Limited’ as part of their formal name. 26
Collections Act 1966 (Qld) s 10. Community purpose associations are those that don’t qualify technically as charities under the Act.

22 Working Paper No. 65
One might expect that all charities registered under the Queensland Collections Act would also be
registered with the ACNC. However, only 1,132 of 1,634 Collections Act charities appear to be
registered as ACNC charities. On the other hand, one might expect that few community purpose
organisations would be registered with the ACNC as they have not been assessed in Queensland as
being charitable, but 1,058 of 2,574 Queensland community purpose organisations are registered
with the ACNC as charities. This appears to be high. In total, there are 2,582 (61.2%) entries (charity
and community purpose) on the Collections Act register that appear also to be registered as ACNC
charities.
Examining the issue from the ACNC register, there are 6,327 (78.9%) ACNC charities resident in
Queensland that do not appear on the Queensland Collections register and for those who indicated
to the ACNC that they operated in Queensland 8,505 (80.4%) did not appear on the Collections
register. Overall, there are 8,526 (80.4%) ACNC registered charities either resident or operating in
Queensland that are NOT on the Queensland Collections list. This could be due to a number of
factors other than non-compliance, for example:
1. Some ACNC charities are exempt from the Queensland provisions – so the ACNC charities
that are recognised religious denominations may fall into this category. There are 2,817
ACNC charities with religious purposes operating in Queensland and a large number may fall
into this category.
2. There are ACNC charities resident or operating in Queensland which do not seek support
from the public in Queensland.
3. There are Queensland Collections Act Charities that do not seek income tax exemption or
seek it through a different exemption category from the ACNC regime.
This represents an opportunity for both regulators to improve the integrity of their registers and has
implications for the ACNC being a repository of centralised records and returns for such
organisations. If both registers are accurate in relation to those who qualify as charities in each
jurisdiction, it highlights the issue of confusion and extra administration that differing technical
definitions of charity bring to the sector.
23 Working Paper No. 65
What is the distribution of size for Queensland charities?27
The size of charities has become a topic of interest in recent years. Some commentators and
governments have adopted the position that larger organisations are more efficient and effective
and can offer a bigger range of co-ordinated services to a client. Whether this is the case in all
circumstances is open to debate. Size might also be a contributing factor when considering the
number of charities per capita which was explored above.
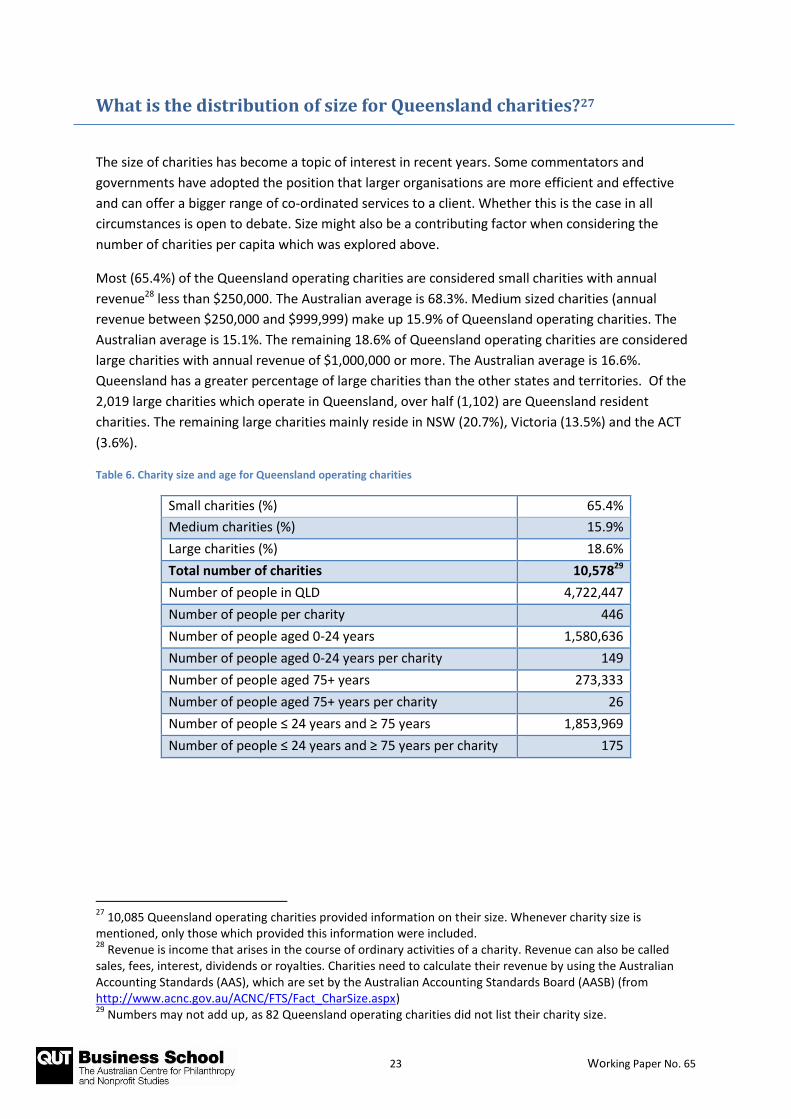
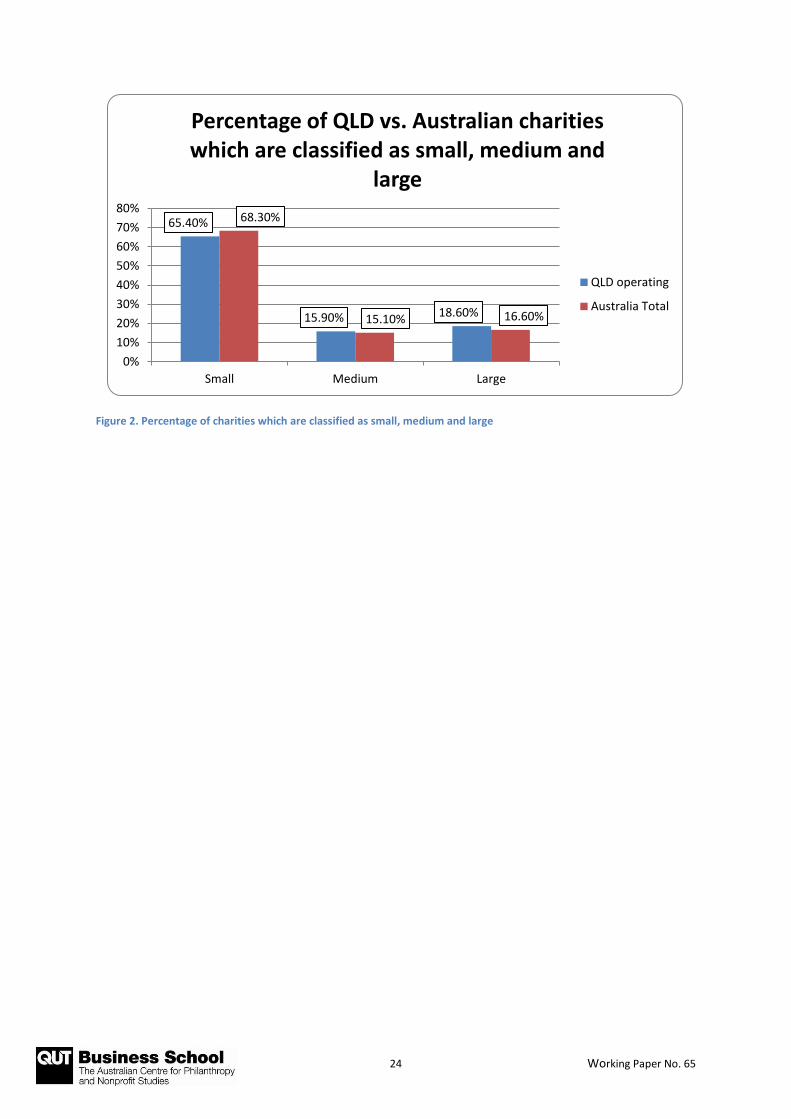
Most (65.4%) of the Queensland operating charities are considered small charities with annual
revenue28 less than $250,000. The Australian average is 68.3%. Medium sized charities (annual
revenue between $250,000 and $999,999) make up 15.9% of Queensland operating charities. The
Australian average is 15.1%. The remaining 18.6% of Queensland operating charities are considered
large charities with annual revenue of $1,000,000 or more. The Australian average is 16.6%.
Queensland has a greater percentage of large charities than the other states and territories. Of the
2,019 large charities which operate in Queensland, over half (1,102) are Queensland resident
charities. The remaining large charities mainly reside in NSW (20.7%), Victoria (13.5%) and the ACT
(3.6%).
Table 6. Charity size and age for Queensland operating charities
Small charities (%) 65.4%
Medium charities (%) 15.9%
Large charities (%) 18.6%
Total number of charities 10,57829
Number of people in QLD 4,722,447
Number of people per charity 446
Number of people aged 0-24 years 1,580,636
Number of people aged 0-24 years per charity 149
Number of people aged 75+ years 273,333
Number of people aged 75+ years per charity 26
Number of people ≤ 24 years and ≥ 75 years 1,853,969
Number of people ≤ 24 years and ≥ 75 years per charity 175
27
10,085 Queensland operating charities provided information on their size. Whenever charity size is mentioned, only those which provided this information were included. 28
Revenue is income that arises in the course of ordinary activities of a charity. Revenue can also be called sales, fees, interest, dividends or royalties. Charities need to calculate their revenue by using the Australian Accounting Standards (AAS), which are set by the Australian Accounting Standards Board (AASB) (from http://www.acnc.gov.au/ACNC/FTS/Fact_CharSize.aspx) 29
Numbers may not add up, as 82 Queensland operating charities did not list their charity size.
24 Working Paper No. 65
Figure 2. Percentage of charities which are classified as small, medium and large
65.40%
15.90% 18.60%
68.30%
15.10% 16.60%
0%
10%
20%
30%
40%
50%
60%
70%
80%
Small Medium Large
Percentage of QLD vs. Australian charities which are classified as small, medium and
large
QLD operating
Australia Total

25 Working Paper No. 65
When were Queensland charities established?
There are a number of reasons why knowing about the lifecycle of charities can be productive. We
know that the longer a charity is in existence the better its performance or potential performance in
fundraising, particularly bequests. It is also likely to have greater ratio of reserves to expenditure or
assets to expenditure and thus be able to survive environmental shocks such as national financial
crises, funding cuts or entry of disruptive business models. On the other hand, more recent entries
are likely to be more fragile. This information is vital to assist in design of capacity building assistance
for nonprofit organisations.
9,204 Queensland operating charities provided details on their registration form regarding the year
they were established. The mean year of establishment was 1981, with the median being 1992. The
most common response year of establishment was 1922. Overall, the mean year of establishment
for Australian charities was 1978.30
Year of establishment and charity size There was little difference in the mean year established and the size of the charity for Queensland
operating charities (small = 1980, medium = 1984, large = 1982). Figure 3 displays the year of
establishment by charity size for charities which operate in Queensland. The percentage of all
Australian charities established in each year group is also displayed. While 12.3% of small
Queensland operating charities were established between 2010 and 2013, 8.3% of all charities were
also established in this time frame.
Figure 3. Year of establishment and charity size
30
Only charities which stated they were established up until December 2013 were included in this analysis. The median was 1989, mode was 1977.
0%
5%
10%
15%
20%
25%
30%
Year of establishment and charity size for QLD operating charities
Small
Medium
Large
All Australian charities
26 Working Paper No. 65
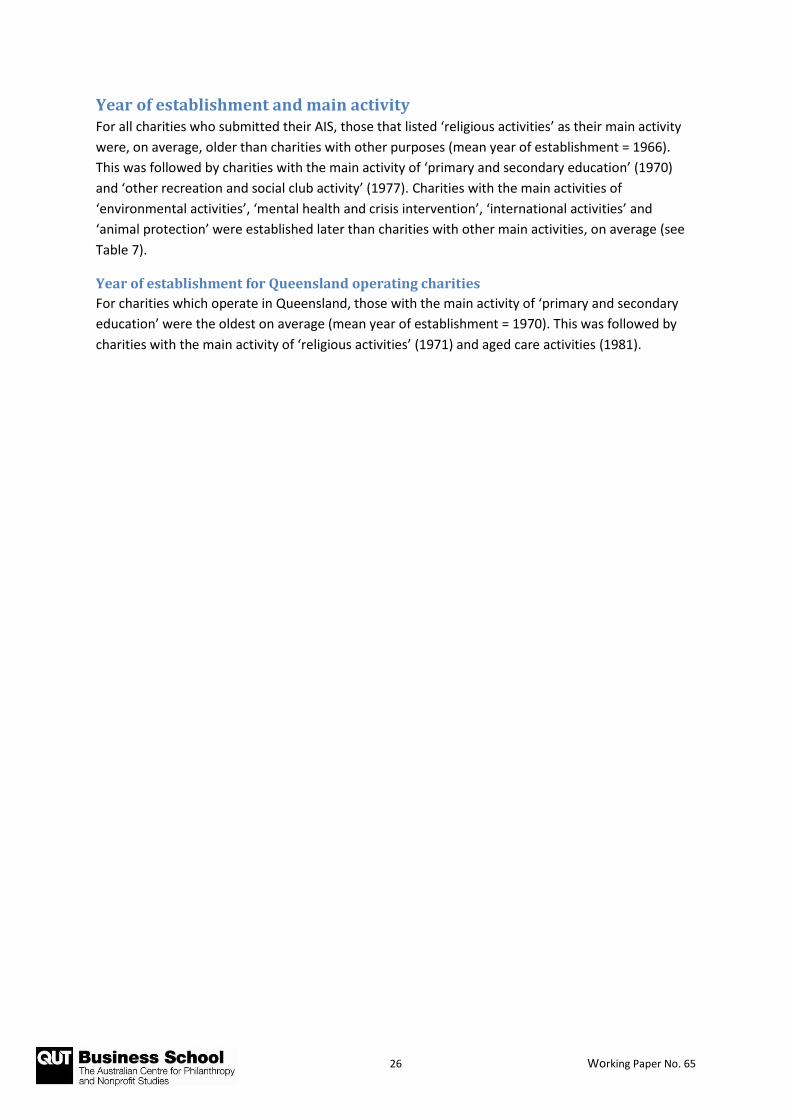
Year of establishment and main activity For all charities who submitted their AIS, those that listed ‘religious activities’ as their main activity
were, on average, older than charities with other purposes (mean year of establishment = 1966).
This was followed by charities with the main activity of ‘primary and secondary education’ (1970)
and ‘other recreation and social club activity’ (1977). Charities with the main activities of
‘environmental activities’, ‘mental health and crisis intervention’, ‘international activities’ and
‘animal protection’ were established later than charities with other main activities, on average (see
Table 7).
Year of establishment for Queensland operating charities
For charities which operate in Queensland, those with the main activity of ‘primary and secondary
education’ were the oldest on average (mean year of establishment = 1970). This was followed by
charities with the main activity of ‘religious activities’ (1971) and aged care activities (1981).
27 Working Paper No. 65
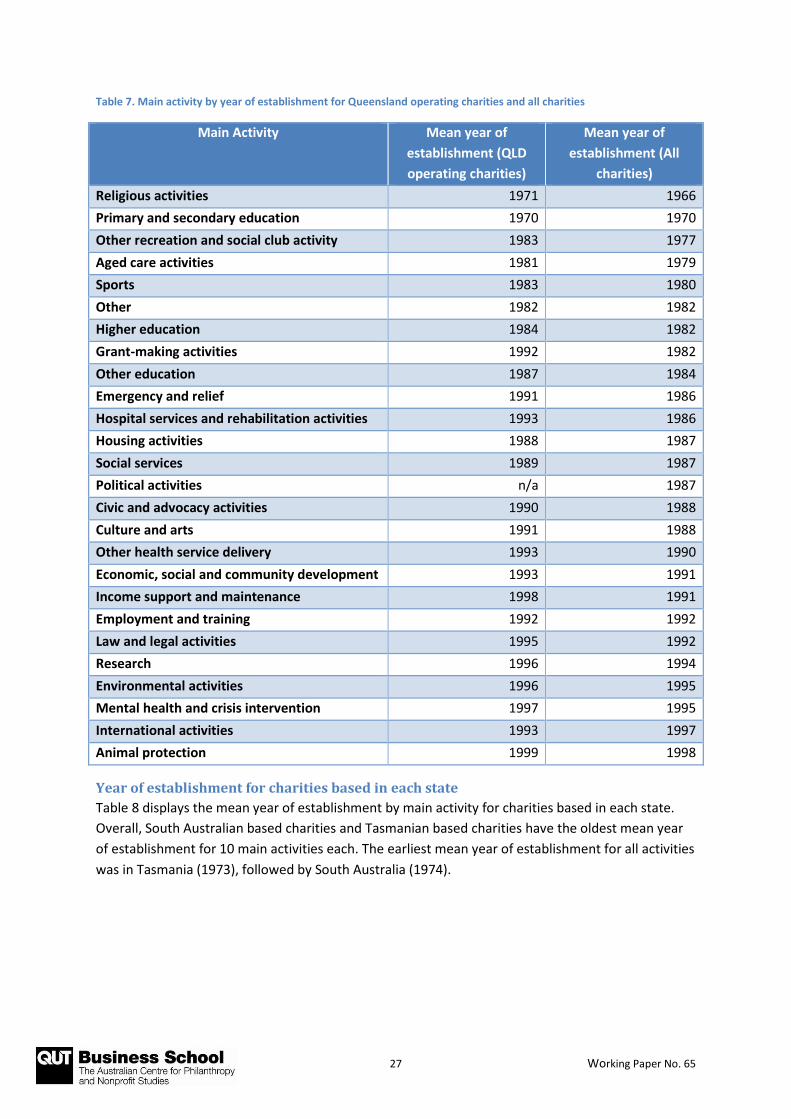
Table 7. Main activity by year of establishment for Queensland operating charities and all charities
Main Activity Mean year of
establishment (QLD
operating charities)
Mean year of
establishment (All
charities)
Religious activities 1971 1966
Primary and secondary education 1970 1970
Other recreation and social club activity 1983 1977
Aged care activities 1981 1979
Sports 1983 1980
Other 1982 1982
Higher education 1984 1982
Grant-making activities 1992 1982
Other education 1987 1984
Emergency and relief 1991 1986
Hospital services and rehabilitation activities 1993 1986
Housing activities 1988 1987
Social services 1989 1987
Political activities n/a 1987
Civic and advocacy activities 1990 1988
Culture and arts 1991 1988
Other health service delivery 1993 1990
Economic, social and community development 1993 1991
Income support and maintenance 1998 1991
Employment and training 1992 1992
Law and legal activities 1995 1992
Research 1996 1994
Environmental activities 1996 1995
Mental health and crisis intervention 1997 1995
International activities 1993 1997
Animal protection 1999 1998
Year of establishment for charities based in each state
Table 8 displays the mean year of establishment by main activity for charities based in each state.
Overall, South Australian based charities and Tasmanian based charities have the oldest mean year
of establishment for 10 main activities each. The earliest mean year of establishment for all activities
was in Tasmania (1973), followed by South Australia (1974).

28 Working Paper No. 65
Table 8. Main activity by mean year of establishment for charities based in each state/territory*
Main Activity3132
Mean year of establishment for charities based in
NSW VIC QLD SA WA TAS ACT NT
Religious activities 1967 1964 1969 1960 1970 1957 1985 1985
Primary and secondary education 1977 1961 1968 1963 1975 1961 1988 1991
Other recreation and social club
activity 1973 1975 1983 1967 1987 1973 1984 -
Aged care activities 1983 1976 1980 1973 1980 1975 1986 -
Sports 1976 1982 1980 1985 1982 1971 - -
Other 1983 1983 1980 1980 1985 1977 1985 1986
Higher education 1987 1977 1981 1979 1991 1965 1984 -
Grant-making activities 1984 1979 1993 1979 1994 1976 1986 1989
Other education 1984 1984 1985 1988 1986 1965 1990 1991
Emergency and relief 1983 1986 1991 1985 1989 1966 1992 1989
Hospital services and rehabilitation
activities 1988 1992 1989 1973 1979 1978 - -
Housing activities 1986 1989 1988 1987 1985 1980 1998 1992
Social services 1988 1984 1989 1981 1988 1971 1989 1986
Civic and advocacy activities 1991 1989 1984 1976 1988 1989 1992 1987
Culture and arts 1986 1989 1991 1980 1988 1992 1988 1997
Other health service delivery 1993 1988 1994 1989 1990 1984 1990 1990
Economic, social and community
development 1988 1993 1993 1987 1994 1980 1992 1994
Income support and maintenance 1993 1986 1997 1978 1998 - - -
Employment and training 1992 1991 1991 1986 1994 1992 2002 1996
Law and legal activities 1994 1991 1993 1992 1994 1991 1986 1992
Research 1995 1994 1995 1989 1995 1998 1996 -
Environmental activities 1995 1995 1996 1993 1997 1996 1993 1991
Mental health and crisis
intervention 1994 1993 1997 1996 1995 1995 1994 -
International activities 1996 1998 2002 1999 1998 - - -
Animal protection 2000 1998 2000 1987 2000 1996 - -
All charities 1978 1977 1978 1974 1981 1973 1988 1991
* Bold indicates oldest activity
31
The ‘Political activities’ category was removed due to the small number of charities with this as their main activity. 32
Categories with less than five charities were removed from this table.

29 Working Paper No. 65
How many people work and volunteer for Queensland charities?
Nonprofit organisations and charities in particular are usually regarded as having significant labour
inputs being the largest expenditure for those charities that employ staff. Changes in wage expenses
can impact significantly on organisations that usually cannot pass these on to clients and face either
lower quality or quantity of service provision. Those that rely on volunteers also have expenses in
managing and caring for their volunteers.
Full-time staff 8,200 Queensland operating charities reported their number of full-time staff. The mean number of
full-time staff was 20. However this was heavily skewed by several charities with a large number of
staff and the median number of full-time staff was 1, with the most common response being 0. The
largest number of full-time staff reported was 10,011. The second highest number of full-time staff
reported was 6,892. Nearly 50% of Queensland operating charities, who reported their number of
full-time staff, reported no full-time staff. In total, Queensland operating charities employ 156,429
full-time staff, with 10% of Queensland operating charities employing 92.2% of all full-time staff
working for charities. Charities resident in Queensland had a mean of 15.59 full-time staff.
Part-time staff 8,581 Queensland operating charities reported their number of part-time staff. As with full-time
staff the mean number of part-time staff (17) was affected by several charities with a large number
of staff. The median number of part-time staff was 1 and no part-time staff was the most common
response. The largest number of part-time staff reported was 7,358. The second largest was 3,497.
The total number of part-time staff employed to charities which operate in Queensland was
143,323. 10% of charities employ 89.3% of part-time staff employed by charities. Charities resident
in Queensland had a mean of 15.15 part-time staff.
The mean number of full-time staff is higher for charities operating in Queensland than the overall
mean for Australian charities, while the numbers for part-time staff are roughly equal (see Figure 4).
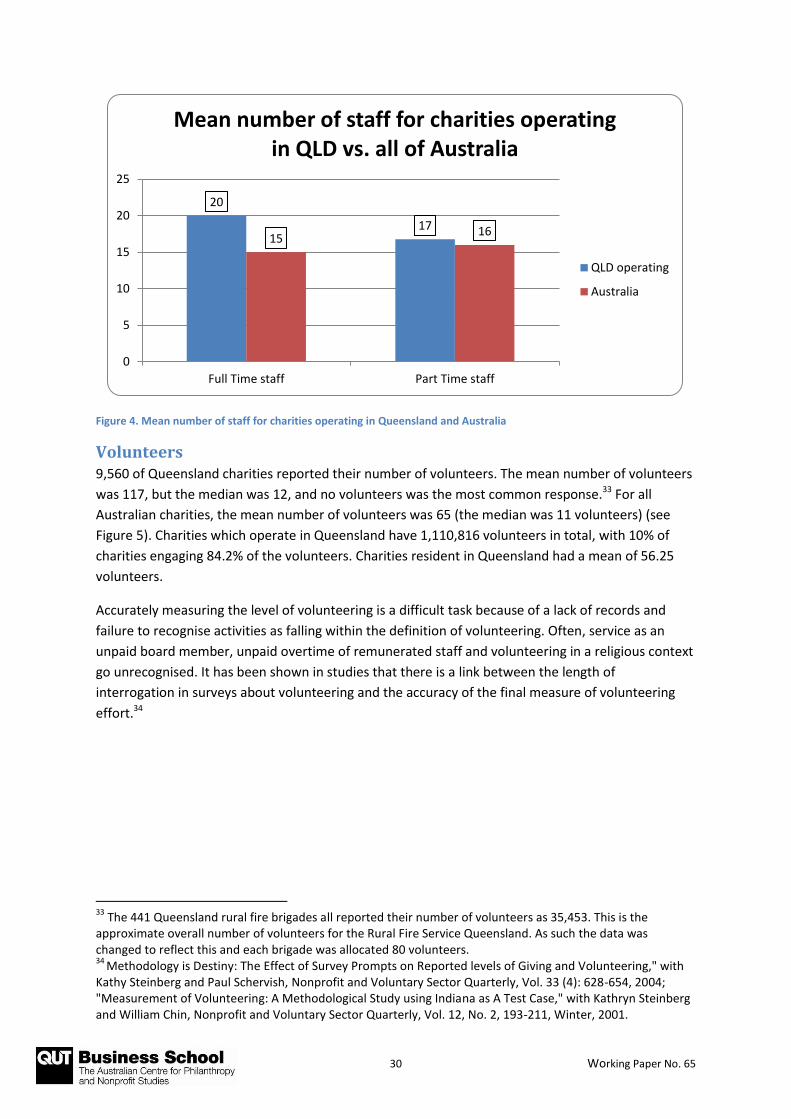
30 Working Paper No. 65
Figure 4. Mean number of staff for charities operating in Queensland and Australia
Volunteers 9,560 of Queensland charities reported their number of volunteers. The mean number of volunteers
was 117, but the median was 12, and no volunteers was the most common response.33 For all
Australian charities, the mean number of volunteers was 65 (the median was 11 volunteers) (see
Figure 5). Charities which operate in Queensland have 1,110,816 volunteers in total, with 10% of
charities engaging 84.2% of the volunteers. Charities resident in Queensland had a mean of 56.25
volunteers.
Accurately measuring the level of volunteering is a difficult task because of a lack of records and
failure to recognise activities as falling within the definition of volunteering. Often, service as an
unpaid board member, unpaid overtime of remunerated staff and volunteering in a religious context
go unrecognised. It has been shown in studies that there is a link between the length of
interrogation in surveys about volunteering and the accuracy of the final measure of volunteering
effort.34
33
The 441 Queensland rural fire brigades all reported their number of volunteers as 35,453. This is the approximate overall number of volunteers for the Rural Fire Service Queensland. As such the data was changed to reflect this and each brigade was allocated 80 volunteers. 34
Methodology is Destiny: The Effect of Survey Prompts on Reported levels of Giving and Volunteering," with Kathy Steinberg and Paul Schervish, Nonprofit and Voluntary Sector Quarterly, Vol. 33 (4): 628-654, 2004; "Measurement of Volunteering: A Methodological Study using Indiana as A Test Case," with Kathryn Steinberg and William Chin, Nonprofit and Voluntary Sector Quarterly, Vol. 12, No. 2, 193-211, Winter, 2001.
20
17 15
16
0
5
10
15
20
25
Full Time staff Part Time staff
Mean number of staff for charities operating in QLD vs. all of Australia
QLD operating
Australia

31 Working Paper No. 65
Figure 5. Number of volunteers in charities which operate in Queensland and other states
Employment and population Table 9 displays the percentage of the total Australian population who are full-time staff, part-time
staff or volunteers for charities in each state. Overall, 2% of the total Australian population are full-
time charity staff members, 2.23% are part-time charity staff members and 10.8% volunteer for
charities.
0%
5%
10%
15%
20%
25%
Number of volunteers in charities which operate in QLD and other states
QLD operating
Australia total

32 Working Paper No. 65
Table 9. Number of full-time staff, part-time staff and volunteers by state of residence and population
State
Full-time staff Part-time staff Volunteers Percent of
pop who are
either FT, PT
or volunteers
Total no.
people Mean
no. staff
Total no.
staff
% pop. who
are FT NFP
Staff
Mean
no.
staff
Total no.
staff
% pop. who
are PT NFP
Staff
Mean no.
volunteers
Total no.
volunteers
% pop. who are
NFP volunteers
NSW 14 152,252 2.03% 13 151,373 2.01% 79 1,041,464 13.85% 17.89% 7,518,472
VIC 14 116,128 1.99% 16 140,267 2.40% 67 631,949 10.82% 15.21% 5,841,667
QLD 16 94,882 2.01% 15 97,186 2.06% 56 415,089 8.79% 12.86% 4,722,447
SA 12 29,359 1.74% 17 44,401 2.63% 51 153,501 9.11% 13.48% 1,685,714
WA 15 49,679 1.93% 18 61,430 2.39% 44 176,013 6.84% 11.16% 2,573,389
TAS 9 6,971 1.35% 19 16,366 3.18% 39 36,915 7.17% 11.70% 514,762
ACT 18 12,752 3.55% 12 9,198 2.56% 83 65,496 18.24% 24.36% 358,996
NT 20 7,064 2.88% 9 3,095 1.26% 28 8,923 3.64% 7.79% 245,079
TOTAL 15 469,686 2.00% 16 523,957 2.23% 65 2,536,927 10.80% 15.03% 23,490,736
33 Working Paper No. 65
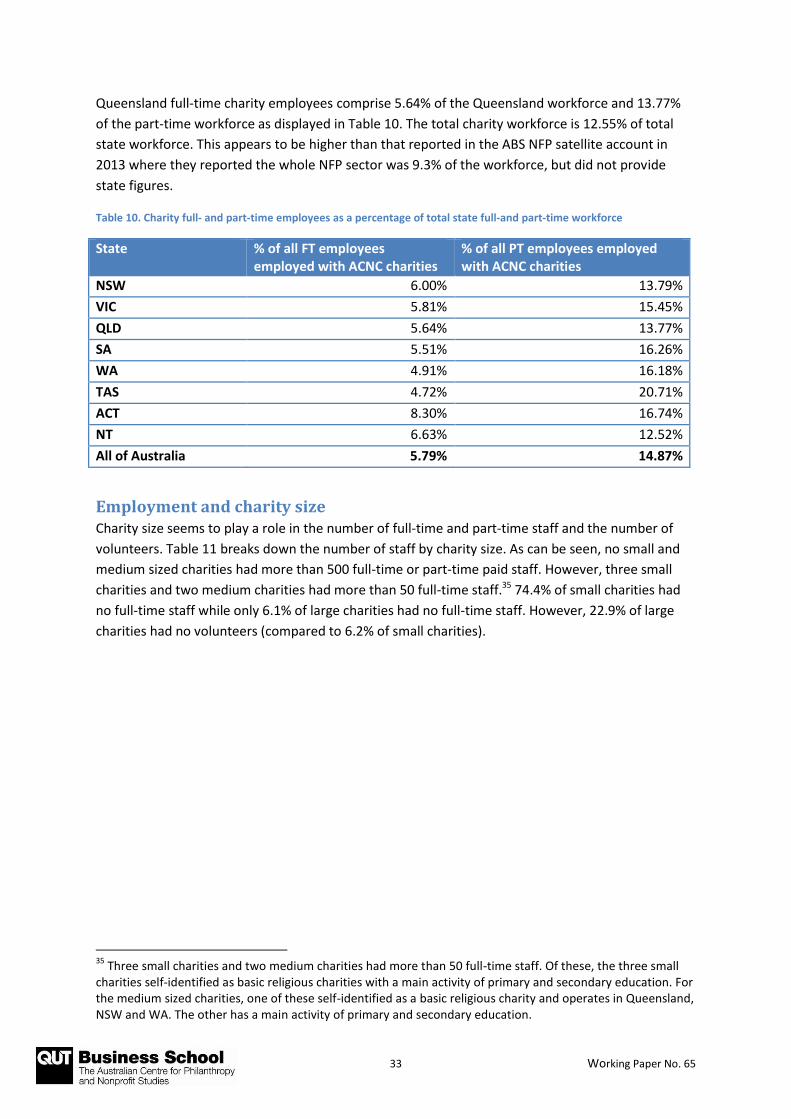
Queensland full-time charity employees comprise 5.64% of the Queensland workforce and 13.77%
of the part-time workforce as displayed in Table 10. The total charity workforce is 12.55% of total
state workforce. This appears to be higher than that reported in the ABS NFP satellite account in
2013 where they reported the whole NFP sector was 9.3% of the workforce, but did not provide
state figures.
Table 10. Charity full- and part-time employees as a percentage of total state full-and part-time workforce
State % of all FT employees employed with ACNC charities
% of all PT employees employed with ACNC charities
NSW 6.00% 13.79%
VIC 5.81% 15.45%
QLD 5.64% 13.77%
SA 5.51% 16.26%
WA 4.91% 16.18%
TAS 4.72% 20.71%
ACT 8.30% 16.74%
NT 6.63% 12.52%
All of Australia 5.79% 14.87%
Employment and charity size Charity size seems to play a role in the number of full-time and part-time staff and the number of
volunteers. Table 11 breaks down the number of staff by charity size. As can be seen, no small and
medium sized charities had more than 500 full-time or part-time paid staff. However, three small
charities and two medium charities had more than 50 full-time staff.35 74.4% of small charities had
no full-time staff while only 6.1% of large charities had no full-time staff. However, 22.9% of large
charities had no volunteers (compared to 6.2% of small charities).
35
Three small charities and two medium charities had more than 50 full-time staff. Of these, the three small charities self-identified as basic religious charities with a main activity of primary and secondary education. For the medium sized charities, one of these self-identified as a basic religious charity and operates in Queensland, NSW and WA. The other has a main activity of primary and secondary education.

34 Working Paper No. 65
Table 11. Number of staff for each Queensland operating charity by charity size
Charity Size Number of staff per charity
Number of charities
Full-time staff Part-time staff Volunteers
Number Valid
Percent Number
Valid Percent
Number Valid
Percent
Small (< $250,000)
0 3,560 74.4% 3,280 64.0% 392 6.2%
1-4 1,167 24.4% 1,601 31.2% 831 13.1%
5-9 37 0.8% 165 3.2% 1,111 17.5%
10-19 7 0.1% 57 1.1% 1,431 22.6%
20-49 11 0.2% 17 0.3% 1,260 19.9%
50-99 2 0.03% 1 0.02% 952 15.0%
100-199 1 0.01% 3 0.1% 269 4.2%
200-499 0 0.0% 1 0.02% 56 0.9%
500-999 0 0.0% 0 0.0% 20 0.3%
1000+ 0 0.0% 0 0.0% 18 0.3%
Medium ($250,000 - $999,999)
0 313 21.9% 251 16.6% 138 9.5%
1-4 933 65.4% 778 51.6% 199 13.7%
5-9 138 9.7% 311 20.6% 203 14.0%
10-19 32 2.2% 127 8.4% 228 15.7%
20-49 8 0.5% 38 2.5% 273 18.8%
50-99 2 0.1% 2 0.1% 153 10.5%
100-199 0 0.0% 2 0.1% 136 9.4%
200-499 0 0.0% 0 0.0% 86 5.9%
500-999 0 0.0% 0 0.0% 18 1.2%
1000+ 0 0.0% 0 0.0% 18 1.2%
Large (> $1,000,000)
0 115 6.1% 136 7.4% 376 22.9%
1-4 328 17.3% 439 23.8% 197 12.0%
5-9 376 19.9% 296 16.1% 183 11.1%
10-19 325 17.2% 285 15.5% 199 12.1%
20-49 330 17.4% 340 18.5% 209 12.7%
50-99 178 9.4% 164 8.9% 115 7.0%
100-199 125 6.6% 92 5.0% 130 7.9%
200-499 65 3.4% 45 2.4% 112 6.8%
500-999 28 1.5% 18 1.0% 45 2.7%
1000+ 22 1.2% 27 1.5% 76 4.6%
QLD TOTAL
0 4015 49.2% 3,693 43.2% 912 9.6%
1-4 2,444 30.0% 2,838 33.2% 1,238 13.0%
5-9 558 6.8% 779 9.1% 1,514 15.9%
10-19 367 4.5% 476 5.6% 1,879 19.8%
20-49 351 4.3% 398 4.7% 1,751 18.4%
50-99 182 2.2% 168 2.0% 1,225 12.9%
100-199 126 1.5% 97 1.1% 537 5.6%
200-499 65 0.8% 46 0.5% 257 2.7%
500-999 28 0.3% 19 0.2% 84 0.9%
1000+ 23 0.3% 27 0.3% 112 1.2%
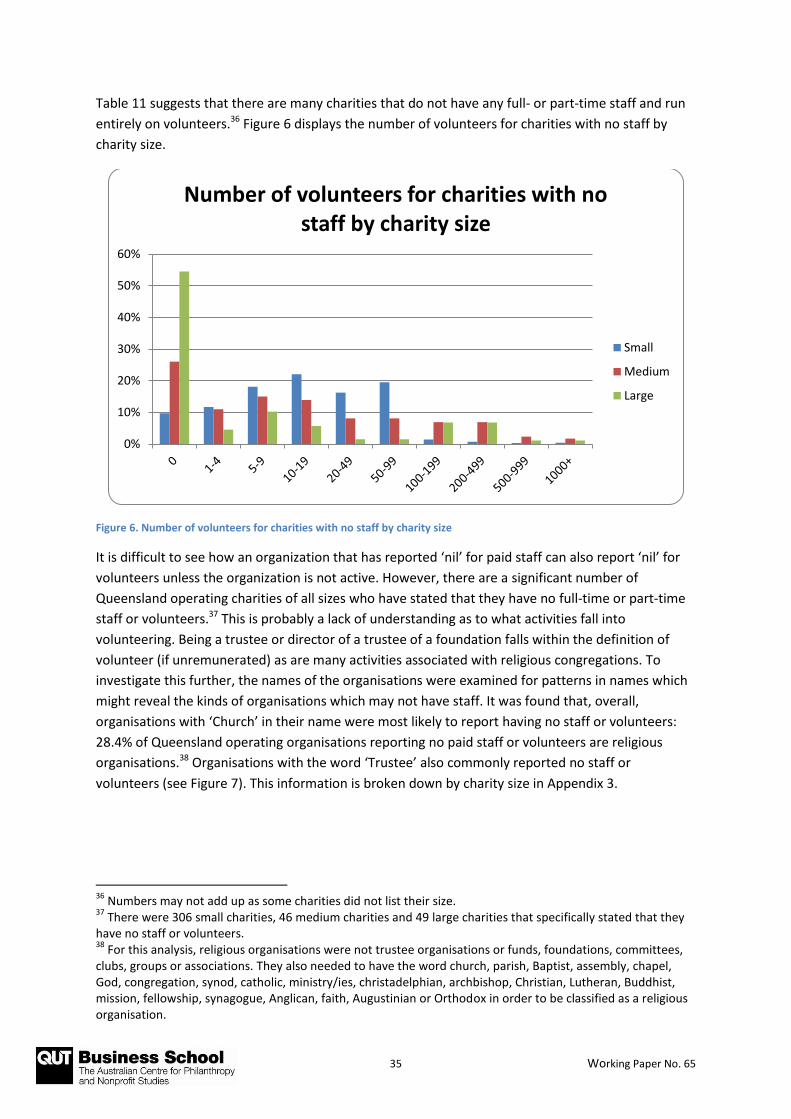
35 Working Paper No. 65
Table 11 suggests that there are many charities that do not have any full- or part-time staff and run
entirely on volunteers.36 Figure 6 displays the number of volunteers for charities with no staff by
charity size.
Figure 6. Number of volunteers for charities with no staff by charity size
It is difficult to see how an organization that has reported ‘nil’ for paid staff can also report ‘nil’ for
volunteers unless the organization is not active. However, there are a significant number of
Queensland operating charities of all sizes who have stated that they have no full-time or part-time
staff or volunteers.37 This is probably a lack of understanding as to what activities fall into
volunteering. Being a trustee or director of a trustee of a foundation falls within the definition of
volunteer (if unremunerated) as are many activities associated with religious congregations. To
investigate this further, the names of the organisations were examined for patterns in names which
might reveal the kinds of organisations which may not have staff. It was found that, overall,
organisations with ‘Church’ in their name were most likely to report having no staff or volunteers:
28.4% of Queensland operating organisations reporting no paid staff or volunteers are religious
organisations.38 Organisations with the word ‘Trustee’ also commonly reported no staff or
volunteers (see Figure 7). This information is broken down by charity size in Appendix 3.
36
Numbers may not add up as some charities did not list their size. 37
There were 306 small charities, 46 medium charities and 49 large charities that specifically stated that they have no staff or volunteers. 38
For this analysis, religious organisations were not trustee organisations or funds, foundations, committees, clubs, groups or associations. They also needed to have the word church, parish, Baptist, assembly, chapel, God, congregation, synod, catholic, ministry/ies, christadelphian, archbishop, Christian, Lutheran, Buddhist, mission, fellowship, synagogue, Anglican, faith, Augustinian or Orthodox in order to be classified as a religious organisation.
0%
10%
20%
30%
40%
50%
60%
Number of volunteers for charities with no staff by charity size
Small
Medium
Large

36 Working Paper No. 65
Figure 7. Type of organisations for Queensland operating charities which reported no staff or volunteers
0%
5%
10%
15%
20%
25%
30%
Type of organisations for QLD operating charities who reported no staff or volunteers
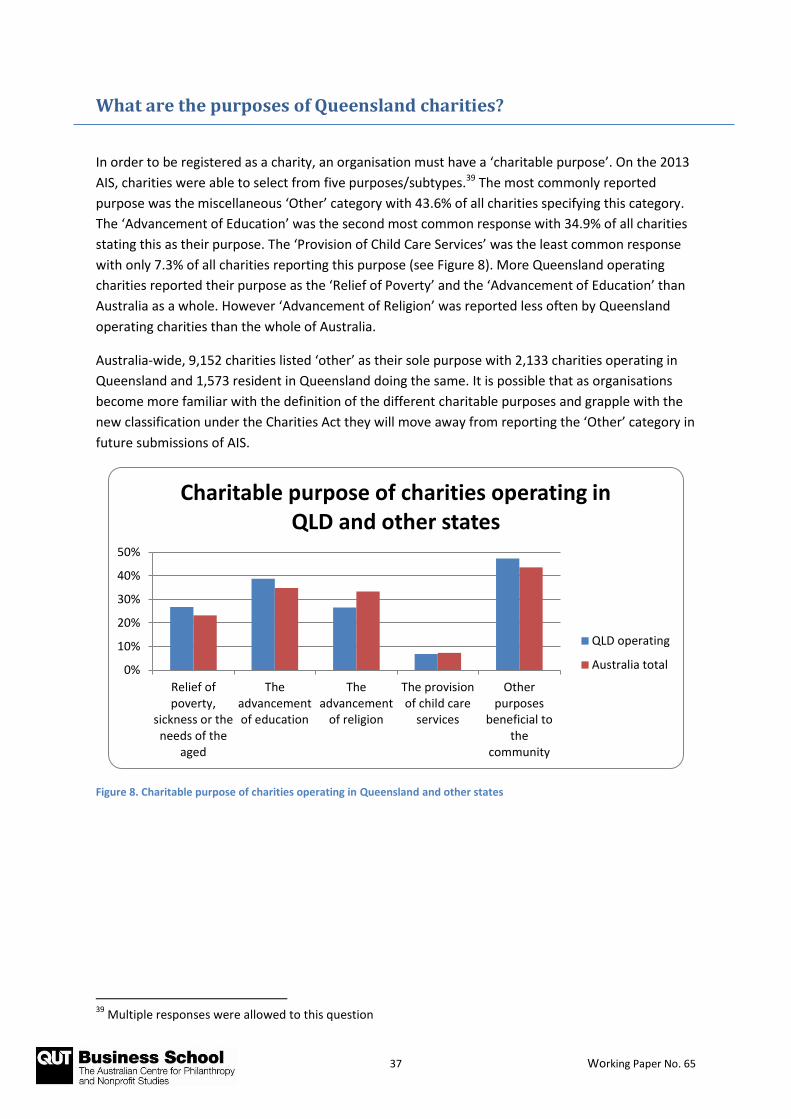
37 Working Paper No. 65
What are the purposes of Queensland charities?
In order to be registered as a charity, an organisation must have a ‘charitable purpose’. On the 2013
AIS, charities were able to select from five purposes/subtypes.39 The most commonly reported
purpose was the miscellaneous ‘Other’ category with 43.6% of all charities specifying this category.
The ‘Advancement of Education’ was the second most common response with 34.9% of all charities
stating this as their purpose. The ‘Provision of Child Care Services’ was the least common response
with only 7.3% of all charities reporting this purpose (see Figure 8). More Queensland operating
charities reported their purpose as the ‘Relief of Poverty’ and the ‘Advancement of Education’ than
Australia as a whole. However ‘Advancement of Religion’ was reported less often by Queensland
operating charities than the whole of Australia.
Australia-wide, 9,152 charities listed ‘other’ as their sole purpose with 2,133 charities operating in
Queensland and 1,573 resident in Queensland doing the same. It is possible that as organisations
become more familiar with the definition of the different charitable purposes and grapple with the
new classification under the Charities Act they will move away from reporting the ‘Other’ category in
future submissions of AIS.
Figure 8. Charitable purpose of charities operating in Queensland and other states
39
Multiple responses were allowed to this question
0%
10%
20%
30%
40%
50%
Relief ofpoverty,
sickness or theneeds of the
aged
Theadvancementof education
Theadvancement
of religion
The provisionof child care
services
Otherpurposes
beneficial tothe
community
Charitable purpose of charities operating in QLD and other states
QLD operating
Australia total

38 Working Paper No. 65
Charitable purpose by state of residence Table 12 shows the number of people per charity by charitable purpose for charities based in each
state. Apart from charities with other purposes, charities with the purpose to advance education had
the lowest ratio of people to each charity indicating that there is one charity with this purpose per
1,519 people. Charities which advance religion are also strongly represented with one charity to
1,586 people. While charities with the main purpose to provide child care services were under-
represented, with one charity to every 7,223 people, this was especially poor in Western Australia
where there is one charity with this purpose for every 11,540 people. Queensland has above average
ratios of people per charity for every charitable purpose except the relief of poverty, sickness or the
needs of the aged, where there is one charity per 2,247 people, slightly less than the Australian
average of one charity per 2,287 people. Overall, the ratio in Queensland is one charity for every 589
people (the second worst ratio in the country behind the Northern Territory). Interestingly, the ACT
has the best ratio of people per charity, with one charity for every 389 people.

39 Working Paper No. 65
Table 12. Charitable purpose by state of residence
State
Relief of poverty,
sickness or the
needs of the aged
Advancement of
education
Advancement of
religion
Provision of child
care services
Other purposes
beneficial to the
community Total no.
charities
Total no.
people
Total
no.
people
per
charity
No.
charities
No.
people
per
charity
No.
charities
No.
people
per
charity
No.
charities
No.
people
per
charity
No.
Charities
No.
people
per
charity
No.
charities
No.
people
per
charity
NSW 2,977 2,526 5,055 1,487 5,146 1,461 1,200 6,265 5,933 1,267 14,616 7,518,472 514
VIC 2,630 2,221 3,888 1,502 3,721 1,570 821 7,115 5,146 1,135 11,165 5,841,667 523
QLD 2,102 2,247 3,026 1,561 2,201 2,146 619 7,629 3,562 1,326 8,020 4,722,447 589
SA 873 1,931 1,047 1,610 1,377 1,224 201 8,387 1,398 1,206 3,413 1,685,714 494
WA 1012 2,543 1,496 1,720 1,522 1,691 223 11,540 2,000 1,287 4,439 2,573,389 580
TAS 299 1,722 362 1,422 425 1,211 70 7,354 538 957 1,221 514,762 422
ACT 196 1,832 394 911 293 1,225 73 4,918 418 859 923 358,996 389
NT 135 1,815 145 1,690 85 2,883 39 6,284 255 961 404 245,079 607
TOTAL 10,271 2,287 15,469 1,519 14,814 1,586 3,252 7,223 19,329 1,215 43,563 23,490,736 539

40 Working Paper No. 65
Charitable purpose and charity size Overall, large charities tended to report more charitable purposes than small or medium sized
charities. The exception to this was in the advancement of religion. While 31.1% of small charities
stated this as a purpose, only 13.8% of large charities did. Medium sized charities reported the
provision of child care services more than small and large charities with 12.9% of medium sized
charities reporting this purpose (see Figure 9). Appendix 4 details the number of people per
charitable purpose by charity size for charities based in each state.
Figure 9. Charitable purpose and charity size for Queensland operating charities
0%
10%
20%
30%
40%
50%
60%
Relief ofpoverty,
sickness or theneeds of the
aged
Theadvancement of
education
Theadvancement of
religion
The provision ofchild careservices
Other purposesbeneficial to the
community
Charitable purpose and charity size for QLD operating charities
Small
Medium
Large
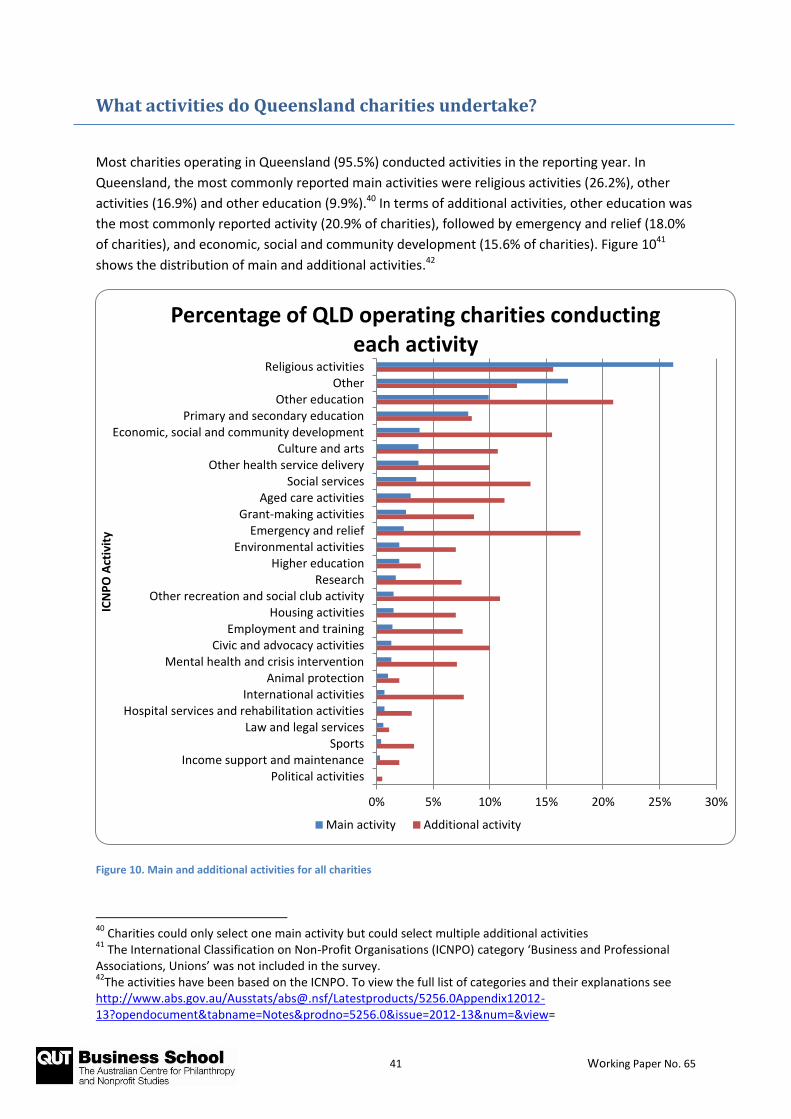
41 Working Paper No. 65
What activities do Queensland charities undertake?
Most charities operating in Queensland (95.5%) conducted activities in the reporting year. In
Queensland, the most commonly reported main activities were religious activities (26.2%), other
activities (16.9%) and other education (9.9%).40 In terms of additional activities, other education was
the most commonly reported activity (20.9% of charities), followed by emergency and relief (18.0%
of charities), and economic, social and community development (15.6% of charities). Figure 1041
shows the distribution of main and additional activities.42
Figure 10. Main and additional activities for all charities
40
Charities could only select one main activity but could select multiple additional activities 41
The International Classification on Non-Profit Organisations (ICNPO) category ‘Business and Professional Associations, Unions’ was not included in the survey. 42
The activities have been based on the ICNPO. To view the full list of categories and their explanations see http://www.abs.gov.au/Ausstats/[email protected]/Latestproducts/5256.0Appendix12012-13?opendocument&tabname=Notes&prodno=5256.0&issue=2012-13&num=&view=
0% 5% 10% 15% 20% 25% 30%
Political activitiesIncome support and maintenance
SportsLaw and legal services
Hospital services and rehabilitation activitiesInternational activities
Animal protectionMental health and crisis intervention
Civic and advocacy activitiesEmployment and training
Housing activitiesOther recreation and social club activity
ResearchHigher education
Environmental activitiesEmergency and relief
Grant-making activitiesAged care activities
Social servicesOther health service delivery
Culture and artsEconomic, social and community development
Primary and secondary educationOther education
OtherReligious activities
ICN
PO
Act
ivit
y
Percentage of QLD operating charities conducting each activity
Main activity Additional activity
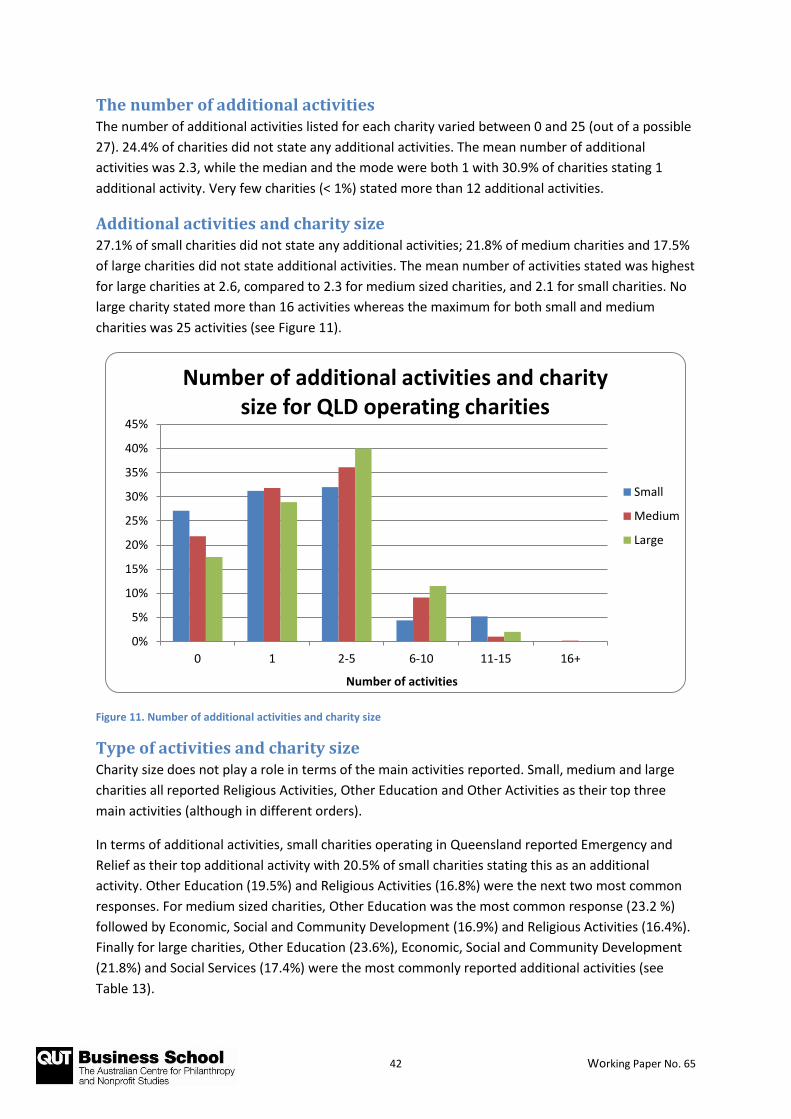
42 Working Paper No. 65
The number of additional activities The number of additional activities listed for each charity varied between 0 and 25 (out of a possible
27). 24.4% of charities did not state any additional activities. The mean number of additional
activities was 2.3, while the median and the mode were both 1 with 30.9% of charities stating 1
additional activity. Very few charities (< 1%) stated more than 12 additional activities.
Additional activities and charity size 27.1% of small charities did not state any additional activities; 21.8% of medium charities and 17.5%
of large charities did not state additional activities. The mean number of activities stated was highest
for large charities at 2.6, compared to 2.3 for medium sized charities, and 2.1 for small charities. No
large charity stated more than 16 activities whereas the maximum for both small and medium
charities was 25 activities (see Figure 11).
Figure 11. Number of additional activities and charity size
Type of activities and charity size Charity size does not play a role in terms of the main activities reported. Small, medium and large
charities all reported Religious Activities, Other Education and Other Activities as their top three
main activities (although in different orders).
In terms of additional activities, small charities operating in Queensland reported Emergency and
Relief as their top additional activity with 20.5% of small charities stating this as an additional
activity. Other Education (19.5%) and Religious Activities (16.8%) were the next two most common
responses. For medium sized charities, Other Education was the most common response (23.2 %)
followed by Economic, Social and Community Development (16.9%) and Religious Activities (16.4%).
Finally for large charities, Other Education (23.6%), Economic, Social and Community Development
(21.8%) and Social Services (17.4%) were the most commonly reported additional activities (see
Table 13).
0%
5%
10%
15%
20%
25%
30%
35%
40%
45%
0 1 2-5 6-10 11-15 16+
Number of activities
Number of additional activities and charity size for QLD operating charities
Small
Medium
Large

43 Working Paper No. 65
Table 13. Main and additional activities by charity size for Queensland operating charities
Activity Main activity Additional Activities
Charity Size Charity Size
Small Medium Large Total Small Medium Large Total
Culture and arts 2.8% 4.0% 3.3% 3.1% 11.7% 9.2% 8.7% 10.7%
Sports 0.4% 0.2% 0.1% 0.3% 3.0% 3.6% 3.4% 3.2%
Other recreation and social
club activity
1.6% 0.7% 0.4% 1.3% 13.1% 8.6% 5.7% 10.9%
Primary and secondary
education
6.7% 4.7% 8.7% 6.8% 7.9% 8.3% 9.3% 8.3%
Higher education 1.0% 1.7% 3.9% 1.7% 2.4% 4.6% 8.1% 3.9%
Other education 6.8% 13.3% 8.5% 8.2% 19.5% 23.2 % 23.6% 20.9%
Research 1.0% 1.0% 3.3% 1.4% 4.8% 9.2% 15.5% 7.5%
Hospital services and
rehabilitation activities
0.4% 0.8% 1.3% 0.6% 2.4% 4.0% 4.5% 3.0%
Aged care activities 1.7% 2.9% 5.2% 2.5% 11.6% 8.8% 12.6% 11.3%
Mental health and crisis
intervention
0.7% 1.4% 1.9% 1.1% 5.3% 8.6% 12.4% 7.1%
Other health service delivery 1.8% 3.6% 6.9% 3.1% 9.1% 8.8% 14.8% 10.0%
Social services 1.8% 4.0% 6.2% 2.9% 12.3% 14.6% 17.4% 13.6%
Emergency and relief 2.2% 1.8% 1.6% 2.0% 20.4% 14.6% 13.6% 18.1%
Income support and
maintenance
0.3% 0.1% 0.1% 0.2% 1.6% 2.7% 2.7% 2.0%
Environmental activities 1.3% 2.1% 2.6% 1.7% 7.9% 5.2% 6.1% 7.1%
Animal protection 1.0% 0.6% 0.5% 0.8% 2.1% 1.9% 1.5% 1.9%
Economic, social and
community development
2.5% 4.5% 4.5% 3.2% 13.5% 16.9% 21.8% 15.6%
Housing activities 0.5% 3.1% 2.0% 1.2% 6.6% 6.5% 9.6% 7.1%
Employment and training 0.3% 1.2% 4.1% 1.2% 4.0% 10.8% 16.9% 7.5%
Civic and advocacy activities 1.0% 1.4% 1.2% 1.1% 10.0% 10.1% 10.6% 10.1%
Law and legal services 0.2% 1.0% 0.7% 0.5% 0.8% 2.4% 1.2% 1.1%
Political activities 0.0% 0.0% 0.0% 0.0% 0.5% 0.8% 0.6% 0.5%
Grant-making activities 2.1% 2.7% 2.1% 2.2% 9.3% 7.4% 7.8% 8.7%
International activities 0.3% 0.8% 1.1% 0.5% 8.3% 6.1% 7.3% 7.7%
Religious activities 26.1% 20.0% 9.5% 22.0% 16.8% 16.4% 10.5% 15.5%
Other 15.9% 11.1% 11.1% 14.2% 10.7% 14.5% 15.9% 12.4%
None 19.3% 11.3% 9.2% 16.0% 27.1% 21.6% 17.5% 24.4%
Total Number of Charities 6529 1656 1900 10154 6529 1656 1900 10154

44 Working Paper No. 65
Appendix 5 shows the distribution of small, medium and large charities by their main activity for
charities based in each of the states. The percentage of all charities with each main activity can be
seen in Table 14, along with a breakdown by charity size: 25.6% of all Australian charities listed
religious activities as their main activity. Education was the second most common main activity with
15.4% of all charities listing either primary and secondary education, higher education or other
education. Over 18% of all charities did not list a main activity, while 9.1% listed ‘other’.
Table 14. Main activity of all charities by charity size
Main Activity
TOTAL
Charity Size
Small Medium Large Total
Animal protection 0.8% 0.5% 0.4% 0.7%
Aged care activities 1.3% 3.4% 8.4% 2.8%
Civic and advocacy activities 0.6% 1.1% 0.7% 0.7%
Culture and arts 3.3% 4.1% 2.7% 3.4%
Economic, social and community
development 2.8% 4.8% 3.6% 3.2%
Emergency and relief 3.1% 1.7% 1.0% 2.5%
Employment and training 0.3% 1.4% 3.4% 1.0%
Environmental activities 1.4% 1.6% 1.4% 1.4%
Grant-making activities 5.1% 2.6% 1.7% 4.2%
Higher education 0.8% 1.2% 2.6% 1.2%
Hospital services and rehabilitation
activities 0.5% 0.5% 1.2% 0.6%
Housing activities 0.9% 2.8% 2.4% 1.5%
Income support and maintenance 0.3% 0.2% 0.1% 0.2%
International activities 0.5% 0.6% 0.6% 0.5%
Law and legal services 0.1% 1.2% 0.9% 0.4%
Mental health and crisis intervention 0.6% 1.1% 1.3% 0.8%
Primary and secondary education 5.0% 3.4% 19.5% 7.2%
Religious activities 30.4% 24.0% 7.7% 25.6%
Research 0.6% 1.0% 1.8% 0.9%
Social Services 1.7% 4.0% 6.2% 2.8%
Sports 0.4% 0.3% 0.2% 0.3%
Other education 5.8% 12.1% 7.0% 7.0%
Other health service delivery 1.5% 2.7% 6.2% 2.4%
Other recreation and social club activity 1.4% 0.8% 0.3% 1.1%
Other 9.0% 9.6% 9.1% 9.1%
None 21.9% 13.3% 9.5% 18.5%
Total Number of Charities 30,099 6,663 7,302 44,352
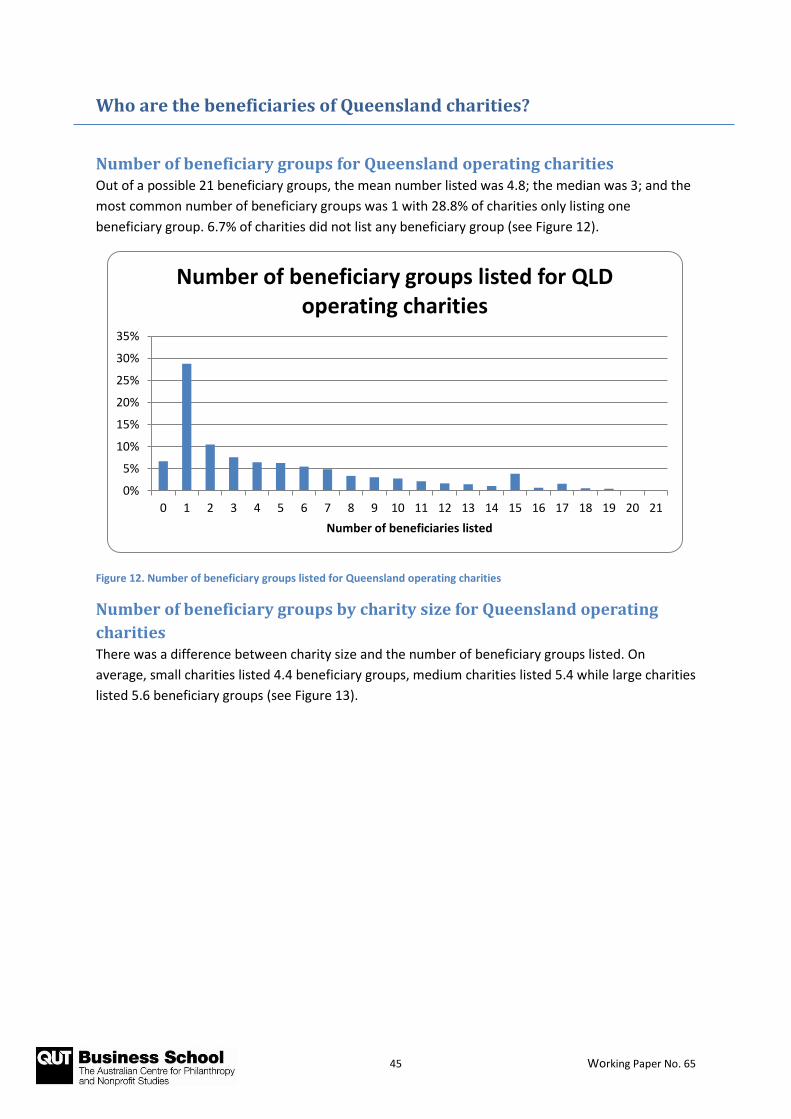
45 Working Paper No. 65
Who are the beneficiaries of Queensland charities?
Number of beneficiary groups for Queensland operating charities Out of a possible 21 beneficiary groups, the mean number listed was 4.8; the median was 3; and the
most common number of beneficiary groups was 1 with 28.8% of charities only listing one
beneficiary group. 6.7% of charities did not list any beneficiary group (see Figure 12).
Figure 12. Number of beneficiary groups listed for Queensland operating charities
Number of beneficiary groups by charity size for Queensland operating
charities There was a difference between charity size and the number of beneficiary groups listed. On
average, small charities listed 4.4 beneficiary groups, medium charities listed 5.4 while large charities
listed 5.6 beneficiary groups (see Figure 13).
0%
5%
10%
15%
20%
25%
30%
35%
0 1 2 3 4 5 6 7 8 9 10 11 12 13 14 15 16 17 18 19 20 21
Number of beneficiaries listed
Number of beneficiary groups listed for QLD operating charities

46 Working Paper No. 65
Figure 13. Number of beneficiary groups and charity size for Queensland operating charities
Type of beneficiaries for Queensland operating charities The general community in Australia was the most commonly reported beneficiary overall with 53.8%
of charities operating in Queensland specifying this category. Other major beneficiaries included
children (51.5 %), youth (42.3%), women (37.6%) and men (33.3%) (see Figure 14).
For charities Australia-wide, the most commonly reported beneficiary group was children with 49.8%
of all charities specifying this category. The general community in Australia was the second most
reported beneficiary (45.6%), followed by youth (36.8%) and women (32.2%).
0%
5%
10%
15%
20%
25%
30%
35%
40%
0 1 2-5 6-10 11-15 16-21
Number of beneficiaries listed
Number of beneficiary groups and charity size for QLD operating charities
Small
Medium
Large

47 Working Paper No. 65
Figure 14. Type of beneficiaries for charities operating in Queensland and all of Australia
Type of beneficiaries and charity size for Queensland operating charities The general community in Australia, children and youth were the top three listed beneficiaries for
small, medium and large charities (although in different orders). Differences did emerge between
charity sizes in terms of the fourth and fifth most common beneficiaries listed. For small charities,
women and men were the fourth and fifth most common beneficiary groups; for medium charities,
women and Aboriginal or Torres Strait Islanders were fourth and fifth most commonly nominated;
while for large charities, Aboriginal or Torres Strait Islanders and people with disabilities were the
fourth and fifth most commonly nominated (see Figure 15).
0% 10% 20% 30% 40% 50% 60%
Communities overseas
Victims of crime
Pre- Post- release offenders
Other beneficiaries not listed
Veterans or their families
Gay, lesbian, bisexual and intersex persons
Migrants, refugees or asylum seekers
Victims of disasters
Unemployed persons
People at risk of homelessness
Ethnic groups
People with chronic illness
Other charities
People with disabilities
Aboriginal or Torres Strait Islander
Aged Persons
Men
Women
Youth
Children
General community in Australia
Type of beneficiaries for charities operating in QLD vs. all of Australia
QLD only Australia
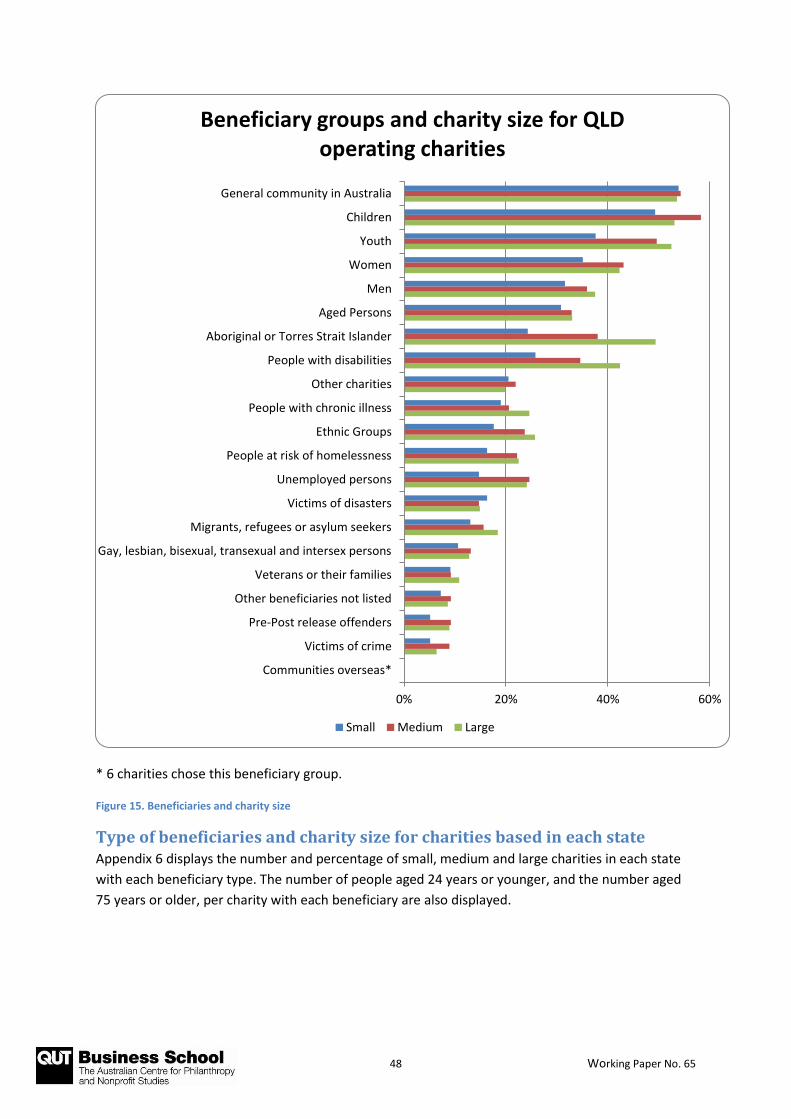
48 Working Paper No. 65
* 6 charities chose this beneficiary group.
Figure 15. Beneficiaries and charity size
Type of beneficiaries and charity size for charities based in each state Appendix 6 displays the number and percentage of small, medium and large charities in each state
with each beneficiary type. The number of people aged 24 years or younger, and the number aged
75 years or older, per charity with each beneficiary are also displayed.
0% 20% 40% 60%
Communities overseas*
Victims of crime
Pre-Post release offenders
Other beneficiaries not listed
Veterans or their families
Gay, lesbian, bisexual, transexual and intersex persons
Migrants, refugees or asylum seekers
Victims of disasters
Unemployed persons
People at risk of homelessness
Ethnic Groups
People with chronic illness
Other charities
People with disabilities
Aboriginal or Torres Strait Islander
Aged Persons
Men
Women
Youth
Children
General community in Australia
Beneficiary groups and charity size for QLD operating charities
Small Medium Large
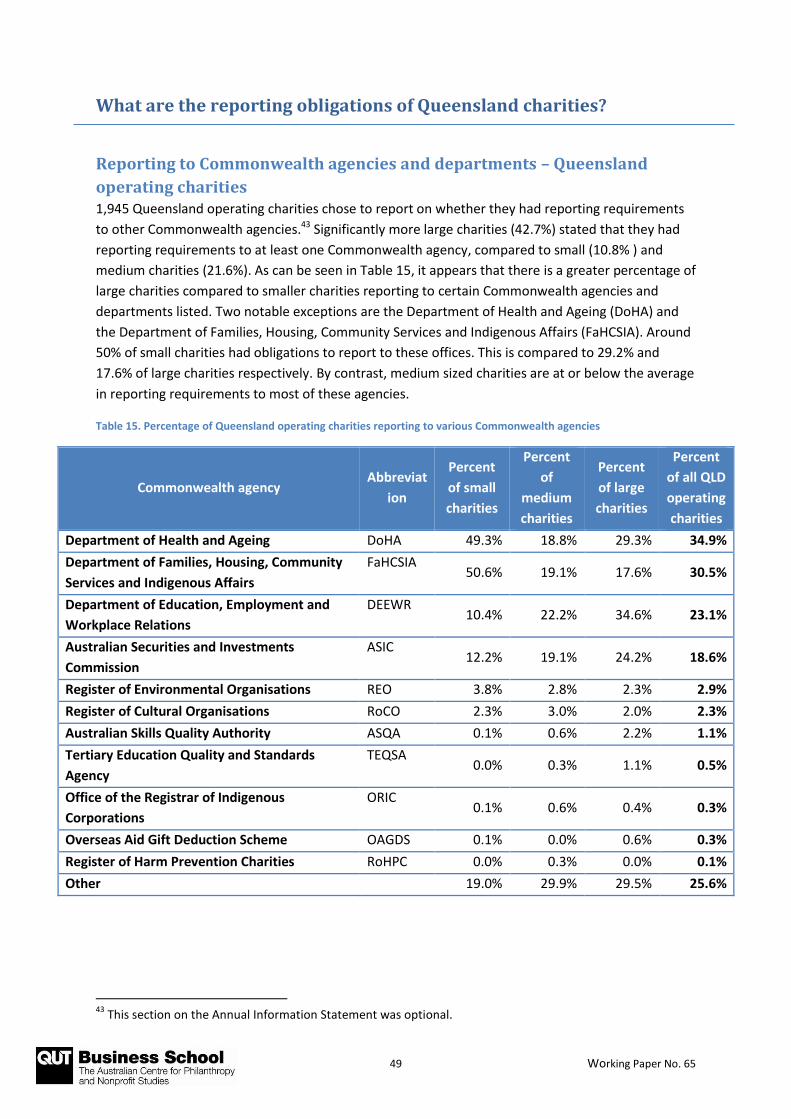
49 Working Paper No. 65
What are the reporting obligations of Queensland charities?
Reporting to Commonwealth agencies and departments – Queensland
operating charities 1,945 Queensland operating charities chose to report on whether they had reporting requirements
to other Commonwealth agencies.43 Significantly more large charities (42.7%) stated that they had
reporting requirements to at least one Commonwealth agency, compared to small (10.8% ) and
medium charities (21.6%). As can be seen in Table 15, it appears that there is a greater percentage of
large charities compared to smaller charities reporting to certain Commonwealth agencies and
departments listed. Two notable exceptions are the Department of Health and Ageing (DoHA) and
the Department of Families, Housing, Community Services and Indigenous Affairs (FaHCSIA). Around
50% of small charities had obligations to report to these offices. This is compared to 29.2% and
17.6% of large charities respectively. By contrast, medium sized charities are at or below the average
in reporting requirements to most of these agencies.
Table 15. Percentage of Queensland operating charities reporting to various Commonwealth agencies
Commonwealth agency Abbreviat
ion
Percent
of small
charities
Percent
of
medium
charities
Percent
of large
charities
Percent
of all QLD
operating
charities
Department of Health and Ageing DoHA 49.3% 18.8% 29.3% 34.9%
Department of Families, Housing, Community
Services and Indigenous Affairs
FaHCSIA 50.6% 19.1% 17.6% 30.5%
Department of Education, Employment and
Workplace Relations
DEEWR 10.4% 22.2% 34.6% 23.1%
Australian Securities and Investments
Commission
ASIC 12.2% 19.1% 24.2% 18.6%
Register of Environmental Organisations REO 3.8% 2.8% 2.3% 2.9%
Register of Cultural Organisations RoCO 2.3% 3.0% 2.0% 2.3%
Australian Skills Quality Authority ASQA 0.1% 0.6% 2.2% 1.1%
Tertiary Education Quality and Standards
Agency
TEQSA 0.0% 0.3% 1.1% 0.5%
Office of the Registrar of Indigenous
Corporations
ORIC 0.1% 0.6% 0.4% 0.3%
Overseas Aid Gift Deduction Scheme OAGDS 0.1% 0.0% 0.6% 0.3%
Register of Harm Prevention Charities RoHPC 0.0% 0.3% 0.0% 0.1%
Other 19.0% 29.9% 29.5% 25.6%
43
This section on the Annual Information Statement was optional.

50 Working Paper No. 65
Reporting to other states and territories Duplicative reporting to state regulators is a common complaint made in the context of the red tape
debate. Gaining a sense of charities’ actual reporting behaviours, rather than what they might be
required to do pursuant to legislation (which is policed inadequately) is instructive.
Figure 16. Percent of charities who operate in each state and have reporting obligations to that state
Figure 16 shows the percentage of all charities that operate in each state and have reporting
obligations in that state. Overall, around 18% of charities which operate in the different states have
reporting obligations in that state. Queensland however is the highest with 27.7% of Queensland
operating charities having reporting obligations in Queensland. It is not apparent why this might be
the case and further research is needed on this issue.44 The Northern Territory has the lowest
percentage of operating charities having reporting obligations in the Territory (12.2%), which may
reflect the lack of fundraising legislation in the Northern Territory.
In terms of charities with reporting obligations outside their state of residence, the ACT not
surprisingly has the highest percentage with 4.6% of ACT resident charities having reporting
obligations in other states (see Figure 17). Only 21.2% of ACT resident charities do not operate in
other states and territories compared to over 70% of charities resident in NSW, VIC and Queensland.
44
Two possible explanations for the increased reporting obligations in Queensland are that there is a large percentage of Queensland operating charities which do not operate in other states (71.7%) or that there is a large percentage of Queensland operating charities that are resident in Queensland. However, neither of these appears to explain the greater reporting burden of Queensland operating charities as both New South Wales and Victoria have a greater percentage of operating charities resident in their state and a greater percentage of operating charities that do not operate in other states. Further research is needed to explain this increased reporting burden on Queensland operating charities.
19.7% 21.0%
27.7%
15.0%
17.8%
15.0% 14.0%
12.2%
0%
5%
10%
15%
20%
25%
30%
NSW VIC QLD SA WA TAS ACT NT
Percentage of all charities who operate in each state and have reporting obligations to
that state
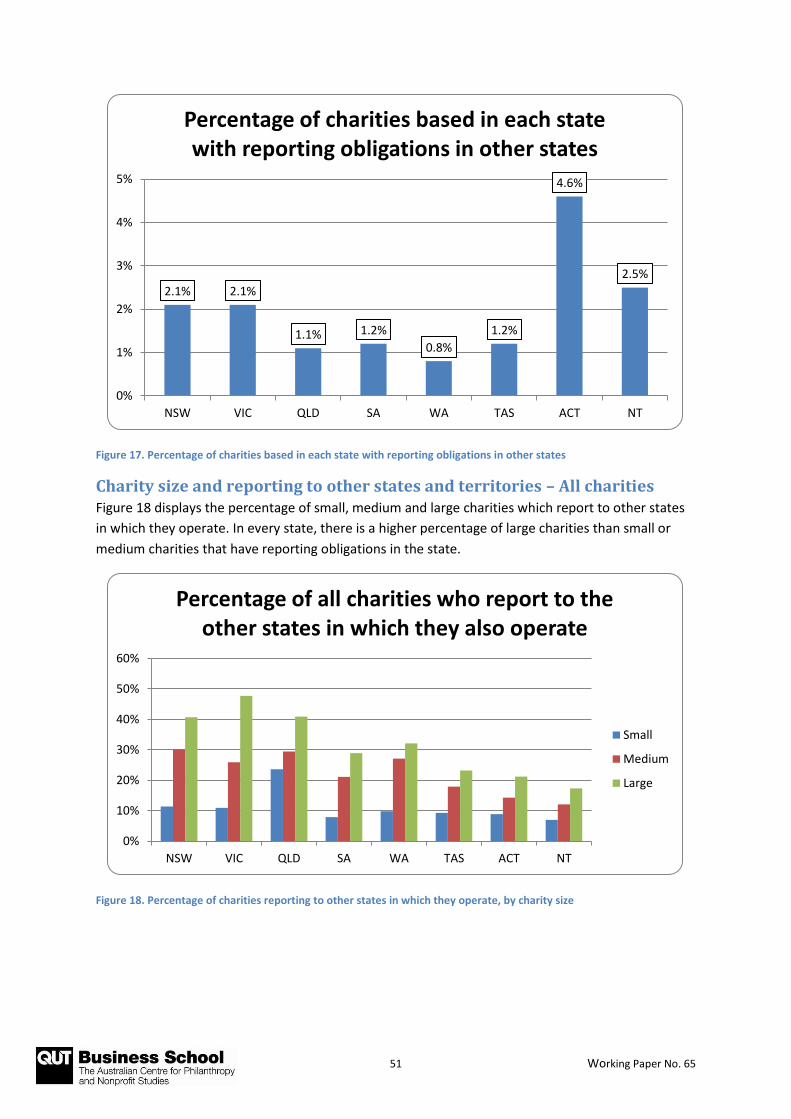
51 Working Paper No. 65
Figure 17. Percentage of charities based in each state with reporting obligations in other states
Charity size and reporting to other states and territories – All charities Figure 18 displays the percentage of small, medium and large charities which report to other states
in which they operate. In every state, there is a higher percentage of large charities than small or
medium charities that have reporting obligations in the state.
Figure 18. Percentage of charities reporting to other states in which they operate, by charity size
2.1% 2.1%
1.1% 1.2%
0.8%
1.2%
4.6%
2.5%
0%
1%
2%
3%
4%
5%
NSW VIC QLD SA WA TAS ACT NT
Percentage of charities based in each state with reporting obligations in other states
0%
10%
20%
30%
40%
50%
60%
NSW VIC QLD SA WA TAS ACT NT
Percentage of all charities who report to the other states in which they also operate
Small
Medium
Large

52 Working Paper No. 65
Figure 19. Mean number of reporting hours by charity size for Queensland operating charities
Figure 20. Mean number of reporting hours for charities based in each state
Figure 19 displays the mean number of hours spent completing reporting obligations by Queensland
charities (192.89 hours). Small charities report a mean of 52.78 hours, medium charities report
134.68 and large charities report 588.99 hours spent completing government reporting
requirements. In comparison with other states, Queensland is in the middle of the range for time
spent on reporting obligations, with the Northern Territory reporting over 444 hours spent and
South Australian just over 86 hours.
The Ernst & Young (EY) report commissioned by the ACNC in 2014 to examine charity compliance
burden found that:
52.78
134.68
588.99
192.89
0
100
200
300
400
500
600
700
Small Medium Large All QLD operatingcharities
Mean total number of reporting hours by charity size for QLD operating charities
0
50
100
150
200
250
300
350
400
450
500
NSW VIC QLD SA WA TAS ACT NT
Mean number of reporting hours for charities based in each state

53 Working Paper No. 65
Using the Business Cost Calculator (BCC), we estimate that the average Commonwealth
burden imposed on the case study charities over the past 12 months of operations is
$108,000. The average Commonwealth burden was smaller for small charities ($18,000) and
larger for large charities ($235,000).45
They also noted, regarding time estimates for all reporting (including corporate reports), that:
69 per cent of respondents indicated that they spend less than five hours in an average week
on meeting Commonwealth regulatory and reporting obligations only, while 23 per cent
stated that they spend between five and 30 hours, and 9 per cent stated that they spend 30
hours or more.46
On the AIS data, 88.1% spent on average less than five hours a week on reporting obligations; 9.5%
spent between five and 30 hours a week and 2.4% spent more than 30 hours a week. Part of the
discrepancy between the EY report and the AIS data may be explained by the methods used (e.g.,
style of survey, who completes the survey and attitude towards the regulator) which can cause
significant variations in results.47 This is something which warrants an agreed and definitive research
agenda to settle the issue and provide accurate data to guide policy makers.
45
Ernst & Young, Research into Commonwealth Regulatory and Reporting Burdens on the Charity Sector: A report prepared for the Australian Charities and Not-for-profits Commission, 30 September 2014 available at http://www.acnc.gov.au/ACNC/Pblctns/Rpts/ACNC/Publications/Rpt_LP.aspx?hkey=1340fa63-7895-4b9f-b57b-4e171ad4e7fd, p 6. 46
Ibid, p 38. 47
Ryan, Christine M., Newton, Cameron J., & McGregor-Lowndes, Myles (2008) How Long Is A Piece of Red Tape? The Paperwork Reporting Cost of Government Grants, CPNS Working Paper No. 39 available at http://eprints.qut.edu.au/12986/

54 Working Paper No. 65
How many Queensland charities operate overseas and where do they
operate?
449 or 5.6 % of Queensland resident charities specified at least one country outside Australia that
they operate in.48 This compares to a total of 2,207 charities (6.1%) Australia-wide that indicated
they were involved overseas with nearly 2% being active in more than one country. For charities
resident in Queensland, the Philippines and India were the most commonly reported overseas
countries with 13.4% of Queensland resident charities operating overseas specifying these countries.
Papua New Guinea was the third most commonly reported (12.7%), followed by New Zealand (9.6%)
(see Appendix 7)
1,163 Queensland operating charities (not necessarily Queensland resident) specified at least one
country outside Australia that they operate in. Most (64.1%) listed only one country, 9.1% listed two,
while 6.4% listed three countries. While more than 100 countries were listed, no single charity listed
more than 53. The most frequently reported overseas location reported by Queensland operating
charities was New Zealand (20.3% of Queensland operating charities that listed an overseas
location). The top 10 countries reported by charities operating in Queensland and all of Australia are
displayed in Table 16.
The Curtin Report notes:
Charities could indicate that they were involved with countries outside of Australia in three ways; by nominating ‘international activities’ as one of their activities, by nominating ‘communities overseas’ as one of their beneficiaries, or by advising that they operate outside of Australia.
In total, 6,476 charities or 17% of all reporting charities indicated they were involved in some
way internationally. This could include sending donations or other aid or more active
involvement.49
We used the same method on a slightly later AIS data set and found that Queensland charities
appear to have a greater engagement with international activities when compared to all Australian
charities (see Table 17). This is evident in the number who indicated international activities as an
additional activity and listed operating in another country. Those indicating that they benefited
another country in their initial registration with the ACNC also number more when compared to the
whole of Australian charities. This could be due to factors such as proximity to the South Pacific, the
diverse community in Queensland with links to countries of origin (remittance activities), or the state
being used as a base for charities seeking to operate overseas such as religious missions or aid
agencies.
48
Note that this variable only examines charities which specifically stated the overseas countries they operate in. This is different from the measure used in the Curtin University report which was a combination of charities nominating ‘international activities’ as one of their activities, specifying ‘communities overseas’ as one of their beneficiaries, or specifically identifying overseas countries that they operate in. 49
Knight, P.A. and D.J. Gilchrist (214) Australian Charities 2014: The First report on Charities Registered with the Australian Charities and Not-for-profits Commission, Report for the Australian Charities and Not-for-profits Commission, Melbourne. P 94. As the data for this report was earlier than that used in this report, results may differ slightly.
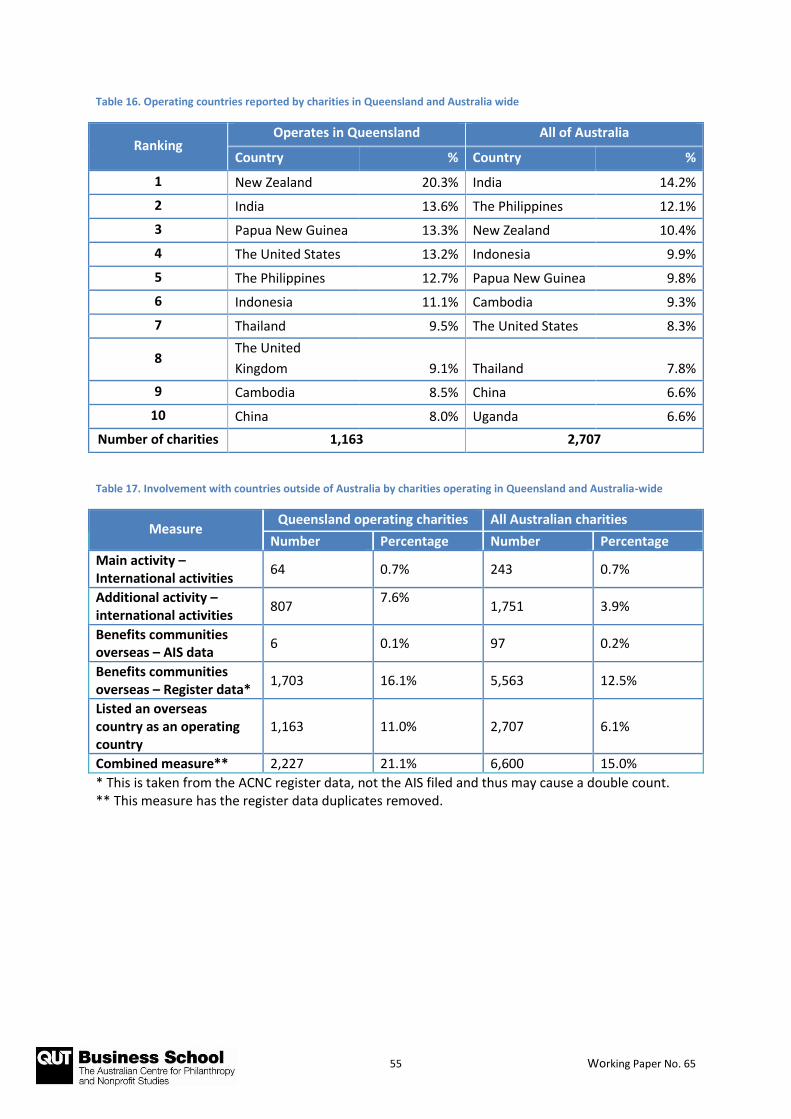
55 Working Paper No. 65
Table 16. Operating countries reported by charities in Queensland and Australia wide
Ranking Operates in Queensland All of Australia
Country % Country %
1 New Zealand 20.3% India 14.2%
2 India 13.6% The Philippines 12.1%
3 Papua New Guinea 13.3% New Zealand 10.4%
4 The United States 13.2% Indonesia 9.9%
5 The Philippines 12.7% Papua New Guinea 9.8%
6 Indonesia 11.1% Cambodia 9.3%
7 Thailand 9.5% The United States 8.3%
8 The United
Kingdom 9.1% Thailand 7.8%
9 Cambodia 8.5% China 6.6%
10 China 8.0% Uganda 6.6%
Number of charities 1,163 2,707
Table 17. Involvement with countries outside of Australia by charities operating in Queensland and Australia-wide
Measure Queensland operating charities All Australian charities
Number Percentage Number Percentage
Main activity – International activities
64 0.7% 243 0.7%
Additional activity – international activities
807 7.6%
1,751 3.9%
Benefits communities overseas – AIS data
6 0.1% 97 0.2%
Benefits communities overseas – Register data*
1,703 16.1% 5,563 12.5%
Listed an overseas country as an operating country
1,163 11.0% 2,707 6.1%
Combined measure** 2,227 21.1% 6,600 15.0%
* This is taken from the ACNC register data, not the AIS filed and thus may cause a double count. ** This measure has the register data duplicates removed.

56 Working Paper No. 65
The prevalence of charities operating in Queensland that also operate in countries outside Australia
provides an insight about a number of issues:
Some policy makers are concerned that charities operating overseas will effect a net transfer
of resources out of the jurisdiction and that concessions extended to these charities, for
example on payroll tax and other duties, does not directly benefit the Queensland public. On
the other hand there may be a net inflow of resources from other Australian jurisdictions
and overseas countries into Queensland.
The benefits to Queensland and Australia of charities operating across borders include
enhanced relations between communities, which spills over into international relations,
trade and exchange of ideas and skills. On the other hand, there is a risk of charities being
used as a vehicle to transfer funds and resources to activities which are not in the national
interest such as terrorism funding or money laundering.
The geographic proximity of Queensland to the South Pacific and Asia, combined with its
stable political and economic environment could make it an attractive base for international
charities requiring a regional office. This can have significant economic benefits for the
economy because of the investment in infrastructure, foundation corpus and employees of
such organisations. Singapore has recently pursued such a policy to become a destination of
choice for international organisations and philanthropy.50
Operating Countries and Charity Size – Queensland operating charities Table 18 displays the top 10 operating countries by charity size.51 As can be seen, there were few
differences in the top 10 across the three charity sizes however the order of importance differed.
Table 18. Operating countries by charity size for charities which operate in Queensland
Ranking Small Medium Large
Country % Country % Country %
1 New Zealand 17.2% New Zealand 23.7% Papua New Guinea 24.3%
2 The United States 11.9% Thailand 15.7% New Zealand 23.6%
3 India 10.9% The United States 14.8% Indonesia 21.3%
4 The Philippines 10.7% India 13.6% India 19.0%
5 Papua New Guinea 8.0% Papua New Guinea 13.1% The Philippines 17.7%
6 The United Kingdom 7.5% The Philippines 11.4% The United States 14.8%
7 Indonesia 6.2% Indonesia 10.6% China 14.4%
8 Thailand 5.9% The United Kingdom 8.9% Vietnam 14.4%
9 China 5.4% Fiji 8.9% Cambodia 14.1%
10 Kenya 5.4% Cambodia 8.9% The United Kingdom 12.8%
Number of
charities 615 236 305
50
http://www.edb.gov.sg/content/dam/edb/en/industries/International%20Non%20Profit%20Organisation/downloads/Guidance_on_International_Charitable_Organisations__ICOs.pdf 51
This table is based on Queensland operating charities that provided their charity size and listed the countries they operate in.

57 Working Paper No. 65
Number of countries and charity size for Queensland operating charities There was a difference between small, medium and large charities in the number of countries listed,
with large charities that listed any other countries reporting on average 5.3 countries. Medium
charities reported 3.5 countries on average while small countries reported 2.3 countries (see Figure
21). However the mode did not differ according to charity size with small, medium and large
charities all reporting one country outside Australia as the most common response.
Figure 21. Mean number of operating countries and charity size for Queensland operating charities
Top 10 operating countries by charity size and state of residence Appendix 7 displays the top ten operating countries by charity size for each state of residence. Only
charities that have indicated that they operate in at least one overseas country have been included
in this analysis.
2.3
3.5
5.3
0
1
2
3
4
5
6
Mean number of operating countries and charity size for QLD operating charities
Small Medium Large
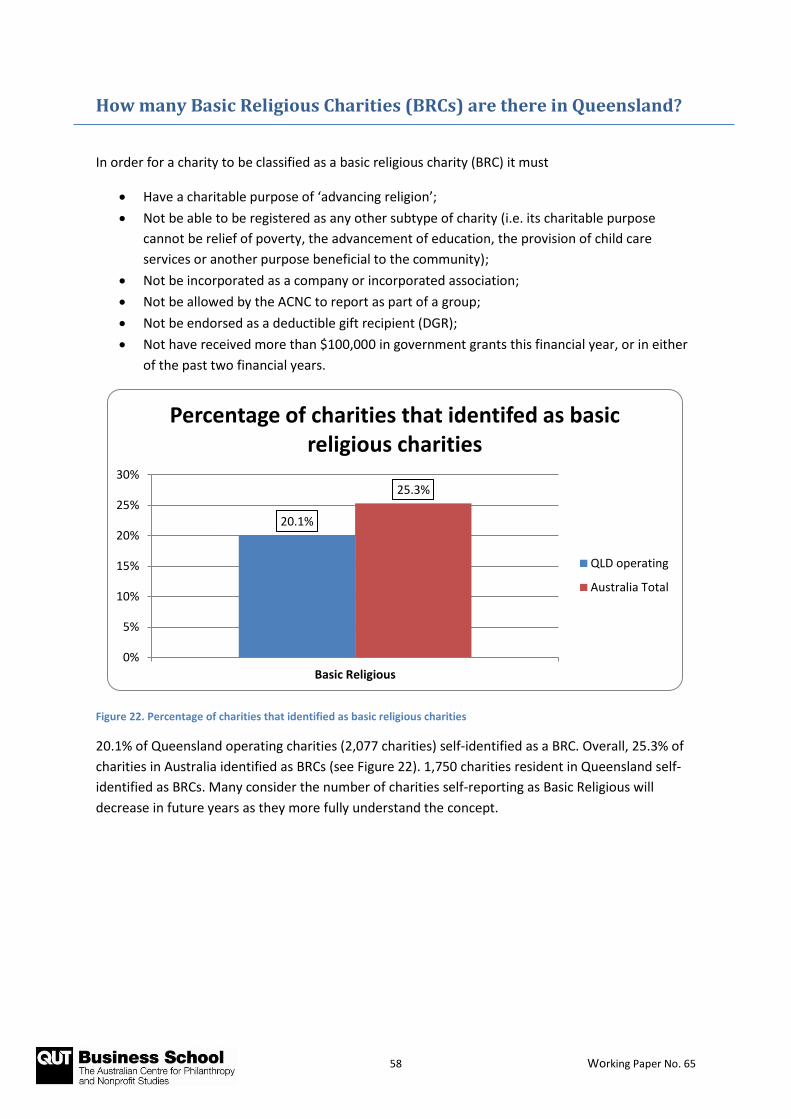
58 Working Paper No. 65
How many Basic Religious Charities (BRCs) are there in Queensland?
In order for a charity to be classified as a basic religious charity (BRC) it must
Have a charitable purpose of ‘advancing religion’;
Not be able to be registered as any other subtype of charity (i.e. its charitable purpose
cannot be relief of poverty, the advancement of education, the provision of child care
services or another purpose beneficial to the community);
Not be incorporated as a company or incorporated association;
Not be allowed by the ACNC to report as part of a group;
Not be endorsed as a deductible gift recipient (DGR);
Not have received more than $100,000 in government grants this financial year, or in either
of the past two financial years.
Figure 22. Percentage of charities that identified as basic religious charities
20.1% of Queensland operating charities (2,077 charities) self-identified as a BRC. Overall, 25.3% of
charities in Australia identified as BRCs (see Figure 22). 1,750 charities resident in Queensland self-
identified as BRCs. Many consider the number of charities self-reporting as Basic Religious will
decrease in future years as they more fully understand the concept.
20.1%
25.3%
0%
5%
10%
15%
20%
25%
30%
Basic Religious
Percentage of charities that identifed as basic religious charities
QLD operating
Australia Total
59 Working Paper No. 65
References Australian Bureau of Statistics. (2010). Community Services, 2008-09, cat. no. 8696.0. Canberrra:
Australian Government Retrieved from
http://www.abs.gov.au/AUSSTATS/[email protected]/allprimarymainfeatures/71A3B97BF7436EE2C
A2568A900139376?opendocument.
Australian Bureau of Statistics. (2014). 3101.0 - Australian Demographic Statistics, Jun 2014.
Canberra: Australian Government Retrieved from
http://www.abs.gov.au/ausstats/[email protected]/mf/3101.0.
Australian charities and Not-for-profits Commission. (2013). About ACNC. Australian Government.
Retrieved from
http://www.acnc.gov.au/ACNC/About_ACNC/ACNC_role/ACNC/Edu/ACNC_role.aspx?hkey=
88635892-3c89-421b-896d-d01add82f4fe
Australian Institute of Health and Welfare. (2007). Welfare Expenditure Australia, 2005-06.
Australian Government. Retrieved from http://www.aihw.gov.au/publication-
detail/?id=6442468044.
Australian Institute of Health and Welfare. (2009). Health and Community Services Labour Force,
2006. Australian Government. Retrieved from http://www.aihw.gov.au/publication-
detail/?id=6442468220.
Productivity Commission. (2010). Contribution of the Not-for-Profit Sector, Research Report.
Canberra: Australian Government. Retrieved from
http://www.pc.gov.au/projects/study/not-for-profit/report.
60 Working Paper No. 65
Appendices
61 Working Paper No. 65
Appendix 1. Data cleansing The primary data used are available from the ACNC site on http://data.gov.au downloaded 31
October, 2014.
1,243 charities did not list their operating states, however nearly all of these listed a state of
residence. These were recoded as operating in their state of residence.52
801 charities operated in only one state but did not list a state of residence. These were recoded so
their state of residence reflected where they operate.53
ABNs which were listed twice were removed from the data, as were some obvious keying errors, but
these are referenced in the text.
The 441 Queensland rural fire brigades all reported their number of volunteers as 35,453. This is the
approximate overall number of volunteers for the Rural Fire Service Queensland. As such the data
were changed to reflect this and each brigade was allocated 80 volunteers.
Only charities which provided their AIS were included in the analysis. The year of establishment was
not included in the AIS. This information was taken from the charities register for those charities
included in the analysis.
At the time of publication about 6,000 charities transferred from the previous ATO registry had not
file for two consecutive years and are at risk of being revoked.
52
Number recoded due to not reporting operating states – NSW=436; VIC=330; QLD=184; SA=103; WA=133;
TAS=28; ACT=25; NT=4. One other charity listed its state as Nairobi and did not list Australian operating states.
A further 25 charities did not list a state or any operating states. These are included in analyses of the whole
sample and may account for differences when the total for Australia is examined compared to the state totals. 53
Number recoded due to not reporting state of residence – NSW = 265; VIC = 173; QLD = 164; SA = 61; WA =
77; TAS = 24; ACT = 15; NT = 22.
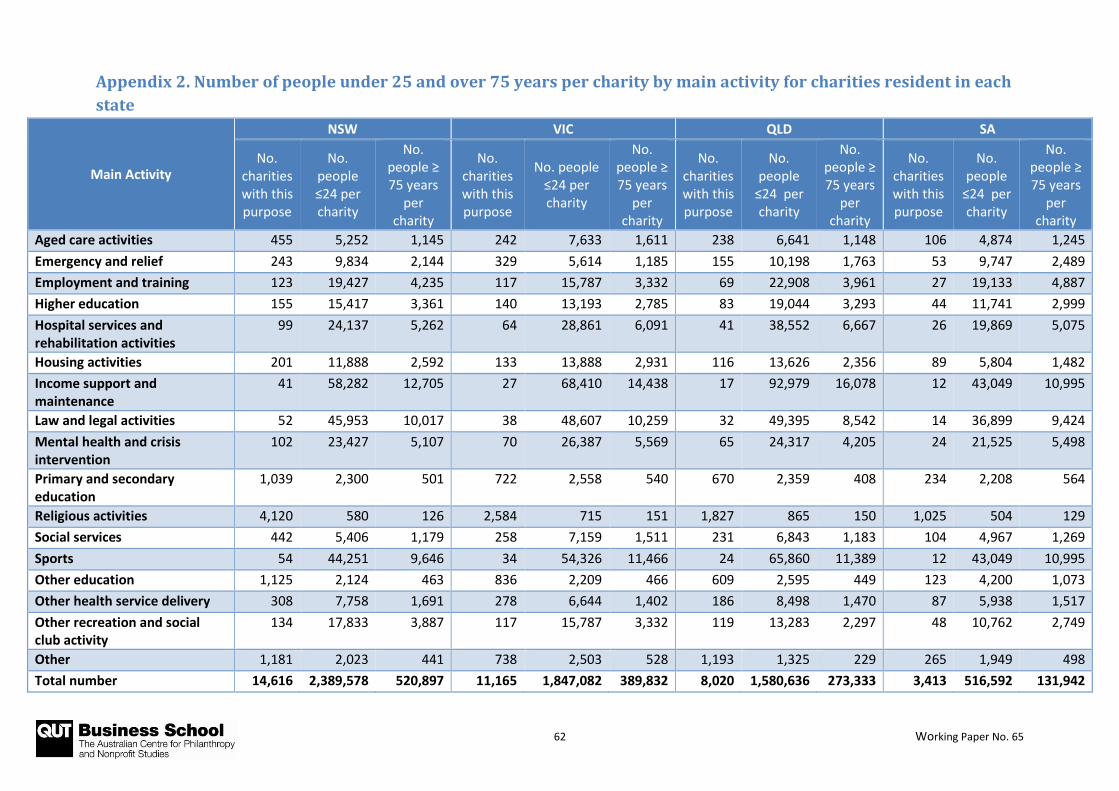
62 Working Paper No. 65
Appendix 2. Number of people under 25 and over 75 years per charity by main activity for charities resident in each
state
Main Activity
NSW VIC QLD SA
No. charities with this purpose
No. people ≤24 per charity
No. people ≥ 75 years
per charity
No. charities with this purpose
No. people ≤24 per charity
No. people ≥ 75 years
per charity
No. charities with this purpose
No. people
≤24 per charity
No. people ≥ 75 years
per charity
No. charities with this purpose
No. people
≤24 per charity
No. people ≥ 75 years
per charity
Aged care activities 455 5,252 1,145 242 7,633 1,611 238 6,641 1,148 106 4,874 1,245
Emergency and relief 243 9,834 2,144 329 5,614 1,185 155 10,198 1,763 53 9,747 2,489
Employment and training 123 19,427 4,235 117 15,787 3,332 69 22,908 3,961 27 19,133 4,887
Higher education 155 15,417 3,361 140 13,193 2,785 83 19,044 3,293 44 11,741 2,999
Hospital services and rehabilitation activities
99 24,137 5,262 64 28,861 6,091 41 38,552 6,667 26 19,869 5,075
Housing activities 201 11,888 2,592 133 13,888 2,931 116 13,626 2,356 89 5,804 1,482
Income support and maintenance
41 58,282 12,705 27 68,410 14,438 17 92,979 16,078 12 43,049 10,995
Law and legal activities 52 45,953 10,017 38 48,607 10,259 32 49,395 8,542 14 36,899 9,424
Mental health and crisis intervention
102 23,427 5,107 70 26,387 5,569 65 24,317 4,205 24 21,525 5,498
Primary and secondary education
1,039 2,300 501 722 2,558 540 670 2,359 408 234 2,208 564
Religious activities 4,120 580 126 2,584 715 151 1,827 865 150 1,025 504 129
Social services 442 5,406 1,179 258 7,159 1,511 231 6,843 1,183 104 4,967 1,269
Sports 54 44,251 9,646 34 54,326 11,466 24 65,860 11,389 12 43,049 10,995
Other education 1,125 2,124 463 836 2,209 466 609 2,595 449 123 4,200 1,073
Other health service delivery 308 7,758 1,691 278 6,644 1,402 186 8,498 1,470 87 5,938 1,517
Other recreation and social club activity
134 17,833 3,887 117 15,787 3,332 119 13,283 2,297 48 10,762 2,749
Other 1,181 2,023 441 738 2,503 528 1,193 1,325 229 265 1,949 498
Total number 14,616 2,389,578 520,897 11,165 1,847,082 389,832 8,020 1,580,636 273,333 3,413 516,592 131,942

63 Working Paper No. 65
Main Activity
WA TAS ACT NT
No. charities with this purpose
No. people ≤24 per charity
No. people
≥ 75 years per
charity
No. charities with this purpose
No. people ≤24 per charity
No. people
≥ 75 years per
charity
No. charities with
this purpose
No. people
≤24 per charity
No. people ≥ 75 years
per charity
No. charities with
this purpose
No. people
≤24 per charity
No. people ≥ 75 years
per charity
Aged care activities 107 7,836 1,299 61 2,619 635 22 5,787 832 4 22,495 1,078
Emergency and relief 295 2,842 471 25 6,391 1,550 13 9,794 1,408 8 11,247 539
Employment and training 54 15,526 2,574 22 7,263 1,761 5 25,465 3,662 9 9,998 479
Higher education 45 18,631 3,089 16 9,987 2,422 23 5,536 796 3 29,993 1,437
Hospital services and rehabilitation activities
25 33,537 5,560 14 11,413 2,768 3 42,441 6,103 1 89,978 4,310
Housing activities 63 13,308 2,207 24 6,658 1,615 12 10,610 1,526 7 12,854 616
Income support and maintenance
8 104,802 17,377 1 159,784 38,751 0 - - 1 89,978 4,310
Law and legal activities 19 44,127 7,316 5 31,957 7,750 5 25,465 3,662 11 8,180 392
Mental health and crisis intervention
43 19,498 3,233 14 11,413 2,768 11 11,575 1,664 2 44,989 2,155
Primary and secondary education
411 2,040 338 32 4,993 1,211 73 1,744 251 9 9,998 479
Religious activities 1,170 717 119 369 433 105 179 711 102 49 1,836 88
Social services 126 6,654 1,103 27 5,918 1,435 31 4,107 591 13 6,921 332
Sports 15 55,894 9,267 6 26,631 6,459 0 - - 4 22,495 1,078
Other education 207 4,050 672 99 1,614 391 87 1,463 210 21 4,285 205
Other health service delivery 121 6,929 1,149 44 3,631 881 24 5,305 763 24 3,749 180
Other recreation and social club activity
54 15,526 2,574 23 6,947 1,685 9 14,147 2,034 3 29,993 1,437
Other 356 2,355 390 124 1,289 313 134 950 137 28 3,214 154
Total number 4,439 838,415 139,012 1,221 159,784 38,751 923 127,324 18,309 404 89,978 4,310

64 Working Paper No. 65
Appendix 3. Types of charities with no staff or volunteers by charity size Figure 23 below shows the percentage of Queensland vs Australia-wide charities which reported no
staff or volunteers who had the word ‘trustee’ in their name, broken down by charity size. Overall
39.2% of charities reporting no staff or volunteers across Australia had the word trustee in their
name. This is compared to 24.8% of Queensland operating charities. The distribution between
charity sizes was comparable but as the Figure shows, there is a greater percentage for all of
Australia.
Figure 23. Percentage with no staff or volunteers that are trustee organisation by charity size
0%
5%
10%
15%
20%
25%
30%
35%
40%
45%
QLD operating charities All of Australia
Percentage with no staff or volunteers that are trustee organisations by charity size
Small
Medium
Large
Total
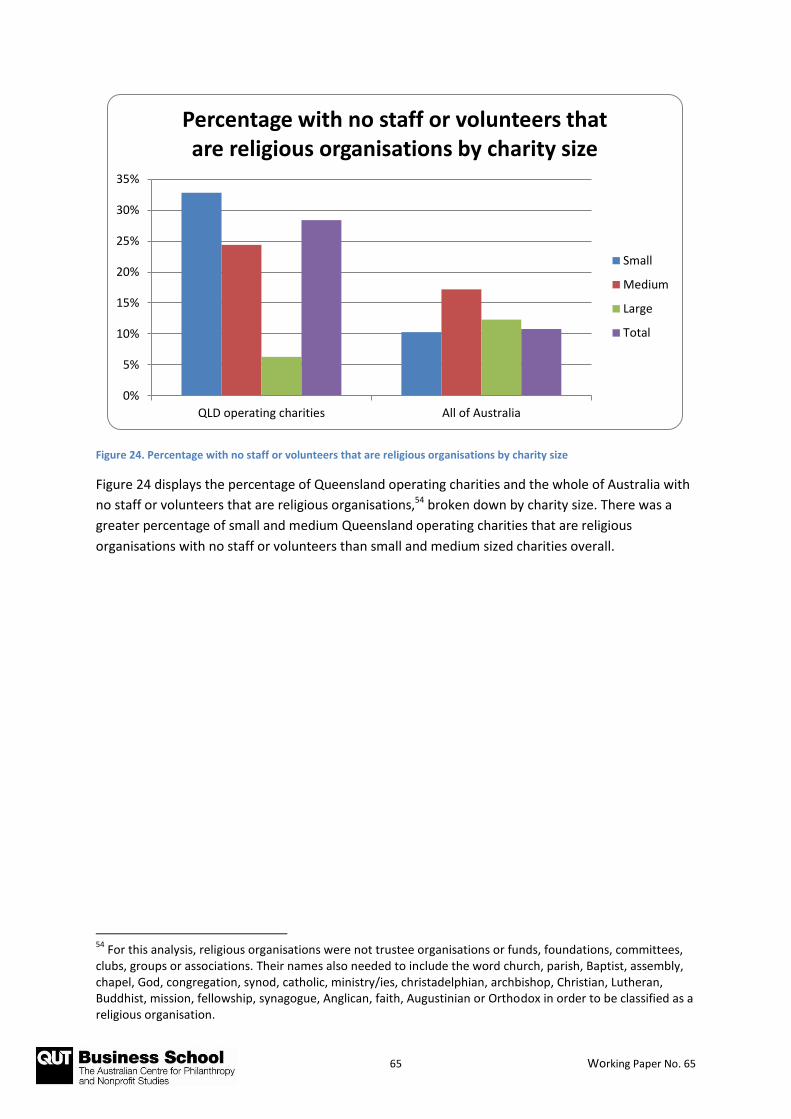
65 Working Paper No. 65
Figure 24. Percentage with no staff or volunteers that are religious organisations by charity size
Figure 24 displays the percentage of Queensland operating charities and the whole of Australia with
no staff or volunteers that are religious organisations,54 broken down by charity size. There was a
greater percentage of small and medium Queensland operating charities that are religious
organisations with no staff or volunteers than small and medium sized charities overall.
54
For this analysis, religious organisations were not trustee organisations or funds, foundations, committees, clubs, groups or associations. Their names also needed to include the word church, parish, Baptist, assembly, chapel, God, congregation, synod, catholic, ministry/ies, christadelphian, archbishop, Christian, Lutheran, Buddhist, mission, fellowship, synagogue, Anglican, faith, Augustinian or Orthodox in order to be classified as a religious organisation.
0%
5%
10%
15%
20%
25%
30%
35%
QLD operating charities All of Australia
Percentage with no staff or volunteers that are religious organisations by charity size
Small
Medium
Large
Total

66 Working Paper No. 65
Appendix 4. Charitable purpose by state and charity size
State
Relief of poverty, sickness or the needs of the aged
Advancement of education Advancement of religion Provision of child care services Other purposes beneficial to the
community
Total no. charities
Total no. people
Total no.
people per
charity No. %
No. people
per charity
No %
No. people
per charity
No. %
No. people
per charity
No. %
No. people
per charity
No. % No.
people per charity
NSW
Small 1,654 16.8% 4,546 3,170 32.1% 2,372 3,781 38.3% 1,988 502 5.1% 14,977 3,857 39.1% 1,949 9,862
7,518,472
762
Medium 571 22.7% 13,167 873 34.7% 8,612 854 34.0% 8,804 432 17.2% 17,404 1,044 41.5% 7,202 2,513 2,992
Large 741 34.5% 10,146 956 44.5% 7,865 484 22.5% 15,534 256 11.9% 29,369 997 46.4% 7,541 2,150 3,497
Total 2,977 20.4% 2,526 5,055 34.6% 1,487 5,146 35.2% 1,461 1,200 8.2% 6,265 5,933 40.6% 1,267 14,616 514
VIC
Small 1,603 21.6% 3,644 2,051 27.7% 2,848 2,582 34.8% 2,262 417 5.6% 14,009 3,532 47.7% 1,654 7,412
5,841,667
788
Medium 418 26.3% 13,975 621 39.1% 9,407 466 29.3% 12,536 197 12.4% 29,653 718 45.2% 8,136 1,588 3,679
Large 595 28.4% 9,818 1,189 56.7% 4,913 656 31.3% 8,905 201 9.6% 29,063 857 40.8% 6,816 2,098 2,784
Total 2,630 23.6% 2,221 3,888 34.8% 1,502 3,721 33.3% 1,570 821 7.4% 7,115 5,146 46.1% 1,135 11,165 523
QLD
Small 1,364 23.9% 3,462 2,102 36.8% 2,247 1,785 31.3% 2,646 285 5.0% 16,570 2,509 44.0% 1,882 5,708
4,722,447
827
Medium 317 27.7% 14,897 409 35.8% 11,546 285 24.9% 16,570 195 17.1% 24,218 474 41.5% 9,963 1,143 4,132
Large 413 37.4% 11,434 476 43.2% 9,921 123 11.2% 38,394 132 12.0% 35,776 546 49.5% 8,649 1,103 4,281
Total 2,012 26.2% 2,347 3,026 37.7% 1,561 2,201 27.4% 2,146 619 7.7% 7,629 3,562 44.4% 1,326 8,020 589
SA
Small 582 23.9% 2,896 621 25.5% 2,715 1,109 45.6% 1,520 110 4.5% 15,325 975 40.1% 1,729 2,431
1,685,714
693
Medium 104 25.9% 16,209 135 33.7% 12,487 109 27.2% 15,465 36 9.0% 46,825 201 50.1% 8,387 401 4,204
Large 184 32.5% 9,161 288 50.8% 5,853 155 27.3% 10,876 55 9.7% 30,649 213 37.6% 7,914 567 2,973
Total 873 25.6% 1,931 1,047 30.7% 1,610 1,377 40.3% 1,224 201 5.9% 8,387 1,398 41.0% 1,206 3,413 494

67 Working Paper No. 65
State
Relief of poverty, sickness or the needs of the aged
Advancement of education Advancement of religion Provision of child care services Other purposes beneficial to the
community
Total no. charities
Total no. people
Total no.
people per
charity No. %
No. people
per charity
No %
No. people
per charity
No. %
No. people
per charity
No. %
No. people
per charity
No. % No.
people per charity
WA
Small 609 19.8% 4,226 888 28.9% 2,898 1,137 37.0% 2,263 104 3.4% 24,744 1,331 43.3% 1,933 3074
2,573,389
837
Medium 138 25.2% 18,648 199 36.4% 12,932 141 25.8% 18,251 39 7.1% 65,984 308 56.3% 8,355 547 4,705
Large 261 33.1% 9,860 394 50.0% 6,531 236 29.9% 10,904 80 10.2% 32,167 347 44.0% 7,416 788 3,266
Total 1012 22.8% 2,543 1,496 33.7% 1,720 1,522 34.3% 1,691 223 5.0% 11,540 2,000 45.1% 1,287 4,439 580
TAS
Small 181 21.7% 2,844 204 24.4% 2,523 365 43.7% 1,410 26 3.1% 19,799 328 39.3% 1,569 835
514,762
616
Medium 53 29.4% 9,712 63 35.0% 8,171 42 23.3% 12,256 20 11.1% 25,738 116 64.4% 4,438 180 2,860
Large 63 31.5% 8,171 92 46.0% 5,595 18 9.0% 28,598 24 12.0% 21,448 89 44.5% 5,784 200 2,574
Total 299 24.5% 1,722 362 29.6% 1,422 425 34.8% 1,211 70 5.7% 7,354 539 44.1% 955 1,221 422
ACT
Small 94 18.3% 4,106 210 40.8% 1,838 191 37.1% 2,021 24 4.7% 16,083 223 43.3% 1,731 515
385,996
750
Medium 34 19.7% 11,353 69 39.9% 5,594 56 32.4% 6,893 23 13.3% 16,782 83 48.0% 4,651 173 2,231
Large 67 29.6% 5,761 109 48.2% 3,541 45 19.9% 8,578 25 11.1% 15,440 108 47.8% 3,574 226 1,708
Total 196 21.2% 1,969 394 42.7% 980 293 31.7% 1,317 73 7.9% 5,288 418 45.3% 923 923 418
NT
Small 37 21.5% 6,624 56 32.6% 4,376 62 36.0% 3,953 6 3.5% 40,846 94 54.7% 2,607 172
245,076
1,425
Medium 34 35.8% 7,208 31 32.6% 7,906 12 12.6% 20,423 18 18.9% 13,615 64 67.4% 3,829 95 2,580
Large 62 46.6% 3,953 56 42.1% 4,376 10 7.5% 24,508 14 10.5% 17,505 94 70.7% 2,607 133 1,843
Total 135 33.4% 1,815 145 35.9% 1,690 85 21.0% 2,883 39 9.7% 6,284 255 63.1% 961 404 607

68 Working Paper No. 65
State
Relief of poverty, sickness or the needs of the aged
Advancement of education Advancement of religion Provision of child care services Other purposes beneficial to the
community
Total no. charities
Total no. people
Total no.
people per
charity No. %
No. people
per charity
No %
No. people
per charity
No. %
No. people
per charity
No. %
No. people
per charity
No. % No.
people per charity
All charities
Small 6,153 20.4% 3,817 9,339 31.0% 2,515 11,041 36.7% 2,127 1,478 4.9% 15,891 12,890 42.8% 1,822 30,099
23,487,523
780
Medium 1,678 25.2% 13,997 2,407 36.1% 9,758 1,973 29.6% 11,904 961 14.4% 24,441 3,021 45.3% 7,775 6,663 3,525
Large 2,394 32.8% 9,811 3,571 48.9% 6,577 1,734 23.7% 13,545 788 10.8% 29,807 3,275 44.7% 7,172 7,302 3,217
Total 10,271 23.2% 2,287 15,469 34.9% 1,518 14,814 33.4% 1,585 3,252 7.3% 7,222 19,329 43.6% 1,215 44,352 530

69 Working Paper No. 65
Appendix 5. Main activity by charity size for charities based in each state
Main Activity NSW VIC
Charity Size Charity Size
Small Medium Large Total Small Medium Large Total
Animal protection 0.8% 0.4% 0.2% 0.6% 0.7% 0.3% 0.4% 0.6%
Aged care activities 1.4% 3.8% 10.3% 3.1% 0.9% 2.4% 6.3% 2.2%
Civic and advocacy activities 0.6% 0.6% 0.7% 0.6% 0.5% 1.2% 0.6% 0.6%
Culture and arts 3.8% 2.8% 3.3% 3.6% 3.7% 5.0% 2.2% 3.6%
Economic, social and
community development 2.4% 4.3% 3.7% 2.9% 3.3% 5.2% 2.7% 3.5%
Emergency and relief 1.9% 1.2% 1.3% 1.7% 3.7% 2.5% 0.6% 2.9%
Employment and training 0.2% 0.9% 3.6% 0.8% 0.2% 2.3% 3.1% 1.0%
Environmental activities 1.1% 1.1% 1.1% 1.1% 1.5% 1.8% 1.0% 1.4%
Grant-making activities 4.8% 1.7% 1.4% 3.7% 11.7% 5.4% 2.9% 9.1%
Higher education 0.7% 0.8% 2.8% 1.1% 0.8% 1.6% 2.7% 1.3%
Hospital services and
rehabilitation activities 0.5% 0.5% 1.7% 0.7% 0.5% 0.6% 0.7% 0.6%
Housing activities 0.8% 2.8% 2.3% 1.4% 0.8% 2.1% 1.9% 1.2%
Income support and
maintenance 0.4% 0.2% 0.1% 0.3% 0.3% 20.0% 0.1% 0.2%
International activities 0.5% 0.7% 1.0% 0.6% 0.7% 0.4% 0.6% 0.6%
Law and legal services 0.1% 0.9% 0.9% 0.4% 0.1% 1.2% 0.7% 0.3%
Mental health and crisis
intervention 0.5% 1.0% 1.2% 0.7% 0.5% 0.8% 0.8% 0.6%
Primary and secondary
education 6.7% 3.3% 13.4% 7.1% 1.6% 2.2% 26.8% 6.5%
Religious activities 32.1% 27.4% 11.8% 28.2% 27.9% 24.0% 5.8% 23.1%
Research 0.6% 0.9% 2.3% 0.9% 0.6% 1.0% 2.0% 1.0%
Social Services 1.8% 4.6% 6.7% 3.0% 1.5% 2.7% 4.9% 2.3%
Sports 0.4% 0.2% 0.3% 0.4% 0.3% 0.4% 0.1% 0.3%
Other education 6.2% 13.6% 7.3% 7.7% 6.6% 12.7% 6.5% 7.5%
Other health service delivery 1.5% 2.2% 4.7% 2.1% 1.3% 2.9% 6.3% 2.5%
Other recreation and social
club activity 1.1% 0.6% 0.4% 0.9% 1.3% 0.6% 0.3% 1.0%
Other 7.5% 9.3% 9.1% 8.1% 5.7% 7.9% 8.8% 6.6%
None 21.6% 14.3% 8.5% 18.4% 23.1% 12.8% 11.2% 19.4%
Total Number of Charities
9,862
2,513
2,150
14,616
7,412
1,588
2,098
11,165

70 Working Paper No. 65
Main Activity QLD SA
Charity Size Charity Size
Small Medium Large Total Small Medium Large Total
Animal protection 0.9% 0.5% 0.2% 0.7% 0.5% 0.5% 0.9% 0.6%
Aged care activities 1.8% 3.6% 8.3% 3.0% 1.3% 3.2% 10.8% 3.1%
Civic and advocacy activities 0.7% 0.5% 0.6% 0.7% 0.6% 2.0% 0.2% 0.7%
Culture and arts 2.5% 3.1% 2.4% 2.6% 2.7% 6.7% 2.5% 3.2%
Economic, social and
community development 2.2% 4.3% 3.1% 2.6% 2.8% 5.2% 2.1% 3.0%
Emergency and relief 2.0% 1.9% 1.5% 1.9% 1.9% 1.5% 0.4% 1.6%
Employment and training 0.3% 1.0% 3.6% 0.9% 0.2% 0.5% 3.4% 0.8%
Environmental activities 1.1% 1.6% 2.1% 1.3% 2.3% 3.2% 1.1% 2.2%
Grant-making activities 0.8% 1.0% 1.2% 0.9% 4.6% 3.0% 1.2% 3.8%
Higher education 0.6% 1.1% 3.2% 1.0% 0.9% 2.0% 2.5% 1.3%
Hospital services and
rehabilitation activities 0.3% 0.4% 1.5% 0.5% 0.6% 0.2% 1.8% 0.8%
Housing activities 0.7% 3.8% 2.8% 1.4% 2.5% 2.5% 3.2% 2.6%
Income support and
maintenance 0.3% 0.1% 0.1% 0.2% 0.4% 0.5% 0.0% 0.4%
International activities 0.4% 0.7% 0.3% 0.4% 0.7% 1.2% 0.4% 0.7%
Law and legal services 0.2% 1.1% 0.8% 0.4% 0.2% 1.5% 0.7% 0.4%
Mental health and crisis
intervention 0.5% 1.2% 1.9% 0.8% 0.5% 1.5% 1.2% 0.7%
Primary and secondary
education 7.7% 6.4% 13.5% 8.4% 2.6% 3.0% 27.5% 6.9%
Religious activities 26.1% 21.6% 7.5% 22.8% 37.3% 21.9% 4.8% 30.0%
Research 0.6% 0.4% 1.3% 0.7% 0.7% 2.0% 1.2% 0.9%
Social Services 1.6% 4.5% 8.1% 2.9% 2.2% 2.0% 7.2% 3.0%
Sports 0.4% 0.2% 0.1% 0.3% 0.3% 0.7% 0.0% 0.4%
Other education 6.0% 15.0% 7.6% 7.6% 3.0% 5.7% 4.8% 3.6%
Other health service
delivery 1.2% 3.4% 6.8% 2.3% 1.8% 2.0% 6.3% 2.5%
Other recreation and social
club activity 1.8% 0.8% 0.5% 1.5% 1.6% 1.5% 0.4% 1.4%
Other 16.7% 9.5% 11.0% 14.9% 7.3% 12.2% 6.3% 7.8%
None 22.7% 12.0% 10.2% 19.4% 20.5% 13.5% 9.3% 17.8%
Total Number of Charities
5,708
1,143
1,103
8,020
2,431
401
567
3,413
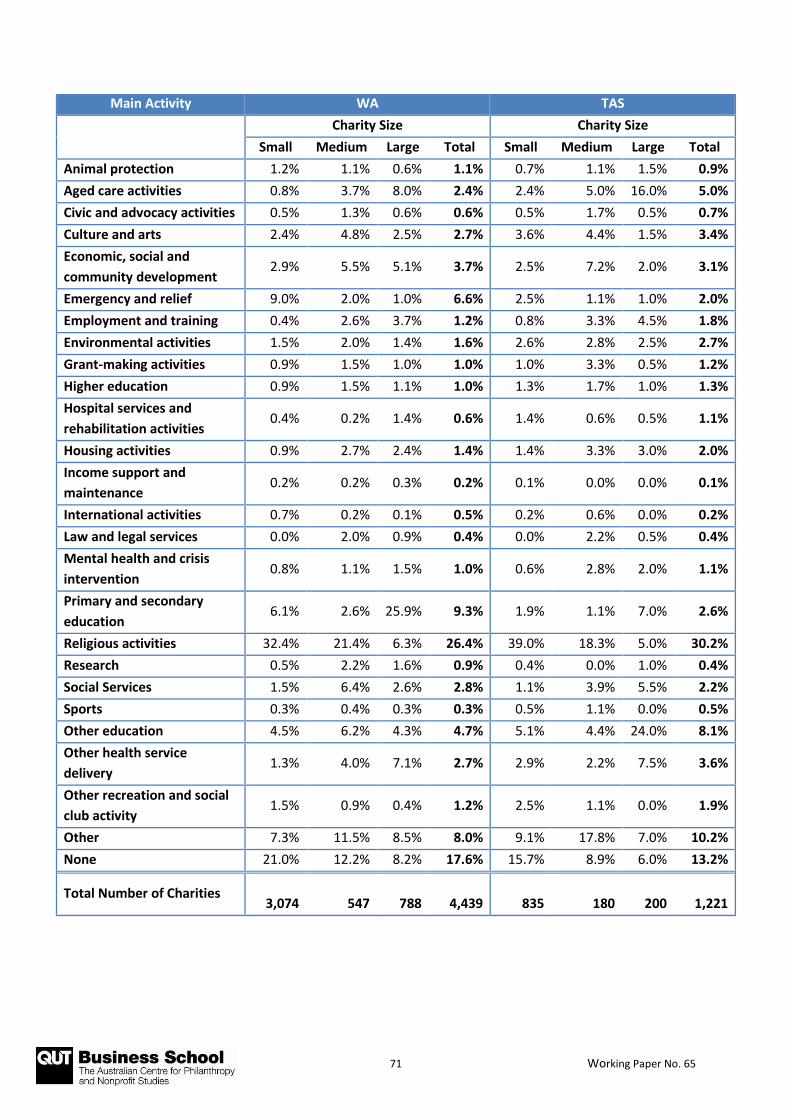
71 Working Paper No. 65
Main Activity WA TAS
Charity Size Charity Size
Small Medium Large Total Small Medium Large Total
Animal protection 1.2% 1.1% 0.6% 1.1% 0.7% 1.1% 1.5% 0.9%
Aged care activities 0.8% 3.7% 8.0% 2.4% 2.4% 5.0% 16.0% 5.0%
Civic and advocacy activities 0.5% 1.3% 0.6% 0.6% 0.5% 1.7% 0.5% 0.7%
Culture and arts 2.4% 4.8% 2.5% 2.7% 3.6% 4.4% 1.5% 3.4%
Economic, social and
community development 2.9% 5.5% 5.1% 3.7% 2.5% 7.2% 2.0% 3.1%
Emergency and relief 9.0% 2.0% 1.0% 6.6% 2.5% 1.1% 1.0% 2.0%
Employment and training 0.4% 2.6% 3.7% 1.2% 0.8% 3.3% 4.5% 1.8%
Environmental activities 1.5% 2.0% 1.4% 1.6% 2.6% 2.8% 2.5% 2.7%
Grant-making activities 0.9% 1.5% 1.0% 1.0% 1.0% 3.3% 0.5% 1.2%
Higher education 0.9% 1.5% 1.1% 1.0% 1.3% 1.7% 1.0% 1.3%
Hospital services and
rehabilitation activities 0.4% 0.2% 1.4% 0.6% 1.4% 0.6% 0.5% 1.1%
Housing activities 0.9% 2.7% 2.4% 1.4% 1.4% 3.3% 3.0% 2.0%
Income support and
maintenance 0.2% 0.2% 0.3% 0.2% 0.1% 0.0% 0.0% 0.1%
International activities 0.7% 0.2% 0.1% 0.5% 0.2% 0.6% 0.0% 0.2%
Law and legal services 0.0% 2.0% 0.9% 0.4% 0.0% 2.2% 0.5% 0.4%
Mental health and crisis
intervention 0.8% 1.1% 1.5% 1.0% 0.6% 2.8% 2.0% 1.1%
Primary and secondary
education 6.1% 2.6% 25.9% 9.3% 1.9% 1.1% 7.0% 2.6%
Religious activities 32.4% 21.4% 6.3% 26.4% 39.0% 18.3% 5.0% 30.2%
Research 0.5% 2.2% 1.6% 0.9% 0.4% 0.0% 1.0% 0.4%
Social Services 1.5% 6.4% 2.6% 2.8% 1.1% 3.9% 5.5% 2.2%
Sports 0.3% 0.4% 0.3% 0.3% 0.5% 1.1% 0.0% 0.5%
Other education 4.5% 6.2% 4.3% 4.7% 5.1% 4.4% 24.0% 8.1%
Other health service
delivery 1.3% 4.0% 7.1% 2.7% 2.9% 2.2% 7.5% 3.6%
Other recreation and social
club activity 1.5% 0.9% 0.4% 1.2% 2.5% 1.1% 0.0% 1.9%
Other 7.3% 11.5% 8.5% 8.0% 9.1% 17.8% 7.0% 10.2%
None 21.0% 12.2% 8.2% 17.6% 15.7% 8.9% 6.0% 13.2%
Total Number of Charities
3,074
547
788
4,439
835
180
200
1,221

72 Working Paper No. 65
Main Activity ACT NT
Charity Size Charity Size
Small Medium Large Total Small Medium Large Total
Animal protection 0.4% 0.0% 0.9% 0.4% 1.2% 1.1% 0.0% 0.7%
Aged care activities 1.2% 4.0% 3.5% 2.4% 0.0% 2.1% 1.5% 1.0%
Civic and advocacy activities 2.5% 6.4% 3.1% 3.4% 1.2% 3.2% 0.0% 1.2%
Culture and arts 5.4% 5.8% 2.7% 4.9% 8.7% 18.9% 8.3% 11.1%
Economic, social and
community development 2.7% 1.2% 4.0% 2.7% 9.3% 16.8% 18.0% 14.1%
Emergency and relief 1.4% 1.7% 1.3% 1.4% 3.5% 0.0% 1.5% 2.0%
Employment and training 0.4% 0.6% 0.9% 0.5% 1.2% 1.1% 4.5% 2.2%
Environmental activities 1.7% 2.3% 0.9% 1.6% 0.6% 2.1% 3.0% 1.7%
Grant-making activities 2.1% 1.7% 1.8% 2.0% 1.2% 2.1% 0.8% 1.2%
Higher education 1.9% 1.7% 4.0% 2.5% 0.6% 1.1% 0.8% 0.7%
Hospital services and
rehabilitation activities 0.4% 0.0% 0.4% 0.3% 0.0% 0.0% 0.8% 0.2%
Housing activities 1.0% 2.3% 1.3% 1.3% 0.0% 0.0% 5.3% 1.7%
Income support and
maintenance 0.0% 0.0% 0.0% 0.0% 0.6% 0.0% 0.0% 0.2%
International activities 0.4% 0.6% 0.0% 0.3% 0.0% 0.0% 0.0% 0.0%
Law and legal services 0.4% 0.6% 0.9% 0.5% 0.6% 3.2% 5.3% 2.7%
Mental health and crisis
intervention 0.6% 1.2% 2.7% 1.2% 0.0% 2.1% 0.0% 0.5%
Primary and secondary
education 4.5% 2.9% 19.5% 7.9% 0.6% 2.1% 4.5% 2.2%
Religious activities 26.0% 20.8% 3.5% 19.4% 23.8% 5.3% 2.3% 12.1%
Research 1.2% 1.7% 1.8% 1.4% 0.6% 0.0% 0.8% 0.5%
Social Services 2.3% 2.3% 6.6% 3.4% 1.7% 1.1% 6.8% 3.2%
Sports 0.0% 0.0% 0.0% 0.0% 1.2% 2.1% 0.0% 1.0%
Other education 8.7% 12.1% 8.4% 9.4% 3.5% 9.5% 3.8% 5.2%
Other health service
delivery 0.8% 2.3% 7.1% 2.6% 2.3% 1.1% 13.5% 5.9%
Other recreation and social
club activity 0.6% 3.5% 0.0% 1.0% 1.2% 1.1% 0.0% 0.7%
Other 16.7% 7.5% 15.0% 14.5% 4.7% 8.4% 9.0% 6.9%
None 16.7% 16.8% 9.7% 15.0% 32.0% 15.8% 9.8% 20.5%
Total Number of Charities
515
173
226
923
172
95
133
404

73 Working Paper No. 65
Appendix 6. Beneficiary groups and charity size for charities based in each state
Beneficiary group
NSW
Small Medium Large Total No. people
< 24 years per
charity
No. people
> 75 years
per charity No. % No. % No. % No. %
Aboriginal or TSI 1,569 15.9% 847 33.7% 941 43.8% 3,381 23.1% 707 154
Aged persons 2,492 25.3% 830 33.0% 728 33.9% 4,050 27.7% 590 129
Children 4,585 46.5% 1,490 59.3% 1,167 54.3% 7,300 49.9% 327 71
Ethnic groups 1,327 13.5% 613 24.4% 607 27.2% 2,555 17.5% 935 204
Gay, Lesbian, Bisexual, Transgender persons 392 4.0% 277 11.0% 268 12.5% 944 6.5% 2,531 552
General community in Australia 3,892 39.5% 1,260 50.1% 991 46.1% 6,177 42.3% 387 84
Men 2,371 24.0% 814 32.4% 686 31.9% 3,886 26.6% 615 134
Migrants, refugees or asylum seekers 783 7.9% 390 15.5% 343 16.0% 1,523 10.4% 1,569 342
Pre-, post-release offenders 305 3.1% 182 7.6% 170 7.9% 670 4.6% 3,567 777
People with chronic illness 1,208 12.2% 458 18.2% 460 21.4% 2,134 14.6% 1,120 244
People with disabilities 15 16.5% 1,828 18.5% 872 34.7% 3,676 25.2% 650 142
People at risk of homelessness 935 9.5% 509 20.3% 433 20.1% 1,882 12.9% 1,270 277
Unemployed persons 1,370 13.9% 573 22.8% 445 20.7% 2,400 16.4% 996 217
Veterans or their families 781 7.9% 215 8.6% 216 10.0% 1,215 8.3% 1,967 429
Victims of crime 345 3.5% 197 7.8% 143 6.7% 686 4.7% 3,483 759
Victims of disasters 770 7.8% 230 9.2% 172 8.0% 1,175 8.0% 2,034 443
Women 2,646 26.8% 996 39.6% 775 36.0% 4,438 30.4% 538 117
Youth 3,127 31.7% 1,094 43.5% 965 44.9% 5,227 35.8% 457 100
Other charities 1,610 16.3% 453 18.0% 328 15.3% 2,398 16.4% 996 217
Other beneficiaries not listed 1,347 13.7% 197 7.8% 151 7.0% 1,700 11.6% 1,406 306
Note: Number of people ≤ 24 years in NSW = 2,389,578; Number of people ≥75 years in NSW = 520,897
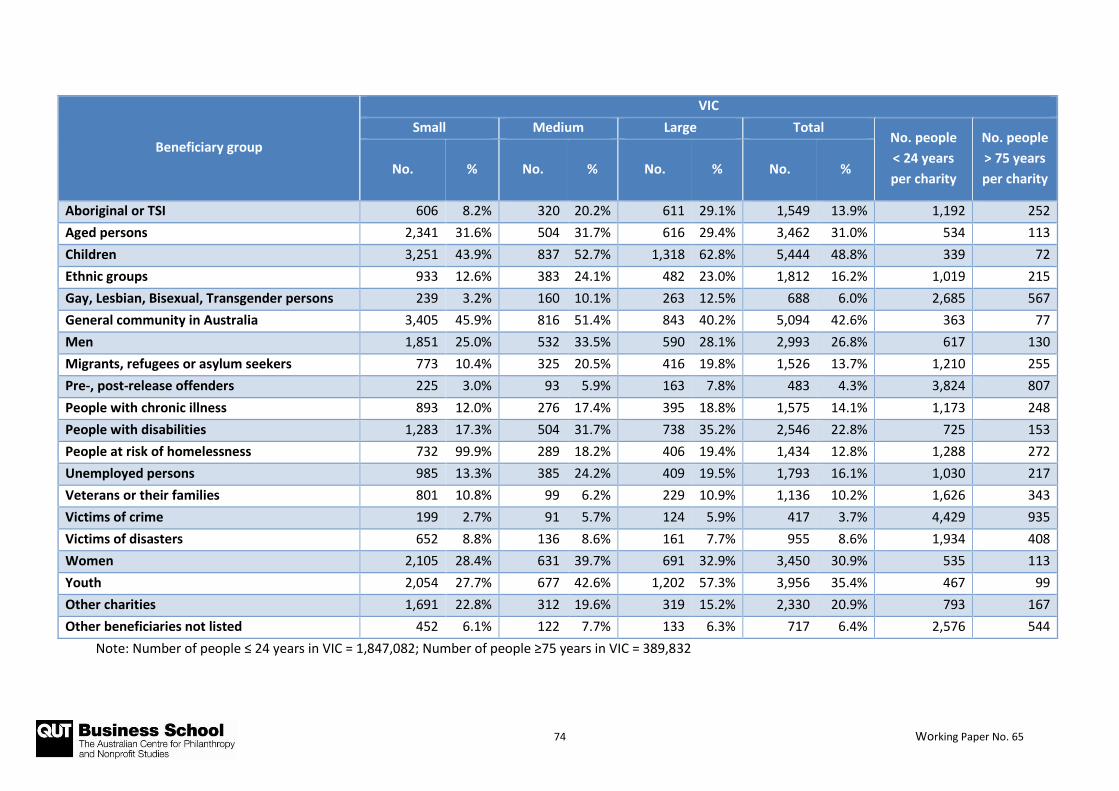
74 Working Paper No. 65
Beneficiary group
VIC
Small Medium Large Total No. people
< 24 years
per charity
No. people
> 75 years
per charity No. % No. % No. % No. %
Aboriginal or TSI 606 8.2% 320 20.2% 611 29.1% 1,549 13.9% 1,192 252
Aged persons 2,341 31.6% 504 31.7% 616 29.4% 3,462 31.0% 534 113
Children 3,251 43.9% 837 52.7% 1,318 62.8% 5,444 48.8% 339 72
Ethnic groups 933 12.6% 383 24.1% 482 23.0% 1,812 16.2% 1,019 215
Gay, Lesbian, Bisexual, Transgender persons 239 3.2% 160 10.1% 263 12.5% 688 6.0% 2,685 567
General community in Australia 3,405 45.9% 816 51.4% 843 40.2% 5,094 42.6% 363 77
Men 1,851 25.0% 532 33.5% 590 28.1% 2,993 26.8% 617 130
Migrants, refugees or asylum seekers 773 10.4% 325 20.5% 416 19.8% 1,526 13.7% 1,210 255
Pre-, post-release offenders 225 3.0% 93 5.9% 163 7.8% 483 4.3% 3,824 807
People with chronic illness 893 12.0% 276 17.4% 395 18.8% 1,575 14.1% 1,173 248
People with disabilities 1,283 17.3% 504 31.7% 738 35.2% 2,546 22.8% 725 153
People at risk of homelessness 732 99.9% 289 18.2% 406 19.4% 1,434 12.8% 1,288 272
Unemployed persons 985 13.3% 385 24.2% 409 19.5% 1,793 16.1% 1,030 217
Veterans or their families 801 10.8% 99 6.2% 229 10.9% 1,136 10.2% 1,626 343
Victims of crime 199 2.7% 91 5.7% 124 5.9% 417 3.7% 4,429 935
Victims of disasters 652 8.8% 136 8.6% 161 7.7% 955 8.6% 1,934 408
Women 2,105 28.4% 631 39.7% 691 32.9% 3,450 30.9% 535 113
Youth 2,054 27.7% 677 42.6% 1,202 57.3% 3,956 35.4% 467 99
Other charities 1,691 22.8% 312 19.6% 319 15.2% 2,330 20.9% 793 167
Other beneficiaries not listed 452 6.1% 122 7.7% 133 6.3% 717 6.4% 2,576 544
Note: Number of people ≤ 24 years in VIC = 1,847,082; Number of people ≥75 years in VIC = 389,832

75 Working Paper No. 65
Beneficiary group
QLD
Small Medium Large Total No. people
< 24 years
per charity
No. people
> 75 years
per charity No. % No. % No. % No. %
Aboriginal or TSI 1,364 23.9% 459 40.2% 596 54.0% 2,439 30.4% 648 112
Aged persons 1,797 31.5% 418 36.6% 421 38.2% 2,637 32.9% 599 104
Children 2,852 50.0% 471 64.8% 642 58.2% 4,279 53.4% 369 64
Ethnic groups 964 16.9% 281 24.6% 280 25.4% 1,534 19.1% 1,030 178
Gay, Lesbian, Bisexual, Transgender persons 610 10.7% 159 13.9% 147 13.3% 921 11.5% 1,716 297
General community in Australia 2,972 52.1% 573 50.1% 486 44.1% 4,053 50.5% 390 67
Men 1,766 30.9% 440 38.5% 446 40.4% 2,662 33.2% 594 103
Migrants, refugees or asylum seekers 718 12.6% 172 15.0% 184 16.7% 1,079 13.5% 1,465 253
Pre-, post-release offenders 276 4.8% 117 10.2% 102 9.2% 498 6.2% 3,174 549
People with chronic illness 1,041 18.2% 239 20.9% 290 26.3% 1,575 19.6% 1,004 174
People with disabilities 1,437 25.2% 413 36.1% 532 48.2% 2,392 29.8% 661 114
People at risk of homelessness 943 16.5% 283 24.8% 296 26.8% 1,527 19.0% 1,035 179
Unemployed persons 806 14.1% 319 27.9% 287 26.0% 1,419 17.7% 1,114 193
Veterans or their families 519 9.1% 121 10.6% 159 14.4% 801 10.0% 1,973 341
Victims of crime 267 4.7% 117 10.2% 85 7.7% 473 5.9% 3,342 578
Victims of disasters 957 16.8% 191 16.7% 167 15.1% 1,323 16.5% 1,195 207
Women 1,941 34.0% 510 44.6% 497 45.1% 2,962 36.9% 534 92
Youth 2,053 36.0% 580 50.7% 604 54.8% 3,253 40.6% 486 84
Other charities 1,091 19.1% 228 19.9% 201 18.2% 1,528 19.1% 1,034 179
Other beneficiaries not listed 310 5.4% 71 6.2% 71 6.4% 456 5.7% 3,466 599
Note: Number of people ≤ 24 years in Queensland = 1,580,636; Number of people ≥75 years in Queensland = 273,333

76 Working Paper No. 65
Beneficiary group
SA
Small Medium Large Total No. people
< 24 years per
charity
No. people
> 75 years
per charity No. % No. % No. % No. %
Aboriginal or TSI 352 14.5% 123 30.7% 212 37.4% 690 20.2% 749 191
Aged persons 832 34.2% 147 36.7% 197 34.7% 1,176 34.5% 439 112
Children 1,079 44.4% 224 55.9% 352 62.1% 1,662 48.7% 311 79
Ethnic groups 402 16.5% 98 24.4% 143 25.2% 645 18.9% 801 205
Gay, Lesbian, Bisexual, Transgender persons 111 4.6% 41 10.2% 78 13.8% 232 6.8% 2,227 569
General community in Australia 1,174 48.3% 224 55.9% 216 38.1% 1,622 47.5% 318 81
Men 734 30.2% 153 38.2% 182 32.1% 1,074 31.5% 481 123
Migrants, refugees or asylum seekers 335 13.8% 84 20.9% 93 16.4% 512 15.0% 1,009 258
Pre-, post-release offenders 97 4.0% 27 6.7% 46 8.1% 170 5.0% 3,039 776
People with chronic illness 409 16.8% 78 19.5% 136 24.0% 626 18.3% 825 211
People with disabilities 573 23.6% 149 37.2% 246 43.4% 971 28.5% 532 136
People at risk of homelessness 367 15.1% 78 19.5% 120 21.2% 565 16.6% 914 234
Unemployed persons 486 20.0% 110 27.4% 118 20.8% 715 20.9% 723 185
Veterans or their families 204 8.4% 36 9.0% 67 11.5% 307 9.0% 1,683 430
Victims of crime 89 3.7% 13 3.2% 37 6.5% 139 4.1% 3,716 949
Victims of disasters 313 12.9% 32 8.0% 22 3.9% 368 10.8% 1,404 359
Women 807 33.2% 184 45.9% 202 35.6% 1,197 35.1% 432 110
Youth 818 33.6% 187 46.6% 210 37.0% 1,223 35.8% 422 108
Other charities 547 22.5% 89 22.2% 74 13.1% 712 20.9% 726 185
Other beneficiaries not listed 188 7.7% 28 7.0% 28 4.9% 244 7.1% 2,117 541
Note: Number of people ≤ 24 years in SA = 516,592; Number of people ≥ 75 years in SA = 131,942

77 Working Paper No. 65
Beneficiary group
WA
Small Medium Large Total No. people
< 24 years
per charity
No. people
> 75 years
per charity No. % No. % No. % No. %
Aboriginal or TSI 556 18.1% 345 44.8% 403 51.1% 1,218 27.4% 688 114
Aged persons 729 23.7% 209 38.2% 246 31.2% 1,184 26.7% 708 117
Children 1,330 43.3% 318 58.1% 489 62.1% 2,159 48.6% 388 64
Ethnic groups 374 12.2% 141 25.8% 166 21.1% 689 15.5% 1,217 202
Gay, Lesbian, Bisexual, Transgender persons 132 4.3% 61 11.2% 76 9.6% 272 6.1% 3,082 511
General community in Australia 1,386 45.1% 295 53.9% 312 39.6% 2,010 45.3% 417 69
Men 682 22.2% 225 41.1% 229 29.1% 1,143 25.7% 734 122
Migrants, refugees or asylum seekers 255 8.3% 105 19.2% 112 14.2% 477 10.7% 1,758 291
Pre-, post-release offenders 119 3.9% 67 12.2% 79 10.0% 265 6.0% 3,164 525
People with chronic illness 380 12.4% 111 20.3% 151 19.2% 645 14.5% 1,300 216
People with disabilities 580 18.9% 224 41.0% 314 39.8% 1,126 25.4% 745 123
People at risk of homelessness 339 11.0% 127 23.2% 153 19.4% 624 14.1% 1,344 223
Unemployed persons 425 13.8% 168 30.7% 166 21.1% 767 17.3% 1,093 181
Veterans or their families 207 6.7% 42 7.7% 57 7.2% 307 6.9% 2,731 453
Victims of crime 97 3.2% 54 9.9% 47 6.0% 198 4.5% 4,234 702
Victims of disasters 346 11.3% 42 7.7% 44 5.6% 434 9.8% 1,932 320
Women 760 24.7% 265 48.4% 265 33.6% 1,299 29.3% 645 107
Youth 897 29.2% 301 55.0% 311 39.5% 1,525 34.4% 550 91
Other charities 400 13.0% 123 22.5% 131 16.6% 661 14.9% 1,268 210
Other beneficiaries not listed 244 7.9% 42 7.7% 46 5.8% 332 7.5% 2,525 419
Note: Number of people ≤ 24 years in WA = 838,415; Number of people ≥ 75 years in WA = 139,012

78 Working Paper No. 65
Beneficiary group
TAS
Small Medium Large Total No. people
< 24 years
per charity
No. people
> 75 years
per charity No. % No. % No. % No. %
Aboriginal or TSI 77 9.2% 60 33.3% 78 39.0% 216 17.7% 740 179
Aged persons 237 28.4% 69 38.3% 77 38.5% 383 31.4% 417 101
Children 310 37.1% 96 53.3% 122 61.0% 531 43.5% 301 73
Ethnic groups 65 7.8% 47 56.1% 48 24.0% 161 13.2% 992 241
Gay, Lesbian, Bisexual, Transgender persons 38 4.6% 34 18.9% 34 17.0% 106 8.7% 1,507 366
General community in Australia 407 48.7% 102 56.7% 83 41.5% 597 48.9% 268 65
Men 203 24.3% 65 36.1% 70 35.0% 341 27.9% 469 114
Migrants, refugees or asylum seekers 55 6.6% 44 24.4% 42 21.0% 141 11.5% 1,133 275
Pre-, post-release offenders 25 3.0% 14 7.8% 22 11.0% 61 5.0% 2,619 635
People with chronic illness 102 12.2% 47 26.1% 51 25.5% 202 16.5% 791 192
People with disabilities 198 23.7% 81 45.0% 93 46.5% 374 30.6% 427 104
People at risk of homelessness 87 10.4% 44 24.4% 43 21.5% 174 14.3% 918 223
Unemployed persons 133 15.9% 52 28.9% 39 19.5% 225 18.4% 710 172
Veterans or their families 54 6.5% 33 18.3% 32 16.0% 120 9.8% 1,332 323
Victims of crime 22 2.6% 23 12.8% 7 3.5% 52 4.3% 3,073 745
Victims of disasters 90 10.8% 29 16.1% 19 9.5% 138 11.3% 1,158 281
Women 230 27.5% 78 43.3% 76 38.0% 387 31.7% 413 100
Youth 258 30.9% 89 49.4% 119 59.5% 469 38.4% 341 83
Other charities 111 13.3% 45 25.0% 27 13.5% 184 15.1% 868 211
Other beneficiaries not listed 55 6.6% 17 9.4% 10 5.0% 82 6.7% 1,949 473
Note: Number of people ≤ 24 years in TAS = 159,784; Number of people ≥ 75 years in TAS = 38,751

79 Working Paper No. 65
Beneficiary group
ACT
Small Medium Large Total No. people
< 24 years
per charity
No. people
> 75 years
per charity No. % No. % No. % No. %
Aboriginal or TSI 64 12.4% 52 30.1% 103 45.6% 221 23.9% 576 83
Aged persons 110 21.4% 50 28.9% 71 21.4% 231 25.0% 551 79
Children 235 45.6% 87 50.3% 137 60.6% 466 50.5% 273 39
Ethnic groups 74 14.4% 38 22.0% 63 27.9% 177 19.2% 719 103
Gay, Lesbian, Bisexual, Transgender persons 24 4.9% 18 10.4% 52 23.0% 96 10.4% 1,326 191
General community in Australia 222 43.1% 94 54.3% 119 52.7% 436 47.2% 292 42
Men 127 24.7% 49 28.3% 78 34.5% 255 27.6% 499 72
Migrants, refugees or asylum seekers 58 11.3% 28 16.2% 50 22.1% 137 14.8% 929 134
Pre-, post-release offenders 23 4.5% 9 5.2% 30 13.3% 62 6.7% 2,054 295
People with chronic illness 75 14.5% 15 15.8% 31 23.3% 152 16.5% 838 120
People with disabilities 89 17.3% 54 31.2% 77 34.1% 221 23.9% 576 83
People at risk of homelessness 55 10.7% 29 16.8% 53 23.5% 137 14.8% 929 134
Unemployed persons 59 11.5% 29 16.8% 48 21.2% 137 14.8% 929 134
Veterans or their families 33 6.4% 15 8.7% 24 10.6% 72 7.8% 1,768 254
Victims of crime 18 3.5% 5 2.9% 15 6.6% 38 4.1% 3,351 482
Victims of disasters 38 7.4% 16 9.2% 17 7.5% 71 7.7% 1,793 258
Women 151 29.3% 71 41.0% 81 35.8% 304 32.9% 419 60
Youth 189 36.7% 91 52.6% 130 57.5% 413 44.7% 308 44
Other charities 98 19.0% 42 24.3% 40 17.7% 180 19.5% 707 102
Other beneficiaries not listed 52 10.1% 27 15.6% 24 11.1% 105 11.4% 1,213 174
Note: Number of people ≤ 24 years in ACT = 127,324; Number of people ≥ 75 years in ACT = 18,309
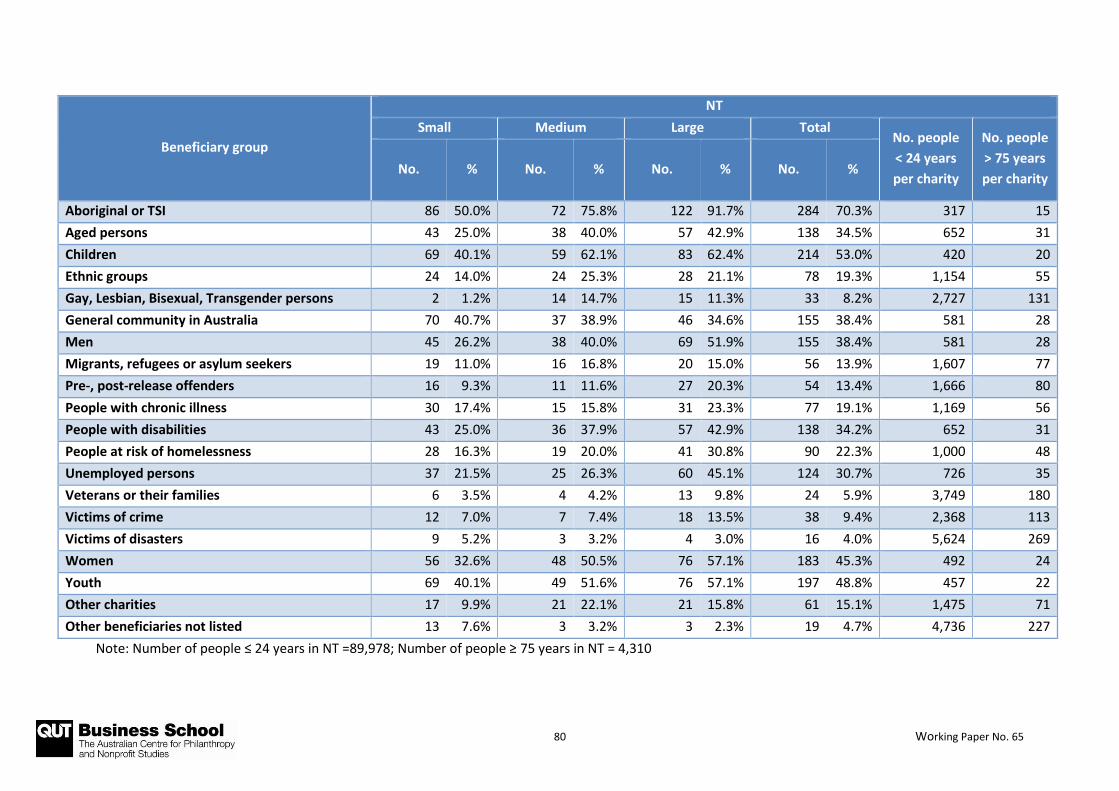
80 Working Paper No. 65
Beneficiary group
NT
Small Medium Large Total No. people
< 24 years
per charity
No. people
> 75 years
per charity No. % No. % No. % No. %
Aboriginal or TSI 86 50.0% 72 75.8% 122 91.7% 284 70.3% 317 15
Aged persons 43 25.0% 38 40.0% 57 42.9% 138 34.5% 652 31
Children 69 40.1% 59 62.1% 83 62.4% 214 53.0% 420 20
Ethnic groups 24 14.0% 24 25.3% 28 21.1% 78 19.3% 1,154 55
Gay, Lesbian, Bisexual, Transgender persons 2 1.2% 14 14.7% 15 11.3% 33 8.2% 2,727 131
General community in Australia 70 40.7% 37 38.9% 46 34.6% 155 38.4% 581 28
Men 45 26.2% 38 40.0% 69 51.9% 155 38.4% 581 28
Migrants, refugees or asylum seekers 19 11.0% 16 16.8% 20 15.0% 56 13.9% 1,607 77
Pre-, post-release offenders 16 9.3% 11 11.6% 27 20.3% 54 13.4% 1,666 80
People with chronic illness 30 17.4% 15 15.8% 31 23.3% 77 19.1% 1,169 56
People with disabilities 43 25.0% 36 37.9% 57 42.9% 138 34.2% 652 31
People at risk of homelessness 28 16.3% 19 20.0% 41 30.8% 90 22.3% 1,000 48
Unemployed persons 37 21.5% 25 26.3% 60 45.1% 124 30.7% 726 35
Veterans or their families 6 3.5% 4 4.2% 13 9.8% 24 5.9% 3,749 180
Victims of crime 12 7.0% 7 7.4% 18 13.5% 38 9.4% 2,368 113
Victims of disasters 9 5.2% 3 3.2% 4 3.0% 16 4.0% 5,624 269
Women 56 32.6% 48 50.5% 76 57.1% 183 45.3% 492 24
Youth 69 40.1% 49 51.6% 76 57.1% 197 48.8% 457 22
Other charities 17 9.9% 21 22.1% 21 15.8% 61 15.1% 1,475 71
Other beneficiaries not listed 13 7.6% 3 3.2% 3 2.3% 19 4.7% 4,736 227
Note: Number of people ≤ 24 years in NT =89,978; Number of people ≥ 75 years in NT = 4,310

81 Working Paper No. 65
Beneficiary group
All charities across Australia
Small Medium Large Total No. people
< 24 years
per charity
No. people
> 75 years
per charity No. % No. % No. % No. %
Aboriginal or TSI 4,691 15.6% 2,187 32.8% 3,083 42.2% 10,038 23% 752 151
Aged persons 8,601 28.6% 2,270 34.1% 2,424 33.2% 13,291 30% 568 114
Children 13,738 45.6% 3,865 45.6% 4,323 59.2% 22,108 50% 341 69
Ethnic groups 4,172 13.9% 1,632 24.5% 1,824 25.0% 7,674 17% 984 198
Gay, Lesbian, Bisexual, Transgender persons 1,556 5.2% 769 11.5% 939 12.9% 3,290 7% 2,295 461
General community in Australia 13,566 45.1% 3,417 51.3% 3,122 42.8% 20,225 46% 373 75
Men 7,801 25.9% 2,322 34.8% 2,365 32.4% 12,553 28% 601 121
Migrants, refugees or asylum seekers 3,003 10.0% 1,172 17.6% 1,267 17.4% 5,473 12% 1,379 277
Pre-, post-release offenders 1,092 3.6% 535 8.0% 639 8.8% 2,274 5% 3,320 667
People with chronic illness 4,150 13.8% 1,253 18.8% 1,572 21.5% 7,010 16% 1,077 216
People with disabilities 6,048 20.1% 2,345 35.1% 3,028 41.5% 11,481 26% 658 132
People at risk of homelessness 3,498 11.6% 1,385 20.8% 1,551 21.2% 6,458 15% 1,169 235
Unemployed persons 4,313 14.3% 1,667 25.0% 1,576 21.6% 7,602 17% 993 199
Veterans or their families 2,608 8.7% 566 8.5% 800 11.0% 3,990 9% 1,892 380
Victims of crime 1,055 3.5% 510 7.7% 478 6.5% 2,052 5% 3,679 739
Victims of disasters 3,188 10.5% 682 10.2% 611 8.4% 4,501 10% 1,677 337
Women 8,726 29.0% 2,790 41.9% 2,679 36.7% 14,274 32% 529 106
Youth 9,493 31.5% 3,077 46.2% 3,633 49.8% 16,316 37% 463 93
Other charities 5,584 18.6% 1,317 19.8% 1,151 15.8% 8,088 18% 933 187
Other beneficiaries not listed 2,677 8.9% 510 7.7% 469 6.4% 3,676 8% 2,054 413
Note: Number of people ≤ 24 years in Australia =7,549,389; Number of people ≥ 75 years in Australia = 1,516,386

82 Working Paper No. 65
Appendix 7. Top 10 operating countries by charity size for charities based
in each state
Ranking
NSW
Small Medium Large Total
Country % Country % Country % Country %
1 The Philippines
12.5% India 13.3% Papua New Guinea
20.2% The Philippines
13.4%
2 India 10.4%
The Philippines
12.8% India 19.2% India 12.8%
3 New Zealand
8.8% New Zealand 12.8% New Zealand
18.7% New Zealand 11.7%
4 The United States
6.8% Indonesia 12.8% The Philippines
16.6% Papua New Guinea
9.8%
5 The United Kingdom
6.6% Papua New Guinea
11.7% Indonesia 16.1% Indonesia 9.5%
6 Indonesia 6.0% Cambodia 11.2% China 15.0%
The United States
8.5%
7 Kenya 5.9% Thailand 10.2% Vietnam 15.0% Cambodia 8.0%
8 Papua New Guinea
5.5% The United States
9.2% Cambodia 14.5% The United Kingdom
7.9%
9 Fiji 5.3% China 9.2%
The United States
13.0% China 6.9%
10 Uganda 5.3%
The United Kingdom
8.7% The United Kingdom
10.9% Kenya 6.8%
Number of charities
546 196 193 938
Ranking
VIC
Small Medium Large Total
Country % Country % Country % Country %
1 India 15.9% New Zealand 23.2% Indonesia 23.4% India 16.2%
2 Cambodia 9.6%
The Philippines
11.2% India 22.7% New Zealand 12.6%
3 The Philippines
9.1% Thailand 11.2% Papua New Guinea
22.0% Cambodia 11.0%
4 New Zealand
7.7% India 10.4% China 22.0% The Philippines
10.7%
5 The United States
7.1% The United States
10.4% Cambodia 20.6% Indonesia 9.6%
6 Uganda 7.1% Indonesia 9.6%
New Zealand
18.4% Papua New Guinea
8.6%
7 Kenya 5.9%
The United Kingdom
8.0% Thailand 17.0% China 8.6%
8 The United Kingdom
5.7% Fiji 8.0% The Philippines
15.6% The United States
8.6%
9 Indonesia 5.2%
Papua New Guinea
7.2% Vietnam 15.6% Thailand 8.5%
10 Vietnam 5.2% Malaysia 7.2% Timor-Leste 14.9% Vietnam 7.1%
Number of charities
439 125 141 708

83 Working Paper No. 65
Ranking
QLD
Small Medium Large Total
Country % Country % Country % Country %
1 India 25.0% Thailand 20.9%
Papua New Guinea
32.1% The Philippines
13.4%
2 The Philippines
11.9% Papua New Guinea
17.4% Indonesia 21.4% India 13.4%
3 New Zealand
7.9% The Philippines
16.3% New Zealand
19.6% Papua New Guinea
12.7%
4 Papua New Guinea
7.6% India 12.2% The Philippines
17.9% New Zealand 9.6%
5 Cambodia 6.6%
The United States
10.5% Solomon Islands
17.9% Thailand 9.4%
6 The United States
6.6% Uganda 10.5% India 16.3% The United States
8.0%
7 Thailand 6.3% Fiji 10.5% Vanuatu 16.1% Indonesia 7.8%
8 Vietnam 5.9% New Zealand 8.1%
The United States
12.5% Cambodia 7.8%
9 Vanuatu 5.9% Cambodia 8.1% Fiji 12.5% Vanuatu 7.3%
10 Indonesia 5.3% Nepal 8.1% Cambodia 12.5% Fiji 6.7%
Number of charities
303 86 56 449
Ranking
SA
Small Medium Large Total
Country % Country % Country % Country %
1 India 13.9%
The United States
16.2% India 19.0% India 14.3%
2 The Philippines
12.7% India 13.5% Cambodia 19.0% The Philippines
12.0%
3 Uganda 11.4% Vietnam 13.5% Indonesia 14.3% Cambodia 10.6%
4 Papua New Guinea
9.5% Myanmar 13.5% Kenya 14.3% Uganda 10.1%
5 Cambodia 9.5% Cambodia 10.8%
The Philippines
14.3% Papua New Guinea
9.2%
6 Indonesia 7.6% Indonesia 10.8% china 14.3% Indonesia 8.8%
7 The United States
6.3% Kenya 10.8% Vietnam 9.5% Kenya 7.4%
8 Vietnam 5.7%
The United Kingdom
10.8% The United Kingdom
9.5% Vietnam 7.4%
9 Kenya 5.7% Sri Lanka 10.8%
Papua New Guinea
9.5% The United States
7.4%
10 New Zealand
4.4% The Philippines
8.1% New Zealand
9.5% The United Kingdom
6.0%
Number of charities
158 37 21 217
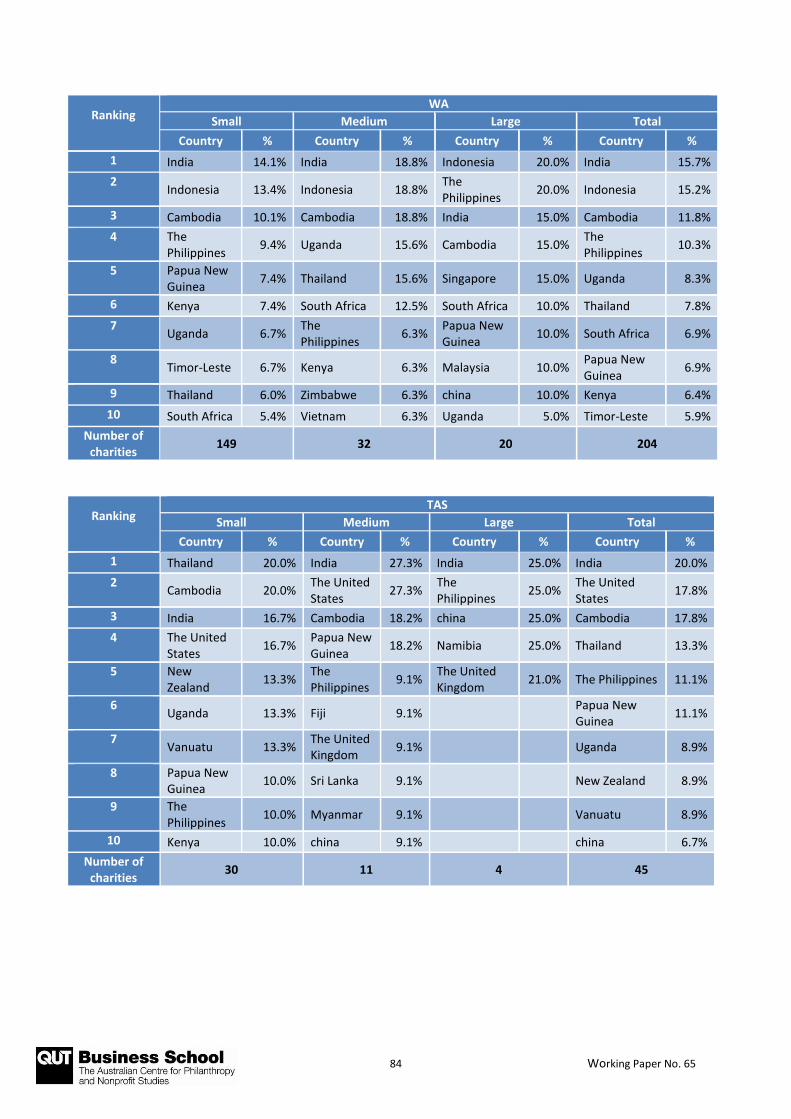
84 Working Paper No. 65
Ranking
WA
Small Medium Large Total
Country % Country % Country % Country %
1 India 14.1% India 18.8% Indonesia 20.0% India 15.7%
2 Indonesia 13.4% Indonesia 18.8%
The Philippines
20.0% Indonesia 15.2%
3 Cambodia 10.1% Cambodia 18.8% India 15.0% Cambodia 11.8%
4 The Philippines
9.4% Uganda 15.6% Cambodia 15.0% The Philippines
10.3%
5 Papua New Guinea
7.4% Thailand 15.6% Singapore 15.0% Uganda 8.3%
6 Kenya 7.4% South Africa 12.5% South Africa 10.0% Thailand 7.8%
7 Uganda 6.7%
The Philippines
6.3% Papua New Guinea
10.0% South Africa 6.9%
8 Timor-Leste 6.7% Kenya 6.3% Malaysia 10.0%
Papua New Guinea
6.9%
9 Thailand 6.0% Zimbabwe 6.3% china 10.0% Kenya 6.4%
10 South Africa 5.4% Vietnam 6.3% Uganda 5.0% Timor-Leste 5.9%
Number of charities
149 32 20 204
Ranking
TAS
Small Medium Large Total
Country % Country % Country % Country %
1 Thailand 20.0% India 27.3% India 25.0% India 20.0%
2 Cambodia 20.0%
The United States
27.3% The Philippines
25.0% The United States
17.8%
3 India 16.7% Cambodia 18.2% china 25.0% Cambodia 17.8%
4 The United States
16.7% Papua New Guinea
18.2% Namibia 25.0% Thailand 13.3%
5 New Zealand
13.3% The Philippines
9.1% The United Kingdom
21.0% The Philippines 11.1%
6 Uganda 13.3% Fiji 9.1%
Papua New Guinea
11.1%
7 Vanuatu 13.3%
The United Kingdom
9.1%
Uganda 8.9%
8 Papua New Guinea
10.0% Sri Lanka 9.1%
New Zealand 8.9%
9 The Philippines
10.0% Myanmar 9.1%
Vanuatu 8.9%
10 Kenya 10.0% china 9.1%
china 6.7%
Number of charities
30 11 4 45
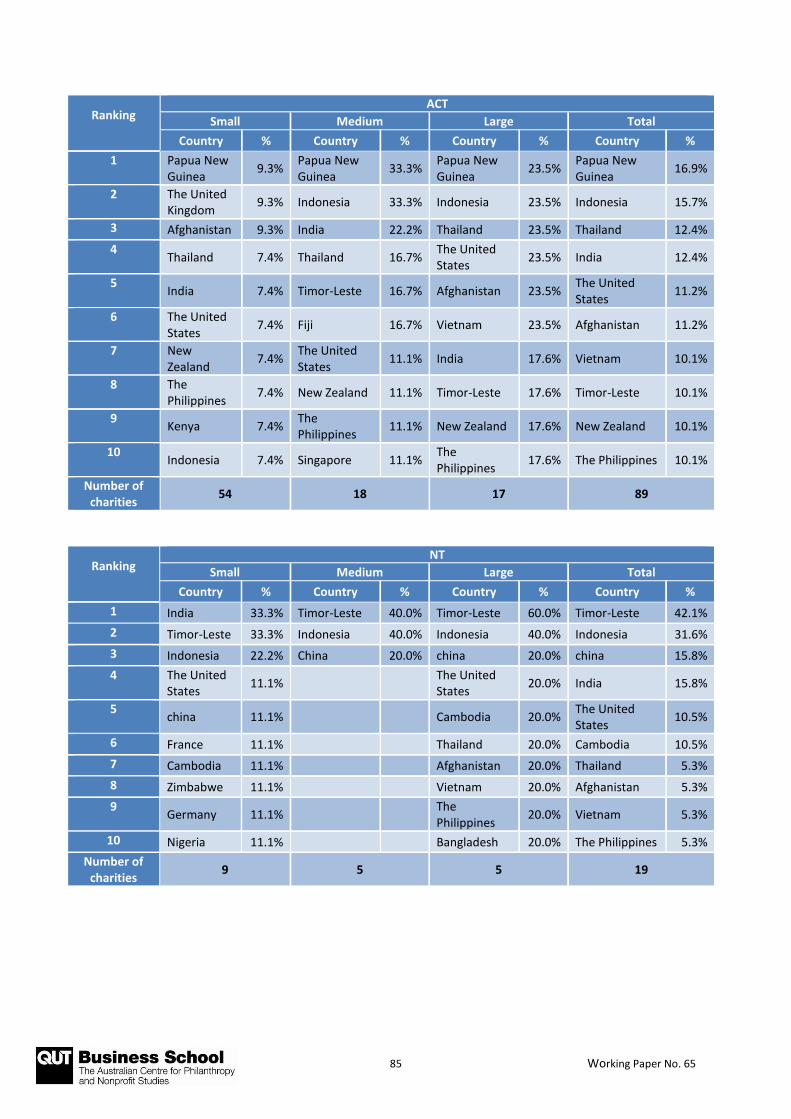
85 Working Paper No. 65
Ranking
ACT
Small Medium Large Total
Country % Country % Country % Country %
1 Papua New Guinea
9.3% Papua New Guinea
33.3% Papua New Guinea
23.5% Papua New Guinea
16.9%
2 The United Kingdom
9.3% Indonesia 33.3% Indonesia 23.5% Indonesia 15.7%
3 Afghanistan 9.3% India 22.2% Thailand 23.5% Thailand 12.4%
4 Thailand 7.4% Thailand 16.7%
The United States
23.5% India 12.4%
5 India 7.4% Timor-Leste 16.7% Afghanistan 23.5%
The United States
11.2%
6 The United States
7.4% Fiji 16.7% Vietnam 23.5% Afghanistan 11.2%
7 New Zealand
7.4% The United States
11.1% India 17.6% Vietnam 10.1%
8 The Philippines
7.4% New Zealand 11.1% Timor-Leste 17.6% Timor-Leste 10.1%
9 Kenya 7.4%
The Philippines
11.1% New Zealand 17.6% New Zealand 10.1%
10 Indonesia 7.4% Singapore 11.1%
The Philippines
17.6% The Philippines 10.1%
Number of charities
54 18 17 89
Ranking
NT
Small Medium Large Total
Country % Country % Country % Country %
1 India 33.3% Timor-Leste 40.0% Timor-Leste 60.0% Timor-Leste 42.1%
2 Timor-Leste 33.3% Indonesia 40.0% Indonesia 40.0% Indonesia 31.6%
3 Indonesia 22.2% China 20.0% china 20.0% china 15.8%
4 The United States
11.1%
The United States
20.0% India 15.8%
5 china 11.1%
Cambodia 20.0%
The United States
10.5%
6 France 11.1%
Thailand 20.0% Cambodia 10.5%
7 Cambodia 11.1%
Afghanistan 20.0% Thailand 5.3%
8 Zimbabwe 11.1%
Vietnam 20.0% Afghanistan 5.3%
9 Germany 11.1%
The Philippines
20.0% Vietnam 5.3%
10 Nigeria 11.1%
Bangladesh 20.0% The Philippines 5.3%
Number of charities
9 5 5 19
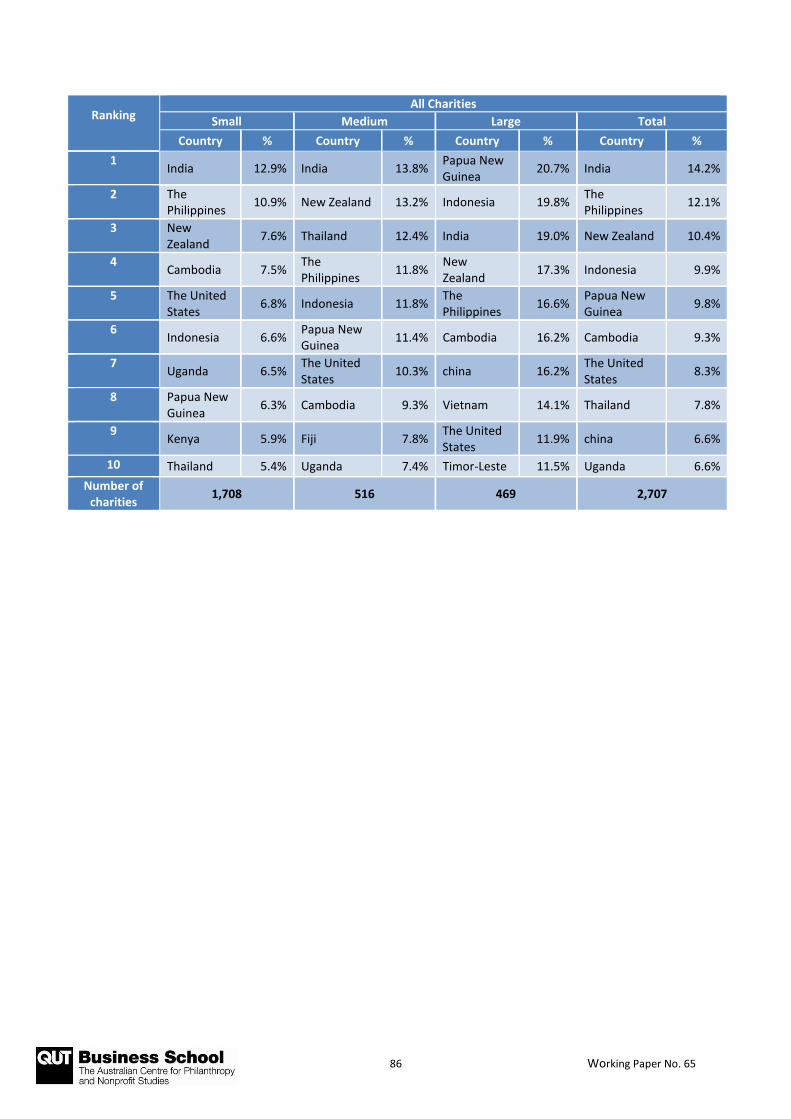
86 Working Paper No. 65
Ranking
All Charities
Small Medium Large Total
Country % Country % Country % Country %
1 India 12.9% India 13.8%
Papua New Guinea
20.7% India 14.2%
2 The Philippines
10.9% New Zealand 13.2% Indonesia 19.8% The Philippines
12.1%
3 New Zealand
7.6% Thailand 12.4% India 19.0% New Zealand 10.4%
4 Cambodia 7.5%
The Philippines
11.8% New Zealand
17.3% Indonesia 9.9%
5 The United States
6.8% Indonesia 11.8% The Philippines
16.6% Papua New Guinea
9.8%
6 Indonesia 6.6%
Papua New Guinea
11.4% Cambodia 16.2% Cambodia 9.3%
7 Uganda 6.5%
The United States
10.3% china 16.2% The United States
8.3%
8 Papua New Guinea
6.3% Cambodia 9.3% Vietnam 14.1% Thailand 7.8%
9 Kenya 5.9% Fiji 7.8%
The United States
11.9% china 6.6%
10 Thailand 5.4% Uganda 7.4% Timor-Leste 11.5% Uganda 6.6%
Number of charities
1,708 516 469 2,707