the state of the american traveler...about the state of the american traveler o online survey...
TRANSCRIPT
THE STATE OF THE AMERICAN TRAVELER
MOBILE EDITION
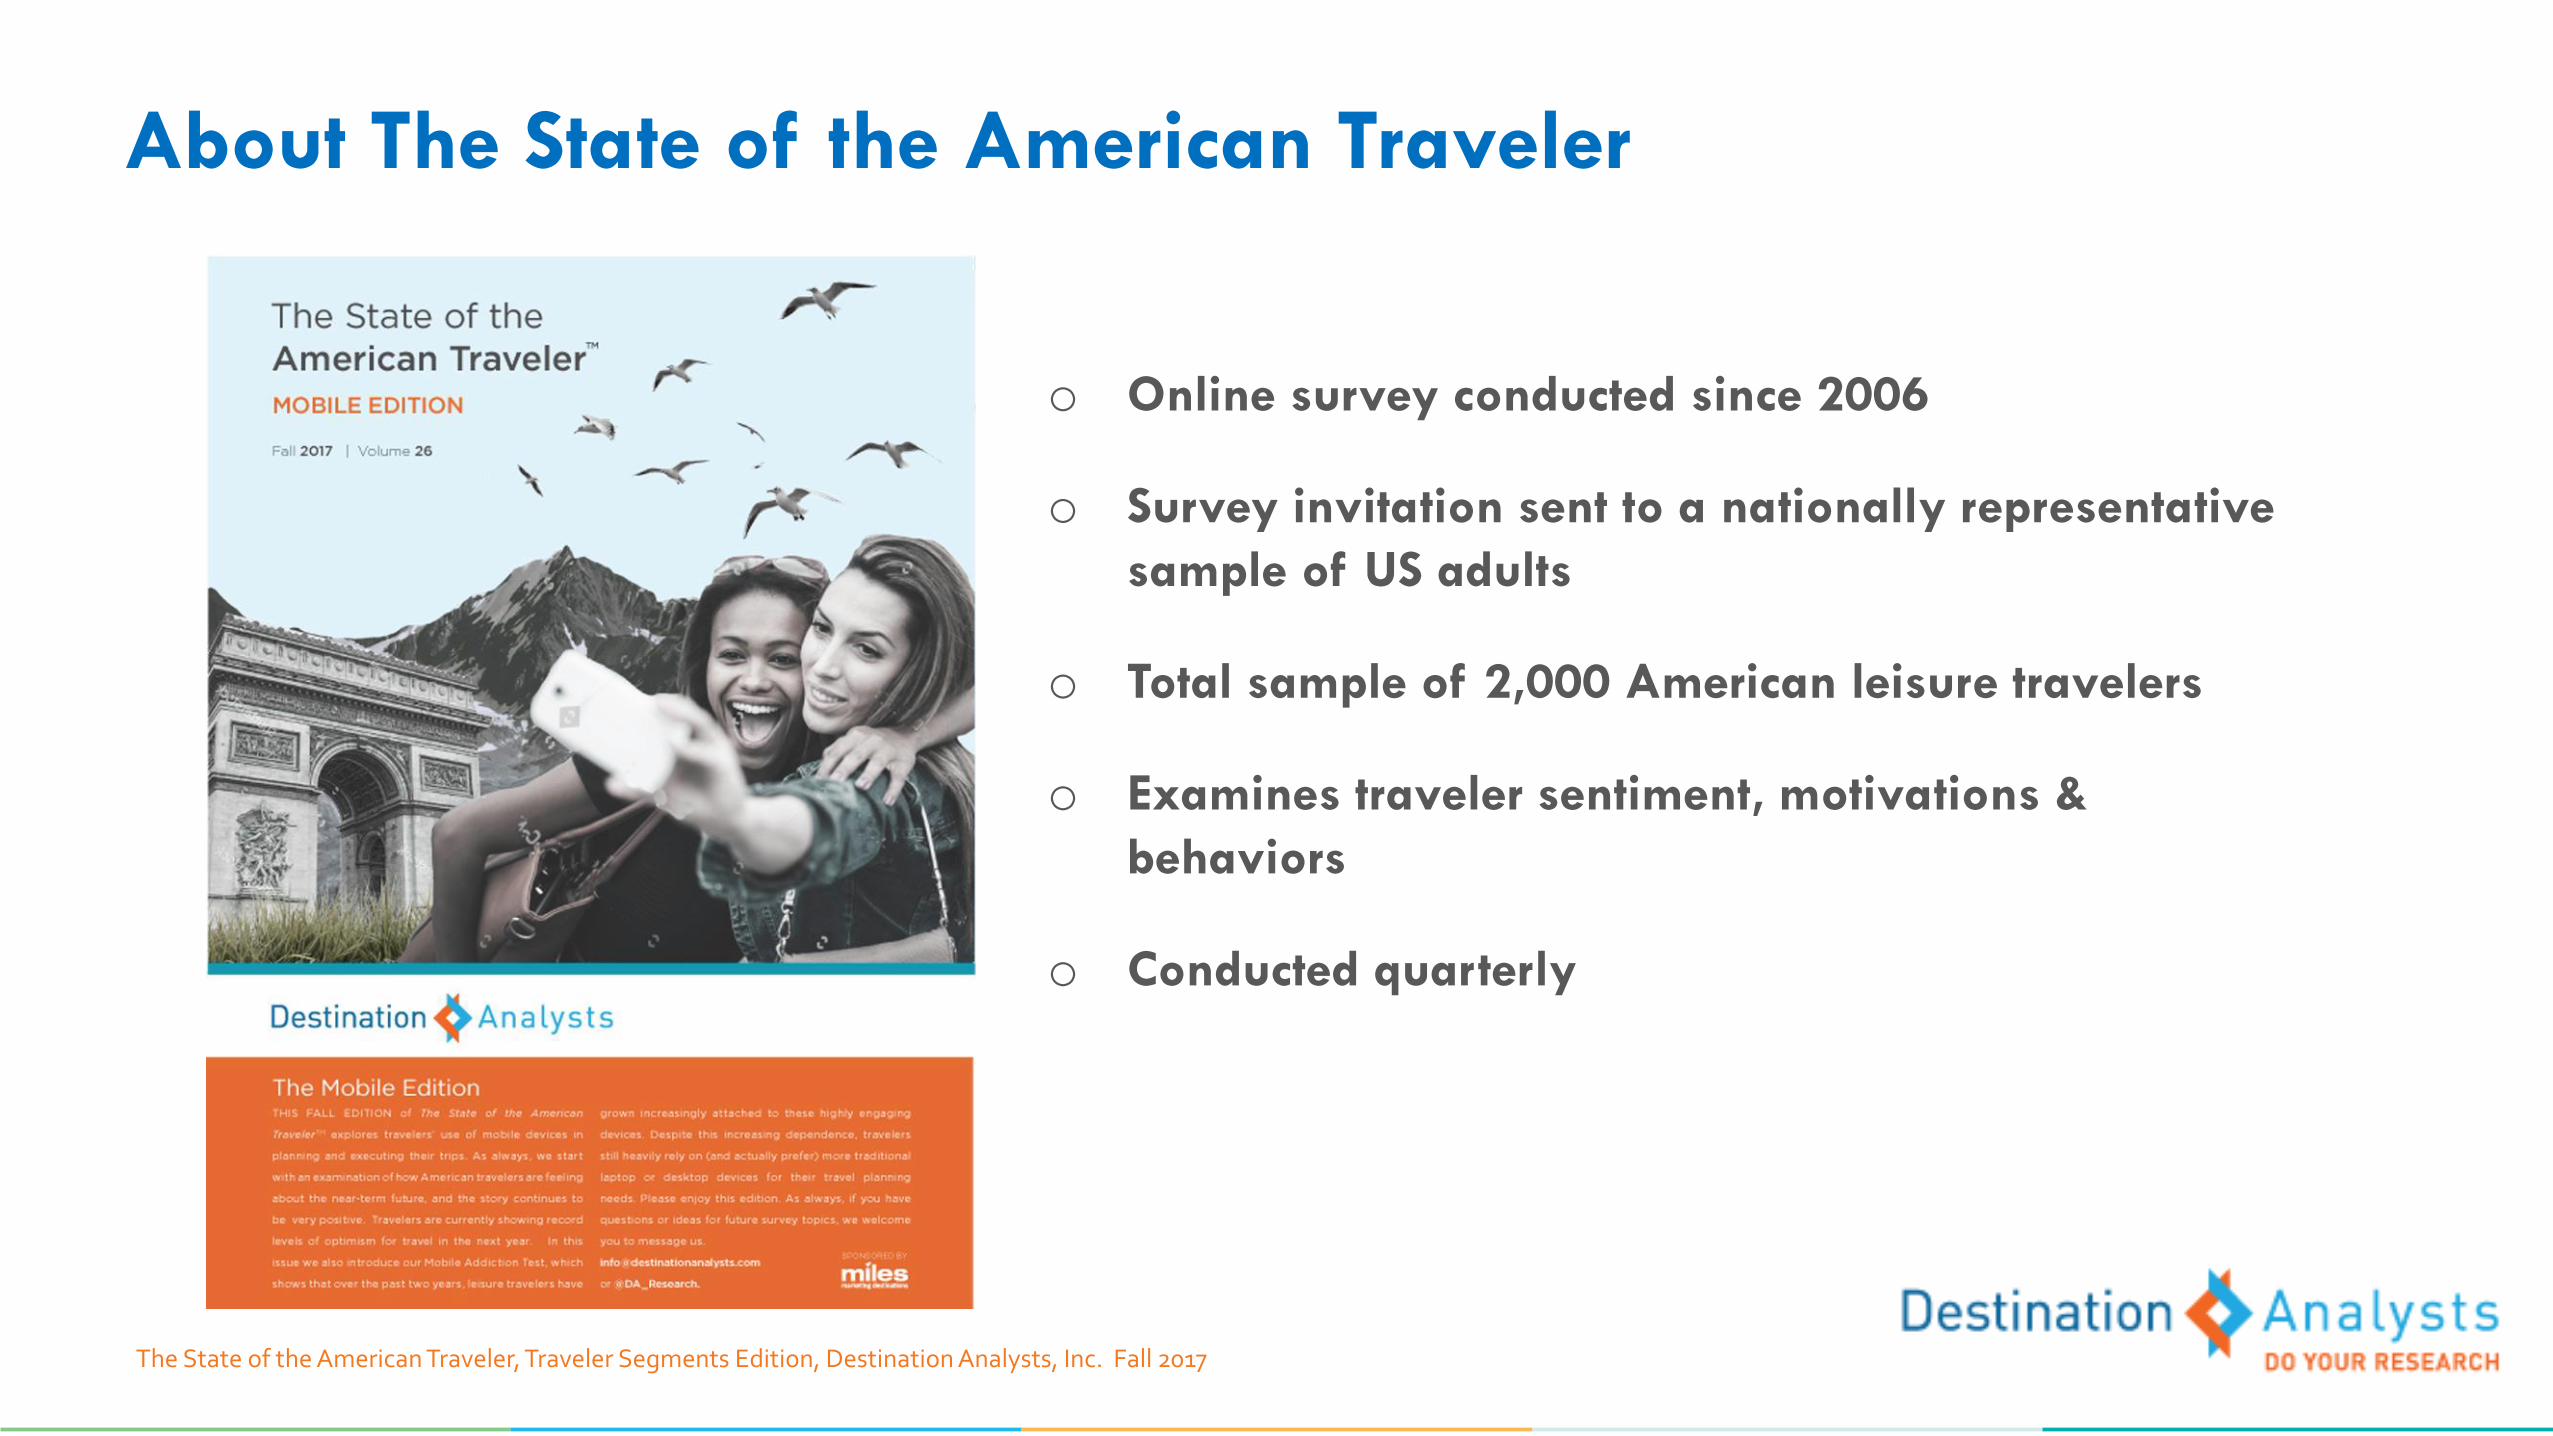
About The State of the American Traveler
o Online survey conducted since 2006
o Survey invitation sent to a nationally representative
sample of US adults
o Total sample of 2,000 American leisure travelers
o Examines traveler sentiment, motivations &
behaviors
o Conducted quarterly
The State of the American Traveler, Traveler Segments Edition, Destination Analysts, Inc. Fall 2017
American Traveler Sentiment
October 2017
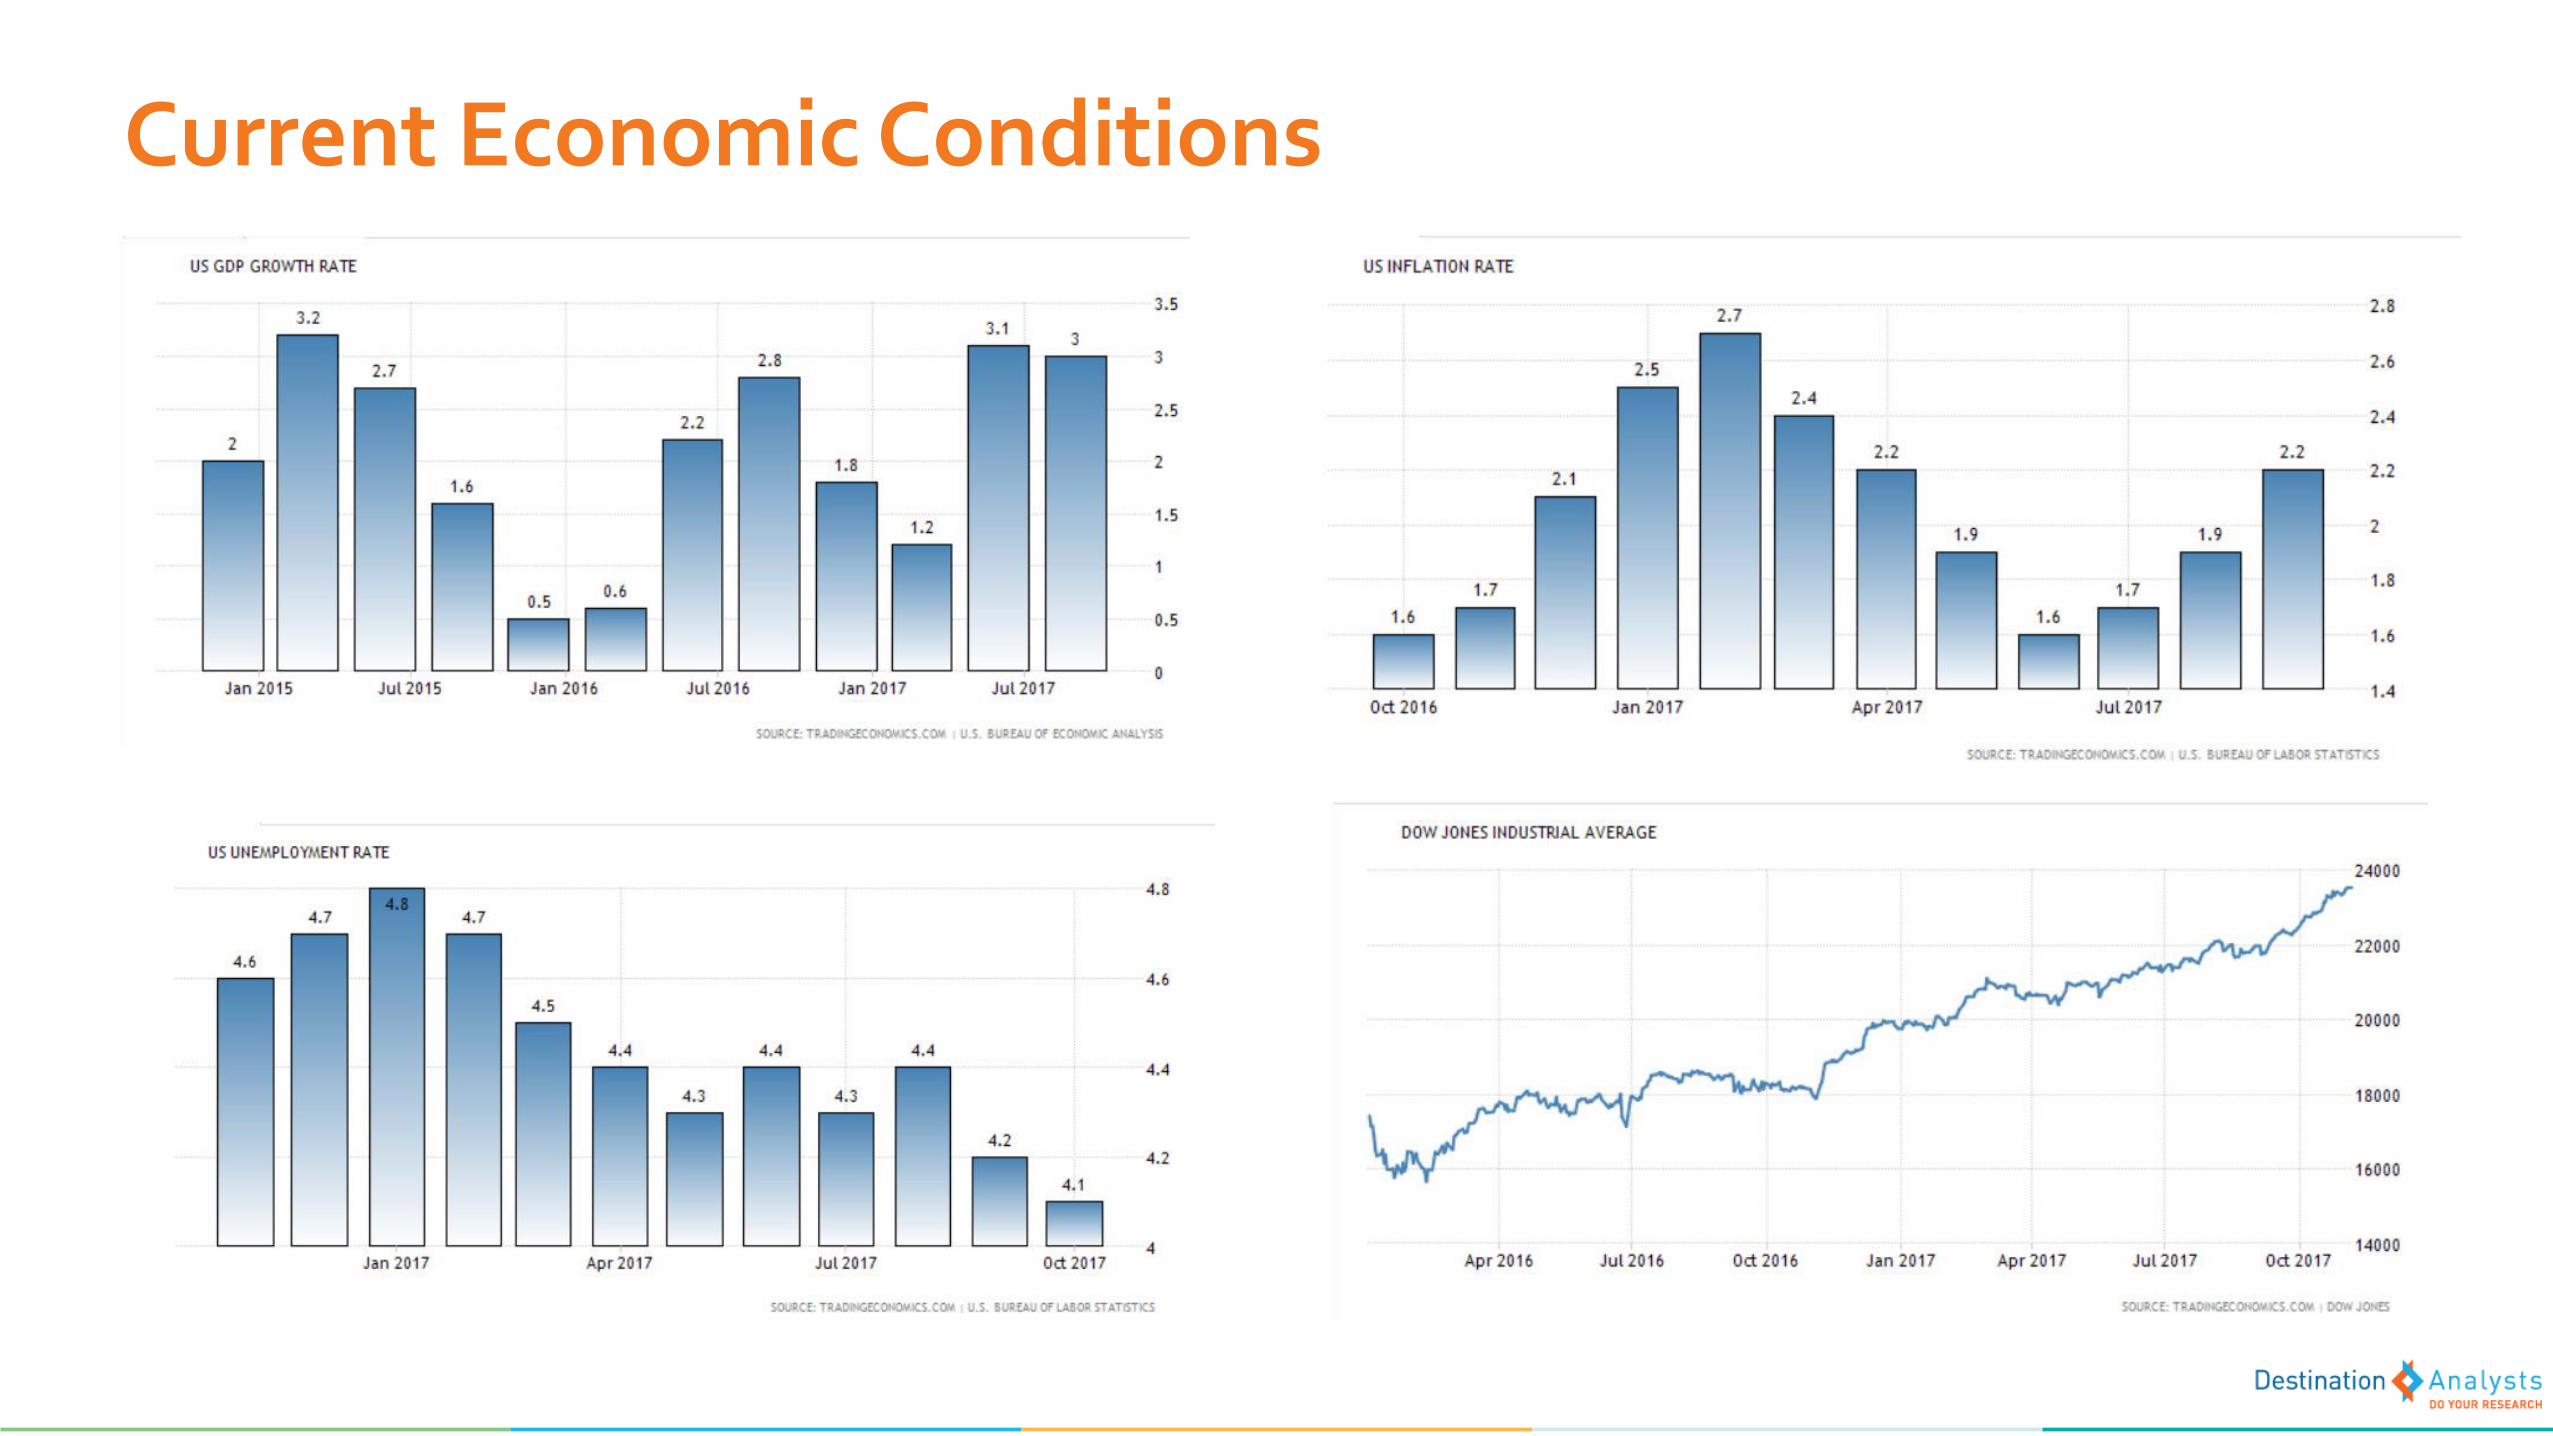
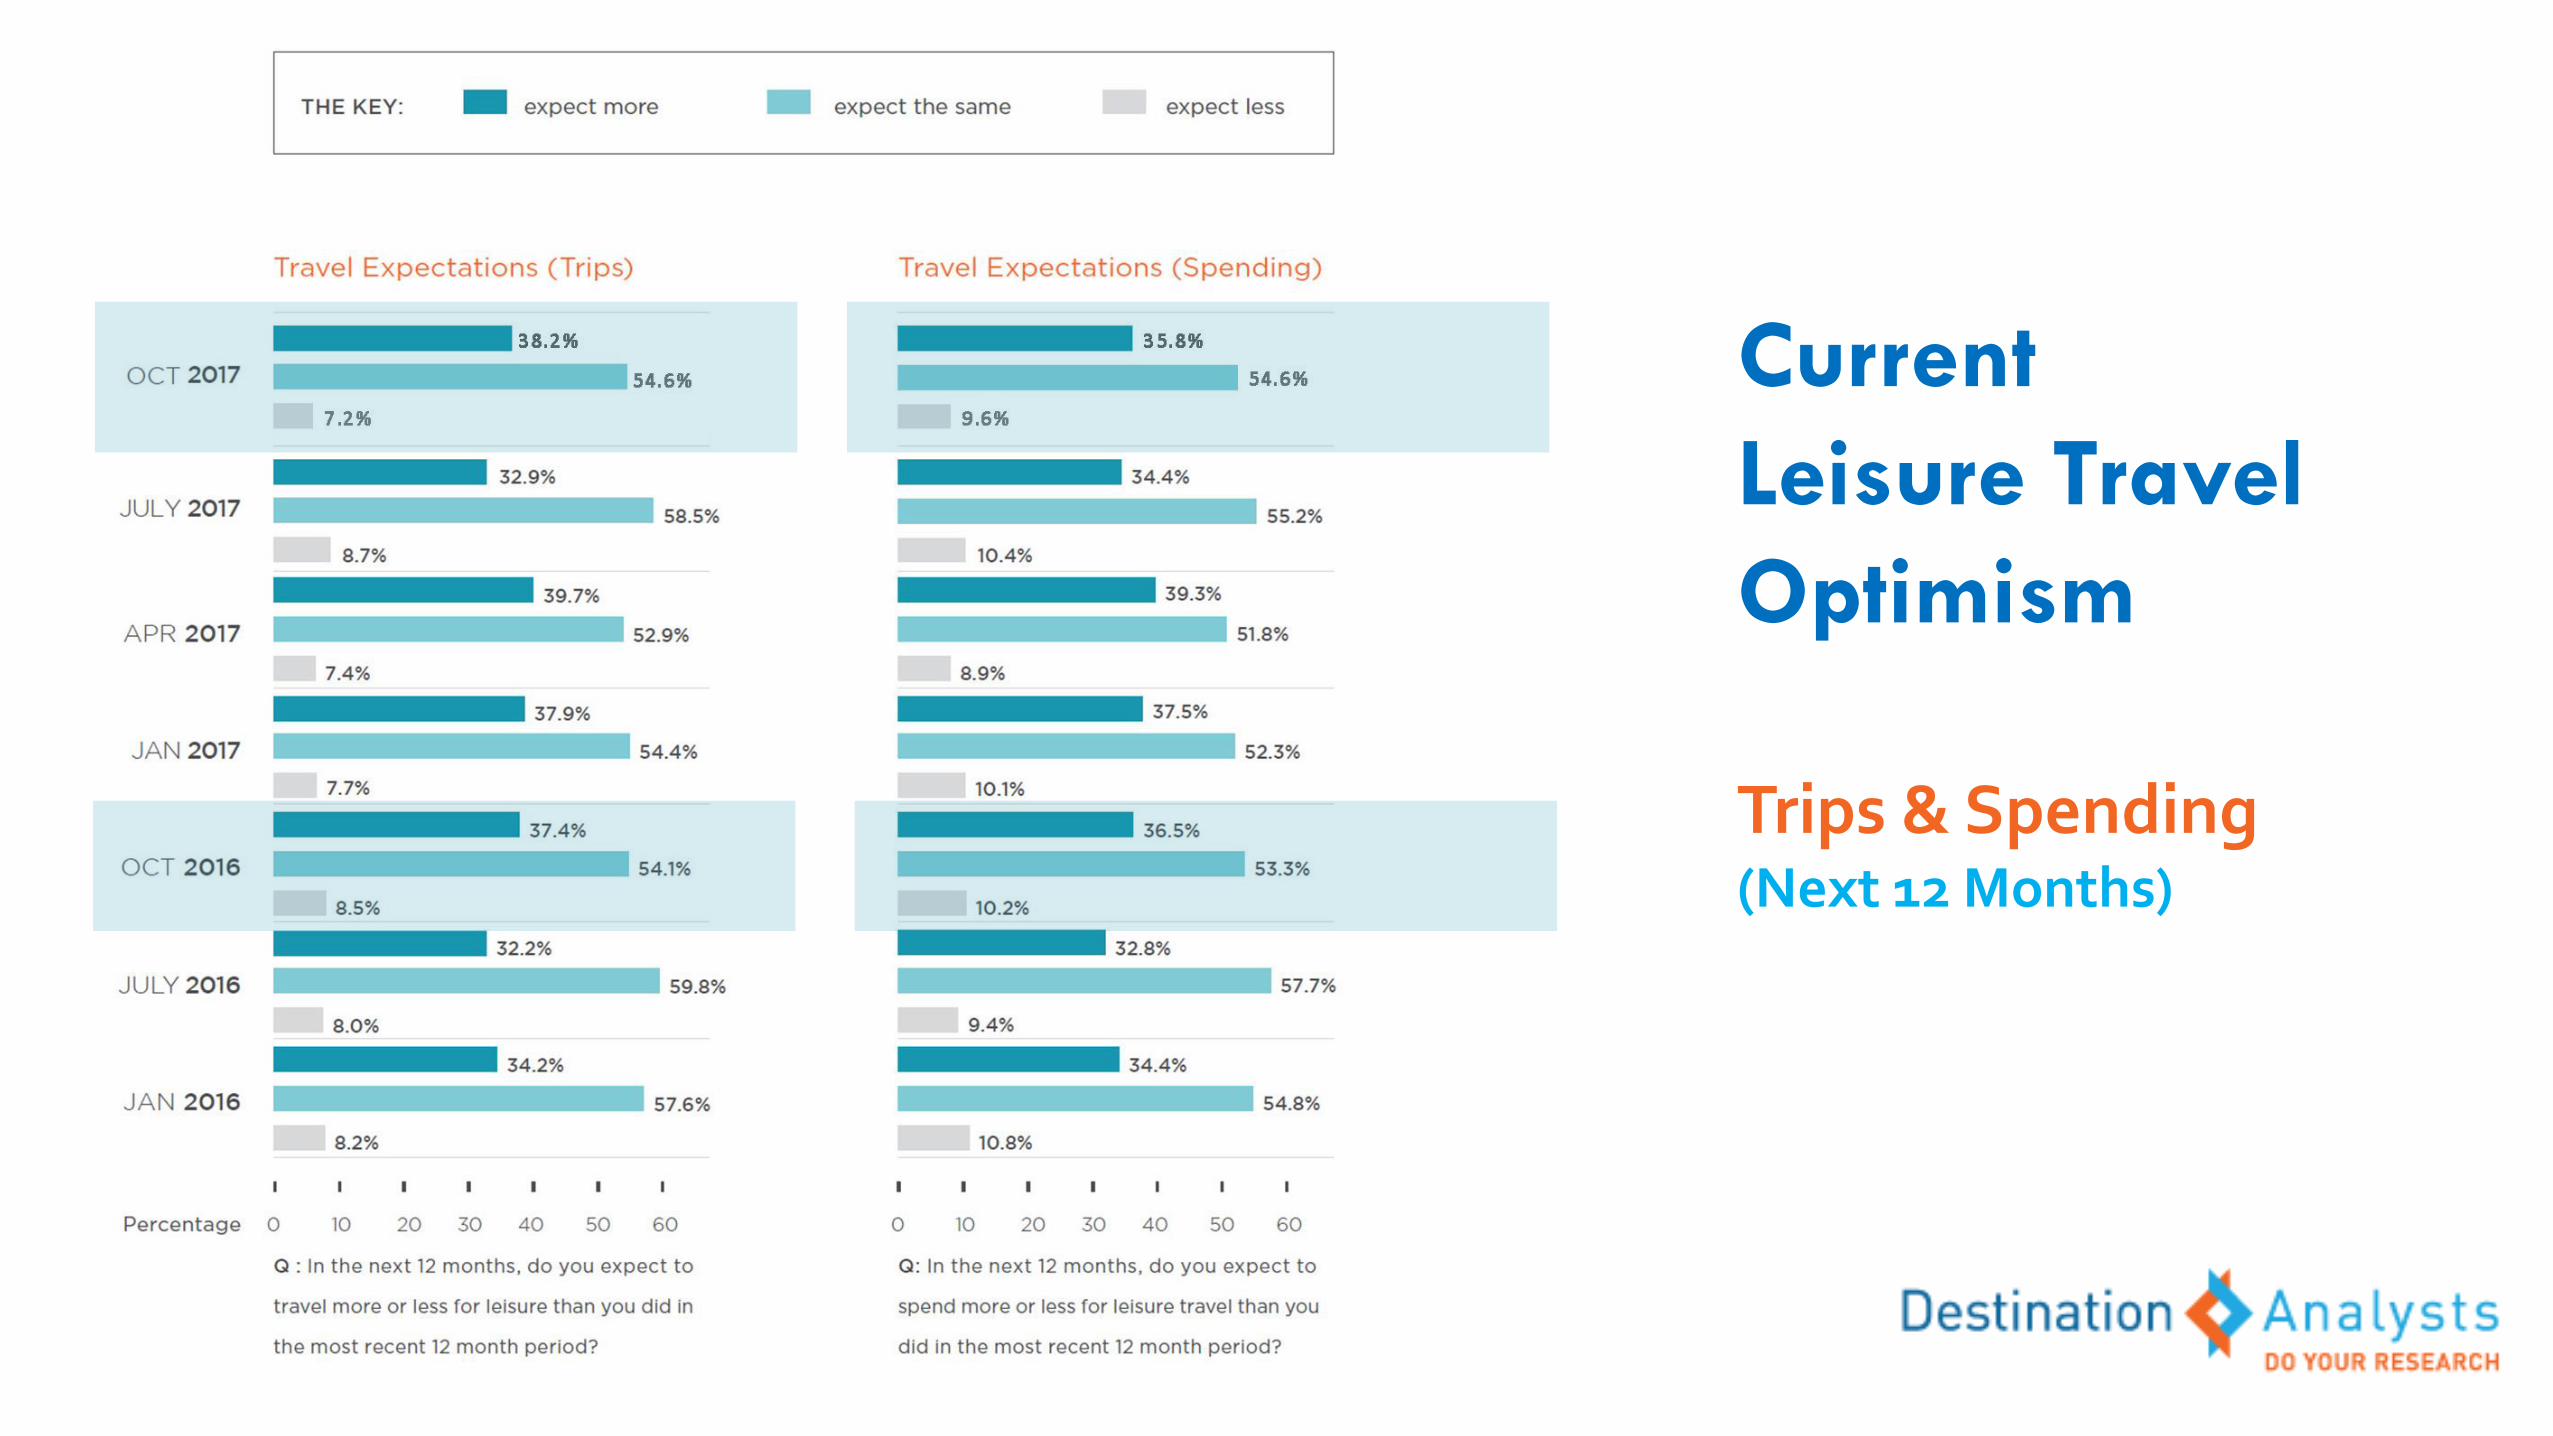
Current
Leisure Travel
Optimism
Trips & Spending (Next 12 Months)
40.7% 39.3%
53.6%
45.9% 46.6%
40.7%39.5%
32.9% 32.4%
26.4%23.2%
16.9%13.0%
13.7% 15.6% 12.7%
17.6%
0%
10%
20%
30%
40%
50%
60%
July2010
Jan2011
July2011
Jan2012
July2012
Jan2013
July2013
Jan2014
July2014
Jan2015
July2015
Jan2016
July2016
Oct2017
Jan2017
July2017
Oct2017
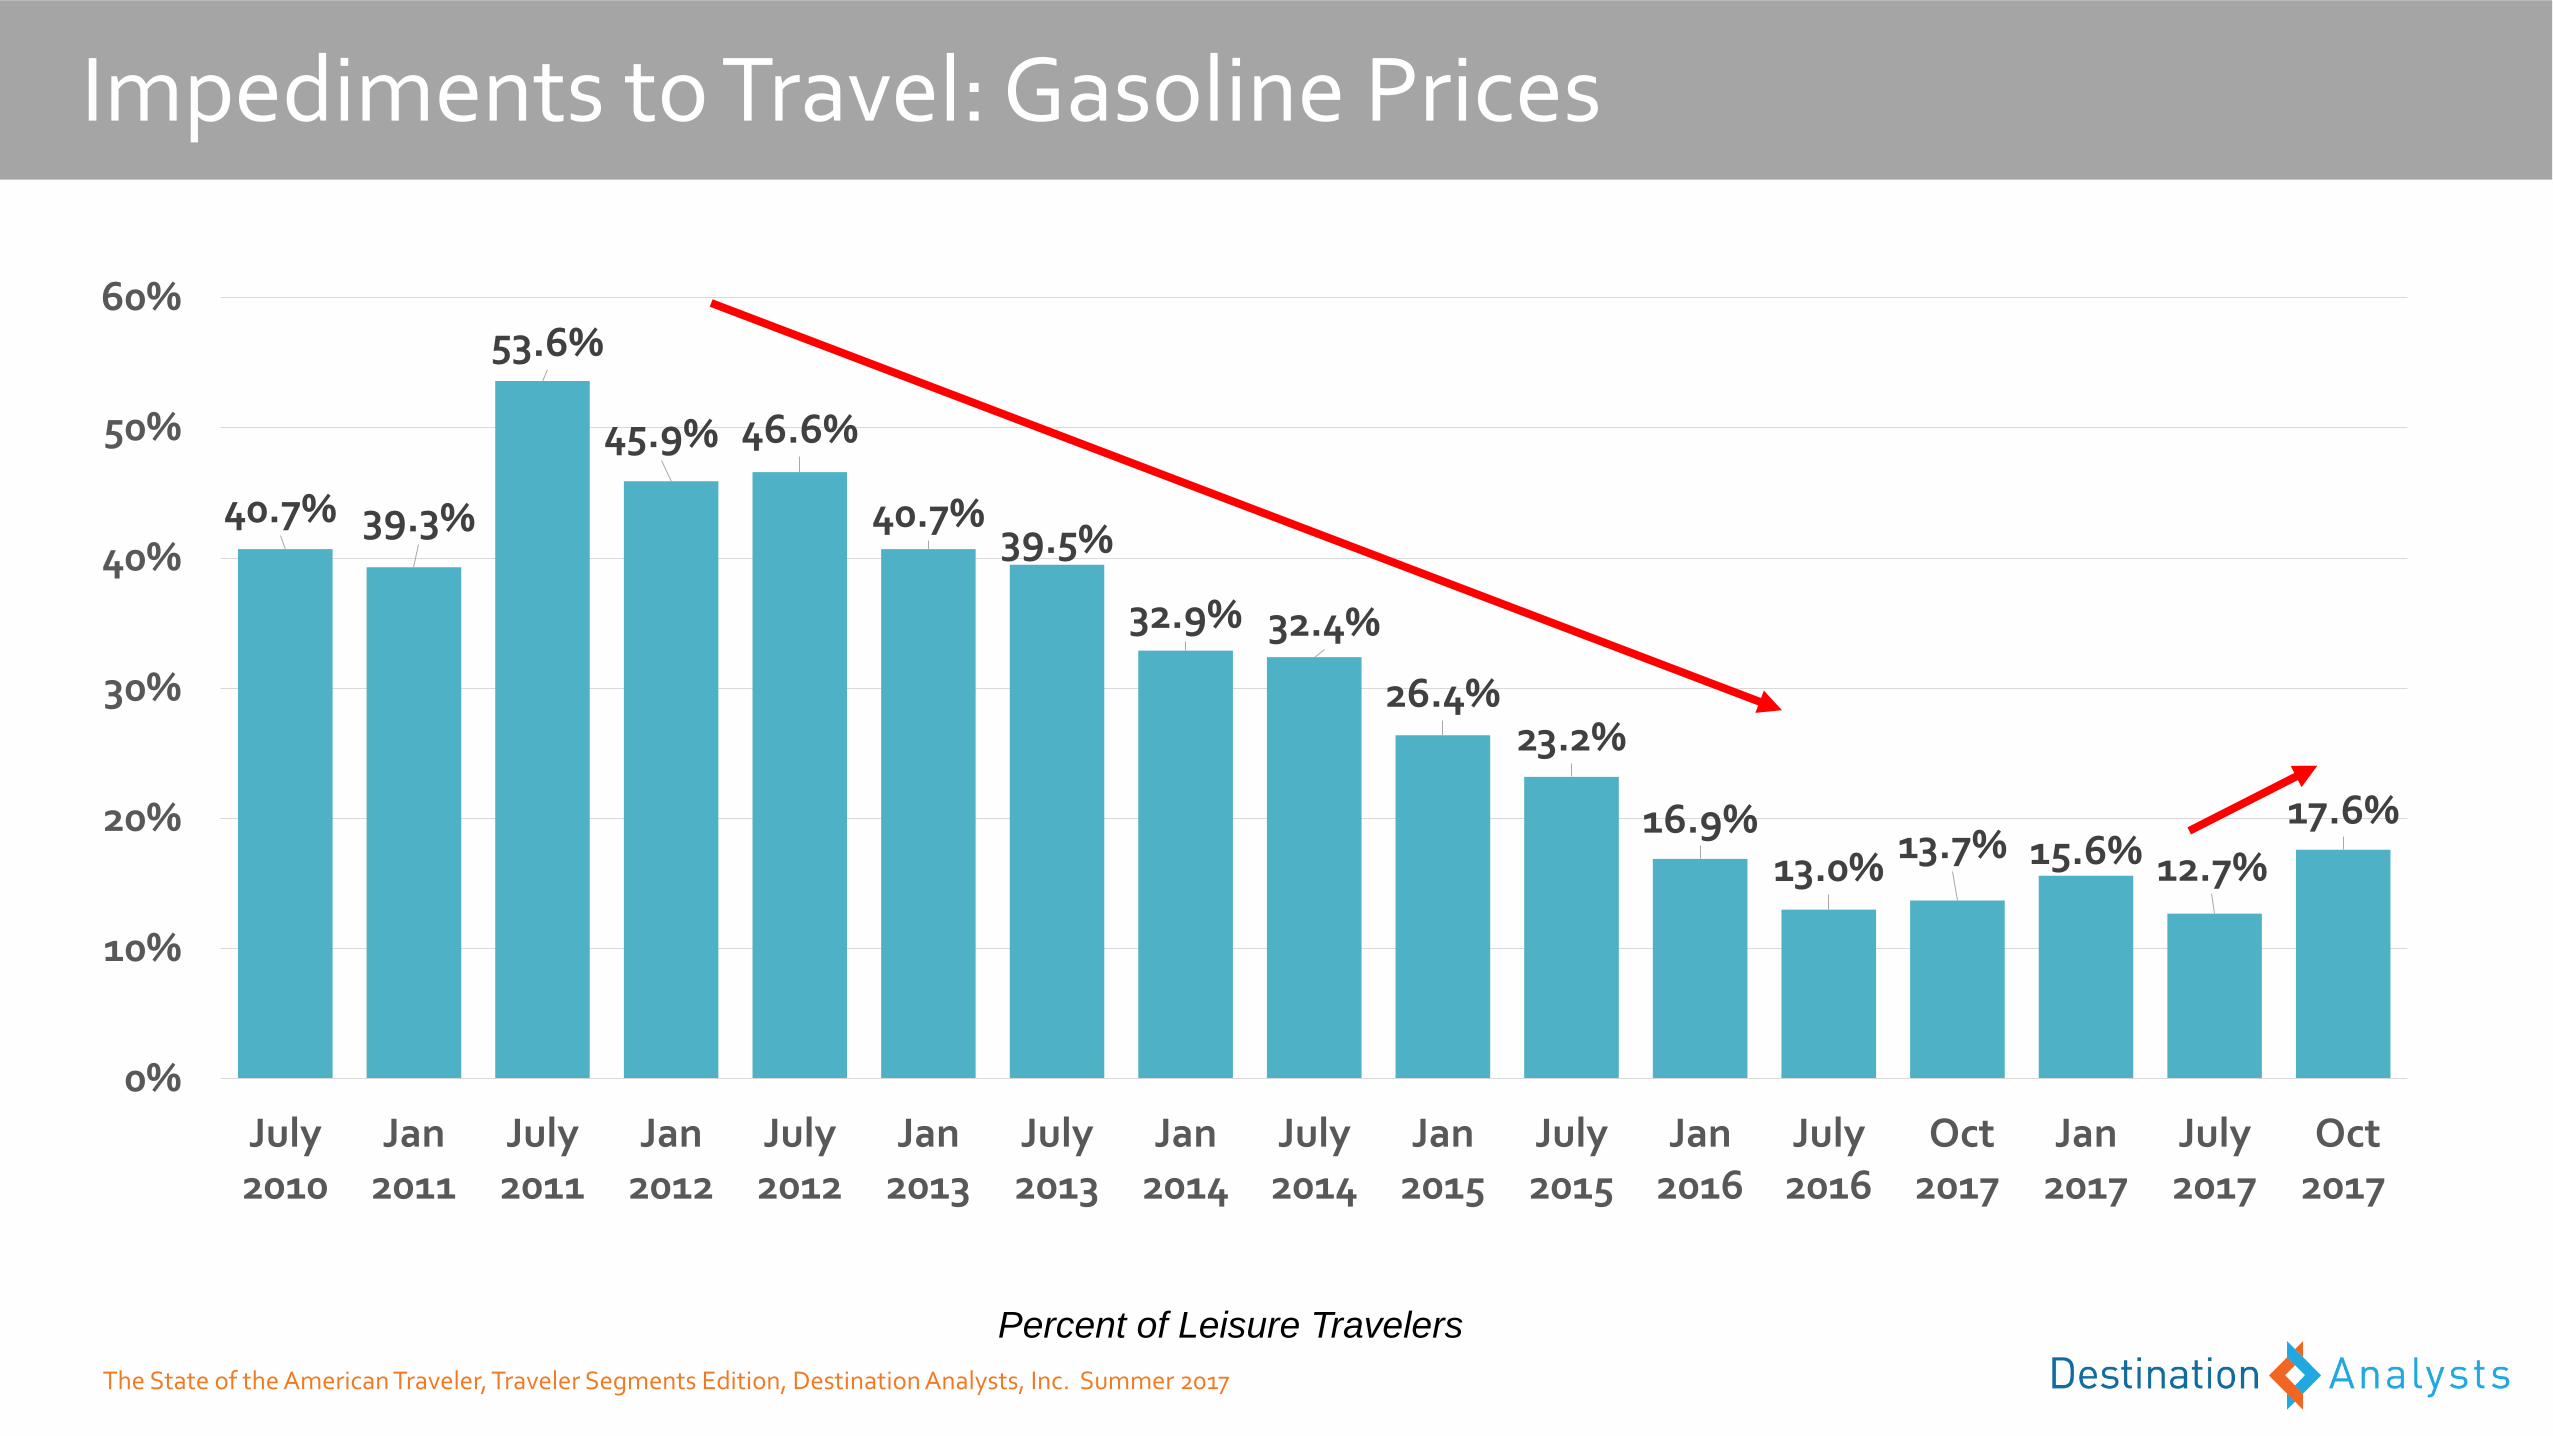
Impediments to Travel: Gasoline Prices
Percent of Leisure Travelers
The State of the American Traveler, Traveler Segments Edition, Destination Analysts, Inc. Summer 2017
36.0%34.9%
38.9%
35.2%
30.2%
32.9%
27.1%25.6%
24.0%
19.6%20.6%
22.8%
19.3%
22.2%21.0%
19.6%
24.1%
0%
5%
10%
15%
20%
25%
30%
35%
40%
45%
July 2010 Jan 2011 July 2011 Jan 2012 July 2012 Jan 2013 July 2013 Jan 2014 July 2014 Jan 2015 July 2015 Jan 2016 July 2016 Oct 2016 Jan 2017 July 2017 Oct 2017
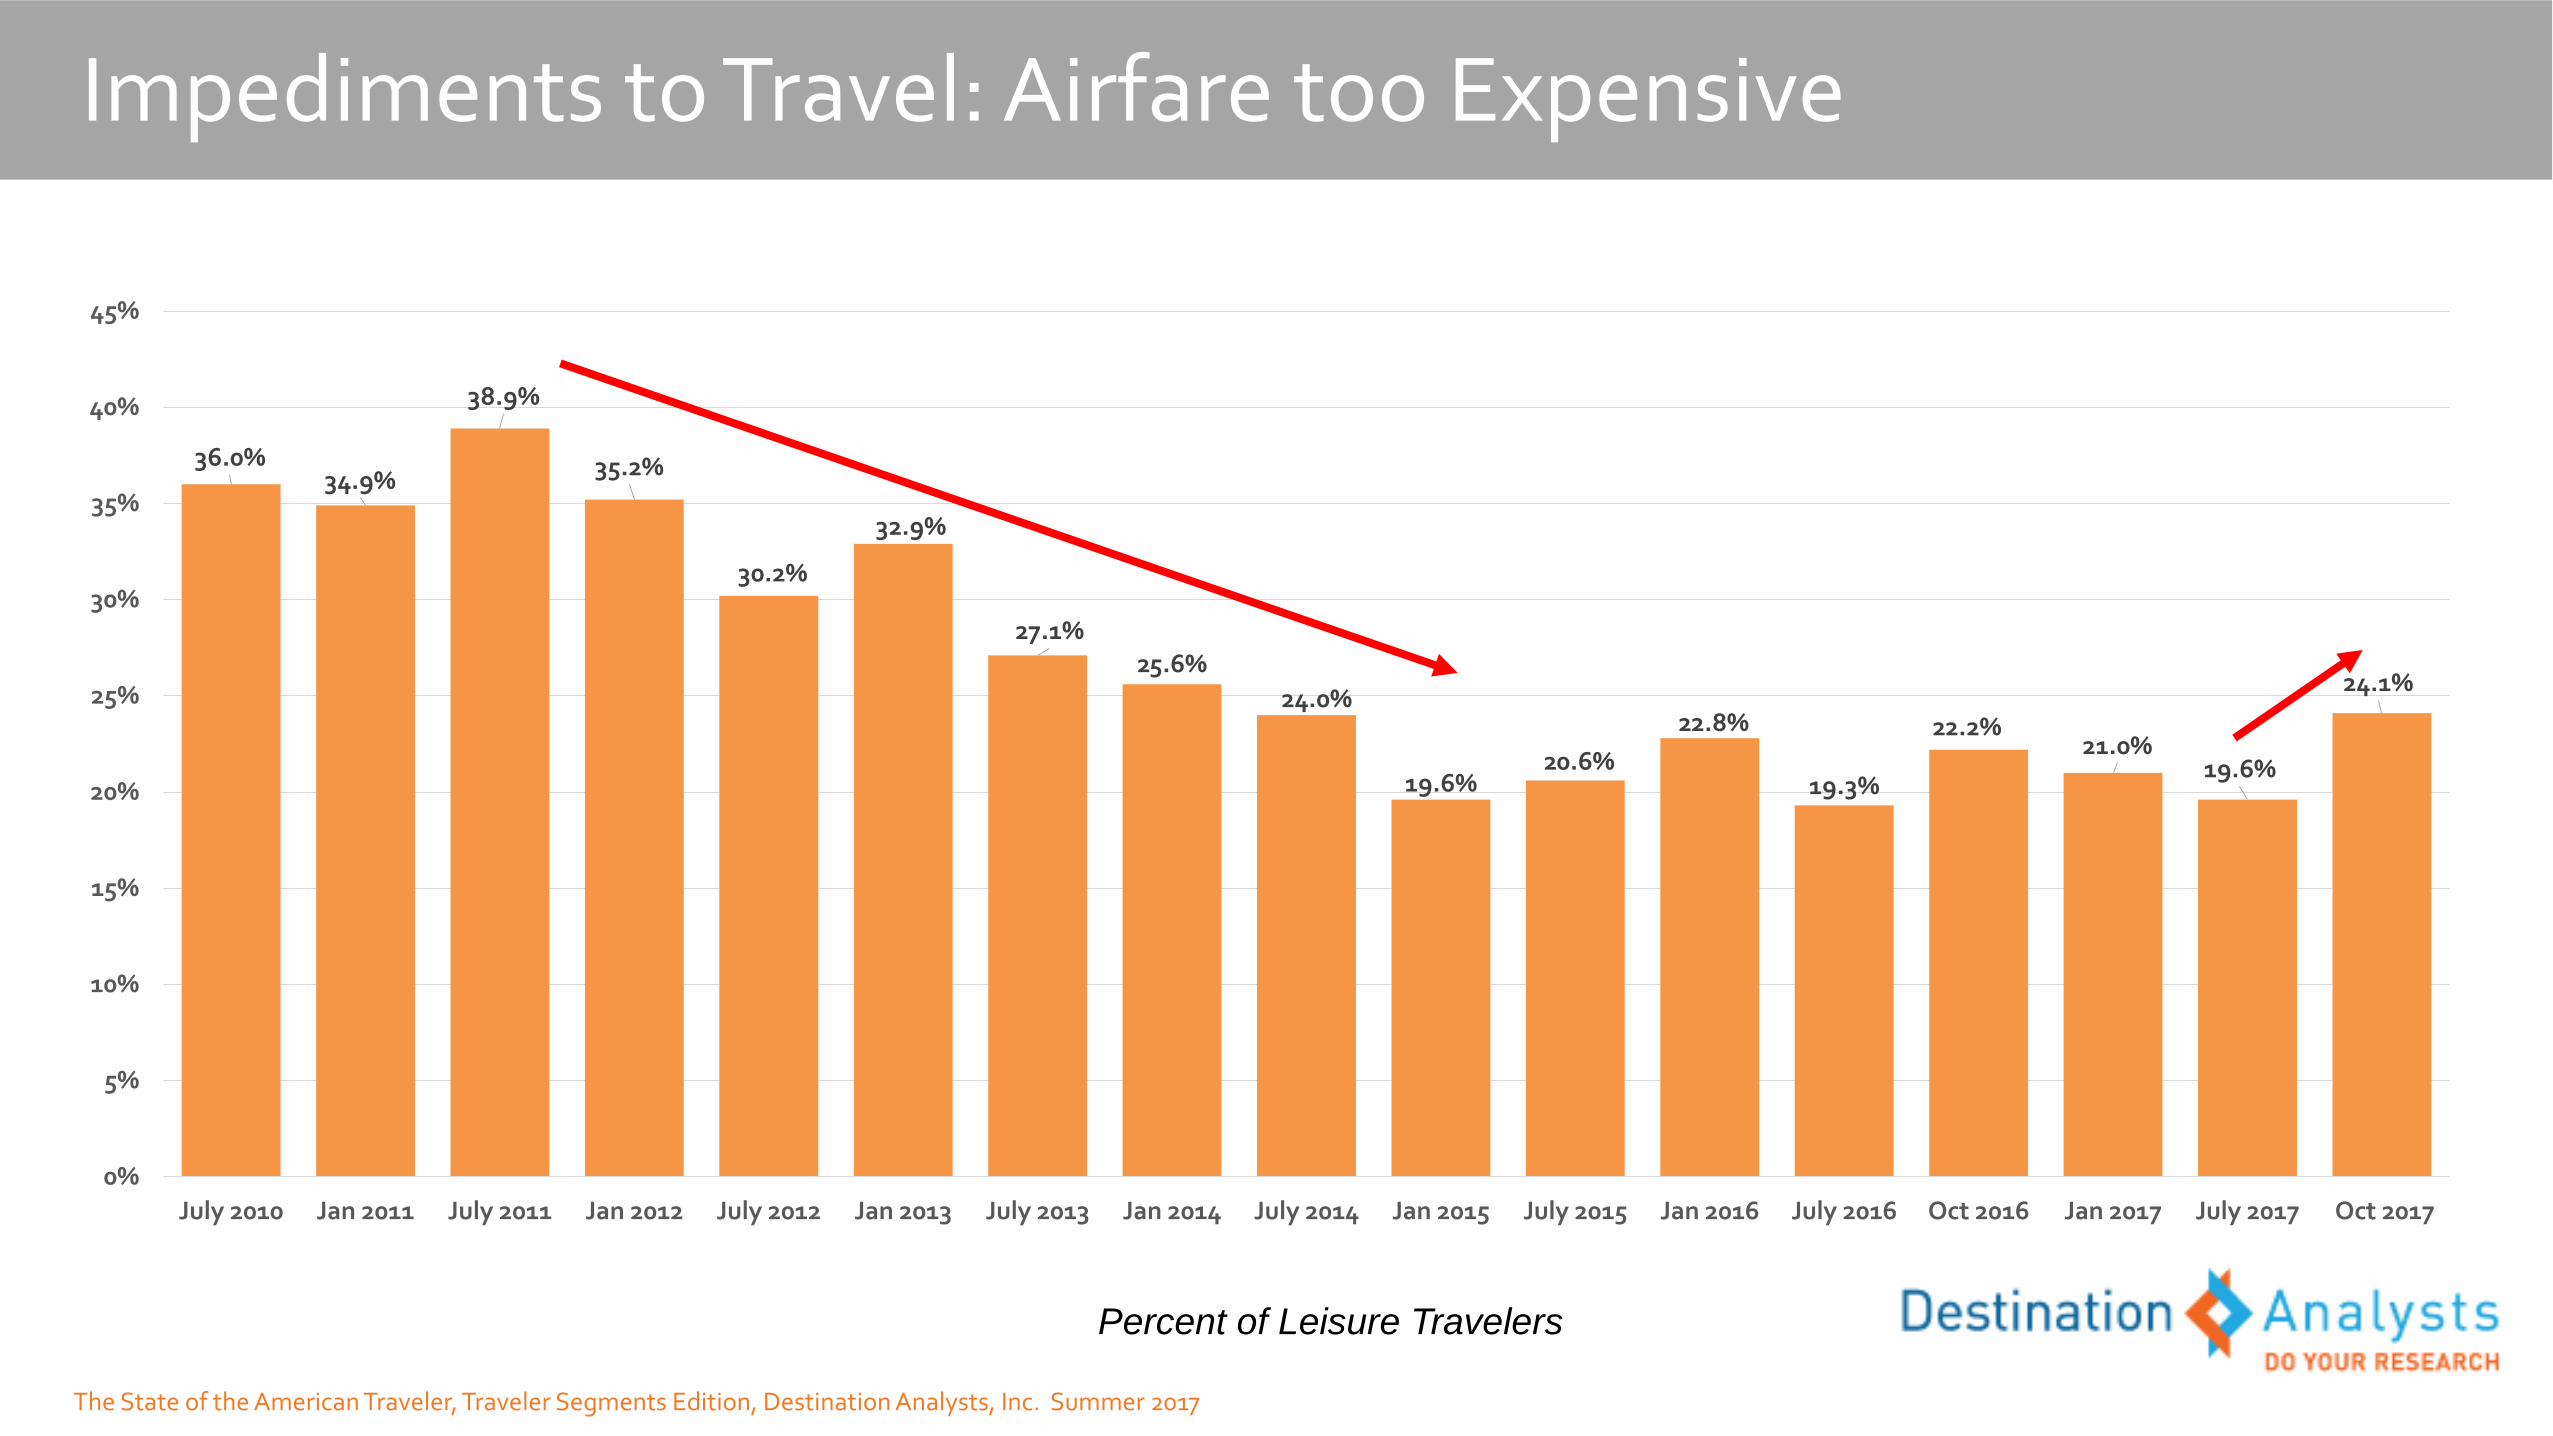
Impediments to Travel: Airfare too Expensive
Percent of Leisure Travelers
The State of the American Traveler, Traveler Segments Edition, Destination Analysts, Inc. Summer 2017
55.9%54.6%
48.9% 49.1%47.6%
40.9%38.6%
41.1%
36.8%35.7%
35.8%38.5%
36.3%37.6%
37.6%
40.6%
44.0%
0%
10%
20%
30%
40%
50%
60%
July 2010 Jan 2011 July 2011 Jan 2012 July 2012 Jan 2013 July 2013 Jan 2014 July 2014 Jan 2015 July 2015 Jan 2016 July 2016 Oct 2016 Jan 2017 July 2017 Oct 2017
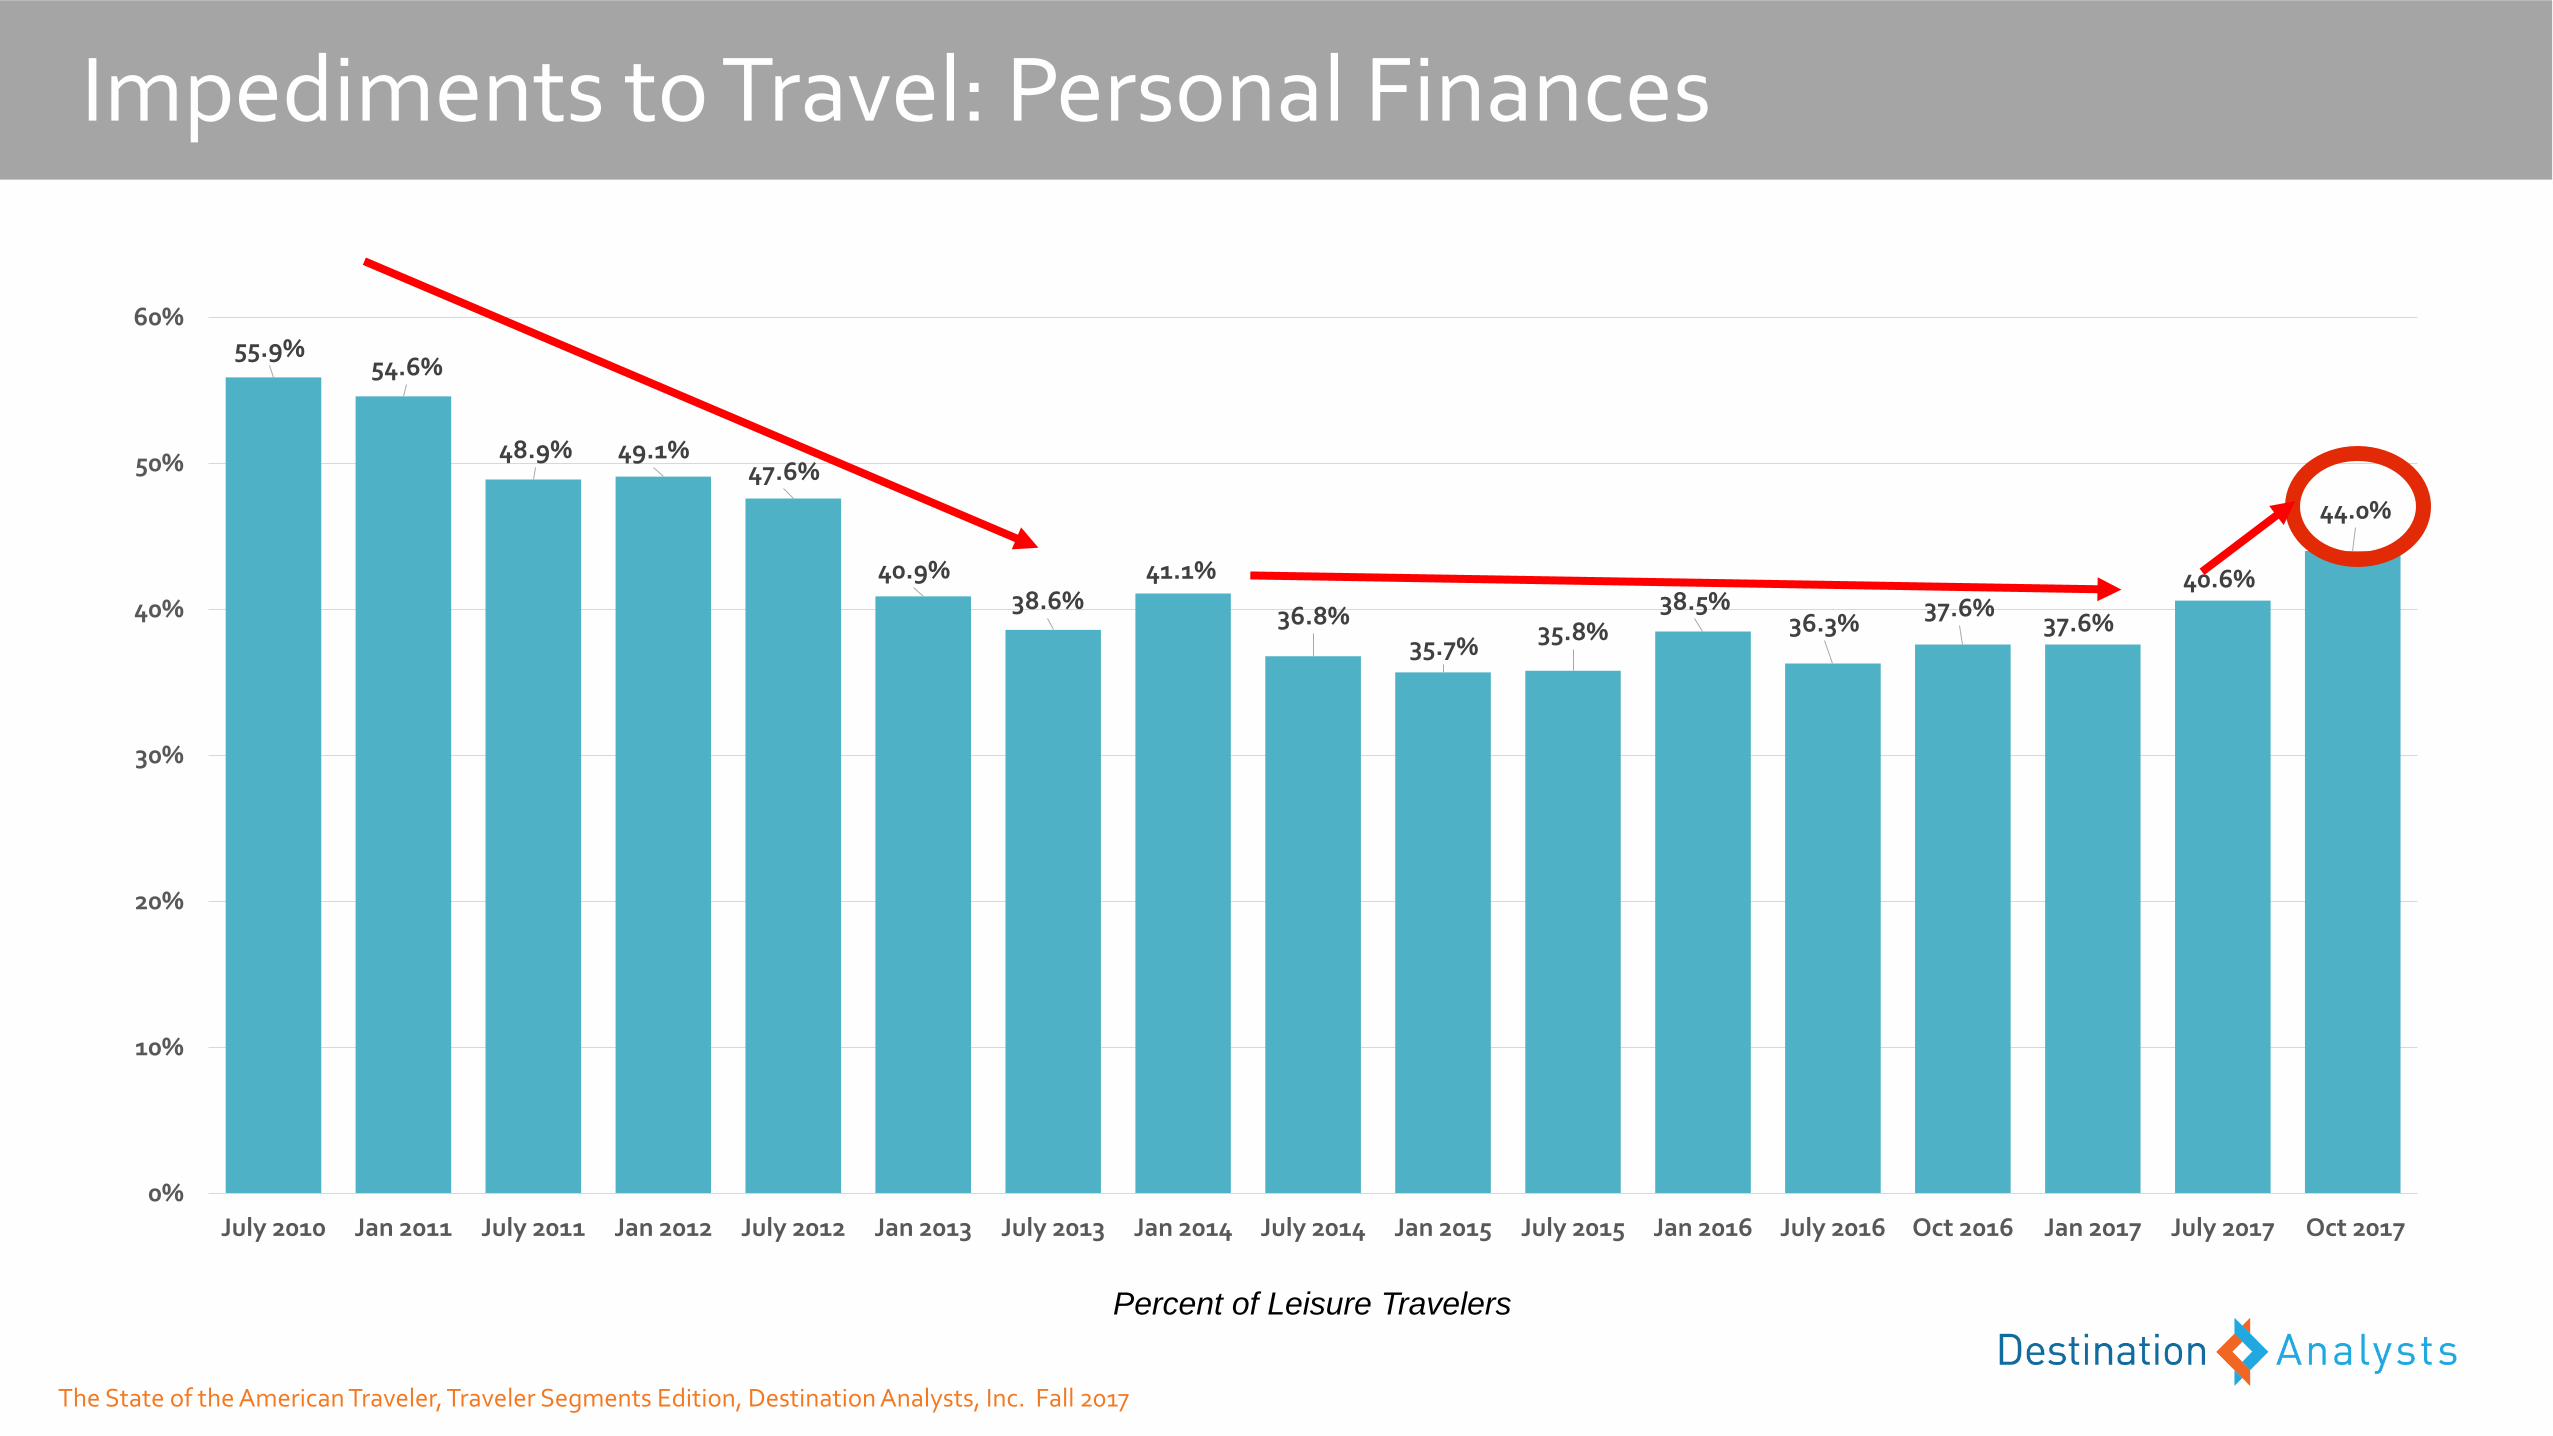
Impediments to Travel: Personal Finances
Percent of Leisure Travelers
The State of the American Traveler, Traveler Segments Edition, Destination Analysts, Inc. Fall 2017
The Mobile Travel Planner
A Profile
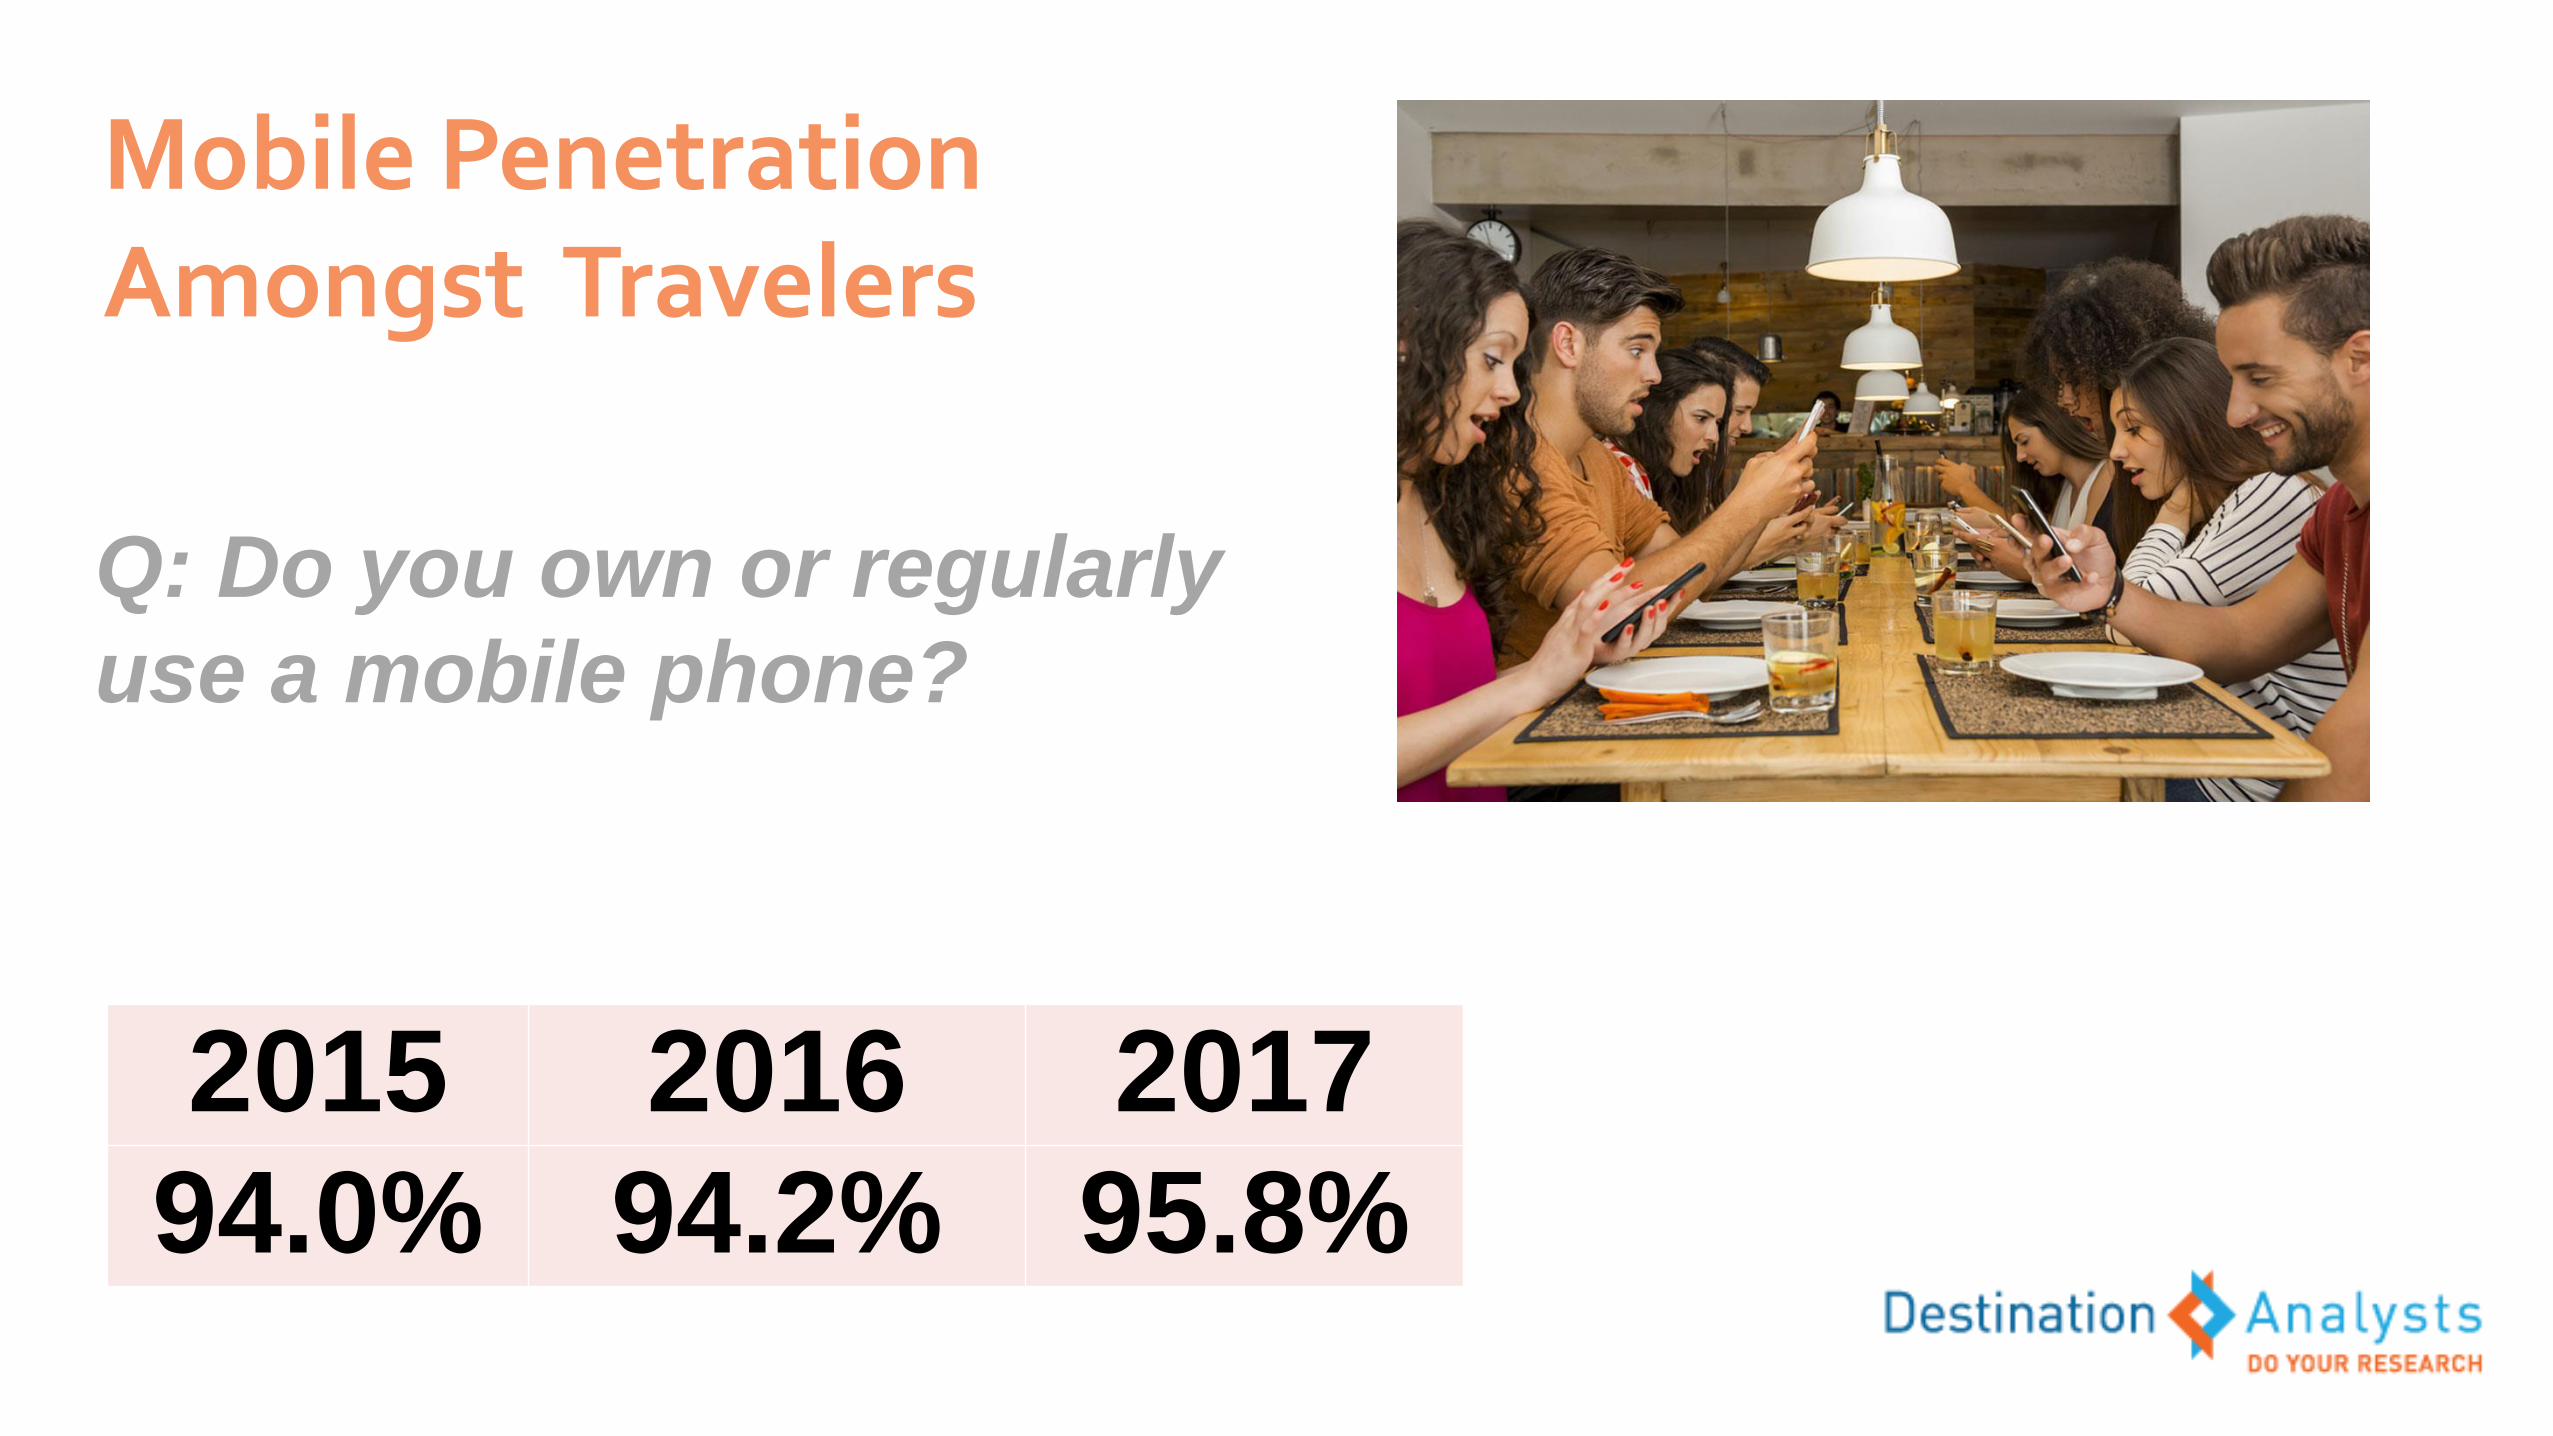
Mobile Penetration Amongst Travelers
2015 2016 2017
94.0% 94.2% 95.8%
Q: Do you own or regularly
use a mobile phone?
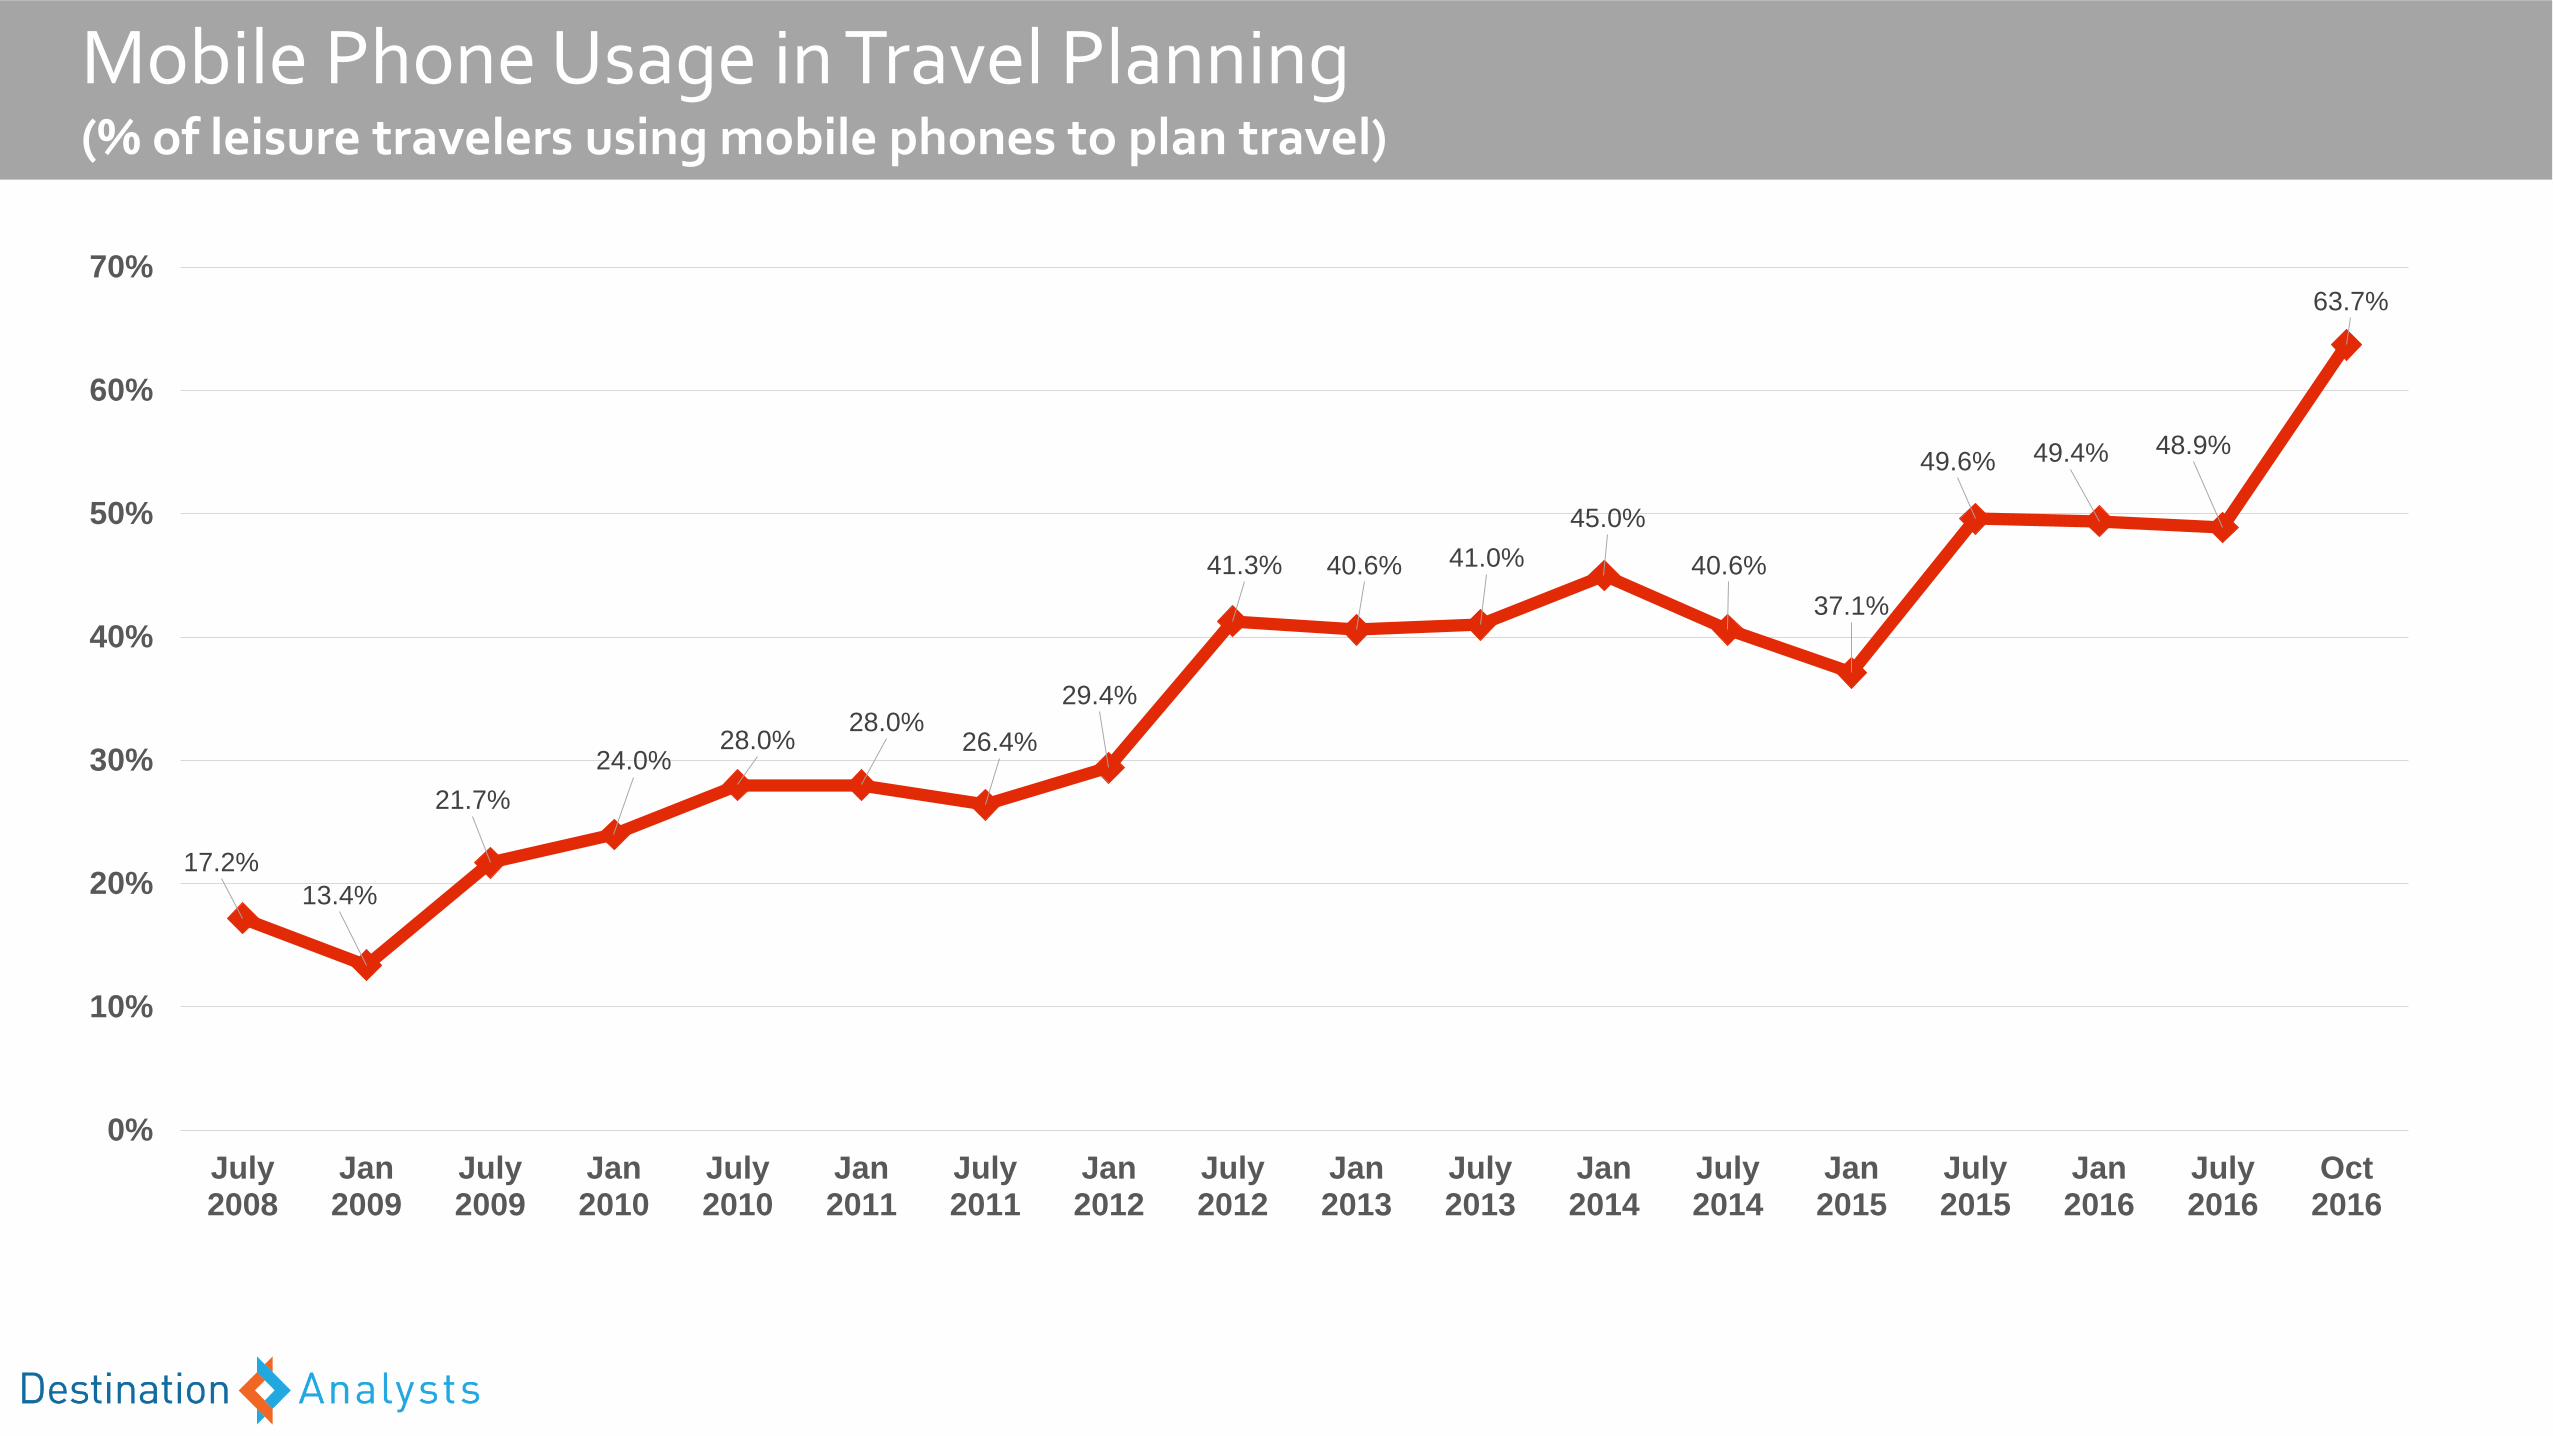
Mobile Phone Usage in Travel Planning(% of leisure travelers using mobile phones to plan travel)
17.2%
13.4%
21.7%
24.0%28.0%
28.0%26.4%
29.4%
41.3% 40.6% 41.0%
45.0%
40.6%
37.1%
49.6% 49.4% 48.9%
63.7%
0%
10%
20%
30%
40%
50%
60%
70%
July2008
Jan2009
July2009
Jan2010
July2010
Jan2011
July2011
Jan2012
July2012
Jan2013
July2013
Jan2014
July2014
Jan2015
July2015
Jan2016
July2016
Oct2016

WHO are
the Mobile
Travel
Planners?
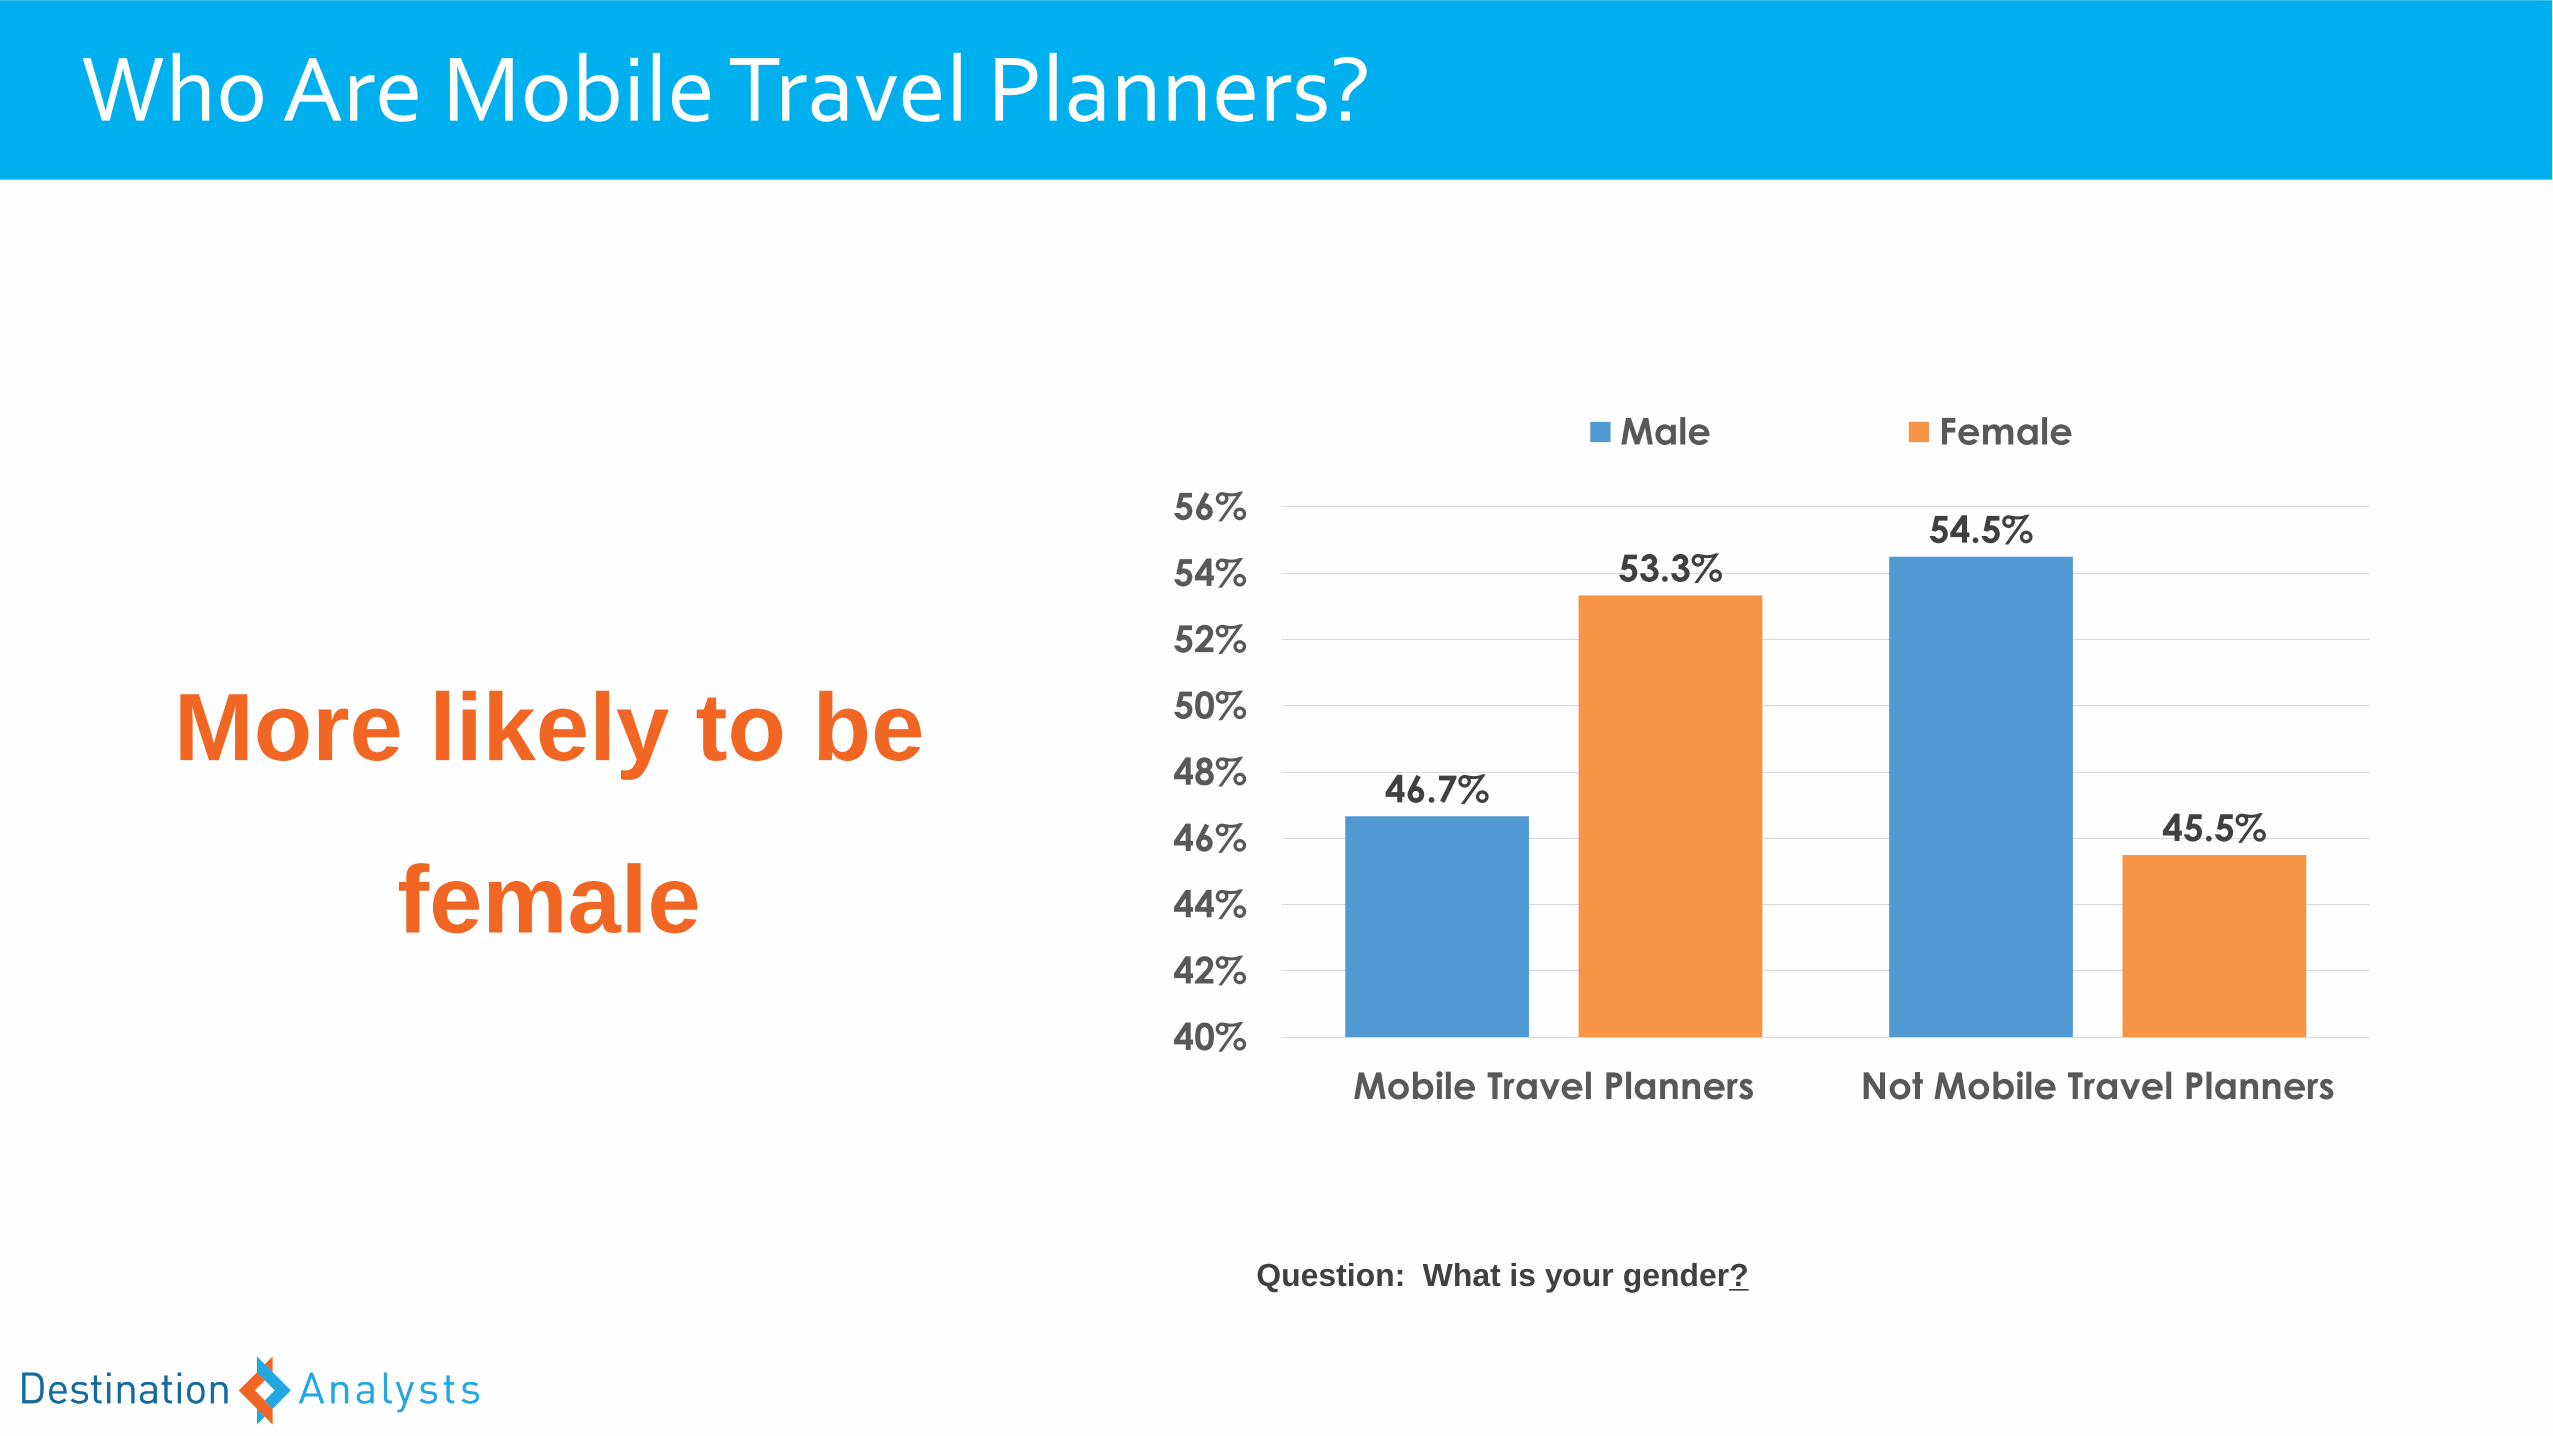
Who Are Mobile Travel Planners?
Question: What is your gender?
46.7%
54.5%53.3%
45.5%
40%
42%
44%
46%
48%
50%
52%
54%
56%
Mobile Travel Planners Not Mobile Travel Planners
Male Female
More likely to be
female

Who Are Mobile Travel Planners?
Question: On any of the leisure trip(s) you took last year, did you bring
your own children?
11.8% 8.3%
27.0%
19.3%
0%
10%
20%
30%
40%
50%
60%
Mobile Travel Planners Not Mobile Travel Planners
Four Five or more
Mean trips
4.0 3.4
Travel more
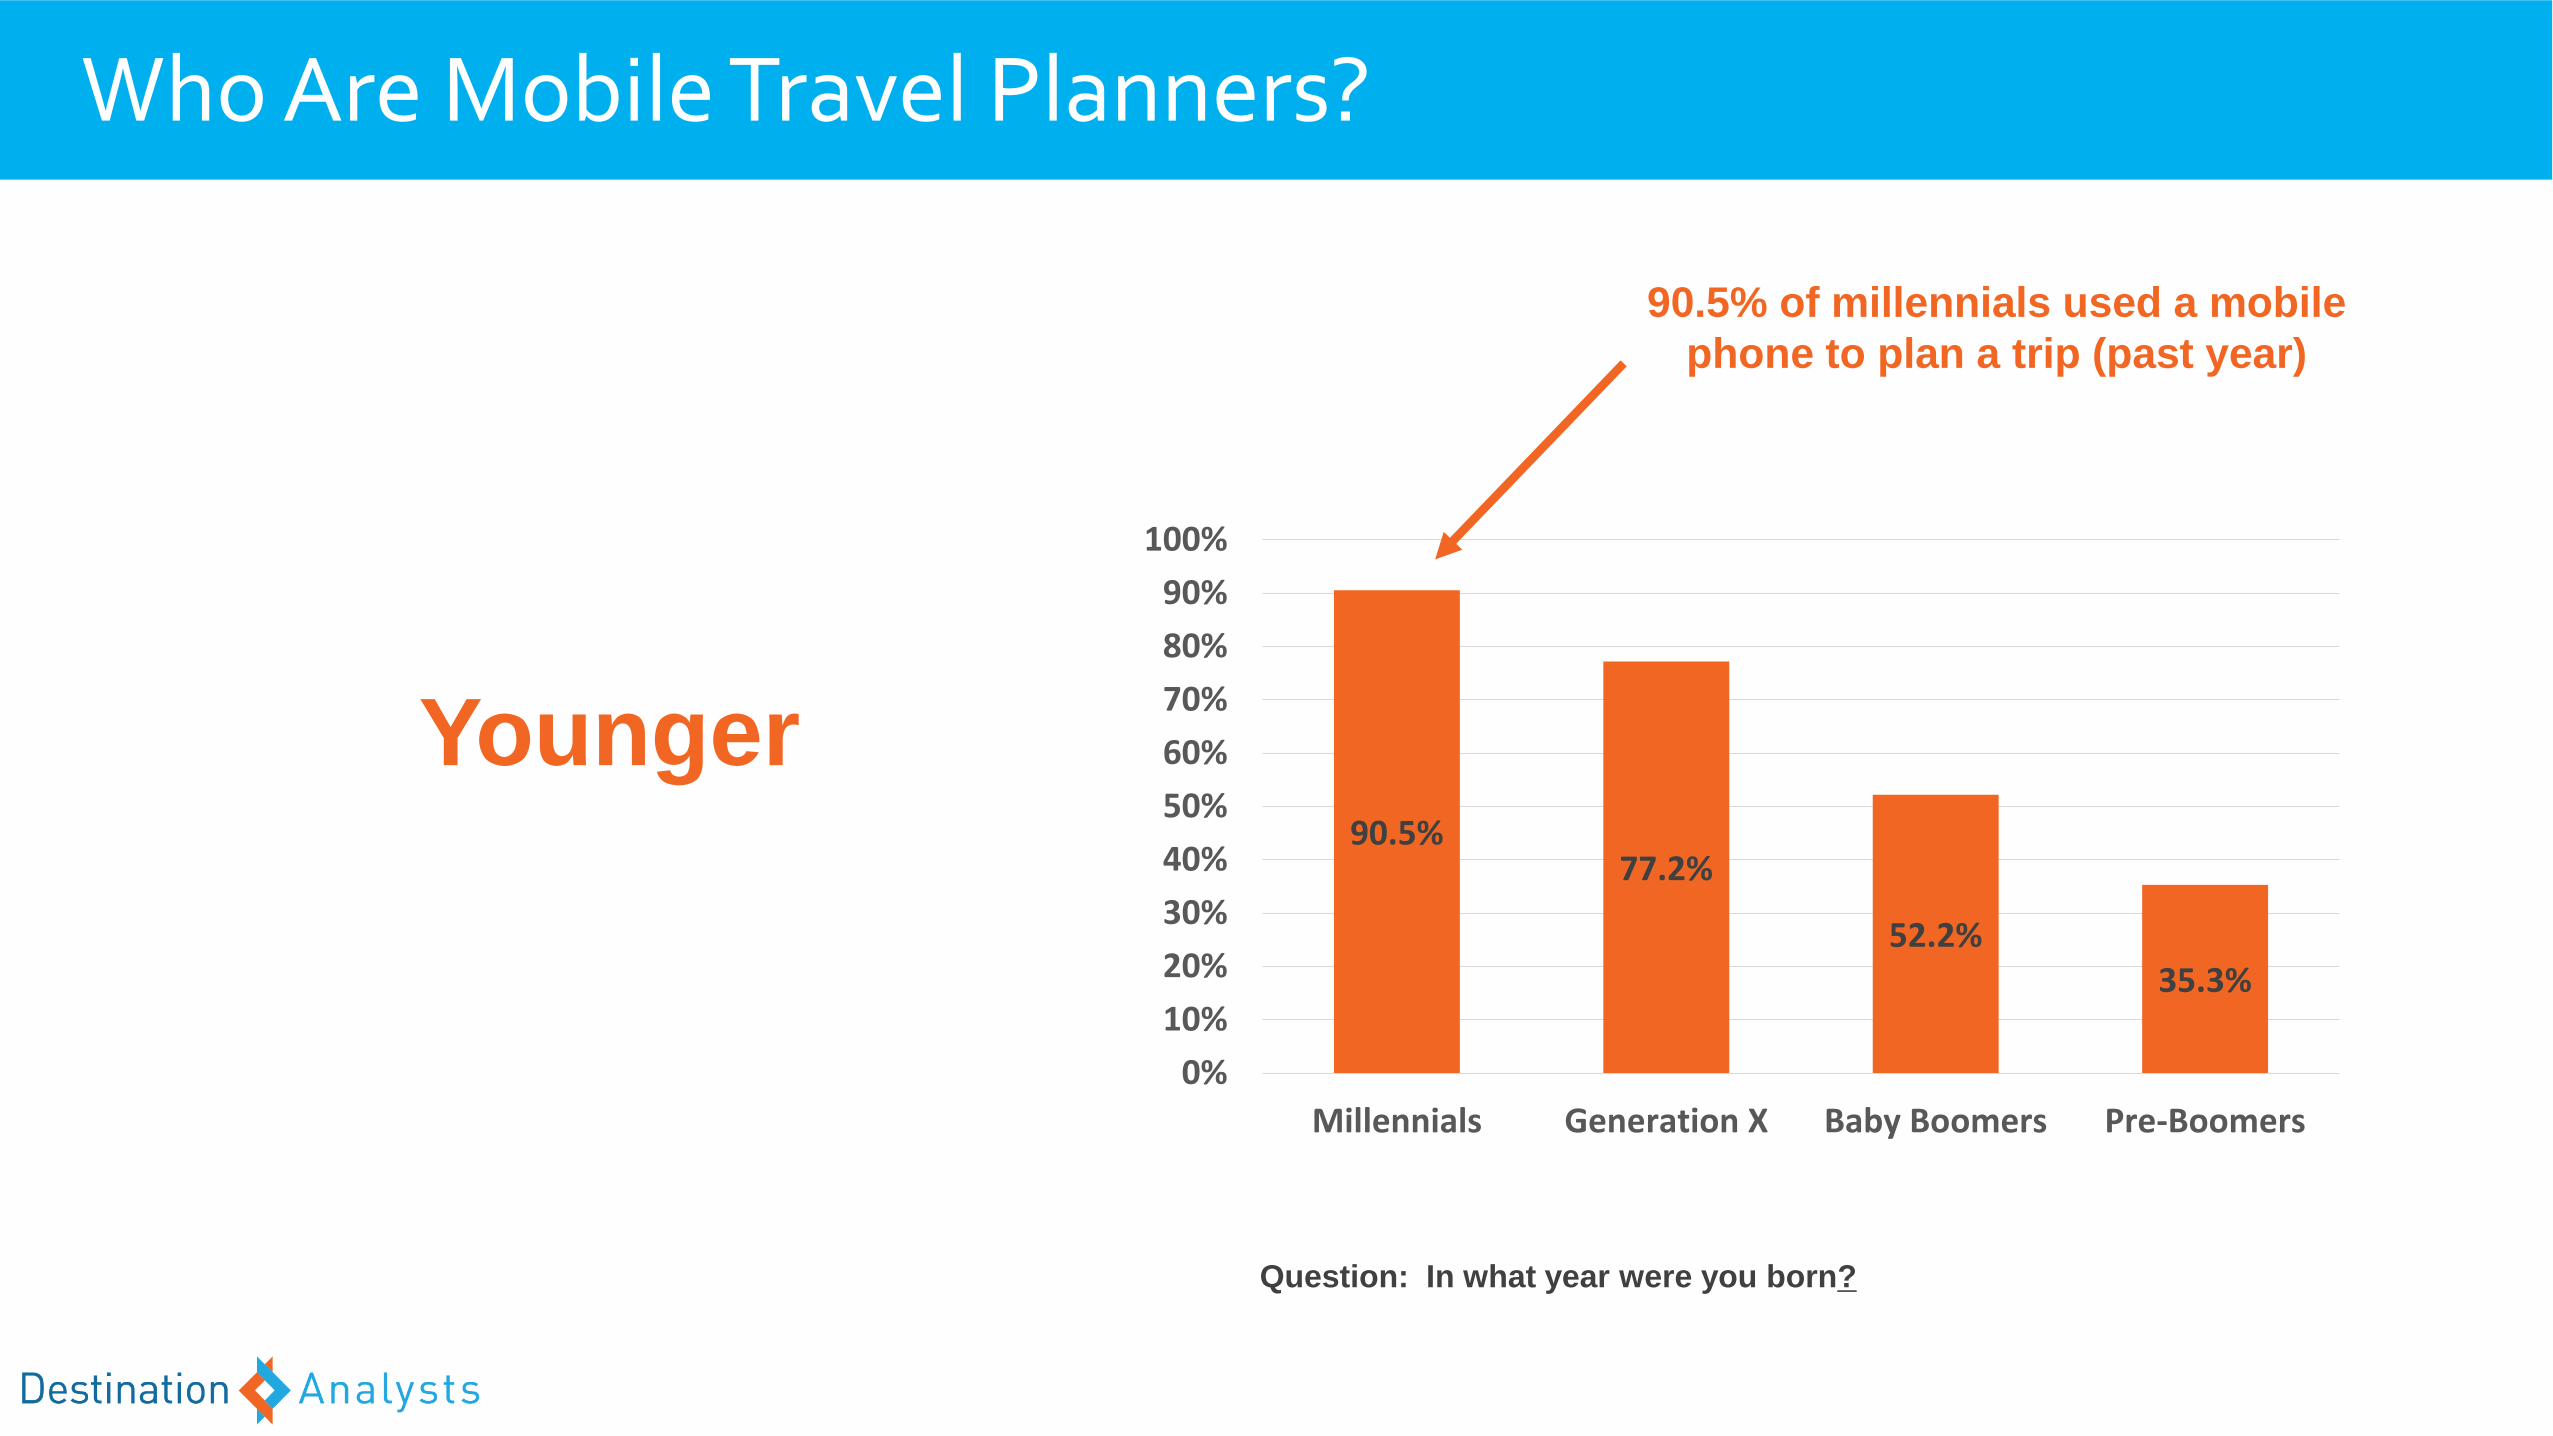
Who Are Mobile Travel Planners?
Question: In what year were you born?
90.5%77.2%
52.2%35.3%
0%
10%
20%
30%
40%
50%
60%
70%
80%
90%
100%
Millennials Generation X Baby Boomers Pre-Boomers
90.5% of millennials used a mobile
phone to plan a trip (past year)
Younger
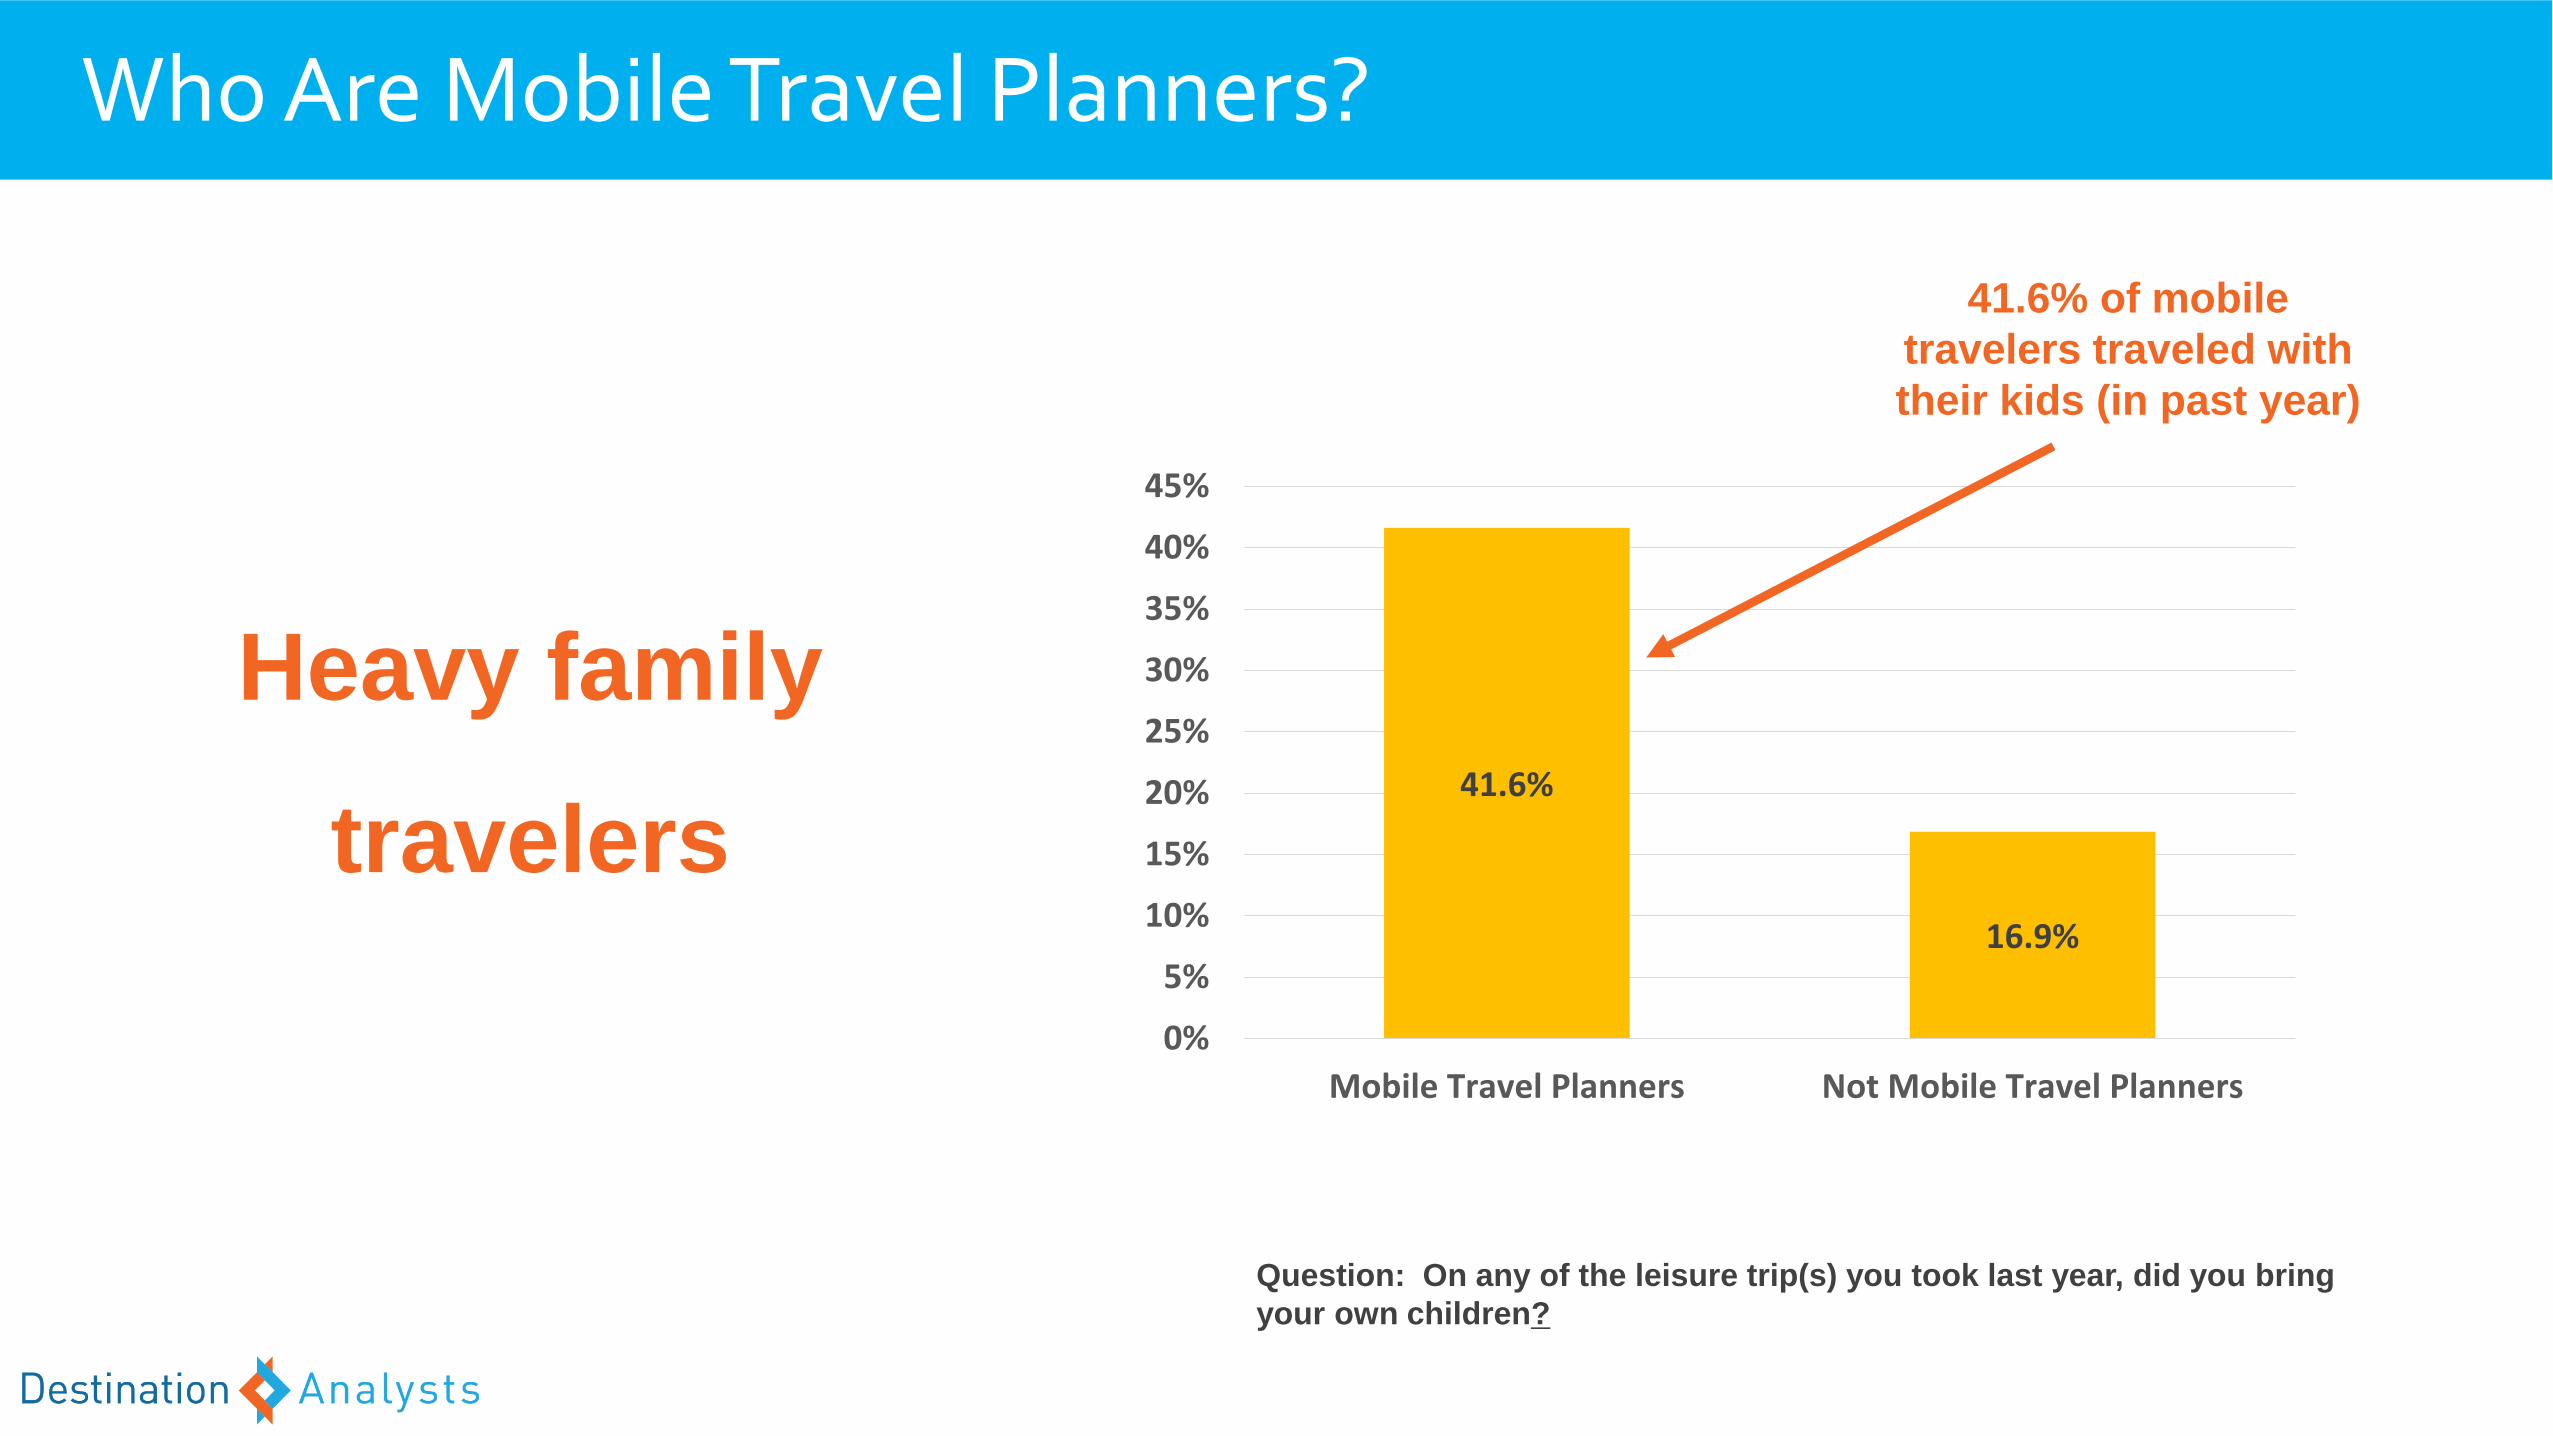
Who Are Mobile Travel Planners?
Question: On any of the leisure trip(s) you took last year, did you bring
your own children?
Heavy family
travelers41.6%
16.9%
0%
5%
10%
15%
20%
25%
30%
35%
40%
45%
Mobile Travel Planners Not Mobile Travel Planners
41.6% of mobile
travelers traveled with
their kids (in past year)
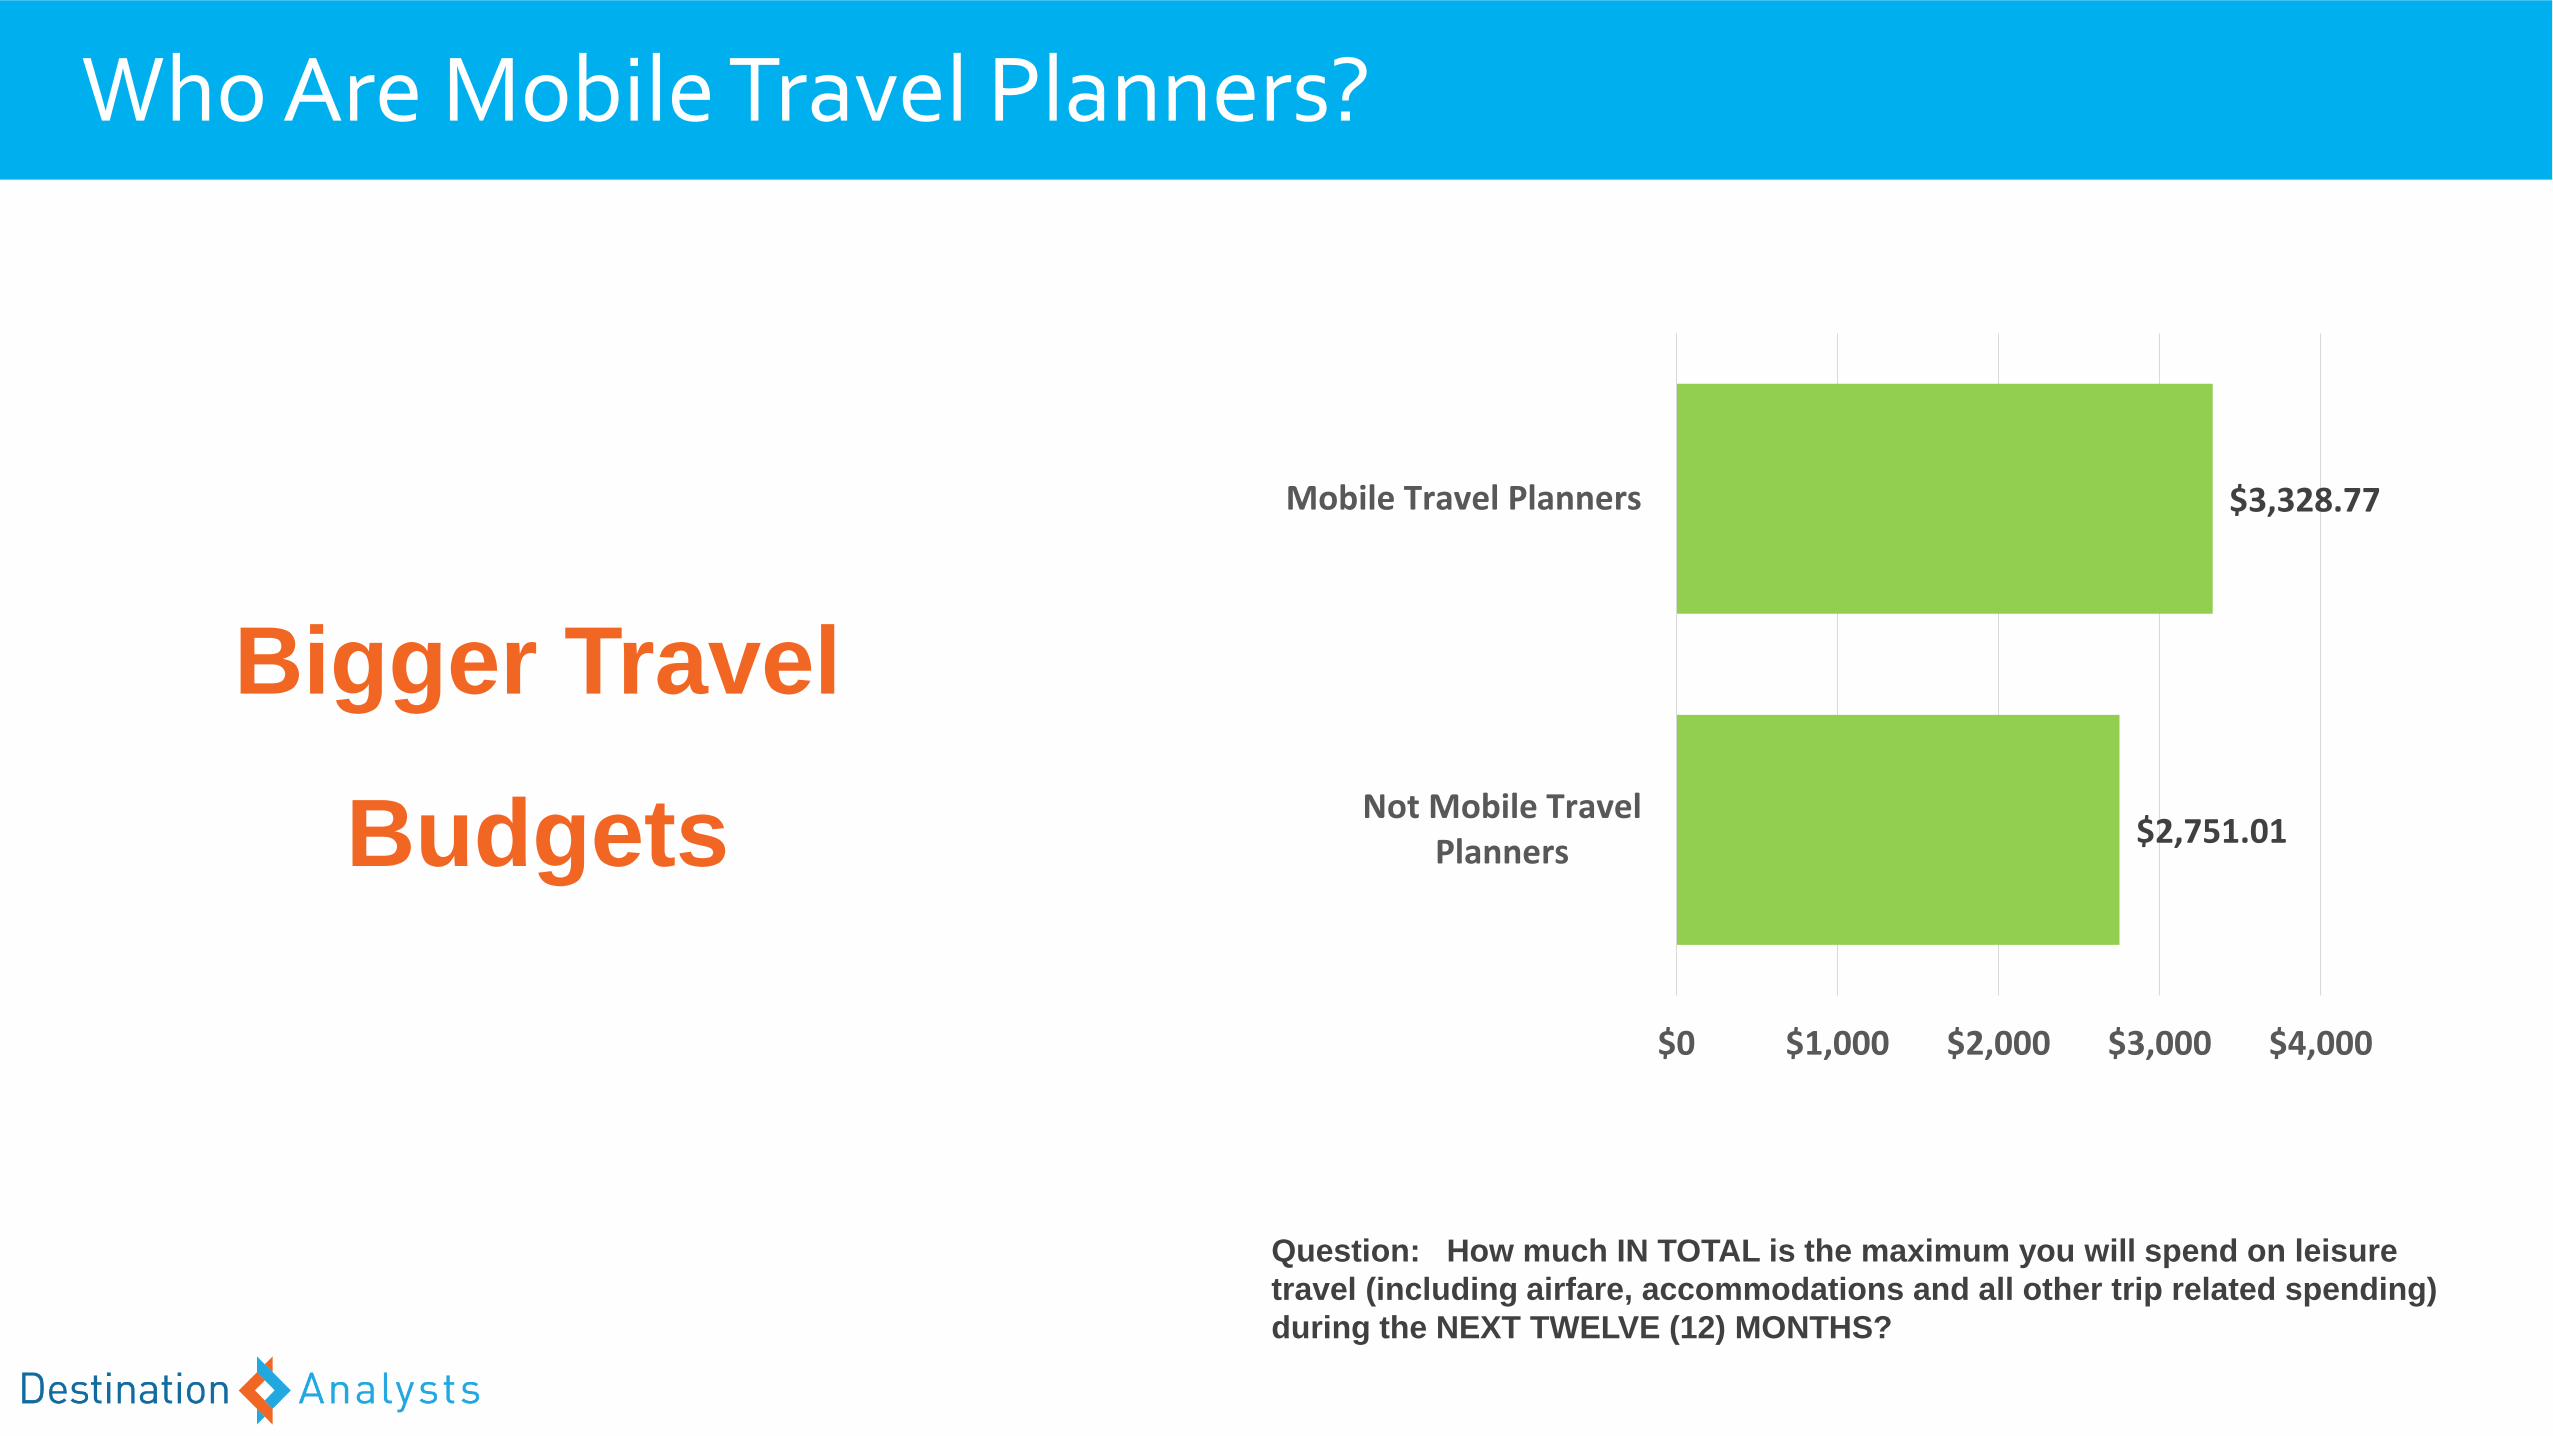
Who Are Mobile Travel Planners?
Question: How much IN TOTAL is the maximum you will spend on leisure
travel (including airfare, accommodations and all other trip related spending)
during the NEXT TWELVE (12) MONTHS?
$2,751.01
$3,328.77
$0 $1,000 $2,000 $3,000 $4,000
Not Mobile TravelPlanners
Mobile Travel Planners
Bigger Travel
Budgets
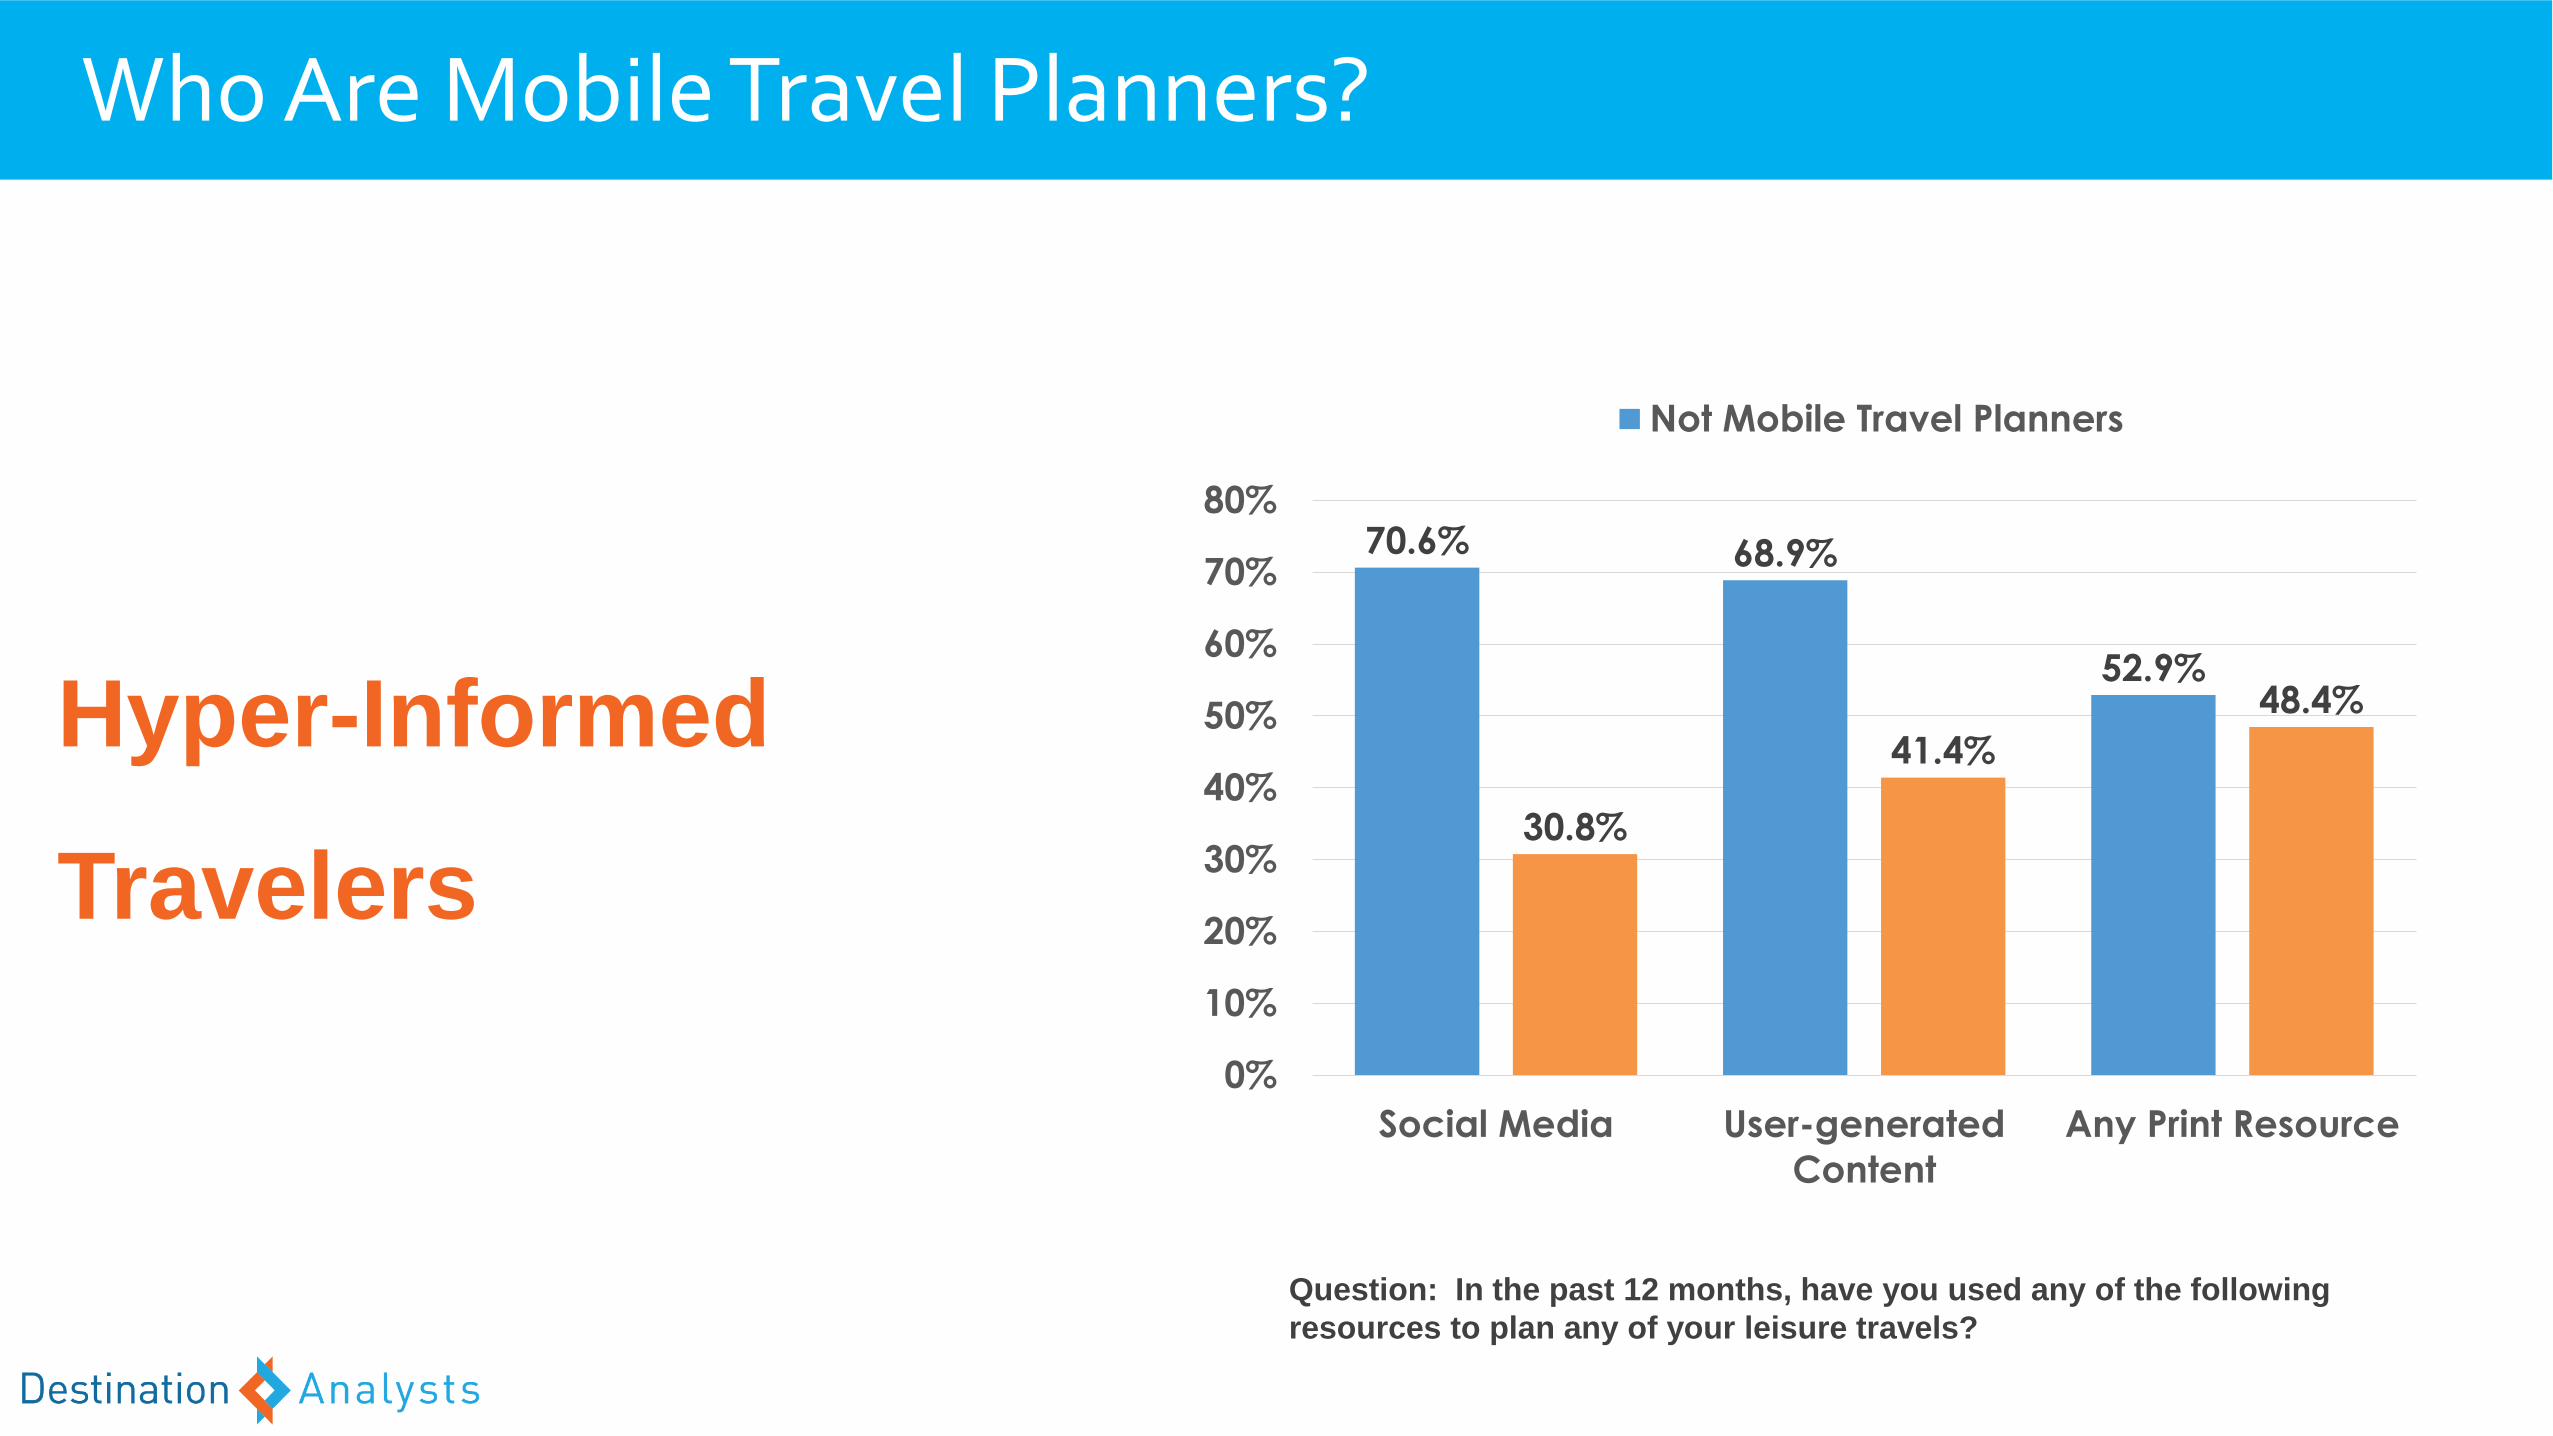
Who Are Mobile Travel Planners?
Question: In the past 12 months, have you used any of the following
resources to plan any of your leisure travels?
Hyper-Informed
Travelers
70.6% 68.9%
52.9%
30.8%
41.4%
48.4%
0%
10%
20%
30%
40%
50%
60%
70%
80%
Social Media User-generated
Content
Any Print Resource
Not Mobile Travel Planners
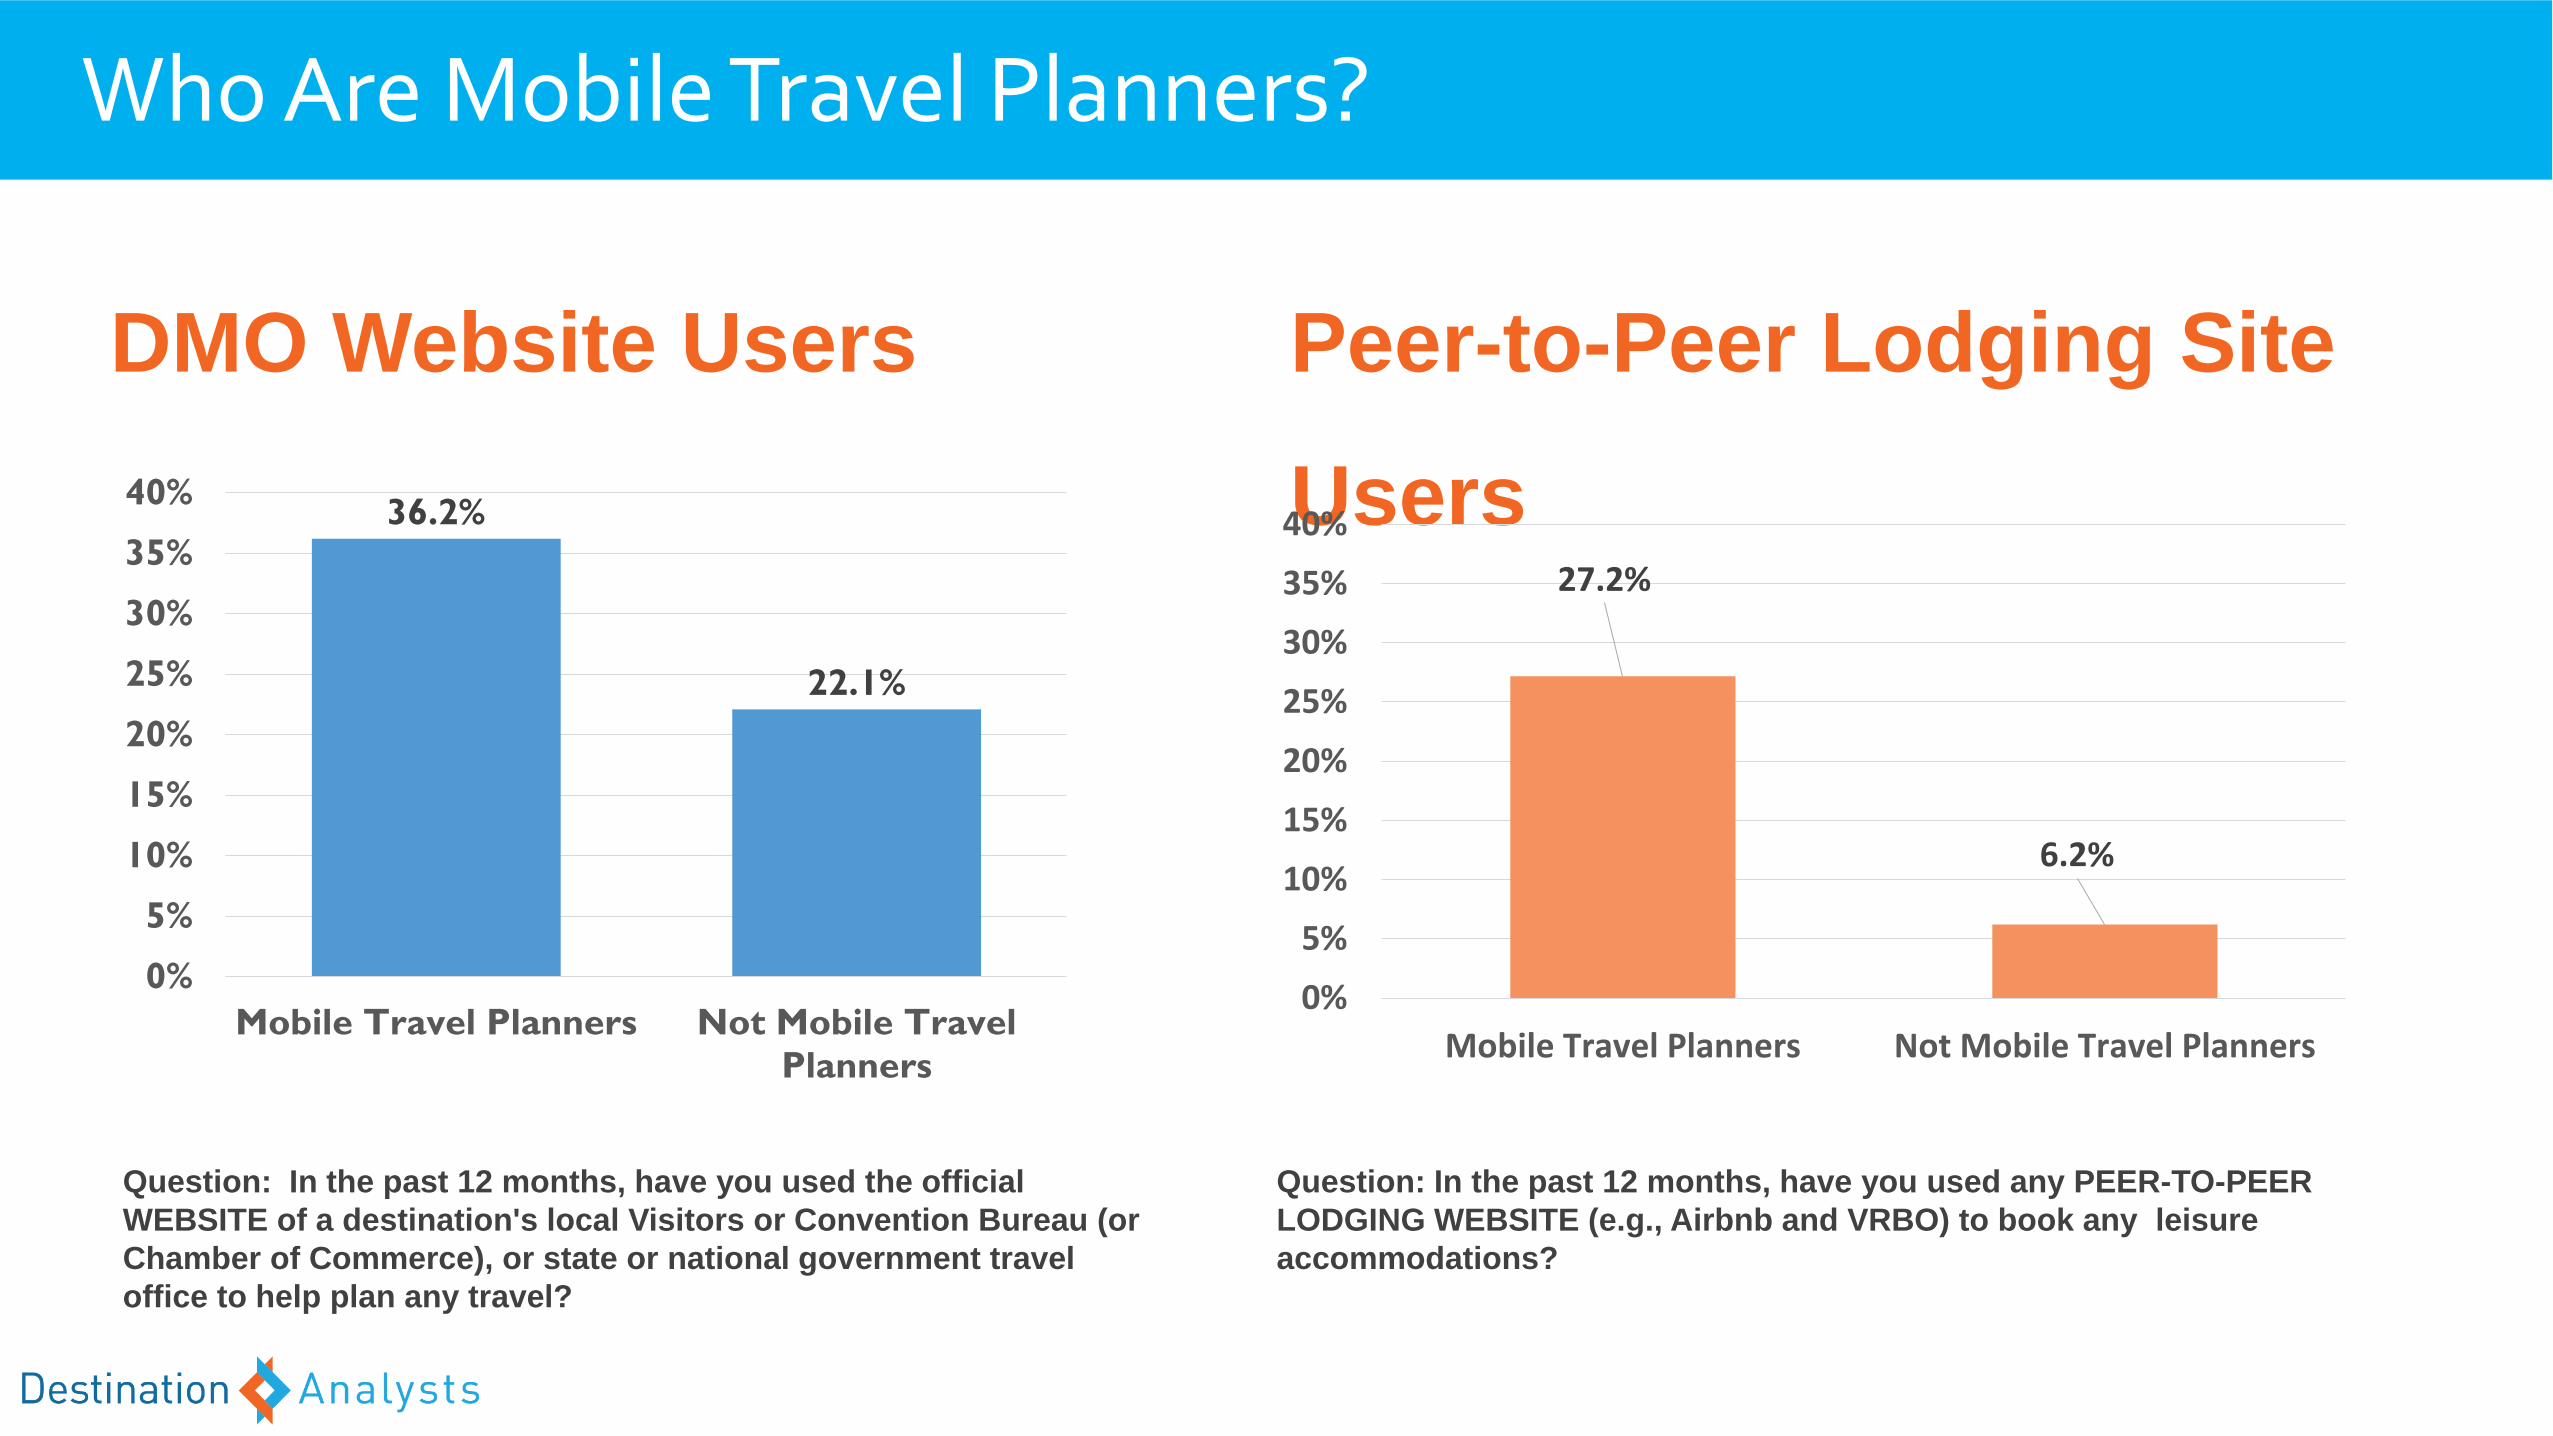
Who Are Mobile Travel Planners?
Question: In the past 12 months, have you used the official
WEBSITE of a destination's local Visitors or Convention Bureau (or
Chamber of Commerce), or state or national government travel
office to help plan any travel?
DMO Website Users Peer-to-Peer Lodging Site
Users36.2%
22.1%
0%
5%
10%
15%
20%
25%
30%
35%
40%
Mobile Travel Planners Not Mobile Travel
Planners
27.2%
6.2%
0%
5%
10%
15%
20%
25%
30%
35%
40%
Mobile Travel Planners Not Mobile Travel Planners
Question: In the past 12 months, have you used any PEER-TO-PEER
LODGING WEBSITE (e.g., Airbnb and VRBO) to book any leisure
accommodations?
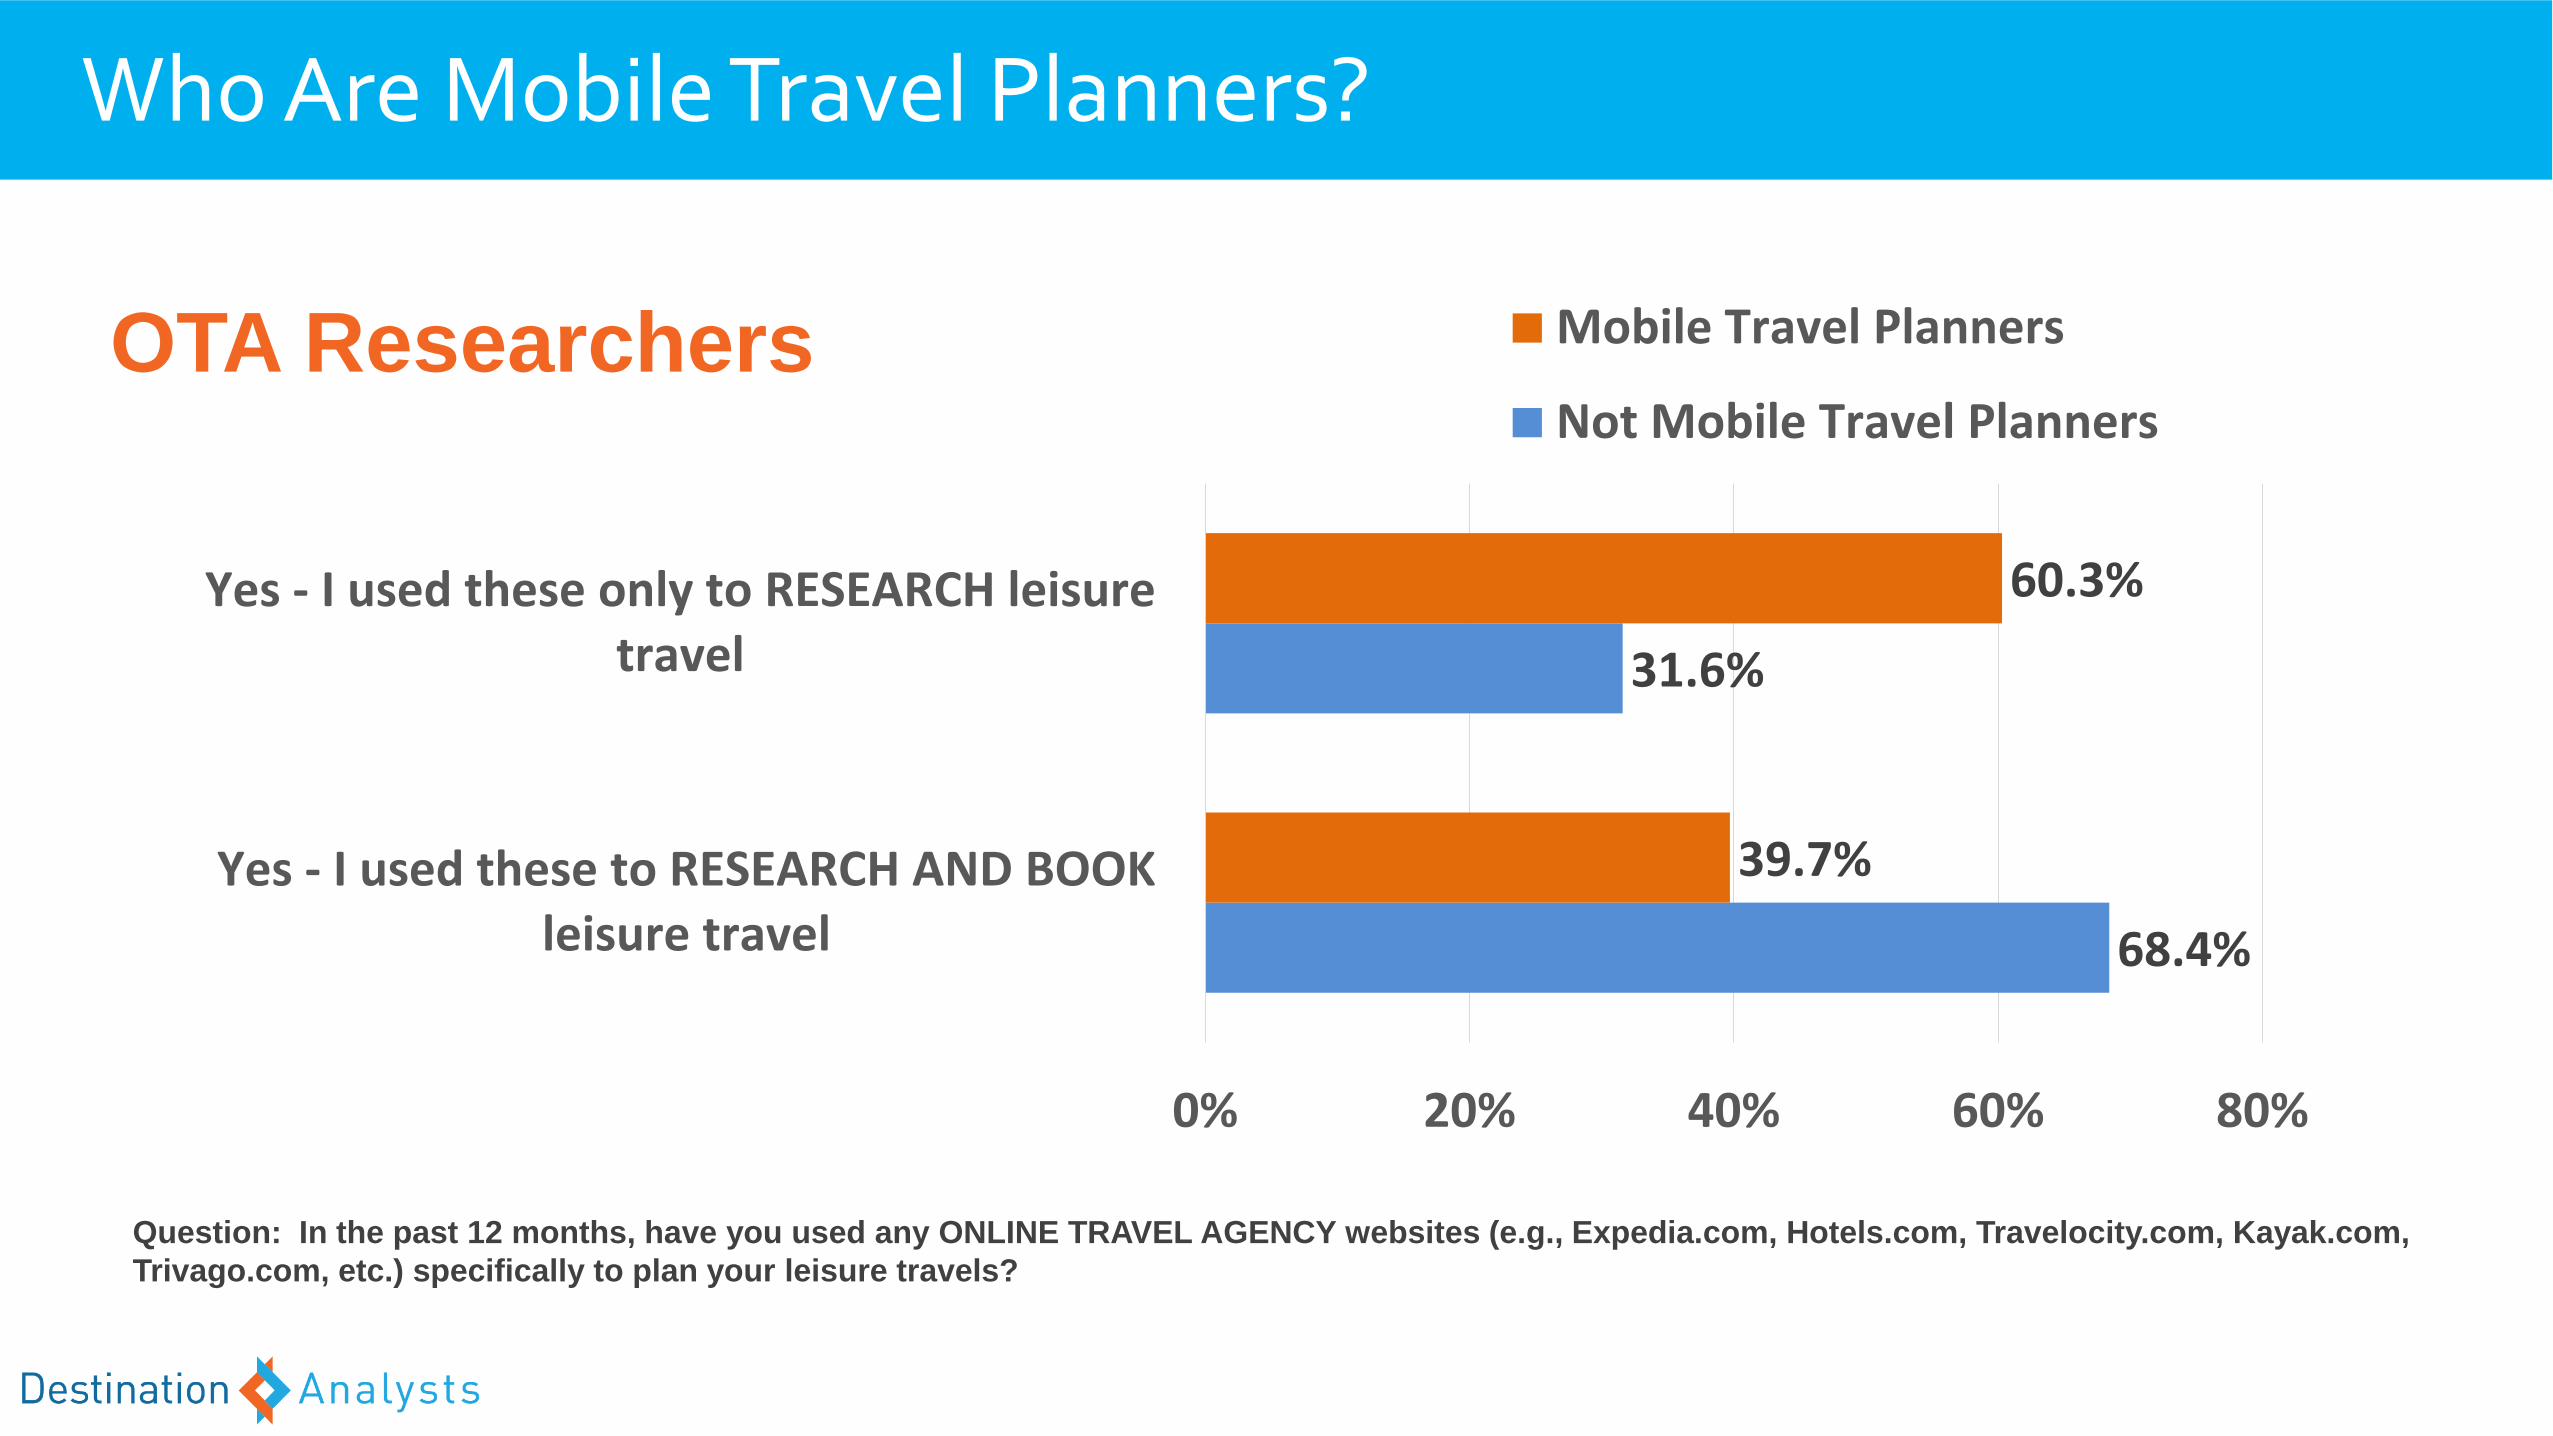
Who Are Mobile Travel Planners?
Question: In the past 12 months, have you used any ONLINE TRAVEL AGENCY websites (e.g., Expedia.com, Hotels.com, Travelocity.com, Kayak.com,
Trivago.com, etc.) specifically to plan your leisure travels?
68.4%
31.6%
39.7%
60.3%
0% 20% 40% 60% 80%
Yes - I used these to RESEARCH AND BOOKleisure travel
Yes - I used these only to RESEARCH leisuretravel
Mobile Travel Planners
Not Mobile Travel PlannersOTA Researchers
Planning Leisure Travel
Device Usage, Content
Consumption & Other Behaviors
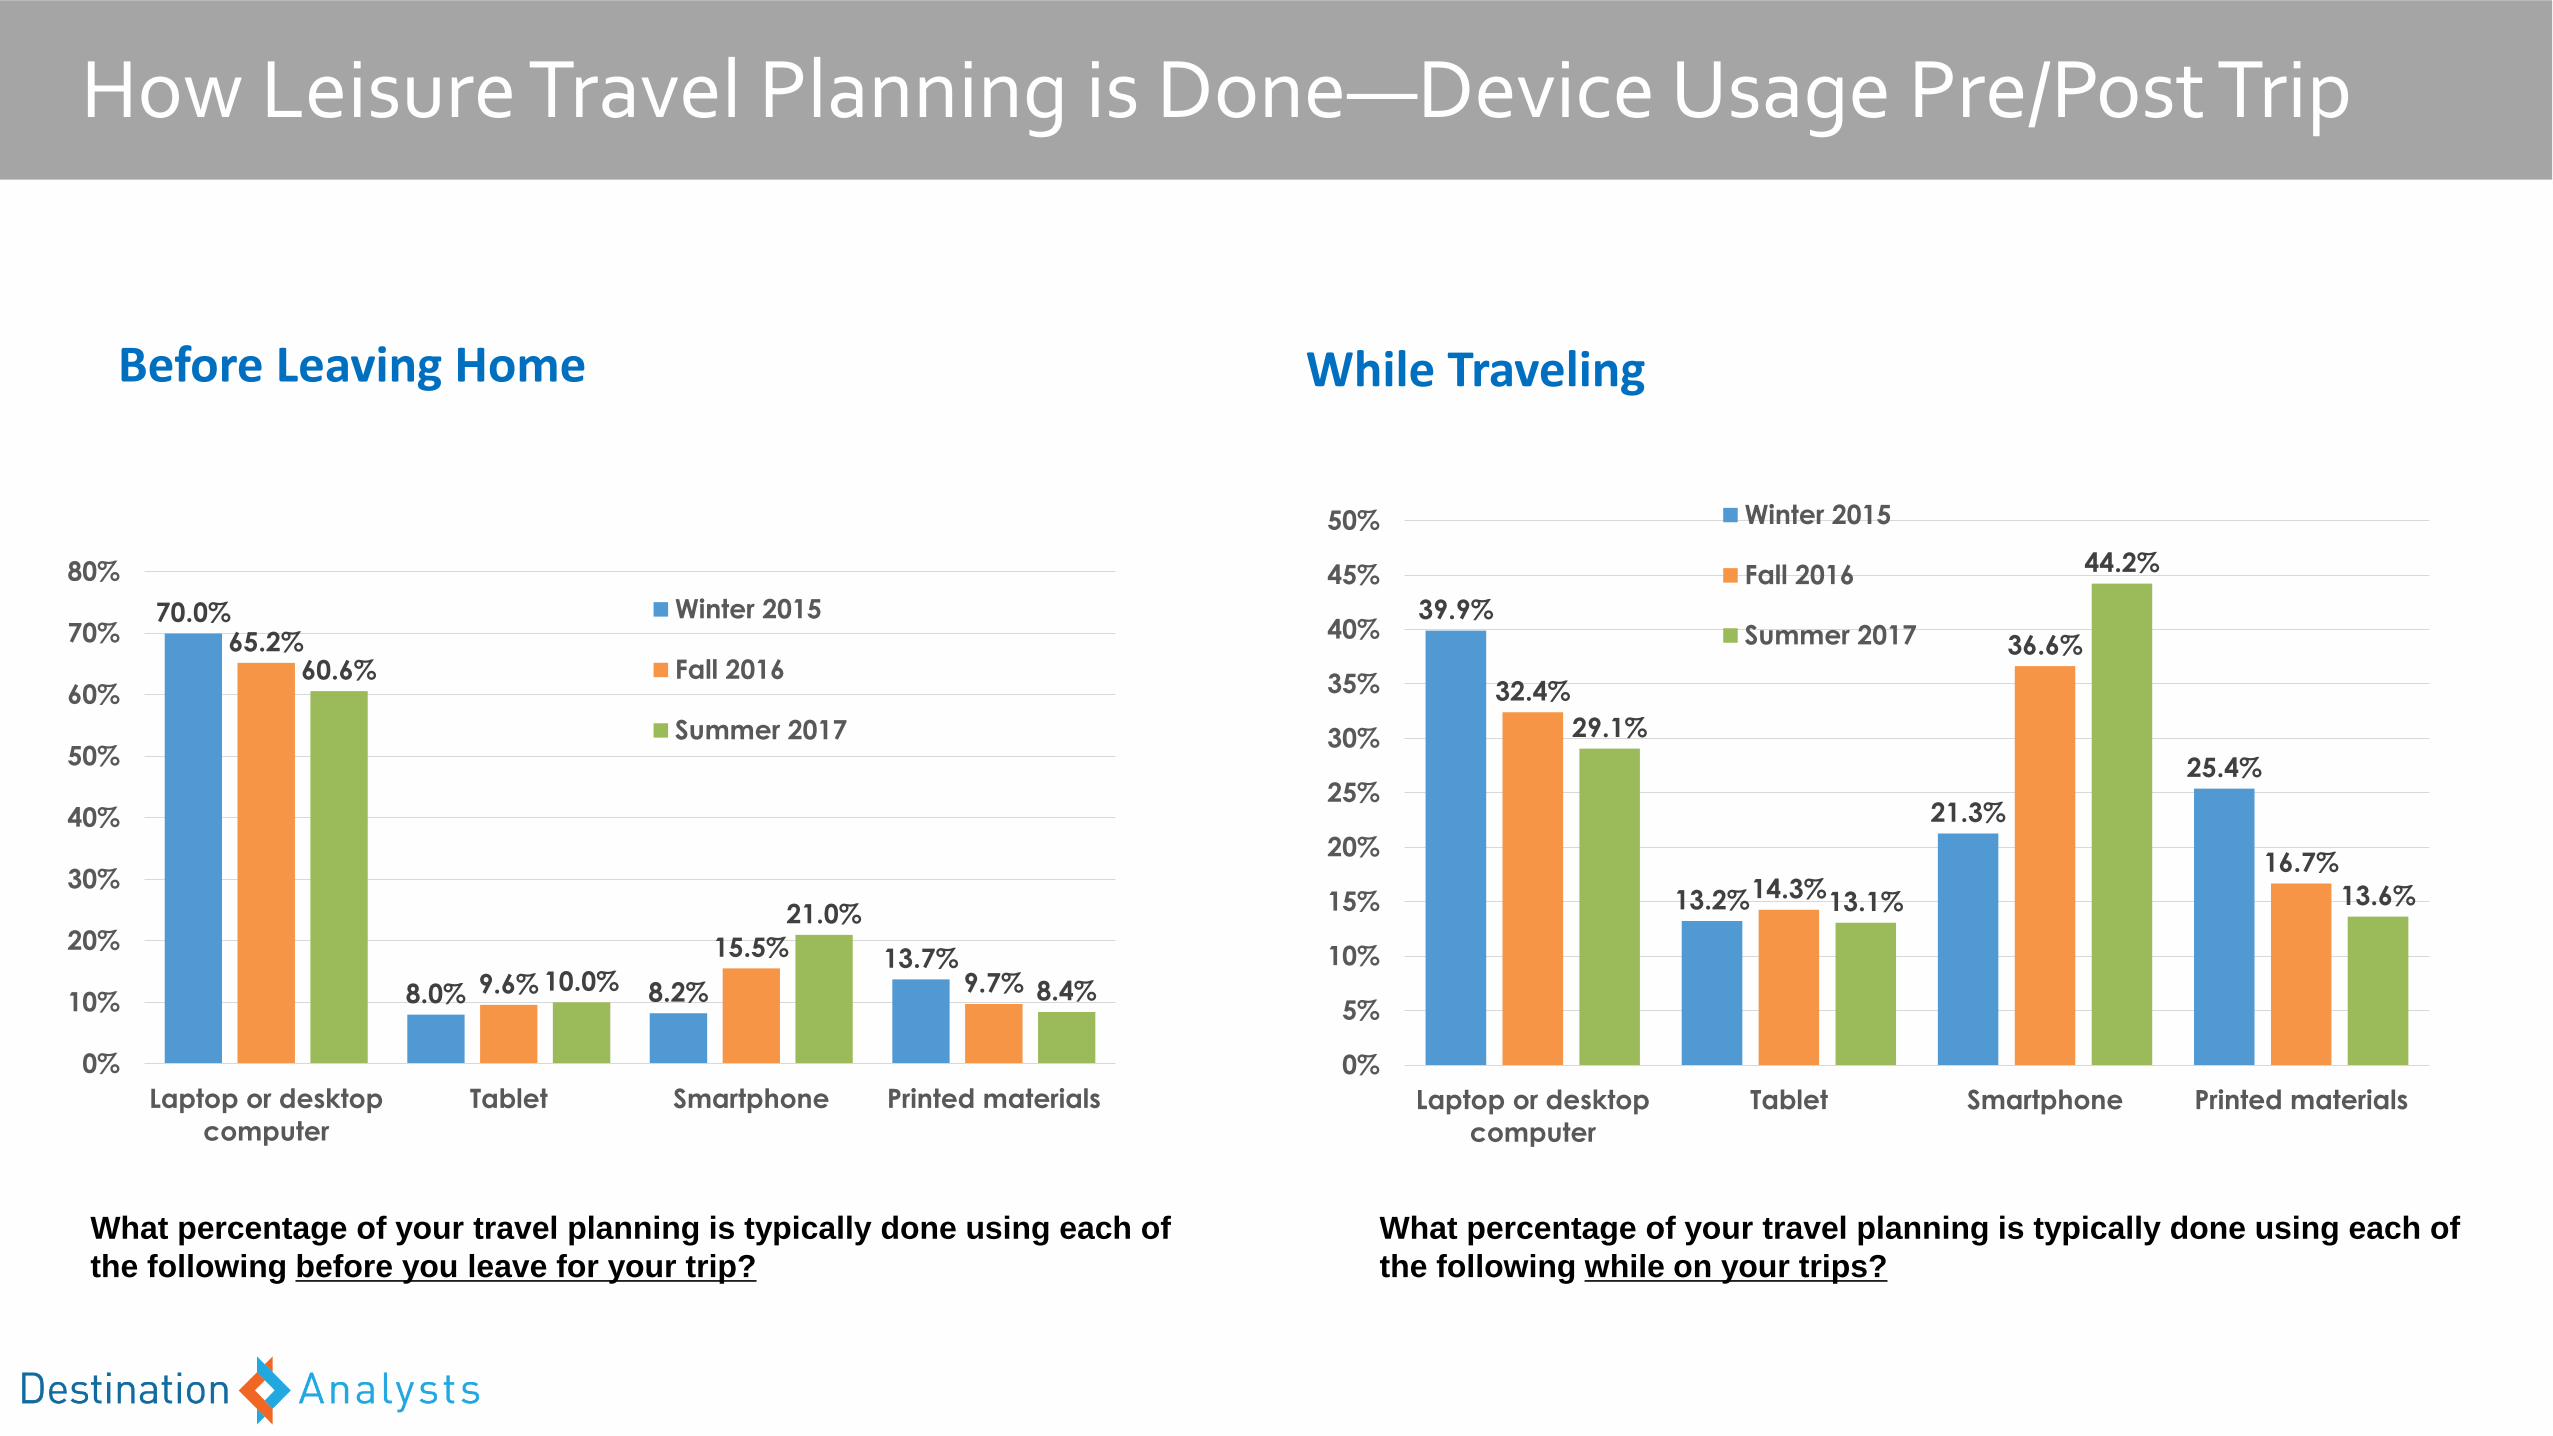
How Leisure Travel Planning is Done—Device Usage Pre/Post Trip
What percentage of your travel planning is typically done using each of
the following before you leave for your trip?
What percentage of your travel planning is typically done using each of
the following while on your trips?
Before Leaving Home While Traveling
70.0%
8.0% 8.2%
13.7%
65.2%
9.6%
15.5%
9.7%
60.6%
10.0%
21.0%
8.4%
0%
10%
20%
30%
40%
50%
60%
70%
80%
Laptop or desktop
computer
Tablet Smartphone Printed materials
Winter 2015
Fall 2016
Summer 2017
39.9%
13.2%
21.3%
25.4%
32.4%
14.3%
36.6%
16.7%
29.1%
13.1%
44.2%
13.6%
0%
5%
10%
15%
20%
25%
30%
35%
40%
45%
50%
Laptop or desktop
computer
Tablet Smartphone Printed materials
Winter 2015
Fall 2016
Summer 2017

What percentage of your travel planning is typically done using each of
the following before you leave for your trip?What percentage of your travel planning is typically done using each of
the following while on your trips?
34.3%
25.2%
10.7%8.2%
58.7%
49.0%
34.0%
27.0%
0%
10%
20%
30%
40%
50%
60%
70%
Millennials Generation X Baby Boomers
Before leaving home While traveling
How Leisure Travel Planning is Done—Device Usage Pre/Post Trip by Generation
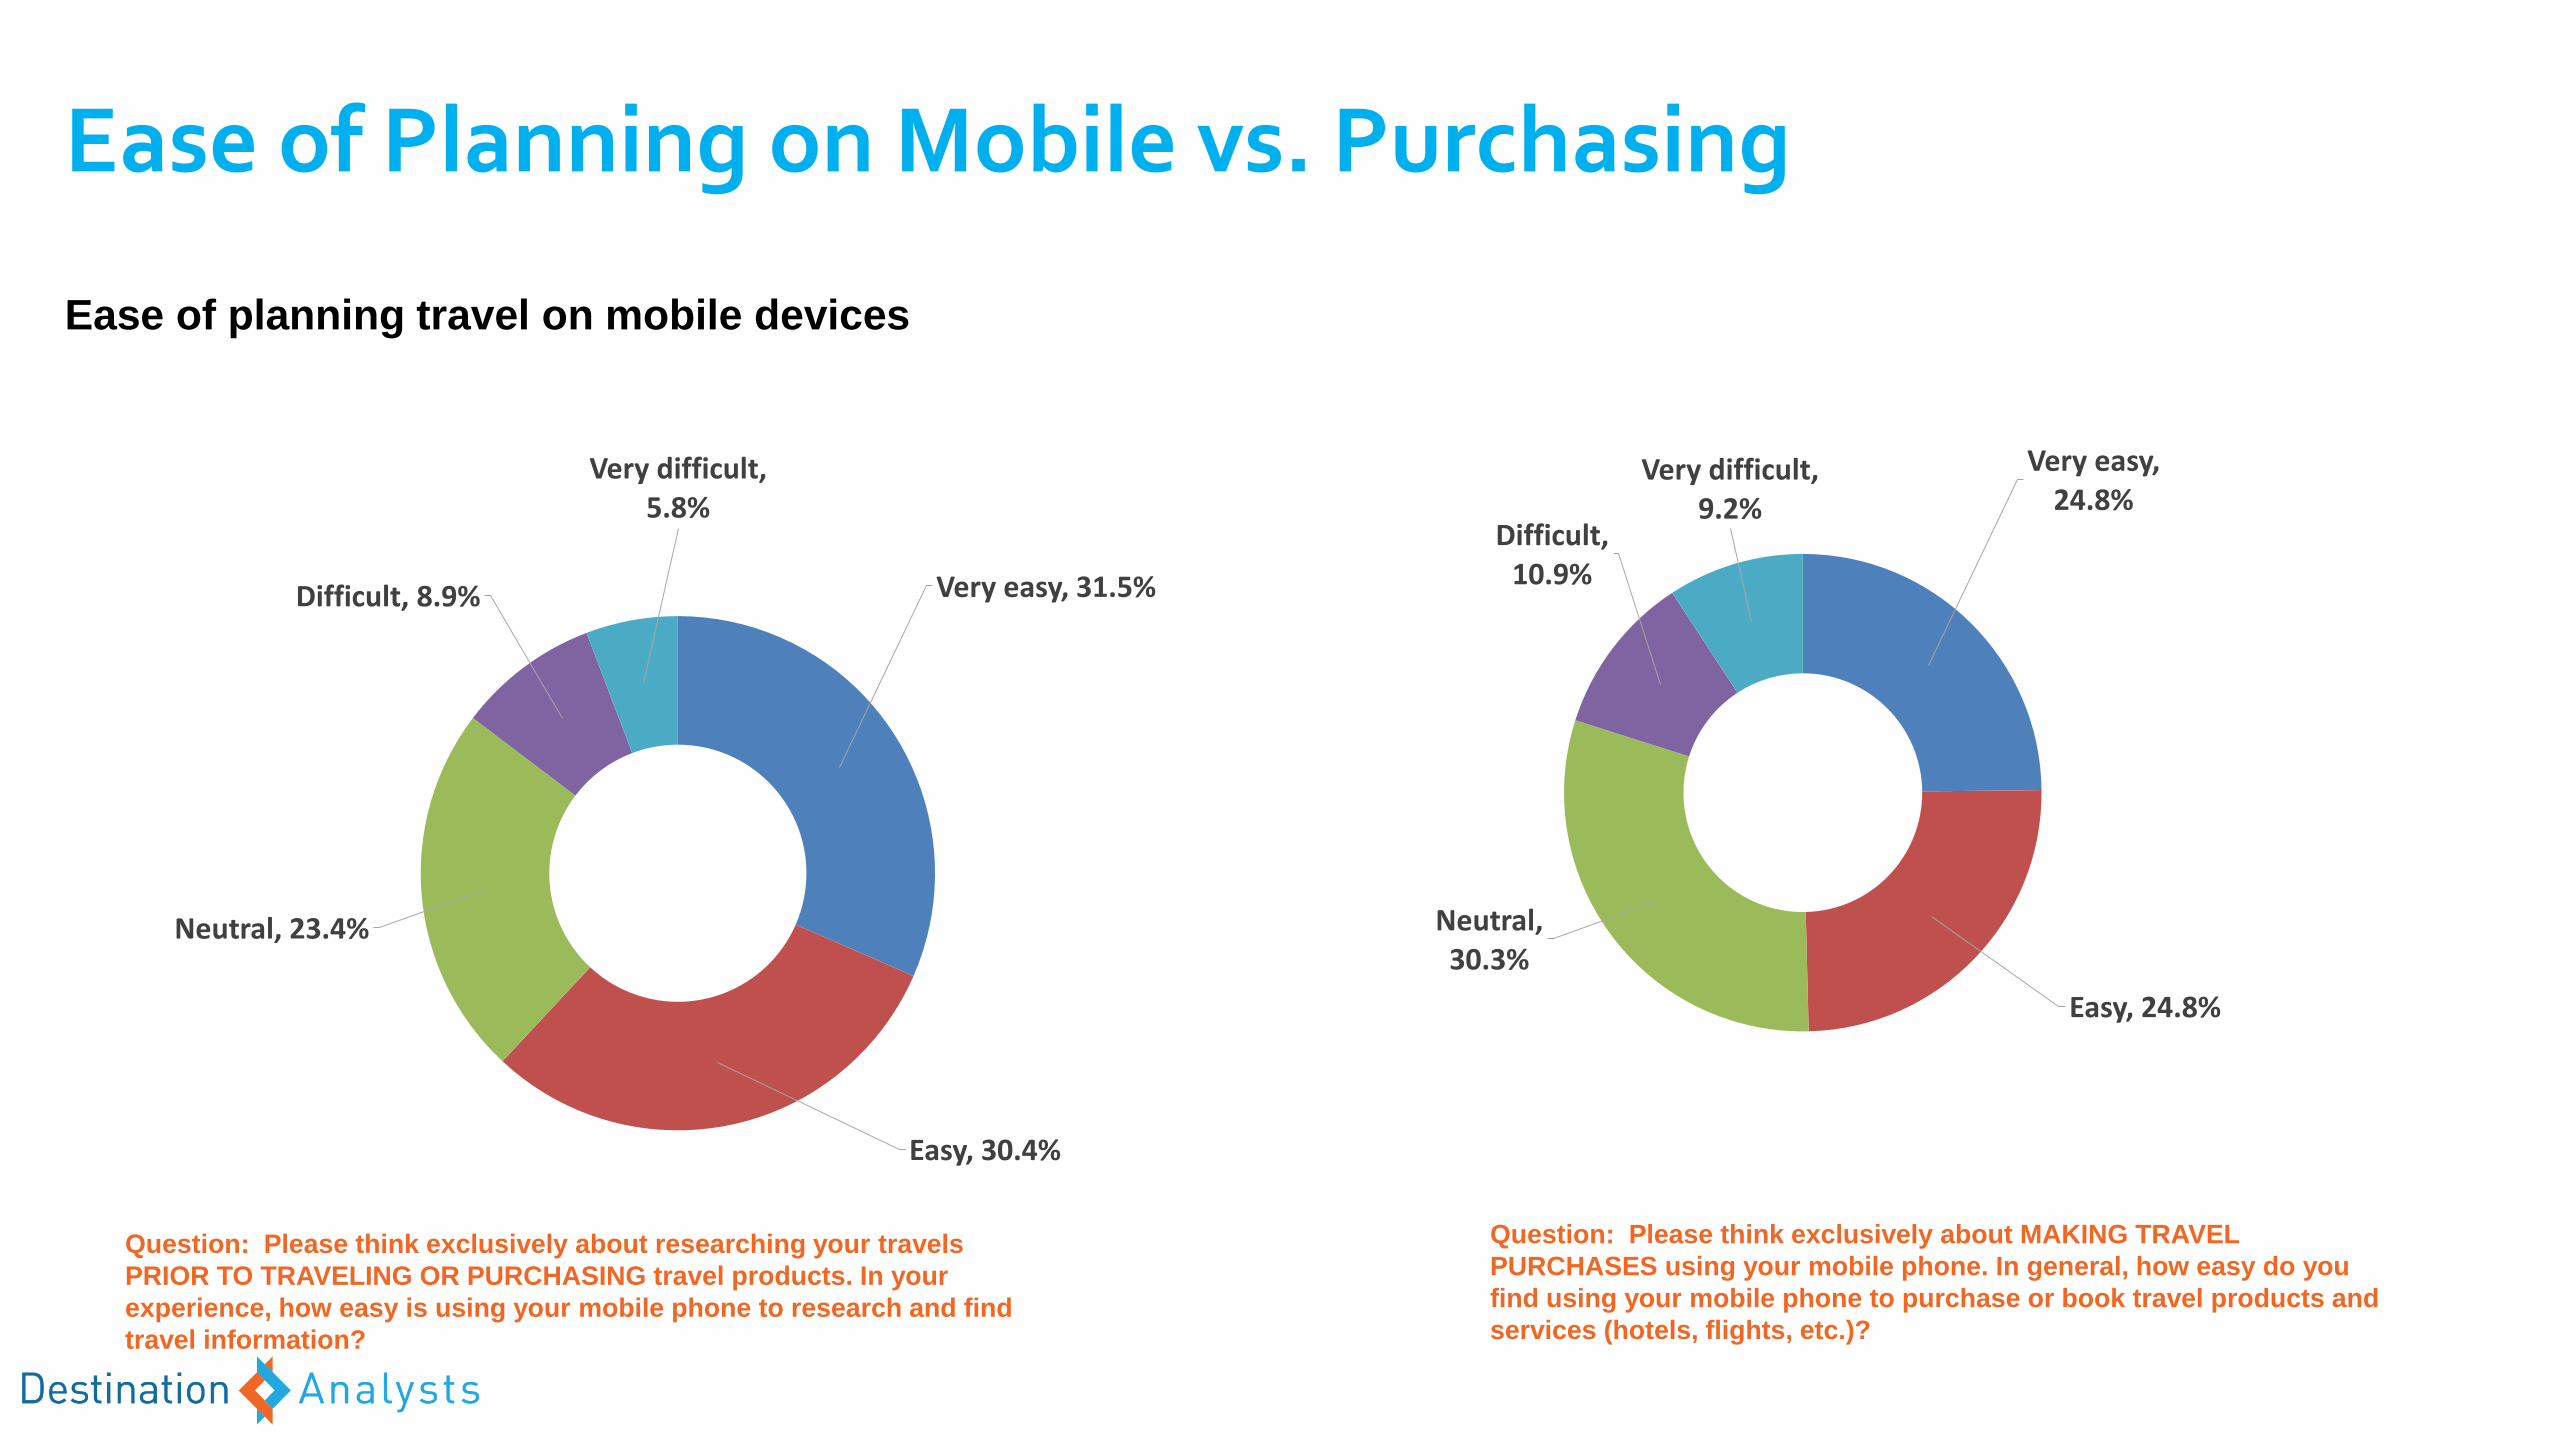
Ease of Planning on Mobile vs. Purchasing
Ease of purchasing travel productsEase of planning travel on mobile devices
Very easy, 31.5%
Easy, 30.4%
Neutral, 23.4%
Difficult, 8.9%
Very difficult, 5.8%
Very easy, 24.8%
Easy, 24.8%
Neutral, 30.3%
Difficult, 10.9%
Very difficult, 9.2%
Question: Please think exclusively about researching your travels
PRIOR TO TRAVELING OR PURCHASING travel products. In your
experience, how easy is using your mobile phone to research and find
travel information?
Question: Please think exclusively about MAKING TRAVEL
PURCHASES using your mobile phone. In general, how easy do you
find using your mobile phone to purchase or book travel products and
services (hotels, flights, etc.)?
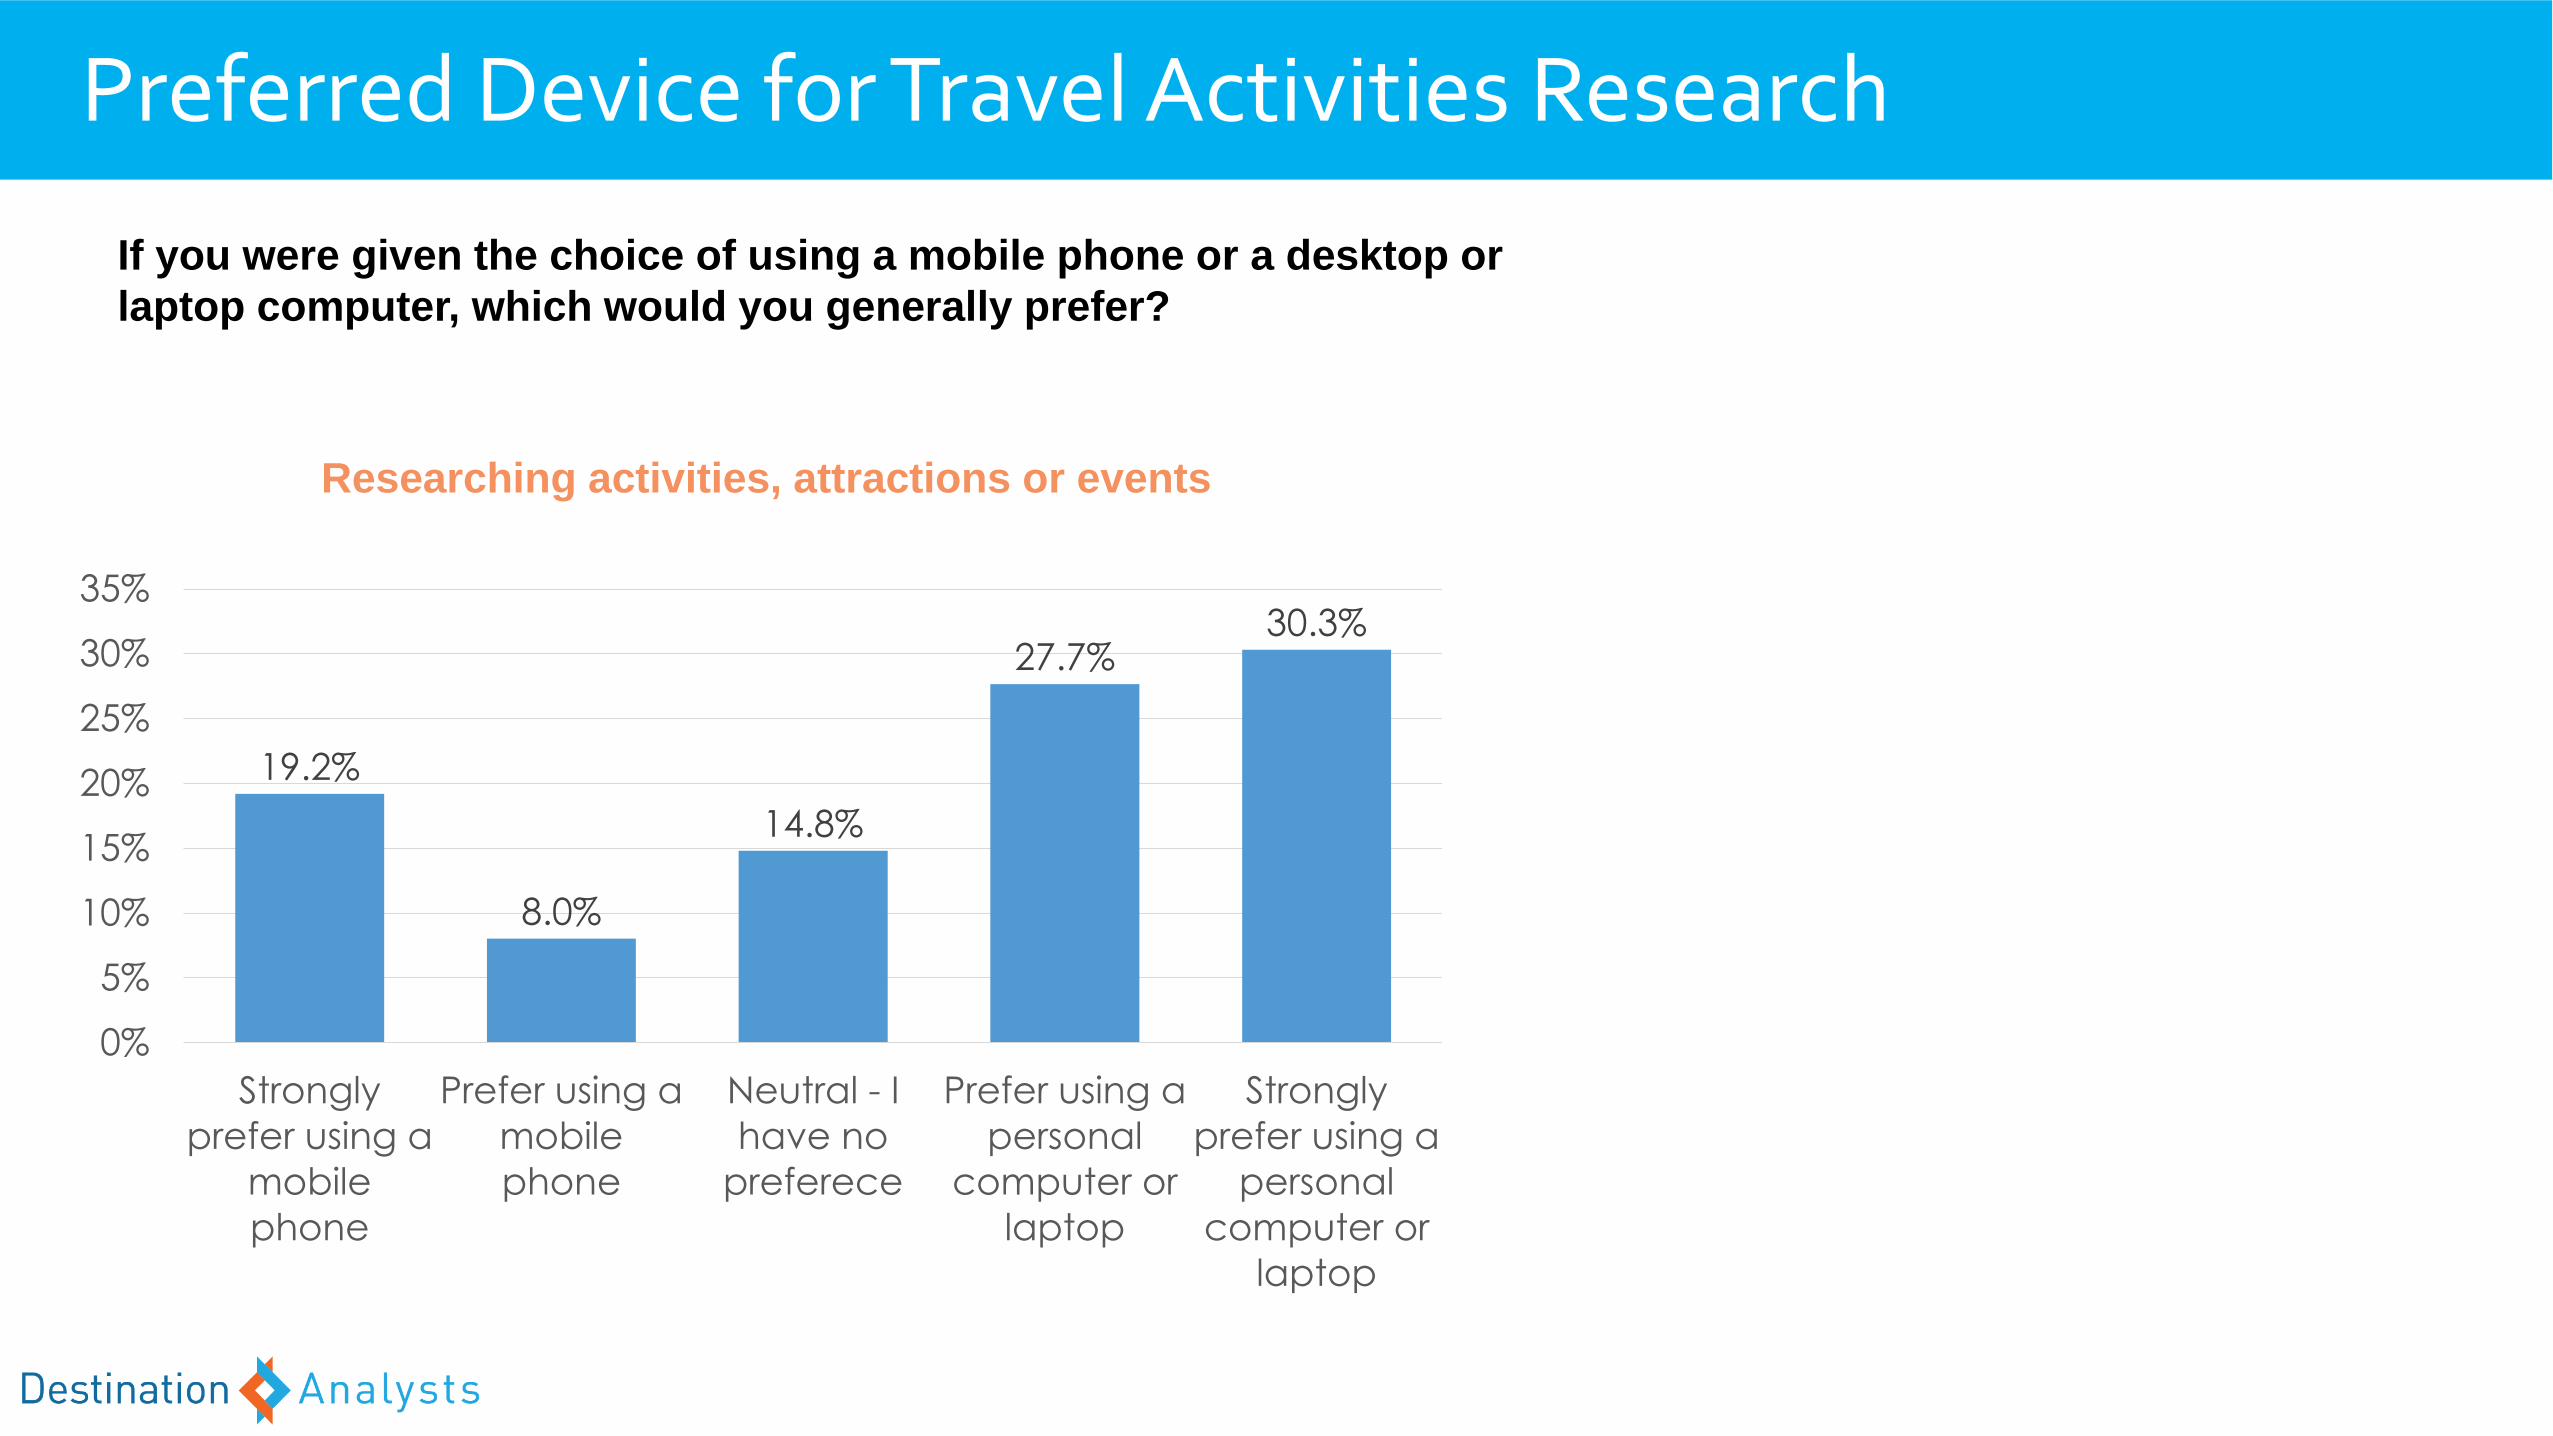
19.2%
8.0%
14.8%
27.7%30.3%
0%
5%
10%
15%
20%
25%
30%
35%
Strongly
prefer using a
mobile
phone
Prefer using a
mobile
phone
Neutral - I
have no
preferece
Prefer using a
personal
computer or
laptop
Strongly
prefer using a
personal
computer or
laptop
Preferred Device for Travel Activities Research
If you were given the choice of using a mobile phone or a desktop or
laptop computer, which would you generally prefer?
Researching activities, attractions or events
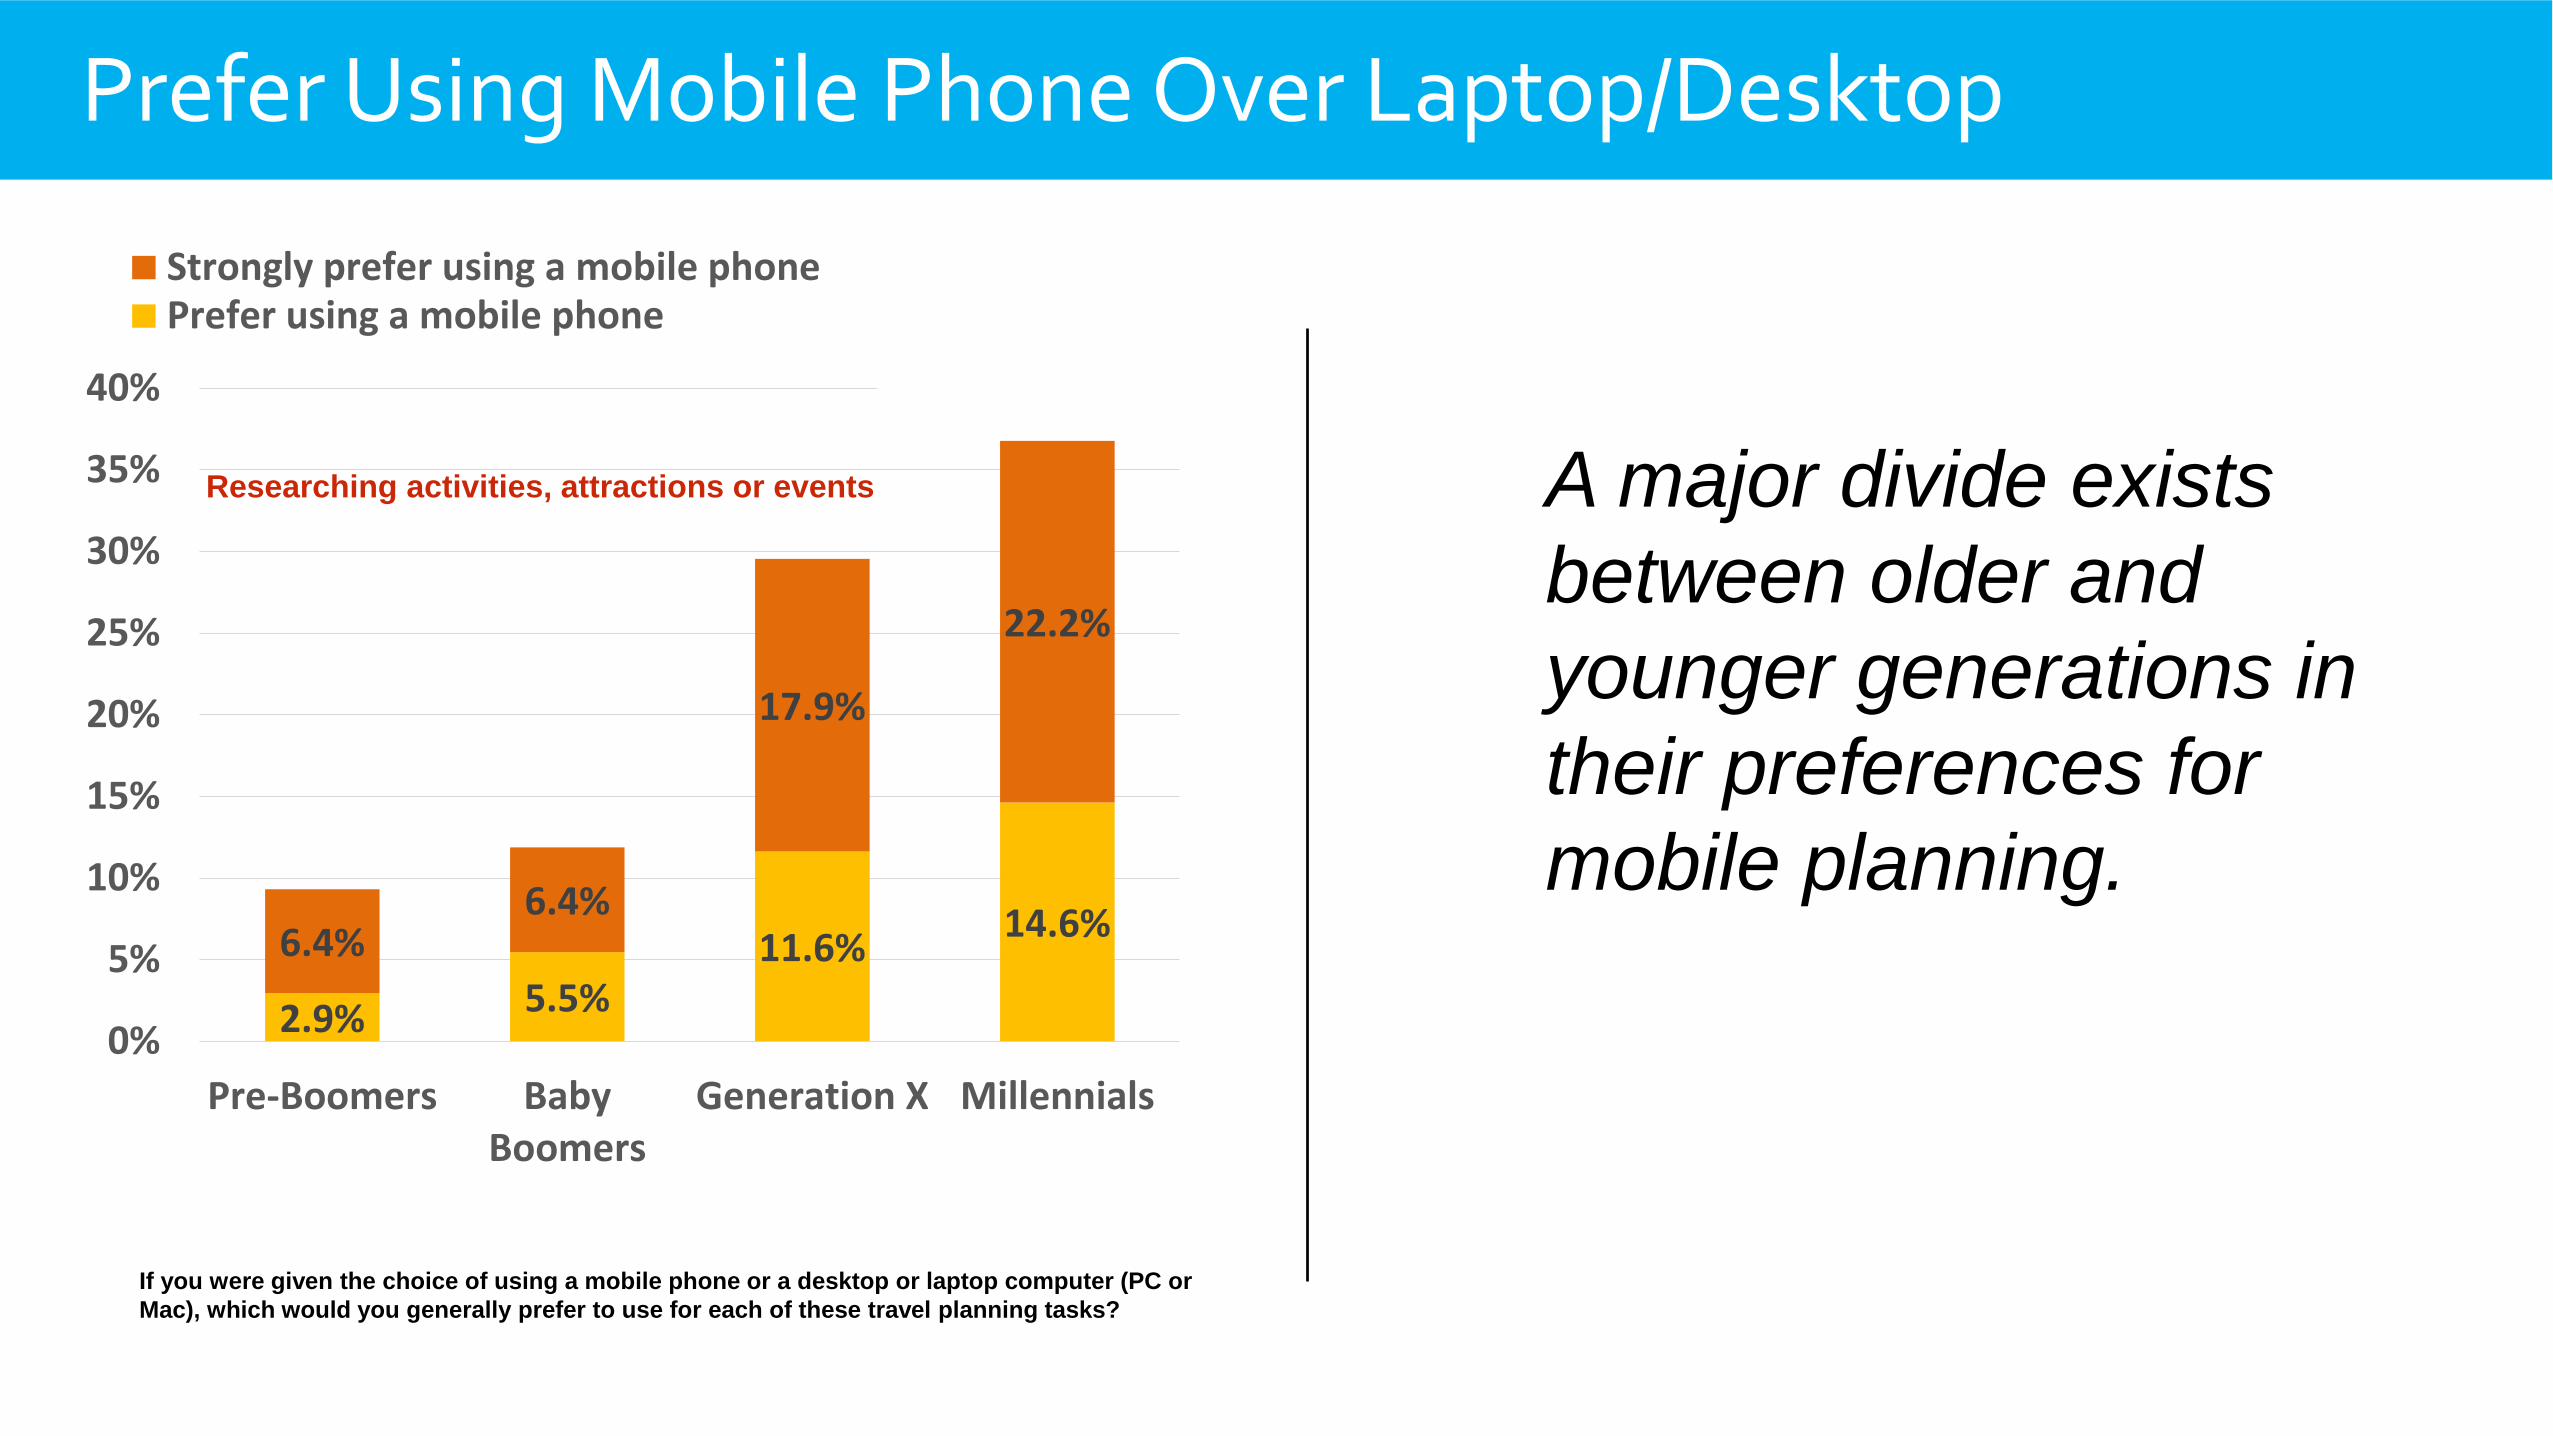
Prefer Using Mobile Phone Over Laptop/Desktop
If you were given the choice of using a mobile phone or a desktop or laptop computer (PC or
Mac), which would you generally prefer to use for each of these travel planning tasks?
Researching activities, attractions or events
2016 = 44.6%
2017 = 36.8%
2.9% 5.5%11.6%
14.6%6.4%6.4%
17.9%
22.2%
0%
5%
10%
15%
20%
25%
30%
35%
40%
Pre-Boomers BabyBoomers
Generation X Millennials
Strongly prefer using a mobile phonePrefer using a mobile phone
A major divide exists
between older and
younger generations in
their preferences for
mobile planning.
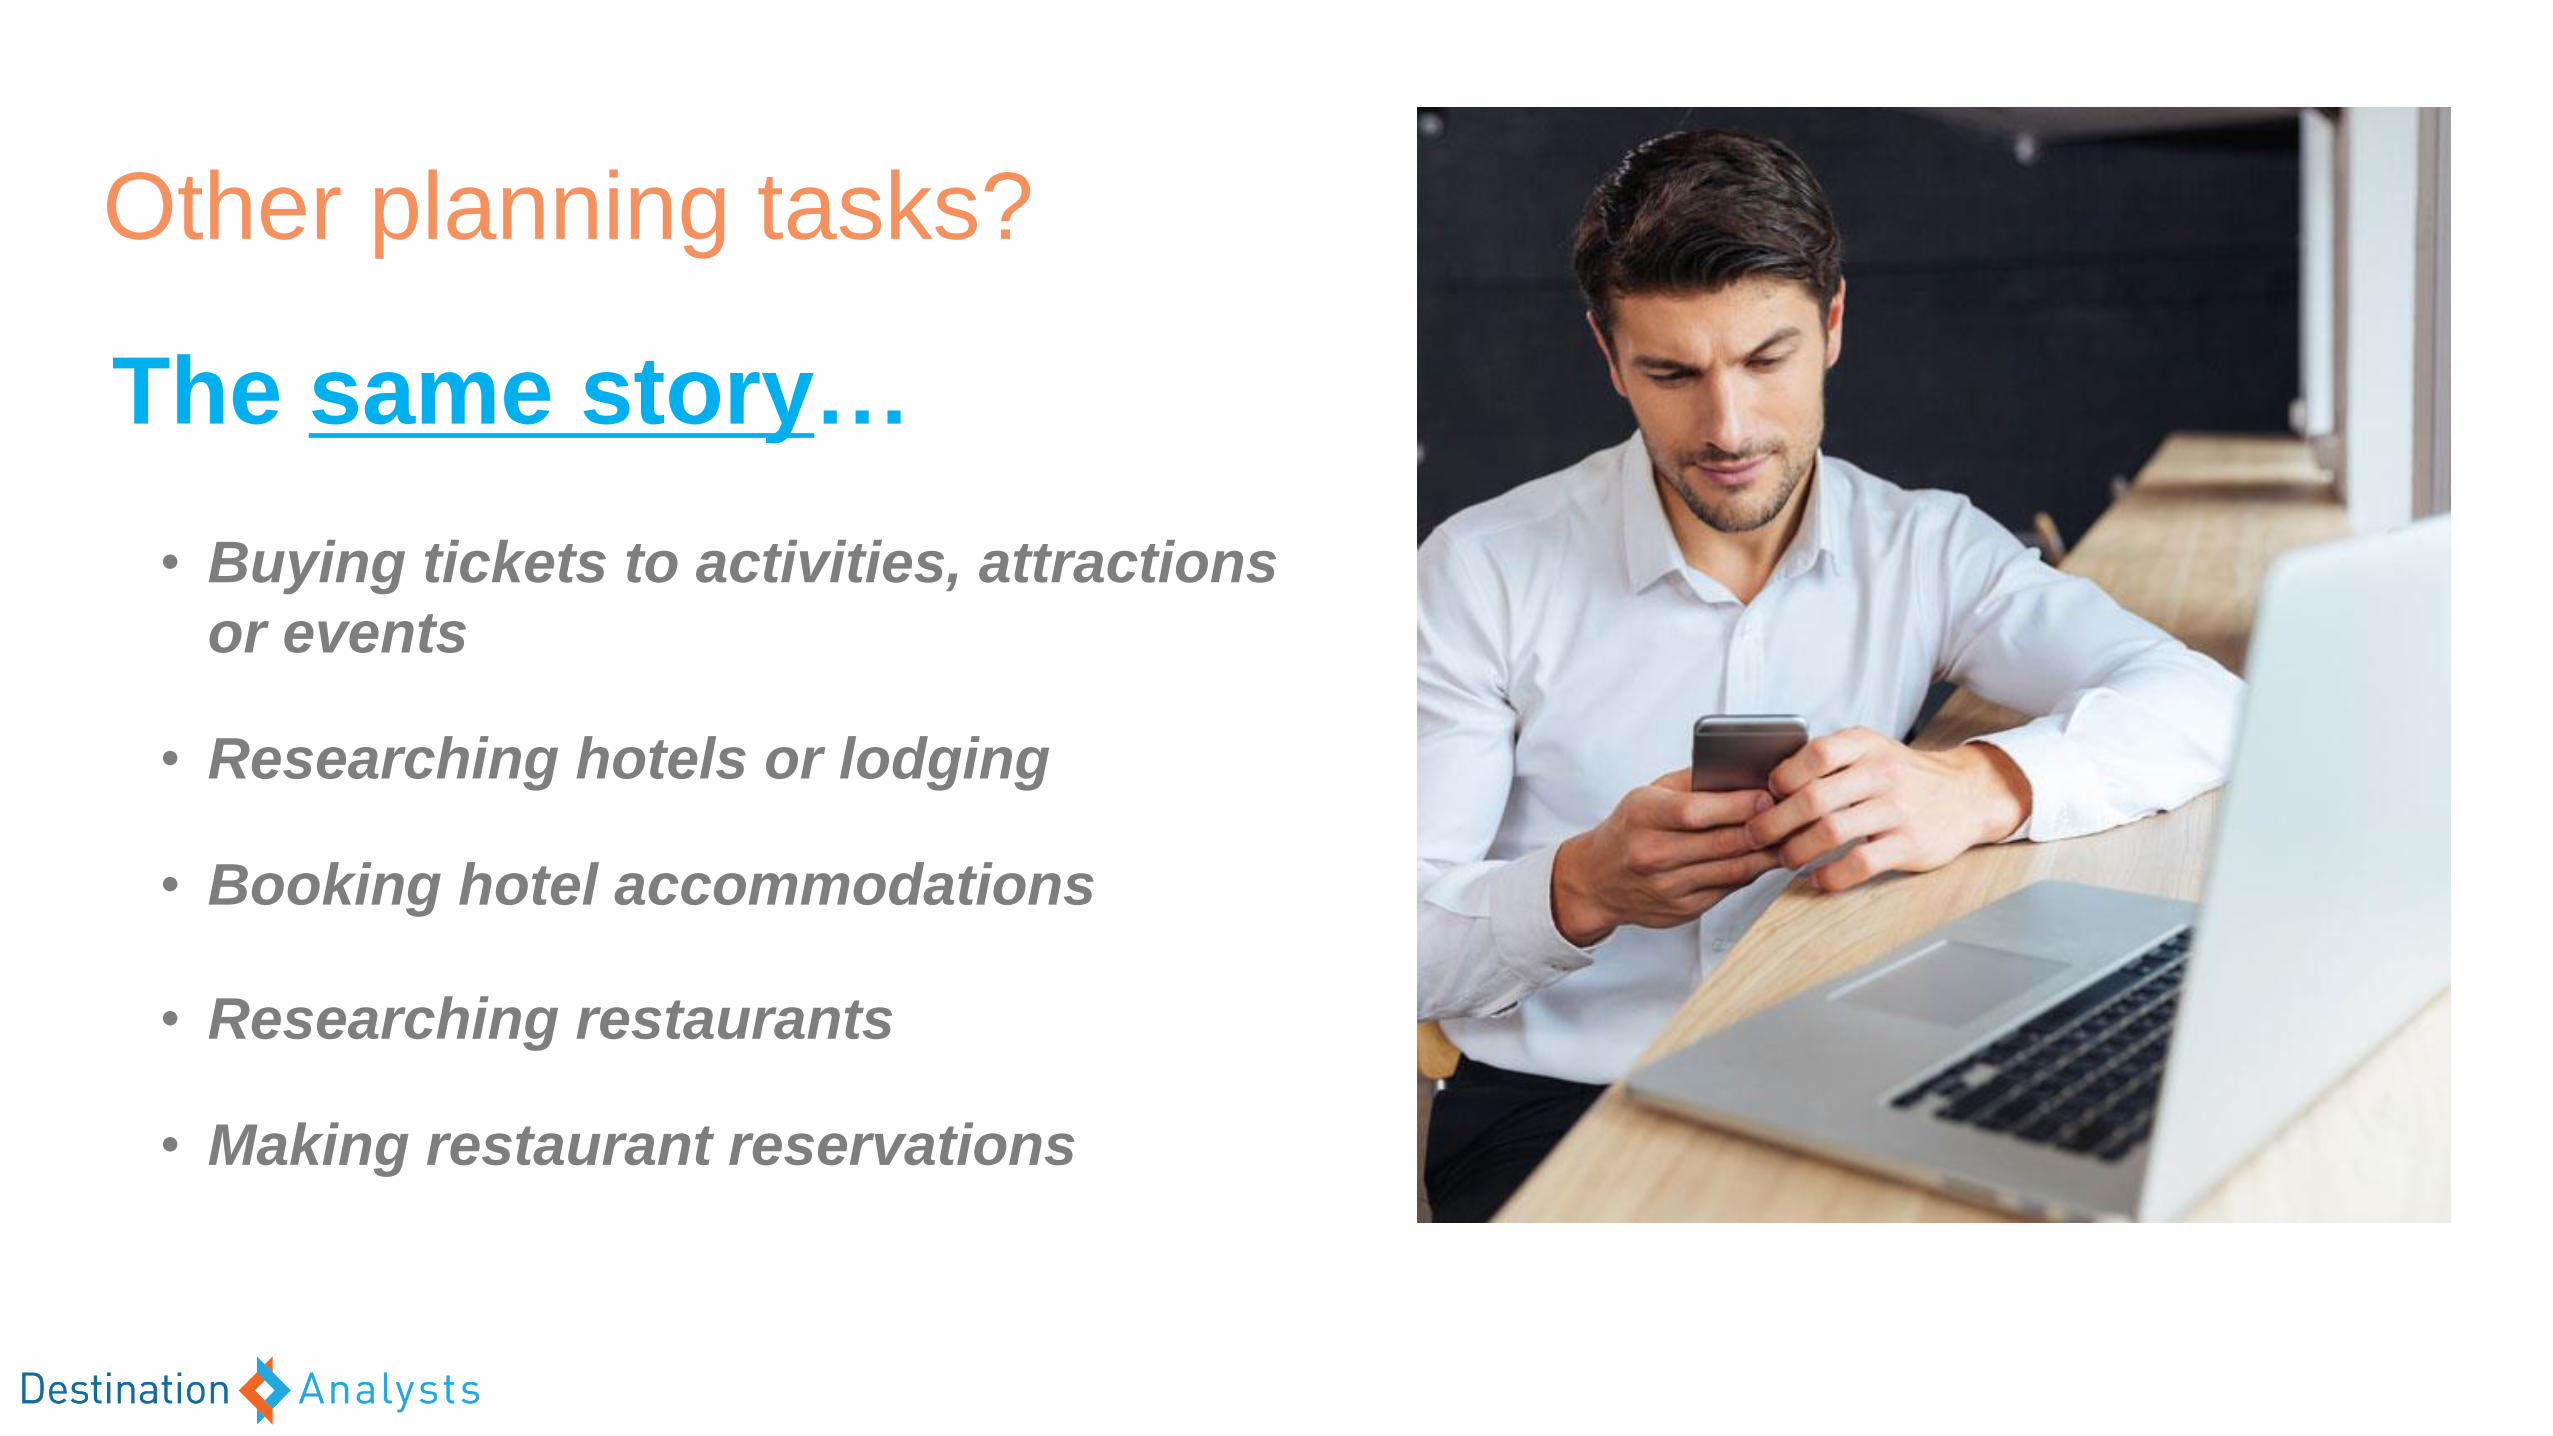
The same story…
• Buying tickets to activities, attractions
or events
• Researching hotels or lodging
• Booking hotel accommodations
• Researching restaurants
• Making restaurant reservations
Other planning tasks?
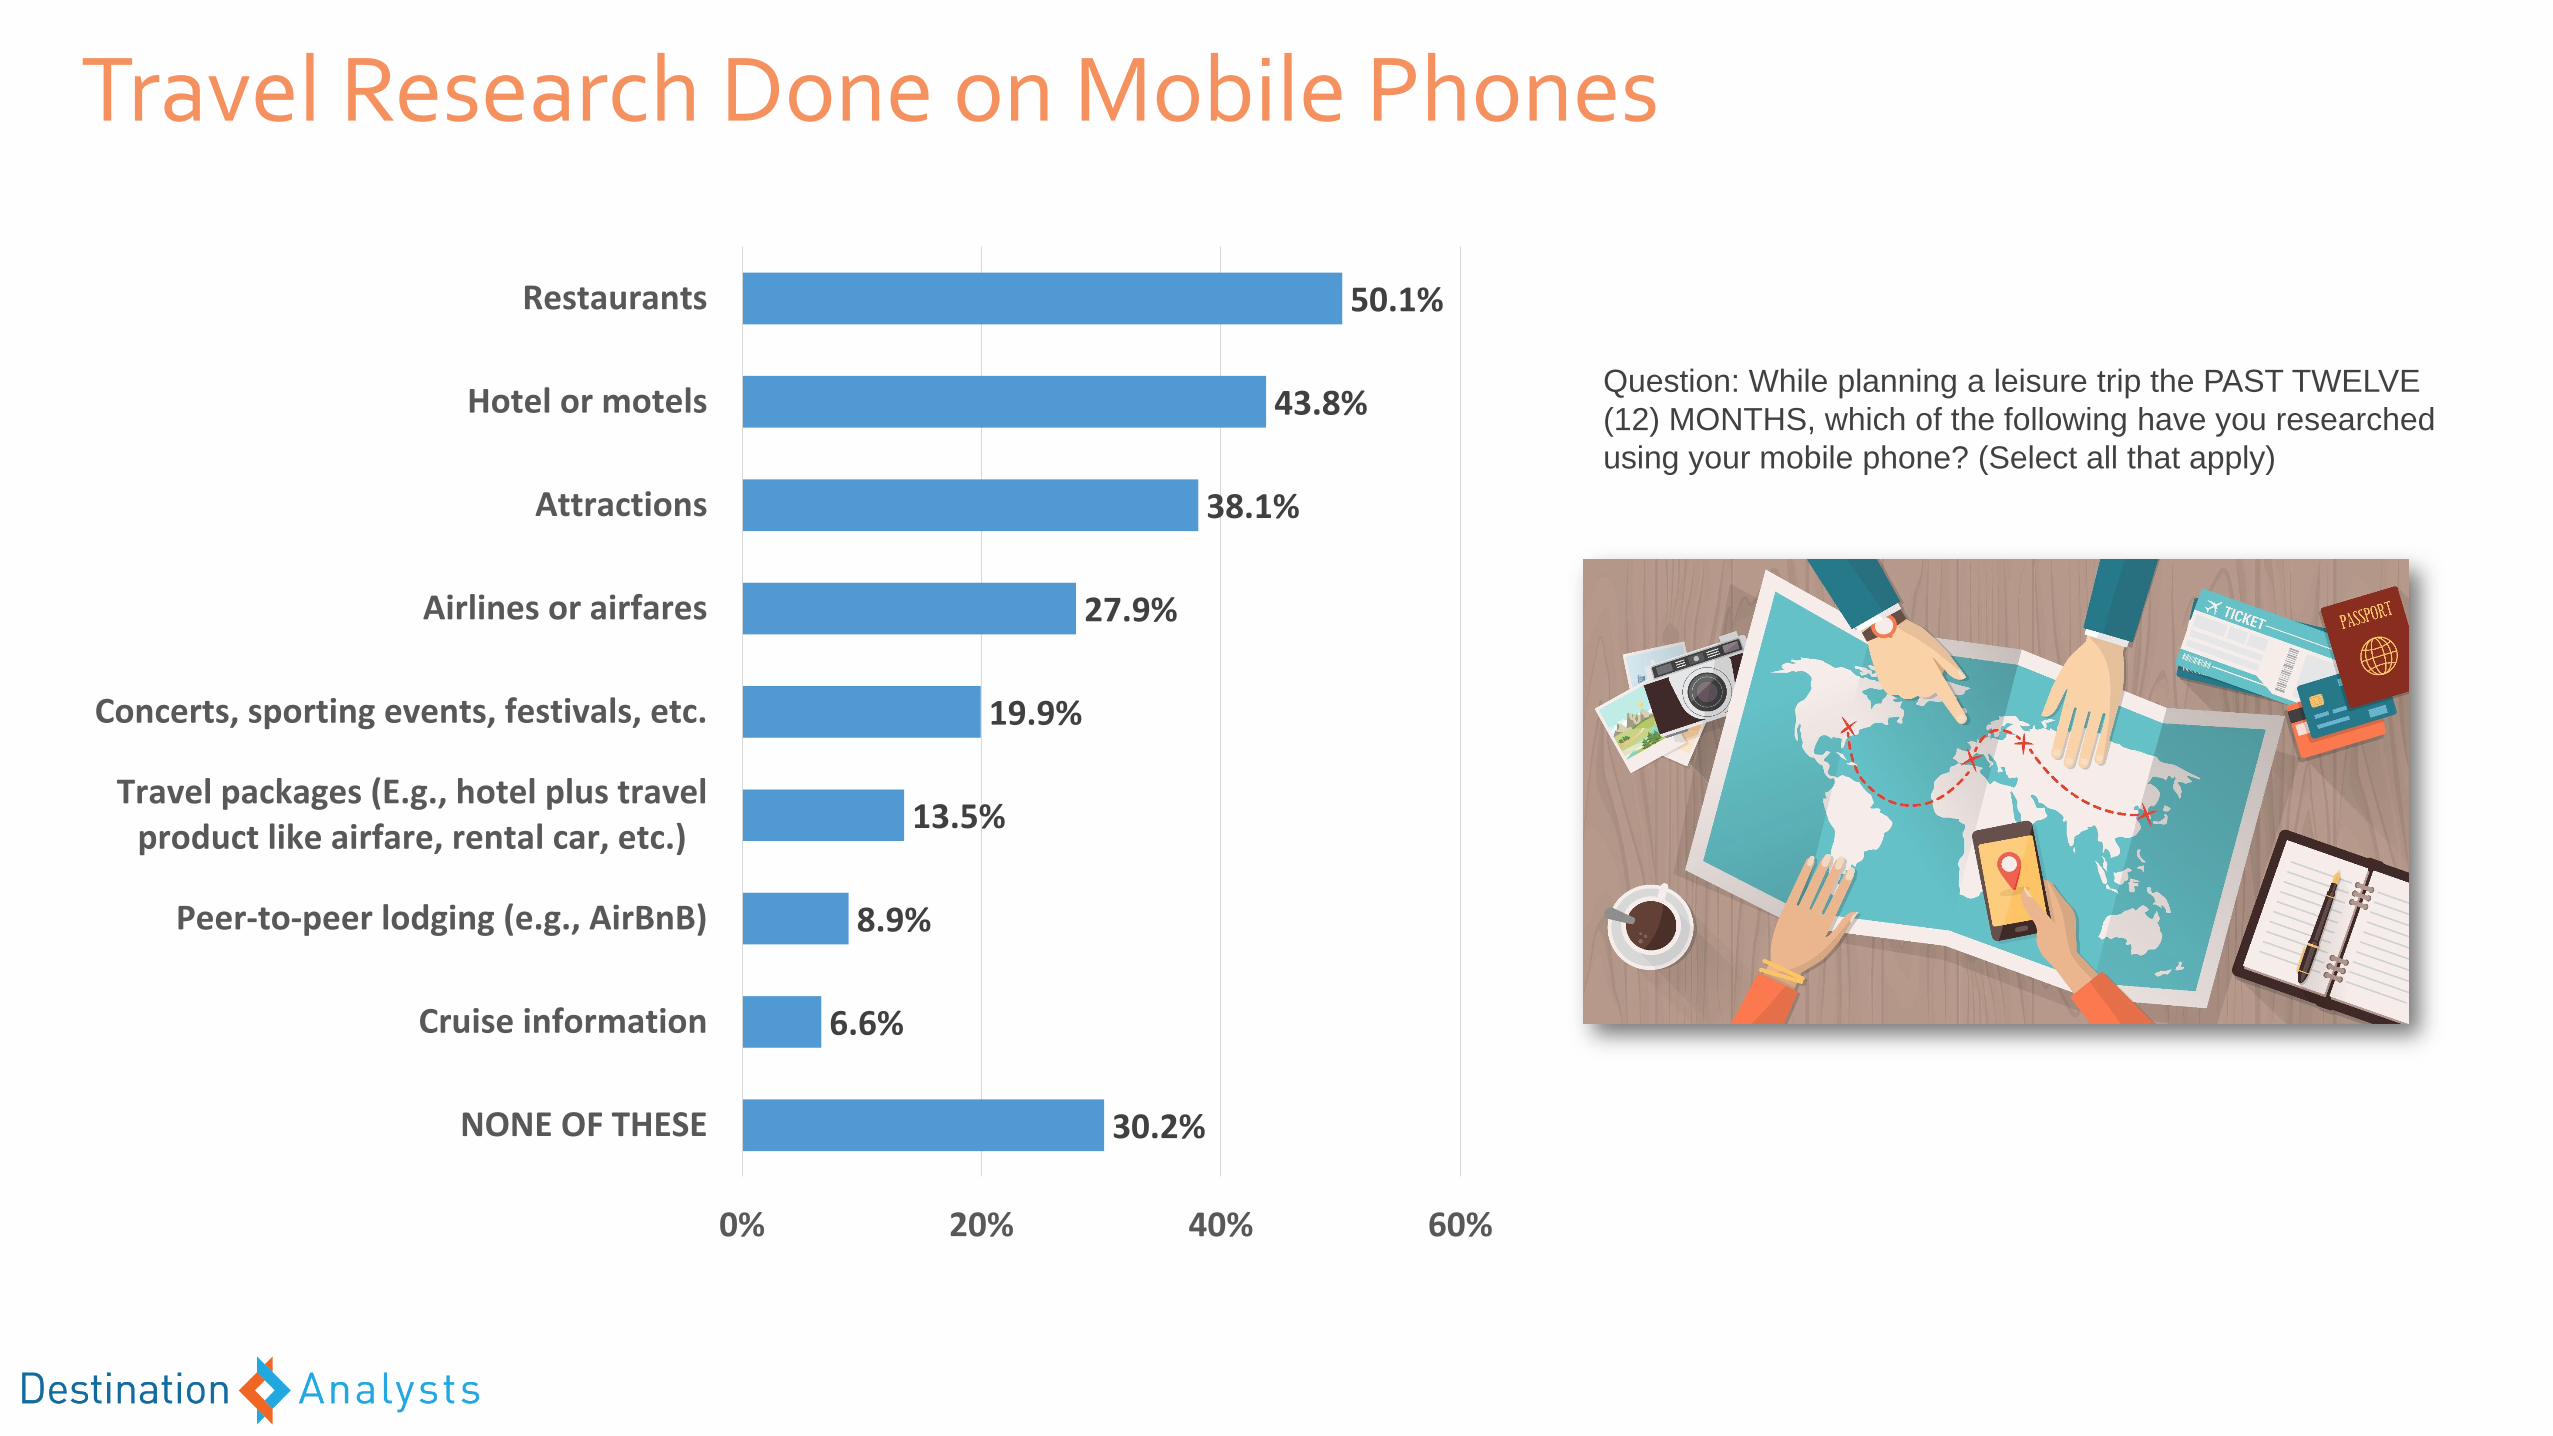
Travel Research Done on Mobile Phones
30.2%
6.6%
8.9%
13.5%
19.9%
27.9%
38.1%
43.8%
50.1%
0% 20% 40% 60%
NONE OF THESE
Cruise information
Peer-to-peer lodging (e.g., AirBnB)
Travel packages (E.g., hotel plus travelproduct like airfare, rental car, etc.)
Concerts, sporting events, festivals, etc.
Airlines or airfares
Attractions
Hotel or motels
Restaurants
Question: While planning a leisure trip the PAST TWELVE
(12) MONTHS, which of the following have you researched
using your mobile phone? (Select all that apply)
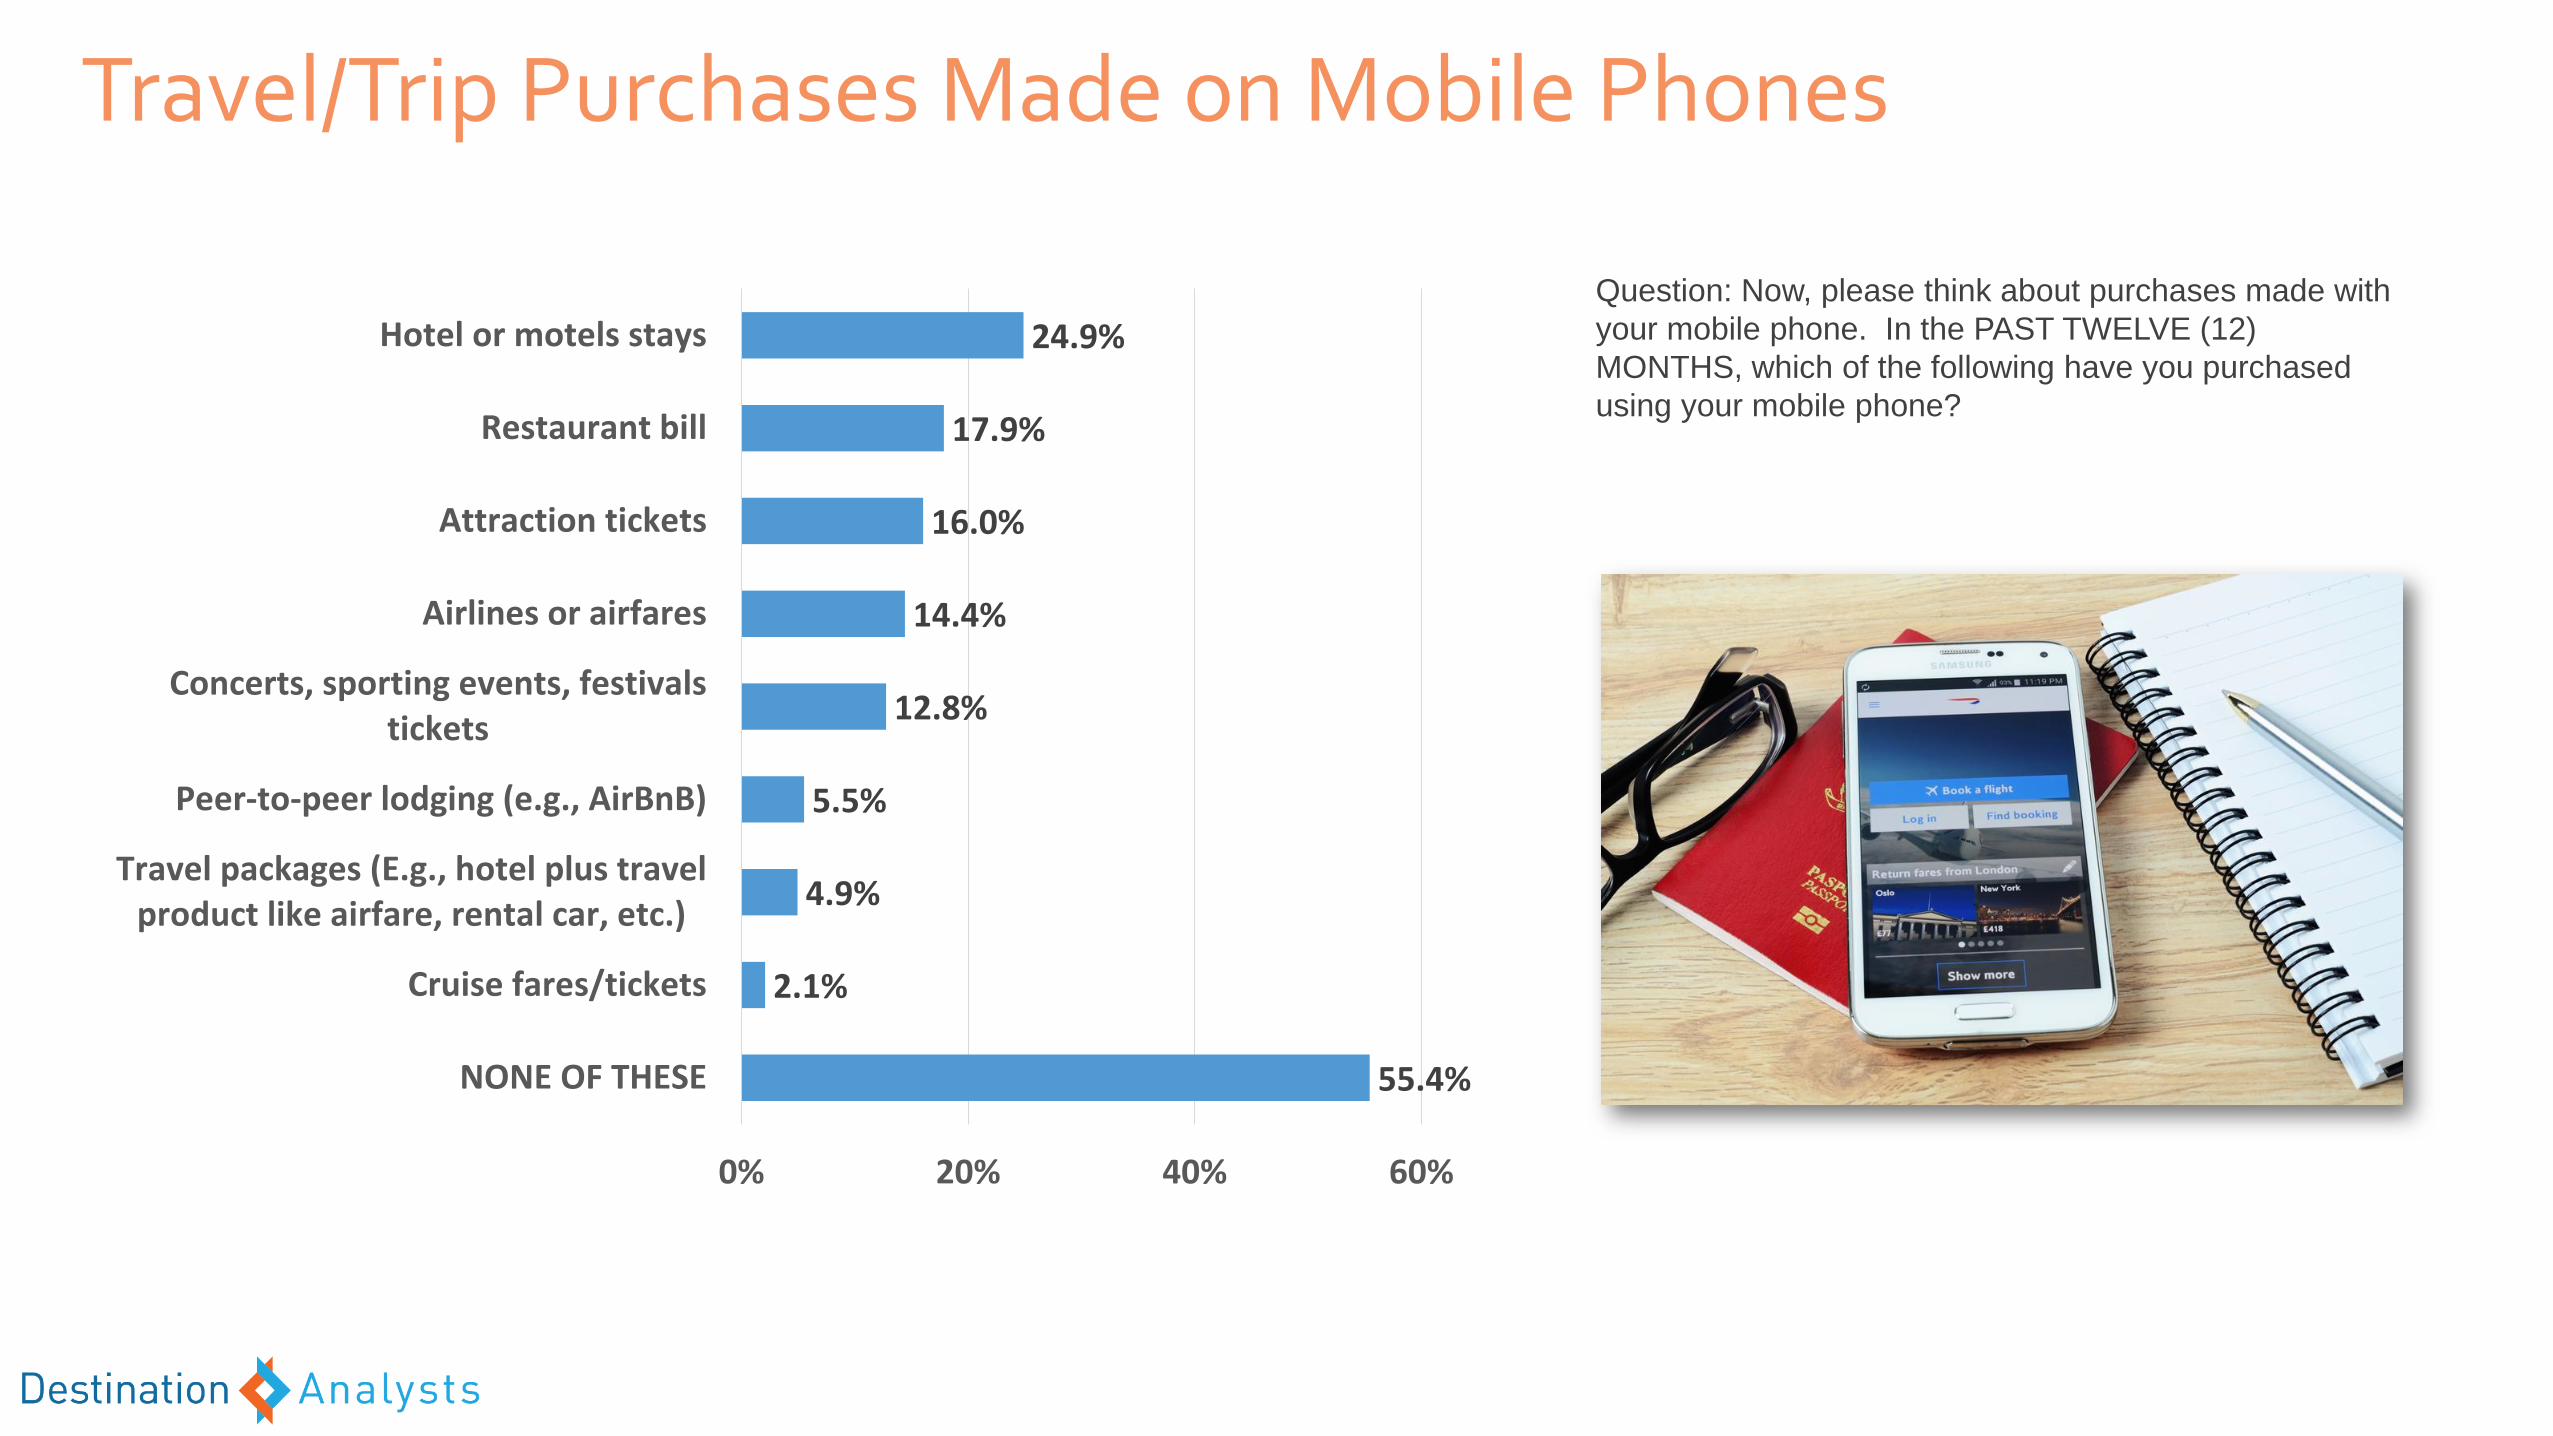
Travel/Trip Purchases Made on Mobile Phones
Question: Now, please think about purchases made with
your mobile phone. In the PAST TWELVE (12)
MONTHS, which of the following have you purchased
using your mobile phone?
55.4%
2.1%
4.9%
5.5%
12.8%
14.4%
16.0%
17.9%
24.9%
0% 20% 40% 60%
NONE OF THESE
Cruise fares/tickets
Travel packages (E.g., hotel plus travelproduct like airfare, rental car, etc.)
Peer-to-peer lodging (e.g., AirBnB)
Concerts, sporting events, festivalstickets
Airlines or airfares
Attraction tickets
Restaurant bill
Hotel or motels stays
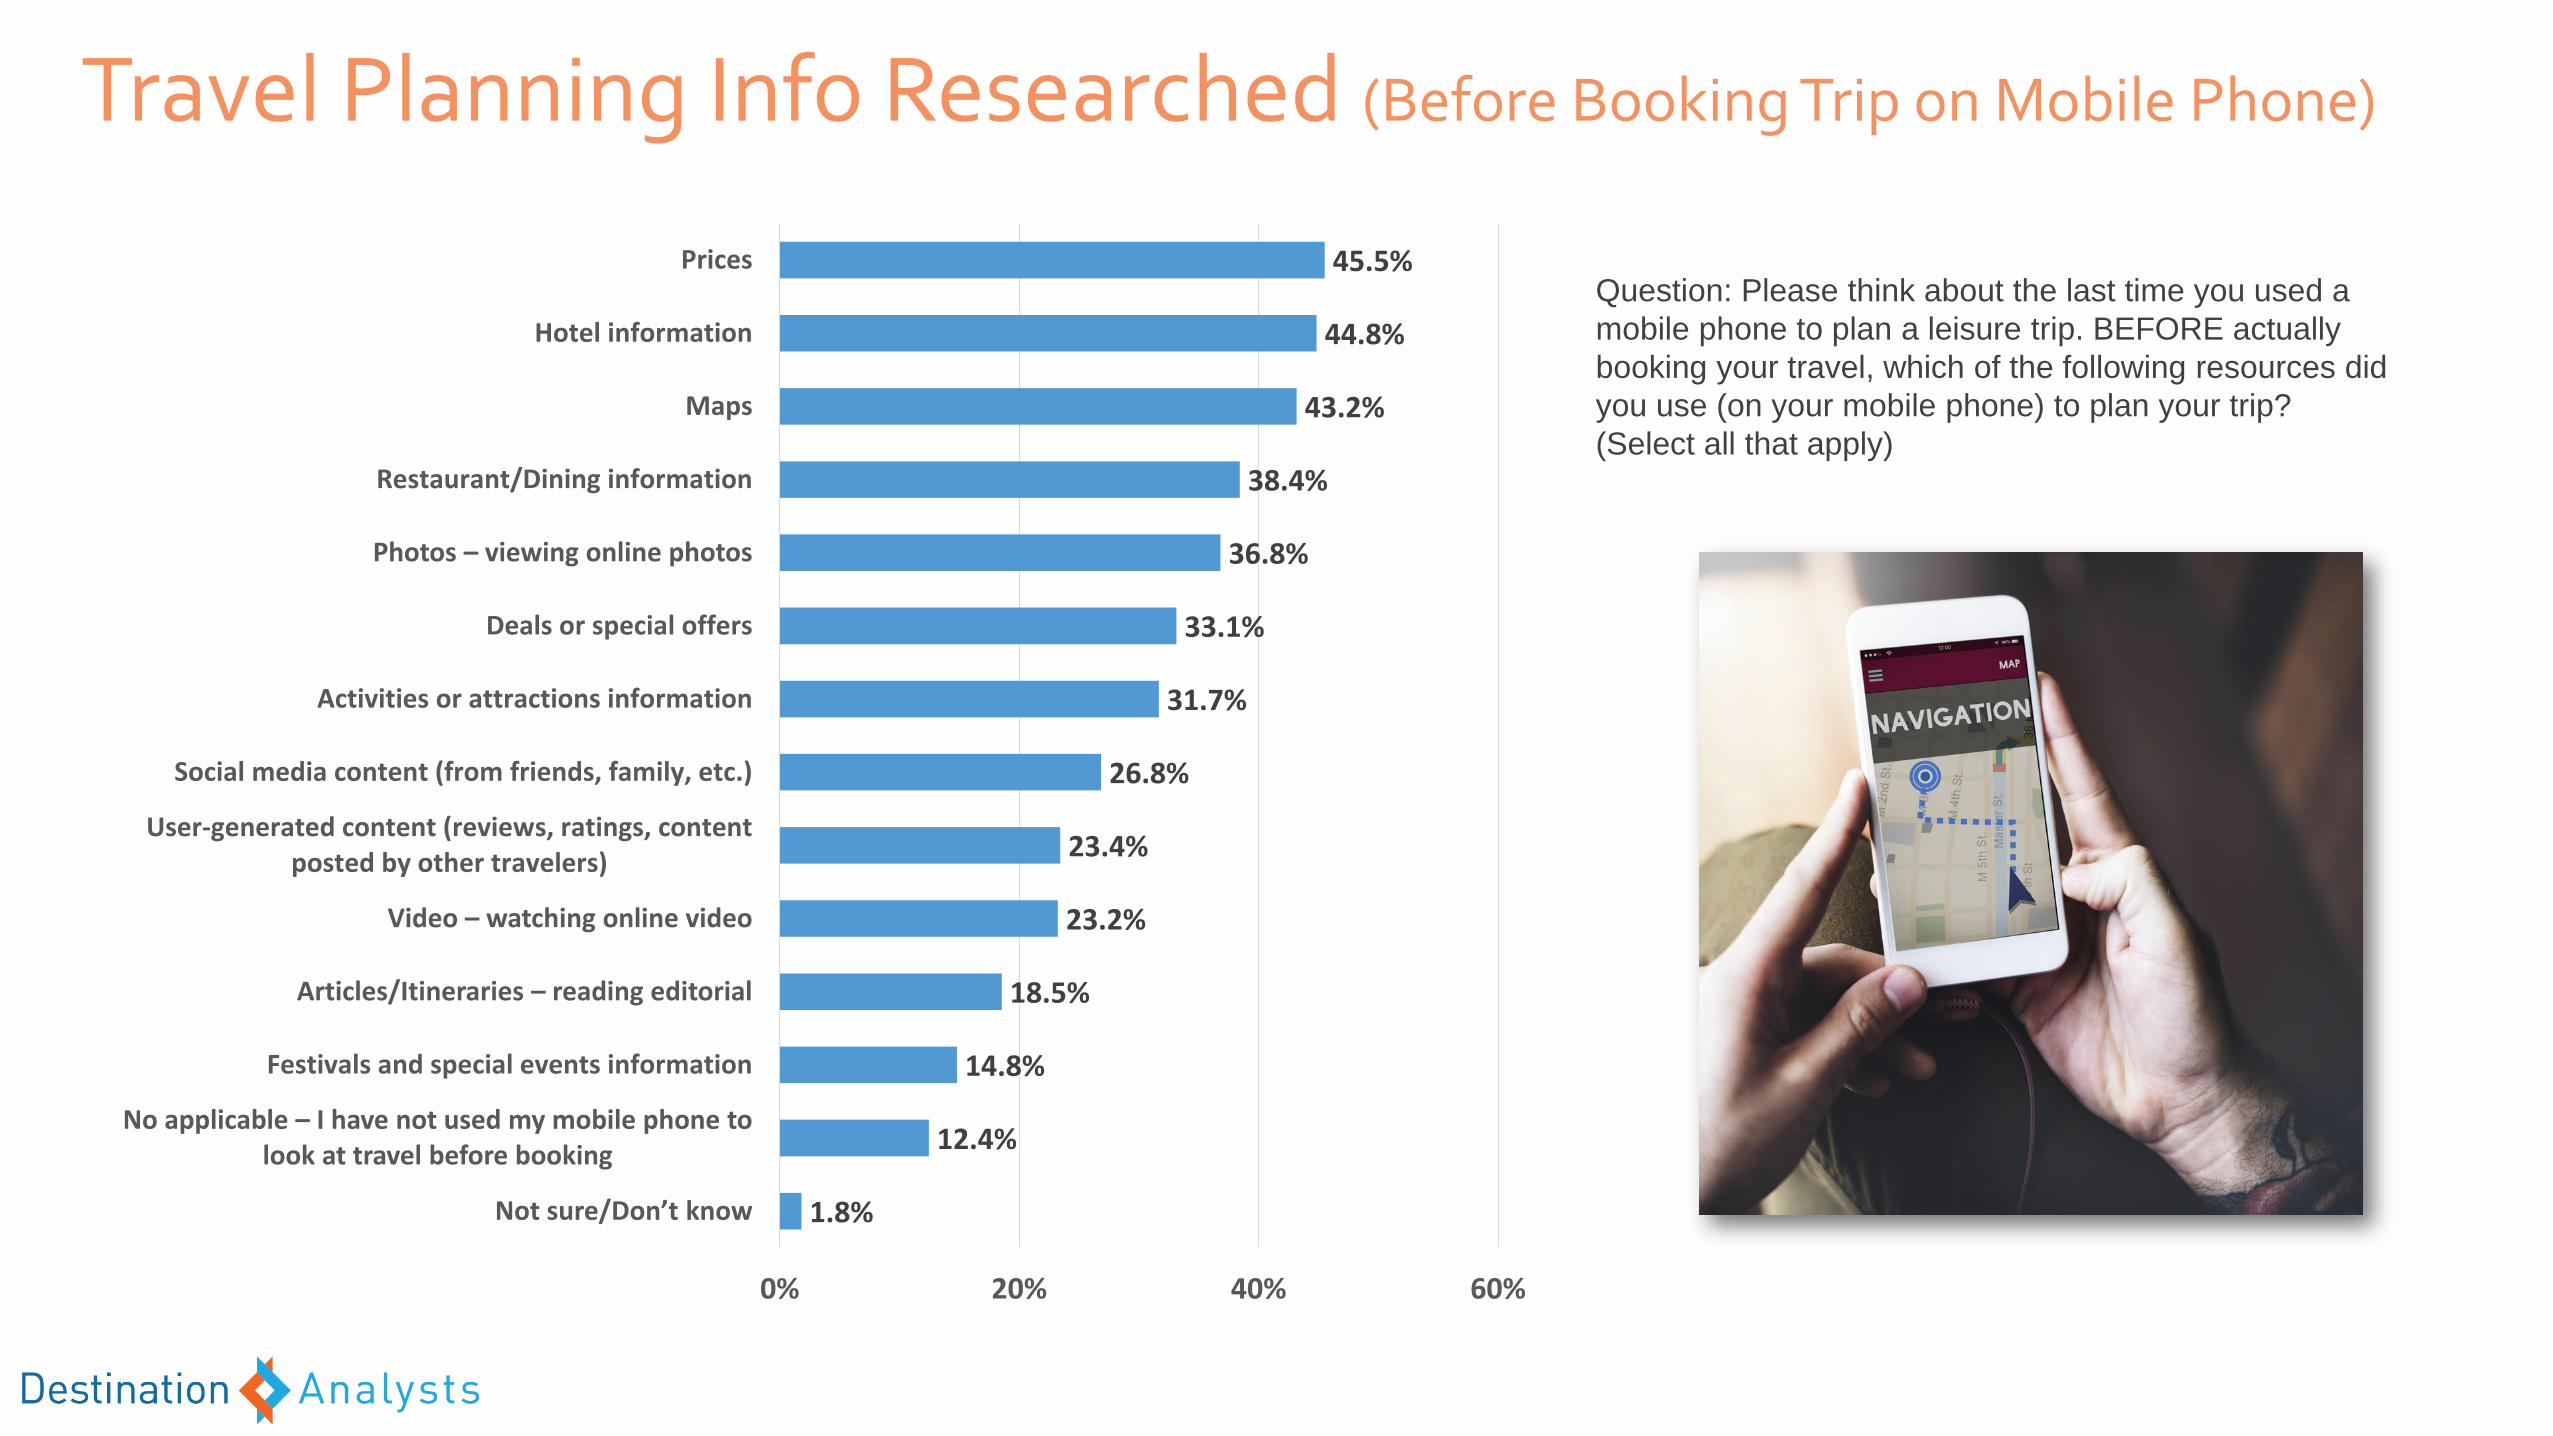
1.8%
12.4%
14.8%
18.5%
23.2%
23.4%
26.8%
31.7%
33.1%
36.8%
38.4%
43.2%
44.8%
45.5%
0% 20% 40% 60%
Not sure/Don’t know
No applicable – I have not used my mobile phone to look at travel before booking
Festivals and special events information
Articles/Itineraries – reading editorial
Video – watching online video
User-generated content (reviews, ratings, contentposted by other travelers)
Social media content (from friends, family, etc.)
Activities or attractions information
Deals or special offers
Photos – viewing online photos
Restaurant/Dining information
Maps
Hotel information
Prices
Travel Planning Info Researched (Before Booking Trip on Mobile Phone)
Question: Please think about the last time you used a
mobile phone to plan a leisure trip. BEFORE actually
booking your travel, which of the following resources did
you use (on your mobile phone) to plan your trip?
(Select all that apply)
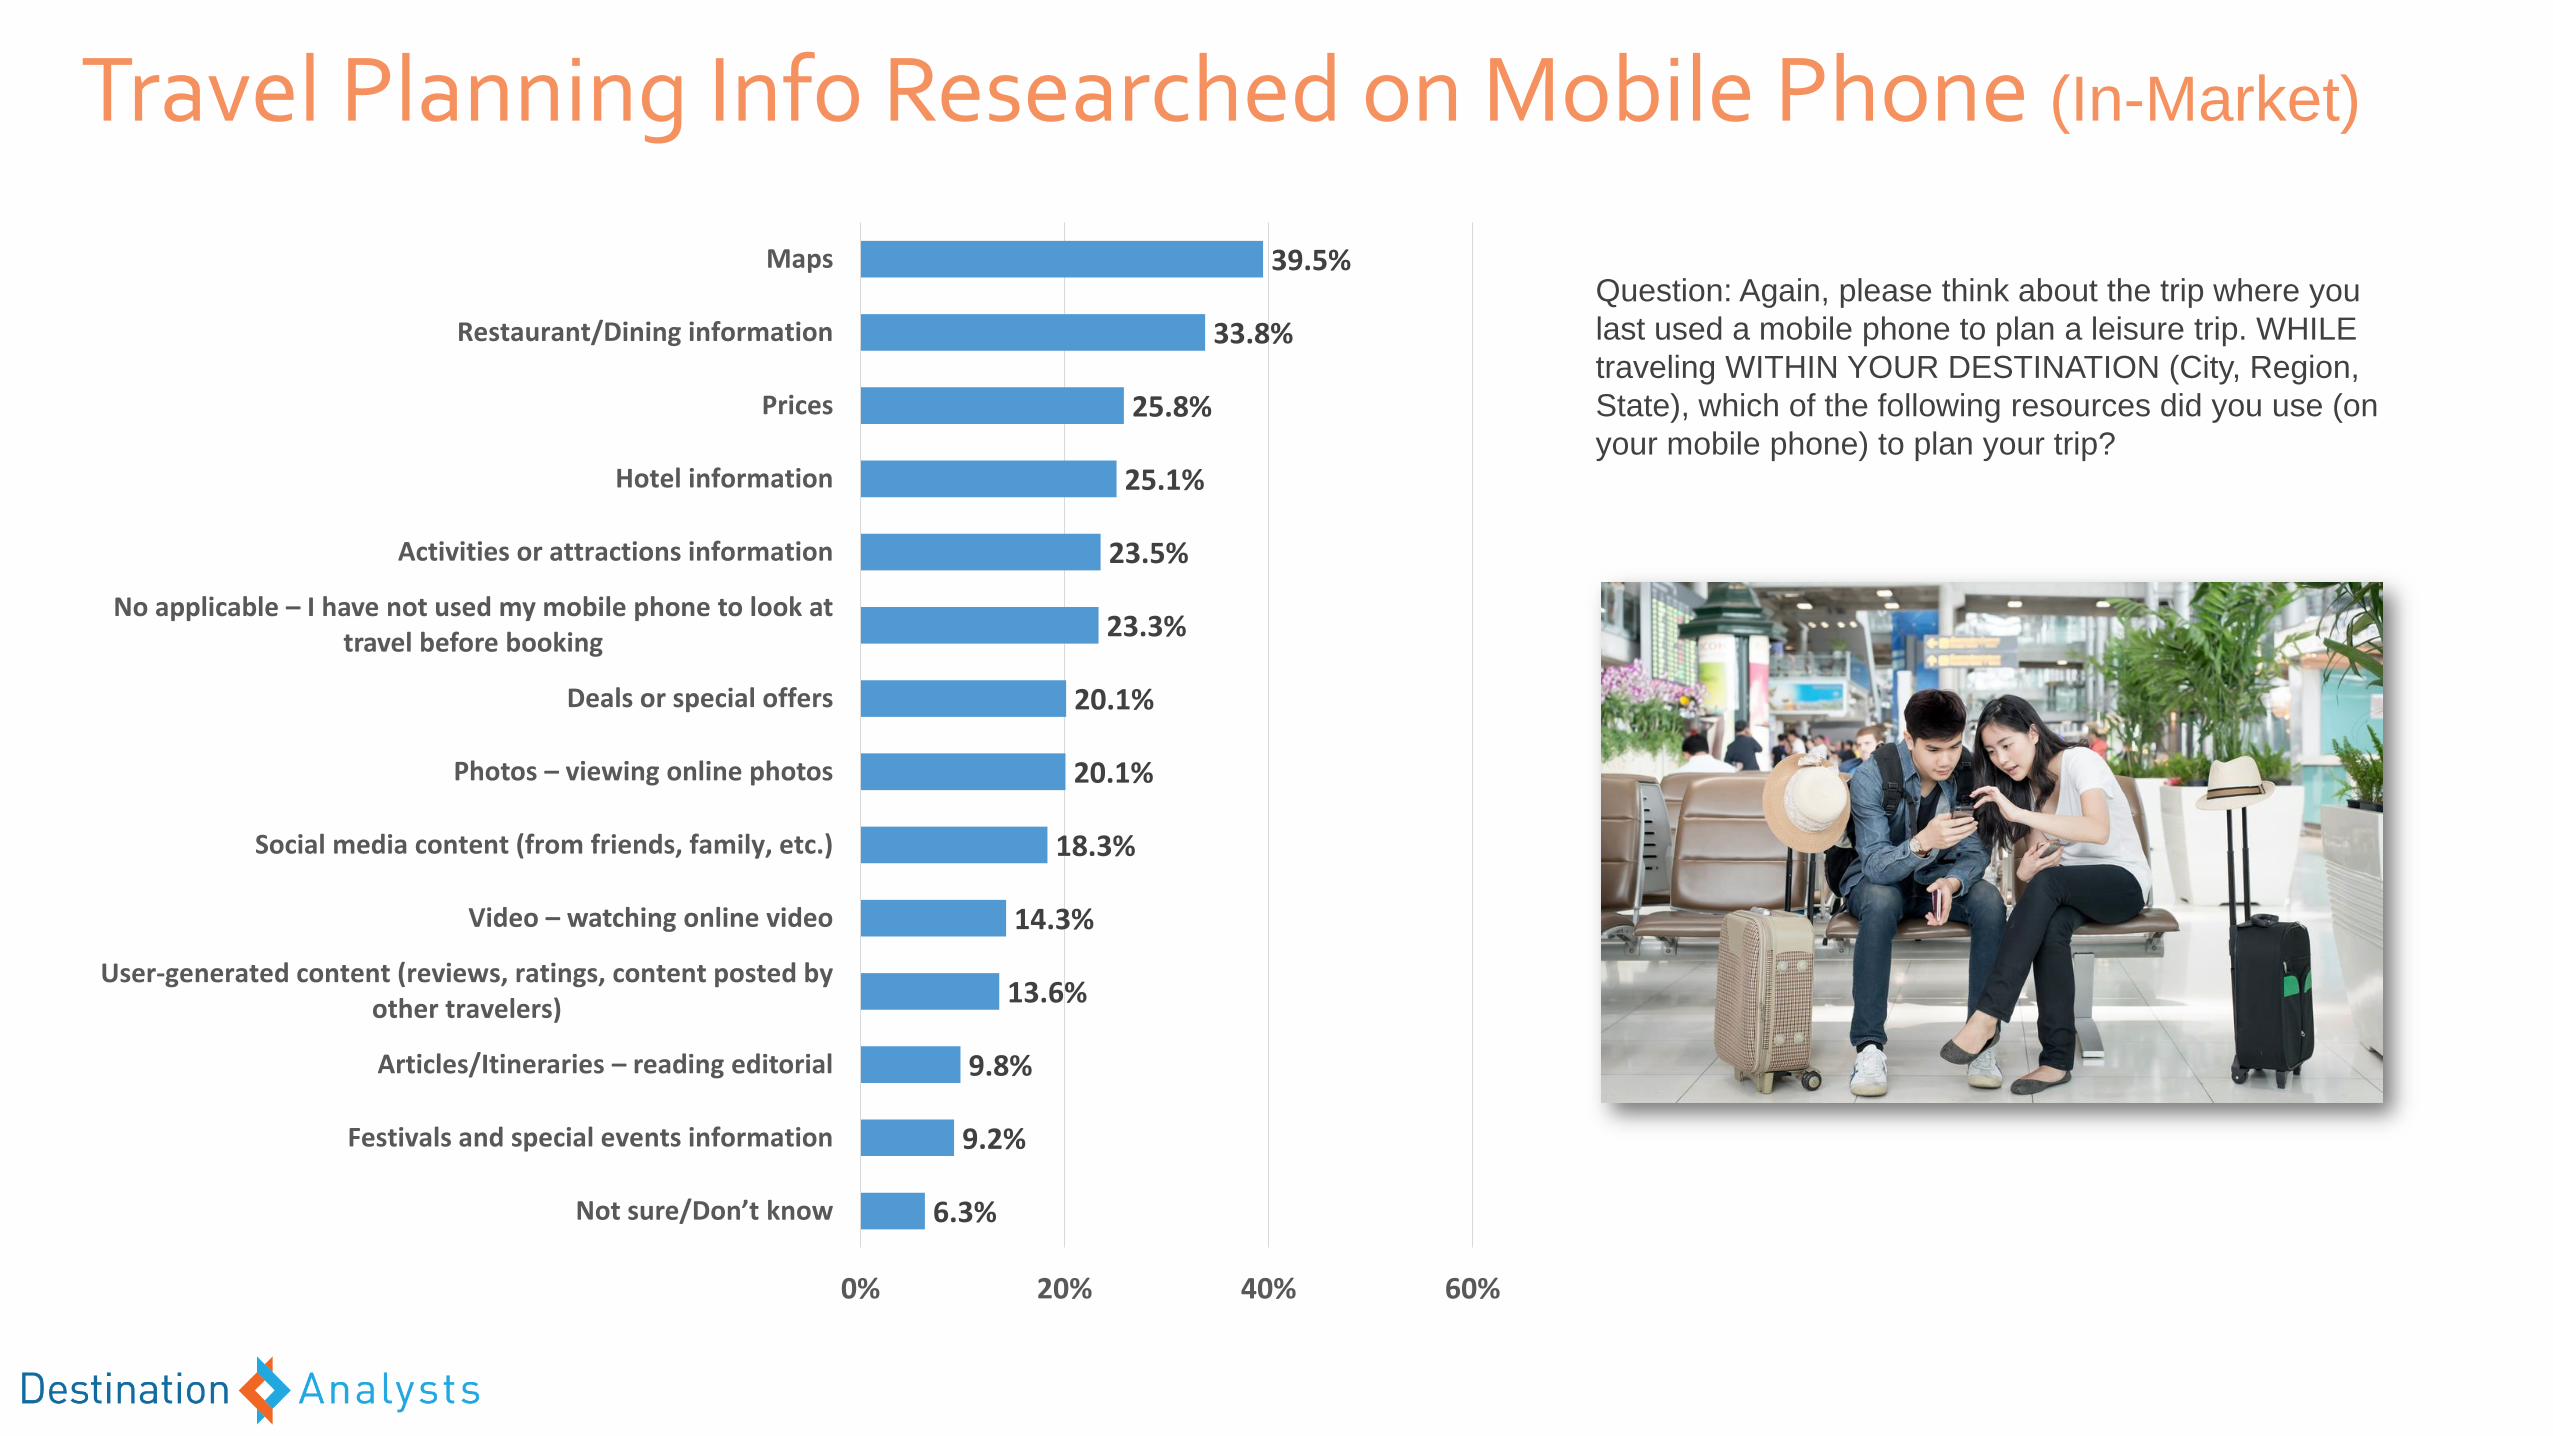
6.3%
9.2%
9.8%
13.6%
14.3%
18.3%
20.1%
20.1%
23.3%
23.5%
25.1%
25.8%
33.8%
39.5%
0% 20% 40% 60%
Not sure/Don’t know
Festivals and special events information
Articles/Itineraries – reading editorial
User-generated content (reviews, ratings, content posted byother travelers)
Video – watching online video
Social media content (from friends, family, etc.)
Photos – viewing online photos
Deals or special offers
No applicable – I have not used my mobile phone to look at travel before booking
Activities or attractions information
Hotel information
Prices
Restaurant/Dining information
Maps
Travel Planning Info Researched on Mobile Phone (In-Market)
Question: Again, please think about the trip where you
last used a mobile phone to plan a leisure trip. WHILE
traveling WITHIN YOUR DESTINATION (City, Region,
State), which of the following resources did you use (on
your mobile phone) to plan your trip?
Destination Analysts’
Mobile Addiction Test
• Scored on 6 questions on:
• Behaviors and emotions
regarding mobile phones
• Based on standard addiction self-
assessment test methodologies
• Each respondent scored from 1 to
100
• Measured three times:
• January 2015
• October 2016
• October 2017
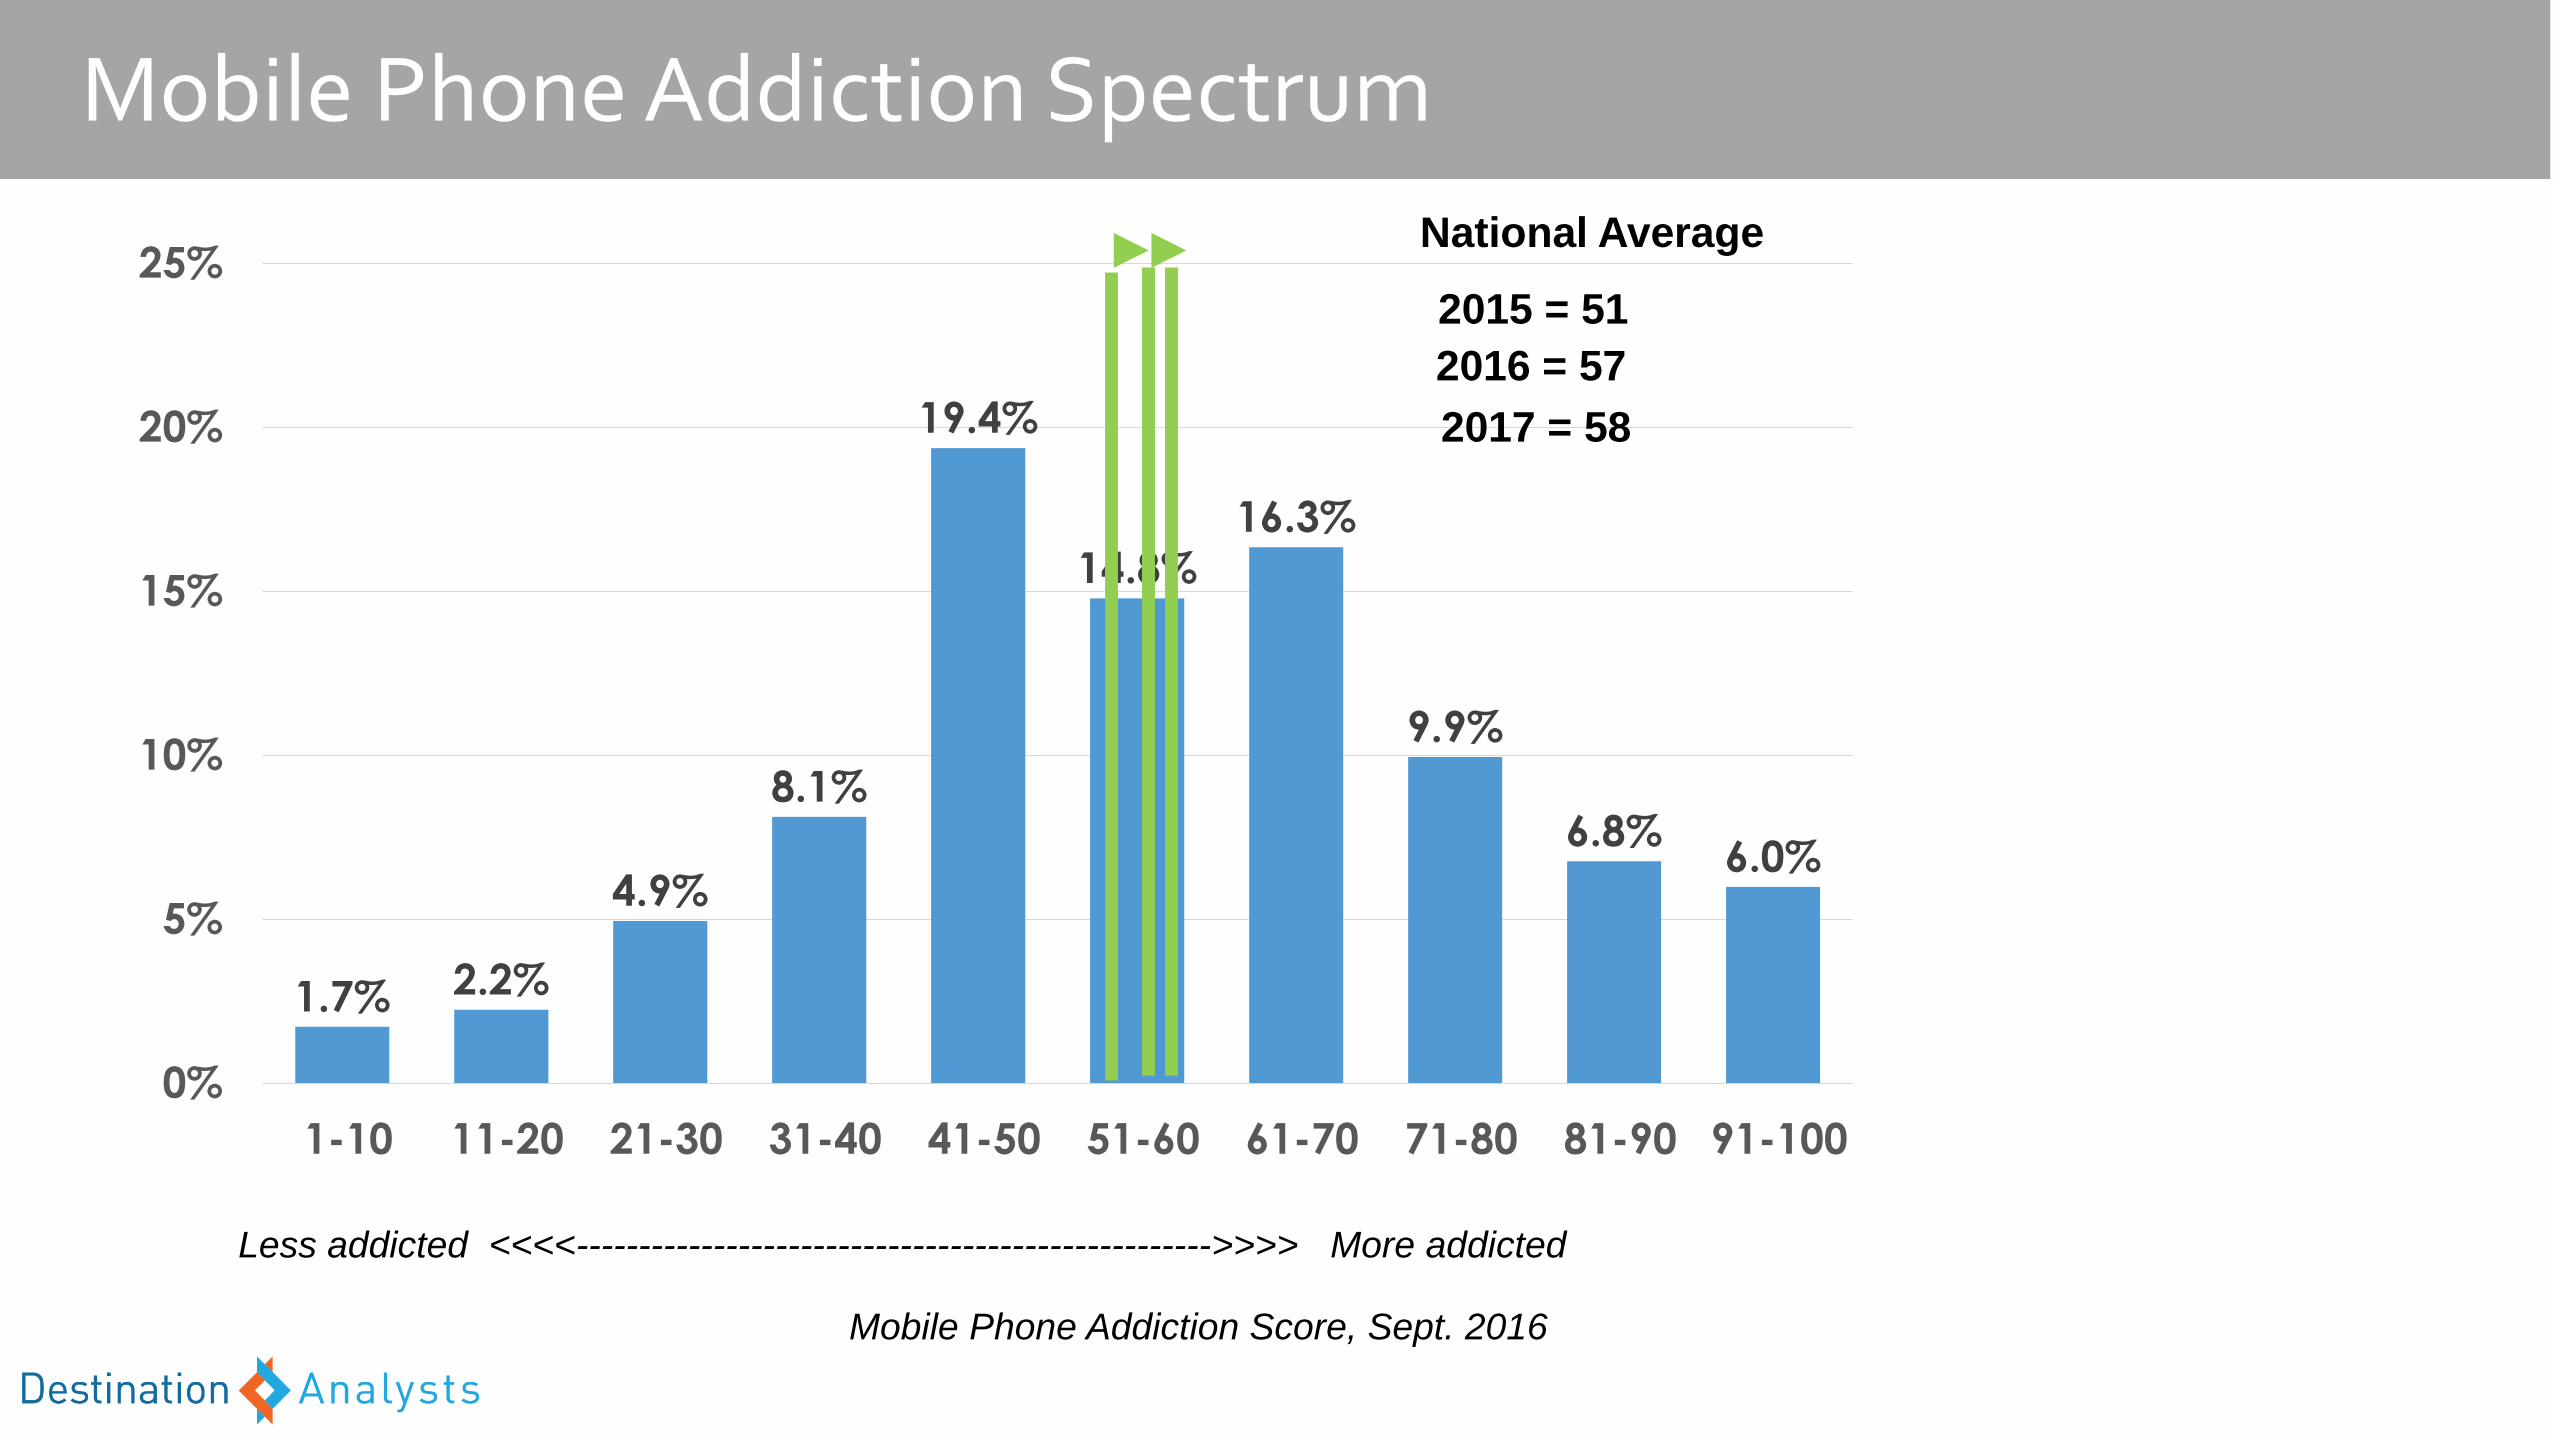
1.7% 2.2%
4.9%
8.1%
19.4%
14.8%
16.3%
9.9%
6.8%6.0%
0%
5%
10%
15%
20%
25%
1-10 11-20 21-30 31-40 41-50 51-60 61-70 71-80 81-90 91-100
Mobile Phone Addiction Spectrum
Mobile Phone Addiction Score, Sept. 2016
Less addicted <<<<--------------------------------------------------->>>> More addicted
2015 = 51
2016 = 57
National Average
2017 = 58
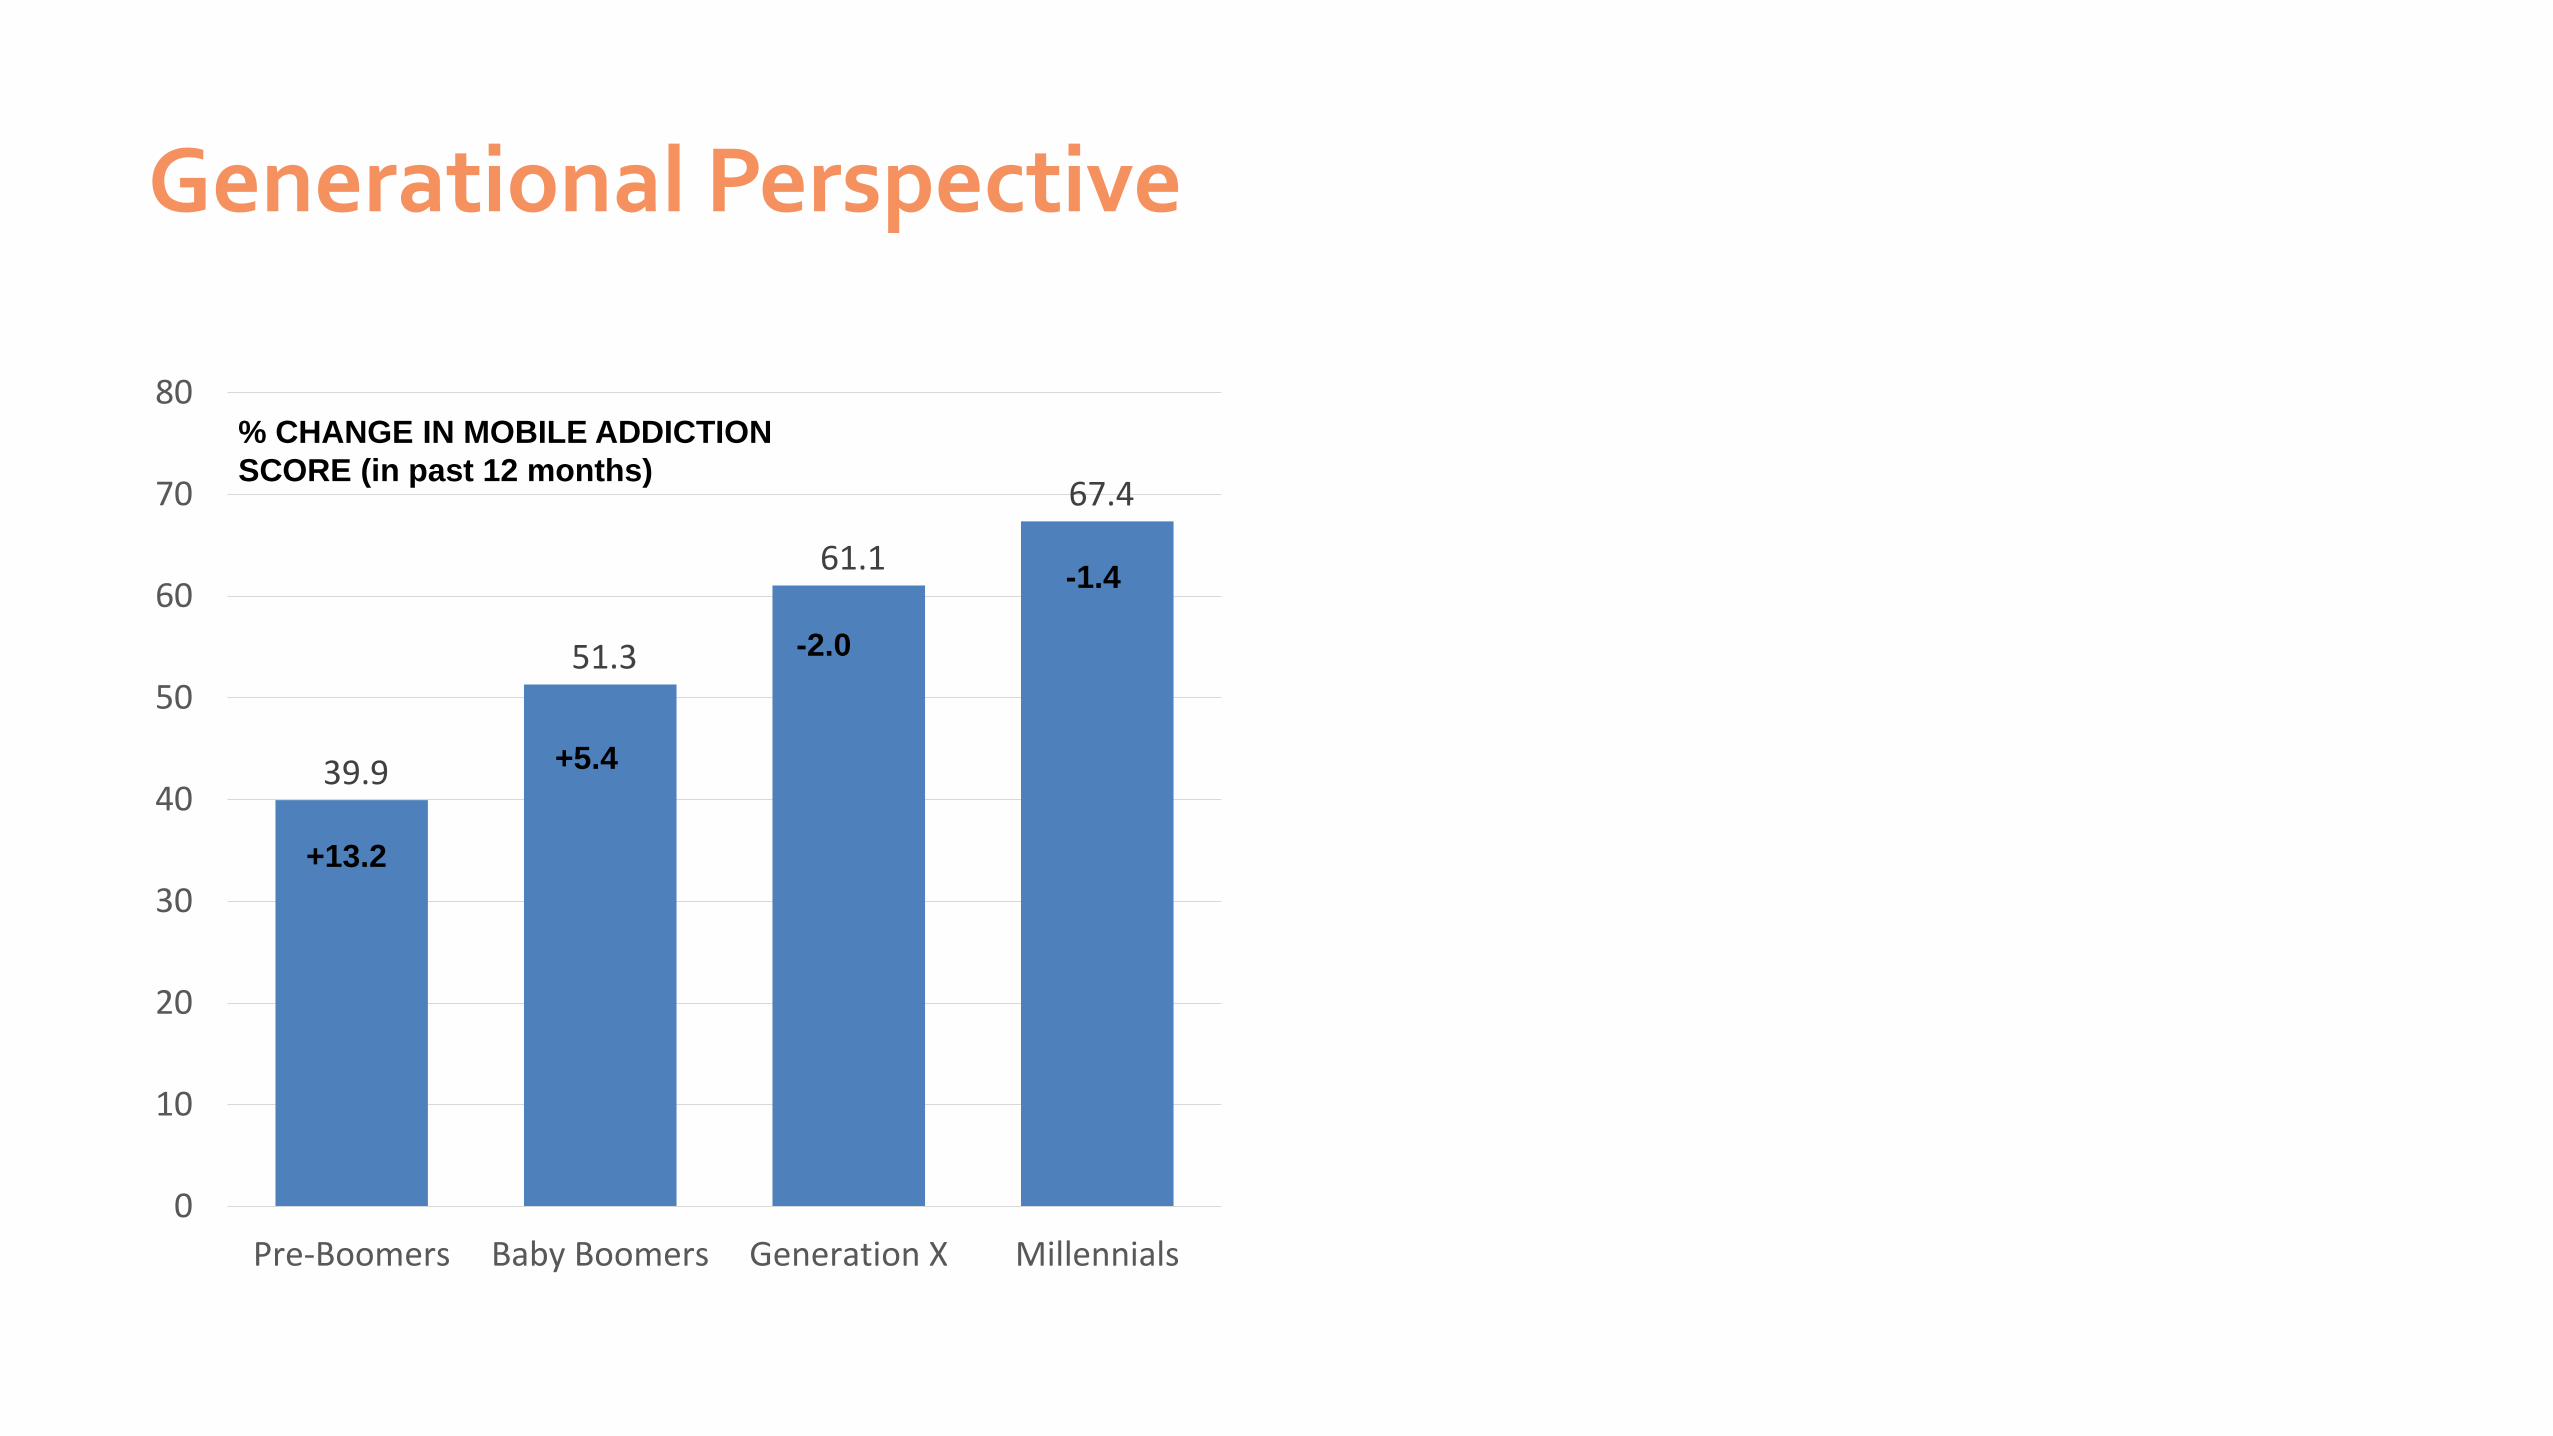
39.9
51.3
61.1
67.4
0
10
20
30
40
50
60
70
80
Pre-Boomers Baby Boomers Generation X Millennials
Generational Perspective
+13.2
% CHANGE IN MOBILE ADDICTION
SCORE (in past 12 months)
+5.4
-2.0
-1.4
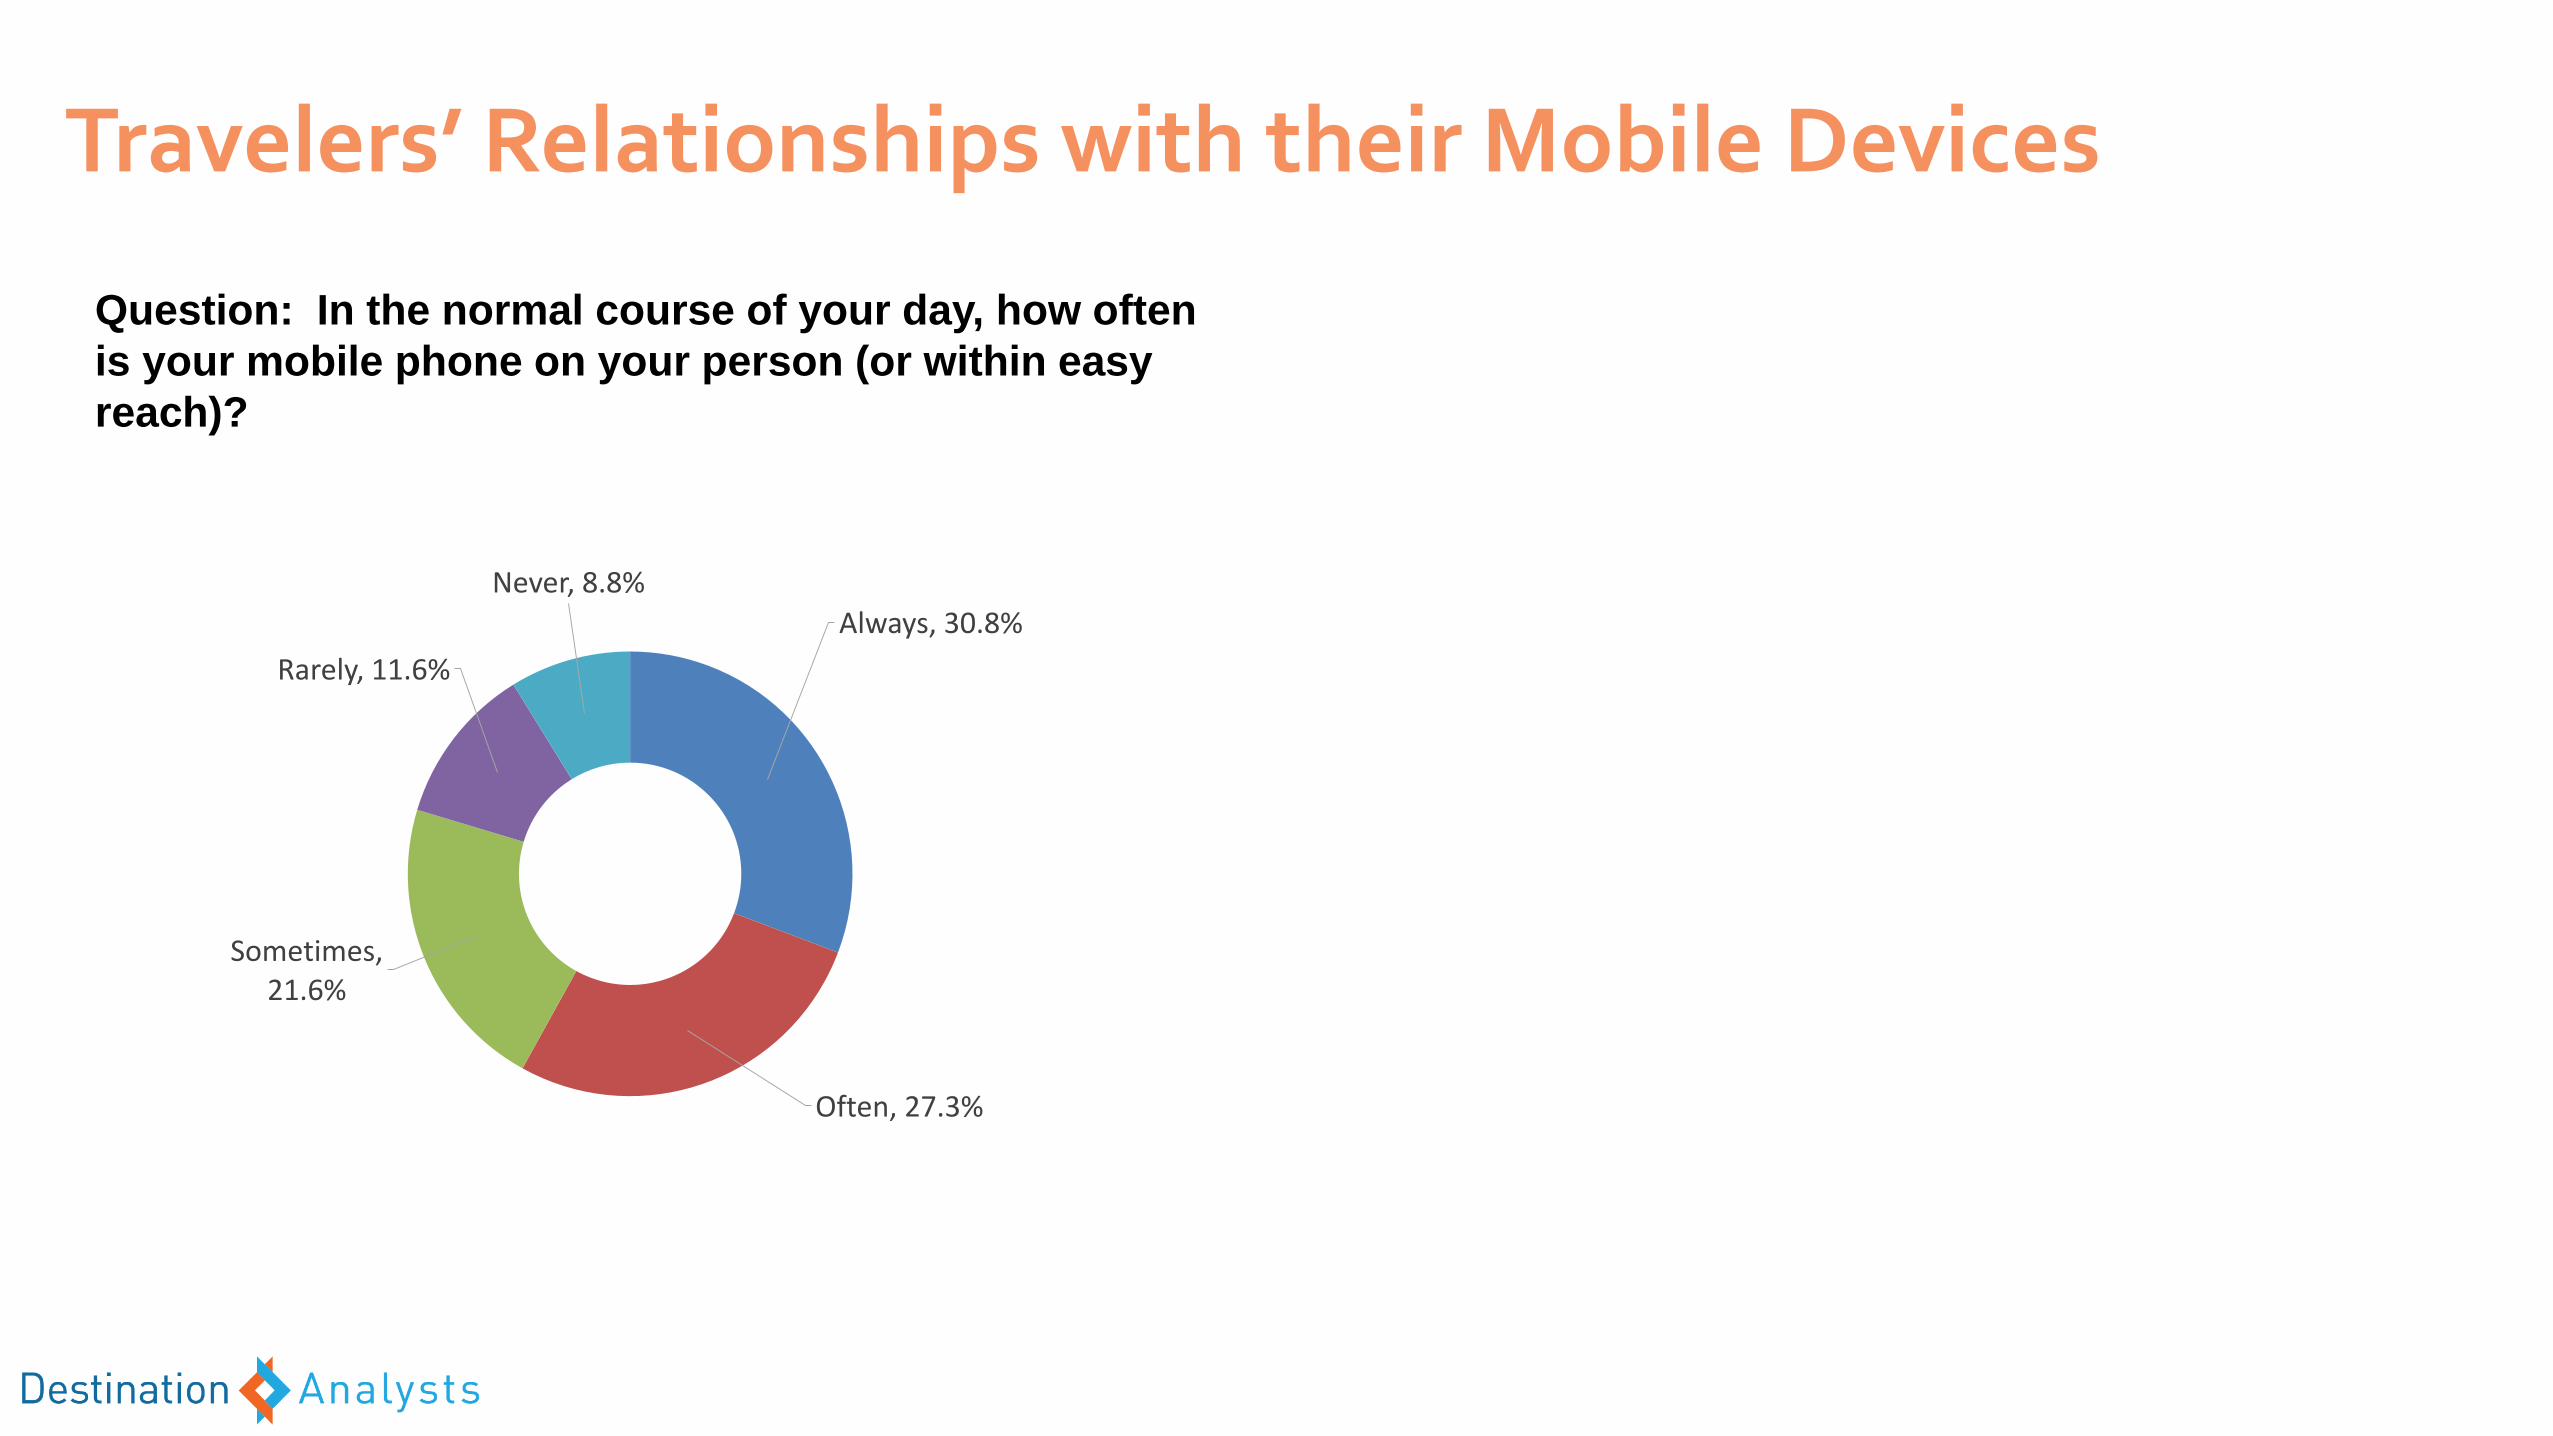
Travelers’ Relationships with their Mobile Devices
Question: In the normal course of your day, how often
is your mobile phone on your person (or within easy
reach)?
Always, 30.8%
Often, 27.3%
Sometimes, 21.6%
Rarely, 11.6%
Never, 8.8%
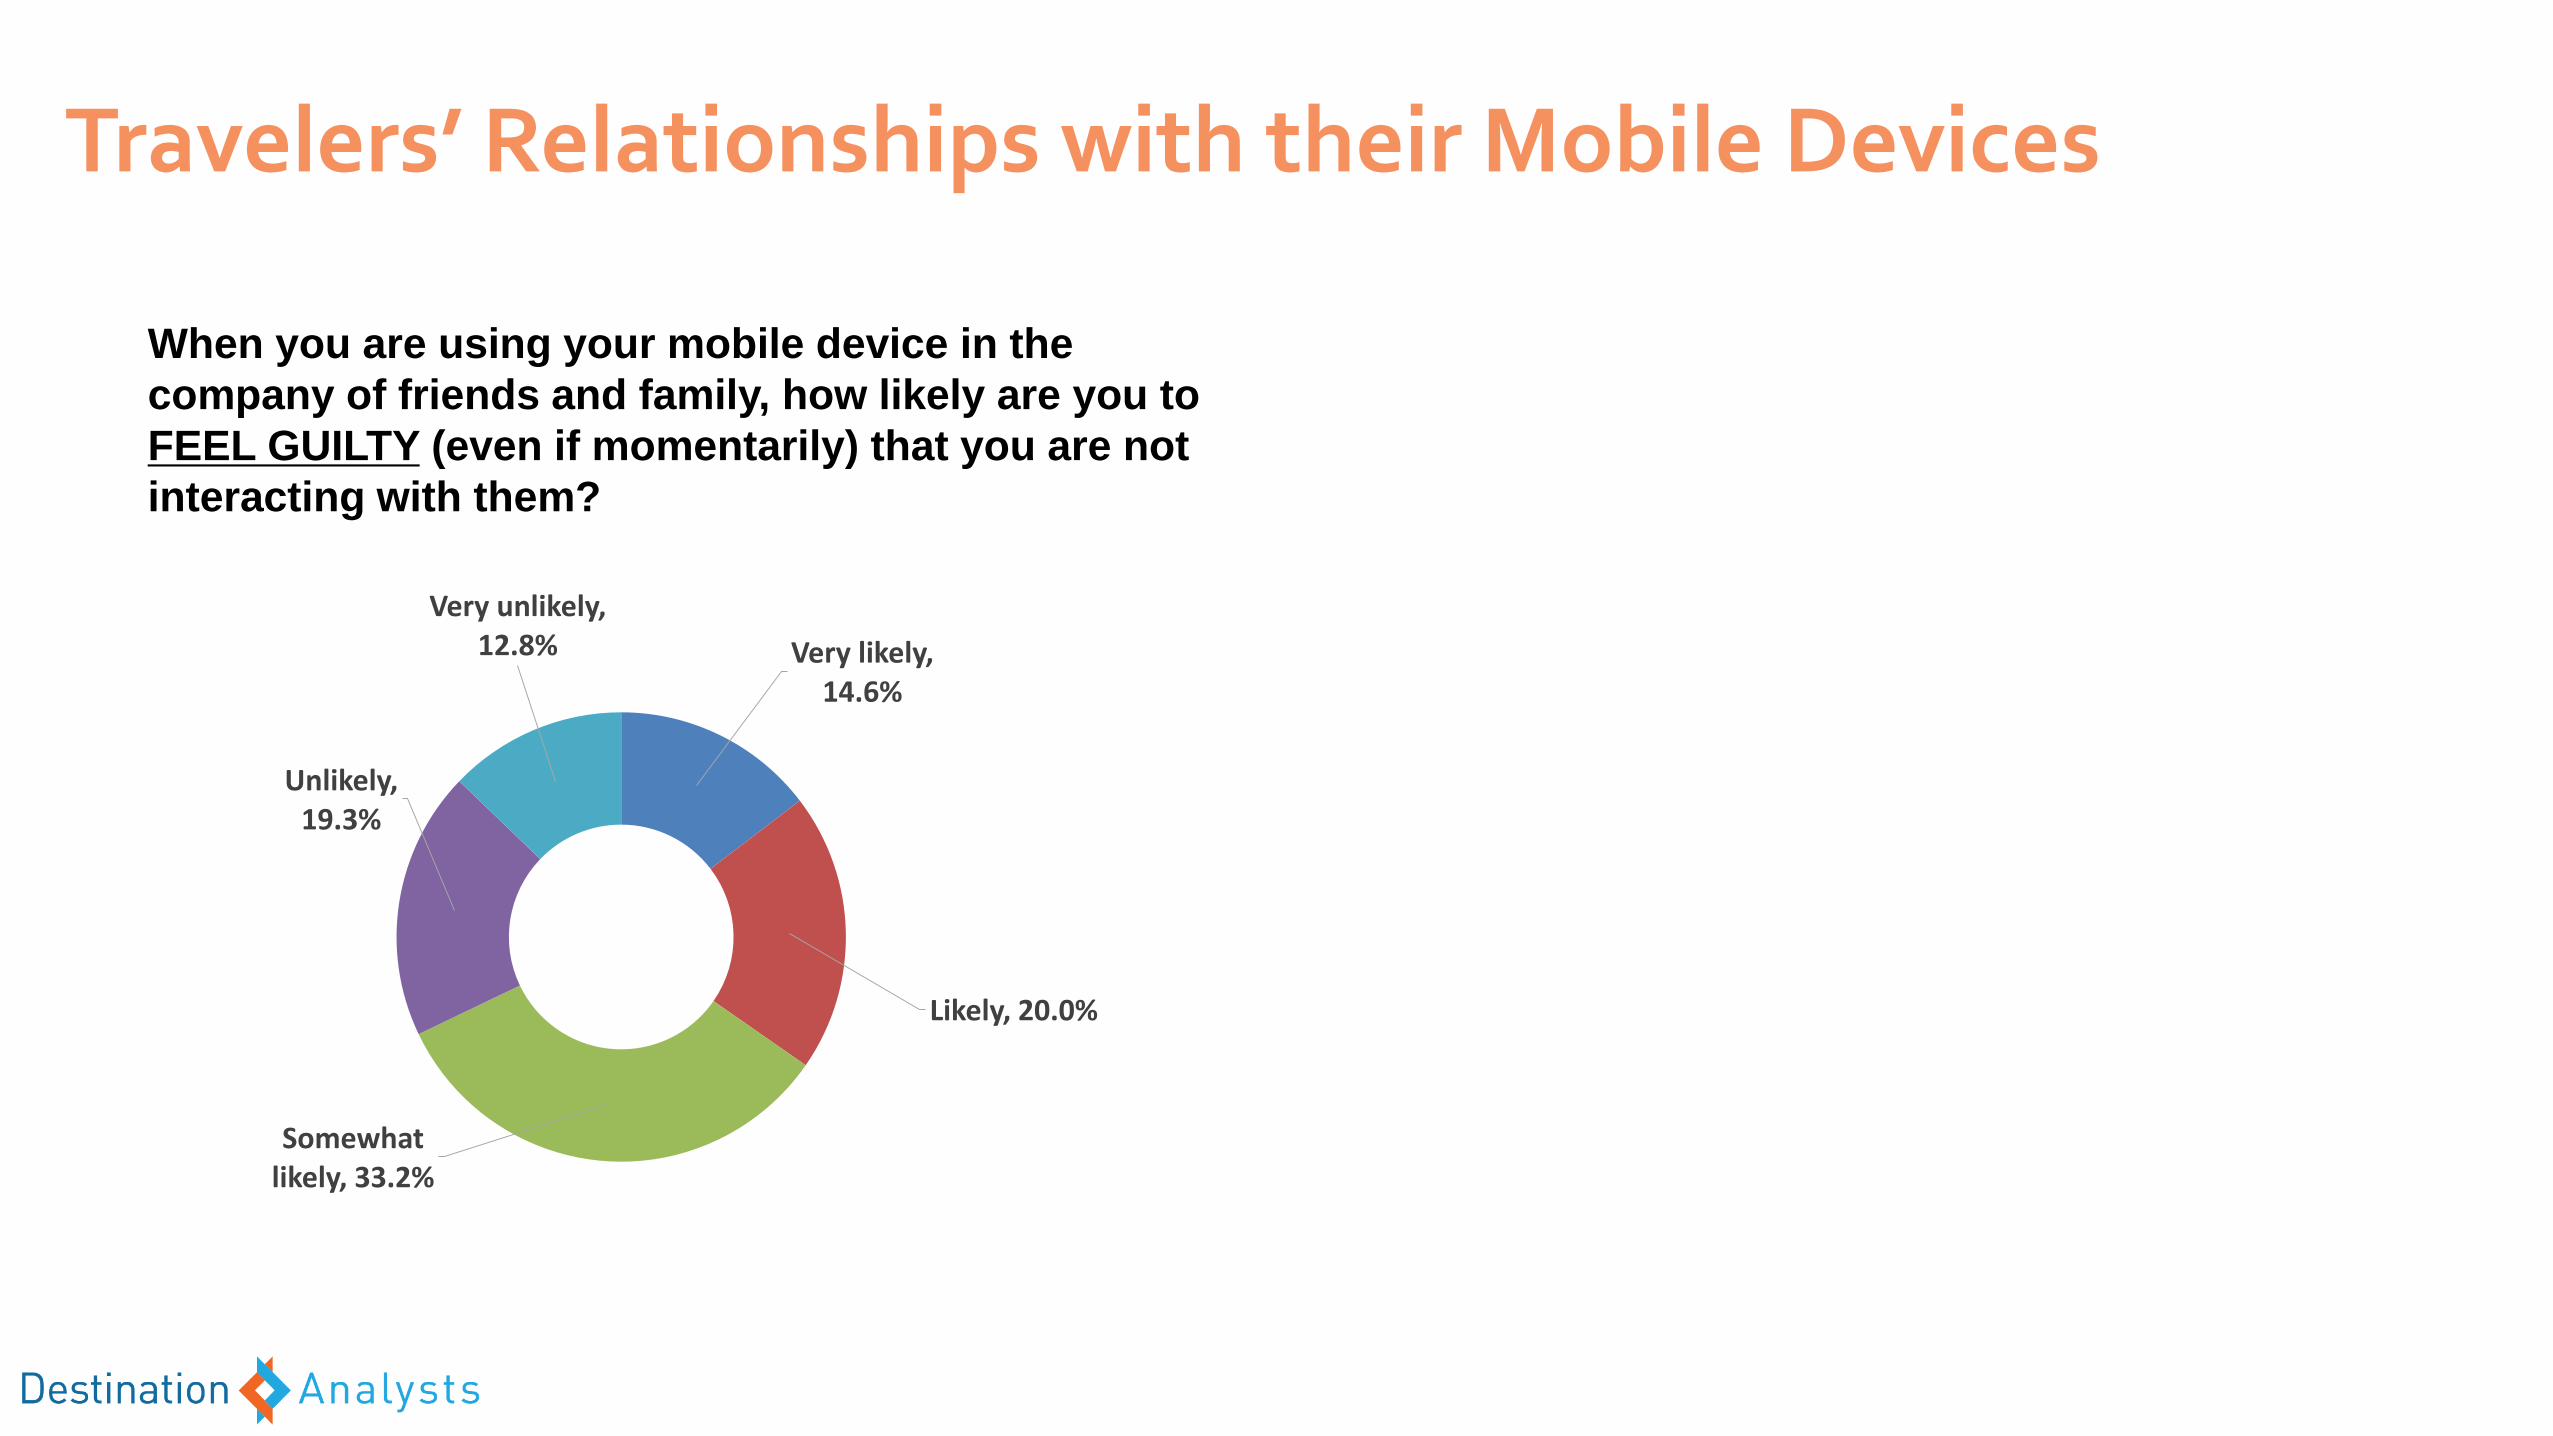
Travelers’ Relationships with their Mobile Devices
When you are using your mobile device in the
company of friends and family, how likely are you to
FEEL GUILTY (even if momentarily) that you are not
interacting with them?
Very likely, 14.6%
Likely, 20.0%
Somewhat likely, 33.2%
Unlikely, 19.3%
Very unlikely, 12.8%
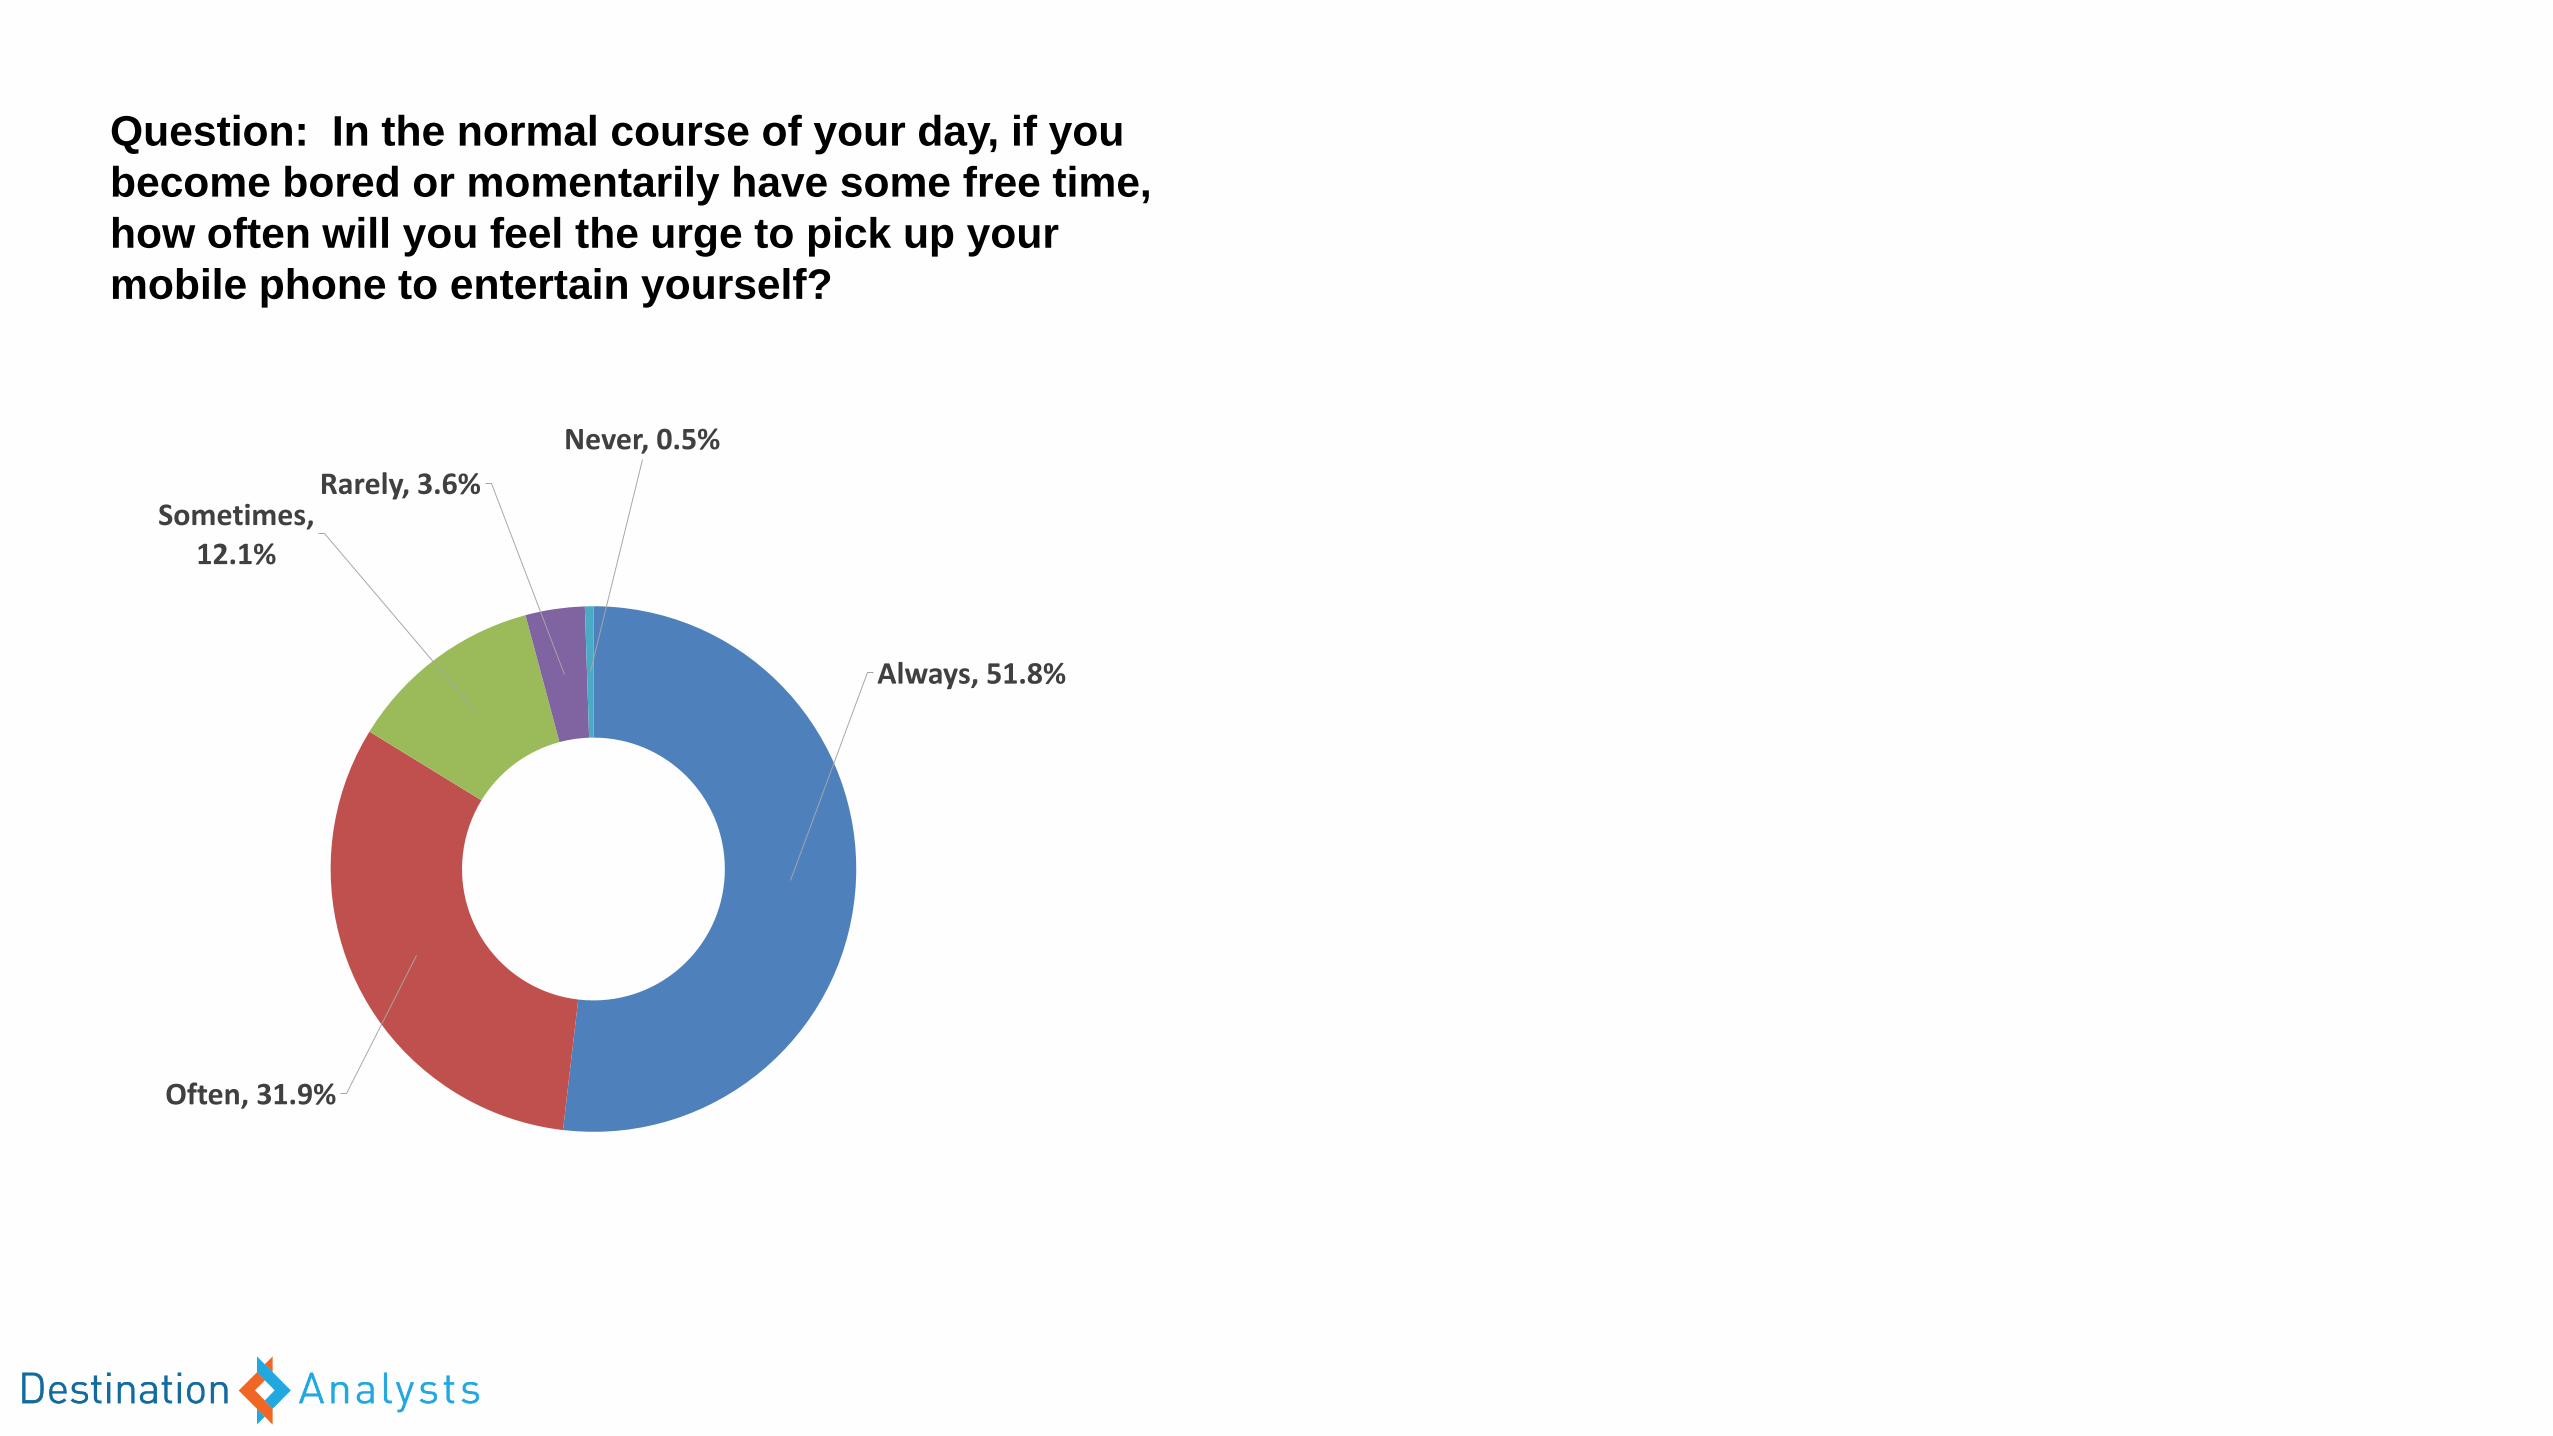
Question: In the normal course of your day, if you
become bored or momentarily have some free time,
how often will you feel the urge to pick up your
mobile phone to entertain yourself?
Always, 51.8%
Often, 31.9%
Sometimes, 12.1%
Rarely, 3.6%
Never, 0.5%
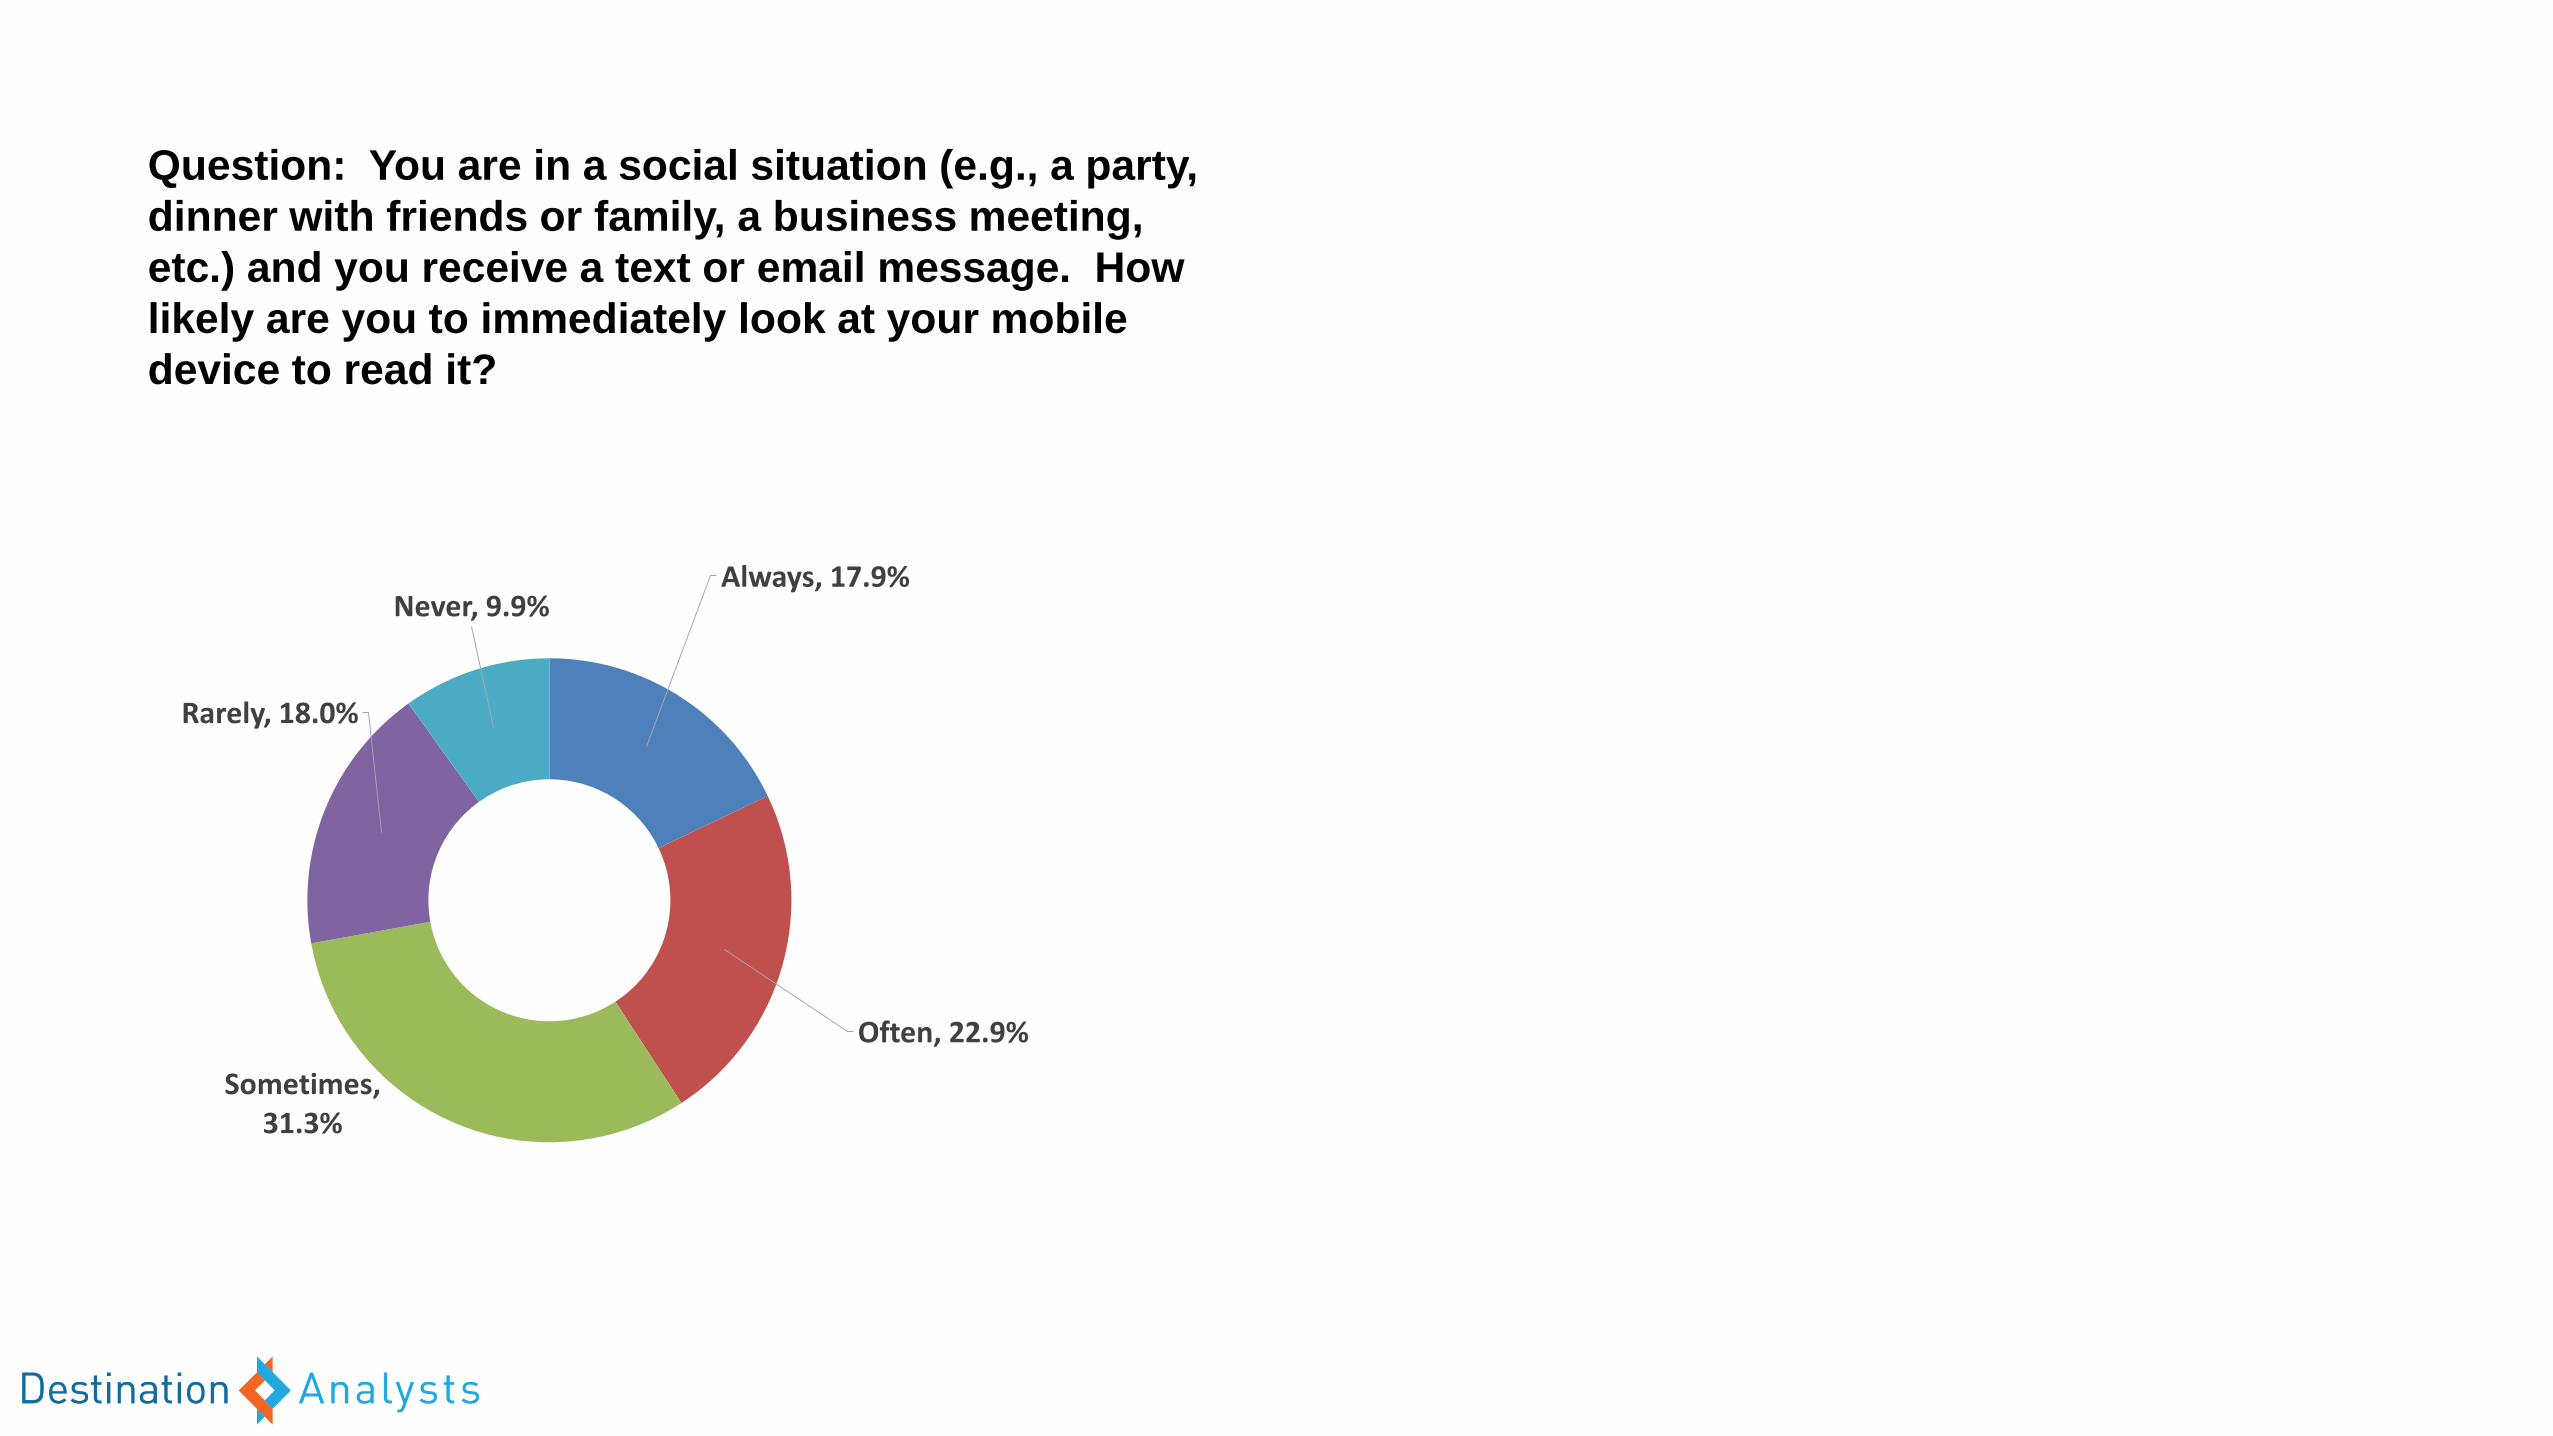
Question: You are in a social situation (e.g., a party,
dinner with friends or family, a business meeting,
etc.) and you receive a text or email message. How
likely are you to immediately look at your mobile
device to read it?
Always, 17.9%
Often, 22.9%
Sometimes, 31.3%
Rarely, 18.0%
Never, 9.9%
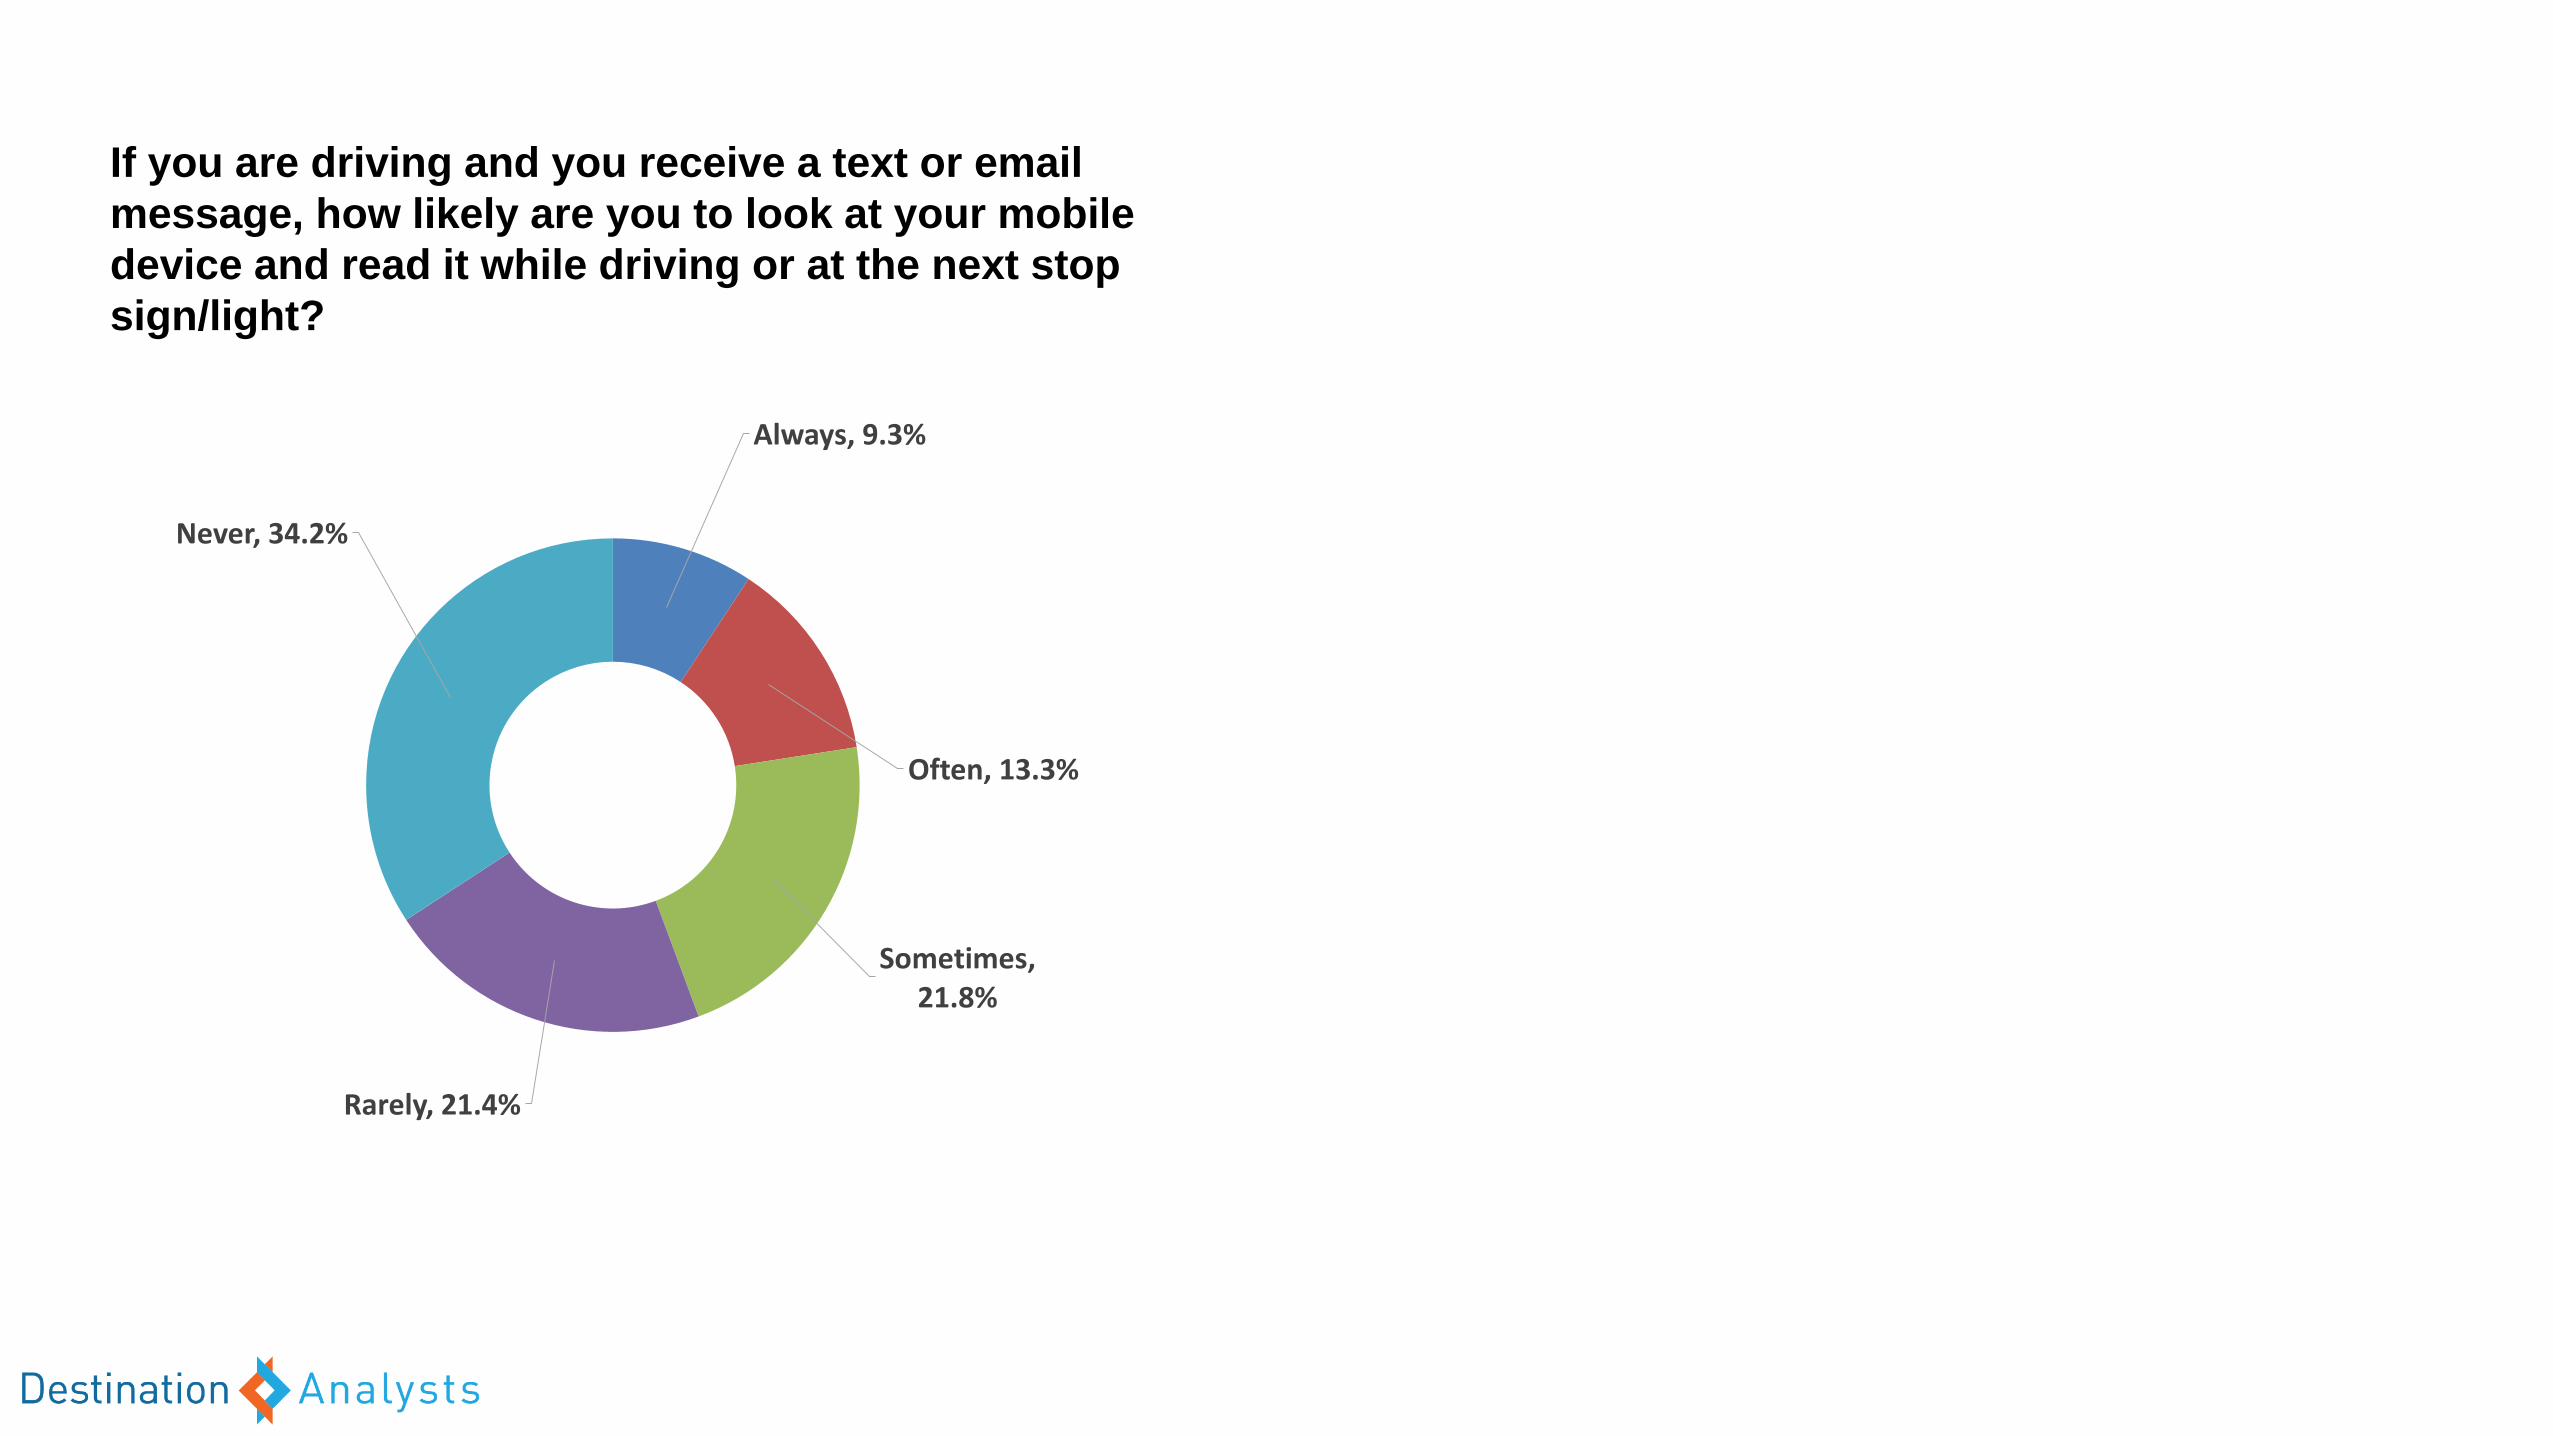
If you are driving and you receive a text or email
message, how likely are you to look at your mobile
device and read it while driving or at the next stop
sign/light?
Always, 9.3%
Often, 13.3%
Sometimes, 21.8%
Rarely, 21.4%
Never, 34.2%
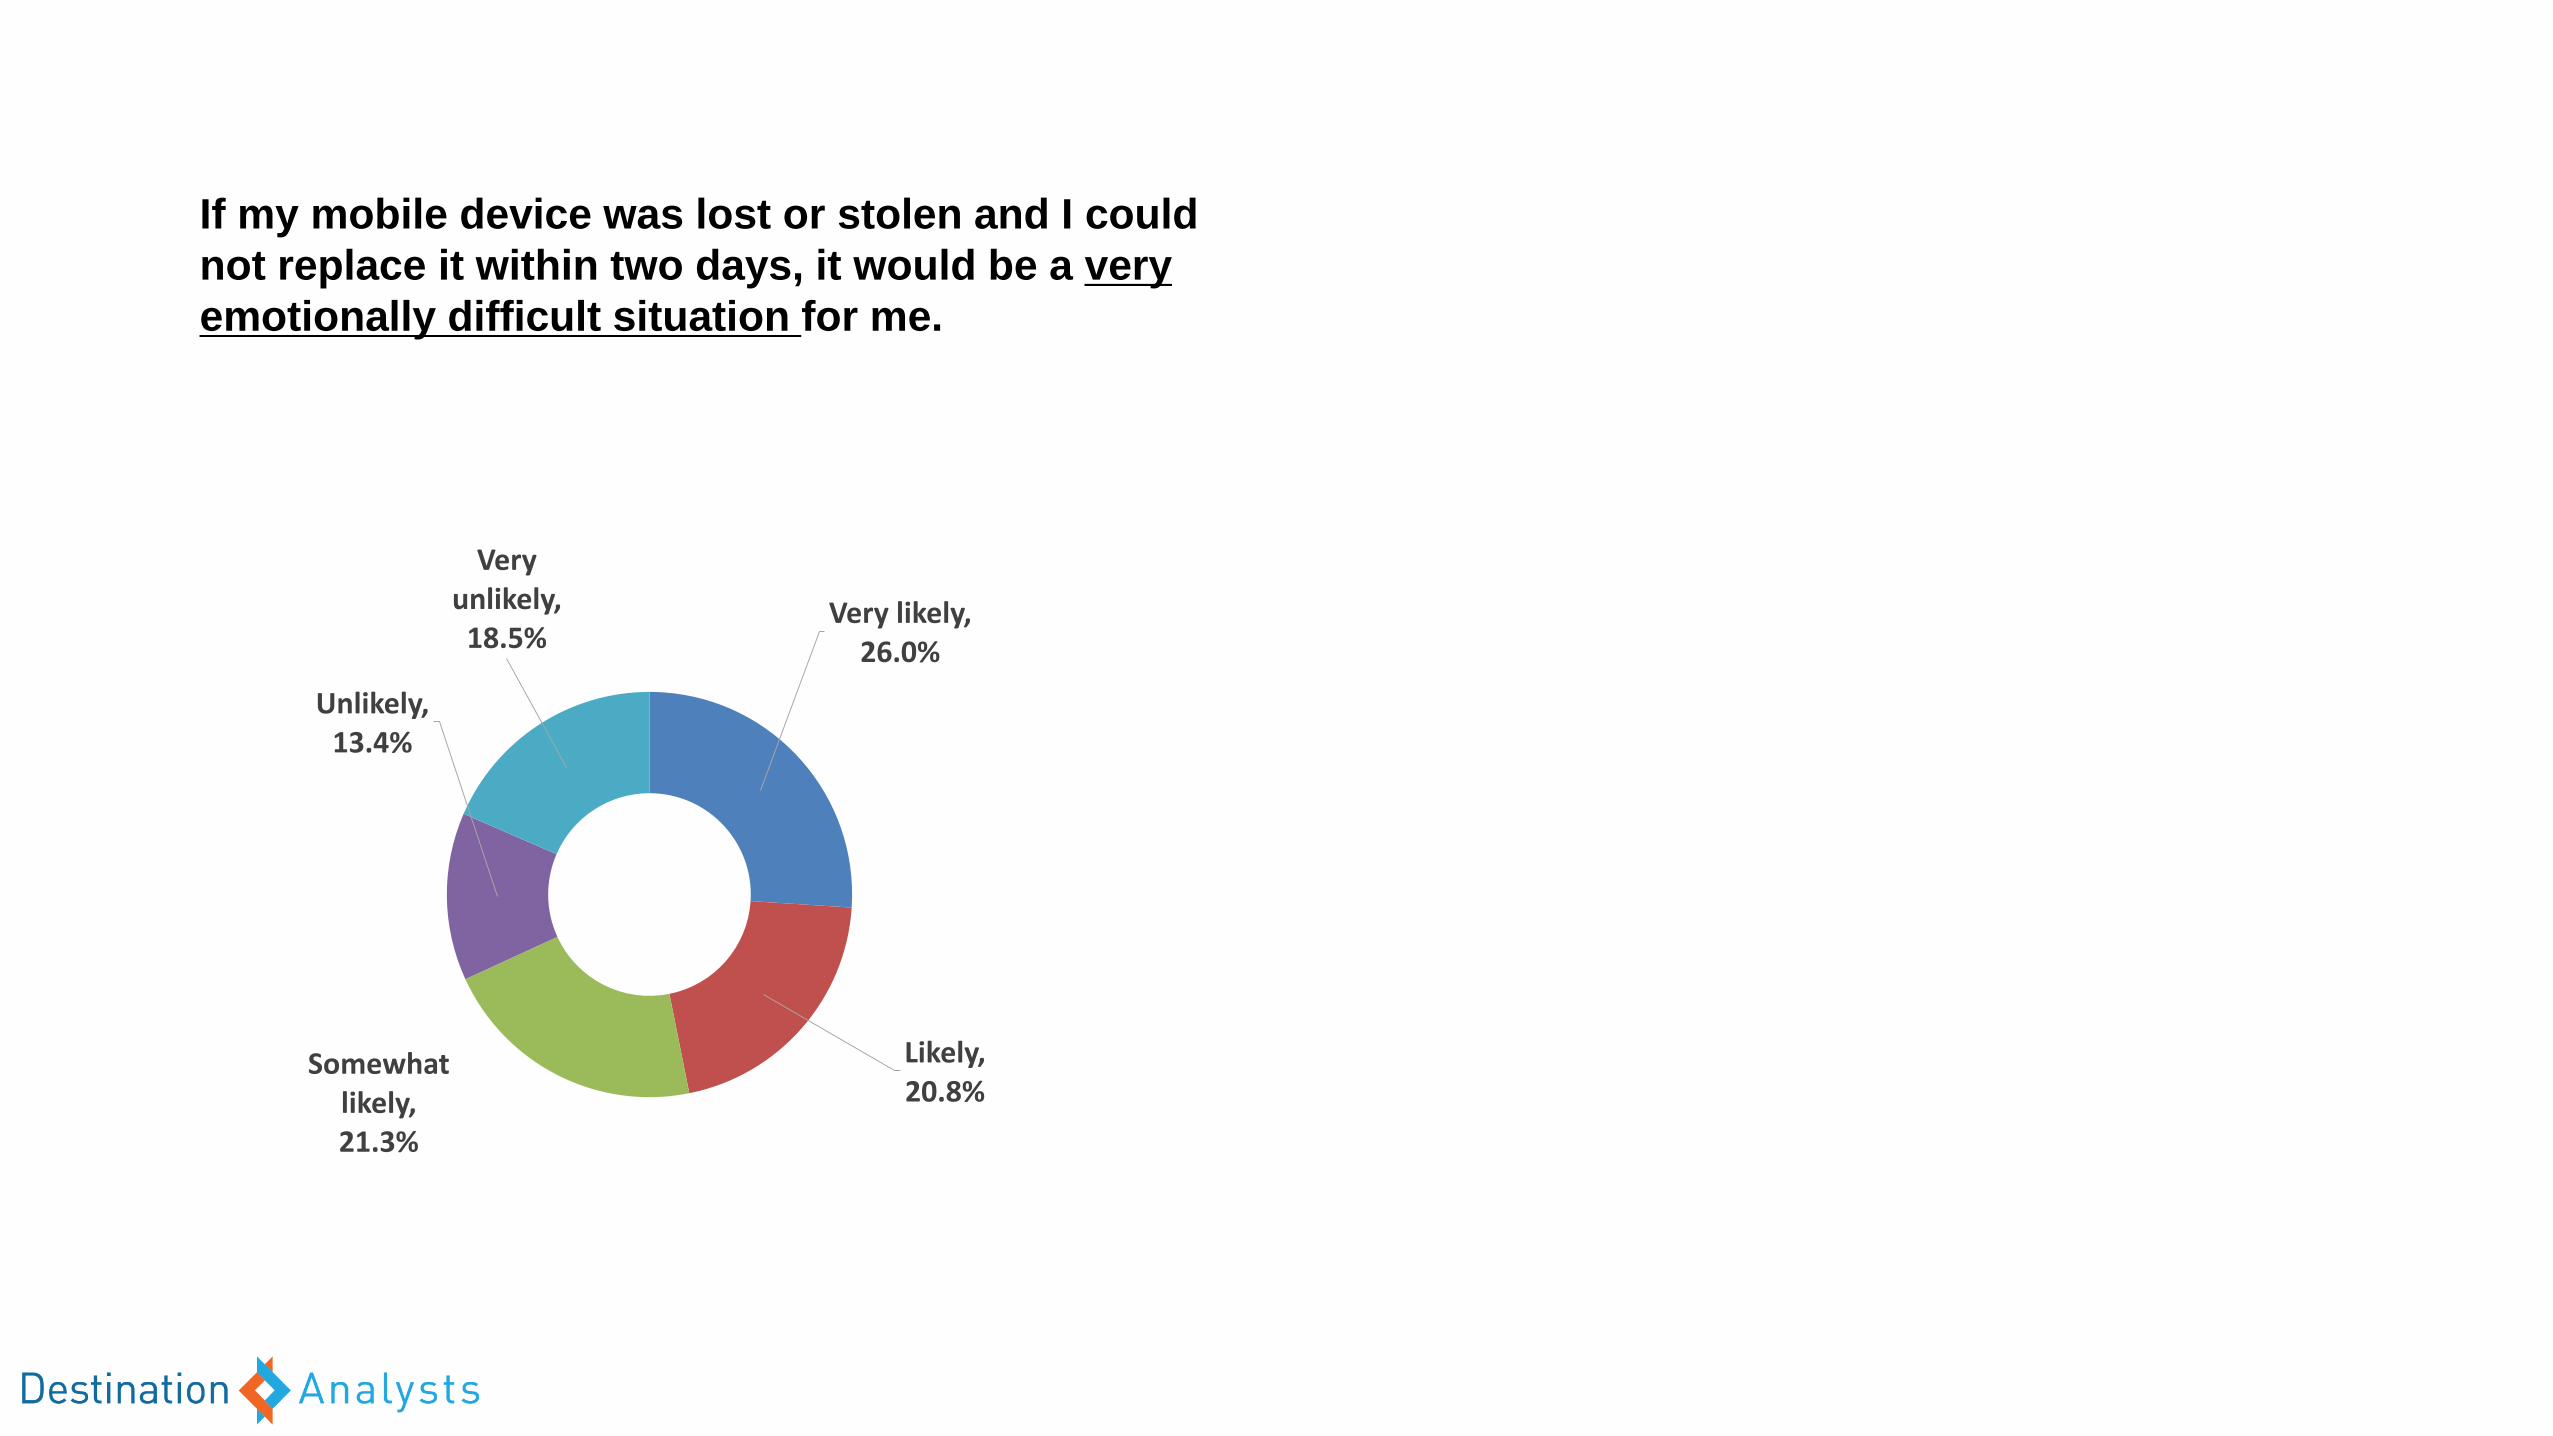
If my mobile device was lost or stolen and I could
not replace it within two days, it would be a very
emotionally difficult situation for me.
Very likely, 26.0%
Likely, 20.8%
Somewhat likely, 21.3%
Unlikely, 13.4%
Very unlikely,
18.5%

THANK YOU!