the state of the economy - portland state university seidman... · continued and the unemployment...
TRANSCRIPT

■ Adam Seidman is a Master of Real Estate Development candidate and has been awarded the Center for Real Estate Fellowship. Any errors or omissions are the author’s responsibility. Any opinions expressed are those of the author solely and do not represent the opinions of any other person or entity. Center for Real Estate Quarterly Report, vol. 10, no. 2. Spring 2016 14
THE STATE OF THE ECONOMY
ADAM SEIDMAN
Portland State University
Employment continued to strengthen in the first quarter. Nationally, job growth continued and the unemployment rate remained steady at 5 percent. Oregon and the Portland MSA saw strong employment growth (at rates above national levels) and unemployment at or near historic lows. Importantly, the strong job market in Oregon is finally translating to wage gains across a diverse set of industries.
Despite the strengthening employment market, significant uncertainty remains about the state of the economy. At the national level, GDP growth was the lowest in two years as consumers and businesses reigned in spending. Volatility in the financial and oil markets have impacted projections for economic growth domestically and internationally. The IMF again revised its growth estimates downwards for the next two years for the global economy.
In Oregon and Portland, housing affordability remains a key concern for politicians and economists. And although job growth is described as at “full throttle” for the state, its largest private employer, Intel, announced significant layoffs after the end of the first quarter in response to a changing technology market.

STATE OF THE ECONOMY SEIDMAN 15
Table 1: Key Economic Indicators, Portland MSA, Oregon, and US Q1 2016
Sources: BEA, BLS, Federal Reserve, Oregon Employment Department
GLOBAL TRENDS The International Monetary Fund (IMF) revised its global growth projection down yet again for 2016 and 2017 to annual rates of 3.2 percent and 3.5 percent, respectively. In its April World Economic Outlook report, the IMF noted that uncertainty had increased and that “risks of weaker growth scenarios are becoming more tangible.” The major macroeconomic factors impacting global growth, according to the IMF, include: a continuing slowdown and rebalancing of the Chinese economy, further declines in energy and commodity prices, a related slowdown in investment and trade, and declining capital flows to emerging markets.
However, global growth is expected to pick up in 2017 “as conditions in stressed economies start gradually to normalize,” according to the IMF report. Recessions in Russia and Brazil are expected to continue in the near-term but to recover over the next 8 quarters. Importantly, growth in China has been stronger than anticipated, due in large part to Chinese consumer spending. This has prompted the IMF to upwardly revise its forecasts of growth in China over the next 2 years.
Interest rates remained unchanged in the first quarter after the United States Federal Reserve raised its target rate in December after 7 years of zero interest
Q12016/ Q42015/ Q12015/Mar2015 Dec2015 Mar2015
GDPGrowth(annualized)US 0.5% 1.4% 0.6%
UnemploymentRateUS 5.0% 5.0% 5.5%OR 4.5% 5.4% 5.4%PortlandMSA 4.2% 4.9% 4.9%
JobGrowthRate(12-mogrowth)US 2.0% 2.0% 2.1%OR 3.3% 3.2% 3.4%PortlandMSA 3.2% 3.1% 3.3%
Inflation(12-mounadjusted)US 0.9% 0.7% -0.1%
InterestRatesFederalFundsRate 0.4% 0.2% 0.1%10-YearTreasury 1.9% 2.2% 2.0%

STATE OF THE ECONOMY SEIDMAN 16
rates. Some analysts believe that the Fed will raise interest rates one or two more times this year, with the soonest hike potentially happening at the Fed’s June meeting. The Wall Street Journal’s survey economists predicts a rate of 0.84 percent by the end of the year (versus the current 0.38 percent).
Oil prices slid to under $30 a barrel in the first half of the quarter, but rebounded in the latter half to end up virtually unchanged in price. Still down over 20 percent year-over-year at the quarter’s end, low oil prices have hurt oil-dependent economies across the world, including Russia and Brazil, both of which are currently in recession. The U.S. economy has also been impacted as its oil industry has grown significantly over the past decade with the shale boom. Major oil producing nations have discussed output freezes to help stem the price declines, but as of this writing no agreements have been reached.
Following a strong showing in 2015, the dollar weakened in the first quarter, ending down 4 percent versus foreign currencies, with notable weakness against the Japanese yen. This was due in part to uncertainty from the Federal Reserve regarding future interest rate hikes.
GDP/OUTPUT The Bureau of Economic Analysis (BEA) reported that their “advance” estimate for U.S. annualized GDP growth was 0.5 percent in the first quarter. This follows growth of 1.4 percent in the fourth quarter (revised upwards from the prior “advance” estimate of 0.7 percent) and represents the slowest growth in two years. The slow growth was driven by deceleration in both consumer and corporate spending, and corporate fixed investment dropped nearly 6 percent, its biggest decline since 2009.
It should be noted that the past two years have seen slow growth in the first quarter followed by stronger growth in the following quarters, and some analysts believe that will be the case in 2016, helped along by a strong employment market and calming financial markets. It should also be noted that there is a likely chance of an upward revision in the estimate as we’ve seen the past few quarters. Looking ahead, The Wall Street Journal Economic Forecasting Survey projects annualized GDP growth of 2.4 percent for the next two quarters, in-line with previous forecasts.

STATE OF THE ECONOMY SEIDMAN 17
Figure 1: Gross Domestic Product, United States, Annualized Percent Change, 2005–2016 Q3 (Forecast)
Source: Bureau of Economic Analysis (blue bars) and Wall Street Journal Economic Forecasting Survey (orange bars)
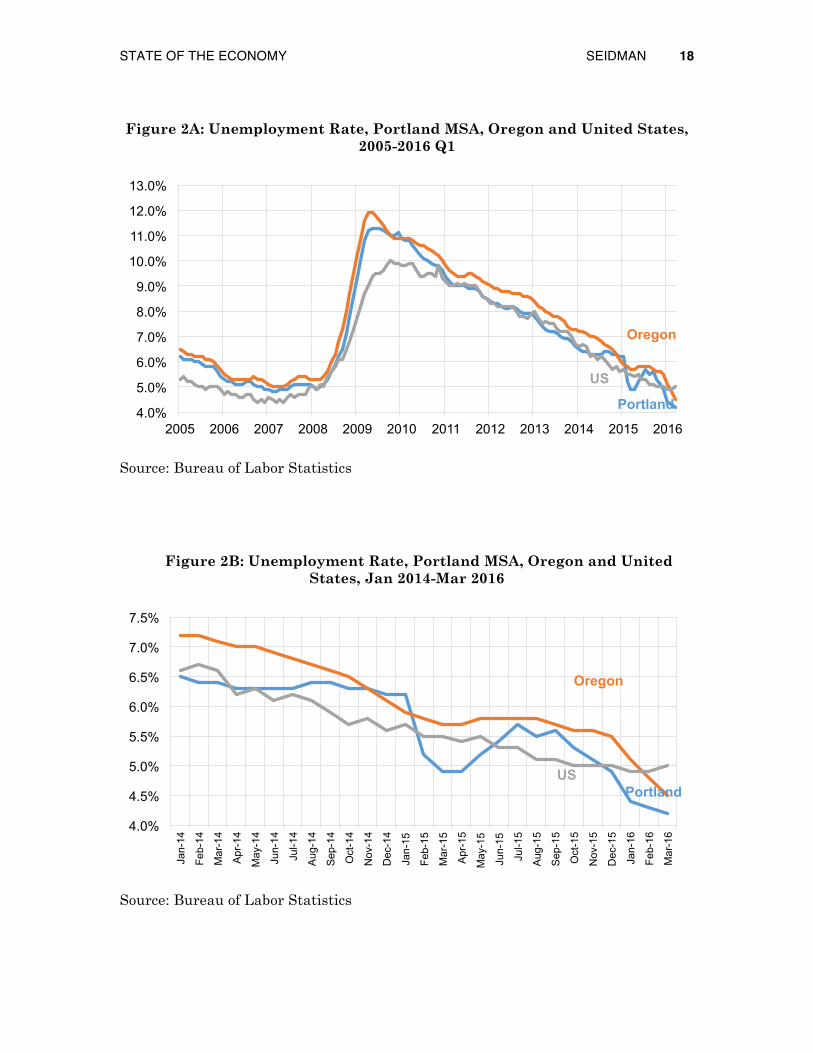
EMPLOYMENT The Bureau of Labor Statistics (BLS) reported that total U.S. nonfarm employment increased by 215,000 in March and 628,000 for the first quarter. This compares with growth of 84,000 in March 2015 and 552,000 for the first quarter of 2015. National unemployment figures remained steady at 5.0 percent, matching lows not seen since April 2008.
The unemployment rate for both Oregon and the Portland Metropolitan Statistical Area (MSA) continued to decline in the first quarter to near historic lows. Oregon’s unemployment rate dropped to 4.5 percent in March – the lowest point since comparable records began in 1976. In Portland, the unemployment rate dropped to 4.2 percent in March, a rate not seen since 2000. At both the state and metro level, unemployment is now lower than the national rate of 5.0 percent.
-10.0%
-8.0%
-6.0%
-4.0%
-2.0%
0.0%
2.0%
4.0%
6.0%
2005 2006 2007 2008 2009 2010 2011 2012 2013 2014 2015 2016
STATE OF THE ECONOMY SEIDMAN 18
Figure 2A: Unemployment Rate, Portland MSA, Oregon and United States, 2005-2016 Q1
Source: Bureau of Labor Statistics
Figure 2B: Unemployment Rate, Portland MSA, Oregon and United States, Jan 2014-Mar 2016
Source: Bureau of Labor Statistics
4.0%
5.0%
6.0%
7.0%
8.0%
9.0%
10.0%
11.0%
12.0%
13.0%
2005 2006 2007 2008 2009 2010 2011 2012 2013 2014 2015 2016
Oregon
Portland
US
4.0%
4.5%
5.0%
5.5%
6.0%
6.5%
7.0%
7.5%
Jan-
14
Feb-
14
Mar
-14
Apr
-14
May
-14
Jun-
14
Jul-1
4
Aug
-14
Sep
-14
Oct
-14
Nov
-14
Dec
-14
Jan-
15
Feb-
15
Mar
-15
Apr
-15
May
-15
Jun-
15
Jul-1
5
Aug
-15
Sep
-15
Oct
-15
Nov
-15
Dec
-15
Jan-
16
Feb-
16
Mar
-16
Oregon
Portland US

STATE OF THE ECONOMY SEIDMAN 19
Job gains continued their strong trajectory in both Oregon and the Portland MSA in the first quarter. Year-over-year, Oregon added nearly 59,000 jobs and the Portland MSA grew by over 35,000 jobs, representing growth rates of 3.3 percent and 3.2 percent, respectively—remaining notably above the national rate of 2.0 percent. According to Oregon’s Office of Economic Analysis (OEA), this job growth rate represents “full throttle” growth. After the end of the first quarter, Intel, Oregon’s largest private employer, announced significant layoffs as the firm seeks to re-orient to changing dynamics in the technology markets. The firm will lay off nearly 800 Oregon workers, or 4 percent of its state workforce, and will also pursue an undisclosed number of early retirements and buyouts.
Figure 3: Employment Growth Rate by Sector, Portland MSA and Oregon, 12 Months to March 2016
Source: Oregon Employment Department
-6.0%
-4.0%
-2.0%
0.0%
2.0%
4.0%
6.0%
8.0%
10.0%
Oregon PortlandMetro

STATE OF THE ECONOMY SEIDMAN 20
Job growth in Oregon and the Portland MSA has been broad-based over the past 12 months. In the Portland metro, every sector added at least 1,400 jobs in the past 4 quarters (except for Mining and Logging, which only has a total base of 1,200 jobs in the MSA).
Figure 4: Employment Growth by Sector, Portland MSA, 12 Months to March 2016 (000s)
Source: Oregon Employment Department
Strong job gains have helped lead to relatively wage gains. According to Oregon’s
Office of Economic Analysis, “while Oregonian income and wages are below the typical state, average wages today in Oregon are at their highest relative point since the severe early 1980s recession when the timber industry restructured. Much of this improvement has come in the past 2-3 years when Oregon wage growth, much like job growth, has outstripped the average state.” Statewide, wage growth has been broad-based across various industries and not just driven by high-paying technology jobs. The OEA projects that wages and salaries will grow at a faster rate in Oregon compared to the national average in 2016, as was seen in 2015.
0 1 2 3 4 5 6 7 8
Mining and Logging Other Services
Construction Information
Manufacturing Financial Activities
Government Trade, Transport and Utilities
Leisure and Hospitality Professional and Business Services
Educational and Health Services

STATE OF THE ECONOMY SEIDMAN 21
Figure 5: Growth in Wages, Employment, and Population, Oregon and US, 2015-2016
Source: From Oregon Labor Trends April 2016 Report
Wage growth has been strong in the Portland MSA as well, and according to the
Oregon Employment Department the metro area’s hourly wage of over $19 is 14th highest among the 50 largest U.S. metro areas and 11 percent higher than the national average. As noted here the past few quarters, in the Portland MSA much of the growth in average wages has been driven by high-paying jobs, especially those in the software sector in Multnomah County.
Job growth in Oregon and Portland is expected to continue, driven by projected population growth and in-migration trends. However, the rate of growth is expected to moderate over the next two years. The Oregon Office of Economic Analysis expects job growth of 2.7 percent in 2016 and 2.6 percent in 2017, representing a slight downward revision from their prior forecast. This would translate to nearly 50,000 new jobs per year in the state over the next two years.

STATE OF THE ECONOMY SEIDMAN 22
Although still near historically low levels, the labor force participation rate has improved nationally and in Oregon. Analysts note that these gains likely reflect a short-term cyclical rebound in the economy but that demographic pressures, especially of an aging population, will continue to weight on this measure in the longer-term.
Figure 6: Labor Force Participation Rate, United States, 2007-2016 Q1
Source: Bureau of Labor Statistics
INFLATION The United States Consumer Price Index (CPI-U) increased 0.1 percent in March on a seasonally-adjusted basis and for the year saw a gain of 0.9 percent on a non-adjusted basis. Rising energy prices, after 3 months of declines, offset declines in food prices in March. However, the energy index is still down nearly 13 percent over the past year, and volatility is projected to continue as uncertainty remains in the oil market. The Wall Street Journal’s Economic Forecasting Survey projects that the unadjusted 12-month CPI will increase by 1.1 percent in June and 1.8 percent in December.
INTEREST RATES After raising the overnight rate for the first time in 7 years in December, the Federal Reserve stood pat in the first quarter, keeping rates at 0.36 percent. However, many analysts believe the Fed officials have signaled that they are likely to raise rates once or twice this year, potentially at their next meeting in June. The Wall Street Journal’s Economic Forecasting Survey projects that the rate will increase to 0.56 percent by June and to 0.84 percent by the end of 2016 (both are downward revisions since last quarter).
The 10-year Treasury and the 30-year mortgage rate both declined in the first quarter and are slightly below their March 2015 levels.
62.0%
63.0%
64.0%
65.0%
66.0%
67.0%
2007 2008 2009 2010 2011 2012 2013 2014 2015 2016

STATE OF THE ECONOMY SEIDMAN 23
Figure 7: Treasury and Mortgage Rates, United States, 2005-2016 Q1
Source: Federal Reserve
CAPITAL MARKETS There was significant volatility in capital markets in the first quarter. The first half of the quarter saw big declines in equity markets and U.S. bond prices over concerns about global economic conditions, but markets rebounded in the second half of the quarter to post small overall gains. Bonds turned in returns close to 3 percent for the quarter, better than those seen for large- and small-cap stock indices. However, the core issues that partly caused the swoon in the first half of the quarter have not gone away, and many analysts believe that the remainder of the year will see increased volatility in capital markets.
Part of the market’s volatility is due to declines in the price of oil. The price per barrel dipped below $30 in the first half of the quarter, but rebounded by the end of the quarter to remain virtually unchanged from the end of 2015. However, prices have been on a steady decline, impacting countries dependent on oil revenue, such as Russia and Venezuela. This group now includes the United States, whose shale industry has grown significantly over the past decade and whose many smaller players cannot sustain oil prices below $50 per barrel.
0.00%
1.00%
2.00%
3.00%
4.00%
5.00%
6.00%
7.00%
8.00%
2005 2006 2007 2008 2009 2010 2011 2012 2013 2014 2015 2016
30 Year Mortgage
10 Year Treasury

STATE OF THE ECONOMY SEIDMAN 24
Figure 8: Oil Price per Barrel (WTI Spot), 2013–2016 Q1
Source: US Energy Information Administration
Figure 9A: Standard & Poor’s 500 Index, 2007–2016 Q1
Source: S&P Dow Jones Indices, McGraw Hill Financial
$0 $20 $40 $60 $80
$100 $120
-60%
-40%
-20%
0%
20%
40%
60%
80%
100%
2007 2008 2009 2010 2011 2012 2013 2014 2015 2016
Including Dividends
Excluding Dividends

STATE OF THE ECONOMY SEIDMAN 25
Figure 9B: Standard & Poor’s 500 Index, Jan 2014–Mar 2016
LOOKING AHEAD Oregon and Portland’s economies continued to show strength in the first quarter, following a banner year in 2015, and the OEA forecasts strong growth to continue for the next two years. The state and metro area are grappling with issues such as housing affordability and minimum wage, which will impact local economies in upcoming quarters.
On a national and international level, uncertainty and volatility look set to continue, with even greater swings in financial markets predicted by many analysts. In addition to issues such as the interest rate, oil prices, and China’s growth, 2016 will also see national elections in the United States, adding yet another level of uncertainty. !
0%
10%
20%
30%
40%
50%
60%
70%
80%
Including Dividends
Excluding Dividends