the state of the world’s children2007 - unicef.org · the state of the world’s children2007...
TRANSCRIPT

Women andChildrenThe Double Dividendof Gender Equality
THE STATE OF THEWORLD’S CHILDREN 2007EXECUTIVE SUMMARY


CONTENTS
Chapter 1: A call for equality............................................ 2
Chapter 2: Equality in the household.............................. 6
Chapter 3: Equality in employment.................................. 9
Chapter 4: Equality in politics and government............12
Chapter 5: Reaping the double dividend of gender equality.............................................. 15
Summary Indicators
Sub-Saharan Africa...................................................... 20
Eastern and Southern Africa...................................... 22
West and Central Africa.............................................. 24
Middle East and North Africa.................................... 26
South Asia.................................................................... 28
East Asia and Pacific.................................................... 30
Latin America and Caribbean...................................... 32
Central and Eastern Europe/Commonwealthof Independent States (CEE/CIS)................................ 34
Industrialized countries.............................................. 36
Developing countries.................................................. 38
Least developed countries.......................................... 40
Design and Prepress Production: Prographics, Inc.

A call for equality
Gender equality is central to realizing the Millennium agenda, which risks failure without the full participation ofall members of society. Within the Millennium Declarationand the Millennium Development Goals (MDGs), and at theheart of the United Nations itself, is the acknowledgementthat the vulnerable, especially children, require special careand attention. Gender equality will not only empower womento overcome poverty, but will also assist their children, fami-lies, communities and countries as well. When seen in thislight, gender equality is not only morally right – it is pivotalto human progress.
Moreover, gender equality produces a double dividend: Itbenefits both women and children. Healthy, educated andempowered women have healthy, educated and confidentdaughters and sons. The amount of influence women haveover the decisions in the household has been shown to posi-tively impact the nutrition, health care and education of theirchildren. But the benefits of gender equality go beyond theirdirect impact on children. Without it, it will be impossible to
2
1© UNICEF/SW2K00161/Giacomo Pirozzi

create a world of equity, tolerance and shared responsibility –a world that is fit for children.
Yet gender discrimination remains pervasive in every regionof the world. It appears in the preference for sons overdaughters, limited opportunities in education and work forgirls and women, and outright gender-based violence in theforms of physical and sexual violence. Other, less obvious,forms of gender discrimination can be equally destructive.Institutional discrimination is harder to identify and rectify.Cultural traditions can perpetuate social exclusion and discrimination from generation to generation, as genderstereotypes remain widely accepted and go unchallenged.
In spite of the ingrained nature of gender inequality, there is hope in the fact that the status of women has improvedsince the Convention on the Elimination of All Forms ofDiscrimination against Women (CEDAW) was adopted by theUN General Assembly in 1979. Today, many girls and womenhave access to opportunities that were previously restricted.Girls are present in increasing numbers in education, and inmany regions women’s participation in both the labour forceand government and politics has risen. Since late 2005, Chile,Jamaica, Liberia and the Republic of Korea have elected orselected women as their Heads of Government, bringing thetotal number of female Heads of State or Government to 14.
Most importantly, by promoting legal and economic reforms,proponents of gender equality have begun to reshape the socialand political landscape. And though gender continues to influ-ence choices, chances and challenges, in many parts of theworld a girl born in 2007 will probably have a brighter futurethan a girl who was born when CEDAW was adopted in 1979.
Building on this progress is critical to achieving not only gender equality and women’s empowerment, but also sustain-able development. To do so, women’s influence in the keydecisions that shape their lives and those of children must beenhanced in three distinct arenas: the household, the work-place and the political sphere. A change for the better in anyone of these realms influences women’s equality in the others,and has a profound and positive impact on children’s well-being and development.
3

4
0
20
40
60
80
100
Easternand
SouthernAfrica
West and
CentralAfrica
Middle East and
NorthAfrica
SouthAsia
East Asiaand
Pacific
LatinAmerica
andCaribbean
MaleFemale
CEE/CIS
Per
cen
t
Easternand
SouthernAfrica
West and
CentralAfrica
Middle East and
NorthAfrica
SouthAsia
East Asiaand
Pacific**
LatinAmerica
andCaribbean
Per
cen
t
0
10
20
30
40
50
60
MaleFemale
In many developing regions, girls are more
likely than boys to miss out on a secondary
education
Notes: Gross secondary enrolment ratio refers to the number of childrenenrolled in secondary school, regardless of age, expressed as a percentage ofthe total number of children of official secondary school age. Net secondaryschool attendance ratio refers to the number of children attending secondaryschool who are of official secondary school age, expressed as a percentage ofthe total number of children of official secondary school age. These data comefrom national household surveys. * Data refer to the most recent year available during the period specified.** Excludes China.
Sources: Gross secondary enrolment ratio: UNESCO Institute of Statistics. Netsecondary school attendance ratio: Demographic and Health Surveys andMultiple Indicator Cluster Surveys. The underlying data can be found in theStatistical Tables of the Main Report, page 98.
Gross secondary school
enrolment ratio, 2000–2005*
Net secondary school
attendance ratio, 1996–2005*

The State of the World’s Children 2007 examines the status ofwomen today and analyses the discrimination and disempow-erment that many women face throughout their lives. Thereport discusses how gender equality will move all of theMillennium Development Goals forward, and how invest-ment in women’s rights – through education, financing, legis-lation, legislative quotas, engaging men and boys, womenempowering women and improved research and data – willultimately produce a double dividend: advancing the rights ofboth women and children.
5

6
Equality in thehousehold
For children, the most important actors in the world are notpolitical leaders and heads of development agencies, but theparents and caregivers who make crucial household decisionseach day. Evidence suggests that men and women frequentlyhave very different roles and priorities when it comes tohousehold decision-making. Women generally place a higherpremium on welfare-related goals and are more likely to usetheir influence and the resources they control to meet theneeds of families, particularly children.
A growing body of evidence indicates that household deci-sions are often made through a bargaining process that ismore likely to favour men than women.
• According to data from the Demographic and HealthSurveys, in only 10 out of the 30 developing countries sur-veyed did half or more of women participate in all house-hold decisions, including those regarding daily householdspending, major household purchases, their own health careand their visits with friends or relatives outside the home.
2© UNICEF/HQ98--0609/Alejandro Balaguer

7
• Factors underlying women’s influence in decision-makingprocesses include control of income and assets, age at mar-riage and level of education. In both industrialized anddeveloping countries, women continue to lag behind men interms of income-earning opportunities and ownership andmanagement of assets. Evidence from around the worldindicates that husbands tend to be older than wives at firstmarriage, with the age gaps most extreme in the case ofchild marriage (defined as customary or statutory unionwhere one or both of the partners is under the age of 18).The findings of a study undertaken in 40 developing coun-tries indicate that, on average, men tend to spend moretime in education than women.
• Levels of education, earnings and asset ownership, and age gaps are key in determining bargaining power betweenmen and women in the household. Arguably of equalimportance is the threat of domestic violence. While physical and sexual violence and other forms of abuseoccur in different domestic environments and in differentguises, there is substantial evidence to suggest that such acts are mainly perpetrated by adult men against womenand girls. Domestic violence threatens the physical healthand emotional well-being of its victims and often forcesthem to endure subordinate positions and economic insecurity within households.
The consequences of women’s exclusion from household decisions can be as dire for children as they are for womenthemselves. In families in which women are key decision-makers, the proportion of resources devoted to children is fargreater than in those in which women have a less decisive role.
• Case studies conducted in the developing world indicatethat women who have greater influence in household decisions can significantly improve their children’s nutritionalstatus. Educating women also results in multiple benefitsfor children, improving their survival rates and nutritionalstatus as well as school attendance.
• According to a study conducted by the International FoodPolicy Research Institute, if men and women had equalinfluence in decision-making, the incidence of underweight

children less than three years old in South Asia would fallby up to 13 percentage points, resulting in 13.4 millionfewer undernourished children in the region; in sub-SaharanAfrica, an additional 1.7 million children would be adequately nourished.
• Women who have greater influence in decision-making can promote better health-care practices for the family. As evidence from India and Nepal shows, even afteraccounting for differences in education and wealth amongthe households surveyed, women’s participation in house-hold decisions decreases stunting among children andreduces child mortality.
• A woman’s empowerment within the household increasesthe likelihood that her children, particularly girls, willattend school. A UNICEF survey of selected countriesacross the developing world found that, on average, chil-dren with uneducated mothers are at least twice as likely to be out of school as children whose mothers attended primary school.
Men play a vital role in promoting egalitarian decision-making. Through simple and direct strategies, such as sharing responsibility for household chores and childcare,men can help combat gender discrimination in householdsand communities.
Women themselves are the most important catalysts forchange. By challenging and defying discriminatory attitudesin their communities, women’s groups can advance the rightsof girls and women for generations to come.
8

9
Equality in employment
While there has been great progress in recent decades in engag-ing women in the labour force, there has been considerably lessadvance on improving the conditions under which they work,recognizing their unpaid work, eliminating discriminatory prac-tices and laws related to property and inheritance rights, andproviding support for childcare. Ensuring that women and menhave equal opportunities to generate and manage income is animportant step towards realizing women’s rights. Moreover,children’s rights are more likely to be fulfilled when womenfully enjoy their social and economic rights.
• For many women, unpaid work in and for the householdtakes up the majority of their working hours, with muchless time spent in remunerative employment. Even whenthey participate in the labour market for paid employment,women still undertake the majority of the housework. InMexico, for example, women in paid employment also per-form household tasks that absorb 33 hours of their timeeach week; in contrast, men’s contribution to domesticchores amounts to just 6 hours per week.
3© UNICEF/HQ05-2192/Giacomo Pirozzi

10
• When women work outside the household, they earn, onaverage, far less than men. Although disaggregated data on nominal wages are scarce, the available evidence showsthat, across regions, women’s nominal wages are roughly 20 per cent lower than men’s. Women are also more likelyto work in more precarious forms of employment with lowearnings, little financial security and few or no social benefits.
• Women not only earn less than men but also tend to ownfewer assets. Smaller salaries and less control over house-hold income constrain their ability to accumulate capital.Gender biases in property and inheritance laws and in otherchannels of acquiring assets also leave women and childrenat greater risk of poverty.
Where women work matters for children, as paid employ-ment for women does not automatically lead to better out-comes for children.
• Factors such as the amount of time women spend workingoutside the household, the conditions under which they areemployed, who controls the income they generate, and thecosts and quality of childcare determine how the workundertaken by women in the labour market affects their ownwell-being and that of children.
• In many countries, high-quality childcare remains prohibi-tively expensive for low-income families in the absence ofstate provision or subsidies. Parents often rely on extendedfamily members or older children – most often girls – toprovide childcare while they work, often at the expense ofchildren’s education.
Challenging attitudes towards women at work requires a mul-tifaceted approach. Governments should undertake legislative,financial and administrative measures to create a strong andenabling environment for women’s entrepreneurship and par-ticipation in the labour market. Social policies should be pro-moted to tackle discrimination in the workplace and to enablewomen and men to reconcile their work and family responsi-bilities. For children, the most important strategies for ensur-ing that girls and boys will have equal income-earning oppor-tunities as adults is to give them equal access to education.

11
4 countri
es in
the M
iddle
East a
nd North
Afri
ca
0
20
40
8180 80
76
7370
60
80
100
Pro
po
rtio
n o
f w
om
en’s
wag
es t
o m
en’s
wag
es o
uts
ide
of
agri
cult
ure
, 199
5-20
04**
6 countri
es in
Eas
t Asia
and P
acifi
c
22 in
dustrial
ized co
untries
10 co
untries
in tr
ansit
ion
8 countri
es in
Latin
Amer
ica an
d Car
ibbea
n
4 countri
es in
sub-S
ahar
an A
frica
Nominal wages for women are significantly
lower than for men*
* UNICEF calculations for Developing countries include countries and territories inthe following regional groups. Middle East and North Africa: Bahrain, Egypt,Jordan, Occupied Palestinian Territory. East Asia and Pacific: Malaysia, Myanmar,Philippines, Republic of Korea, Singapore, Thailand. Countries in transition:Bulgaria, Croatia, Czech Republic, Georgia, Kazakhstan, Latvia, Lithuania, Romania,Turkey, Ukraine. Latin America and Caribbean: Brazil, Colombia, Costa Rica, El Salvador, Mexico, Panama, Paraguay, Peru. Sub-Saharan Africa: Botswana,Eritrea, Kenya, Swaziland.
** Data refer to the most recent year available during the period specified.
Industrialized countries: Australia, Austria, Belgium, Cyprus, Denmark, Finland,France, Germany, Greece, Hungary, Iceland, Ireland, Japan, Luxembourg, Malta, Netherlands, New Zealand, Norway, Portugal, Sweden, Switzerland, United Kingdom.
Source: International Labour Organization, LABORSTA database, <http://laborsta.ilo.org>, accessed March 2006.

12
Equality in politicsand government
Women’s political participation is a Millennium objective in its own right. Empowering women in the political arenahas the potential to change societies. Their involvement ingoverning bodies at the national and local levels leads to policies and legislation that are focused on women, childrenand families.
• A growing body of evidence from industrialized and devel-oping countries alike suggests that women in politics havebeen especially effective advocates for children at all levels,sponsoring legislation and fostering tangible changes in pol-icy outcomes that reflect the rights, priorities, experiencesand contributions of women, children and families.
• Parliamentary advocacy on behalf of children and familiescan also bridge party and ideological lines. Countries wherecross-party alliances of women parliamentarians have successfully advanced the rights of women and childreninclude Egypt, France, the Netherlands, the RussianFederation, Rwanda, South Africa and Sweden.
4© UN Photo/Paulo Filgueiras

13
• Though women’s parliamentary representation has steadilyincreased in the past decade, they remain under-representedin almost all national legislatures – accounting for justunder 17 per cent of parliamentarians worldwide. Moreover,their presence in government is even more limited; only 14 per cent of ministers and just 6 per cent of the world’sHeads of Government are women.
• Many of the pernicious effects of gender discrimination,from lower levels of education to prevailing social attitudesthat challenge women’s competence as decision makers, aswell as women’s greater work burden, continue to hindertheir participation in politics.
• Women’s participation at the local level has been growingrapidly, particularly in South Asia, partly due to the use ofquotas. Although evidence about the behaviour of localpoliticians is limited, a number of studies from both indus-trialized and developing countries indicate that women inlocal government tend to prioritize social issues. The partic-ipation of women in local politics can have an immediateimpact on outcomes for women and children, particularlyin the distribution of community resources and in promot-ing provisions for childcare.
• Women’s participation in peace negotiations and post-conflictreconstruction is vital to ensure the safety and protection ofchildren and other vulnerable populations. Yet women’sparticipation in most peace processes across the developingworld is, at best, informal. While governments and otherpolitical actors appear content to encourage engagementbetween women’s groups that often cut across conflict lines,women rarely make it to the peace table.
Despite limited participation in national and local politics and in post-conflict reconstruction, women in politics andgovernment are helping change the political environment.Their influence is not just being felt in stronger legislation forchildren and women; they are also helping decision-makingbodies become more democratic and gender-sensitive.
• In Rwanda, for example, women’s role in the transition to peace and democracy has paved the way for future

14
generations of girls to assume public roles that would havebeen inconceivable only a generation ago. In India, newassociations are strengthened by elected women representa-tives, as well as women who were previously elected butwho no longer formally participate in local councils. Thesetwo countries represent just a sample of the growinginvolvement of women in politics across the world.
Increasing women’s participation in politics is vital to pro-mote gender equality, empower women and fulfil children’srights. The remaining formal entry barriers must be disman-tled, and women encouraged and supported by political par-ties to stand for office. Legislative quotas are also gainingincreasing recognition as a potentially effective vehicle forbolstering women’s representation in local government, andin some countries, at the national level as well. Gender initia-tives also need the involvement and support of men, especial-ly male parliamentarians and political leaders. Better data andresearch are required to fully assess the impact of women legislators on policies related to children.
Women inparliament
Womenministers
Women heads ofgovernment
0
10
20
30
World averages
17
Per
cen
t
14
6
Source: Data on women in parliament and women ministers are drawn from the Inter-Parliamentary Union database on ‘Women in National Parliaments’,<http://www.ipu.org/wmn-e/classif.htm>, accessed June 2006. Data on womenheads of government are derived from official websites of national governments.
Women in governance, 2006

15
© UNICEF/HQ05-1566/Giacomo Pirozzi
Reaping the double dividend ofgender equality
The final chapter of the report provides a road map for maximiz-ing gender equality through seven key modes: education, financ-ing, legislation, legislative quotas, women empowering women,engaging men and boys, and improved research and data.
• Education: Ensuring that girls and boys have equal educa-tional opportunities is one of the most powerful stepstowards combating gender discrimination. Key actionsinclude abolishing school fees, encouraging parents andcommunities to invest in girls’ education, and creating girl-friendly schools that are safe and without bias. School cur-ricula must also impress upon teachers and students theimportance of gender equality, and address male bias in theclassroom. One way to help eliminate bias is to increase the number of female teachers in the classroom.
• Focusing additional resources on achieving gender equality:In addition to sound legislation, robust research and bold
5

16
policies, equitable and efficient investment is central toeliminating gender discrimination and fulfilling the rights ofwomen and children. Because gender equality cuts acrossall of the MDGs, assessing the cost of achieving MDG 3 –promoting gender equality and empowering women – hasproved especially difficult. According to a realistic scenario,low-income countries would need an additional US$28 bil-lion (measured in constant 2003 US dollars) in 2006, risingto US$73 billion by 2015. But getting the financing right isonly the first step. Money must be put to the right use, andit must be integrated with existing government budgets andplans, as well as aligned with poverty reduction strategypapers and other planning processes.
• Levelling the playing field in national legislation: Legislativereform can be a powerful strategy of empowerment forwomen and girls and for the safeguarding of their rights.Comprehensive measures are required to prevent andrespond to domestic violence and gender-based violence in conflict. National legal reforms in property law and
85%
60%
100
80
60
40
20
Number ofcountrieswith...
Percentageof countriesusing quotas
0
20
40
60
80
100
20
35More than 30% women MPs
Between 20% and 30%women MPs
Countries with the most women in parliament
in 2006 are also the most likely to use quotas
Note: Quotas include constitutional quotas, election law quotas and politicalparty quotas for electoral candidates.

17
inheritance rights represent one of the most direct strategiesfor increasing women’s access to land and property. Mostimportantly, governments need to enforce the existing laws,address customary laws that discriminate against womenand ensure equal access to justice and legal protection forwomen and children.
• Quotas can encourage women’s participation in politics:Quotas are a proven method of ensuring women breakthrough the political glass ceiling. Overall, of the 20 coun-tries in the world with the most women in parliament, 17are using some form of quota system. To be truly effective,however, quotas must be supported by political parties andelectoral systems that are committed to encouragingwomen’s participation in politics and government.
• Women empowering women: Grass-roots women’s move-ments have been the most vocal champions of women’sequality and empowerment, but they are sometimes over-looked by national governments and international agencies.
55%
6760
Between 10% and 20%women MPs Less than
10% women MPs
28%
Sources: Women in parliament from the Inter-Parliamentary Union databaseon ‘Women in National Parliaments’, <http://www.ipu.org/wmn-e/classif.htm>,accessed May 2006. The figures for those legislatures using quotas arederived from the ‘Global Database of Quotas for Women’, <www.quotaproject.org/country.cfm>, also accessed May 2006.

18
Primar
y sch
ool enro
lmen
t0
50
100
150
200
250
Countries with dataCountries without data
Num
ber
of c
ount
ries
Wom
en’s
partic
ipat
ion in
loca
l
govern
men
t
Indicators, 1995–2003*
187
17
111
62
108
96
81
123
70
134
67
137
60
144
52
152
41
163
38
166
Mat
ernal
morta
lity
Occupat
ional
distrib
ution
Liter
acya
Unpaid w
ork an
d tim
e use
Violen
ce ag
ainst
women
b
Info
rmal
emplo
ymen
t
Wag
e sta
tistic
s
School a
ttendan
cea
In many countries sex-disaggregated data are
not available for key indicators
*Data refer to the most recent year available during the period specified.
Note: ‘Countries with data’ includes only countries where data are based on cen-suses, surveys or other sources, not countries where data are derived from mod-elled estimates. aData from censuses only. bIncludes only data from national sur-veys. An additional 30 countries have surveys covering part of the country.
Source: United Nations, Department of Social and Economic Affairs, The World’sWomen 2005: Progress in statistics, United Nations, New York, 2006.

19
Involving women in the early stages of policy formulationhelps ensure that programmes are designed with the needsof women and children in mind.
• Engaging men and boys. Men can be powerful allies in the struggle for women’s equality. Advocacy initiativesdesigned to educate both women and men on the benefitsof gender equality and joint decision-making can help nurture a more cooperative relationship between them.UNICEF’s experience shows that programmes that encour-age the participation of both men and women can help increase communication between the sexes and encouragea more even division of childcare responsibilities.
• Improved research and data: Although surveys such as theDemographic and Health Surveys and Multiple IndicatorCluster Surveys are effective vehicles to provide in-depthinformation on some aspects of the situation of women andgirls, research and data in this area are sorely lacking. Anoverwhelming lack of sex-disaggregated statistics oftenresults in scant or weak quantitative evidence on the issuesthat affect women and, in turn, children. Better and moreextensive data and analysis are urgently required, particu-larly in the areas of maternal mortality, violence againstwomen, education, employment, wages, unpaid work andtime use, and participation in politics.
The time is now
Eliminating gender discrimination will produce a double dividend, fulfilling the rights of women and going a long waytowards realizing those of children as well. With concertedefforts, real progress, based on respect, universal human rightsand equal opportunities, can be made towards transformingdiscriminatory attitudes, behaviours, customs, laws, institu-tions and practices in society. Effective partnerships, involvinggovernments, donors and international agencies, can supportthis process through the design and implementation of humanrights-based development strategies. For women, men, and forchildren, the time to refocus our efforts is now.

SUB-SAHARAN AFRICA
INDICATOR REGION WORLD
Demographic indicators
Total population (2005) 713,457,000 6,449,371,000
Population under 18 (2005) 361,301,000 2,183,143,000
Population under 5 (2005) 119,555,000 616,219,000
Survival
Life expectancy at birth (2005) 46 68
Neonatal mortality rate (under 28 days), per 1,000 live births (2000) 44 30
Infant mortality rate (under 1), per 1,000 live births (2005) 101 52
Under-5 mortality rate, per 1,000 live births (2005) 169 76
Under-5 mortality rate, average annual rate of reduction (1990-2005) 0.7 1.5
Maternal mortality ratio, per 100,000 live births (2000, adjusted) 940 400
Health and nutrition
Percentage of infants with low birthweight (1998-2005*) 14 15
Percentage of under-5s who are moderately or severely underweight (1996-2005*) 28 25
Percentage of population using improved drinking water sources (2004) 55 83
Urban 81 95 Rural 44 73
Percentage of population using adequate sanitation facilities (2004) 37 59
Percentage of 1-year-old children immunized (2005) against:
Tuberculosis (BCG) 76 83Diphtheria/pertussis/tetanus (DPT1) 77 88 Diphtheria/pertussis/tetanus (DPT3) 66 78 Polio (polio3) 68 78 Measles 65 77 Hepatitis B (hepB3) 37 55 Haemophilus influenzae (Hib3) - -
Education
Percentage of primary school entrants reaching grade 5 (administrative data; 2000-2004*) 63 83
Net primary school attendance ratio (1996-2005*)Male 63 78 Female 59 75
Net secondary school attendance ratio (1996-2005*)Male 21 46 ** Female 20 43 **
Adult literacy rate (2000-2004*) 62 80
20

INDICATOR REGION WORLD
Economic indicators
GNI per capita (US$, 2005) 764 7,002
Percentage of population living on less than $1 a day (1994-2004*) 46 21
Percentage share of central government expenditure (1994-2004*) allocated to:
Health - 13 Education - 6 Defence - 12
Percentage share of household income (1994-2004*):Lowest 40 per cent 11 20 Highest 20 per cent 59 42
HIV/AIDS
Adult prevalence rate (15+ years, end 2005) 6.1 1.0
Estimated number of people (all ages) living with HIV (2005) 24,500,000 38,600,000
Estimated number of children (0-14 years) living with HIV (2005) 2,000,000 2,300,000
Estimated number of children (0-17 years) orphaned by AIDS (2005) 12,000,000 15,200,000
Child protection
Birth registration (1999-2005*) 40 -Urban 54 -Rural 32 -
Child marriage (1987-2005*) 40 -Urban 25 -Rural 48 -
Child labour (5-14 years, 1999-2005*) 37 -Male 38 -Female 37 -
Women
Adult literacy parity rate (females as a percentage of males, 2000-2004*) 76 86
Antenatal care coverage (percentage, 1997-2005*) 68 71
Skilled attendant at delivery (percentage, 1997-2005*) 43 63
Lifetime risk of maternal death (2000) 1 in… 16 74
NOTES:
* Data refer to the most recent year available during the period specified.
** Excludes China.
- Data not available.
21

EASTERN AND SOUTHERN AFRICA
22
INDICATOR REGION WORLD
Demographic indicators
Total population (2005) 356,126,000 6,449,371,000
Population under 18 (2005) 177,395,000 2,183,143,000
Population under 5 (2005) 57,670,000 616,219,000
Survival
Life expectancy at birth (2005) 46 68
Neonatal mortality rate (under 28 days), per 1,000 live births (2000) 40 30
Infant mortality rate (under 1), per 1,000 live births (2005) 93 52
Under-5 mortality rate, per 1,000 live births (2005) 146 76
Under-5 mortality rate, average annual rate of reduction (1990-2005) 0.9 1.5
Maternal mortality ratio, per 100,000 live births (2000, adjusted) 980 400
Health and nutrition
Percentage of infants with low birthweight (1998-2005*) 13 15
Percentage of under-5s who are moderately or severely underweight (1996-2005*) 27 25
Percentage of population using improved drinking water sources (2004) 55 83
Urban 76 95 Rural 40 73
Percentage of population using adequate sanitation facilities (2004) 36 59
Percentage of 1-year-old children immunized (2005) against:
Tuberculosis (BCG) 81 83Diphtheria/pertussis/tetanus (DPT1) 85 88 Diphtheria/pertussis/tetanus (DPT3) 76 78 Polio (polio3) 75 78 Measles 72 77 Hepatitis B (hepB3) 57 55 Haemophilus influenzae (Hib3) - -
Education
Percentage of primary school entrants reaching grade 5 (administrative data; 2000-2004*) 71 83
Net primary school attendance ratio (1996-2005*)Male 66 78 Female 66 75
Net secondary school attendance ratio (1996-2005*)Male 16 46 ** Female 17 43 **
Adult literacy rate (2000-2004*) 73 80

INDICATOR REGION WORLD
Economic indicators
GNI per capita (US$, 2005) 1,043 7,002
Percentage of population living on less than $1 a day (1994-2004*) 40 21
Percentage share of central government expenditure (1994-2004*) allocated to:
Health - 13 Education - 6 Defence - 12
Percentage share of household income (1994-2004*):Lowest 40 per cent 10 20 Highest 20 per cent 61 42
HIV/AIDS
Adult prevalence rate (15+ years, end 2005) 8.6 1.0
Estimated number of people (all ages) living with HIV (2005) 17,500,000 38,600,000
Estimated number of children (0-14 years) living with HIV (2005) 1,400,000 2,300,000
Estimated number of children (0-17 years) orphaned by AIDS (2005) 8,700,000 15,200,000
Child protection
Birth registration (1999-2005*) 33 -Urban 44 -Rural 28 -
Child marriage (1987-2005*) 36 -Urban 21 -Rural 43 -
Child labour (5-14 years, 1999-2005*) 34 -Male 36 -Female 32 -
Women
Adult literacy parity rate (females as a percentage of males, 2000-2004*) 85 86
Antenatal care coverage (percentage, 1997-2005*) 71 71
Skilled attendant at delivery (percentage, 1997-2005*) 39 63
Lifetime risk of maternal death (2000) 1 in… 15 74
NOTES:
* Data refer to the most recent year available during the period specified.
** Excludes China.
- Data not available.
23

WEST AND CENTRAL AFRICA
24
INDICATOR REGION WORLD
Demographic indicators
Total population (2005) 357,331,000 6,449,371,000
Population under 18 (2005) 183,906,000 2,183,143,000
Population under 5 (2005) 61,885,000 616,219,000
Survival
Life expectancy at birth (2005) 46 68
Neonatal mortality rate (under 28 days), per 1,000 live births (2000) 48 30
Infant mortality rate (under 1), per 1,000 live births (2005) 108 52
Under-5 mortality rate, per 1,000 live births (2005) 190 76
Under-5 mortality rate, average annual rate of reduction (1990-2005) 0.6 1.5
Maternal mortality ratio, per 100,000 live births (2000, adjusted) 900 400
Health and nutrition
Percentage of infants with low birthweight (1998-2005*) 15 15
Percentage of under-5s who are moderately or severely underweight (1996-2005*) 28 25
Percentage of population using improved drinking water sources (2004) 56 83
Urban 86 95 Rural 42 73
Percentage of population using adequate sanitation facilities (2004) 38 59
Percentage of 1-year-old children immunized (2005) against:
Tuberculosis (BCG) 71 83Diphtheria/pertussis/tetanus (DPT1) 70 88 Diphtheria/pertussis/tetanus (DPT3) 57 78 Polio (polio3) 62 78 Measles 58 77 Hepatitis B (hepB3) 19 55 Haemophilus influenzae (Hib3) - -
Education
Percentage of primary school entrants reaching grade 5 (administrative data; 2000-2004*) 55 83
Net primary school attendance ratio (1996-2005*)Male 59 78 Female 52 75
Net secondary school attendance ratio (1996-2005*)Male 26 46 ** Female 22 43 **
Adult literacy rate (2000-2004*) 49 80

INDICATOR REGION WORLD
Economic indicators
GNI per capita (US$, 2005) 491 7,002
Percentage of population living on less than $1 a day (1994-2004*) 54 21
Percentage share of central government expenditure (1994-2004*) allocated to:
Health - 13 Education - 6 Defence - 12
Percentage share of household income (1994-2004*):Lowest 40 per cent 14 20 Highest 20 per cent 51 42
HIV/AIDS
Adult prevalence rate (15+ years, end 2005) 3.5 1.0
Estimated number of people (all ages) living with HIV (2005) 6,900,000 38,600,000
Estimated number of children (0-14 years) living with HIV (2005) 650,000 2,300,000
Estimated number of children (0-17 years) orphaned by AIDS (2005) 3,300,000 15,200,000
Child protection
Birth registration (1999-2005*) 44 -Urban 59 -Rural 34 -
Child marriage (1987-2005*) 44 -Urban 28 -Rural 56 -
Child labour (5-14 years, 1999-2005*) 42 -Male 41 -Female 42 -
Women
Adult literacy parity rate (females as a percentage of males, 2000-2004*) 63 86
Antenatal care coverage (percentage, 1997-2005*) 66 71
Skilled attendant at delivery (percentage, 1997-2005*) 45 63
Lifetime risk of maternal death (2000) 1 in… 16 74
NOTES:
* Data refer to the most recent year available during the period specified.
** Excludes China.
- Data not available.
25

MIDDLE EAST AND NORTH AFRICA
26
INDICATOR REGION WORLD
Demographic indicators
Total population (2005) 378,532,000 6,449,371,000
Population under 18 (2005) 154,130,000 2,183,143,000
Population under 5 (2005) 44,711,000 616,219,000
Survival
Life expectancy at birth (2005) 69 68
Neonatal mortality rate (under 28 days), per 1,000 live births (2000) 26 30
Infant mortality rate (under 1), per 1,000 live births (2005) 43 52
Under-5 mortality rate, per 1,000 live births (2005) 54 76
Under-5 mortality rate, average annual rate of reduction (1990-2005) 2.7 1.5
Maternal mortality ratio, per 100,000 live births (2000, adjusted) 220 400
Health and nutrition
Percentage of infants with low birthweight (1998-2005*) 15 15
Percentage of under-5s who are moderately or severely underweight (1996-2005*) 16 25
Percentage of population using improved drinking water sources (2004) 88 83
Urban 95 95 Rural 78 73
Percentage of population using adequate sanitation facilities (2004) 74 59
Percentage of 1-year-old children immunized (2005) against:
Tuberculosis (BCG) 89 83Diphtheria/pertussis/tetanus (DPT1) 96 88 Diphtheria/pertussis/tetanus (DPT3) 89 78 Polio (polio3) 90 78 Measles 89 77 Hepatitis B (hepB3) 88 55 Haemophilus influenzae (Hib3) - -
Education
Percentage of primary school entrants reaching grade 5 (administrative data; 2000-2004*) 91 83
Net primary school attendance ratio (1996-2005*)Male 83 78 Female 77 75
Net secondary school attendance ratio (1996-2005*)Male 50 46 ** Female 44 43 **
Adult literacy rate (2000-2004*) 72 80

INDICATOR REGION WORLD
Economic indicators
GNI per capita (US$, 2005) 2,627 7,002
Percentage of population living on less than $1 a day (1994-2004*) 4 21
Percentage share of central government expenditure (1994-2004*) allocated to:
Health 5 13 Education 14 6 Defence 17 12
Percentage share of household income (1994-2004*):Lowest 40 per cent 16 20 Highest 20 per cent 47 42
HIV/AIDS
Adult prevalence rate (15+ years, end 2005) 0.2 1.0
Estimated number of people (all ages) living with HIV (2005) 510,000 38,600,000
Estimated number of children (0-14 years) living with HIV (2005) 33,000 2,300,000
Estimated number of children (0-17 years) orphaned by AIDS (2005) - 15,200,000
Child protection
Birth registration (1999-2005*) - -Urban - -Rural - -
Child marriage (1987-2005*) - -Urban - -Rural - -
Child labour (5-14 years, 1999-2005*) 10 -Male 12 -Female 9 -
Women
Adult literacy parity rate (females as a percentage of males, 2000-2004*) 77 86
Antenatal care coverage (percentage, 1997-2005*) 70 71
Skilled attendant at delivery (percentage, 1997-2005*) 76 63
Lifetime risk of maternal death (2000) 1 in…100 74
NOTES:
* Data refer to the most recent year available during the period specified.
** Excludes China.
- Data not available.
27

SOUTH ASIA
28
INDICATOR REGION WORLD
Demographic indicators
Total population (2005) 1,483,358,000 6,449,371,000
Population under 18 (2005) 587,319,000 2,183,143,000
Population under 5 (2005) 169,666,000 616,219,000
Survival
Life expectancy at birth (2005) 64 68
Neonatal mortality rate (under 28 days), per 1,000 live births (2000) 44 30
Infant mortality rate (under 1), per 1,000 live births (2005) 63 52
Under-5 mortality rate, per 1,000 live births (2005) 84 76
Under-5 mortality rate, average annual rate of reduction (1990-2005) 2.9 1.5
Maternal mortality ratio, per 100,000 live births (2000, adjusted) 560 400
Health and nutrition
Percentage of infants with low birthweight (1998-2005*) 29 15
Percentage of under-5s who are moderately or severely underweight (1996-2005*) 45 25
Percentage of population using improved drinking water sources (2004) 85 83
Urban 94 95 Rural 81 73
Percentage of population using adequate sanitation facilities (2004) 37 59
Percentage of 1-year-old children immunized (2005) against:
Tuberculosis (BCG) 79 83Diphtheria/pertussis/tetanus (DPT1) 83 88 Diphtheria/pertussis/tetanus (DPT3) 65 78 Polio (polio3) 65 78 Measles 64 77 Hepatitis B (hepB3) 23 55 Haemophilus influenzae (Hib3) - -
Education
Percentage of primary school entrants reaching grade 5 (administrative data; 2000-2004*) 76 83
Net primary school attendance ratio (1996-2005*)Male 81 78 Female 75 75
Net secondary school attendance ratio (1996-2005*)Male 54 46 ** Female 48 43 **
Adult literacy rate (2000-2004*) 59 80

INDICATOR REGION WORLD
Economic indicators
GNI per capita (US$, 2005) 691 7,002
Percentage of population living on less than $1 a day (1994-2004*) 32 21
Percentage share of central government expenditure (1994-2004*) allocated to:
Health 2 13 Education 4 6 Defence 14 12
Percentage share of household income (1994-2004*):Lowest 40 per cent 22 20 Highest 20 per cent 41 42
HIV/AIDS
Adult prevalence rate (15+ years, end 2005) 0.7 1.0
Estimated number of people (all ages) living with HIV (2005) 5,900,000 38,600,000
Estimated number of children (0-14 years) living with HIV (2005) 130,000 2,300,000
Estimated number of children (0-17 years) orphaned by AIDS (2005) - 15,200,000
Child protection
Birth registration (1999-2005*) 32 -Urban 47 -Rural 25 -
Child marriage (1987-2005*) 48 -Urban 28 -Rural 55 -
Child labour (5-14 years, 1999-2005*) 14 -Male 12 -Female 15 -
Women
Adult literacy parity rate (females as a percentage of males, 2000-2004*) 64 86
Antenatal care coverage (percentage, 1997-2005*) 53 71
Skilled attendant at delivery (percentage, 1997-2005*) 37 63
Lifetime risk of maternal death (2000) 1 in… 43 74
NOTES:
* Data refer to the most recent year available during the period specified.
** Excludes China.
- Data not available.
29

EAST ASIA AND PACIFIC
30
INDICATOR REGION WORLD
Demographic indicators
Total population (2005) 1,952,656,000 6,449,371,000
Population under 18 (2005) 572,465,000 2,183,143,000
Population under 5 (2005) 144,948,000 616,219,000
Survival
Life expectancy at birth (2005) 71 68
Neonatal mortality rate (under 28 days), per 1,000 live births (2000) 20 30
Infant mortality rate (under 1), per 1,000 live births (2005) 26 52
Under-5 mortality rate, per 1,000 live births (2005) 33 76
Under-5 mortality rate, average annual rate of reduction (1990-2005) 3.8 1.5
Maternal mortality ratio, per 100,000 live births (2000, adjusted) 110 400
Health and nutrition
Percentage of infants with low birthweight (1998-2005*) 7 15
Percentage of under-5s who are moderately or severely underweight (1996-2005*) 15 25
Percentage of population using improved drinking water sources (2004) 79 83
Urban 92 95 Rural 70 73
Percentage of population using adequate sanitation facilities (2004) 51 59
Percentage of 1-year-old children immunized (2005) against:
Tuberculosis (BCG) 87 83Diphtheria/pertussis/tetanus (DPT1) 92 88 Diphtheria/pertussis/tetanus (DPT3) 84 78 Polio (polio3) 84 78 Measles 84 77 Hepatitis B (hepB3) 78 55 Haemophilus influenzae (Hib3) - -
Education
Percentage of primary school entrants reaching grade 5 (administrative data; 2000-2004*) 94 83
Net primary school attendance ratio (1996-2005*)Male - 78 Female - 75
Net secondary school attendance ratio (1996-2005*)Male 53** 46 ** Female 55** 43 **
Adult literacy rate (2000-2004*) 91 80

INDICATOR REGION WORLD
Economic indicators
GNI per capita (US$, 2005) 2,092 7,002
Percentage of population living on less than $1 a day (1994-2004*) 14 21
Percentage share of central government expenditure (1994-2004*) allocated to:
Health 1 13 Education 8 6 Defence 12 12
Percentage share of household income (1994-2004*):Lowest 40 per cent 17 20 Highest 20 per cent 48 42
HIV/AIDS
Adult prevalence rate (15+ years, end 2005) 0.2 1.0
Estimated number of people (all ages) living with HIV (2005) 2,300,000 38,600,000
Estimated number of children (0-14 years) living with HIV (2005) 50,000 2,300,000
Estimated number of children (0-17 years) orphaned by AIDS (2005) - 15,200,000
Child protection
Birth registration (1999-2005*) 65** -Urban 77** -Rural 56** -
Child marriage (1987-2005*) 20** -Urban 12** -Rural 25** -
Child labour (5-14 years, 1999-2005*) 11** -Male 11** -Female 10** -
Women
Adult literacy parity rate (females as a percentage of males, 2000-2004*) 92 86
Antenatal care coverage (percentage, 1997-2005*) 88 71
Skilled attendant at delivery (percentage, 1997-2005*) 87 63
Lifetime risk of maternal death (2000) 1 in… 360 74
NOTES:
* Data refer to the most recent year available during the period specified.
** Excludes China.
- Data not available.
31
32
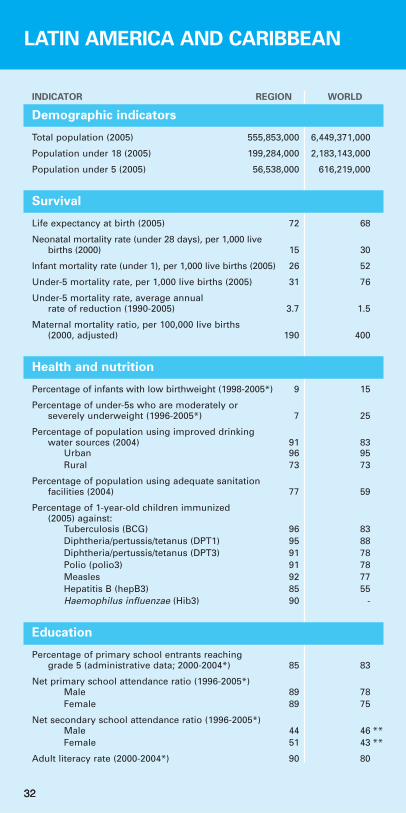
LATIN AMERICA AND CARIBBEAN
32
INDICATOR REGION WORLD
Demographic indicators
Total population (2005) 555,853,000 6,449,371,000
Population under 18 (2005) 199,284,000 2,183,143,000
Population under 5 (2005) 56,538,000 616,219,000
Survival
Life expectancy at birth (2005) 72 68
Neonatal mortality rate (under 28 days), per 1,000 live births (2000) 15 30
Infant mortality rate (under 1), per 1,000 live births (2005) 26 52
Under-5 mortality rate, per 1,000 live births (2005) 31 76
Under-5 mortality rate, average annual rate of reduction (1990-2005) 3.7 1.5
Maternal mortality ratio, per 100,000 live births (2000, adjusted) 190 400
Health and nutrition
Percentage of infants with low birthweight (1998-2005*) 9 15
Percentage of under-5s who are moderately or severely underweight (1996-2005*) 7 25
Percentage of population using improved drinking water sources (2004) 91 83
Urban 96 95 Rural 73 73
Percentage of population using adequate sanitation facilities (2004) 77 59
Percentage of 1-year-old children immunized (2005) against:
Tuberculosis (BCG) 96 83Diphtheria/pertussis/tetanus (DPT1) 95 88 Diphtheria/pertussis/tetanus (DPT3) 91 78 Polio (polio3) 91 78 Measles 92 77 Hepatitis B (hepB3) 85 55 Haemophilus influenzae (Hib3) 90 -
Education
Percentage of primary school entrants reaching grade 5 (administrative data; 2000-2004*) 85 83
Net primary school attendance ratio (1996-2005*)Male 89 78 Female 89 75
Net secondary school attendance ratio (1996-2005*)Male 44 46 ** Female 51 43 **
Adult literacy rate (2000-2004*) 90 80

33
INDICATOR REGION WORLD
Economic indicators
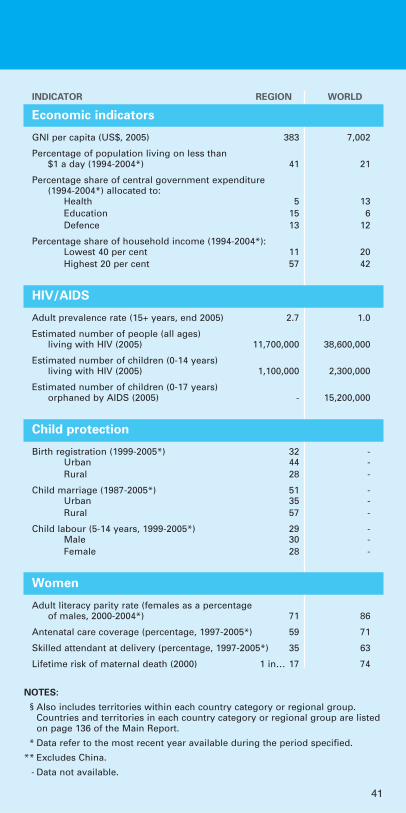
GNI per capita (US$, 2005) 4,078 7,002
Percentage of population living on less than $1 a day (1994-2004*) 9 21
Percentage share of central government expenditure (1994-2004*) allocated to:
Health 7 13 Education 16 6 Defence 4 12
Percentage share of household income (1994-2004*):Lowest 40 per cent 13 20 Highest 20 per cent 53 42
HIV/AIDS
Adult prevalence rate (15+ years, end 2005) 0.6 1.0
Estimated number of people (all ages) living with HIV (2005) 1,900,000 38,600,000
Estimated number of children (0-14 years) living with HIV (2005) 54,000 2,300,000
Estimated number of children (0-17 years) orphaned by AIDS (2005) - 15,200,000
Child protection
Birth registration (1999-2005*) 89 -Urban 92 -Rural 78 -
Child marriage (1987-2005*) 25 -Urban 24 -Rural 31 -
Child labour (5-14 years, 1999-2005*) 9 -Male 10 -Female 8 -
Women
Adult literacy parity rate (females as a percentage of males, 2000-2004*) 99 86
Antenatal care coverage (percentage, 1997-2005*) 93 71
Skilled attendant at delivery (percentage, 1997-2005*) 87 63
Lifetime risk of maternal death (2000) 1 in…160 74
NOTES:
* Data refer to the most recent year available during the period specified.
** Excludes China.
- Data not available.
33

CEE/CIS
34
INDICATOR REGION WORLD
Demographic indicators
Total population (2005) 404,322,000 6,449,371,000
Population under 18 (2005) 104,278,000 2,183,143,000
Population under 5 (2005) 25,562,000 616,219,000
Survival
Life expectancy at birth (2005) 67 68
Neonatal mortality rate (under 28 days), per 1,000 live births (2000) 18 30
Infant mortality rate (under 1), per 1,000 live births (2005) 29 52
Under-5 mortality rate, per 1,000 live births (2005) 35 76
Under-5 mortality rate, average annual rate of reduction (1990-2005) 2.8 1.5
Maternal mortality ratio, per 100,000 live births (2000, adjusted) 64 400
Health and nutrition
Percentage of infants with low birthweight (1998-2005*) 9 15
Percentage of under-5s who are moderately or severely underweight (1996-2005*) 5 25
Percentage of population using improved drinking water sources (2004) 91 83
Urban 98 95 Rural 79 73
Percentage of population using adequate sanitation facilities (2004) 84 59
Percentage of 1-year-old children immunized (2005) against:
Tuberculosis (BCG) 93 83Diphtheria/pertussis/tetanus (DPT1) 96 88 Diphtheria/pertussis/tetanus (DPT3) 95 78 Polio (polio3) 95 78 Measles 96 77 Hepatitis B (hepB3) 92 55 Haemophilus influenzae (Hib3) - -
Education
Percentage of primary school entrants reaching grade 5 (administrative data; 2000-2004*) 96 83
Net primary school attendance ratio (1996-2005*)Male 91 78 Female 89 75
Net secondary school attendance ratio (1996-2005*)Male - 46 ** Female - 43 **
Adult literacy rate (2000-2004*) 97 80

INDICATOR REGION WORLD
Economic indicators
GNI per capita (US$, 2005) 3,433 7,002
Percentage of population living on less than $1 a day (1994-2004*) 4 21
Percentage share of central government expenditure (1994-2004*) allocated to:
Health 4 13 Education 6 6 Defence 9 12
Percentage share of household income (1994-2004*):Lowest 40 per cent 22 20 Highest 20 per cent 39 42
HIV/AIDS
Adult prevalence rate (15+ years, end 2005) 0.6 1.0
Estimated number of people (all ages) living with HIV (2005) 1,500,000 38,600,000
Estimated number of children (0-14 years) living with HIV (2005) 9,000 2,300,000
Estimated number of children (0-17 years) orphaned by AIDS (2005) - 15,200,000
Child protection
Birth registration (1999-2005*) - -Urban - -Rural - -
Child marriage (1987-2005*) - -Urban - -Rural - -
Child labour (5-14 years, 1999-2005*) - -Male - -Female - -
Women
Adult literacy parity rate (females as a percentage of males, 2000-2004*) 97 86
Antenatal care coverage (percentage, 1997-2005*) 87 71
Skilled attendant at delivery (percentage, 1997-2005*) 93 63
Lifetime risk of maternal death (2000) 1 in… 770 74
NOTES:
* Data refer to the most recent year available during the period specified.
** Excludes China.
- Data not available.
35

INDUSTRIALIZED COUNTRIES§
36
INDICATOR REGION WORLD
Demographic indicators
Total population (2005) 961,191,000 6,449,371,000
Population under 18 (2005) 204,366,000 2,183,143,000
Population under 5 (2005) 54,239,000 616,219,000
Survival
Life expectancy at birth (2005) 79 68
Neonatal mortality rate (under 28 days), per 1,000 live births (2000) 4 30
Infant mortality rate (under 1), per 1,000 live births (2005) 5 52
Under-5 mortality rate, per 1,000 live births (2005) 6 76
Under-5 mortality rate, average annual rate of reduction (1990-2005) 3.4 1.5
Maternal mortality ratio, per 100,000 live births (2000, adjusted) 13 400
Health and nutrition
Percentage of infants with low birthweight (1998-2005*) 7 15
Percentage of under-5s who are moderately or severely underweight (1996-2005*) - 25
Percentage of population using improved drinking water sources (2004) 100 83
Urban 100 95 Rural 100 73
Percentage of population using adequate sanitation facilities (2004) 100 59
Percentage of 1-year-old children immunized (2005) against:
Tuberculosis (BCG) - 83Diphtheria/pertussis/tetanus (DPT1) 98 88 Diphtheria/pertussis/tetanus (DPT3) 96 78 Polio (polio3) 94 78 Measles 92 77 Hepatitis B (hepB3) 64 55 Haemophilus influenzae (Hib3) 90 -
Education
Percentage of primary school entrants reaching grade 5 (administrative data; 2000-2004*) - 83
Net primary school attendance ratio (1996-2005*)Male - 78 Female - 75
Net secondary school attendance ratio (1996-2005*)Male - 46 ** Female - 43 **
Adult literacy rate (2000-2004*) - 80

INDICATOR REGION WORLD
Economic indicators
GNI per capita (US$, 2005) 35,410 7,002
Percentage of population living on less than $1 a day (1994-2004*) - 21
Percentage share of central government expenditure (1994-2004*) allocated to:
Health 16 13 Education 4 6 Defence 12 12
Percentage share of household income (1994-2004*):Lowest 40 per cent 21 20 Highest 20 per cent 40 42
HIV/AIDS
Adult prevalence rate (15+ years, end 2005) 0.4 1.0
Estimated number of people (all ages) living with HIV (2005) 2,000,000 38,600,000
Estimated number of children (0-14 years) living with HIV (2005) 13,000 2,300,000
Estimated number of children (0-17 years) orphaned by AIDS (2005) - 15,200,000
Child protection
Birth registration (1999-2005*) - -Urban - -Rural - -
Child marriage (1987-2005*) - -Urban - -Rural - -
Child labour (5-14 years, 1999-2005*) - -Male - -Female - -
Women
Adult literacy parity rate (females as a percentage of males, 2000-2004*) - 86
Antenatal care coverage (percentage, 1997-2005*) - 71
Skilled attendant at delivery (percentage, 1997-2005*) 99 63
Lifetime risk of maternal death (2000) 1 in… 4,000 74
NOTES:
§ Also includes territories within each country category or regional group. Countries and territories in each country category or regional group are listedon page 136 of the Main Report.
* Data refer to the most recent year available during the period specified.
** Excludes China.
- Data not available.
37

DEVELOPING COUNTRIES§
38
INDICATOR REGION WORLD
Demographic indicators
Total population (2005) 5,238,533,000 6,449,371,000
Population under 18 (2005) 1,928,976,000 2,183,143,000
Population under 5 (2005) 550,130,000 616,219,000
Survival
Life expectancy at birth (2005) 65 68
Neonatal mortality rate (under 28 days), per 1,000 live births (2000) 33 30
Infant mortality rate (under 1), per 1,000 live births (2005) 57 52
Under-5 mortality rate, per 1,000 live births (2005) 83 76
Under-5 mortality rate, average annual rate of reduction (1990-2005) 1.6 1.5
Maternal mortality ratio, per 100,000 live births (2000, adjusted) 440 400
Health and nutrition
Percentage of infants with low birthweight (1998-2005*) 16 15
Percentage of under-5s who are moderately or severely underweight (1996-2005*) 27 25
Percentage of population using improved drinking water sources (2004) 80 83
Urban 92 95 Rural 70 73
Percentage of population using adequate sanitation facilities (2004) 50 59
Percentage of 1-year-old children immunized (2005) against:
Tuberculosis (BCG) 83 83Diphtheria/pertussis/tetanus (DPT1) 87 88 Diphtheria/pertussis/tetanus (DPT3) 75 78 Polio (polio3) 76 78 Measles 75 77 Hepatitis B (hepB3) 54 55 Haemophilus influenzae (Hib3) - -
Education
Percentage of primary school entrants reaching grade 5 (administrative data; 2000-2004*) 82 83
Net primary school attendance ratio (1996-2005*)Male 78 78 Female 75 75
Net secondary school attendance ratio (1996-2005*)Male 46** 46 ** Female 43** 43 **
Adult literacy rate (2000-2004*) 79 80

INDICATOR REGION WORLD
Economic indicators
GNI per capita (US$, 2005) 1,801 7,002
Percentage of population living on less than $1 a day (1994-2004*) 22 21
Percentage share of central government expenditure (1994-2004*) allocated to:
Health 4 13 Education 10 6 Defence 10 12
Percentage share of household income (1994-2004*):Lowest 40 per cent 17 20 Highest 20 per cent 48 42
HIV/AIDS
Adult prevalence rate (15+ years, end 2005) 1.1 1.0
Estimated number of people (all ages) living with HIV (2005) 35,100,000 38,600,000
Estimated number of children (0-14 years) living with HIV (2005) 2,300,000 2,300,000
Estimated number of children (0-17 years) orphaned by AIDS (2005) - 15,200,000
Child protection
Birth registration (1999-2005*) 46** -Urban 62** -Rural 34** -
Child marriage (1987-2005*) 36** -Urban 23** -Rural 46** -
Child labour (5-14 years, 1999-2005*) 17** -Male 17** -Female 18** -
Women
Adult literacy parity rate (females as a percentage of males, 2000-2004*) 85 86
Antenatal care coverage (percentage, 1997-2005*) 71 71
Skilled attendant at delivery (percentage, 1997-2005*) 60 63
Lifetime risk of maternal death (2000) 1 in… 61 74
NOTES:
§ Also includes territories within each country category or regional group. Countries and territories in each country category or regional group are listedon page 136 of the Main Report.
* Data refer to the most recent year available during the period specified.
** Excludes China.
- Data not available.
39

LEAST DEVELOPED COUNTRIES§
40
INDICATOR REGION WORLD
Demographic indicators
Total population (2005) 759,389,000 6,449,371,000
Population under 18 (2005) 368,348,000 2,183,143,000
Population under 5 (2005) 119,352,000 616,219,000
Survival
Life expectancy at birth (2005) 53 68
Neonatal mortality rate (under 28 days), per 1,000 live births (2000) 43 30
Infant mortality rate (under 1), per 1,000 live births (2005) 97 52
Under-5 mortality rate, per 1,000 live births (2005) 153 76
Under-5 mortality rate, average annual rate of reduction (1990-2005) 1.2 1.5
Maternal mortality ratio, per 100,000 live births (2000, adjusted) 890 400
Health and nutrition
Percentage of infants with low birthweight (1998-2005*) 19 15
Percentage of under-5s who are moderately or severely underweight (1996-2005*) 35 25
Percentage of population using improved drinking water sources (2004) 59 83
Urban 79 95 Rural 51 73
Percentage of population using adequate sanitation facilities (2004) 36 59
Percentage of 1-year-old children immunized (2005) against:
Tuberculosis (BCG) 81 83Diphtheria/pertussis/tetanus (DPT1) 86 88 Diphtheria/pertussis/tetanus (DPT3) 76 78 Polio (polio3) 76 78 Measles 72 77 Hepatitis B (hepB3) 41 55 Haemophilus influenzae (Hib3) - -
Education
Percentage of primary school entrants reaching grade 5 (administrative data; 2000-2004*) 69 83
Net primary school attendance ratio (1996-2005*)Male 64 78 Female 59 75
Net secondary school attendance ratio (1996-2005*)Male 22 46 ** Female 20 43 **
Adult literacy rate (2000-2004*) 60 80
INDICATOR REGION WORLD
Economic indicators
GNI per capita (US$, 2005) 383 7,002
Percentage of population living on less than $1 a day (1994-2004*) 41 21
Percentage share of central government expenditure (1994-2004*) allocated to:
Health 5 13 Education 15 6 Defence 13 12
Percentage share of household income (1994-2004*):Lowest 40 per cent 11 20 Highest 20 per cent 57 42
HIV/AIDS
Adult prevalence rate (15+ years, end 2005) 2.7 1.0
Estimated number of people (all ages) living with HIV (2005) 11,700,000 38,600,000
Estimated number of children (0-14 years) living with HIV (2005) 1,100,000 2,300,000
Estimated number of children (0-17 years) orphaned by AIDS (2005) - 15,200,000
Child protection
Birth registration (1999-2005*) 32 -Urban 44 -Rural 28 -
Child marriage (1987-2005*) 51 -Urban 35 -Rural 57 -
Child labour (5-14 years, 1999-2005*) 29 -Male 30 -Female 28 -
Women
Adult literacy parity rate (females as a percentage of males, 2000-2004*) 71 86
Antenatal care coverage (percentage, 1997-2005*) 59 71
Skilled attendant at delivery (percentage, 1997-2005*) 35 63
Lifetime risk of maternal death (2000) 1 in… 17 74
NOTES:
§ Also includes territories within each country category or regional group. Countries and territories in each country category or regional group are listedon page 136 of the Main Report.
* Data refer to the most recent year available during the period specified.
** Excludes China.
- Data not available.
41

United Nations Children’s Fund
3 UN Plaza, New York, NY 10017, [email protected]
ISBN-13: 978-92-806-4064-9ISBN-10: 92-806-4064-X
© The United Nations Children’s Fund (UNICEF)
December 2006