the statistical features of radio bursts with fine structure at 1.1–7.6 ghz
TRANSCRIPT

Available online at www.sciencedirect.com
www.elsevier.com/locate/asr
Advances in Space Research 46 (2010) 1388–1393
The statistical features of radio bursts with fine structure at 1.1–7.6 GHz
Jing Huang ⇑, Yihua Yan, Yuying Liu
Key Laboratory of Solar Activity, National Astronomical Observatories, CAS, Beijing 100012, China
Received 14 April 2010; received in revised form 3 August 2010; accepted 5 August 2010
Abstract
This work presents the spectral and temporal features of radio bursts with fine structures (FSs) at broad band from 1.1 to 7.6 GHz.Fifteen burst events are studied with high frequency and temporal cadence observation from the Solar Broadband Radio Spectrometer atthree frequency bands. It is found that the amount and species of radio FS decrease with increasing frequency band; the pulsation, typeIII burst and continuum are most frequently recorded; almost in all the burst events, more radio FSs occur before the soft X-ray (SXR)maximum than after; at 1.1–2.06 GHz, all types of radio FSs have more before the SXR peak except fiber; at 2.6–3.8 GHz, pulsation,fiber and spike prefer to appear after the peak; the separation between neighboring emission lines of zebra pattern increases with increas-ing frequency and the magnetic field deduced from the whistler model is 29–86 G at 1.1–2.06 GHz and 89–268 G at 2.6–3.8 GHz.� 2010 COSPAR. Published by Elsevier Ltd. All rights reserved.
Keywords: Radio burst; Fine structure; Dynamic spectrum
1. Introduction
The emission of radio burst related to the active regionis produced by incoherent mechanism like gyrosynchrotronradiation and coherent mechanism like plasma emission.From the dynamic spectrum recorded by radio spectrome-ter, lots of radio FSs superimposed on the radio bursts arefound and studied (Slotjje, 1981; Isliker and Benz, 1994;Jiricka et al., 2001; Fu et al., 2004; Liu et al., 2006; Huangand Yan, 2007; Huang et al., 2008). According to the char-acter in the dynamic spectrum such as emitting frequency,duration, instantaneous bandwidth, frequency driftingrate, they are classified into different types and correspond-ing mechanisms are proposed based on the emission fea-tures. We can obtain some physical parameters like thelocation of the acceleration site, the velocity of energeticparticles, the local plasma density (and its scale length),the magnetic field (and its scale length) from the observa-tional features and theoretical models. During one burst
0273-1177/$36.00 � 2010 COSPAR. Published by Elsevier Ltd. All rights rese
doi:10.1016/j.asr.2010.08.010
⇑ Corresponding author. Tel.: +86 10 64860323; fax: +86 10 64863314.E-mail addresses: [email protected] (J. Huang), [email protected] (Y.
Yan), [email protected] (Y. Liu).
process, the same kind of radio FSs occurring at differentphases with different spectral parameters would indicatethe change of the physical condition of their sources. Thephysical parameters deduced from different types of radioFSs recorded at the same time can test and verify eachother. Radio FSs not only provide us diagnostic informa-tion of the solar activities, but also help us to understandthe evolution of the magnetic field, local plasma et al. dur-ing the burst process. Although the occurrence of radio FSsis conditional, random and accidental and the classificationof radio FSs from the dynamic spectrum depends on thetemporal/frequency resolution of the spectrometer, casestudy and statistical research on radio FSs are still neces-sary. From that we can validate the existing models andfind some new phenomena.
Huang et al. (2008) have studied the solar radio burstswith FSs during flare/CME events at 2.6–3.8 GHz bandrecorded by Solar Broadband Radio Spectrometer (SBRS).They made a survey on the radio FSs, radio bursts at2.84 GHz, flares, CMEs of 27 burst events and summarizedsome statistical results. As the radio emission at differentfrequency band comes from different altitude in the solaratmosphere, to fully understand the burst process and the
rved.
J. Huang et al. / Advances in Space Research 46 (2010) 1388–1393 1389
distribution of the radio FSs, we widened the frequencyband to lower and higher frequency band, respectively.SBRS has three observing frequency bands with high fre-quency and temporal resolutions: 1.1–2.06 GHz, 2.6–3.8 GHz and 5.2–7.6 GHz, which facilitates the study ofradio FSs at broader band. Based on the study of Huanget al. (2008), we made a further analysis on radio FSs at1.1–2.06 GHz and 5.2–7.6 GHz bands and a broader bandstatistical research of radio FSs. Section 2 shows the dataselection and some additional remarks. The statisticalresults are shown in Section 3. Finally, the discussion andconclusions are in Section 4.
2. Data selection
The observation of SBRS at 2.6–3.8 GHz band has 8 mstemporal and 10 MHz frequency resolution for the eventsHuang et al. (2008) have selected. The observation at5.2–7.6 GHz band is of 5 ms temporal and 20 MHz fre-quency resolution for the 27 burst events. At 1.1–2.06 GHz band, the temporal and frequency resolution ofthe spectrometer were 100 ms and 20 MHz before May14, 2002. After that, the spectrometer was advanced andthe temporal and frequency resolutions are upgraded tobe 5 ms and 4 MHz. We find that the events nos. 1–10listed in the Table 1 of Huang et al. (2008) have few radioFSs at 1.1–2.06 GHz band, which may be difficult to be dis-tinguished due to the worse data resolution. For the eventsnos. 11–27, the data resolutions at 1.1–2.06 GHz becomebetter, which can be comparable with that of 2.6–3.8 GHz and 5.2–7.6 GHz bands. In additional, two events(nos. 23–24) have no data at 1.1–2.06 GHz. Finally, we
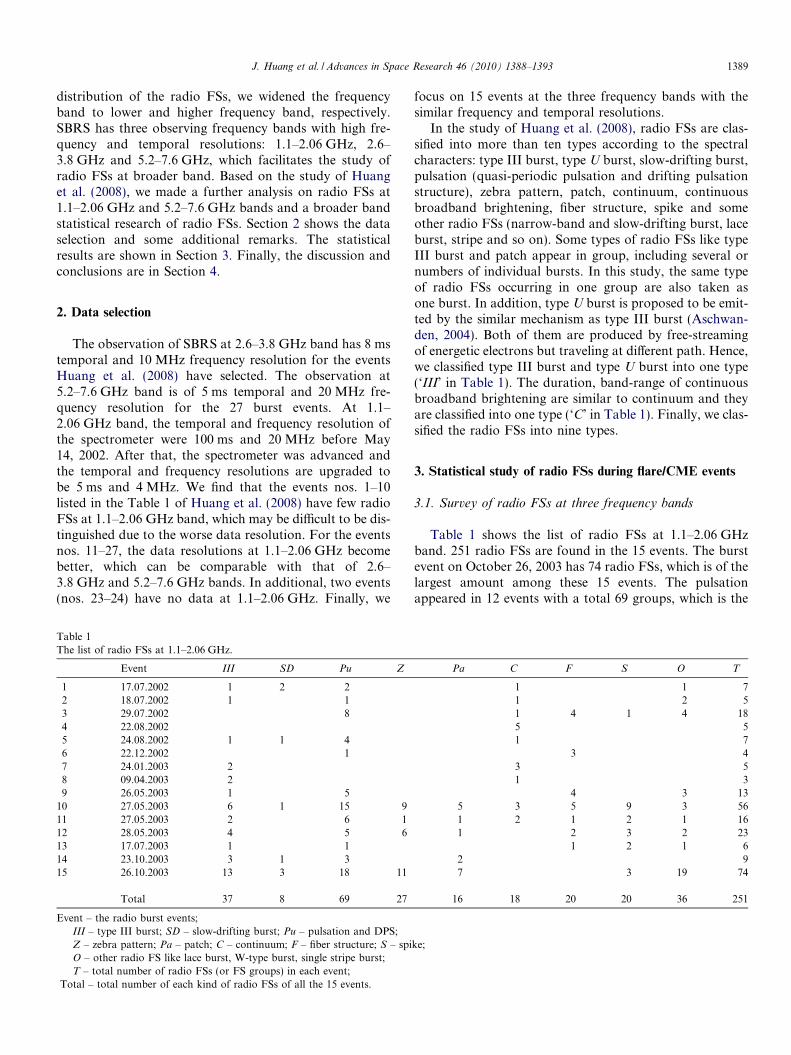
Table 1The list of radio FSs at 1.1–2.06 GHz.
Event III SD Pu Z
1 17.07.2002 1 2 22 18.07.2002 1 13 29.07.2002 84 22.08.20025 24.08.2002 1 1 46 22.12.2002 17 24.01.2003 28 09.04.2003 29 26.05.2003 1 5
10 27.05.2003 6 1 15 911 27.05.2003 2 6 112 28.05.2003 4 5 613 17.07.2003 1 114 23.10.2003 3 1 315 26.10.2003 13 3 18 11
Total 37 8 69 27
Event – the radio burst events;III – type III burst; SD – slow-drifting burst; Pu – pulsation and DPS;Z – zebra pattern; Pa – patch; C – continuum; F – fiber structure; S – spiO – other radio FS like lace burst, W-type burst, single stripe burst;T – total number of radio FSs (or FS groups) in each event;
Total – total number of each kind of radio FSs of all the 15 events.
focus on 15 events at the three frequency bands with thesimilar frequency and temporal resolutions.
In the study of Huang et al. (2008), radio FSs are clas-sified into more than ten types according to the spectralcharacters: type III burst, type U burst, slow-drifting burst,pulsation (quasi-periodic pulsation and drifting pulsationstructure), zebra pattern, patch, continuum, continuousbroadband brightening, fiber structure, spike and someother radio FSs (narrow-band and slow-drifting burst, laceburst, stripe and so on). Some types of radio FSs like typeIII burst and patch appear in group, including several ornumbers of individual bursts. In this study, the same typeof radio FSs occurring in one group are also taken asone burst. In addition, type U burst is proposed to be emit-ted by the similar mechanism as type III burst (Aschwan-den, 2004). Both of them are produced by free-streamingof energetic electrons but traveling at different path. Hence,we classified type III burst and type U burst into one type(‘III’ in Table 1). The duration, band-range of continuousbroadband brightening are similar to continuum and theyare classified into one type (‘C’ in Table 1). Finally, we clas-sified the radio FSs into nine types.
3. Statistical study of radio FSs during flare/CME events
3.1. Survey of radio FSs at three frequency bands
Table 1 shows the list of radio FSs at 1.1–2.06 GHzband. 251 radio FSs are found in the 15 events. The burstevent on October 26, 2003 has 74 radio FSs, which is of thelargest amount among these 15 events. The pulsationappeared in 12 events with a total 69 groups, which is the
Pa C F S O T
1 1 71 2 51 4 1 4 185 51 7
3 43 51 3
4 3 135 3 5 9 3 561 2 1 2 1 161 2 3 2 23
1 2 1 62 97 3 19 74
16 18 20 20 36 251
ke;

Table 2The list of radio FSs at 2.6–3.8 GHz.
Event III SD Pu Z Pa C F S O T
1 17.07.2002 1 3 1 52 18.07.2002 2 23 29.07.2002 1 3 44 22.08.2002 1 1 2 1 55 24.08.2002 1 16 22.12.2002 3 37 24.01.2003 1 1 28 09.04.2003 1 19 26.05.2003 2 2
10 27.05.2003 1 1 2 411 27.05.2003 1 1 3 2 2 1 1012 28.05.2003 4 5 7 4 1 2113 17.07.2003 1 1 214 23.10.2003 1 3 415 26.10.2003 1 1 1 1 4
Total 6 5 17 9 4 22 1 4 2 70
The abbreviations of radio FSs are same as listed in Table 1.
1390 J. Huang et al. / Advances in Space Research 46 (2010) 1388–1393
most frequent radio FS. The next one is the type III burstwith positive and negative frequency drifting rate and wefound 37 groups in 12 events. 36 rare types of radio FSslike W-type burst, lace burst and stripe are recorded in nineevents. Table 2 shows the radio FSs at 2.6–3.8 GHz band.70 radio FSs are recorded in this frequency band. Theevent May 28, 2003 has 21 radio FSs, which is the largestamount at this frequency band. Continuum is the most fre-quently occurring radio FS and 22 continua are recorded.The radio FSs at 5.2–7.5 GHz are much less than the othertwo bands. In most events, only continuum can be distin-guished. We have checked that if the lower frequencycadence (20 MHz) leads to this. However, we found sometype III bursts and slow-drifting bursts in the events on2002 July 17–18. Hence, radio FSs can still be classifiedat 5.2–7.6 GHz. It is real that less radio FSs occur aroundthis higher frequency band.
Fig. 1(a) shows the total amount of radio FSs in eachevent at 1.1–2.06 GHz and 2.6–3.8 GHz bands. It can beseen that the total number of radio FSs in each event at
Fig. 1. (a) The total number of radio FSs in each event at 1.1–2.06 GHz and 2event at 1.1–2.06 GHz and 2.6–3.8 GHz bands.
1.1–2.06 GHz band is larger than that of 2.6–3.8 GHzband. Especially for the events nos. 10 and 15, the totalnumbers of radio FSs at 1.1–2.06 GHz band are 56 and74, but at 2.6–3.8 GHz band, only four radio FSs arerecorded. Fig. 1(b) shows the total number of radio FStype in each event at the two frequency bands. It can beseen that the species of radio FS at 1.1–2.06 GHz is largerthan that at 2.6–3.8 GHz except one event.
3.2. The occurring probability of radio FSs
Fig. 2 shows the total amount of each type of radio FSsin the 15 events. X-axis is name of radio FSs as listed inTable 1. Y-axis is the total amount of each type of radioFSs at 1.1–2.06 GHz (solid line), 2.6–3.8 GHz (dotted line)and the sum of the two bands (asterisk). It can be seen thatalmost all types of radio FSs at 1.1–2.06 GHz band aremuch more than that at 2.6–3.8 GHz band, especially forthe type III burst, pulsation and the other rare FSs. How-ever, we have more continuum at 2.6–3.8 GHz. From thesum of the two frequency bands (asterisk), it is found thatthe amount of pulsation is much larger than that of others.The next are type III burst, zebra pattern, continuum andsome rare radio FSs.
Fig. 3 shows the percentage of burst events containingeach type of radio FS. X-axis is the same to Fig. 2. Y-axisis the percentage of event containing every type of radio FSat 1.1–2.06 GHz (solid line), 2.6–3.8 GHz (dotted line) andfor the sum of the two bands (asterisk). The number ofburst events containing each type of radio FSs at 1.1–2.06 GHz is larger than that at 2.6–3.8 GHz band besidesthe slow-drifting burst, zebra pattern and continuum,which have the same occurrence rate at the two bands.Hence, the type III burst, pulsation, fiber, spike and theother rare type FSs are easy to be recorded at lower band.Although the continuum has the same occurrence at thetwo bands, compared with the other radio FSs at 2.6–3.8 GHz band, it is the most frequent radio FS at higherfrequency (2.6–3.8 GHz and 5.2–7.6 GHz). For the twobands, type III burst, pulsation and continuum are
.6–3.8 GHz bands. (b) The total number of radio FS type included in each

Fig. 2. The total amount of each type of radio FSs in the 15 events at 1.1–2.06 GHz (solid line), 2.6–3.8 GHz (dotted line) and for the sum of the twofrequency bands (asterisk). X-axis is the type of radio FSs, which are sameas listed in Table 1.
Fig. 3. The percentage of burst events containing each type of radio FSsat 1.1–2.06 GHz (solid line), 2.6–3.8 GHz (dotted line) and for the twofrequency bands (asterisk). X-axis is the type of radio FSs, which are sameas listed in Table 1. Y-axis is the percentage of burst events containingeach kind of radio FSs.
Fig. 4. The temporal distribution of each type of radio FSs at 1.1–2.06 GHz (solid line), 2.6–3.8 GHz (dotted line) and for the two frequencybands (asterisk). X-axis is the type of radio FSs, which are same as listed inTable 1. Y-axis is the percentage of each kind of radio FSs occurringbefore the SXR maximum in the 15 events.
J. Huang et al. / Advances in Space Research 46 (2010) 1388–1393 1391
recorded in 14, 13, 13 burst events, respectively. They havethe largest occurring probability around the two bands.
3.3. The temporal distribution of radio FSs
At 1.1–2.06 GHz band, 13 events have more than 50%radio FSs before the SXR maximum and six of them haveno radio FS during the decay phase of the SXR flare. At2.6–3.8 GHz, 14 events have more than 50% radio FSsoccurring before the SXR maximum. Fig. 4 shows the timedistribution of each type of radio FSs at 1.1–2.06 GHz
(solid line), 2.6–3.8 GHz (dotted line) and for the two fre-quency bands (asterisk). X-axis is the type of radio FSs;Y-axis is the percentage occurring before the SXR maxi-mum to the total number of each kind of radio FSs. At1.1–2.06 GHz (solid line), all radio FSs have more than50% occurring before the SXR peak except fiber. At 2.6–3.8 GHz, pulsation, fiber and spike are recorded muchmore after the SXR peak. The temporal distribution ofslow-drifting burst, zebra pattern, continuum and somerare radio FSs are similar at the two bands. For the twofrequency bands, almost all of slow-drifting burst and con-tinuum, about 70% of type III burst and spike appearbefore the SXR peak. Fiber prefers to occur after theSXR peak.
3.4. The spectral distribution of zebra pattern
The spectral features of radio FSs around these fre-quency bands have been introduced by Isliker and Benz(1994), Jiricka et al. (2001) and Fu et al. (2004). In thiswork, we prefer to report the difference of spectral charac-ter between the two frequency bands. Zebra pattern is clas-sified by several quasi-parallel emission lines. Someexamples of dynamic spectrum can be found in the paperof Huang et al. (2008). Fig. 5 shows the spectral distribu-tion of 27 zebra patterns in 15 events at 1.1–2.06 GHz bandand 34 ones in 27 events at 2.6–3.8 GHz listed in Huanget al. (2008). We expand the number of zebra pattern at2.6–3.8 GHz to get a more believable statistical result. X-axis is the central frequency of the whole emission bandand Y-axis is the separation between neighboring emissionlines (DF) at the center of each zebra patten at 1.1–2.06 GHz (+) and 2.6–3.8 GHz (M). It can be seen thatthe DF increases with increasing frequency. Fig. 6 shows

Fig. 5. The DF distribution of zebra patterns. X-axis is the centralfrequency of the zebra pattern; Y-axis is the DF around the center of zebrapattern.
Fig. 6. The ratio of DF to the central frequency of zebra patterns. X-axisis the central frequency of the zebra pattern; Y-axis is the ratio of DFaround the center of zebra pattern to the central frequency.
1392 J. Huang et al. / Advances in Space Research 46 (2010) 1388–1393
the ratio of DF to the central frequency (radiant fre-quency). The results at the two frequency bands are scat-tered around 0.01–0.05, but the trend that the relativebandwidth increases with increasing frequency can stillexist. Several models have been proposed to explain zebrapattern and its superfine structures (Zheleznyakov andZlotnik, 1975; Kuijpers, 1975; Chernov, 1976; Mollwo,1998; Ledenev et al., 2001, 2006; Barta and Karlicky,2006; Kuznetsov and Tsap, 2007; Chen and Yan, 2007).From whistler model (Chernov et al., 2006), it is assumedthat Mfea � fw � 0.1fB, where Mfea is the frequency separa-tion between two neighboring emitted–absorbed lines, fw
is the frequency of whistler wave, and fB is the electrongyrofrequency. The value of Mfea is assumed to be half ofDF. At 1.1–2.06 GHz band, DF � 16–48 MHz, the mag-
netic field deduced from them is about 29–86 G. At 2.6–3.8 GHz, DF � 50–150 MHz and B � 89–268 G.
4. Discussion and conclusions
Based on the study of radio FSs at 2.6–3.8 GHz band inHuang et al. (2008), we make a further survey of radio FSsat 1.1–2.06 GHz and 5.2–7.6 GHz bands to study the radioFSs in a broader band. Considering the improvement ofdata resolutions at 1.1–2.06 GHz band, we selected 15events with comparable temporal and frequency resolu-tions at the three frequency bands from the previous 27events listed in Huang et al. (2008). It is found that:
(1) The amount and species of radio FSs included in eachevent decrease with increasing frequency. At 1.1–2.06 GHz and 2.6–3.8 GHz bands, we have recorded251 and 70 radio FSs, respectively. At the highest fre-quency band (5.2–7.5 GHz), only event nos. 1–2 havesome type III bursts, slow-drifting bursts and con-tinua. For the others, we just found some continua.
(2) The amount of each type of radio FSs in 15 events at1.1–2.06 GHz band is larger than that of 2.6–3.8 GHzexcept continuum. At 1.1–2.06 GHz, pulsation hasthe largest amount but at 2.6–3.8 GHz, continuumis the most frequent one. For the two bands, pulsa-tion is of the largest amount. The next are type IIIburst, zebra pattern, continuum and some rare radioFSs like lace burst, single stripe and W-type burst.
(3) The percentage of burst events containing each typeof radio FSs at 1.1–2.06 GHz is larger than that of2.6–3.8 GHz except slow-drifting burst, zebra patternand continuum, which have the same occurring prob-ability at the two frequency bands. Type III burst,pulsation and continuum are recorded in more than13 events in the two frequency bands.
(4) Most radio FSs have half of the total number occur-ring before the SXR maximum at 1.1–2.06 GHzexcept fiber. Especially, almost all of slow-driftingburst, continuum and spikes occur before the SXRmaximum. At 2.6–3.8 GHz, fiber prefer to appearafter the SXR peak and pulsation appear both beforeand after the SXR peak.
(5) The separation between neighboring emission lines atthe center of zebra pattern increases with increasingfrequency. The magnetic field deduced from the whis-tler model is 29–86 G form 1.1–2.06 GHz and 89–268 G from 2.6–3.8 GHz, which is also increased withincreasing frequency (i.e. decreasing altitude in thesolar atmosphere). The relative ratio of separationto the emitting frequency is scattered around 0.01–0.05 at the two frequency bands, but the trend thatthe value increases with increasing frequency can stillexist.
Kliem et al. (2000) interpreted DPS as a signature ofdynamic phase of magnetic reconnection in a large-scale

J. Huang et al. / Advances in Space Research 46 (2010) 1388–1393 1393
current sheet. Tan et al. (2007) found that 83% DPS areassociated with CMEs or ejection events. In this survey,we found the total number of pulsation is the largest onein the nine types of radio FSs and 13 of 15 events havepulsation, which indicates that pulsations are of directand close relationship with flare/CME events. We foundmore events including type III burst, spike and some raretypes like W-type burst, single stripe et al. at 1.1–2.06 GHz, which prefer to appear before the SXR maxi-mum. Type III burst is proposed to be produced by free-streaming energetic electrons with coherent mechanism(Aschwanden, 2004); theoretical models of radio nar-row-band spikes emission are based mainly on plasmaemission and acceleration processes (Kuijpers et al.,1981) or on electron–cyclotron maser emission (Asch-wanden, 1990); some rare types like W-type burstrecorded during the radio maximum with big flux maybe also emitted by coherent mechanism. These radioFSs are relative with energetic electrons in different ways,hence, they are easy to occur before or during the SXRmaximum, which may indicate the main phase of energyrelease or particle acceleration and transportation.
Radio bursts at different frequency are produced at dif-ferent altitude in the heliosphere with different mecha-nisms. Radio emission at lower frequency band iscorresponding to the higher altitude in the heliosphere.Much more and abundant radio FSs appearing at lowerfrequency band indicates that the physical conditionaround higher altitude can be easy to provide appropriatecircumstance for them. It may be due to the complex con-figuration of magnetic field, local plasma and energetic par-ticles or their fast and changeful evolutions. The regionconnected with radio FSs at lower frequency bands maybe involved with the reconnection sites and the particletransportation path. At higher frequency band, fewer radioFSs are recorded and continuum is the most frequentlyoccurring burst. The radio emission around higher fre-quency may be mainly produced at the lower part of theflare loops, where the magnetic structure and other param-eters may be much more simple. The continuum aroundhigher frequency could be emitted by the trapped electronsthrough gyrosynchrotron radiation.
Acknowledgements
We thank the GOES team for the data of SXR flare andthe SOHO/LASCO team for the CME data. This work issupported by NSFC Grants 10921303, 10903013,10873021, CAS-NSFC Key Project Grant No. 10778605,the National Basic Research Program of the MOST GrantNo. 2006CB806301, and the Young Researcher Grant ofNational Astronomical Observatories, Chinese Academyof Sciences (Grand 0835032002).
References
Aschwanden, M.J. The saturation of the electron–cyclotron maserinstability and the interpretation of solar millisecond spikes. Astron.Astrophys. 237, 512–523, 1990.
Aschwanden, M.J.. Physics of the Solar Corona. Praxis Publishing Ltd.,Chichester and Springer-Verlag, Berlin, 2004.
Barta, M., Karlicky, M. Interference patterns in solar radio spectra: high-resolution structural analysis of the corona. Astron. Astrophys. 450,359–364, 2006.
Chen, B., Yan, Y.H. On the origin of the zebra pattern with pulsatingsuperfine structures on 21 April 2002. Solar Phys. 246, 431–443, 2007.
Chernov, G.P. Microstructure in continuous emission of type IV meterbursts. Modulation of continuous emission by wave packets ofwhistlers. Sov. Astron. 20, 582–589, 1976.
Chernov, G.P., Sych, R.A., Yan, Y.H., Fu, Q.J., Tan, Ch.M., Huang,G.L., et al. Multi-site spectrographic and heliographic observations ofradio fine structure on April 10, 2001. Solar Phys. 237, 397–418, 2006.
Fu, Q.J., Ji, H.R., Qin, Z.H., Xu, Z.C., Xia, Zh.G., Wu, H.A., et al. A newsolar broadband radio spectrometer (SBRS) in China. Solar Phys. 222,167–173, 2004.
Huang, J., Yan, Y.H. An analysis of solar radio burst events on December1, 2004. Adv. Space Res. 39, 1441–1446, 2007.
Huang, J., Yan, Y.H., Liu, Y.Y. A study of solar radio bursts with finestructures during flare/CME events. Solar Phys. 253, 143–160, 2008.
Isliker, H., Benz, A.O. Catalogue of 1–3 GHz solar flare radio emission.Astron. Astrophys. Suppl. Ser. 104, 145–160, 1994.
Jiricka, K., Karlichy, M., Meszarosova, H., Snızek, V. Global statistics of0.8–2.0 GHz radio bursts and fine structures observed during 1992–2000 by the Ond?ejov Radiospectrograph. Astron. Astrophys. 375,243–250, 2001.
Kliem, B., Karlicky, M., Benz, A.O. Solar flare radio pulsations as asignature of dynamic magnetic reconnection. Astron. Astrophys. 360,715–728, 2000.
Kuijpers, J. Generation of Intermediate Drift Bursts in Solar Type IVRadio Continua Through Coupling of Whistlers and LangmuirWaves. Ph.D. Thesis, Utrecht University, 1975.
Kuijpers, J., Van der Post, P., Slotjje, C. Runaway acceleration in a radioflare. Astron. Astrophys. 103, 195–331, 1981.
Kuznetsov, A.A., Tsap, Y.T. Loss-cone instability and formation of zebrapatterns in type IV solar radio bursts. Solar Phys. 241, 127–143, 2007.
Ledenev, V.G., Karlicky, M., Yan, Y.H., Fu, Q.J. An estimation of thecoronal magnetic field strength from spectrographic observations inthe microwave range. Solar Phys. 202, 71–79, 2001.
Ledenev, V.G., Yan, Y.H., Fu, Q.J. Interference mechanism of ‘zebra-pattern’ formation in solar radio emission. Solar Phys. 233, 129–139,2006.
Liu, Y.Y., Fu, Q.J., Yan, Y.H., Tan, Ch.M. New results obtained fromthe solar radio spectrometer in decimeter wavelength with super-hightemporal resolution. Publ. Astron. Obs. China 3, 119–127, 2006.
Mollwo, L. The magneto-hydrostatic field in the region of zebra patternsin solar type IV dm-bursts. Solar Phys. 116, 323–348, 1998.
Slotjje, C.. Atlas of Fine Structures of Dynamic Spectra of Solar Type IV-Dm and Some Type II Radio Bursts. Publ. Utrech Observatory,Utrecht, 1981.
Tan, Ch.M., Yan, Y.H., Liu, Y.Y., Fu, Q.J., Wang, S.J., Ji, H.R., et al.Statistical study of radio drifting pulsation structures with associatedCMEs and other observations 2008. Adv. Space Res. 41, 969–975,2007.
Zheleznyakov, V.V., Zlotnik, E.Y. Cyclotron wave instability in thecorona and origin of solar radio emission with fine structure. III.Origin of zebra-pattern. Solar Phys. 44, 461–470, 1975.