the statistical properties of hedge fund index returns and
TRANSCRIPT
THE BUSINESS SCHOOL FOR FINANCIAL MARKETS
The University of Reading
The Statistical Properties of Hedge Fund Index Returns
and their Implications for Investors
ISMA Centre Discussion Papers In Finance 2001-09 This Version: November 10th 2001
Chris Brooks Associate Professor of Finance,
ISMA Centre, University of Reading and
Harry M. Kat Associate Professor of Finance,
ISMA Centre, University of Reading
Copyright 2001. All rights reserved.
The University of Reading • ISMA Centre • Whiteknights • PO Box 242 • Reading RG6 6BA • UK Tel: +44 (0)118 931 8239 • Fax: +44 (0)118 931 4741 Email: [email protected] • Web: www.ismacentre.rdg.ac.uk Director: Professor Brian Scott-Quinn, ISMA Chair in Investment Banking The ISMA Centre is supported by the International Securities Market Association

The contents of the paper are presented to the reader in good faith, and neither the authors, the ISMA Centre, nor the University, will be held responsible for any losses, financial or otherwise, resulting from actions taken on the basis of its content. Any persons reading the paper are deemed to have accepted this.
Abstract The monthly return distributions of many hedge fund indices exhibit highly unusual skewness and kurtosis properties as well as first-order serial correlation. This has important consequences for investors. We demonstrate that although hedge fund indices are highly attractive in mean-variance terms, this is much less the case when skewness, kurtosis and autocorrelation are taken into account. Sharpe Ratios will substantially overestimate the true risk-return performance of (portfolios containing) hedge funds. Similarly, mean-variance portfolio analysis will over-allocate to hedge funds and overestimate the attainable benefits from including hedge funds in an investment portfolio. We also find substantial differences between indices that aim to cover the same type of strategy. Investors’ perceptions of hedge fund performance and value added will therefore strongly depend on the indices used. Please address all correspondence to: Harry M. Kat The University of Reading ISMA Centre Whiteknights Reading RG6 6BA Tel. +44-118-9318239 E-mail: [email protected] JEL Classification: Keywords: hedge fund, hedge fund index, skewness, kurtosis, autocorrelation, Sharpe ratio, mean-variance analysis.
Discussion Paper 2001-09
© Chris Brooks and Harry Kat
1
I. Introduction Hedge funds are pooled investment vehicles that are privately organised, administered by professional investment managers and not widely available to the general investing public. Due to their private nature, hedge funds have less restrictions on the use of leverage, short-selling and derivatives than more regulated vehicles such as mutual funds. This allows them to follow investment strategies that are significantly different from the non-leveraged, long-only strategies traditionally followed by investors. Although they have been around for quite a while, over the past few years especially wealthy private investors have shown great interest in hedge funds. As a result, the number of funds has increased dramatically. It is estimated that currently there are around 6,000 hedge funds with an estimated $400 billion in capital and $1 trillion in total assets. Not all these funds are of similar size, however. Around 80% of hedge funds are smaller than $100 million and around 50% are smaller than $25 million, which reflects the high number of recent new entries. Many institutional investors are currently in the process of deciding whether or not to invest in hedge funds and if so, in which type(s). Most of them will do so by comparing the mean-variance characteristics of portfolios with and without hedge funds where the hedge fund component will typically be represented by a publicly available hedge fund index. In this paper we show that there are two important problems with this approach. First, there are significant differences between the indices supplied by different data providers. Conclusions will therefore heavily depend on the choice of index. Second, the statistical properties of these indices are highly unusual. As we will see, monthly index returns are far from normally distributed. This means that evaluating portfolios only on their monthly means and variances skips over a number of other important properties, which need not be advantageous to investors. In addition, monthly returns show significant serial correlation, which may lead one to seriously underestimate true volatility and correlation. In the next two sections we briefly discuss the main types of hedge fund strategies as well as the main data providers. In section IV we analyse the returns on 48 different hedge fund indices over the period January 1995 – April 2001. We look at these indices’ unconditional return distributions, possible serial correlation and ARCH effects, as well as their correlations with other asset classes. In section V we discuss the implications for performance measurement while in section VI we discuss the implications for portfolio analysis. Section VII concludes.
II. Hedge Fund Strategies Hedge fund investment strategies tend to be quite different from the strategies followed by traditional money managers. Moreover, in principle every fund follows its own proprietary strategy. This means that hedge funds are a very heterogeneous group. There are, however, a number of ideal types to be distinguished, comprising three main groups. So-called Global funds concentrate on economic change around the world and sometimes make extensive use of leverage and derivatives. This type of fund is responsible for the most media attention and includes well-known names such as George Soros's Quantum Fund and Julian Robertson's Tiger Fund Management. Event-Driven
Discussion Paper 2001-09
© Chris Brooks and Harry Kat
2
funds trade the securities of companies in special situations such as a reorganisation or a merger. Market Neutral funds are the largest group. These funds simultaneously enter into long as well as short positions. Some use fundamental analysis to decide which assets to buy and which to short. Others use technical analysis, statistical analysis and/or complex theoretical models. Within these three groups it is customary to distinguish a number of subgroups. We discuss the most important briefly below.1
Global: International - Funds that pick stocks in favoured markets around the world. These make less use of derivatives than macro funds (see below). Global: Emerging Markets - Funds that focus on emerging and less mature markets. These funds tend to be long only because in many emerging markets short selling is not permitted and futures and options are not available. Global: Macro – Funds that aim to profit from major economic trends and events in the global economy, typically large currency and interest rate shifts. These funds make extensive use of leverage and derivatives. Event Driven: Distressed Securities - Funds that trade the securities of companies in reorganization and/or bankruptcy, ranging from senior secured debt to common stock. Event Driven: Risk Arbitrage - Funds that trade the securities of companies involved in a merger or acquisition, typically buying the stocks of the company being acquired while shorting the stocks of its acquirer. Market Neutral: Long/Short Equity – Funds that invest on both the long and the short side of the equity market. Unlike equity market neutral funds (see below), the portfolio may not always have zero market risk. Most funds have a long bias. Market Neutral: Convertible arbitrage - Funds that buy undervalued convertible securities, while hedging (some of) the intrinsic risks. Market Neutral: Equity - Funds that are simultaneously long and short matched equity positions, i.e. portfolios are designed to have zero market risk. Leverage is often applied to enhance returns. Market Neutral: Fixed Income - Funds that exploit pricing anomalies in the global market for interest rate securities and their derivatives. A separate class of funds is formed by so-called Funds of Funds. These are funds that invest in other hedge funds. Some limit themselves to one specific type of hedge fund but most invest across the board. The idea behind funds of funds is to offer investors a “hassle-free” alternative to constructing a basket of hedge funds themselves. In addition, many claim to be able to do a better job as they employ experienced managers to select funds, carry out due diligence and continuously monitor the portfolio. As we will see later, on average funds of funds appear unable to make up for the fees charged, which makes them quite an expensive way to manage one’s hedge fund investments.
III. Hedge Fund Data With the industry still in its infancy and hedge funds under no formal obligation to disclose their results, gaining insight in the performance characteristics of hedge funds is not straightforward. Fortunately, many funds release performance as well as other administrative information to attract new and to accommodate existing investors. These data are collected by a small number of data vendors and fund advisors, some of which make their data available to qualifying investors. Subscribing to these databases can be quite expensive. Many investors will therefore initially choose to
Discussion Paper 2001-09
© Chris Brooks and Harry Kat
3
work with the monthly performance indices that are calculated from these databases and which are freely available on the internet. Most data vendors and advisors calculate one overall or aggregate index as well as a number of sub-indices, corresponding to the various types of hedge fund strategies discussed earlier. In what follows we briefly discuss these indices and the websites where they can be obtained.2 HFR (www.hfr.com) Hedge Fund Research (HFR) is a hedge fund research and consulting firm that has collected data on around 4,000 different hedge funds. HFR uses a subset of around 1,500 funds to calculate 33 indices. These indices reflect the monthly net of fee returns on equally weighted baskets of funds. ZURICH CAPITAL MARKETS (www.marhedge.com) The Zurich Capital Markets database and the indices calculated from it were originally developed and compiled by Managed Accounts Reports (MAR) but were sold to Zurich Capital Markets in March 2001. The database contains information on around 1,500 hedge funds, which are used to calculate 19 indices. The latter reflect the median monthly net of fee returns on the funds in the indices. CSFB/TREMONT (www.hedgeindex.com) The CSFB/Tremont indices are based on the TASS database which tracks around 2,600 funds. Using a subset of around 650 funds, CSFB/Tremont calculates 10 indices. Contrary to other indices, the CSFB/Tremont indices reflect the monthly net of fee return on an asset-weighted basket of funds. Large funds therefore have a larger influence on the index than smaller funds. There are strict rules for fund selection. The universe consists only of funds with a minimum of USD 10 million under management and a current audited financial statement. Funds are re-selected quarterly as necessary. HENNESSEE (www.hennesseegroup.com) The Hennessee Group is a hedge fund advisory firm that maintains a database of around 3,000 funds. Based on a subset of about 500 funds, Hennessee calculates 23 indices that reflect the monthly net of fee returns on equally-weighted baskets of funds. VAN (www.vanhedge.com) Van Hedge Fund Advisors is a hedge fund advisory firm that has collected data on about 3,400 funds. Using a subset of around 500 funds Van calculates 15 indices. These indices reflect the monthly net of fee returns on equally-weighted baskets of funds. ALTVEST (www.altvest.com) Altvest is a hedge fund website that aims to provide investors with real-time information on alternative investments. The Altvest database contains information on around 2000 hedge funds. From the monthly net of fee returns of these funds Altvest calculates 14 equally-weighted indices.
Discussion Paper 2001-09
© Chris Brooks and Harry Kat
4
TUNA (www.hedgefund.net) Hedgefund.net is a hedge fund website that offers investors free hedge fund information and performance data. The database covers around 1,800 hedge funds and forms the basis for the calculation of 35 indices. The latter reflect the monthly net of fee returns on equally-weighted baskets of funds. An important point concerning hedge funds is the possibility of survivorship bias. With around 30% of newly established funds not surviving the first three years, hedge fund attrition is relatively high. With lack of performance being one of the drivers, not including defunct funds may lead to overestimation of true returns.3 Fortunately, most data vendors do incorporate funds that have ceased to exist in their index calculation and thereby avoid the problem of survivorship bias. The only exception is Tuna, where, if a fund is shut down, it is completely removed from the indices. Finally, it should be noted that the information collected by the above parties is supplied directly by the fund managers and/or their administrators. Although some data providers attempt to perform regular checks, the available data is best thought of as un-audited and not independently verified. Another point concerns the lack of plausibility of some indices' history. For example, over the 136-month period from January 1990 until April 2001 the Zurich Market Neutral Median has produced a return of exactly 1.00% in no less than 13 separate months. Obviously, this raises serious doubts about the way some of these indices are calculated.
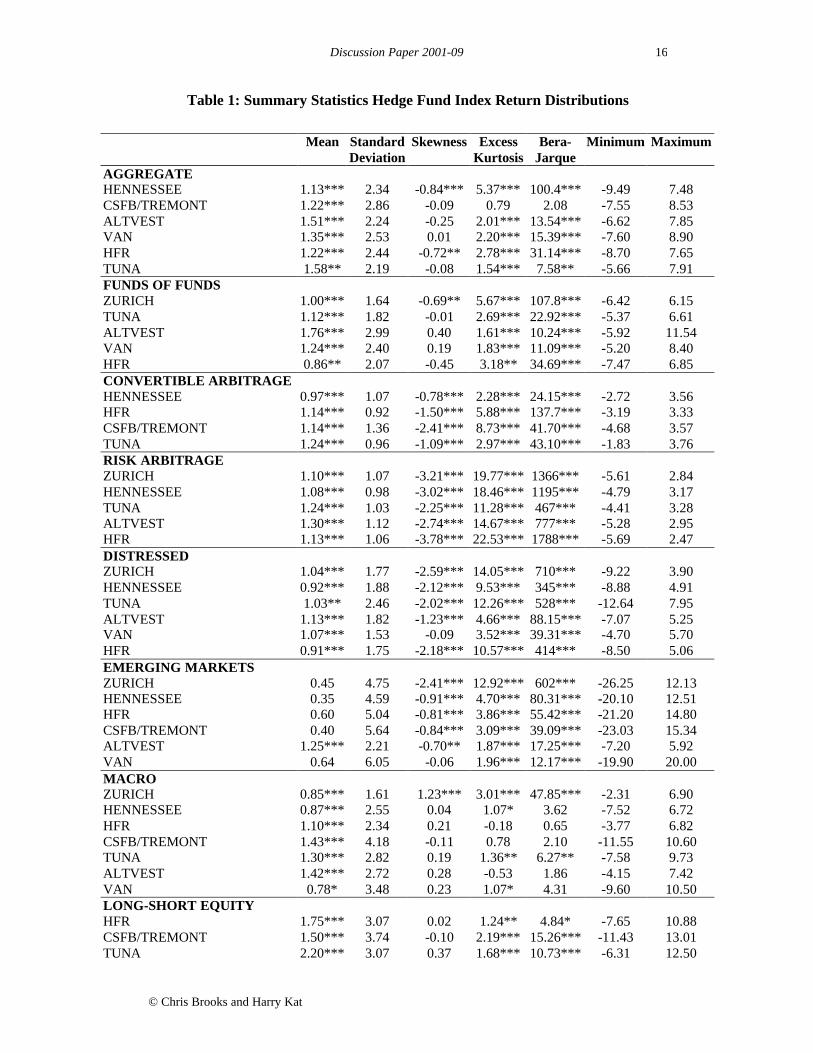
IV. Hedge Fund Index Returns We study the monthly returns of 48 hedge fund indices constructed by the above data providers spanning the period January 1995 – April 2001.4 This means that our data set includes the Asian, Russian and LTCM crises as well as the end of the IT bubble. The indices in our sample are classified into the following categories: Aggregate, Funds of Funds, Convertible Arbitrage, Risk Arbitrage, Distressed, Emerging Markets, Macro, Long-Short Equity, and Equity Market Neutral. Some summary statistics for the returns of each index under these headings are provided in Table 1. For comparison, statistics for the S&P 500, the Dow Jones Industrial Average, the Russell 2000 mutual fund index, the NASDAQ and the Lehman Brothers Government Bond index returns are presented in the last panel of Table 1. << Insert Table 1 >> To those familiar with the typical results from time series analysis of financial asset returns, the hedge fund returns presented in Table 1 may seem quite bizarre. Although on average indices with a higher standard deviation also offer a higher mean, compared to stocks and bonds all except the Macro and Emerging Markets indices combine a relatively high mean with a relatively low standard deviation. The indices under the Convertible Arbitrage, Risk Arbitrage and Equity Market Neutral headings all have standard deviations similar to bonds but means that are substantially higher. The Long-Short Equity indices have standard deviations that are considerably lower than those of the stock market indices but their means are again much higher. This would be clear proof of market inefficiency were it not that compared to stocks and bonds many hedge fund indices also exhibit relatively low skewness and high kurtosis. Especially

Discussion Paper 2001-09
© Chris Brooks and Harry Kat
5
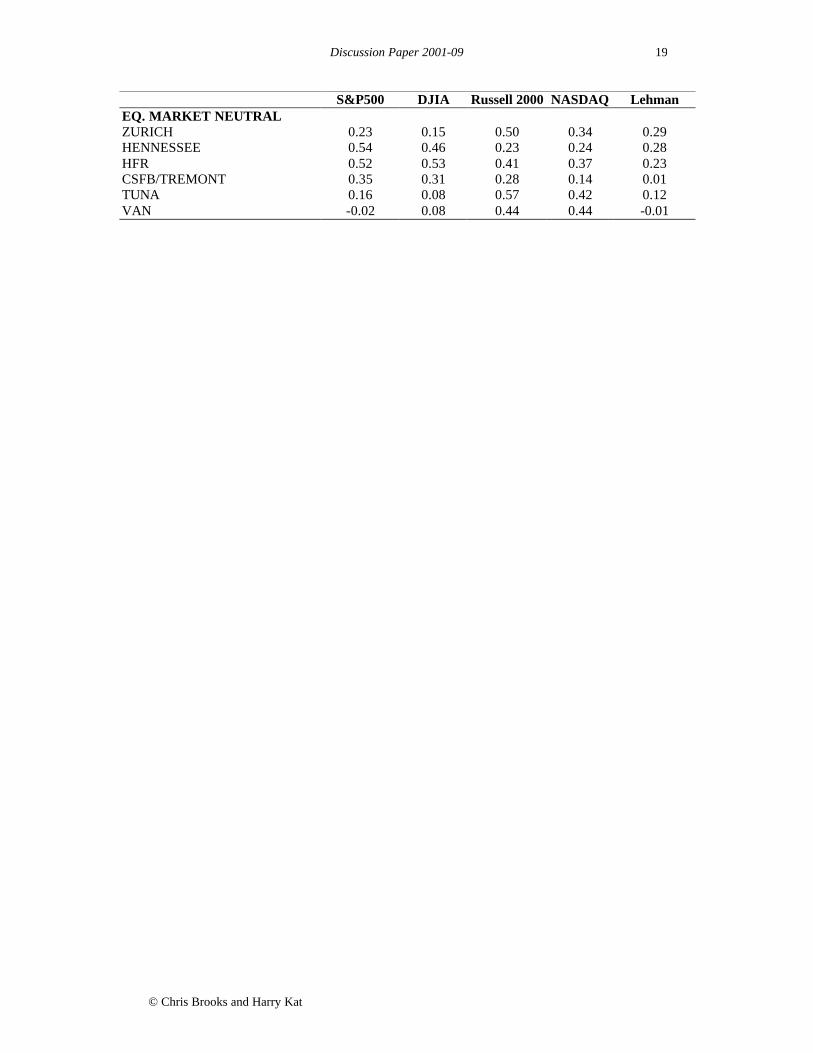
Convertible Arbitrage, Risk Arbitrage, Distressed Securities and Emerging Markets exhibit not only high negative skewness but also large excess kurtosis. This means that for these indices, large negative returns are much more likely than would be the case under a normal distribution. Given the nature of these strategies, this does not come as a complete surprise. As is evidenced by their significant Bera-Jarque (1987) normality test statistics, it seems safe to conclude that most hedge fund index returns are not normally distributed. Three other points are worth noting. First, although in essence funds of funds are nothing more than baskets of hedge funds, the Fund of Funds indices exhibit significantly lower means than the Aggregate indices. This strongly suggests that fund of fund managers are unable to add enough value to make up for the fees that they charge. Second, not all indices in the same group exhibit similar behaviour. The CSFB/Tremont Aggregate index, the Altvest Emerging Markets index, the Zurich Macro index and the Zurich and Van Equity Market Neutral indices all seem to differ significantly from the other indices in their respective groups. Third, we also see some differences between indices that follow different calculation principles. The CSFB/Tremont indices for example are value-weighted instead of equally-weighted. Since there can be significant differences in size between the funds included in these indices this may lead to an asymmetric weighting which may raise the variability of returns. The standard deviation estimates in Table 1 show that this is indeed the case. The Tuna indices produce relatively high mean returns. This reflects the fact that these indices contain a significant survivorship bias. << Insert Figure 1 >> The bizarre shape of the unconditional distributions of some of the hedge fund index return series is also demonstrated in Figure 1, which plots the distribution of the HFR Risk Arbitrage index (continuous line) against the distribution of a normal random variable with the same mean and standard deviation (dotted line). Although this is an extreme example, the asymmetry about the mean and in particular the very long lower tail and complete absence of an upper tail are clearly evident. << Insert Table 2 >> Table 2 examines the correlations between the hedge fund index returns and those of the stock and bond market indices. The majority of indices exhibit a low and typically negative correlation with the bond market. The only exceptions are Macro and Equity Market Neutral, which may reflect the relatively high degree of leverage applied in these sectors. Apart from Convertible Arbitrage and Equity Market Neutral, the majority of indices show surprisingly high correlations with the equity indices, especially with the Russell 2000. This makes it clear that during the sample period many hedge funds were heavily invested in the securities of smaller companies. The Long/Short Equity indices are not only highly correlated with the Russell 2000 but also with the NASDAQ, implying that these funds must have been heavily invested in small technology stocks. Since long/short funds make up more than 30% of the hedge fund market, in terms of number of funds as well as assets under management, the same pattern is reflected in the Aggregate and Fund of Funds indices. Hedge funds often sell themselves on the claim that their returns are ‘market-proof’, i.e. uncorrelated with general market movements. This may well be true for individual
Discussion Paper 2001-09
© Chris Brooks and Harry Kat
6
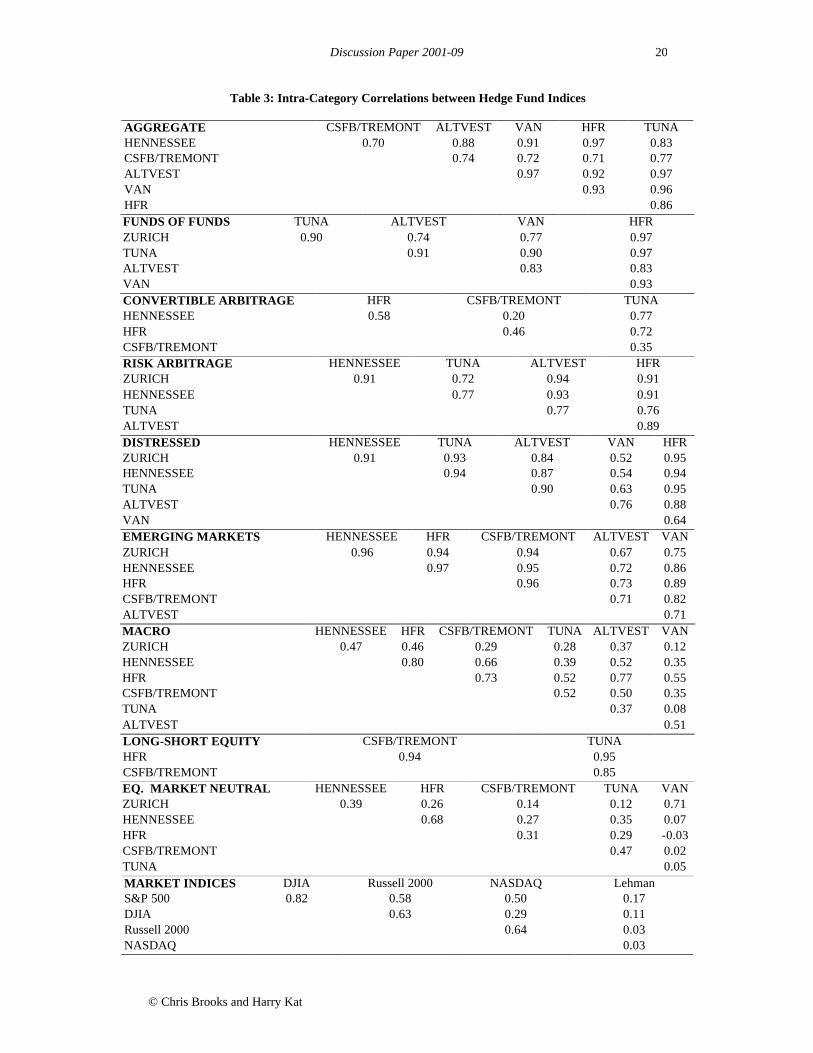
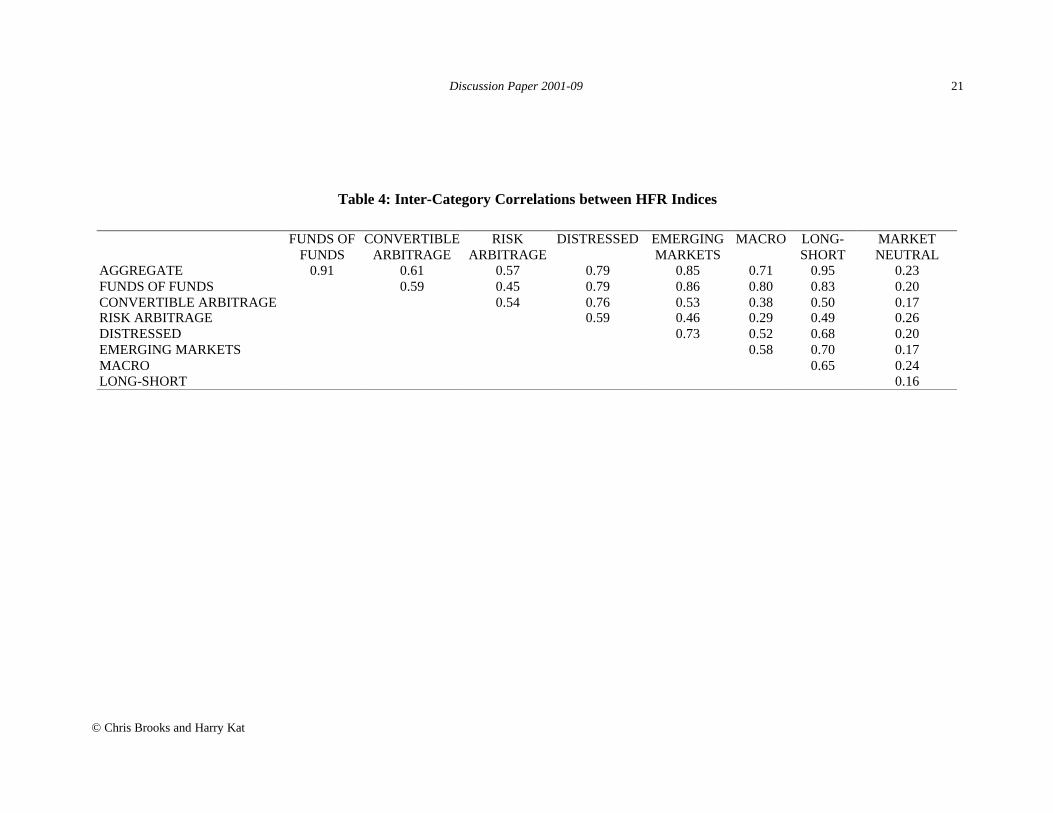
funds, which carry relatively high unsystematic risk, but, as we can see from Table 2, it is not so for most hedge fund indices. The observed high correlation with the equity indices tells us that despite the unorthodox strategies followed by many hedge funds, part of their systematic risk is still old-fashioned equity market risk. Since most investors nowadays do not invest in a single fund but hold a basket of funds, either self-selected or through a fund of funds structure, this is an important point. The Convertible Arbitrage and Equity Market Neutral indices are the exception. The nature of these strategies is such that these funds pick up less equity market risk. This does not mean there are no systematic factors present in their returns however. We simply do not have a clear picture of what the systematic factors for these strategies are. Again, it is interesting to note that different indices within the same group may paint a very different picture. Within the Equity Market Neutral class, correlation with the S&P 500 for example varies from –0.02 to 0.54. Likewise, the Macro indices’ correlation with the S&P 500 varies from as low as 0.25 to as high as 0.60. Although all data providers aim to provide similar information, a priori it is unlikely that their indices will show exactly the same behaviour. Not only may different data providers classify the same fund differently but the main databases also show surprisingly little overlap. Liang (2000) for example found only 465 common funds when he compared the HFR and the TASS databases. This suggests that many funds report to only one data vendor, which in turn means that different databases provide information on different subsets of the hedge fund universe. << Insert Table 3 >> Table 3 presents an analysis of the relationship between the indices within each category by examining their unconditional correlations. The correlations for Aggregate, Funds of Funds, Risk Arbitrage, Distressed Securities, Emerging Markets, and Long/Short Equity are high – typically between 0.7 and 0.9. This suggests that the various indices within the groups have similar constituents, or at least constituents with similar time series of returns. On the contrary, the correlations for Convertible Arbitrage, Macro and especially for Equity Market Neutral are much lower. Since these are also the indices that show relatively low correlation with equity, this suggests that the systematic factors that drive these funds returns may quite complex. Again, we see a number of outliers, some of which were encountered before in Tables 1 and 2. The CSFB/Tremont Aggregate index for example has a relatively low correlation with the other indices in its class. A similar observation can be made concerning the CSFB/Tremont Convertible Arbitrage, the Tuna Risk Arbitrage, the Van Distressed Securities, the Altvest Emerging Markets, the Zurich and Tuna Macro and the Van Equity Market Neutral indices. This once again stresses that investors’ perceptions of hedge fund performance will strongly depend on the indices used. << Insert Table 4 >> We also studied the unconditional correlation between indices in different groups. With 48 indices, the results are too extensive to display fully, however. Table 4 therefore presents the correlation estimates between the different investment categories of HFR indices. We selected the HFR indices for illustration since it is the only vendor supplying an index for all of the fund categories under consideration. Although the results presented above suggest considerable heterogeneity between the various types of funds,
Discussion Paper 2001-09
© Chris Brooks and Harry Kat
7
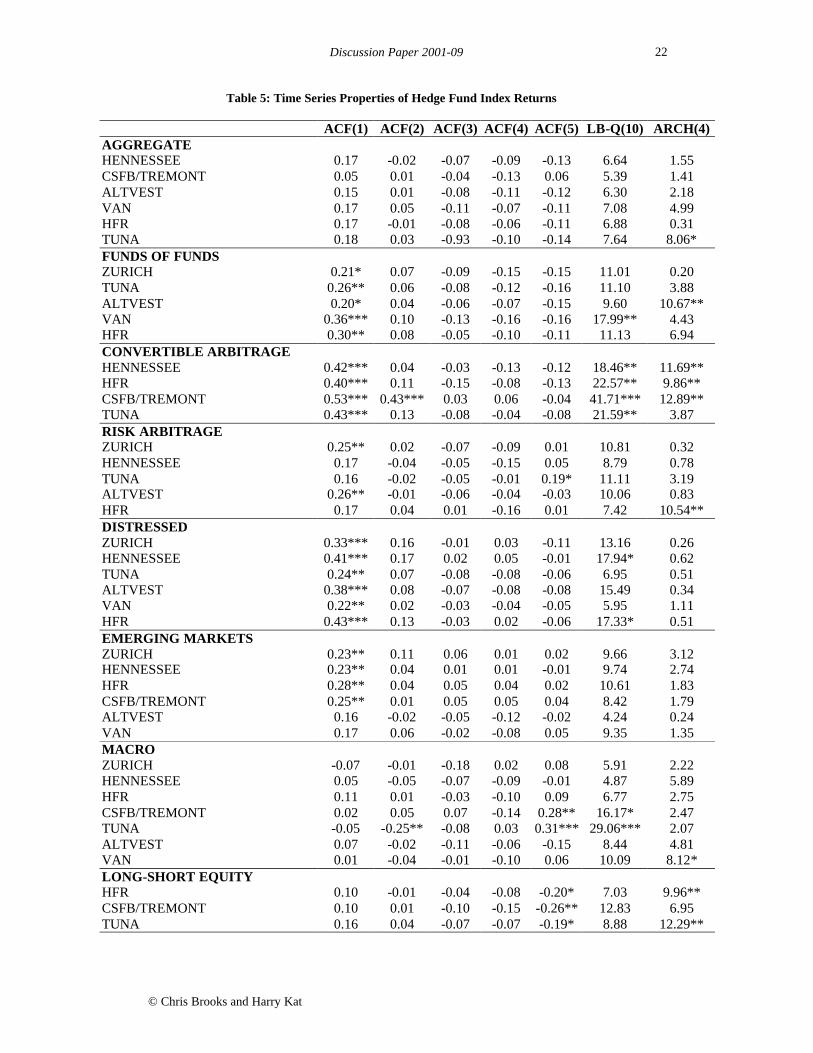
the indices in Table 4 show a surprisingly high degree of association. Correlations are almost all greater than 0.5, which suggests that the returns on different types of strategies may still share the same systematic factors. With long/short funds making up a large part of the hedge fund industry, it is not surprising that the Long/Short Equity, Funds of Funds and Aggregate indices turn out to be so highly correlated. More bizarre, however, are the high correlations between types of funds that follow strategies which at first sight have very little in common, such as Convertible Arbitrage and Distressed Securities for example (0.76). The big exception in Table 4 is Equity Market Neutral, where correlations with other groups are typically of the order of 0.2. This again shows that Equity Market Neutral funds are distinctly different from other types of hedge funds. << Insert Table 5 >> Table 5 shows the basic time series properties of each of the indices, together with those of standard market indices for comparison. We present the autocorrelation coefficients for lags 1 to 5 together with the result from the Ljung-Box (1978) test of the joint null hypothesis that all of the first 10 autocorrelation coefficients are zero. Under the assumption that returns are normally distributed,5 confidence intervals for the correlations can be constructed. For a sample of this size, a correlation coefficient is defined as statistically significant at the 10% level if it lies outside ±0.19, significant at the 5% level if it lies outside ±0.22, and significant at the 1% level if it lies outside ±0.30. For the stock and bond market indices there is very little evidence of statistically significant autocorrelation. Only the lag 5 coefficient for the Russell 2000 and the lag 1 coefficient for the bond index are significant, while none of the joint statistics lead to rejection of the no serial correlation null. These properties are common for monthly time series of financial returns, which are widely believed to be linearly independent of their previous values. A further point worth noting is that not only are the autocorrelation coefficients small in absolute value, they are also mainly negative (except for those of the bond index). By contrast, many of the hedge fund indices exhibit highly significant positive autocorrelation. All of the Convertible Arbitrage indices have a first order serial correlation of at least 0.4, which are also statistically significant at the 1% level. A similar feature is observed for Distressed Securities and some of the Risk Arbitrage, Emerging Markets and Equity Market Neutral series. It is also reflected in the Funds of Funds results but, surprisingly, not in the Aggregate indices. The observed positive autocorrelation is quite a unique property and seems inconsistent with the notion of efficient markets. One possible explanation is that the nature of hedge funds’ strategies leads their returns to be inherently related to those of preceding months. As this implies lags in the major systematic risk factors, however, this is not the most plausible explanation. An alternative explanation lies in the difficulty for hedge fund managers to obtain up-to-date valuations of their positions in illiquid and complex over-the-counter securities. When confronted with this problem, hedge funds either use the last reported transaction price or an estimate of the current market price, which may easily create lags in the evolution of their net asset value. This would explain why the Convertible Arbitrage and Distressed Securities indices exhibit the most significant autocorrelation.6

Discussion Paper 2001-09
© Chris Brooks and Harry Kat
8
Finally, the last column of Table 4 presents the test statistics corresponding to Engle’s test for ARCH-effects of order up to 4 on the residuals of an AR(5) model to remove linear dependencies that could spuriously trip the test. For the majority of series, there is little evidence for volatility clustering, except for some indices in the categories Convertible Arbitrage, Long/Short Equity and Equity Market Neutral. It should be noted, however, that after the linear filter, the remaining 71 observations probably represent an insufficiently large sample for the test to hold much power. This also explains why we do not find any significant ARCH effects in the stock market indices.
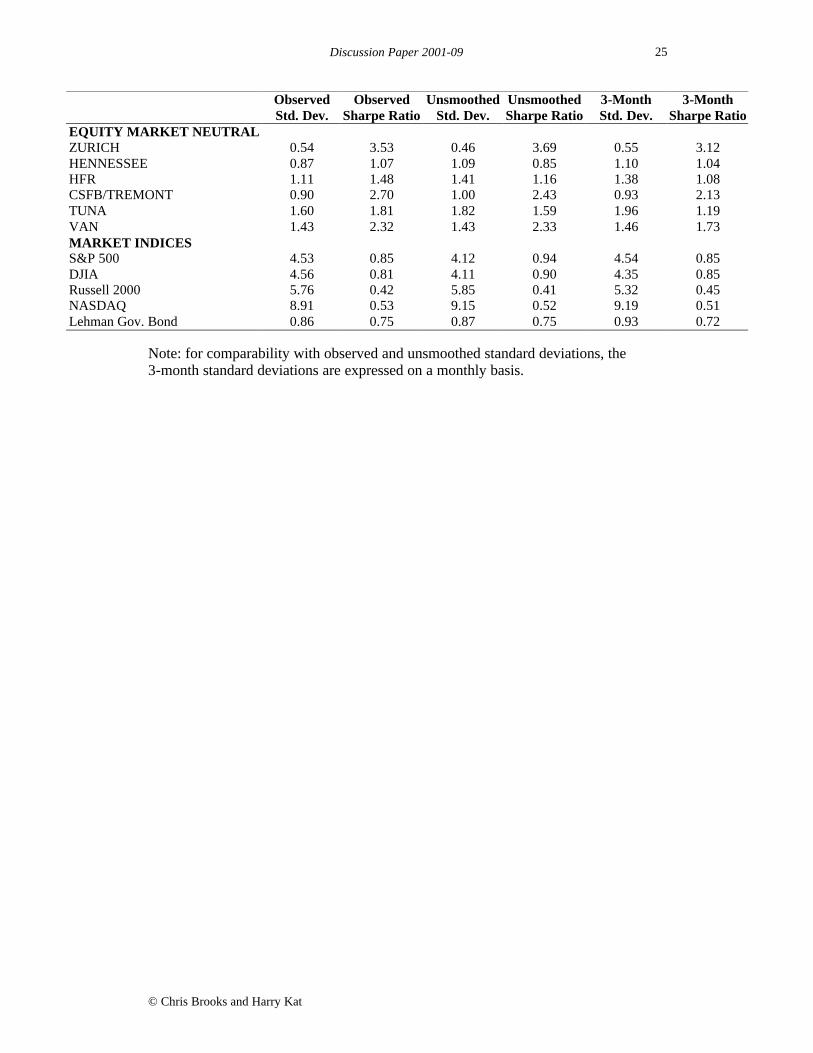
V. Implications for Performance Evaluation To evaluate fund performance many practitioners use the Sharpe Ratio, which is calculated as the ratio of the average excess return and the return standard deviation of the fund being evaluated.7 As such, it is thought to measure the excess return per unit of risk. As shown in the third column of Table 6, for most of the hedge fund indices the relatively high means and low standard deviations lead to Sharpe Ratios that are considerably higher than those of the stock and bond market indices.8 Only the Emerging Markets indices and the Hennessee Macro index do not beat the market in these risk-adjusted terms. << Insert Table 6 >> Whilst this type of analysis is widely used, it only considers the first two moments of the return distribution. When fund returns are not normally distributed, however, the mean and standard deviation are not sufficient to describe the distribution. As shown in Scott and Horvath (1980), under fairly weak assumptions concerning investors’ utility functions it can be shown that investors desire high odd moments and low even moments. Hedge funds offer relatively high means and low variances, but they also tend to give investors third and fourth moment attributes that are exactly opposite of those that investors desire. This means that the Sharpe Ratio will systematically overstate true hedge fund performance relative to that of the standard market indices. From Tables 1 and 6 we see a strong relationship between an index’s Sharpe Ratio and the skewness and kurtosis of its return distribution. High Sharpe Ratios tend to go together with negative skewness and high kurtosis. This means that the relatively high mean and low standard deviation offered by hedge fund indices is no free lunch. Investors simply pay for a more attractive Sharpe Ratio in the form of more negative skewness and higher kurtosis. A recent study by Amin and Kat (2001a) shows that when the whole return distribution is taken into account, there is little or no evidence of superior performance in hedge fund index returns. A second point concerns the observed autocorrelation, which will systematically lead estimates of the standard deviation to be biased downwards. One possible method for evaluating the effect of this bias on the standard deviation stems from the real estate finance literature. Due to smoothing in appraisals and infrequent valuations of properties, the returns of direct property investment indices suffer from similar problems as hedge fund index returns. The approach employed in this literature has been to “unsmooth” the observed returns to create a new set of returns which are more volatile and whose characteristics are believed to more accurately capture the characteristics of the underlying property values. Geltner (1991, 1993) gives an extensive discussion of the motivations for and methodologies to unsmooth returns

Discussion Paper 2001-09
© Chris Brooks and Harry Kat
9
series. Following this tradition, the observed (or smoothed) value Vt* of a hedge fund index at time t could be expressed as a weighted average of the underlying (true) value at time t, Vt, and the smoothed value at time t-1, Vt-1*: *)1(* 1−−+= ttt VVV αα (1)
Implicit in equation (1) is that fund managers are using a single exponential smoothing approach. Given (1), it is possible to derive an expression that will yield an unsmoothed series with zero first order autocorrelation:
α
α−
−= −
1
** 1ttt
rrr (2)
where rt and rt* are the true underlying (unobservable) return and the observed return at time t respectively. Since the stock market indices have autocorrelation coefficients that are very close to zero, it seems plausible in the context of the results presented above to set α equal to the autocorrelation coefficient at lag 1. The newly constructed series, rt, will have the same mean as rt*, and zero first order autocorrelation (aside from rounding errors). The resulting standard deviations are presented in the fourth column of Table 6, together with a revised Sharpe Ratio constructed using the standard deviation of the unsmoothed returns. The standard deviation of the unsmoothed series will increase when the first order autocorrelation coefficient is positive, while a negative coefficient will lead to a lower standard deviation. Since in most cases the autocorrelation coefficients are large and positive, this results in markedly higher standard deviations for virtually all hedge fund indices. For example, the standard deviation for the CSFB/Tremont Convertible Arbitrage index increases from 1.36% to 2.42%. The standard deviations of the stock and bond market indices on the other hand are largely unchanged or even lower. Since hedge fund indices’ standard deviations rise, their Sharpe Ratios fall. For instance, the CSFB/Tremont Convertible Arbitrage index’s Sharpe Ratio drops from 1.81 to 1.01. Since one can never be sure what would be the properties of a series if good quality data were available, the notion of unsmoothing may seem far from rigorous. It serves nonetheless to illustrate the possible impact of infrequent trading on hedge fund and hedge fund index returns. In many cases, Sharpe Ratios that considerably bettered the equity indices now do not. An alternative approach that can be used to reduce the degree of autocorrelation is to calculate returns over a time span of three months rather than one.9 The penultimate column of Table 6 gives the square root of one third of the variance estimated from 3-month data. In the absence of autocorrelation, these standard deviations should be identical to those given in the second column of Table 6. In almost all cases, however, the standard deviations have increased (although less than with the unsmoothed returns), leading to lower Sharpe Ratios (last column). These findings again underpin the notion that observed hedge fund index performance systematically overstates true performance when measured by the Sharpe Ratio.
Discussion Paper 2001-09
© Chris Brooks and Harry Kat
10
VI. Implications for Portfolio Analysis Accustomed to investment alternatives with more or less normally distributed returns, most practitioners evaluate investment portfolios in the mean-variance framework of Markowitz (1959). The latter formalizes the idea that out of all possible portfolios a risk-averse investor will only be interested in those portfolios that offer the highest expected return for a given level of standard deviation. Obviously, this approach suffers from the same problem as the Sharpe Ratio. Since it concentrates on the mean and standard deviation, it skips over a number of other properties that need not be trivial or advantageous for investors. This is especially relevant in our case since, for the hedge fund indices studied, more attractive mean-variance attributes appear to go hand in hand with less attractive skewness and kurtosis properties. To investigate the extend of this problem, we performed a standard mean-variance optimisation using the S&P 500, the Lehman Brothers bond index and the individual hedge funds indices.10 To create a realistic environment, short selling was not allowed. Despite the fact that most investors will typically want to severely restrict their hedge fund allocation, we did not include such a restriction for the simple reason that to make a significant difference at the portfolio level, one will need to allocate substantially more to hedge funds than the 5% typically allocated by institutional investors. Of course, any restricted solution will tend towards the unrestricted solution. Our results should therefore be interpreted as a limit case. << Insert Table 7 >> We first performed the optimisation without hedge funds, i.e. with equities and bonds only, using parameter estimates from the original 1-month return data. Assuming our hypothetical investor uses a target standard deviation of 8% per annum,11 the highest achievable expected return in that case is 1.07% per month. Next, we introduced hedge funds and performed the same analysis. The second and third column of Table 7 show the annualised improvement in expected return and the percentage of total wealth allocated to hedge funds. With the exception of Emerging Markets, Table 7 implies a very high allocation to hedge funds and a marked improvement in expected return. However, there are significant differences between categories with especially Risk Arbitrage, Long/Short Equity and Equity Market Neutral offering a substantial pick-up in expected return. Allocations vary quite significantly between categories. The average allocation for the Aggregate indices is 75%, while it is only 55% for Convertible Arbitrage for example. There is also quite a degree of variation within some of the categories. Within the Aggregate category, the improvement in annualised return varies from 1.08% to 6.12%, with the hedge fund allocation varying between 50% and 100%. Return pick-ups and/or allocations in Convertible Arbitrage, Risk Arbitrage, and Equity Market Neutral on the other hand are remarkably similar. Although this information is not explicitly provided in the table, it is interesting to note that different hedge fund indices generate the observed increase in expected return in a different way. The Aggregate and Macro indices’ allocations come at the cost of the allocations to stocks as well as bonds. The Long/Short Equity indices on the other hand primarily replace equity, while the indices in the other categories primarily replace bonds. This reflects these indices’ mean-variance characteristics. Long/Short Equity has more in common with equity, while Convertible Arbitrage,

Discussion Paper 2001-09
© Chris Brooks and Harry Kat
11
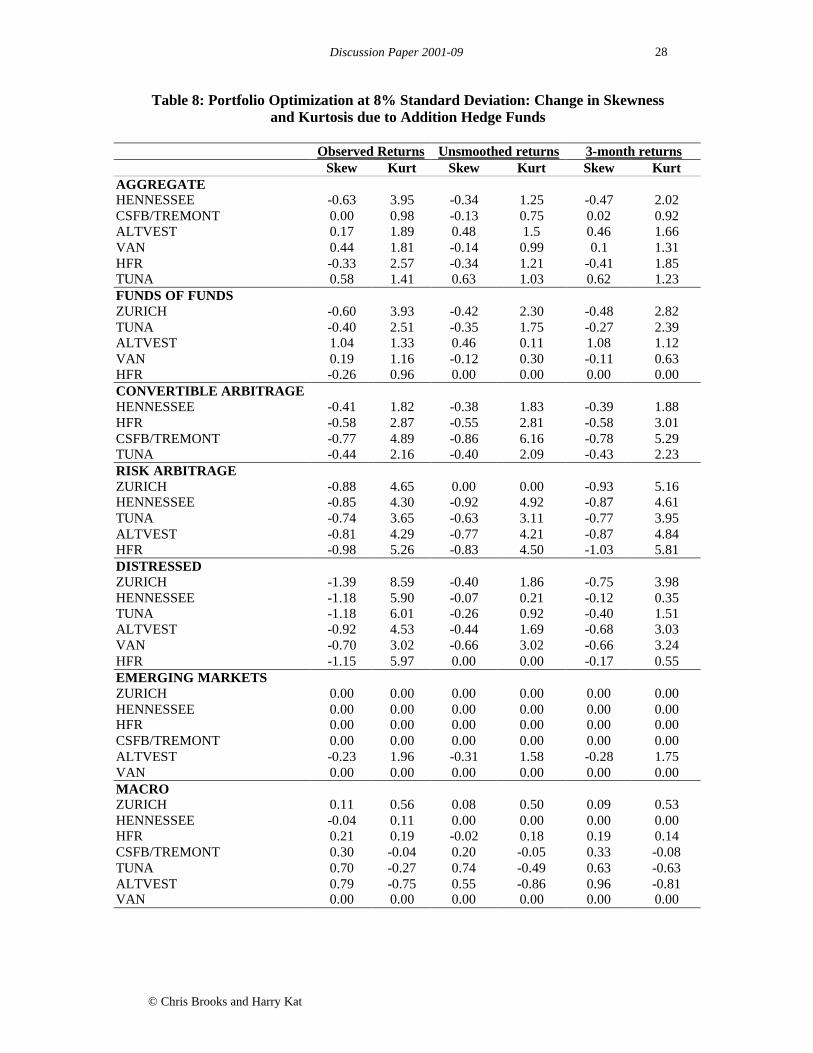
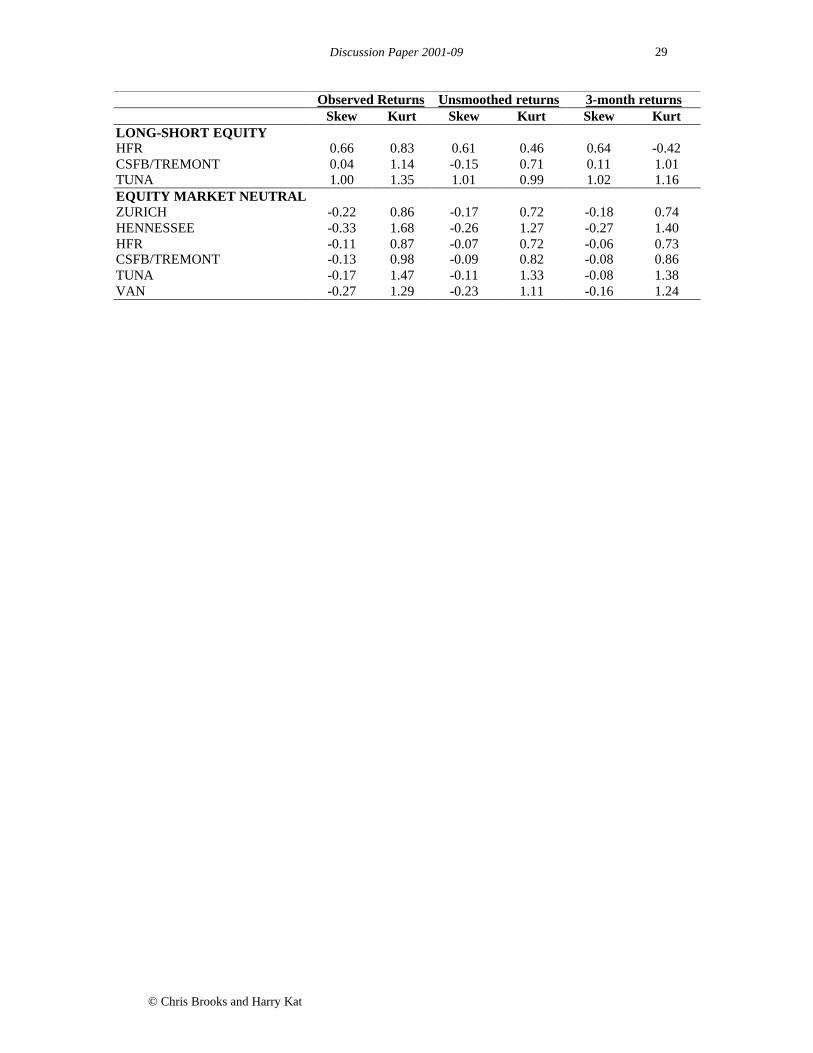
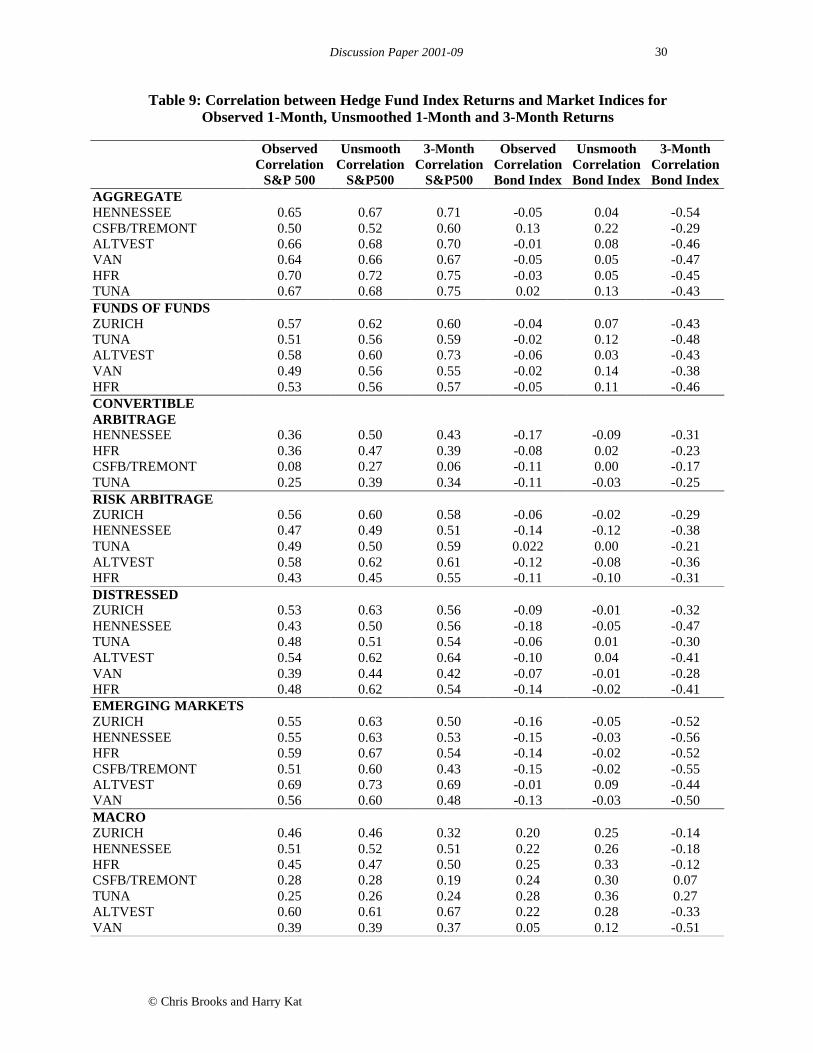
Risk Arbitrage, Distressed Securities and Equity Market Neutral are much more similar to bonds. To check our previous claim that with a severe restriction on the allowable hedge fund allocation the attainable improvement in expected return can only be limited, we repeated the above procedure restricting the hedge fund allocation to 5%. In virtually all cases, the optimiser allocated the full 5% to hedge funds. Given the fact that when not restricted, the allocation is many times higher than that, this is not surprising. Due to the restriction, however, the average improvement in expected return was limited to a meagre 0.30% per annum. Hence these results are not shown. << Insert Table 8 >> Next, we calculated the skewness and kurtosis of the above mean-variance optimal portfolios and compared these with the case without hedge funds. The differences can be found in the second and third column of Table 8. In most cases where the skewness of the hedge fund index is lower (higher) than that of the portfolio to which it is added (-0.66), the skewness of the new portfolio tends to be less (more) attractive than that of the original portfolio comprising only stocks and bonds. The Equity Market Neutral indices are an exception though. Although the latter do not exhibit much skewness themselves, adding them still causes portfolio skewness to deteriorate. This strongly suggests that the correlation between the Equity Market Neutral indices and the S&P 500 is higher in down markets than in up markets. In line with the fact that almost all hedge fund indices exhibit positive excess kurtosis while stocks and bonds do not, in virtually all cases kurtosis rises significantly after the introduction of hedge funds. The above makes it clear that when hedge funds are involved, mean-variance analysis is no longer sufficient as a portfolio decision-making tool. For the individual indices we found a strong relationship between their Sharpe Ratio and their skewness and kurtosis properties. Taking a closer look at the observed trade-off between the improvement in the mean and a portfolio’s skewness and kurtosis properties, it becomes clear that we cannot simply conclude that the more the expected return improves, the more skewness and kurtosis deteriorate. Some indices, such as Long/Short Equity and Equity Market Neutral for example, yield a substantial pick-up in expected return but do not seem to add very much skewness or kurtosis. The indices in the Convertible and Risk Arbitrage categories, on the other hand, appear to come with a lot of additional negative skewness and excess kurtosis. << Insert Table 9 >> The crucial parameters for the determination of the optimal portfolio are the relevant assets’ means, variances and correlations. In the previous section we discussed the effect of excess smoothness on hedge fund index return variance. However, autocorrelation in the hedge fund index returns may also lead one to misestimate true correlations. Table 9 shows the correlations between the hedge fund indices and the S&P 500 and the Lehman Brothers Government Bond index. The second and fifth columns are identical to the second and sixth columns of Table 2 and show the correlations calculated from the available 1-month return data. The third and sixth columns show the correlations from unsmoothed 1-month data and the fourth and seventh column show the correlations from 3-month data. For most series the
Discussion Paper 2001-09
© Chris Brooks and Harry Kat
12
unsmoothed and 3-month correlations with the S&P 500 are higher than those of the original series. The differences are especially large for Convertible Arbitrage and Distressed Securities, which are also the categories that show the highest serial correlation. The unsmoothed correlations with the bond index tend to be higher than for the original data. The 3-month correlations on the other hand tend to be significantly lower. We repeated the portfolio optimisation procedure using the parameter values estimated from the unsmoothed 1-month returns and the 3-month returns. The results can be found in Table 7. From the table we see that overall the improvement in expected return is significantly lower than with the original 1-month data. The allocations to hedge funds are still very substantial but, due to the higher standard deviations (Table 6) and higher correlations with the S&P 500 (Table 9), mostly lower than those found previously. The most noteworthy exceptions are found in Convertible Arbitrage, Risk Arbitrage and Equity Market Neutral where the hedge fund allocations are remarkably stable. This results from the fact that these indices exhibit very low standard deviations (Table 6). The changes in portfolio skewness and kurtosis due to the addition of hedge funds can be found in Table 8. These entries are similar to the ones found earlier for the original 1-month data.
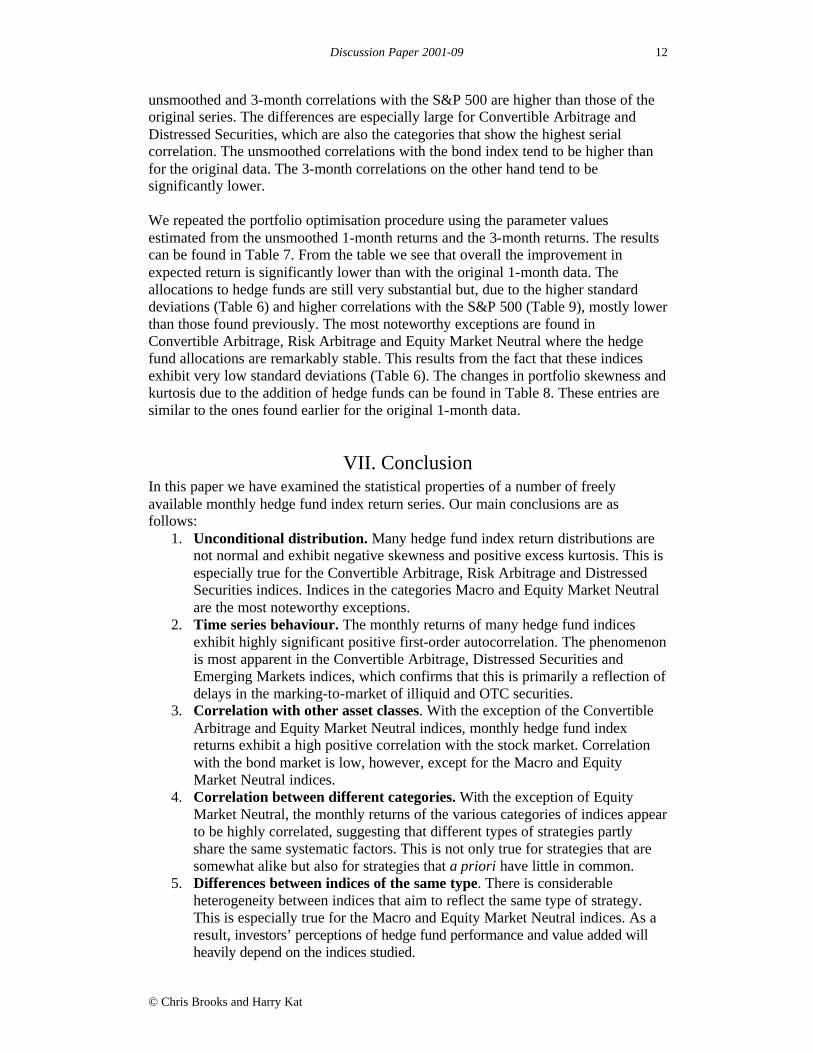
VII. Conclusion In this paper we have examined the statistical properties of a number of freely available monthly hedge fund index return series. Our main conclusions are as follows:
1. Unconditional distribution. Many hedge fund index return distributions are not normal and exhibit negative skewness and positive excess kurtosis. This is especially true for the Convertible Arbitrage, Risk Arbitrage and Distressed Securities indices. Indices in the categories Macro and Equity Market Neutral are the most noteworthy exceptions.
2. Time series behaviour. The monthly returns of many hedge fund indices exhibit highly significant positive first-order autocorrelation. The phenomenon is most apparent in the Convertible Arbitrage, Distressed Securities and Emerging Markets indices, which confirms that this is primarily a reflection of delays in the marking-to-market of illiquid and OTC securities.
3. Correlation with other asset classes. With the exception of the Convertible Arbitrage and Equity Market Neutral indices, monthly hedge fund index returns exhibit a high positive correlation with the stock market. Correlation with the bond market is low, however, except for the Macro and Equity Market Neutral indices.
4. Correlation between different categories. With the exception of Equity Market Neutral, the monthly returns of the various categories of indices appear to be highly correlated, suggesting that different types of strategies partly share the same systematic factors. This is not only true for strategies that are somewhat alike but also for strategies that a priori have little in common.
5. Differences between indices of the same type. There is considerable heterogeneity between indices that aim to reflect the same type of strategy. This is especially true for the Macro and Equity Market Neutral indices. As a result, investors’ perceptions of hedge fund performance and value added will heavily depend on the indices studied.
Discussion Paper 2001-09
© Chris Brooks and Harry Kat
13
The above findings have a number of implications for those investing or considering whether to invest in hedge funds. The most important are:
6. Overestimation of the Sharpe Ratio. The excess smoothness of the available monthly return data will lead one to underestimate true return volatility and thereby significantly overestimate the Sharpe Ratio.
7. Unsuitability of the Sharpe Ratio for performance evaluation. Since it only looks at the mean and standard deviation, the Sharpe Ratio is not suitable for the evaluation of the performance of (portfolios containing) hedge funds. With many hedge fund indices offering skewness and kurtosis properties that are exactly opposite of those that investors desire, the Sharpe Ratio will overstate true performance.
8. Overestimation of the benefits of hedge funds. Due to the excess smoothness of the available monthly return data, straightforward application of mean-variance analysis on monthly hedge fund index return data will over-allocate to hedge funds and thereby overestimate the attainable improvement in expected return at a given level of standard deviation
9. Unsuitability of mean-variance portfolio analysis. Including hedge funds may significantly improve the mean-variance characteristics of a portfolio. Since this may be accompanied by deteriorating skewness and kurtosis, however, standard mean-variance analysis is too restrictive for portfolio decision-making when hedge funds are involved.
Given the unique properties of hedge fund returns, there are several other areas that invite further study. For example, several researchers have reported significant differences in the correlation between hedge funds and equities in up and down markets. A recent paper by Boyer, Gibson and Loretan (1999), however, suggests that at least part of this may be due to the conditioning process itself. Likewise, more research is required into the implications of the observed skewness and kurtosis for standard value at risk and risk budgeting techniques. This will be the subject our next paper.

Discussion Paper 2001-09
© Chris Brooks and Harry Kat
14
Footnotes 1. Note that this is just one of several classifications in use. Different data vendors use different
classifications, some more elaborate than others. 2. We attempted to verify the information below with the individual data vendors themselves.
However, only HFR, Hennessee and Zurich Capital Markets responded to our request.
3. Survivorship bias estimates in the literature range from 1.5% to 3% per annum. See for example Fung and Hsieh (2000) or Amin and Kat (2001b).
4. All Zurich indices are Reproduced from www.marhedge.com. © Zurich Capital Markets 2001.
No claim to orig. US Govt works. All rights reserved.
5. An extremely dubious assumption given the analysis presented above, but one which shall be used nonetheless to give a general idea of the significance or otherwise of the autocorrelation coefficients.
6. A third, more cynical, explanation can be found in Weisman (2000) and Asness, Krail and
Liew (2001). The latter argue that hedge fund managers may deliberately ‘manage’ their marking-to-market to maintain a stream of positive returns with a low variance and a low correlation with other asset classes. This view, however, is incompatible with the fact that marking-to-market is the responsibility of the fund administrator, not the manager.
7. The Sharpe Ratio was first introduced in Sharpe (1966). Details on its general characteristics
can be found in Sharpe (1994).
8. All Sharpe Ratios are calculated by subtracting the average US Treasury bill yield over the sample period (5.25%) from the annualised average fund return and dividing by the annualised fund return standard deviation.
9. The mean returns may be marginally affected by moving to a 3-month differencing interval as
the 1-month returns are estimated using a sample of 76 observations, a number that is not divisible by three. Therefore, the 3-month measures are calculated discarding the last observation.
. 10. Including foreign stocks and bonds in the portfolio might have set a higher benchmark for
hedge funds, i.e. have made it more difficult for hedge funds to add value. We did not do so, however, as our main goal is not to demonstrate the benefits of hedge funds but purely to clarify the effect of their unusual statistical properties on standard portfolio decision-making.
11. A target standard deviation of around 8%, which holds the middle ground between bonds and
stocks, is typical for many pension funds.
Discussion Paper 2001-09
© Chris Brooks and Harry Kat
15
References Amin, G. and H. Kat (2001a), Hedge Fund Performance 1990-2000: Do the Money Machines Really Add Value?, Working Paper ISMA Centre University of Reading.
Amin, G. and H. Kat (2001b), Welcome to the Dark Side: Hedge Fund Attrition and Survivorship Bias 1994-2001, Working Paper ISMA Centre University of Reading.
Asness, C., R. Krail and J. Liew (2001), Do Hedge Funds Hedge?, forthcoming Journal of Portfolio Management.
Bera, A. and C. Jarque (1987), A Test for Normality of Observations and Regression Residuals, International Statistical Review, Vol. 55, pp. 163-172
Boyer, B., M. Gibson and M. Loretan (1999), Pitfalls in Tests for Changes in Correlations, Discussion Paper 597, Board of Governors of the Federal Reserve System.
Fung, W. and D. Hsieh (2000), Performance Characteristics of Hedge Funds and Commodity Funds: Natural vs. Spurious Biases, Journal of Financial and Quantitative Analysis, Vol. 35, pp. 291-307.
Geltner, D. (1991), Smoothing in Appraisal-Based Returns, Journal of Real Estate Finance and Economics, Vol. 4, pp. 327-345.
Geltner, D. (1993) Estimating Market Values from Appraised Values without Assuming an Efficient Market, Journal of Real Estate Research, Vol. 8, pp. 325-345.
Liang, B. (2000), Hedge Funds: The Living and the Dead, Journal of Financial and Quantitative Analysis, Vol. 35, pp. 309-326.
Ljung, G. and G. Box (1978) On a Measure of Lack of Fit in Time Series Models, Biometrika, Vol. 65, pp. 297-303.
Markowitz, H. (1959), Portfolio Selection: Efficient Diversification of Investments, John Wiley & Sons, New York.
Scott, R. and P. Horvath (1980), On the Direction of Preference for Moments of Higher Order Than the Variance, Journal of Finance, Vol. 35, pp. 915-919.
Sharpe, W. (1966), Mutual Fund Performance, Journal of Business, Vol. 39, pp. 119-138.
Sharpe, W. (1994), The Sharpe Ratio, Journal of Portfolio Management, Fall, pp. 49-59.
Weisman, A. (2000), The Dangers of Historical Hedge Fund Data, Working Paper Nikko Securities.
Discussion Paper 2001-09
© Chris Brooks and Harry Kat
16
Table 1: Summary Statistics Hedge Fund Index Return Distributions
Mean Standard
Deviation Skewness Excess
Kurtosis Bera-
Jarque Minimum Maximum
AGGREGATE HENNESSEE 1.13*** 2.34 -0.84*** 5.37*** 100.4*** -9.49 7.48 CSFB/TREMONT 1.22*** 2.86 -0.09 0.79 2.08 -7.55 8.53 ALTVEST 1.51*** 2.24 -0.25 2.01*** 13.54*** -6.62 7.85 VAN 1.35*** 2.53 0.01 2.20*** 15.39*** -7.60 8.90 HFR 1.22*** 2.44 -0.72** 2.78*** 31.14*** -8.70 7.65 TUNA 1.58** 2.19 -0.08 1.54*** 7.58** -5.66 7.91 FUNDS OF FUNDS ZURICH 1.00*** 1.64 -0.69** 5.67*** 107.8*** -6.42 6.15 TUNA 1.12*** 1.82 -0.01 2.69*** 22.92*** -5.37 6.61 ALTVEST 1.76*** 2.99 0.40 1.61*** 10.24*** -5.92 11.54 VAN 1.24*** 2.40 0.19 1.83*** 11.09*** -5.20 8.40 HFR 0.86** 2.07 -0.45 3.18** 34.69*** -7.47 6.85 CONVERTIBLE ARBITRAGE HENNESSEE 0.97*** 1.07 -0.78*** 2.28*** 24.15*** -2.72 3.56 HFR 1.14*** 0.92 -1.50*** 5.88*** 137.7*** -3.19 3.33 CSFB/TREMONT 1.14*** 1.36 -2.41*** 8.73*** 41.70*** -4.68 3.57 TUNA 1.24*** 0.96 -1.09*** 2.97*** 43.10*** -1.83 3.76 RISK ARBITRAGE ZURICH 1.10*** 1.07 -3.21*** 19.77*** 1366*** -5.61 2.84 HENNESSEE 1.08*** 0.98 -3.02*** 18.46*** 1195*** -4.79 3.17 TUNA 1.24*** 1.03 -2.25*** 11.28*** 467*** -4.41 3.28 ALTVEST 1.30*** 1.12 -2.74*** 14.67*** 777*** -5.28 2.95 HFR 1.13*** 1.06 -3.78*** 22.53*** 1788*** -5.69 2.47 DISTRESSED ZURICH 1.04*** 1.77 -2.59*** 14.05*** 710*** -9.22 3.90 HENNESSEE 0.92*** 1.88 -2.12*** 9.53*** 345*** -8.88 4.91 TUNA 1.03** 2.46 -2.02*** 12.26*** 528*** -12.64 7.95 ALTVEST 1.13*** 1.82 -1.23*** 4.66*** 88.15*** -7.07 5.25 VAN 1.07*** 1.53 -0.09 3.52*** 39.31*** -4.70 5.70 HFR 0.91*** 1.75 -2.18*** 10.57*** 414*** -8.50 5.06 EMERGING MARKETS ZURICH 0.45 4.75 -2.41*** 12.92*** 602*** -26.25 12.13 HENNESSEE 0.35 4.59 -0.91*** 4.70*** 80.31*** -20.10 12.51 HFR 0.60 5.04 -0.81*** 3.86*** 55.42*** -21.20 14.80 CSFB/TREMONT 0.40 5.64 -0.84*** 3.09*** 39.09*** -23.03 15.34 ALTVEST 1.25*** 2.21 -0.70** 1.87*** 17.25*** -7.20 5.92 VAN 0.64 6.05 -0.06 1.96*** 12.17*** -19.90 20.00 MACRO ZURICH 0.85*** 1.61 1.23*** 3.01*** 47.85*** -2.31 6.90 HENNESSEE 0.87*** 2.55 0.04 1.07* 3.62 -7.52 6.72 HFR 1.10*** 2.34 0.21 -0.18 0.65 -3.77 6.82 CSFB/TREMONT 1.43*** 4.18 -0.11 0.78 2.10 -11.55 10.60 TUNA 1.30*** 2.82 0.19 1.36** 6.27** -7.58 9.73 ALTVEST 1.42*** 2.72 0.28 -0.53 1.86 -4.15 7.42 VAN 0.78* 3.48 0.23 1.07* 4.31 -9.60 10.50 LONG-SHORT EQUITY HFR 1.75*** 3.07 0.02 1.24** 4.84* -7.65 10.88 CSFB/TREMONT 1.50*** 3.74 -0.10 2.19*** 15.26*** -11.43 13.01 TUNA 2.20*** 3.07 0.37 1.68*** 10.73*** -6.31 12.50

Discussion Paper 2001-09
© Chris Brooks and Harry Kat
17
Mean StandardDeviation
Skewness Excess Kurtosis
Bera-Jarque
Minimum Maximum
EQUITY MARKET NEUTRAL ZURICH 0.99*** 0.54 0.10 2.98*** 28.40*** -1.03 2.76 HENNESSEE 0.71*** 0.87 -0.31 0.46 1.92 -1.66 3.00 HFR 0.91*** 1.11 -0.21 0.16 0.67 -2.00 3.60 CSFB/TREMONT 1.14*** 0.90 -0.10 0.39 0.61 -1.15 3.26 TUNA 1.27*** 1.60 -0.19 0.23 0.63 -2.82 5.24 VAN 1.40*** 1.43 0.85*** 2.97*** 37.02*** -1.70 6.70 MARKET INDICES S&P 500 1.55*** 4.53 -0.87*** 1.05* 13.19*** -14.46 9.67 DJIA 1.51*** 4.56 -0.68** 1.15* 10.01*** -15.00 10.38 Russell 2000 1.14* 5.76 -0.50* 1.34** 8.86** -19.42 16.42 NASDAQ 1.80* 8.91 -0.57** 0.75 5.91* -22.90 21.98 Lehman Gov. Bond 0.62*** 0.86 0.14 0.24 0.44 -1.47 3.02
Notes: *, ** and *** denote significance at the 10%, 5%, and 1% levels respectively. The Bera-Jarque normality test is asymptotically distributed as a central χ2 with 2 degrees of freedom under the null hypothesis, with 5% critical value 5.99.

Discussion Paper 2001-09
© Chris Brooks and Harry Kat
18
Table 2: Correlation between Hedge Fund Index Returns and Market Indices
S&P500 DJIA Russell 2000 NASDAQ Lehman AGGREGATE HENNESSEE 0.65 0.57 0.87 0.79 -0.05 CSFB/TREMONT 0.50 0.42 0.63 0.56 0.13 ALTVEST 0.66 0.55 0.88 0.84 -0.01 VAN 0.64 0.55 0.87 0.81 -0.05 HFR 0.70 0.61 0.90 0.84 -0.03 TUNA 0.67 0.55 0.88 0.85 0.02 FUNDS OF FUNDS ZURICH 0.57 0.51 0.79 0.68 -0.04 TUNA 0.51 0.42 0.77 0.72 -0.02 ALTVEST 0.58 0.46 0.88 0.86 -0.06 VAN 0.49 0.42 0.69 0.67 -0.02 HFR 0.53 0.47 0.73 0.66 -0.05 CONVERTIBLE ARBITRAGE HENNESSEE 0.36 0.31 0.48 0.53 -0.17 HFR 0.36 0.34 0.49 0.38 -0.08 CSFB/TREMONT 0.08 0.09 0.22 0.08 -0.11 TUNA 0.25 0.21 0.37 0.36 -0.11 RISK ARBITRAGE ZURICH 0.56 0.52 0.69 0.50 -0.06 HENNESSEE 0.47 0.44 0.67 0.48 -0.14 TUNA 0.49 0.44 0.51 0.40 0.022 ALTVEST 0.58 0.56 0.67 0.50 -0.12 HFR 0.43 0.42 0.58 0.36 -0.11 DISTRESSED ZURICH 0.53 0.53 0.71 0.55 -0.09 HENNESSEE 0.43 0.42 0.67 0.54 -0.18 TUNA 0.48 0.45 0.78 0.60 -0.06 ALTVEST 0.54 0.47 0.72 0.65 -0.10 VAN 0.39 0.34 0.63 0.54 -0.07 HFR 0.48 0.48 0.65 0.53 -0.14 EMERGING MARKETS ZURICH 0.55 0.57 0.65 0.55 -0.16 HENNESSEE 0.55 0.58 0.64 0.57 -0.15 HFR 0.59 0.60 0.63 0.59 -0.14 CSFB/TREMONT 0.51 0.53 0.57 0.51 -0.15 ALTVEST 0.69 0.59 0.81 0.80 -0.01 VAN 0.56 0.59 0.64 0.59 -0.13 MACRO ZURICH 0.46 0.47 0.54 0.39 0.20 HENNESSEE 0.51 0.49 0.55 0.39 0.22 HFR 0.45 0.39 0.60 0.50 0.25 CSFB/TREMONT 0.28 0.24 0.28 0.19 0.24 TUNA 0.25 0.24 0.27 0.18 0.28 ALTVEST 0.60 0.52 0.68 0.67 0.22 VAN 0.39 0.32 0.54 0.54 0.05 LONG-SHORT EQUITY HFR 0.65 0.51 0.90 0.87 -0.01 CSFB/TREMONT 0.60 0.47 0.87 0.84 0.04 TUNA 0.60 0.45 0.90 0.86 -0.03
Discussion Paper 2001-09
© Chris Brooks and Harry Kat
19
S&P500 DJIA Russell 2000 NASDAQ Lehman EQ. MARKET NEUTRAL ZURICH 0.23 0.15 0.50 0.34 0.29 HENNESSEE 0.54 0.46 0.23 0.24 0.28 HFR 0.52 0.53 0.41 0.37 0.23 CSFB/TREMONT 0.35 0.31 0.28 0.14 0.01 TUNA 0.16 0.08 0.57 0.42 0.12 VAN -0.02 0.08 0.44 0.44 -0.01
Discussion Paper 2001-09
© Chris Brooks and Harry Kat
20
Table 3: Intra-Category Correlations between Hedge Fund Indices
AGGREGATE CSFB/TREMONT ALTVEST VAN HFR TUNA HENNESSEE 0.70 0.88 0.91 0.97 0.83 CSFB/TREMONT 0.74 0.72 0.71 0.77 ALTVEST 0.97 0.92 0.97 VAN 0.93 0.96 HFR 0.86 FUNDS OF FUNDS TUNA ALTVEST VAN HFR ZURICH 0.90 0.74 0.77 0.97 TUNA 0.91 0.90 0.97 ALTVEST 0.83 0.83 VAN 0.93 CONVERTIBLE ARBITRAGE HFR CSFB/TREMONT TUNA HENNESSEE 0.58 0.20 0.77 HFR 0.46 0.72 CSFB/TREMONT 0.35 RISK ARBITRAGE HENNESSEE TUNA ALTVEST HFR ZURICH 0.91 0.72 0.94 0.91 HENNESSEE 0.77 0.93 0.91 TUNA 0.77 0.76 ALTVEST 0.89 DISTRESSED HENNESSEE TUNA ALTVEST VAN HFR ZURICH 0.91 0.93 0.84 0.52 0.95 HENNESSEE 0.94 0.87 0.54 0.94 TUNA 0.90 0.63 0.95 ALTVEST 0.76 0.88 VAN 0.64 EMERGING MARKETS HENNESSEE HFR CSFB/TREMONT ALTVEST VAN ZURICH 0.96 0.94 0.94 0.67 0.75 HENNESSEE 0.97 0.95 0.72 0.86 HFR 0.96 0.73 0.89 CSFB/TREMONT 0.71 0.82 ALTVEST 0.71 MACRO HENNESSEE HFR CSFB/TREMONT TUNA ALTVEST VAN ZURICH 0.47 0.46 0.29 0.28 0.37 0.12 HENNESSEE 0.80 0.66 0.39 0.52 0.35 HFR 0.73 0.52 0.77 0.55 CSFB/TREMONT 0.52 0.50 0.35 TUNA 0.37 0.08 ALTVEST 0.51 LONG-SHORT EQUITY CSFB/TREMONT TUNA HFR 0.94 0.95 CSFB/TREMONT 0.85 EQ. MARKET NEUTRAL HENNESSEE HFR CSFB/TREMONT TUNA VAN ZURICH 0.39 0.26 0.14 0.12 0.71 HENNESSEE 0.68 0.27 0.35 0.07 HFR 0.31 0.29 -0.03 CSFB/TREMONT 0.47 0.02 TUNA 0.05 MARKET INDICES DJIA Russell 2000 NASDAQ Lehman S&P 500 0.82 0.58 0.50 0.17 DJIA 0.63 0.29 0.11 Russell 2000 0.64 0.03 NASDAQ 0.03
Discussion Paper 2001-09
© Chris Brooks and Harry Kat
21
Table 4: Inter-Category Correlations between HFR Indices
FUNDS OF
FUNDS CONVERTIBLE
ARBITRAGE RISK
ARBITRAGE DISTRESSED EMERGING
MARKETS MACRO LONG-
SHORT MARKET NEUTRAL
AGGREGATE 0.91 0.61 0.57 0.79 0.85 0.71 0.95 0.23 FUNDS OF FUNDS 0.59 0.45 0.79 0.86 0.80 0.83 0.20 CONVERTIBLE ARBITRAGE 0.54 0.76 0.53 0.38 0.50 0.17 RISK ARBITRAGE 0.59 0.46 0.29 0.49 0.26 DISTRESSED 0.73 0.52 0.68 0.20 EMERGING MARKETS 0.58 0.70 0.17 MACRO 0.65 0.24 LONG-SHORT 0.16
Discussion Paper 2001-09
© Chris Brooks and Harry Kat
22
Table 5: Time Series Properties of Hedge Fund Index Returns
ACF(1) ACF(2) ACF(3) ACF(4) ACF(5) LB-Q(10) ARCH(4) AGGREGATE HENNESSEE 0.17 -0.02 -0.07 -0.09 -0.13 6.64 1.55 CSFB/TREMONT 0.05 0.01 -0.04 -0.13 0.06 5.39 1.41 ALTVEST 0.15 0.01 -0.08 -0.11 -0.12 6.30 2.18 VAN 0.17 0.05 -0.11 -0.07 -0.11 7.08 4.99 HFR 0.17 -0.01 -0.08 -0.06 -0.11 6.88 0.31 TUNA 0.18 0.03 -0.93 -0.10 -0.14 7.64 8.06* FUNDS OF FUNDS ZURICH 0.21* 0.07 -0.09 -0.15 -0.15 11.01 0.20 TUNA 0.26** 0.06 -0.08 -0.12 -0.16 11.10 3.88 ALTVEST 0.20* 0.04 -0.06 -0.07 -0.15 9.60 10.67** VAN 0.36*** 0.10 -0.13 -0.16 -0.16 17.99** 4.43 HFR 0.30** 0.08 -0.05 -0.10 -0.11 11.13 6.94 CONVERTIBLE ARBITRAGE HENNESSEE 0.42*** 0.04 -0.03 -0.13 -0.12 18.46** 11.69** HFR 0.40*** 0.11 -0.15 -0.08 -0.13 22.57** 9.86** CSFB/TREMONT 0.53*** 0.43*** 0.03 0.06 -0.04 41.71*** 12.89** TUNA 0.43*** 0.13 -0.08 -0.04 -0.08 21.59** 3.87 RISK ARBITRAGE ZURICH 0.25** 0.02 -0.07 -0.09 0.01 10.81 0.32 HENNESSEE 0.17 -0.04 -0.05 -0.15 0.05 8.79 0.78 TUNA 0.16 -0.02 -0.05 -0.01 0.19* 11.11 3.19 ALTVEST 0.26** -0.01 -0.06 -0.04 -0.03 10.06 0.83 HFR 0.17 0.04 0.01 -0.16 0.01 7.42 10.54** DISTRESSED ZURICH 0.33*** 0.16 -0.01 0.03 -0.11 13.16 0.26 HENNESSEE 0.41*** 0.17 0.02 0.05 -0.01 17.94* 0.62 TUNA 0.24** 0.07 -0.08 -0.08 -0.06 6.95 0.51 ALTVEST 0.38*** 0.08 -0.07 -0.08 -0.08 15.49 0.34 VAN 0.22** 0.02 -0.03 -0.04 -0.05 5.95 1.11 HFR 0.43*** 0.13 -0.03 0.02 -0.06 17.33* 0.51 EMERGING MARKETS ZURICH 0.23** 0.11 0.06 0.01 0.02 9.66 3.12 HENNESSEE 0.23** 0.04 0.01 0.01 -0.01 9.74 2.74 HFR 0.28** 0.04 0.05 0.04 0.02 10.61 1.83 CSFB/TREMONT 0.25** 0.01 0.05 0.05 0.04 8.42 1.79 ALTVEST 0.16 -0.02 -0.05 -0.12 -0.02 4.24 0.24 VAN 0.17 0.06 -0.02 -0.08 0.05 9.35 1.35 MACRO ZURICH -0.07 -0.01 -0.18 0.02 0.08 5.91 2.22 HENNESSEE 0.05 -0.05 -0.07 -0.09 -0.01 4.87 5.89 HFR 0.11 0.01 -0.03 -0.10 0.09 6.77 2.75 CSFB/TREMONT 0.02 0.05 0.07 -0.14 0.28** 16.17* 2.47 TUNA -0.05 -0.25** -0.08 0.03 0.31*** 29.06*** 2.07 ALTVEST 0.07 -0.02 -0.11 -0.06 -0.15 8.44 4.81 VAN 0.01 -0.04 -0.01 -0.10 0.06 10.09 8.12* LONG-SHORT EQUITY HFR 0.10 -0.01 -0.04 -0.08 -0.20* 7.03 9.96** CSFB/TREMONT 0.10 0.01 -0.10 -0.15 -0.26** 12.83 6.95 TUNA 0.16 0.04 -0.07 -0.07 -0.19* 8.88 12.29**

Discussion Paper 2001-09
© Chris Brooks and Harry Kat
23
ACF(1) ACF(2) ACF(3) ACF(4) ACF(5) LB-Q(10) ARCH(4) EQUITY MARKET NEUTRAL ZURICH -0.01 -0.04 -0.01 -0.01 -0.01 7.39 1.26 HENNESSEE 0.22** 0.20* 0.14 0.01 0.14 28.83*** 3.67 HFR 0.23** 0.01 -0.01 0.04 0.16 21.23** 3.42 CSFB/TREMONT 0.11 -0.06 -0.13 -0.18 -0.03 15.37 17.34*** TUNA 0.13 0.01 -0.10 -0.26** -0.12 14.89 3.13 VAN 0.14 -0.01 -0.03 -0.02 -0.05 6.61 9.58** MARKET INDICES S&P 500 -0.10 -0.06 0.05 -0.05 0.05 4.12 4.64 DJIA -0.11 -0.01 -0.12 -0.01 0.11 6.25 5.95 Russell 2000 0.01 -0.13 -0.15 -0.05 -0.21* 10.34 0.56 NASDAQ 0.02 -0.02 0.04 0.03 -0.15 4.22 15.44*** Lehman Gov. Bond 0.21* -0.05 0.18 -0.02 -0.05 7.49 7.83
Notes: *, ** and *** denote significance at the 10%, 5%, and 1% levels respectively. The Ljung-Box Q* test for autocorrelation of order up to 10 is asymptotically distributed as a central χ2 with 10 degrees of freedom under the null hypothesis, with 5% critical value 18.31; ARCH(4) is Engle’s LM test for autoregressive conditional heteroscedasticity, which is asymptotically distributed as a central χ2 with 4 degrees of freedom under the null hypothesis, with 5% critical value 9.49.

Discussion Paper 2001-09
© Chris Brooks and Harry Kat
24
Table 6: Standard Deviations and Sharpe Ratios for Observed 1-Month, Unsmoothed 1-Month and 3-Month Hedge fund Index Returns
Observed Std. Dev.
Observed Sharpe Ratio
Unsmoothed Std. Dev.
Unsmoothed Sharpe Ratio
3-Month Std. Dev.
3-Month Sharpe Ratio
AGGREGATE HENNESSEE 2.34 1.02 2.80 0.85 2.66 0.73 CSFB/TREMONT 2.86 0.94 3.01 0.90 2.79 0.77 ALTVEST 2.24 1.65 2.62 1.42 2.49 1.10 VAN 2.53 1.24 3.01 1.04 2.93 0.81 HFR 2.44 1.12 2.91 0.94 2.77 0.77 TUNA 2.19 1.80 2.64 1.49 2.43 1.18 FUNDS OF FUNDS ZURICH 1.64 1.20 2.03 0.97 1.91 0.90 TUNA 1.82 1.30 2.38 1.00 2.07 0.95 ALTVEST 2.99 1.54 3.76 1.22 3.47 0.93 VAN 2.40 1.16 3.50 0.80 3.03 0.73 HFR 2.07 0.70 2.81 0.52 2.47 0.58 CONVERTIBLE ARBITRAGE HENNESSEE 1.07 1.72 1.69 1.09 1.49 1.08 HFR 0.92 2.64 1.41 1.73 1.22 1.62 CSFB/TREMONT 1.36 1.81 2.42 1.01 1.87 1.07 TUNA 0.96 2.90 1.53 1.82 1.31 1.67 RISK ARBITRAGE ZURICH 1.07 2.14 1.39 1.65 1.32 1.46 HENNESSEE 0.98 2.28 1.17 1.91 1.19 1.58 TUNA 1.03 2.70 1.20 2.32 1.20 1.85 ALTVEST 1.12 2.67 1.47 2.04 1.40 1.66 HFR 1.06 2.26 1.26 1.90 1.19 1.68 DISTRESSED ZURICH 1.77 1.17 2.51 0.83 2.31 0.78 HENNESSEE 1.88 0.89 2.92 0.58 2.57 0.61 TUNA 2.46 0.83 3.17 0.65 2.92 0.61 ALTVEST 1.82 1.32 2.72 0.88 2.47 0.81 VAN 1.53 1.44 1.92 1.14 1.86 1.00 HFR 1.75 0.94 2.79 0.59 2.38 0.66 EMERGING MARKETS ZURICH 4.75 0.01 5.97 0.01 5.88 0.10 HENNESSEE 4.59 -0.07 5.77 -0.05 5.79 0.07 HFR 5.04 0.11 6.70 0.08 6.34 0.14 CSFB/TREMONT 5.64 -0.02 7.14 -0.02 7.19 0.08 ALTVEST 2.21 1.27 2.59 1.08 2.48 0.88 VAN 6.05 0.12 7.14 0.10 7.15 0.14 MACRO ZURICH 1.61 0.89 1.49 0.96 1.36 1.04 HENNESSEE 2.55 0.59 2.70 0.56 2.66 0.56 HFR 2.34 0.98 2.62 0.87 2.25 0.86 CSFB/TREMONT 4.18 0.83 4.26 0.81 4.12 0.63 TUNA 2.82 1.06 2.62 1.14 1.91 1.24 ALTVEST 2.72 1.26 2.93 1.17 2.61 0.97 VAN 3.48 0.34 3.53 0.33 3.74 0.33 LONG-SHORT HFR 3.07 1.48 3.41 1.33 3.36 0.95 CSFB/TREMONT 3.74 0.99 4.15 0.89 3.93 0.70 TUNA 3.07 1.98 3.63 1.68 3.44 1.19
Discussion Paper 2001-09
© Chris Brooks and Harry Kat
25
Observed Std. Dev.
Observed Sharpe Ratio
Unsmoothed Std. Dev.
Unsmoothed Sharpe Ratio
3-Month Std. Dev.
3-Month Sharpe Ratio
EQUITY MARKET NEUTRAL ZURICH 0.54 3.53 0.46 3.69 0.55 3.12 HENNESSEE 0.87 1.07 1.09 0.85 1.10 1.04 HFR 1.11 1.48 1.41 1.16 1.38 1.08 CSFB/TREMONT 0.90 2.70 1.00 2.43 0.93 2.13 TUNA 1.60 1.81 1.82 1.59 1.96 1.19 VAN 1.43 2.32 1.43 2.33 1.46 1.73 MARKET INDICES S&P 500 4.53 0.85 4.12 0.94 4.54 0.85 DJIA 4.56 0.81 4.11 0.90 4.35 0.85 Russell 2000 5.76 0.42 5.85 0.41 5.32 0.45 NASDAQ 8.91 0.53 9.15 0.52 9.19 0.51 Lehman Gov. Bond 0.86 0.75 0.87 0.75 0.93 0.72
Note: for comparability with observed and unsmoothed standard deviations, the 3-month standard deviations are expressed on a monthly basis.

Discussion Paper 2001-09
© Chris Brooks and Harry Kat
26
Table 7: Portfolio Optimization at 8% Standard Deviation: Annualised Improvement in
Expected Return over No Hedge Fund Case and Percentage of Portfolio Invested in Hedge Funds
Observed Returns Unsmoothed returns 3-month returns Mean % HF Mean % HF Mean % HF AGGREGATE HENNESSEE 1.08 64.85 0.20 25.97 0.36 37.44 CSFB/TREMONT 1.08 49.46 0.54 32.88 0.84 49.82 ALTVEST 5.28 93.44 3.37 87.75 4.20 93.84 VAN 2.64 84.43 0.91 46.75 1.44 64.25 HFR 1.44 77.39 0.36 35.19 0.64 52.08 TUNA 6.12 100.00 4.01 86.83 5.20 95.71 FUNDS OF FUNDS ZURICH 1.32 67.19 0.41 45.65 0.48 52.32 TUNA 2.16 69.51 0.78 51.54 1.20 72.20 ALTVEST 5.16 77.04 2.39 52.02 3.68 69.65 VAN 2.16 73.69 0.28 22.05 0.80 43.56 HFR 0.12 21.00 0.00 0.00 0.00 0.00 CONVERTIBLE ARBITRAGE HENNESSEE 1.92 55.43 0.94 60.69 1.08 61.05 HFR 0.72 54.24 2.40 55.40 2.52 57.08 CSFB/TREMONT 3.12 53.05 1.66 58.60 2.56 56.01 TUNA 3.72 53.24 3.11 55.20 3.20 57.14 RISK ARBITRAGE ZURICH 2.64 58.22 0.00 0.00 2.00 61.68 HENNESSEE 2.64 56.07 1.74 60.59 2.00 58.71 TUNA 3.60 56.82 3.18 53.34 3.08 60.15 ALTVEST 3.96 59.12 3.37 59.68 3.40 63.43 HFR 2.88 56.31 2.48 53.16 2.32 59.35 DISTRESSED ZURICH 1.56 68.93 0.18 24.96 0.40 40.54 HENNESSEE 0.60 53.31 0.01 3.79 0.00 6.09 TUNA 0.60 42.63 0.07 11.22 0.08 16.30 ALTVEST 2.16 70.45 0.35 32.76 0.60 49.39 VAN 2.28 60.92 1.49 63.76 1.44 67.24 HFR 0.60 57.49 0.00 0.00 0.04 9.83 EMERGING MARKETS ZURICH 0.00 0.00 0.00 0.00 0.00 0.00 HENNESSEE 0.00 0.00 0.00 0.00 0.00 0.00 HFR 0.00 0.00 0.00 0.00 0.00 0.00 CSFB/TREMONT 0.00 0.00 0.00 0.00 0.00 0.00 ALTVEST 2.40 91.87 0.98 63.23 1.40 74.52 VAN 0.00 0.00 0.00 0.00 0.00 0.00 MACRO ZURICH 0.36 56.16 0.67 56.29 0.52 57.30 HENNESSEE 0.00 3.71 0.00 0.00 0.00 0.00 HFR 1.20 61.24 0.54 38.56 0.92 59.38 CSFB/TREMONT 1.20 31.13 0.95 26.80 1.44 34.11 TUNA 2.28 58.17 2.42 62.60 3.44 62.21 ALTVEST 2.64 75.86 1.63 58.84 2.76 88.70 VAN 0.00 0.00 0.00 0.00 0.00 0.00

Discussion Paper 2001-09
© Chris Brooks and Harry Kat
27
Observed Returns Unsmoothed returns 3-month returns Mean % HF Mean % HF Mean % HF LONG-SHORT EQUITY HFR 4.68 74.65 3.06 64.93 3.84 71.50 CSFB/TREMONT 1.32 43.96 0.58 26.82 0.76 44.52 TUNA 8.76 74.80 5.88 62.55 7.36 69.71 EQUITY MARKET NEUTRAL ZURICH 2.28 50.97 2.11 45.31 1.88 50.94 HENNESSEE 0.12 55.83 0.50 46.25 0.28 50.10 HFR 1.32 58.11 0.76 57.33 0.68 60.39 CSFB/TREMONT 3.12 53.99 2.62 51.71 2.60 55.09 TUNA 3.84 56.37 3.18 58.79 3.16 63.72 VAN 4.80 51.58 4.27 49.27 4.28 58.33
Discussion Paper 2001-09
© Chris Brooks and Harry Kat
28
Table 8: Portfolio Optimization at 8% Standard Deviation: Change in Skewness and Kurtosis due to Addition Hedge Funds
Observed Returns Unsmoothed returns 3-month returns Skew Kurt Skew Kurt Skew Kurt AGGREGATE HENNESSEE -0.63 3.95 -0.34 1.25 -0.47 2.02 CSFB/TREMONT 0.00 0.98 -0.13 0.75 0.02 0.92 ALTVEST 0.17 1.89 0.48 1.5 0.46 1.66 VAN 0.44 1.81 -0.14 0.99 0.1 1.31 HFR -0.33 2.57 -0.34 1.21 -0.41 1.85 TUNA 0.58 1.41 0.63 1.03 0.62 1.23 FUNDS OF FUNDS ZURICH -0.60 3.93 -0.42 2.30 -0.48 2.82 TUNA -0.40 2.51 -0.35 1.75 -0.27 2.39 ALTVEST 1.04 1.33 0.46 0.11 1.08 1.12 VAN 0.19 1.16 -0.12 0.30 -0.11 0.63 HFR -0.26 0.96 0.00 0.00 0.00 0.00 CONVERTIBLE ARBITRAGE HENNESSEE -0.41 1.82 -0.38 1.83 -0.39 1.88 HFR -0.58 2.87 -0.55 2.81 -0.58 3.01 CSFB/TREMONT -0.77 4.89 -0.86 6.16 -0.78 5.29 TUNA -0.44 2.16 -0.40 2.09 -0.43 2.23 RISK ARBITRAGE ZURICH -0.88 4.65 0.00 0.00 -0.93 5.16 HENNESSEE -0.85 4.30 -0.92 4.92 -0.87 4.61 TUNA -0.74 3.65 -0.63 3.11 -0.77 3.95 ALTVEST -0.81 4.29 -0.77 4.21 -0.87 4.84 HFR -0.98 5.26 -0.83 4.50 -1.03 5.81 DISTRESSED ZURICH -1.39 8.59 -0.40 1.86 -0.75 3.98 HENNESSEE -1.18 5.90 -0.07 0.21 -0.12 0.35 TUNA -1.18 6.01 -0.26 0.92 -0.40 1.51 ALTVEST -0.92 4.53 -0.44 1.69 -0.68 3.03 VAN -0.70 3.02 -0.66 3.02 -0.66 3.24 HFR -1.15 5.97 0.00 0.00 -0.17 0.55 EMERGING MARKETS ZURICH 0.00 0.00 0.00 0.00 0.00 0.00 HENNESSEE 0.00 0.00 0.00 0.00 0.00 0.00 HFR 0.00 0.00 0.00 0.00 0.00 0.00 CSFB/TREMONT 0.00 0.00 0.00 0.00 0.00 0.00 ALTVEST -0.23 1.96 -0.31 1.58 -0.28 1.75 VAN 0.00 0.00 0.00 0.00 0.00 0.00 MACRO ZURICH 0.11 0.56 0.08 0.50 0.09 0.53 HENNESSEE -0.04 0.11 0.00 0.00 0.00 0.00 HFR 0.21 0.19 -0.02 0.18 0.19 0.14 CSFB/TREMONT 0.30 -0.04 0.20 -0.05 0.33 -0.08 TUNA 0.70 -0.27 0.74 -0.49 0.63 -0.63 ALTVEST 0.79 -0.75 0.55 -0.86 0.96 -0.81 VAN 0.00 0.00 0.00 0.00 0.00 0.00
Discussion Paper 2001-09
© Chris Brooks and Harry Kat
29
Observed Returns Unsmoothed returns 3-month returns Skew Kurt Skew Kurt Skew Kurt LONG-SHORT EQUITY HFR 0.66 0.83 0.61 0.46 0.64 -0.42 CSFB/TREMONT 0.04 1.14 -0.15 0.71 0.11 1.01 TUNA 1.00 1.35 1.01 0.99 1.02 1.16 EQUITY MARKET NEUTRAL ZURICH -0.22 0.86 -0.17 0.72 -0.18 0.74 HENNESSEE -0.33 1.68 -0.26 1.27 -0.27 1.40 HFR -0.11 0.87 -0.07 0.72 -0.06 0.73 CSFB/TREMONT -0.13 0.98 -0.09 0.82 -0.08 0.86 TUNA -0.17 1.47 -0.11 1.33 -0.08 1.38 VAN -0.27 1.29 -0.23 1.11 -0.16 1.24
Discussion Paper 2001-09
© Chris Brooks and Harry Kat
30
Table 9: Correlation between Hedge Fund Index Returns and Market Indices for Observed 1-Month, Unsmoothed 1-Month and 3-Month Returns
Observed
Correlation S&P 500
Unsmooth Correlation
S&P500
3-Month Correlation
S&P500
Observed Correlation Bond Index
Unsmooth Correlation Bond Index
3-Month Correlation Bond Index
AGGREGATE HENNESSEE 0.65 0.67 0.71 -0.05 0.04 -0.54 CSFB/TREMONT 0.50 0.52 0.60 0.13 0.22 -0.29 ALTVEST 0.66 0.68 0.70 -0.01 0.08 -0.46 VAN 0.64 0.66 0.67 -0.05 0.05 -0.47 HFR 0.70 0.72 0.75 -0.03 0.05 -0.45 TUNA 0.67 0.68 0.75 0.02 0.13 -0.43 FUNDS OF FUNDS ZURICH 0.57 0.62 0.60 -0.04 0.07 -0.43 TUNA 0.51 0.56 0.59 -0.02 0.12 -0.48 ALTVEST 0.58 0.60 0.73 -0.06 0.03 -0.43 VAN 0.49 0.56 0.55 -0.02 0.14 -0.38 HFR 0.53 0.56 0.57 -0.05 0.11 -0.46 CONVERTIBLE ARBITRAGE
HENNESSEE 0.36 0.50 0.43 -0.17 -0.09 -0.31 HFR 0.36 0.47 0.39 -0.08 0.02 -0.23 CSFB/TREMONT 0.08 0.27 0.06 -0.11 0.00 -0.17 TUNA 0.25 0.39 0.34 -0.11 -0.03 -0.25 RISK ARBITRAGE ZURICH 0.56 0.60 0.58 -0.06 -0.02 -0.29 HENNESSEE 0.47 0.49 0.51 -0.14 -0.12 -0.38 TUNA 0.49 0.50 0.59 0.022 0.00 -0.21 ALTVEST 0.58 0.62 0.61 -0.12 -0.08 -0.36 HFR 0.43 0.45 0.55 -0.11 -0.10 -0.31 DISTRESSED ZURICH 0.53 0.63 0.56 -0.09 -0.01 -0.32 HENNESSEE 0.43 0.50 0.56 -0.18 -0.05 -0.47 TUNA 0.48 0.51 0.54 -0.06 0.01 -0.30 ALTVEST 0.54 0.62 0.64 -0.10 0.04 -0.41 VAN 0.39 0.44 0.42 -0.07 -0.01 -0.28 HFR 0.48 0.62 0.54 -0.14 -0.02 -0.41 EMERGING MARKETS ZURICH 0.55 0.63 0.50 -0.16 -0.05 -0.52 HENNESSEE 0.55 0.63 0.53 -0.15 -0.03 -0.56 HFR 0.59 0.67 0.54 -0.14 -0.02 -0.52 CSFB/TREMONT 0.51 0.60 0.43 -0.15 -0.02 -0.55 ALTVEST 0.69 0.73 0.69 -0.01 0.09 -0.44 VAN 0.56 0.60 0.48 -0.13 -0.03 -0.50 MACRO ZURICH 0.46 0.46 0.32 0.20 0.25 -0.14 HENNESSEE 0.51 0.52 0.51 0.22 0.26 -0.18 HFR 0.45 0.47 0.50 0.25 0.33 -0.12 CSFB/TREMONT 0.28 0.28 0.19 0.24 0.30 0.07 TUNA 0.25 0.26 0.24 0.28 0.36 0.27 ALTVEST 0.60 0.61 0.67 0.22 0.28 -0.33 VAN 0.39 0.39 0.37 0.05 0.12 -0.51

Discussion Paper 2001-09
© Chris Brooks and Harry Kat
31
Observed Correlation
S&P 500
Unsmooth Correlation
S&P500
3-Month Correlation
S&P500
Observed Correlation Bond Index
Unsmooth Correlation Bond Index
3-Month Correlation Bond Index
LONG-SHORT HFR 0.65 0.65 0.76 -0.01 0.05 -0.40 CSFB/TREMONT 0.60 0.60 0.77 0.04 0.11 -0.35 TUNA 0.60 0.59 0.75 -0.03 0.05 -0.37 EQ. MKT. NEUTRAL ZURICH 0.23 0.23 0.24 0.29 0.32 0.04 HENNESSEE 0.54 0.08 -0.04 0.28 0.28 0.25 HFR 0.52 0.56 0.47 0.23 0.24 0.12 CSFB/TREMONT 0.35 0.54 0.44 0.01 0.06 -0.30 TUNA 0.16 0.36 0.26 0.12 0.18 -0.25 VAN -0.02 0.16 0.32 -0.01 0.07 -0.37
Figure 1: Unconditional Distribution of HFR Risk Arbitrage Index Returns
-8 -6 -4 -2 0 2 4
0.00
0.08
0.16
0.24
0.32
0.40
0.48
0.56