the status of pesticide residues in the drinking water sources in meiliangwan bay, taihu lake of...
TRANSCRIPT

Environmental Monitoring and Assessment (2006) 123: 351–370DOI: 10.1007/s10661-006-9202-0 c© Springer 2006
THE STATUS OF PESTICIDE RESIDUES IN THE DRINKING WATER
SOURCES IN MEILIANGWAN BAY, TAIHU LAKE OF CHINA
TA NA, ZHOU FANG, GAO ZHANQI, ZHONG MING and SUN CHENG∗State Key Laboratory of Pollution Control and Resouce Reuse, School of Environment,
Nanjing University, Nanjing 210093, China(∗author for correspondence, e-mail: [email protected])
(Received 27 October 2005; accepted 16 January 2006)
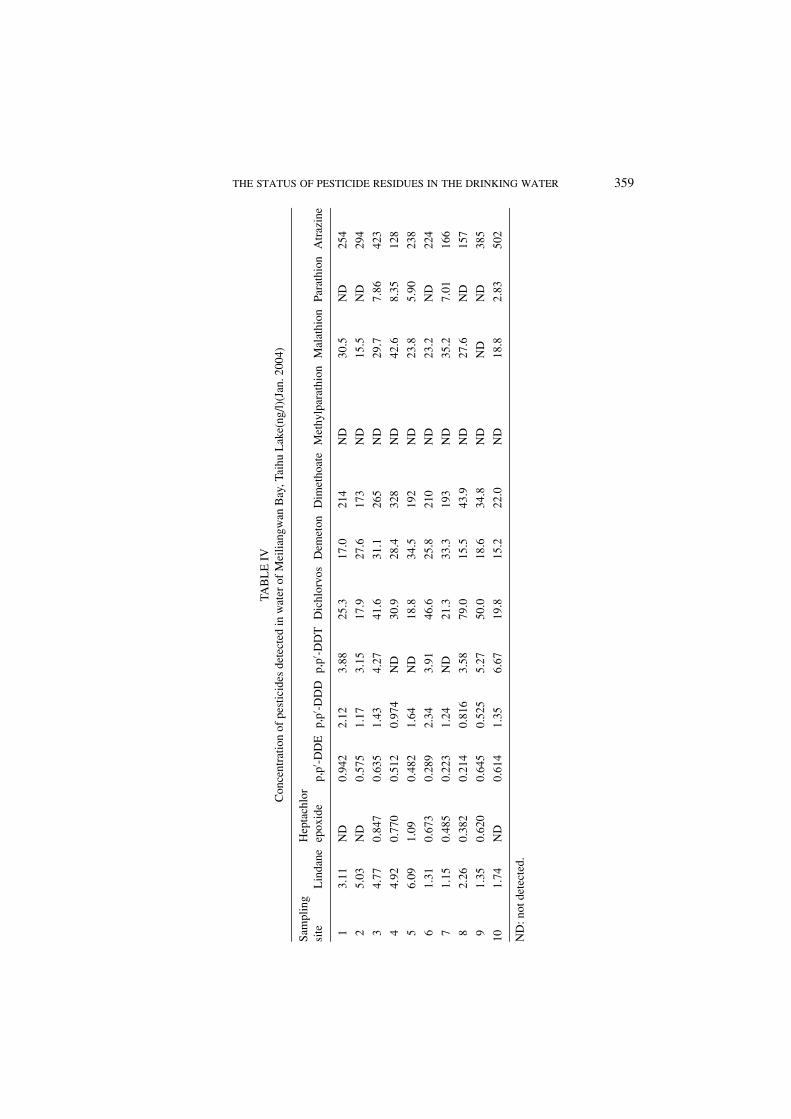
Abstract. The study was carried out to assess the levels of pesticide residues in the water ofMeiliangwan Bay, Taihu Lake of China. The most commonly employed organochlorine pesticides(OCPs), organophosphorus pesticides (OPPs) and herbicide atrazine were analyzed. The water sam-ples were collected seasonally from Meiliangwan Bay within a period of one year. The pesticideswere analyzed by gas chromatography (GC) with μECD or NPD after solid-phase extraction (SPE),which was confirmed by GC with an ion trap mass spectrometry (MS). The mean concentrationswere 1.98 ng/l for lindane, 0.378 ng/l for heptachlor epoxide, 0.367 ng/l for p,p′-DDE, 0.496 ng/lfor p,p′-DDD, 1.06 ng/l for p,p′-DDT and 51.6 ng/l for dichlorvos, 39.0 ng/l for demeton, 346 ng/lfor dimethoate, 4.12 ng/l for methyl parathion, 11.6 ng/l for malathion, 2.17 ng/l for parathion and217 ng/l for atrazine. Generally, low concentrations of OCPs were found, whereas the concentrationsof the OPPs and atrazine in the water of Taihu Lake were relatively high. Heptachlor epoxide andlindane were the two most commonly encountered OCPs while dichlorvos, demeton and dimethoatewere found to have much higher concentrations and occurrences than other OPPs.
Keywords: Taihu Lake, pesticide, solid phase extraction, gas chromatography-mass spectrometry,drinking water sources
1. Introduction
Taihu Lake is a typical shallow freshwater lake with an area of 2338 km2 and anaverage depth of 1.9 m (Qiu et al., 2004), which is one of the five largest lakesin China. The Meiliangwan Bay locates in the north of Taihu Lake and providesdrinking water supply for Wuxi City. Its water quality has been influenced by thedischarge of industrial waste water, domestic sewage and agricultural pollutantsfrom Taihu Lake Area (TLA) which is one of the most developed regions anddensely populated area in China. However, the water pollution management hasnot kept pace with the rapid development of the economy and the intensive useof water sources, as a result the water quality of Taihu Lake has been deterioratedseriously (Zhu et al., 2002). The economic loss caused by the water pollutionis approximately 1.2 billion US dollar per year (Wang et al., 2003), which hasgreat influence on sustainable development of TLA. The water contamination hasthreatened safety of the drinking water supply of millions of people living in WuxiCity.

352 TA NA ET AL.
One of the main reasons of the water quality deterioration may be due to thepesticide application in this region. The applied pesticides may be released to theaquatic environment via soil percolation, air drift or surface run-off, etc., pollutingthe natural water and affecting abundance diversity of non-target species as well asproducing complex effects on the ecosystems (Rovedattil et al., 2001).
TLA is one of the most developed agriculture areas with high-yield and high-intensity pesticide application in China (Wang et al., 2005). The pesticides havebeen detected in various environmental matrices of this area such as soil, air, sedi-ment, fish and eggs of night heron (Feng et al., 2003; Gong et al., 2001). Recently,the pesticide residues in Taihu Lake are of great concern in China. However, up tonow, few systematic researches have been reported regarding the OCPs, OPPs andatrazine pollutions in Taihu Lake.
In order to understand the present pollution status of the pesticides in the waterof Taihu Lake and to recommend future rationalization of controlling, reducing andeliminating releases of the pesticides in TLA, the pesticides in water of MeiliangwanBay, Taihu Lake were investigated seasonally within a period of one year. Resultsof this study should be of value not only to pollution control of pesticides in TLA,but also to guarantee the safety of drinking water.
2. Materials and Methods
2.1. MATERIALS
OCPs standard was a mixed solution (2000 μg/l) in toluene:hexane (50:50) in-cluding 17 organochlorine pesticide components, but only five of them were listedhere, which were investigated in this study: lindane(99.8%), p,p′-DDD(99.4%),p,p′-DDE(99.6%), p,p′-DDT(98.9%), heptachlor epoxide (99.9%), OPPs wereas following: dichlorvos (99.6%), trichlorfon (97.8%), demeton O&S, (30.9%O,60.1%S), dimethoate (99.9%), methyl parathion (99.8%), malathion (97.3%),parathion (99.0%), atrazine (99.0%), decachlorobiphenyl (99.0%, internal stan-dard) and pentachloroanisole (97%, internal standards). The pesticide standardsand internal standards mentioned above were purchased from Supelco, Bellefonte,PA, USA.
The HPLC grade solvents (n-hexane, dichloromethane, isopropanol andmethanol) used in the analysis were purchased from Tedia, Fairfield, OH, USA. An-hydrous sodium sulfate (analytical grade) was purchased from Nanjing ChemicalFactory.
2.2. SAMPLE COLLECTION
The water samples under the surface of 0.5 m were collected from 10 differentsampling sites in Meiliangwan Bay by the aid of Global Position System. Figure 1

THE STATUS OF PESTICIDE RESIDUES IN THE DRINKING WATER 353
Figure 1. Map of Taihu Lake and the location of Meiliangwan Bay.
shows the map of Taihu Lake and the location of Meiliangwan Bay. The watersamples were collected three times within one year period which covered the normalseason (Nov. 2003), the dry season (Jan. 2004) and the rainy season (Aug. 2004).
Before sampling, glass bottles were washed with detergent, tap water, distilledwater and the sample water finally. The glass bottle was filled to the top with thesample water to eliminate air bubbles. The water samples were acidied to pH 2.0firstly with sulfuric acid to inhibit biological activity and then was carried to thelaboratory and stored at 4 ◦C, followed by extraction within 48 h.
2.3. SAMPLE PREPARATION
The water samples were prefiltered through 0.45 μm filter to eliminate particu-late matters and were adjusted to pH 6.0–7.0 with sodium hydroxide solution.The Supelclean ENVITM-18 SPE tube contains 1 mg C18 bonded silica with av-erage particle size 56.0 microns and total volume is 6 ml which was purchasedfrom Supelco, Bellefonte, PA, USA and was used for the sample preparation. Be-fore enrichment, the SPE tubes were conditioned with 10 ml of methanol and then10 ml of distilled water and stored in distilled water till collection of pesticidesfrom water samples. 1 L water samples were mixed well and trapped through theSPE tubes with a flow rate of 5 ml/min under vacuum. The SPE tubes enrichedpesticides were eluted by 5 ml different solvents twice respectively for differenttarget pesticides, and then the collected eluent was evaporated in an evaporator.

354 TA NA ET AL.
This solution was further concentrated by a gentle stream of N2 to 100 μl. Themixture of n-hexane- isopropanol (20:1, v/v), the mixture of dichloromethane – iso-propanol (9:1, v/v) and methanol were optimized to elute OCPs, OPPs and atrazine,respectively.
2.4. ANALYTICAL PROCEDURE
A known amount of internal standard was added to the above final extracts foranalysis of OCPs and atrazine or not added internal standard for analysis of OPPs,and then the extract was transferred to a glass micro vial. Decachlorobiphenyl andpentachloroanisole were applied as internal standards for analysis of OCPs andatrazine, respectively. However, without finding a suitable internal standard, theexternal standard method was applied for of OPPs. 1.0 μl of the final extracts wasautomatically injected into Agilent 6890 GC with different detectors and columnsfor different pesticides analysis. μECD was chosen as a detector for analysis ofOCPs and atrazine, NPD was chosen as a detector for analysis of OPPs. GC columns,detectors, oven temperature programs and various gas flow rate were listed in theTable I.
Analysis of the final extracts was also conducted by a Thermo Finnigan TraceGC interfaced with a PolarisQ ion trap mass spectrometry (GC-MS). The extractswere automatically injected into GC-MS with DB-5 fused-silica capillary column(30 m × 0.25 mm i.d., 0.25 μm film thickness). The instrument was operated withthe Xcalibur software from Finnigan. The conditions of the analysis were as follows:injection volume was 1.0 μl with splitless mode, injector temperature was set at250 ◦C and transfer line temperature was at 200 ◦C. The carrier gas was heliumwith flow rate of 1.5 ml/min at constant flow with vacuum compensation. Oventemperature program of GC-MS was as same as of GC for the correspondingpesticides. The MS was operated with a 70-eV electron impact (EI) mode and thescan range is 50–650 unit. The selected ion monitoring (SIM) mode was chosen toconfirm the target pesticides by typical ions for each pesticide. The retention time,the selected ions and the monitoring time range for each pesticide were shown inTable II.
3. Results and Discussion
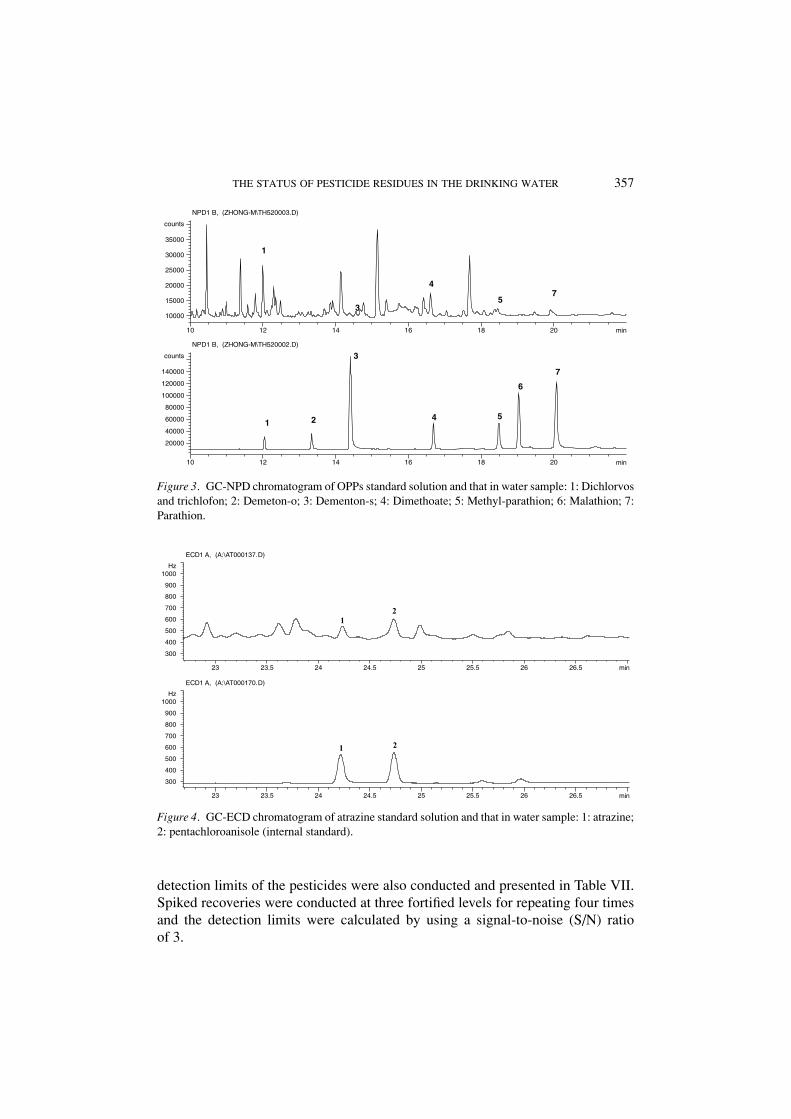
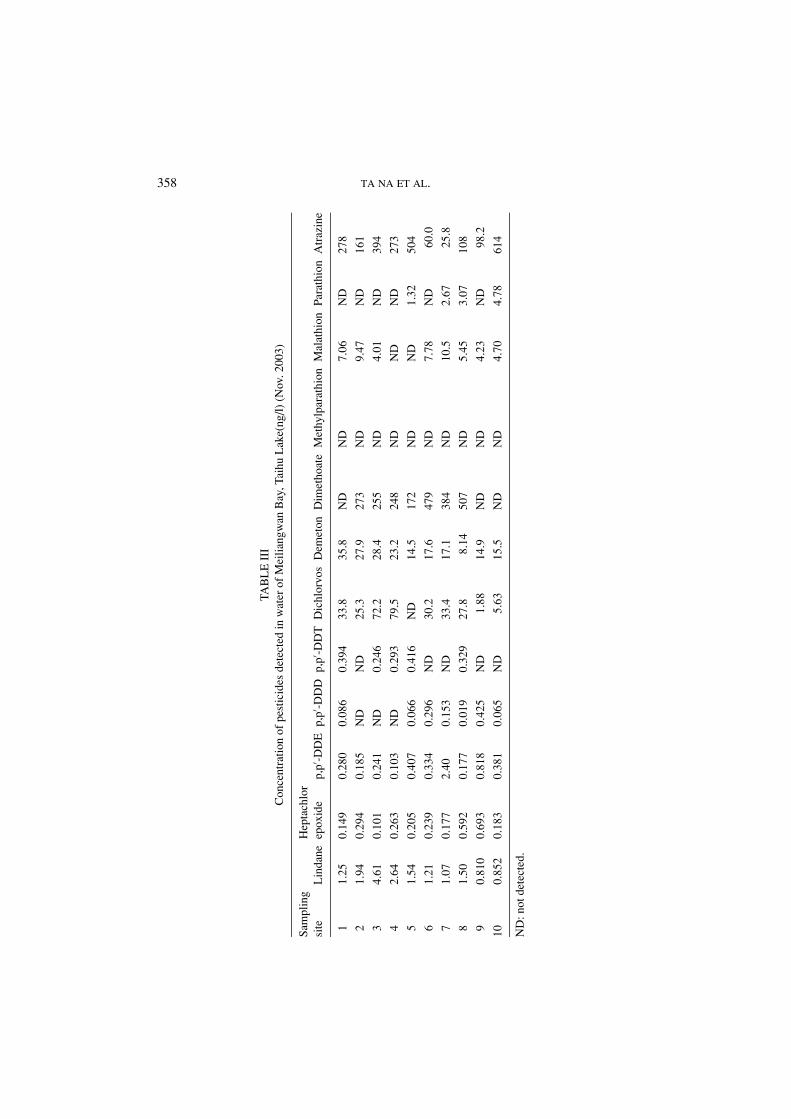
More than one hundred water samples from Meiliangwan Bay of Taihu Lakewere analyzed from Nov. 2003 to Aug. 2004 for 14 different kinds of organicpesticides and their metabolites. Representative GC chromatograms of standardsolutions and water samples are shown in Figures 2–4. The concentration ofpesticide in different water seasons and the data summary were presented inTables III–VI respectively. Additionally, the mean fortified recovery ranges and

THE STATUS OF PESTICIDE RESIDUES IN THE DRINKING WATER 355
TAB
LE
IG
Cco
lum
nsan
dde
tect
ors
and
cond
ition
s
Con
ditio
nsO
rgan
ochl
orin
eO
rgan
opho
spho
rus
Atr
azin
e
Col
umn
DB
-1D
B-1
7D
B-1
60m
×0.
25m
m30
m×
0.25
mm
60m
×0.
25m
mi.d
.×0.
25μ
mi.d
.×0.
25μ
mi.d
.×0.
25μ
m
Det
ecto
rE
CD
NPD
EC
D
Ove
nte
mpe
ratu
repr
ogra
m60
◦ C25
◦ C/m
in−−
−−→
170
◦ C4◦
C/m
in−−
−−→
190
◦ C8◦
C/m
in−−
−−→
230
◦ C(4
min
)1◦
C/m
in−−
−−→
240
◦ C25
◦ C/m
in−−
−−−→
300
◦ C(7
min
)
60◦ C
20◦ C
/m
in−−
−−−→
100
◦ C15
◦ C/m
in−−
−−−→
190
◦ C4◦
C/m
in−−
−−→
240
◦ C(2
min
)
60◦ C
10◦ C
/m
in−−
−−−→
200
◦ C
(2m
in)
4◦C
/m
in−−
−−→
240
◦ C10
◦ C/m
in−−
−−−→
280
◦ C(2
min
)
Inje
ctor
tem
pera
ture
250
◦ C22
0◦ C
250
◦ CD
etec
tor
tem
pera
ture
320
◦ C32
0◦ C
300
◦ CC
arri
erga
sflo
w1.
6m
l/min
4m
l/min
1.1
ml/m
in
Mak
e-up
gas
flow
60m
l/min
100
ml/m
in60
ml/m
in

356 TA NA ET AL.
TABLE IIThe retention time, selected ions and monitoring time range
Pesticide Retention time (min) Selected ions Time range (min)
Lindane 9.08 183,219 7.50–10.00
Heptachlor epoxide 12.96 353,355 12.50–13.50
p,p′-DDE 14.49 246,279 14.20–14.80
p,p′-DDD 15.66 235,237 15.50–15.90
p,p′-DDT 16.84 165,239,272 16.50–18.80
Dichlorvos 5.35 185,109,187 5.00–8.00
Demeton-o 8.41 88,171,60 8.00–9.50
Dementon-s 9.45 88,171,60 9.50–11.00
Dimethoate 9.56 125,93,87 9.50–11.00
Methyl-parathion 11.36 263,125,109 11.00–12.00
Malathion 12.26 173,127,99 12.00–12.50
Parathion 12.63 291,109,97 12.50–13.00
Atrazine 11.77 217,215,200 11.50–12.00
min12.5 15 17.5 20 22.5 25 27.5 30 32.5
Hz
250
500
750
1000
1250
1500
1750
2000
2250
ECD1 A, (A:\TH100015.D)
13
6
4
min12.5 15 17.5 20 22.5 25 27.5 30 32.5
Hz
500
1000
1500
2000
2500
3000
3500
ECD1 A, (A:\TH100004.D)
1
2 3
4
5
6
Figure 2. GC-ECD chromatogram of OCPs standard solution and that in water sample: 1: Lindane;2: Heptachlor epoxide; 3: p,p′-DDE; 4: p,p′-DDD; 5: p,p′-DDT; 6: decachlorobiphenyl (internalstandard).
THE STATUS OF PESTICIDE RESIDUES IN THE DRINKING WATER 357
min10 12 14 16 18 20
counts
10000
15000
20000
25000
30000
35000
NPD1 B, (ZHONG-M\TH520003.D)
5
4
1
3
7
min10 12 14 16 18 20
counts
20000
40000
60000
80000
100000
120000
140000
NPD1 B, (ZHONG-M\TH520002.D)
1 2
3
4 5
6
7
Figure 3. GC-NPD chromatogram of OPPs standard solution and that in water sample: 1: Dichlorvosand trichlofon; 2: Demeton-o; 3: Dementon-s; 4: Dimethoate; 5: Methyl-parathion; 6: Malathion; 7:Parathion.
min23 23.5 24 24.5 25 25.5 26 26.5
Hz
300
400
500
600
700
800
900
1000
ECD1 A, (A:\AT000137.D)
12
min23 23.5 24 24.5 25 25.5 26 26.5
Hz
300
400
500
600
700
800
900
1000
ECD1 A, (A:\AT000170.D)
21
Figure 4. GC-ECD chromatogram of atrazine standard solution and that in water sample: 1: atrazine;2: pentachloroanisole (internal standard).
detection limits of the pesticides were also conducted and presented in Table VII.Spiked recoveries were conducted at three fortified levels for repeating four timesand the detection limits were calculated by using a signal-to-noise (S/N) ratioof 3.
358 TA NA ET AL.
TAB
LE
III
Con
cent
ratio
nof
pest
icid
esde
tect
edin
wat
erof
Mei
liang
wan
Bay
,Tai
huL
ake(
ng/l)
(Nov
.200
3)
Sam
plin
gH
epta
chlo
rsi
teL
inda
neep
oxid
ep,
p′ -DD
Ep,
p′ -DD
Dp,
p′ -DD
TD
ichl
orvo
sD
emet
onD
imet
hoat
eM
ethy
lpar
athi
onM
alat
hion
Para
thio
nA
traz
ine
11.
250.
149
0.28
00.
086
0.39
433
.835
.8N
DN
D7.
06N
D27
8
21.
940.
294
0.18
5N
DN
D25
.327
.927
3N
D9.
47N
D16
1
34.
610.
101
0.24
1N
D0.
246
72.2
28.4
255
ND
4.01
ND
394
42.
640.
263
0.10
3N
D0.
293
79.5
23.2
248
ND
ND
ND
273
51.
540.
205
0.40
70.
066
0.41
6N
D14
.517
2N
DN
D1.
3250
4
61.
210.
239
0.33
40.
296
ND
30.2
17.6
479
ND
7.78
ND
60.0
71.
070.
177
2.40
0.15
3N
D33
.417
.138
4N
D10
.52.
6725
.8
81.
500.
592
0.17
70.
019
0.32
927
.88.
1450
7N
D5.
453.
0710
8
90.
810
0.69
30.
818
0.42
5N
D1.
8814
.9N
DN
D4.
23N
D98
.2
100.
852
0.18
30.
381
0.06
5N
D5.
6315
.5N
DN
D4.
704.
7861
4
ND
:not
dete
cted
.
THE STATUS OF PESTICIDE RESIDUES IN THE DRINKING WATER 359
TAB
LE
IVC
once
ntra
tion
ofpe
stic
ides
dete
cted
inw
ater
ofM
eilia
ngw
anB
ay,T
aihu
Lak
e(ng
/l)(J
an.2
004)
Sam
plin
gH
epta
chlo
rsi
teL
inda
neep
oxid
ep,
p′ -DD
Ep,
p′ -DD
Dp,
p′ -DD
TD
ichl
orvo
sD
emet
onD
imet
hoat
eM
ethy
lpar
athi
onM
alat
hion
Para
thio
nA
traz
ine
13.
11N
D0.
942
2.12
3.88
25.3
17.0
214
ND
30.5
ND
254
25.
03N
D0.
575
1.17
3.15
17.9
27.6
173
ND
15.5
ND
294
34.
770.
847
0.63
51.
434.
2741
.631
.126
5N
D29
.77.
8642
3
44.
920.
770
0.51
20.
974
ND
30.9
28.4
328
ND
42.6
8.35
128
56.
091.
090.
482
1.64
ND
18.8
34.5
192
ND
23.8
5.90
238
61.
310.
673
0.28
92.
343.
9146
.625
.821
0N
D23
.2N
D22
4
71.
150.
485
0.22
31.
24N
D21
.333
.319
3N
D35
.27.
0116
6
82.
260.
382
0.21
40.
816
3.58
79.0
15.5
43.9
ND
27.6
ND
157
91.
350.
620
0.64
50.
525
5.27
50.0
18.6
34.8
ND
ND
ND
385
101.
74N
D0.
614
1.35
6.67
19.8
15.2
22.0
ND
18.8
2.83
502
ND
:not
dete
cted
.

360 TA NA ET AL.
TAB
LE
VC
once
ntra
tion
ofpe
stic
ides
dete
cted
inw
ater
ofM
eilia
ngw
anB
ay,T
aihu
Lak
e(ng
/l)(A
ug.2
004)
Sam
plin
gH
epta
chlo
rsi
teL
inda
neep
oxid
ep,
p′ -DD
Ep,
p′ -DD
Dp,
p′ -DD
TD
ichl
orvo
sD
emet
onD
imet
hoat
eM
ethy
lpar
athi
onM
alat
hion
Para
thio
nA
traz
ine
11.
130.
352
0.08
9N
DN
D35
.810
671
69.
967.
21N
D11
5
20.
610
0.83
5N
DN
DN
D18
938
.366
225
.06.
815.
7125
3
30.
352
0.10
10.
122
ND
ND
80.0
96.9
760
13.4
ND
ND
63.1
41.
990.
119
0.04
90.
174
ND
44.8
68.7
713
ND
ND
ND
193
51.
400.
510
ND
ND
ND
106
41.9
472
ND
ND
7.92
107
60.
885
0.32
9N
DN
DN
D14
.311
847
812
.1N
DN
D31
.2
71.
290.
515
ND
ND
ND
234
66.5
692
51.1
17.8
7.62
190
80.
685
0.21
0N
DN
DN
D22
.669
.991
811
.87.
50N
D26
0
91.
030.
188
ND
ND
ND
155
75.3
644
ND
ND
ND
89.4
100.
810
0.40
7N
DN
DN
D69
.637
.832
0N
D7.
32N
D21
.6
ND
:not
dete
cted
.

THE STATUS OF PESTICIDE RESIDUES IN THE DRINKING WATER 361
TAB
LE
VI
Mea
nco
ncen
trat
ion
(ng/
l)an
doc
curr
ence
(%)
ofpe
stic
ides
inw
ater
ofM
eilia
ngw
anB
ay,T
aihu
Lak
e
Hep
tach
lor
Met
hyl-
Pest
icid
eL
inda
neep
oxid
ep,
p′ -DD
Ep,
p′ -DD
Dp,
p′ -DD
TD
ichl
orvo
sD
emet
onD
imet
hoat
epa
rath
ion
Mal
athi
onPa
rath
ion
Atr
azin
e
Mea
nva
lue
(Nov
.200
3)1.
740.
290
0.53
30.
110.
168
31.0
20.3
232
0.00
5.32
1.18
252
Occ
urre
nce
(Nov
.200
3)10
010
010
070
5090
100
700
8040
100
Mea
nva
lue
(Jan
.200
4)3.
170.
487
0.54
21.
363.
0735
.124
.716
80.
0024
.73.
2027
7
Occ
urre
nce
(Jan
.200
4)10
070
100
100
7010
010
010
00
9050
100
Mea
nva
lue
(Aug
.200
4)1.
020.
357
0.02
60.
017
0.00
95.1
71.9
638
12.3
4.66
2.13
132
Occ
urre
nce
(Aug
.200
4)10
010
030
100
100
100
100
6050
3010
0
Tota
lmea
nco
ncen
trat
ion
1.98
0.37
80.
367
0.49
61.
0651
.639
.034
64.
1211
.62.
1721
7
Tota
lmea
noc
curr
ence
100
9078
6040
9810
090
2073
4010
0

362 TA NA ET AL.
TABLE VIIMean spiked recoveries and detection limits
Pesticide Mean recoveries (%) Detection limits (ng/l)
Lindane 100.5–116.0 0.05
Heptachlor epoxide 63.0–79.6 0.04
p,p′-DDE 30.5–36.9 0.07
p,p′-DDD 62.0–75.0 0.09
p,p′-DDT 91.0–122.3 0.2
Dichlorvos 65.6–88.2 1.0
Demeton-o 59.4–85.1 1.0
Dementon-s 60.7–72.6 1.0
Dimethoate 58.0–85.0 5.0
Methyl-parathion 76.1–86.9 3.0
Malathion 68.9–76.8 2.0
Parathion 75.9–94.6 2.0
Atrazine 75.6–97.8 8.0
3.1. OCPS RESIDUES
In this study, the determined OCPs were lindane, heptachlor epoxide, p,p′-DDT,p,p′-DDE and p,p′-DDD. Their mean concentrations in the water of MeiliangwanBay, Taihu Lake were 1.98, 0.378, 1.06, 0.367 and 0.496 ng/l, and their meanoccurrences were 100, 90, 40, 78 and 60, respectively. All the concentrations ofOCPs were much lower than the maximum allowable limits of drinking water sourcestandards of China which are in μg/l level (Table VIII).
It was observed that lindane had higher occurrences and concentrations thanother OCPs and was detected in all the water samples. Lindane, a commercialname of γ -HCH, is the biological active isomer of technical HCH. Unlike β-HCH, γ -HCH is not bioaccumulated in human being (Gao et al., 1995). In thepast 30 years, as one of the predominant OCPs, technical HCH has played animportant role in agriculture of China and the total production of technical HCHwas around 4 million tons from 1952 to 1984 (Qiu et al., 2004). Nevertheless,with the improving recognition of its properties such as resistance to degradation,susceptibility to large-scale transport, extreme lipophilicity and high toxicity, theuse and production of technical HCH was forbidden by the government of Chinain 1983. However, due to its longer half-life time, it may still remain in aquaticsystems for years. The previous use of technical HCH may be a source of lindanein the water of Meiliangwan Bay. Moreover, another source of lindane may comefrom a small amount of illegal use of lindane which is still produced mainly forexport purpose in China. In 1993, the total output of lindane was over 2000 tons

THE STATUS OF PESTICIDE RESIDUES IN THE DRINKING WATER 363
TABLE VIIIMaximum allowable limits of drinking watersource standards of China (GB3838–2002)
Pesticide Concentration limit (μg/l)
Lindane 2
Heptachlor epoxide 0.2
p,p′-DDE 1
p,p′-DDD –
p,p′-DDT –
Dichlorvos 50
Trichlorfon 50
Demeton 30
Dimethoate 80
Methyl-parathion 2
Malathion 50
Parathion 3
Atrazine 3
—: not regulated.
and still 10% of it was employed in China and 90% of lindane was exported toother countries (Cai et al., 1995).
Generally, the mean concentration of lindane was found to be much lower incomparison with the previous work (Jiang et al., 1988) which reported a declinetrend of HCH concentrations in Taihu Lake from 1980 to 1988. The concentrationof lindane in 1980 was 255 ng/l, but was dramatically decreased to 6 ng/l in 1988.In our study, the mean concentration of Lindane followed this decreasing trend was1.98 ng/l. This indicates that although a large amount of technical HCH has beenapplied in China, the ban of its use over twenty years has significantly reduced itsresidues in the water of Taihu Lake.
The mean concentration of p,p′-DDT was higher than heptachlor epoxide butslightly lower than that of lindane. As one of the common pesticides, p,p′-DDT wasbroadly applied in the past in China. From 1951 to 1983, the total production of DDTreached 0.27 million tons (Qiu et al., 2004). In addition, DDT is still in productionas raw material for synthesis of dicofol which is an acaricide used in corn, fruit treeand cotton to mite control. In dicofol, there still remain relatively higher percents ofDDT and an intermediate, 2, 2, 2, 2-tetrachloro-1, 1-bis (4-chloropheyl) ethane, thatcan easily converted to DDE (Huang et al., 2000). Therefore, the impure dicofolcan increase the environmental residues of DDT and its metobolites. It is necessaryto conduct further research to confirm whether dicofol is a source of DDT and itsmetabolites in the water of Taihu Lake. It is also apparent that the occurrence ofp,p′-DDT was lower than that of p,p′-DDE and p,p′-DDD which are two metobolites

364 TA NA ET AL.
of p,p′-DDT, this may be the reason that p,p′-DDE and p,p′-DDD are more stablethan p,p′-DDT.
Heptachlor epoxide was found in higher frequency, which was detected in almostall the water samples with lower concentration. That may be due to a continuoususe of heptachlor epoxide with a small quantity in the TLA.
Additionally, an obvious temporal trend was observed from the above analyticalresults. The detected maximum concentration was 6.09 ng/l for lindane, 1.09 ng/lfor heptachlor epoxide, 2.40 ng/l for p,p′-DDE, 2.34 ng/l for p,p′-DDD and 6.67 ng/lfor p,p′-DDT. This did not occur in the rainy season (in Aug. 2004) but in the dryseason (Jan. 2004) with the exception of the highest concentration of p,p′-DDEwhich was found in the normal season (Nov. 2003). It is indicated that the OCPsresidues might be concentrated in the water of Taihu Lake in the dry season. Inthe dry season, the water depth was 0.5–1.0 m lower than that in the rainy season.We suggest that the concentration and dilution effect may play a crucial role intemporal trend of concentration of OCPs. As a result, the concentration of OCPsin the rainy season was lower than that in the dry season, because of the dilutioneffect.
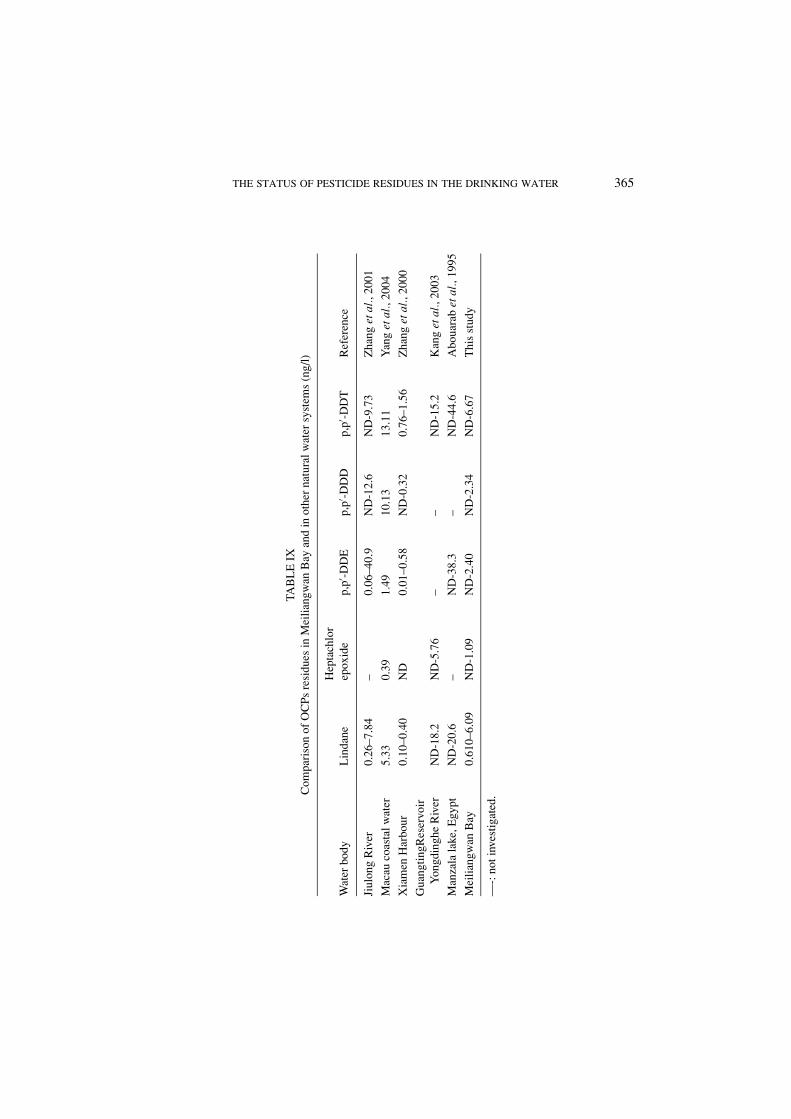
Our data was also compared with the previous studies available at Jiulong River,Macau coastal water, Xiamen Harbour, Guangting Reservoir and Yongdinghe River(China), Manzala Lake (Egypt), (Table IX). From the comparison, it is apparentthat our data and literature data show similar levels of OCPs.
3.2. OPPS RESIDUES
The determined OPPs were dichlovos, trichlofon, demeton-o, demeton-s,dimethoate, methyl-parathion, malathion, and parathion. Because trichlofon canbe easily transformed to dichlovos, and demeton-o and demeton-s is a pair of iso-mers, thus, their total concentrations were determined, respectively.
In the present study, far higher concentrations of OPPs were observed thanthat of OCPs. The mean concentration of dichlovos, demeton, dimethoate, methyl-parathion, malathion, and parathion were 51.6, 39.0, 346, 4.12, 11.6, 2.17 ng/l,respectively. The corresponding occurrences were 98%, 100%, 90%, 20%, 73%,40%, respectively. Due to their efficiency and inexpensiveness, OPPs have beenwidely used in agriculture for crop protection and fruit tree treatment as sub-stitute for OCPs. The OPPs have occupied the dominant position in productionand use in China since the use of OCPs such as DDT and HCH were banned in1983. There are over 20 kinds of OPPs in production and it was reported that,0.11 million tons of OPPs were used in 1989, occupying 52.8% of the total us-age of pesticides and 77% of the total usage of insecticide in China (Pan et al.,1997).
It is obvious that dichlorvos, demeton and dimethoate had higher occurrenceand concentration than other OPPs, because of a large amount of application loads.
THE STATUS OF PESTICIDE RESIDUES IN THE DRINKING WATER 365
TAB
LE
IXC
ompa
riso
nof
OC
Psre
sidu
esin
Mei
liang
wan
Bay
and
inot
her
natu
ralw
ater
syst
ems
(ng/
l)
Hep
tach
lor
Wat
erbo
dyL
inda
neep
oxid
ep,
p′ -DD
Ep,
p′ -DD
Dp,
p′ -DD
TR
efer
ence
Jiul
ong
Riv
er0.
26–7
.84
–0.
06–4
0.9
ND
-12.
6N
D-9
.73
Zha
nget
al.,
2001
Mac
auco
asta
lwat
er5.
330.
391.
4910
.13
13.1
1Y
ang
etal
.,20
04
Xia
men
Har
bour
0.10
–0.4
0N
D0.
01–0
.58
ND
-0.3
20.
76–1
.56
Zha
nget
al.,
2000
Gua
ngtin
gRes
ervo
irY
ongd
ingh
eR
iver
ND
-18.
2N
D-5
.76
––
ND
-15.
2K
ang
etal
.,20
03
Man
zala
lake
,Egy
ptN
D-2
0.6
–N
D-3
8.3
–N
D-4
4.6
Abo
uara
bet
al.,
1995
Mei
liang
wan
Bay
0.61
0–6.
09N
D-1
.09
ND
-2.4
0N
D-2
.34
ND
-6.6
7T
his
stud
y
—-:
noti
nves
tigat
ed.

366 TA NA ET AL.
It was reported that in 2002, over 10 thousand tons of dichlorvos, trichlofon anddimethoate were employed in China, respectively, which were far more than otherOPPs usage (Hua et al., 1999). Furthermore, because of the acute toxicity forhuman being and other endotherm, parathion and methyl parathion were graduallyreduced in use. In 2004, parathion and methyl parathion was decreased by 22.51%and 14.52% in usage compared to in 2003 (Shao et al., 2004). In Jan. 2004, theregistration of five highly toxic OPPs including parathion and methyl parathionwas stopped and from Jan. 2007, their use will be completely forbidden in China(Tang et al., 2004). This can give a good explanation of the lower concentrationand occurrence of them.
Another conclusion drawn from the data was a significant difference in concen-tration between the rainy and the dry seasons. The highest concentration of thoseOPPs were 234 ng/l for dichlorvos 118 ng/l for demeton, 918 ng/l for dimethoate,51.1 ng/l for methyl-parathion, 17.8 ng/l for malathion and 42.6 ng/l for parathion.Except for parathion, the highest concentration of OPPs appeared in the rainy sea-son (in Aug. 2004). This can be explained by the special hydrology of Taihu Lakewhich follows a certain pattern. During the rainy season, the water flows fromthe tributaries of the west, southwest, northwest side of the lake and flows outfrom the tributaries of east side of the lake, but takes a reverse direction duringthe dry season (Zou et al., 1996). Accordingly, during the rainy season, the pes-ticide contamination is caused mainly by the contribution from the tributaries onthe west side of the lake, which can directly flow into the water of MeiliangwanBay and cause a higher concentration. However, the reverse water flow during thedry season minimized the contribution from the tributaries on the west of lake,but increased the contribution from the east side of the lake. The transportationprocess of pesticide to Meiliangwan Bay from the east side of the lake might takeseveral months. During such a long-time transportation, the pesticide might be de-posited in sediment and degraded. As a result, the concentration of OPPs in therainy season was higher than that in the dry season. In general, the source of thoseOPPs principally originated from the agricultural fields in TLA, depending on therun-off and leaching process of the OPPs residues that entered the MeiliangwanBay.
Our results are also compared with a few other studies conducted in JiulongRiver Estuary and Yangtze River (Table X). It is worth paying special attention tothe fact that much higher OPPs pollutions exist in the water of Meiliangwan Bay,Taihu Lake.
Acting on acetylcholinesterase activity, the OPPs are more toxic than OCPs,and it has been believed that OPPs degrade faster. However, it has been provedthat they may persist in the aquatic system for a long time, sometimes more thanhalf year (Lartiges et al., 1995). It is suggested that the exposure to longer periodand lower concentration residues of OPPs in the water of Taihu Lake will bringadverse effect on eco-system and can threaten the safety of the drinking watersource.

THE STATUS OF PESTICIDE RESIDUES IN THE DRINKING WATER 367
TAB
LE
XC
ompa
riso
nof
OPP
sre
sidu
esin
Mei
liang
wan
Bay
and
inot
her
natu
ralw
ater
syst
ems
(ng/
l)
Wat
erbo
dyD
ichl
orvo
sD
emet
onD
imet
hoat
eM
ethy
l-pa
rath
ion
Mal
athi
onPa
rath
ion
Ref
eren
ce
Jiul
ong
Riv
erE
stua
ry6.
67–4
9.8
–6.
39–3
2.6
ND
-14.
5N
D-5
1.6
ND
-8.9
5Z
hang
etal
.,20
02
Yan
gtse
Riv
er1.
59–6
.68
3.05
–4.4
214
.5–6
1.3
ND
-3.3
3N
D-5
.16
1.93
–2.9
0Z
hou
etal
.,20
05
Mei
liang
wan
Bay
ND
-234
8.14
–118
ND
-918
ND
-51.
1N
D-4
2.6
ND
-8.3
5T
his
stud
y
—-:
noti
nves
tigat
ed.
368 TA NA ET AL.
3.3. ATRAZINE RESIDUES
Atrazine is used worldwide as a selective pre- and post emergence herbicide for thecontrol of widespread weeds in many agricultural crops like corn, wheat, maize andbarley. Atrazine inhibits the growth of target weeds by interfering with the normalfunction of photosynthesis (Graymore et al., 2001). Since 1980s, atrazine has beenused in China (Helena et al., 2005) and the amount of usage reached 2835 tons in2000 with a 20% increment annually (Hua et al., 1999).
In our study, atrazine was detected in all the water samples with considerablyhigh concentration. The mean concentration level of atrazine was 217 ng/l and thehighest was 614 ng/l in Nov. 2003 that was under the maximum allowable limitsof drinking water source standards of China. It was reported that atrazine persistsunder cool, dry conditions in a stable pH environment and its metebolites were alsotoxic and persistent as atrazine (Graymore et al., 2001). However, the effects oflong-term exposure to atrazine at lower concentration on human being is unknownyet, which requires further study.
4. Conclusion
The pollution status of OCPs, OPPs and atrazine were studied in the surface waterof Taihu Lake. In general, the contamination follows a decreasing order of OPPs >
atrazine >>OCPs. The mean concentrations of OCPs were 1.98, 0.378, 0.357,0.496, 1.06 for lindane, heptachlor epoxide, p,p′-DDE, p,p′-DDD, p,p′-DDT, re-spectively. The mean concentrations of OPPs were 51.6, 39.0, 346, 4.12, 11.6,2.17 and 217 ng/l for dichlorvos demeton, dimethoate, methyl-parthion, malathion,parathion and atrazine, respectively. The highest concentration levels of the detectedpesticides were far below the maximum allowable limits of drinking water sourcesstandards of China. Moreover, the presence of detected pesticides was attributed tothe intense agricultural activity of TLA. The effects of multi-contamination frompesticide exposure on humans via drinking water are uncertain, and additional workis needed to reduce this uncertainty.
Acknowledgments
This study was supported by Chinese National Programs for High TechnologyResearch and Development 863 project (NO. 2002AA601011-03).
References
Abou-arab, A. A. K., Gomaa, M. N. E. and Badawy, A.: 1995, ‘Distribution of organochlorinepesticides in Egyptian aquatic system’, Food Chemistry 54, 141–146.

THE STATUS OF PESTICIDE RESIDUES IN THE DRINKING WATER 369
Cai, D. J., Liu, Y. K. and Tao, S. M.: 1995, ‘Protection the pollution of uneffective isomers of HCH’,Pesticide Science and Administration (in Chinese). 60(4), 31–32.
Feng, K., Yu, B. Y. and Ge, D. M.: 2003, ‘Organochlorine pesticide (DDT and HCH) residues in theTaihu Lake Region and its movement in soil – water system I. Field survey of DDT and HCHresidues in ecosystem of the region’, Chemosphere 50, 683–687.
Gao, X. F. and Zhang, G. G.: 1995, ‘Utilization of by-products of lindane’, Research of EnvironmentalScience (in Chinese) 8(1), 3–4.
Gong, Z. M., Dong, Y. H. and An, Q.: 2001, ‘Organochlorine residues in eggs of night heron breedingin yuantouzhu,wuxi and their function as bioindicater’, Environmental Sceince (in Chinese) 22(2),110–114.
Graymore, M., Stagnitti, F. and Allinson, G.: 2001, ‘Impacts of atrazine in aquatic ecosystems’,Environ. Int. 26, 483–495.
Helena, P. and Lucija, Z. K.: 2005, ‘Evaluation of photolysis and hydrolysis of atrazine and its firstdegradation products in the presence of humic acids’, Environmental Pollution 133, 517–529.
Hua, X. M. and Shan, Z. J.: 1999, ‘Production, usage and environmental influence factors of pesticidesin China’, Science and Technology of Anhui (in Chinese) 6, 6–10.
Huang, X. Z., Ji, Y. and Ye, J. M.: 2000, ‘Analysis of dicofol technical material and its impurties withGC–MS’, Pesticide Science and Administration (in Chinese). 5, 9–12.
Jiang, X. F., Chen, S. J. and Wang, X. F.: 1988, ‘Determination of HCH in water of Taihu Lake’,Environmental Science and Technology (in Chinese). 5–7.
Kang, Y. H., Liu, P. B. and Wang, Z. J.: 2003, ‘Persistent organochlorinated pesticides in water fromGuanting Reservoir and Yongdinghe River, Beijing’, Journal of Lake Sciences (in Chinese). 15(2),125–132.
Lartiges, S. B. and Garrigues, P. P.: 1995, ‘Degradation kinetics of organophosphorus pesticides indifferent waters under various environmental conditions’, Environ. Sci. Techno. 29, 1246–1254.
Pan, Y. H., Wei, A. X. and Zhao, G. D.: 1997, ‘Analysis of trace organophosphorus pesticides in waterby high performance liquid chromatography/mass spectrometry’, Advances in EnvironmentalScience (in Chinese) 1, 32–40.
Qiu, X. H., Zhu, T. and Li, J.: 2004, ‘Organochlorine pesticides in the air around the taihu lake, China’,Environ. Sci. Technol. 38, 1368–1374.
Rovedattil, M. G., Castan, P. M. and Topalia, M. L.: 2001, ‘Monitoring of organochlorine andorganophosphorus pesticides in the water of the Reconquista River (Buenosaires, argentina)’,Water Res. 35(14), 3457–3461.
Shao, Z. R. and Su, F.: 2004, ‘The prospect for pesticide usage in 2002 and 2003’, Pesticide Scienceand Administration (in Chinese) 25(2), 33–35.
Tang, Y. F., Wang, Y. X. and Cai, H. S.: 2004, ‘Application and pollution of organophosphorouspesticides’, Journal of Wuhan Institute of Chemistry and Technology (in Chinese) 26(1), 11–14.
Wang, T. Y., Lu, Y. L. and Zhang, H.: 2005, ‘Contamination of persistent organic pollutants (POPs)and relevant management in China’, Environ. Int. 31, 813–821.
Wang, H., Wang, C. X. and Wu, W. Z.: 2003, ‘Persistent organic pollutants in water and surfacesediments of taihu lake, China and risk assessment’, Chemosphere 50, 557–562.
Yang, Q. S., Mei, B. X. and Luo, X. J.: 2004, ‘Vertical distribution of organochlorine pesticides(OCPs) in Macau coastal waters’, Acta Scientiae Circumstaniae (in Chinese) 24(3), 428–434.
Zhang, Z. L., Chen, W. Q. and Khalid, M.: 2001, ‘Evaluation and fate of the organic chlorine pesticidesat the waters in Jiulong River Estuary’, Environmental Science (in Chinese). 22(3), 88–92.
Zhang, Z. L., Hong, H. S. and Khald, M.: 2000, ‘Study on organochlorine pesticide and PCBs atsurface water in Xiamen Harbour’, Marine Environmental Science (in Chinese) 19(3), 48–51.
Zhang, Z. L., Yu, G. and Hong, H. S.: 2002, ‘Environmental behavior and risk assessment oforganophosphorus pesticides at water from Jiulong River Estuary’, Environmental Science (inChinese) 23, 73–78.

370 TA NA ET AL.
Zhou, F., Sun, C. and Zhong, M.: 2005, ‘Determination of of organophospheorous pesticides by gaschromatography in drinking water sources’, Environmental Pollution and Protection (in Chinese)27(2), 151–153.
Zhu, X. and Zhang, Y. W.: 2002, ‘The status of water quality and its protection policy in MeiliangwanBay’, Water Source Protection (in Chinese) 4, 28–30.
Zou, H. X., Sheng, G.Y. and Sun, C.: 1996, ‘Distribution of organic contaminants in Lake Taihu’,Water Res. 30(9), 2003–2008.