the status of public and private school library media centers in
TRANSCRIPT
The Status of Public andPrivate School LibraryMedia Centers in theUnited States: 1999–2000
E.D. Tabs
U.S. Department of EducationInstitute of Education SciencesNCES 2004–313
National Center forEducation Statistics
NCES
LibraryStatisticsProgram
Schools and Staffing Survey
SASS

National Center forEducation Statistics
NCES
LibraryStatisticsProgram
Schools and Staffing Survey
SASS
The Status of Public andPrivate School LibraryMedia Centers in theUnited States: 1999–2000
E.D. Tabs
March 2004
Barbara HoltonNational Center forEducation Statistics
Yupin BaeSusan BaldridgeMichelle BrownDan HeffronPinkerton ComputerConsultants, Inc.
U.S. Department of EducationInstitute of Education SciencesNCES 2004–313

U.S. Department of EducationRod PaigeSecretary
Institute of Education SciencesGrover J. WhitehurstDirector
National Center for Education StatisticsRobert LernerCommissioner
The National Center for Education Statistics (NCES) is the primary federal entity for collecting, analyzing, andreporting data related to education in the United States and other nations. It fulfills a congressional mandateto collect, collate, analyze, and report full and complete statistics on the condition of education in the UnitedStates; conduct and publish reports and specialized analyses of the meaning and significance of such statistics;assist state and local education agencies in improving their statistical systems; and review and report oneducation activities in foreign countries.
NCES activities are designed to address high priority education data needs; provide consistent, reliable, complete,and accurate indicators of education status and trends; and report timely, useful, and high quality data to theU.S. Department of Education, the Congress, the states, other education policymakers, practitioners, data users,and the general public.
We strive to make our products available in a variety of formats and in language that is appropriate to avariety of audiences. You, as our customer, are the best judge of our success in communicating informationeffectively. If you have any comments or suggestions about this or any other NCES product or report, we wouldlike to hear from you. Please direct your comments to:
National Center for Education StatisticsInstitute of Education SciencesU.S. Department of Education1990 K Street NWWashington, DC 20006–5651
March 2004
The NCES World Wide Web Home Page address is: http://nces.ed.govThe NCES World Wide Web Electronic Catalog is: http://nces.ed.gov/pubsearch
Suggested Citation
U.S. Department of Education, National Center for Education Statistics. The Status of Public and Private SchoolLibrary Media Centers in the United States: 1999-2000, NCES 2004-313, by Barbara Holton, Yupin Bae, SusanBaldridge, Michelle Brown, and Dan Heffron. Washington, DC: 2004.
For ordering information on this report, write:
U.S. Department of EducationED PubsP.O. Box 1398Jessup, MD 20794–1398
Call toll free 1–877–4ED–Pubs; or order online at http://www.edpubs.org
Content Contact:Barbara Holton(202) 219–[email protected]

iii
Acknowledgments
The authors wish to thank all of the individuals who have contributed to this report. Jeff Williams, Team Leader for the Library Statistics Program at NCES, reviewed plans and drafts of this report. Thanks go to Tai Phan of NCES and Mike Planty of the Education Statistics Services Institute for their careful technical review. The authors also wish to thank Lee Hoffman, Jeff Owings, Marilyn Seastrom, and Tom Snyder, all of NCES, for their thoughtful suggestions. The authors are indebted to Karen O’Conor, of IES, for her significant contributions to this report. Thanks also go to June Kahler Berry of the Graduate School of Library and Information Science at The University of Texas at Austin and Julie Walker, the Executive Director of the American Association of School Librarians, for reviewing the draft and making constructive comments and suggestions.

iv

v
Executive Summary Background This report examines the state of public and private school library media centers in the United States in 1999–2000. The data used in the report come from the 1999–2000 Schools and Staffing Survey (SASS), the nation’s most extensive sample survey of America’s public and private schools and library media centers. Sponsored by the National Center for Education Statistics (NCES), SASS has been conducted four times, in school years 1987–88, 1990–91, 1993–94, and 1999–2000. Currently, the library media center is defined as an organized collection of printed and/or audiovisual and/or computer resources that is administered as a unit, is located in a designated place or places, and makes resources and services available to students, teachers, and administrators. Organization and Content of This Report The body of this report is composed of tables providing an overview of school library media center data from the 1999–2000 SASS. The tables present data on traditional public school and private school library media centers. Traditional public schools are defined as institutions that provide educational services for at least one of grades 1–12 (or comparable ungraded levels), have one or more teachers to give instruction, are located in one or more buildings, receive public funds as primary support, and are operated by an education agency. Traditional public schools include schools in juvenile detention centers, schools located on military bases and operated by the Department of Defense, and Bureau of Indian Affairs (BIA)-funded schools operated by local public school districts. Traditional public schools do not include schools that teach only prekindergarten or kindergarten, public charter schools (1,010 schools in the SASS sample), and BIA-funded schools that are not operated by a local public school district (120 schools in the SASS sample). In this report, the terms traditional public schools and public schools and the terms school library and library media center are used interchangeably. The tables present data on several main topics of interest concerning school library media centers. These topics are library media center characteristics, library media center staff characteristics, library media center expenditures and collection holdings, and library media center policies.
The data are presented at various levels for traditional public school and private school library media centers.

vi
Public school library media center data are presented at the following levels: national-level data, regional-level data, state-level data, community-type data, school-level data, and student-enrollment data.
Private school library media center data are presented at the following levels: national-level data, affiliation-level data, NCES typology-level data, regional-level data, community-type data, school-level data, and student-enrollment data.
Finally, four appendixes provide supporting information. Standard error tables are located in appendix A. Technical Notes that provide overviews of the survey content, target population and estimates, sample design and implementation, data collection procedures, response rates, and weighting procedures are located in appendix B. Appendix C contains supplemental tables, and the glossary is in appendix D. Key Variables The key variables—such as staffing, library expenditures, and collection holdings—were selected for this report because they represent important descriptors of library media centers. Some basic variables about library equipment were excluded from this report because they appeared in the E.D. Tab published in May 2002, Schools and Staffing Survey, 1999–2000: Overview of the Data for Public, Private, Public Charter, and Bureau of Indian Affairs Elementary and Secondary Schools (NCES 2002–313). Findings This report is intended to give the reader an overview of the status of public and private school libraries for school year 1999–2000. The data are presented in the following four categories: Library media center characteristics—the availability of library media centers and the
extent to which students have access to a library in their school, Library media center staff characteristics—the educational level of public and private
school librarians and the number of volunteers who assist in the library, Library media center expenditures and collection holdings—the financial and
information resources of the library, and Library media center policies—issues related to the frequency of regularly scheduled
class visits, independent use of the library, and borrowing privileges.

vii
Selected findings, with comparisons tested and found significant at the .05 level, are described below. Details of the statistical tests used are presented in appendix B. Library Media Center Characteristics In 1999–2000, there were about 77,000 public school library media centers,
representing 92 percent of all traditional public schools (table 1a). There were approximately 17,000 private school library media centers, representing
63 percent of all private schools (table 1b). Of the 45 million students enrolled in public elementary or secondary schools in the
United States, approximately 44 million (97 percent) attended schools with a library media center (table 2a).
Four million private school students, or 82 percent, were enrolled in a school with a
library media center (table 2b). Among schools with a library media center, some three-quarters of public schools had
a paid, state-certified library media specialist (table 2a), compared with one-fifth of private schools (table 2b).
Library Media Center Staff Characteristics Among public schools with a library media center, 52 percent of high schools had a
school librarian with a Master’s of Library Science (MLS) or related degree in 1999–2000, compared to 39 percent of public elementary schools (table 3a) and 32 percent of combined schools.
Among private schools with a library media center, 43 percent of high schools, 9
percent of elementary schools, and 26 percent of combined schools employed a librarian with an MLS or related degree (table 3b).
A larger proportion of library media centers in private schools than in public schools
relied on adult volunteers. Among private schools, 58 percent reported having at least one adult volunteer in the library media center (table 5b), compared with 38 percent of public schools (table 5a).

viii
Library Media Center Expenditures and Collection Holdings Survey questions about expenditures and collection holdings refer to the previous
school year. For the 1993–94 SASS, respondents reported data from 1992–93 and 1999–2000 SASS respondents reported expenditures and collection data from 1998–99.
The average library expenditures of public schools increased between the 1993–94 and the 1999–2000 SASS. When adjusted for inflation, public schools spent an average of $7,900 on library expenditures in 1992–93. By 1998–99, public schools had increased their average library expenditures to $8,700 (table 6a).
The percentage of library expenditures for the purchase or rental of books was higher
for public and private elementary schools than for high schools or combined schools in 1999–2000. Seventy percent of public elementary schools’ library expenditures and 69 percent of private elementary schools’ library expenditures were for the purchase or rental of books (table 6a and 6b). In public high schools, 56 percent of library expenditures, and in public combined schools, 58 percent of library expenditures, were for the purchase or rental of books. In private high schools, 49 percent of library expenditures, and in private combined schools, 58 percent of library expenditures, were for the purchase or rental of books.
Library Media Center Policies The percentage of private school library media centers offering flexible scheduling
for class visits increased from 27 percent in 1993–94 to 34 percent in 1999–2000 (table 8b). No such difference was detected for public schools where 30 percent in 1993–94 and 32 percent in 1999–2000 maintained a flexible schedule for class visits to the library (table 8a).
Public schools tended to provide greater access than private schools to the library
media center for students’ independent use before or after school. Fifty percent of public school library media centers scheduled times before or after school when students could use the library independently in 1999–2000 (table 9a), compared to 36 percent of private school library media centers (table 9b).

ix
Additional Information
This report and other reports on school library media centers and the Schools and Staffing Survey are available on the Internet. The web site for the National Center for Education Statistics is http://nces.ed.gov. To access more information about the Library Statistics Program from the NCES web site, go to http://nces.ed.gov/surveys/libraries. To access more information about the Schools and Staffing Survey from the NCES web site, go to http://nces.ed.gov/surveys/sass. For additional copies of this report or other NCES publications, contact the Department of Education’s Publications Center (ED Pubs): Online: http://www.edpubs.org Toll-free phone: 1-877-4ED-Pubs (877-433-7827) TTY/TDD: 1-877-576-7734 Fax: 1-301-470-1244 Mail: ED Pubs, P.O. Box 1398, Jessup, MD 20794-1398

x

xi
Table of Contents Acknowledgments............................................................................................. iii Executive Summary .......................................................................................... v Introduction ................................................................................................... 1 I: Library Media Center Characteristics................................................... 3 II: Library Media Staff Characteristics...................................................... 13 III: Library Media Center Expenditures and Collection Holdings ............. 27 IV: Library Media Center Policies .............................................................. 37 Appendix A: Standard Error Tables ................................................................. 51 Appendix B: Technical Notes........................................................................... 93
I. Overview of the Schools and Staffing Survey (SASS)............. 95
II. Sampling Frames ...................................................................... 95
III. Data Collection Procedures....................................................... 97
IV. Sample Selection Procedures.................................................... 97
V. Sample Sizes ............................................................................. 97
VI. Weighting.................................................................................. 98
VII. Response Rates and Nonresponse Bias Analysis...................... 99
VIII. Accuracy of Estimates .............................................................. 99
IX. Comparison of Estimates .......................................................... 100
X. Statistical Tests ......................................................................... 100
XI. References................................................................................. 102
Appendix C: Supplemental Tables................................................................. 103
Appendix D: Glossary .................................................................................... 115

xii
List of Tables Table Page 1a. Number of public schools, and number and percentage of public
schools with library media centers, by state and selected characteristics: 1999–2000.................................................................... 4
1b. Number of private schools, and number and percentage of private
schools with library media centers, by affiliation and selected characteristics: 1999–2000.................................................................... 6
2a. Number of pupils in public schools, and number and percentage of
pupils and state-certified library media specialists in public schools with library media centers, by state and selected characteristics: 1999–2000............................................................................................. 8
2b. Number of pupils in private schools, and number and percentage of
pupils and state-certified library media specialists in private schools with library media centers, by affiliation and selected characteristics: 1999–2000.................................................................... 10
3a. Number and percentage of public schools with library media center
where paid professional staff has a bachelor's degree or MLS or related degree as their highest degree, by state and selected characteristics: 1999–2000.................................................................... 14
3b. Number and percentage of private schools with library media
centers where paid professional staff have a bachelor's degree or MLS or related degree as their highest degree, by affiliation and selected characteristics: 1999–2000...................................................... 16
4a. Number and percentage of public schools with paid full-time or
part-time state-certified library media specialists, by state and selected characteristics: 1999–2000...................................................... 18
4b. Number and percentage of private schools with paid full-time or
part-time state-certified library media specialists, by affiliation and selected characteristics: 1999–2000...................................................... 20
5a. Number and percentage of public schools with paid library aides or
clerical staff and regularly scheduled adult and student library volunteers during most recent full week, by state and selected characteristics: 1999–2000.................................................................... 22

xiii
5b. Number and percentage of private schools with paid library aides or clerical staff and regularly scheduled adult and student library volunteers during most recent full week, by affiliation and selected characteristics: 1999–2000.................................................................... 24
6a. Average library expenditures and book holdings for public school
library media centers, by state and selected characteristics: 1999–2000....................................................................................................... 28
6b. Average library expenditures and book holdings for private school
library media centers, affiliation and selected characteristics: 1999–2000............................................................................................. 30
7a. Number and percentage of public school library media centers with
CD-ROMs or video materials, by state and selected characteristics: 1999–2000............................................................................................. 32
7b. Number and percentage of private school library media centers
with CD-ROMs or video materials, by affiliation and selected characteristics: 1999–2000.................................................................... 34
8a. Percentage distribution of types of library schedules and frequency
of regularly scheduled class visits by public school library media centers, by state and selected characteristics: 1999–2000 .................... 38
8b. Percentage distribution of types of library schedules and frequency
of regularly scheduled class visits by private school library media centers, by affiliation and selected characteristics: 1999–2000............ 40
9a. Number and percentage of public school library media centers with
scheduled times that students can use the library independently, by state and selected characteristics: 1999–2000....................................... 42
9b. Number and percentage of private school library media centers
with scheduled times that students can use the library independently, by affiliation and selected characteristics: 1999–2000....................................................................................................... 44
10a. Average number of public school library books and other materials
checked out during the most recent full week and percentage of public school libraries with borrowing privileges for prekindergartners, kindergartners, and parents, by state and selected characteristics: 1999–2000...................................................... 46
xiv
10b. Average number of private school library books and other materials checked out during the most recent full week and percentage of private school libraries with borrowing privileges for prekindergartners, kindergartners, and parents, by affiliation and selected characteristics: 1999–2000...................................................... 48
Appendix A. Standard Error Tables A1a. Standard errors for number of public schools, and number and
percentage of public schools with library media centers, by state and selected characteristics: 1999–2000............................................... 52
A1b. Standard errors for number of private schools, and number and
percentage of private schools with library media centers, by affiliation and selected characteristics: 1999–2000 .............................. 54
A2a. Standard errors for number of pupils in public schools, and number
and percentage of pupils and state-certified library media specialists in public schools with library media centers, by state and selected characteristics: 1999–2000.............................................. 56
A2b. Standard errors for number of pupils in private schools, and
number and percentage of pupils and state-certified library media specialists in private schools with library media centers, by affiliation and selected characteristics: 1999–2000 .............................. 58
A3a. Standard errors for number and percentage of public schools with
library media center where paid professional staff have a bachelor's degree or MLS or related degree as their highest degree, by state and selected characteristics: 1999–2000............................................... 60
A3b. Standard errors for number and percentage of private schools with
library media center where paid professional staff have a bachelor's degree or MLS or related degree as their highest degree, by affiliation and selected characteristics: 1999–2000 .............................. 62
A4a. Standard errors for number and percentage of public schools with
paid full-time or part-time state-certified library media specialists, by state and selected characteristics: 1999–2000 ................................. 64
A4b. Standard errors for number and percentage of private schools with
paid full-time or part-time state-certified library media specialists, by affiliation and selected characteristics: 1999–2000 ........................ 66

xv
A5a. Standard errors for number and percentage of public schools with paid library aides or clerical staff and regularly scheduled adult and student library volunteers during most recent full week, by state and selected characteristics: 1999–2000 .............................................. 68
A5b. Standard errors for number and percentage of private schools with
paid library aides or clerical staff and regularly scheduled adult and student library volunteers during most recent full week, by affiliation and selected characteristics: 1999–2000 ............................. 70
A6a. Standard errors for average library expenditures and book holdings
for public school library media centers, by state and selected characteristics: 1999–2000 ................................................................... 72
A6b. Standard errors for average library expenditures and book holdings
for private school library media centers, by affiliation and selected characteristics: 1999–2000 ................................................................... 74
A7a. Standard errors for number and percentage of public school library
media centers with CD-ROMs or video materials, by state and selected characteristics: 1999–2000 ..................................................... 76
A7b. Standard errors for number and percentage of private school
library media centers with CD-ROMs or video materials, by affiliation and selected characteristics: 1999–2000 ............................. 78
A8a. Standard errors for percentage distribution of types of library
schedules and frequency of regularly scheduled class visits by public school library media centers, by state and selected characteristics: 1999–2000 ................................................................... 80
A8b. Standard errors for percentage distribution of types of library
schedules and frequency of regularly scheduled class visits by private school library media centers, by affiliation and selected characteristics: 1999–2000 ................................................................... 82
A9a. Standard errors for number and percentage of public school library
media centers with scheduled times that students can use the library independently, by state and selected characteristics: 1999–2000 ...................................................................................................... 84
A9b. Standard errors for percentage of private school library media
centers with scheduled times that students can use the library independently, by affiliation and selected characteristics: 1999–2000 ...................................................................................................... 86

xvi
A10a. Standard errors for average number of public school library books and other materials checked out during the most recent full week and percentage of public school libraries with borrowing privileges for prekindergartners, kindergartners, and parents, by state and selected characteristics: 1999–2000 ..................................................... 88
A10b. Standard errors for average number of private school library books
and other materials checked out during the most recent full week and percentage of private school libraries with borrowing privileges for prekindergartners, kindergartners, and parents, by affiliation and selected characteristics: 1999–2000 ............................. 90
Appendix B. Technical Note Tables B-1. Number of library media centers, by sector and interview status:
1999–2000............................................................................................. 98 B-2. Unweighted and weighted response rates for the library media
center survey, by sector: 1999–2000 .................................................... 99 Appendix C. Supplemental Tables C1. Percentage of public schools where a library media specialist
assists teachers with technology and public school library media centers with technology to assist patrons with disabilities, by state and selected characteristics: 1999–2000............................................... 106
C2. Number of library staff members who are state-certified library
media specialists and number and percentage of public schools with a state-certified itinerant librarian, by state and selected characteristics: 1999–2000.................................................................... 108
C1.1. Standard errors for percentage of public schools where a library
media specialist assists teachers with technology and public school library media centers with technology to assist patrons with disabilities, by state and selected characteristics: 1999–2000 .............. 110
C2.1. Standard errors for number of library staff members who are state-
certified library media specialists and number and percentage of public schools with a state-certified itinerant librarian, by state and selected characteristics: 1999–2000...................................................... 112

1
Introduction
This report examines the state of public and private school library media centers in the United States in 1999–2000. The data used in the report come from the 1999–2000 Schools and Staffing Survey (SASS), the nation’s most extensive sample survey of America’s public and private schools and library media centers. Sponsored by the National Center for Education Statistics (NCES), SASS has been conducted four times, in school years 1987–88, 1990–91, 1993–94, and 1999–2000. This report will present comparisons between 1993–94 and 1999–2000 on a variety of topics. Due to a change in the method of calculating the percentage of schools with library media centers between 1993–94 and 1999–2000, no such comparisons are presented. In 1993–94, the number of schools with library media centers was calculated from the school file and the library was not defined. School questionnaire respondents used their discretion in determining whether or not their schools had a library. The number of schools with libraries was calculated from the library media center questionnaire in 1999–2000 and the survey defined library media center. Currently, the library media center is defined as an organized collection of printed and/or audiovisual and/or computer resources which is administered as a unit, is located in a designated place or places, and makes resources and services available to students, teachers, and administrators. Organization and Content The body of this report is composed of tables providing an overview of school library media center data from the 1999–2000 SASS. The tables present data on traditional public school and private school library media centers. Traditional public schools are defined as institutions that provide educational services for at least one of grades 1–12 (or comparable ungraded levels), have one or more teachers to give instruction, are located in one or more buildings, receive public funds as primary support, and are operated by an education agency. Traditional public schools include schools in juvenile detention centers, schools located on military bases and operated by the Department of Defense, and Bureau of Indian Affairs (BIA)-funded schools operated by local public school districts. Traditional public schools do not include public prekindergarten and kindergarten centers and public charter schools. In this report, the terms traditional public schools and public schools and the terms school library and library media center are used interchangeably. The tables present data on several main topics of interest concerning school library media centers. These topics are school library media centers, library media center staff characteristics, library media center expenditures and collection holdings, and library media center policies.

2
The data are presented at various levels for traditional public school and private school library media centers. Public school library media center data are presented at the following levels: national-level data, regional-level data, state-level data, community-type data, school-level data, and student-enrollment data.
Private school library media center data are presented for the following levels: national-level data, affiliation-level data, NCES typology-level data, regional-level data, community-type data, school-level data, and student-enrollment data.
Finally, four appendixes provide supporting information. Standard error tables are located in appendix A. Technical Notes that provide overviews of the survey content, target population and estimates, sample design and implementation, data collection procedures, response rates, weighting procedures are located in appendix B. Appendix C contains supplemental tables, and the glossary is in appendix D.

3
Section I: Library Media Center Characteristics
This section presents data on traditional public school and private school library media centers from the 1999–2000 Schools and Staffing Survey (SASS). These tables examine the prevalence of library media centers and paid professional library media specialists in public and private schools. Paid professional library media specialists are defined as staff who have met the state’s regular or standard certification requirements in the library media specialty area. Public schools were more likely than private schools to have a library media center. In 1999–2000, there were about 77,000 public school library media centers, representing 92 percent of all traditional public schools (table 1a). There were approximately 17,000 private school library media centers, representing 63 percent of all private schools (table 1b). No differences were detected in the proportion of public schools with library media centers in different types of communities. Ninety-one percent of public schools in central cities and rural or small towns had library media centers and 93 percent of public schools in urban fringe or large towns had school libraries (table 1a). Private schools in central cities (69 percent) were more likely to have library media centers than schools in urban fringe or large towns (61 percent) (table 1b). Private schools located in rural areas or small towns (52 percent) were less likely than private schools in urban fringe or large towns to be equipped with a library media centers. Public school students were more likely than private school students to attend a school with a library media center. Of the 45 million students enrolled in public elementary or secondary schools in the United States, approximately 44 million (97 percent) attended schools with a library media center (table 2a). Four million students, or 82 percent, were enrolled in a private school with a library media center (table 2b). Schools with a student enrollment of 1,000 or more were more likely than schools with less than 100 students to staff their library media centers with a paid, state-certified library media specialist. Among large public schools with a library media center, 90 percent had a state-certified library media specialist, compared with 62 percent of small public schools (table 2a). The largest private schools with libraries were 10 times more likely than the smallest schools to employ a state-certified library media specialist (80 percent vs 5 percent) (table 2b).

Table 1a. selected characteristics: 1999–2000
State and Percentage of publicselected Number of public Number of public schools with schools withcharacteristics schools library media centers library media centers
50 States and DC 83,824 76,807 91.6 Alabama 1,329 1,299 97.8 Alaska 466 366 78.5 Arizona 1,175 991 84.3 Arkansas 1,098 1,089 99.1 California 8,060 6,340 78.7
Colorado 1,412 1,355 96.0 Connecticut 1,009 934 92.6 Delaware 155 136 87.8 District of Columbia 158 138 87.1 Florida 2,601 2,436 93.7
Georgia 1,735 1,710 98.6 Hawaii 247 247 100.0 Idaho 621 545 87.8 Illinois 3,976 3,638 91.5 Indiana 1,781 1,737 97.5
Iowa 1,485 1,463 98.6 Kansas 1,401 1,374 98.0 Kentucky 1,317 1,222 92.8 Louisiana 1,428 1,269 88.9 Maine 708 621 87.8
Maryland 1,263 1,226 97.1 Massachusetts 1,712 1,609 94.0 Michigan 3,413 2,942 86.2 Minnesota 1,674 1,483 88.6 Mississippi 934 859 92.1
Missouri 1,988 1,906 95.9 Montana 880 745 84.7 Nebraska 1,197 1,014 84.7 Nevada 439 420 95.8 New Hampshire 453 432 95.3
New Jersey 2,247 2,086 92.8 New Mexico 709 684 96.4 New York 4,090 3,738 91.4 North Carolina 2,014 1,877 93.2 North Dakota 552 461 83.4
See footnotes at end of table.
Table 1a. Number of public schools and number and percentage of public schools with library media centers, by state and
4

Table 1a. selected characteristics: 1999–2000—Continued
State and Percentage of publicselected Number of public Number of public schools with schools withcharacteristics schools library media centers library media centers
Ohio 3,698 3,584 96.9 Oklahoma 1,822 1,782 97.9 Oregon 1,171 1,118 95.5 Pennsylvania 3,121 2,941 94.2 Rhode Island 292 277 94.9
South Carolina 1,066 1,035 97.0 South Dakota 779 571 73.4 Tennessee 1,534 1,488 97.0 Texas 6,650 6,246 93.9 Utah 740 693 93.8
Vermont 332 332 100.0 Virginia 1,740 1,602 92.1 Washington 2,008 1,841 91.7 West Virginia 798 610 76.4 Wisconsin 1,952 1,948 99.8 Wyoming 395 346 87.5
Region Northeast 13,964 12,969 92.9 Midwest 23,898 22,123 92.6 South 27,640 26,025 94.2 West 18,322 15,690 85.6
Community type Central city 19,752 18,038 91.3 Urban fringe/large town 37,564 34,754 92.5 Rural/small town 26,508 24,015 90.6 School level Elementary 59,973 56,715 94.6 Secondary 20,590 17,963 87.2 Combined 3,261 2,129 65.3
Student enrollment Less than 100 7,099 3,540 49.9 100–199 7,932 6,748 85.1 200–499 31,689 30,280 95.6 500–749 20,660 20,095 97.3 750–999 8,036 7,917 98.5 1,000 or more 8,408 8,227 97.9
Table 1a. Number of public schools and number and percentage of public schools with library media centers, by state and
NOTE: These estimates are for traditional public schools. Traditional public schools include all public schools in the United States except public charter schools. Detail may not sum to totals because of rounding.SOURCE: U.S. Department of Education, National Center for Education Statistics (2002), Schools and Staffing Survey (SASS), "Public School Library Media Center Questionnaire," 1999–2000, and the SASS 1999–2000 Schools Without Libraries Restricted-Use Data File, September 2003.
5

Percentage of privateNumber of private Number of private schools with schools with
Selected characteristics schools library media centers library media centers
Total 27,223 17,054 62.6
Affiliation Catholic 8,102 7,097 87.6 Friends 78 71 91.3 Episcopal 379 318 84.0 Hebrew Day 235 146 62.4 Solomon Schechter 60 54 89.4 Other Jewish 396 247 62.5 Lutheran, Missouri Synod 1,100 779 70.8 Lutheran, Wisconsin Synod 358 174 48.6 Evangelical Lutheran 121 83 68.4 Other Lutheran 70 44 62.6 Seventh-Day Adventist 949 590 62.1 Christian Schools International 365 336 92.1 American Association of Christian Schools 996 463 46.5 Association of Christian Schools International 2,780 1,566 56.3 National Association of Private Schools for Exceptional Children 273 177 64.7 Montessori 900 474 52.7 Independent Schools 714 705 98.7 National Independent Private School Association 136 26 19.2 Other 9,210 3,705 40.2
NCES typology Catholic 8,102 7,097 87.6 Parochial 4,607 4,050 87.9 Diocesan 2,591 2,283 88.1 Private 903 763 84.5
Other religious 13,227 6,723 50.8 Conservative Christian 4,947 2,436 49.3 Affiliated 3,602 2,472 68.6 Unaffiliated 4,678 1,815 38.8
Nonsectarian 5,894 3,234 54.9 Regular 2,440 1,678 68.8 Special emphasis 2,179 931 42.7 Special education 1,275 625 49.0
All members of National Association of Independent Schools 846 803 94.9
See footnotes at end of table.
Table 1b. Number of private schools and number and percentage of private schools with library media centers, by affiliationTable 1b. and selected characteristics: 1999–2000
6

Percentage of privateNumber of private Number of private schools with schools with
Selected characteristics schools library media centers library media centers
Region Northeast 6,358 4,093 64.4 Midwest 7,490 4,948 66.1 South 8,196 5,130 62.6 West 5,179 2,883 55.7
Community type Central city 11,592 7,942 68.5 Urban fringe/large town 10,843 6,610 61.0 Rural/small town 4,788 2,501 52.2
School level Elementary 16,531 10,961 66.3 Secondary 2,639 1,955 74.1 Combined 8,053 4,138 51.4
Student enrollment Less than 100 11,629 4,473 38.5 100–199 6,085 4,270 70.2 200–499 7,406 6,375 86.1 500–749 1,305 1,183 90.6 750–999 512 492 96.3 1,000 or more 285 260 91.1
‡Reporting standards not met. (Too few cases.)NOTE: Detail may not sum to totals because of rounding.
Table 1b. Number of private schools and number and percentage of private schools with library media centers, by affiliation
SOURCE: U.S. Department of Education, National Center for Education Statistics (2002), Schools and Staffing Survey (SASS), "Private School Library Media Center Questionnaire," 1999–2000, and the SASS 1999–2000 Schools Without Libraries Restricted-Use Data File, September 2003.
Table 1b. and selected characteristics: 1999–2000—Continued
7

Table 2a. media centers, by state and selected characteristics: 1999–2000
State and Number of schools Percentage of schoolsselected Number of pupils with paid state-certified with paid state-certified characteristics in public schools Number of pupils Percentage of pupils library media specialists library media specialists1
50 States and DC 45,035,115 43,599,096 96.8 57,781 75.2 Alabama 761,577 744,382 97.7 1,253 96.4 Alaska 119,010 113,112 95.0 183 50.0 Arizona 762,672 733,524 96.2 770 77.8 Arkansas 441,810 438,612 99.3 1,015 93.2 California 5,535,278 5,250,593 94.9 1,499 23.7
Colorado 674,646 666,827 98.8 800 59.1 Connecticut 532,669 525,459 98.7 783 83.9 Delaware 102,859 101,225 98.4 118 86.9 District of Columbia 70,565 62,226 88.2 131 95.4 Florida 2,220,488 2,199,859 99.1 2,142 87.9
Georgia 1,280,579 1,267,829 99.0 1,710 100.0 Hawaii 193,905 193,905 100.0 225 91.3 Idaho 235,704 232,307 98.6 299 54.9 Illinois 2,111,475 2,067,518 97.9 2,223 61.1 Indiana 914,688 909,148 99.4 1,334 76.8
Iowa 492,610 488,800 99.2 1,203 82.2 Kansas 448,466 446,650 99.6 1,250 91.0 Kentucky 621,163 604,774 97.4 1,149 94.0 Louisiana 762,422 727,298 95.4 1,011 79.7 Maine 205,404 188,378 91.7 368 59.2
Maryland 842,076 824,177 97.9 1,067 87.0 Massachusetts 938,592 906,426 96.6 990 61.5 Michigan 1,651,331 1,544,968 93.6 1,763 59.9 Minnesota 811,505 792,035 97.6 1,316 88.8 Mississippi 506,862 499,494 98.6 775 90.2
Missouri 814,933 801,593 98.4 1,584 83.1 Montana 156,117 152,892 97.9 650 87.3 Nebraska 271,867 269,815 99.3 846 83.4 Nevada 323,666 321,501 99.3 296 70.5 New Hampshire 195,113 190,695 97.7 281 65.2
New Jersey 1,207,466 1,151,555 95.4 1,877 90.0 New Mexico 321,509 315,291 98.1 359 52.5 New York 2,866,980 2,680,297 93.5 2,774 74.2 North Carolina 1,227,985 1,208,583 98.4 1,717 91.5 North Dakota 109,496 95,336 87.1 423 91.9
See footnotes at end of table.
Table 2a. Number of pupils in public schools, number and percentage of pupils and state-certified library media specialists in public schools with library
For schools with library media centers
8

Table 2a. media centers, by state and selected characteristics: 1999–2000—Continued
State and Number of schools Percentage of schoolsselected Number of pupils with paid state-certified with paid state-certified characteristics in public schools Number of pupils Percentage of pupils library media specialists library media specialists1
Ohio 1,887,164 1,848,105 97.9 2,086 58.2 Oklahoma 614,820 607,995 98.9 1,615 90.6 Oregon 527,426 516,311 97.9 749 67.0 Pennsylvania 1,828,298 1,740,391 95.2 2,788 94.8 Rhode Island 147,889 146,442 99.0 262 94.6
South Carolina 650,442 635,346 97.7 972 94.0 South Dakota 137,280 124,277 90.5 384 67.2 Tennessee 965,063 916,637 95.0 1,395 93.8 Texas 3,651,806 3,590,811 98.3 5,363 85.9 Utah 468,438 460,789 98.4 402 58.0 Vermont 109,290 109,290 100.0 266 80.3 Virginia 1,099,572 1,059,890 96.4 1,529 95.4 Washington 979,111 941,961 96.2 1,441 78.3 West Virginia 296,096 247,624 83.6 406 66.5 Wisconsin 843,116 842,781 100.0 1,711 87.8 Wyoming 95,816 93,362 97.4 224 64.8Region Northeast 8,031,701 7,638,934 95.1 10,390 80.1 Midwest 10,493,930 10,231,025 97.5 16,122 72.9 South 16,116,186 15,736,762 97.7 23,370 89.8 West 10,393,299 9,992,375 96.1 7,899 50.3Community type Central city 12,772,003 12,227,005 95.7 12,669 70.2 Urban fringe/large town 23,070,308 22,534,489 97.7 26,618 76.6 Rural/small town 9,192,803 8,837,602 96.1 18,493 77.0School level Elementary 28,906,006 28,068,489 97.1 40,424 71.3 Secondary 15,227,260 14,720,158 96.7 16,052 89.4 Combined 901,849 810,448 89.9 1,304 61.3Student enrollment Less than 100 354,835 217,376 61.3 2,176 61.5 100–199 1,177,096 1,009,034 85.7 4,452 66.0 200–499 11,328,974 10,869,797 96.0 22,204 73.3 500–749 12,582,645 12,252,391 97.4 15,569 77.5 750–999 6,826,412 6,728,995 98.6 6,020 76.0 1,000 or more 12,765,152 12,521,503 98.1 7,361 89.51Percentage was calculated using estimate of number of schools with library media centers from table 1a.NOTE: These estimates are for traditional public schools. Traditional public schools include all public schools in the United States except public charter schools. Detail may not sum to totals because of rounding.
SOURCE: U.S. Department of Education, National Center for Education Statistics (2002), Schools and Staffing Survey (SASS), "Public School Library Media Center Questionnaire," 1999–2000, and the SASS 1999–2000 Schools Without Libraries Restricted-Use Data File, September 2003.
Table 2a. Number of pupils in public schools, number and percentage of pupils and state-certified library media specialists in public schools with library
For schools with library media centers
9

Number of schools Percentage of schoolsNumber of pupils with paid state-certified with paid state-certified
Selected characteristics in private schools Number of pupils Percentage of pupils library media specialists library media specialists1
Total 5,252,743 4,292,674 81.7 3,441 20.2Affiliation Catholic 2,516,477 2,273,421 90.3 1,692 23.8 Friends 15,689 15,243 97.2 16 22.3 Episcopal 93,256 85,723 91.9 115 36.3 Hebrew Day 53,915 40,640 75.4 20 13.6 Solomon Schechter 17,078 16,573 97.0 18 34.4 Other Jewish 92,321 66,370 71.9 81 32.6 Lutheran, Missouri Synod 179,063 154,015 86.0 41 5.2 Lutheran, Wisconsin Synod 34,837 20,246 58.1 ‡ ‡ Evangelical Lutheran 19,299 15,057 78.0 8 9.8 Other Lutheran 4,810 ‡ 52.6 ‡ ‡ Seventh-Day Adventist 55,713 44,594 80.0 20 ! 3.5 ! Christian Schools International 97,605 94,555 96.9 101 29.9 American Association of Christian Schools 155,217 101,950 65.7 49 10.5 Association of Christian Schools International 539,607 377,398 69.9 277 17.7 National Association of Private Schools for Exceptional Children 28,316 19,247 68.0 45 25.4 Montessori 63,432 36,719 57.9 42 8.9 Independent Schools 315,446 313,042 99.2 342 48.6 National Independent Private School Association 21,072 ‡ 36.0 ‡ ‡ Other 949,590 607,778 64.0 565 15.3
NCES typology Catholic 2,516,477 2,273,421 90.3 1,692 23.8 Parochial 1,320,916 1,172,258 88.8 607 15.0 Diocesan 820,783 753,700 91.8 719 31.5 Private 374,779 347,464 92.7 366 48.0
Other religious 1,889,284 1,362,879 72.1 992 14.8 Conservative Christian 787,775 524,016 66.5 379 15.6 Affiliated 598,786 504,250 84.2 390 15.8 Unaffiliated 502,723 334,613 66.6 223 12.3
Nonsectarian 846,982 656,373 77.5 757 23.4 Regular 571,946 497,474 87.0 539 32.1 Special emphasis 185,888 105,224 56.6 99 10.6 Special education 89,149 53,675 60.2 119 19.1
All members of National Association of Independent Schools 330,201 326,634 98.9 400 49.8See footnotes at end of table.
Table 2b. Number of pupils in private schools, number and percentage of pupils and state-certified library media specialists in private schools with library media
For schools with library media centers
Table 2b. centers, by affiliation and selected characteristics: 1999–2000
10

Number of schools Percentage of schoolsNumber of pupils with paid state-certified with paid state-certified
Selected characteristics in private schools Number of pupils Percentage of pupils library media specialists library media specialists1
Region Northeast 1,330,815 1,089,714 81.9 664 16.2 Midwest 1,362,520 1,161,693 85.3 982 19.8 South 1,663,780 1,366,262 82.1 1,447 28.2 West 895,628 675,004 75.4 348 12.1
Community type Central city 2,660,154 2,221,612 83.5 1,710 21.5 Urban fringe/large town 2,144,467 1,731,534 80.7 1,348 20.4 Rural/small town 448,123 339,527 75.8 384 15.4
School level Elementary 2,876,095 2,336,119 81.2 1,337 12.2 Secondary 818,918 763,313 93.2 953 48.7 Combined 1,557,730 1,193,241 76.6 1,152 27.8
Student enrollment Less than 100 505,577 228,240 45.1 216 4.8 100–199 887,846 630,797 71.1 561 13.1 200–499 2,255,020 1,962,486 87.0 1,585 24.9 500–749 777,160 706,738 90.9 517 43.7 750–999 439,544 421,704 95.9 353 71.8 1,000 or more 387,598 342,708 88.4 209 80.4
! Interpret data with caution. (Estimates are unstable.)‡Reporting standards not met. (Too few cases.)1Percentage was calculated using estimate of number of schools with library media centers from table 1b.NOTE: Detail may not sum to totals because of rounding.SOURCE: U.S. Department of Education, National Center for Education Statistics (2002), Schools and Staffing Survey (SASS), "Private School Library Media Center Questionnaire," 1999–2000, and the SASS 1999–2000 Schools Without Libraries Restricted-Use Data File, September 2003.
Table 2b. Number of pupils in private schools, number and percentage of pupils and state-certified library media specialists in private schools with library media
For schools with library media centers
Table 2b. centers, by affiliation and selected characteristics: 1999–2000—Continued
11

12
13
Section II: Library Media Center Staff Characteristics This section presents data on traditional public school and private school library media centers from the 1999–2000 Schools and Staffing Survey (SASS). These tables report the educational level of library media specialists, their part-time or full-time status, and the prevalence of paid library aides and library volunteers. Public schools, however, were more likely than private schools to staff the library media center with paid professional staff members who had earned a Master’s in Library Science (MLS) or a related degree. Among public schools with a library media center, 42 percent employed professional library staff with an MLS or related degree (table 3a). Seventeen percent of private schools with a library media center had library staff with paid professional staff with an MLS or related degree (table 3b). The likelihood that a school will have library media specialist with an MLS or related degree is associated with school level. High schools with a library media center were more likely than elementary schools or combined schools to employ a library media specialist with an MLS or related degree. Among public schools with a library media center, 52 percent of high schools had a school librarian with an MLS or related degree in 1999–2000, compared to 39 percent of public elementary schools (table 3a) and 32 percent of combined schools. Among private schools with a library media center, 43 percent of high schools, 9 percent of elementary schools, and 26 percent of combined schools employed a librarian with an MLS or related degree (table 3b). Public schools were more likely than private schools to employ a full-time, state-certified library media specialist. Sixty-one percent of public school library media centers reported at least one full-time, state-certified library media specialist (table 4a). Fifteen percent of private school library media centers reported a full-time, state-certified library media specialist (table 4b). Public schools were more likely than private schools to employ at least one library aide or clerical staff. Among public schools, 72 percent employed at least one library aide (table 5a). Thirty-six percent of private schools reported a paid library aide or clerical staff working in the library media center (table 5b). A larger proportion of private school library media centers than public schools libraries relied on adult volunteers. Among private schools, 58 percent reported having at least one adult volunteer in the library media center (table 5b). Thirty-eight percent of public schools reported having at least one adult volunteer in the library media center (table 5a).
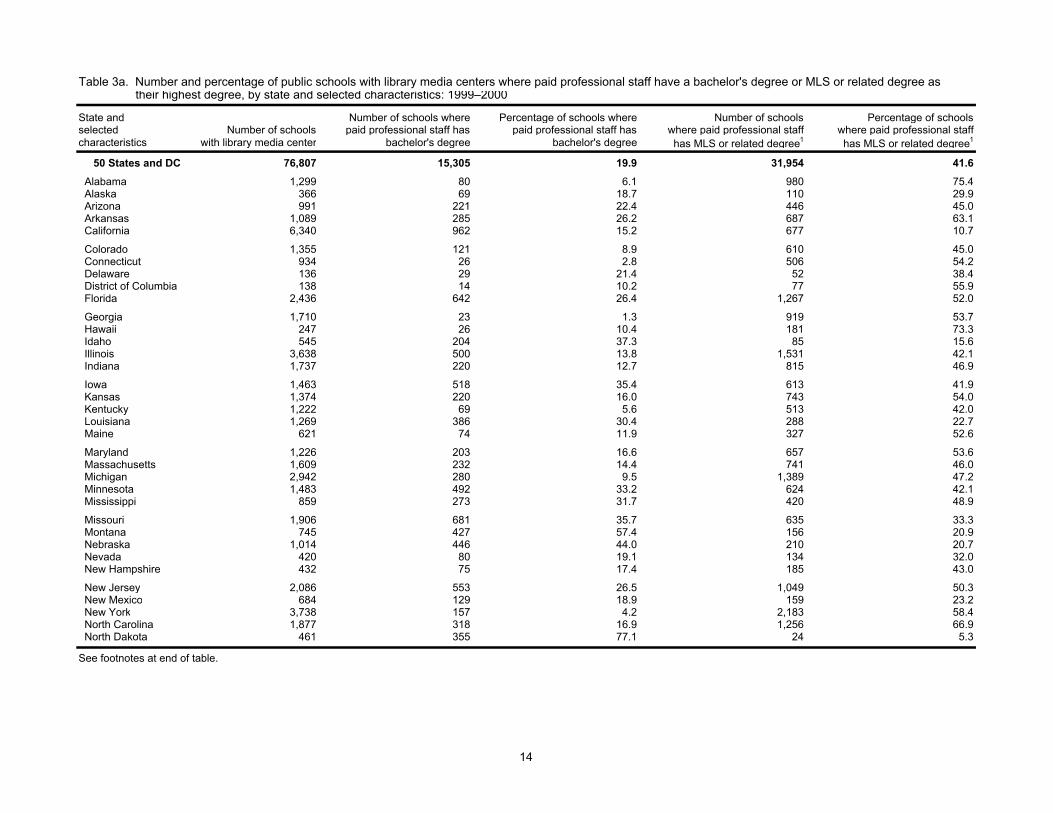
Table 3a. their highest degree, by state and selected characteristics: 1999–2000
State and Number of schools where Percentage of schools where Number of schools Percentage of schoolsselected Number of schools paid professional staff has paid professional staff has where paid professional staff where paid professional staffcharacteristics with library media center bachelor's degree bachelor's degree has MLS or related degree1 has MLS or related degree1
50 States and DC 76,807 15,305 19.9 31,954 41.6 Alabama 1,299 80 6.1 980 75.4 Alaska 366 69 18.7 110 29.9 Arizona 991 221 22.4 446 45.0 Arkansas 1,089 285 26.2 687 63.1 California 6,340 962 15.2 677 10.7
Colorado 1,355 121 8.9 610 45.0 Connecticut 934 26 2.8 506 54.2 Delaware 136 29 21.4 52 38.4 District of Columbia 138 14 10.2 77 55.9 Florida 2,436 642 26.4 1,267 52.0
Georgia 1,710 23 1.3 919 53.7 Hawaii 247 26 10.4 181 73.3 Idaho 545 204 37.3 85 15.6 Illinois 3,638 500 13.8 1,531 42.1 Indiana 1,737 220 12.7 815 46.9
Iowa 1,463 518 35.4 613 41.9 Kansas 1,374 220 16.0 743 54.0 Kentucky 1,222 69 5.6 513 42.0 Louisiana 1,269 386 30.4 288 22.7 Maine 621 74 11.9 327 52.6
Maryland 1,226 203 16.6 657 53.6 Massachusetts 1,609 232 14.4 741 46.0 Michigan 2,942 280 9.5 1,389 47.2 Minnesota 1,483 492 33.2 624 42.1 Mississippi 859 273 31.7 420 48.9
Missouri 1,906 681 35.7 635 33.3 Montana 745 427 57.4 156 20.9 Nebraska 1,014 446 44.0 210 20.7 Nevada 420 80 19.1 134 32.0 New Hampshire 432 75 17.4 185 43.0
New Jersey 2,086 553 26.5 1,049 50.3 New Mexico 684 129 18.9 159 23.2 New York 3,738 157 4.2 2,183 58.4 North Carolina 1,877 318 16.9 1,256 66.9 North Dakota 461 355 77.1 24 5.3
See footnotes at end of table.
Table 3a. Number and percentage of public schools with library media centers where paid professional staff have a bachelor's degree or MLS or related degree as
14

Table 3a. their highest degree, by state and selected characteristics: 1999–2000—Continued
State and Number of schools where Percentage of schools where Number of schools Percentage of schoolsselected Number of schools paid professional staff has paid professional staff has where paid professional staff where paid professional staffcharacteristics with library media center bachelor's degree bachelor's degree has MLS or related degree1 has MLS or related degree1
Ohio 3,584 559 15.6 1,069 29.8 Oklahoma 1,782 362 20.3 894 50.2 Oregon 1,118 258 23.1 330 29.5 Pennsylvania 2,941 628 21.3 1,624 55.2 Rhode Island 277 18 6.6 206 74.3
South Carolina 1,035 76 7.3 677 65.5 South Dakota 571 274 48.0 102 17.8 Tennessee 1,488 327 21.9 453 30.4 Texas 6,246 1,550 24.8 2,489 39.9 Utah 693 167 24.0 151 21.8
Vermont 332 80 24.0 130 39.2 Virginia 1,602 535 33.4 781 48.7 Washington 1,841 391 21.3 545 29.6 West Virginia 610 135 22.1 108 17.7 Wisconsin 1,948 434 22.3 1,074 55.1 Wyoming 346 119 34.4 72 20.7
Region Northeast 12,969 1,842 14.2 6,952 53.6 Midwest 22,123 4,981 22.5 8,828 39.9 South 26,025 5,306 20.4 12,520 48.1 West 15,690 3,175 20.2 3,654 23.3
Community type Central city 18,038 2,949 16.3 6,921 38.4 Urban fringe/large town 34,754 5,878 16.9 16,328 47.0 Rural/small town 24,015 6,478 27.0 8,705 36.2 School level Elementary 56,715 10,805 19.1 21,938 38.7 Secondary 17,963 4,093 22.8 9,327 51.9 Combined 2,129 407 19.1 688 32.3
Student enrollment Less than 100 3,540 989 27.9 778 22.0 100–199 6,748 1,949 28.9 2,029 30.1 200–499 30,280 6,072 20.1 12,177 40.2 500–749 20,095 3,678 18.3 8,538 42.5 750–999 7,917 1,245 15.7 3,621 45.7 1,000 or more 8,227 1,372 16.7 4,811 58.5
1Master’s Degree in Librarianship, Educational Media, Instructional Design, Instructional Technology, Library Science or Information Science as their highest degree.
Table 3a. Number and percentage of public schools with library media centers where paid professional staff have a bachelor's degree or MLS or related degree as
SOURCE: U.S. Department of Education, National Center for Education Statistics, Schools and Staffing Survey, "Public School Library Media Center Questionnaire," 1999–2000.
NOTE: These estimates are for traditional public schools. Traditional public schools include all public schools in the United States except public charter schools. Detail may not sum to totals because of rounding.
15

Number of Number of schools where Percentage of schools where Number of schools where Percentage of schoolsprivate schools with paid professional staff has paid professional staff has paid professional staff has where paid professional staff
Selected characteristics library media centers bachelor's degree bachelor's degree MLS or related degree1 has MLS or related degree1
Total 17,054 3,542 20.8 2,851 16.7
Affiliation Catholic 7,097 1,887 26.6 1,175 16.6 Friends 71 12 17.2 21 30.2 Episcopal 318 86 27.1 102 32.0 Hebrew Day 146 47 32.0 16 11.0 Solomon Schechter 54 9 16.4 20 36.7 Other Jewish 247 11 4.3 100 40.6 Lutheran, Missouri Synod 779 116 14.9 57 7.4 Lutheran, Wisconsin Synod 174 16 9.3 5 2.8 Evangelical Lutheran 83 18 21.9 7 8.3 Other Lutheran ‡ ‡ ‡ ‡ ‡ Seventh-Day Adventist 590 51 8.7 18 ! 3.1 ! Christian Schools International 336 101 30.0 77 22.8 American Association of Christian Schools 463 69 14.9 54 11.6 Association of Christian Schools International 1,566 371 23.7 207 13.2 National Association of Private Schools for Exceptional Children 177 24 13.7 40 22.6 Montessori 474 62 13.0 39 8.2 Independent Schools 705 154 21.9 457 64.8 National Independent Private School Association ‡ ‡ ‡ ‡ ‡ Other 3,705 496 13.4 453 12.2
NCES typology Catholic 7,097 1,887 26.6 1,175 16.6 Parochial 4,050 1,091 26.9 431 10.6 Diocesan 2,283 573 25.1 369 16.2 Private 763 223 29.2 375 49.2
Other religious 6,723 1,157 17.2 873 13.0 Conservative Christian 2,436 476 19.5 269 11.1 Affiliated 2,472 461 18.6 350 14.1 Unaffiliated 1,815 220 12.1 254 14.0
Nonsectarian 3,234 498 15.4 803 24.8 Regular 1,678 340 20.2 597 35.6 Special emphasis 931 92 9.9 115 12.4 Special education 625 67 10.7 91 14.5
All members of National Association of Independent Schools 803 153 19.0 524 65.3
See footnotes at end of table.
Table 3b. Number and percentage of private schools with library media centers where paid professional staff have a bachelor's degree or MLS or related degree as their highestTable 3b. degree, by affiliation and selected characteristics: 1999–2000
16

Number of Number of schools where Percentage of schools where Number of schools where Percentage of schoolsprivate schools with paid professional staff has paid professional staff has paid professional staff has where paid professional staff
Selected characteristics library media centers bachelor's degree bachelor's degree MLS or related degree1 has MLS or related degree1
Region Northeast 4,093 795 19.4 740 18.1 Midwest 4,948 1,092 22.1 597 12.1 South 5,130 1,258 24.5 1,141 22.2 West 2,883 397 13.8 373 12.9
Community type Central city 7,942 1,535 19.3 1,482 18.7 Urban fringe/large town 6,610 1,448 21.9 1,084 16.4 Rural/small town 2,501 558 22.3 285 11.4
School level Elementary 10,961 2,397 21.9 928 8.5 Secondary 1,955 392 20.1 837 42.8 Combined 4,138 753 18.2 1,087 26.3
Student enrollment Less than 100 4,473 358 8.0 98 ! 2.2 ! 100–199 4,270 965 22.6 434 10.2 200–499 6,375 1,665 26.1 1,348 21.2 500–749 1,183 358 30.3 508 43.0 750–999 492 116 23.6 285 57.8 1,000 or more 260 79 30.4 178 68.5
! Interpret data with caution. (Estimates are unstable.)‡Reporting standards not met. (Too few cases.)1 Master’s Degree in Librarianship, Educational Media, Instructional Design, Instructional Technology, Library Science or Information Science as their highest degree.NOTE: Detail may not sum to totals because of rounding.SOURCE: U.S. Department of Education, National Center for Education Statistics, Schools and Staffing Survey (SASS), "Private School Library Media Center Questionnaire," 1999–2000.
Table 3b. Number and percentage of private schools with library media centers where paid professional staff have a bachelor's degree or MLS or related degree as their highestTable 3b. degree, by affiliation and selected characteristics: 1999–2000—Continued
17
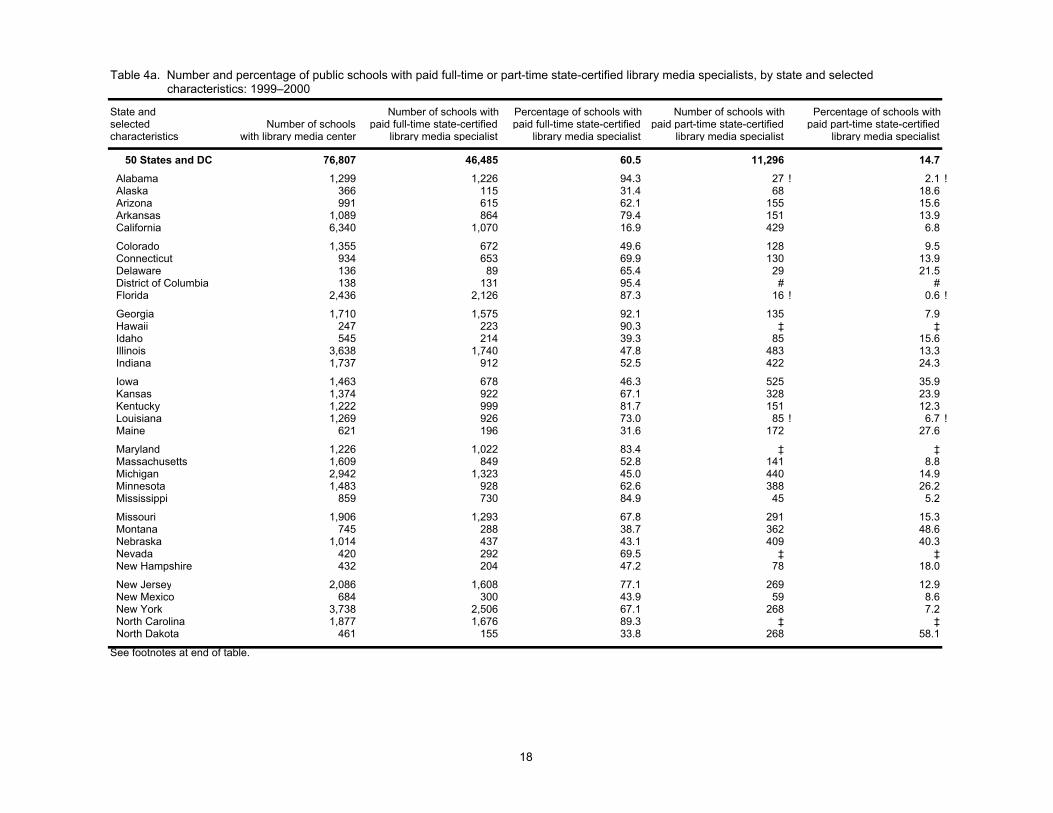
Table 4a. characteristics: 1999–2000
State and Number of schools with Percentage of schools with Number of schools with Percentage of schools withselected Number of schools paid full-time state-certified paid full-time state-certified paid part-time state-certified paid part-time state-certifiedcharacteristics with library media center library media specialist library media specialist library media specialist library media specialist
50 States and DC 76,807 46,485 60.5 11,296 14.7 Alabama 1,299 1,226 94.3 27 ! 2.1 ! Alaska 366 115 31.4 68 18.6 Arizona 991 615 62.1 155 15.6 Arkansas 1,089 864 79.4 151 13.9 California 6,340 1,070 16.9 429 6.8
Colorado 1,355 672 49.6 128 9.5 Connecticut 934 653 69.9 130 13.9 Delaware 136 89 65.4 29 21.5 District of Columbia 138 131 95.4 # # Florida 2,436 2,126 87.3 16 ! 0.6 !
Georgia 1,710 1,575 92.1 135 7.9 Hawaii 247 223 90.3 ‡ ‡ Idaho 545 214 39.3 85 15.6 Illinois 3,638 1,740 47.8 483 13.3 Indiana 1,737 912 52.5 422 24.3
Iowa 1,463 678 46.3 525 35.9 Kansas 1,374 922 67.1 328 23.9 Kentucky 1,222 999 81.7 151 12.3 Louisiana 1,269 926 73.0 85 ! 6.7 ! Maine 621 196 31.6 172 27.6
Maryland 1,226 1,022 83.4 ‡ ‡ Massachusetts 1,609 849 52.8 141 8.8 Michigan 2,942 1,323 45.0 440 14.9 Minnesota 1,483 928 62.6 388 26.2 Mississippi 859 730 84.9 45 5.2
Missouri 1,906 1,293 67.8 291 15.3 Montana 745 288 38.7 362 48.6 Nebraska 1,014 437 43.1 409 40.3 Nevada 420 292 69.5 ‡ ‡ New Hampshire 432 204 47.2 78 18.0
New Jersey 2,086 1,608 77.1 269 12.9 New Mexico 684 300 43.9 59 8.6 New York 3,738 2,506 67.1 268 7.2 North Carolina 1,877 1,676 89.3 ‡ ‡ North Dakota 461 155 33.8 268 58.1
See footnotes at end of table.
Table 4a. Number and percentage of public schools with paid full-time or part-time state-certified library media specialists, by state and selected
18

Table 4a. characteristics: 1999–2000—ContinuedState and Number of schools with Percentage of schools with Number of schools with Percentage of schools withselected Number of schools paid full-time state-certified paid full-time state-certified paid part-time state-certified paid part-time state-certifiedcharacteristics with library media center library media specialist library media specialist library media specialist library media specialist
Ohio 3,584 1,575 43.9 510 14.2 Oklahoma 1,782 1,118 62.7 498 27.9 Oregon 1,118 360 32.2 389 34.9 Pennsylvania 2,941 2,086 70.9 702 23.9 Rhode Island 277 149 53.6 114 41.0
South Carolina 1,035 942 91.0 ‡ ‡ South Dakota 571 231 40.4 153 26.8 Tennessee 1,488 1,363 91.6 ‡ ‡ Texas 6,246 4,473 71.6 890 14.3 Utah 693 295 42.6 107 15.4
Vermont 332 186 56.1 80 24.1 Virginia 1,602 1,504 93.9 ‡ ‡ Washington 1,841 1,120 60.9 320 17.4 West Virginia 610 353 57.9 52 8.6 Wisconsin 1,948 1,023 52.5 688 35.3 Wyoming 346 150 43.5 74 21.4Region Northeast 12,969 8,436 65.0 1,954 15.1 Midwest 22,123 11,217 50.7 4,905 22.2 South 26,025 21,116 81.1 2,254 8.7 West 15,690 5,716 36.4 2,183 13.9Community type Central city 18,038 10,523 58.3 2,146 11.9 Urban fringe/large town 34,754 22,365 64.4 4,253 12.2 Rural/small town 24,015 13,597 56.6 4,896 20.4School level Elementary 56,715 31,150 54.9 9,275 16.4 Secondary 17,963 14,243 79.3 1,809 10.1 Combined 2,129 1,092 51.3 212 10.0Student enrollment Less than 100 3,540 947 26.7 1,229 34.7 100–199 6,748 2,087 30.9 2,365 35.0 200–499 30,280 16,216 53.6 5,988 19.8 500–749 20,095 14,412 71.7 1,157 5.8 750–999 7,917 5,714 72.2 305 3.9 1,000 or more 8,227 7,109 86.4 252 3.1
# Rounds to zero.! Interpret data with caution. (Estimates are unstable.)‡ Reporting standards not met. (Too few cases.)
Table 4a. Number and percentage of public schools with paid full-time or part-time state-certified library media specialists, by state and selected
NOTE: These estimates are for traditional public schools. Traditional public schools include all public schools in the United States except public charter schools. Detail may not sum to totals because of rounding.SOURCE: U.S. Department of Education, National Center for Education Statistics, Schools and Staffing Survey, "Public School Library Media Center Questionnaire," 1999–2000.
19
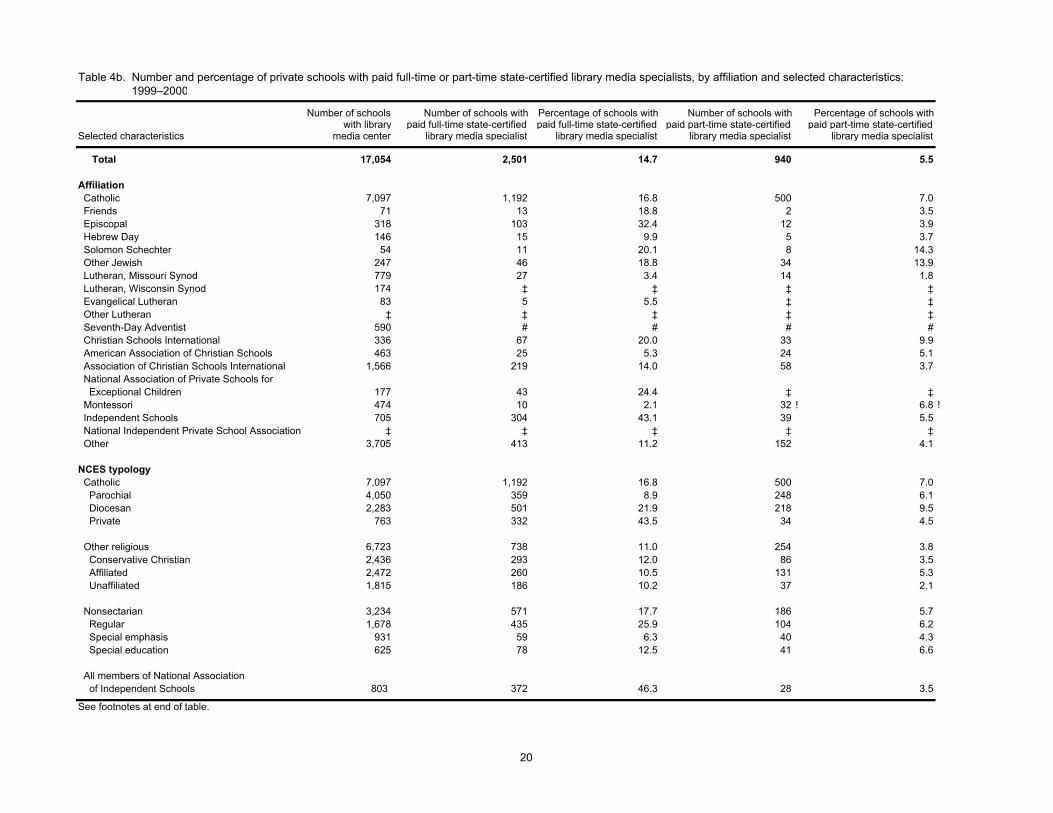
Number of schools Number of schools with Percentage of schools with Number of schools with Percentage of schools with with library paid full-time state-certified paid full-time state-certified paid part-time state-certified paid part-time state-certified
Selected characteristics media center library media specialist library media specialist library media specialist library media specialist
Total 17,054 2,501 14.7 940 5.5
Affiliation Catholic 7,097 1,192 16.8 500 7.0 Friends 71 13 18.8 2 3.5 Episcopal 318 103 32.4 12 3.9 Hebrew Day 146 15 9.9 5 3.7 Solomon Schechter 54 11 20.1 8 14.3 Other Jewish 247 46 18.8 34 13.9 Lutheran, Missouri Synod 779 27 3.4 14 1.8 Lutheran, Wisconsin Synod 174 ‡ ‡ ‡ ‡ Evangelical Lutheran 83 5 5.5 ‡ ‡ Other Lutheran ‡ ‡ ‡ ‡ ‡ Seventh-Day Adventist 590 # # # # Christian Schools International 336 67 20.0 33 9.9 American Association of Christian Schools 463 25 5.3 24 5.1 Association of Christian Schools International 1,566 219 14.0 58 3.7 National Association of Private Schools for Exceptional Children 177 43 24.4 ‡ ‡ Montessori 474 10 2.1 32 ! 6.8 ! Independent Schools 705 304 43.1 39 5.5 National Independent Private School Association ‡ ‡ ‡ ‡ ‡ Other 3,705 413 11.2 152 4.1
NCES typology Catholic 7,097 1,192 16.8 500 7.0 Parochial 4,050 359 8.9 248 6.1 Diocesan 2,283 501 21.9 218 9.5 Private 763 332 43.5 34 4.5
Other religious 6,723 738 11.0 254 3.8 Conservative Christian 2,436 293 12.0 86 3.5 Affiliated 2,472 260 10.5 131 5.3 Unaffiliated 1,815 186 10.2 37 2.1
Nonsectarian 3,234 571 17.7 186 5.7 Regular 1,678 435 25.9 104 6.2 Special emphasis 931 59 6.3 40 4.3 Special education 625 78 12.5 41 6.6
All members of National Association of Independent Schools 803 372 46.3 28 3.5
See footnotes at end of table.
Table 4b. Number and percentage of private schools with paid full-time or part-time state-certified library media specialists, by affiliation and selected characteristics:Table 4b. 1999–2000
20

Number of schools Number of schools with Percentage of schools with Number of schools with Percentage of schools with with library paid full-time state-certified paid full-time state-certified paid part-time state-certified paid part-time state-certified
Selected characteristics media center library media specialist library media specialist library media specialist library media specialist
Region Northeast 4,093 503 12.3 162 3.9 Midwest 4,948 617 12.5 365 7.4 South 5,130 1,128 22.0 319 6.2 West 2,883 254 8.8 94 3.3
Community type Central city 7,942 1,399 17.6 311 3.9 Urban fringe/large town 6,610 926 14.0 422 6.4 Rural/small town 2,501 177 7.1 207 8.3
School level Elementary 10,961 765 7.0 572 5.2 Secondary 1,955 837 42.8 116 5.9 Combined 4,138 900 21.7 252 6.1
Student enrollment Less than 100 4,473 77 1.7 139 3.1 100–199 4,270 300 7.0 261 6.1 200–499 6,375 1,148 18.0 436 6.8 500–749 1,183 437 37.0 80 6.8 750–999 492 336 68.2 18 3.6 1,000 or more 260 203 78.0 6 2.4
# Rounds to zero.! Interpret data with caution. (Estimates are unstable.)‡Reporting standards not met. (Too few cases.)NOTE: Detail may not sum to totals because of rounding.
Table 4b. Number and percentage of private schools with paid full-time or part-time state-certified library media specialists, by affiliation and selected characteristicsTable 4b. 1999–2000—Continued
SOURCE: U.S. Department of Education, National Center for Education Statistics, Schools and Staffing Survey (SASS), "Private School Library Media Center Questionnaire," 1999–2000.
21

recent full week, by state and selected characteristics: 1999–2000
State and Number of schools Number of schools Percentage of schools Number of schools Percentage of schools Number of schools Percentage of schoolsselected with library with paid library aides with paid library aides with adult with adult with student with studentcharacteristics media center or clerical staff or clerical staff volunteers volunteers volunteers volunteers
50 States and DC 76,807 54,956 71.6 29,210 38.0 27,805 36.2 Alabama 1,299 846 65.1 483 37.2 608 46.8 Alaska 366 209 57.2 156 42.5 162 44.2 Arizona 991 856 86.4 486 49.1 392 39.5 Arkansas 1,089 456 41.9 238 21.9 454 41.7 California 6,340 5,559 87.7 2,752 43.4 2,375 37.5
Colorado 1,355 1,028 75.9 800 59.0 546 40.3 Connecticut 934 727 77.9 516 55.2 234 25.1 Delaware 136 59 43.7 72 53.0 51 37.4 District of Columbia 138 23 16.8 34 24.6 44 32.1 Florida 2,436 1,990 81.7 1,368 56.2 1,428 58.6
Georgia 1,710 1,525 89.2 717 41.9 599 35.0 Hawaii 247 86 34.9 125 50.7 148 59.8 Idaho 545 419 76.9 193 35.4 240 44.1 Illinois 3,638 2,691 74.0 1,271 34.9 1,164 32.0 Indiana 1,737 1,474 84.9 650 37.4 628 36.1
Iowa 1,463 1,270 86.8 305 20.8 327 22.3 Kansas 1,374 1,029 74.9 419 30.5 305 22.2 Kentucky 1,222 635 51.9 429 35.1 385 31.5 Louisiana 1,269 353 27.8 412 32.5 633 49.9 Maine 621 479 77.0 358 57.7 206 33.2
Maryland 1,226 601 49.0 745 60.7 689 56.2 Massachusetts 1,609 1,045 65.0 1,016 63.1 484 30.1 Michigan 2,942 2,234 75.9 916 31.1 845 28.7 Minnesota 1,483 1,301 87.7 445 30.0 431 29.0 Mississippi 859 378 44.0 146 17.0 318 37.0
Missouri 1,906 1,048 55.0 461 24.2 499 26.2 Montana 745 380 51.0 232 31.1 251 33.8 Nebraska 1,014 721 71.1 219 21.6 190 18.7 Nevada 420 278 66.1 179 42.5 172 41.0 New Hampshire 432 308 71.5 196 45.5 110 25.6
New Jersey 2,086 1,140 54.7 829 39.8 409 19.6 New Mexico 684 500 73.1 210 30.7 195 28.6 New York 3,738 2,595 69.4 1,060 28.4 1,176 31.5 North Carolina 1,877 1,532 81.6 740 39.4 837 44.6 North Dakota 461 266 57.8 57 12.4 112 24.3
See footnotes at end of table.
Table 5a. Number and percentage of public schools with paid library aides or clerical staff and regularly scheduled adult and student library volunteers during most
22

Table 5a. recent full week, by state and selected characteristics: 1999–2000—Continued
State and Number of schools Number of schools Percentage of schools Number of schools Percentage of schools Number of schools Percentage of schoolsselected with library with paid library aides with paid library aides with adult with adult with student with studentcharacteristics media center or clerical staff or clerical staff volunteers volunteers volunteers volunteers
Ohio 3,584 2,520 70.3 1,084 30.2 1,307 36.5 Oklahoma 1,782 1,283 72.0 395 22.2 550 30.9 Oregon 1,118 960 85.9 555 49.6 451 40.4 Pennsylvania 2,941 1,903 64.7 1,138 38.7 948 32.2 Rhode Island 277 159 57.4 121 43.5 84 30.1
South Carolina 1,035 790 76.4 425 41.1 557 53.8 South Dakota 571 314 54.9 117 20.5 154 27.0 Tennessee 1,488 815 54.8 649 43.6 747 50.2 Texas 6,246 4,749 76.0 2,157 34.5 2,337 37.4 Utah 693 443 63.9 178 25.6 224 32.3
Vermont 332 206 62.2 166 50.1 118 35.5 Virginia 1,602 1,077 67.2 891 55.6 524 32.7 Washington 1,841 1,608 87.4 934 50.7 1,055 57.3 West Virginia 610 85 14.0 325 53.3 210 34.5 Wisconsin 1,948 1,718 88.2 701 36.0 796 40.9 Wyoming 346 282 81.5 140 40.4 94 27.2
Region Northeast 12,969 8,563 66.0 5,401 41.6 3,770 29.1 Midwest 22,123 16,587 75.0 6,644 30.0 6,757 30.5 South 26,025 17,197 66.1 10,226 39.3 10,972 42.2 West 15,690 12,608 80.4 6,939 44.2 6,306 40.2
Community type Central city 18,038 11,835 65.6 7,354 40.8 7,100 39.4 Urban fringe/large town 34,754 27,069 77.9 15,718 45.2 13,022 37.5 Rural/small town 24,015 16,051 66.8 6,138 25.6 7,682 32.0 School level Elementary 56,715 41,189 72.6 25,775 45.4 18,773 33.1 Secondary 17,963 12,599 70.1 3,023 16.8 8,268 46.0 Combined 2,129 1,168 54.9 412 19.4 763 35.9
Student enrollment Less than 100 3,540 2,021 57.1 763 21.6 753 21.3 100–199 6,748 4,361 64.6 1,625 24.1 1,644 24.4 200–499 30,280 19,901 65.7 11,501 38.0 9,388 31.0 500–749 20,095 15,489 77.1 9,212 45.8 8,182 40.7 750–999 7,917 6,357 80.3 3,372 42.6 3,294 41.6 1,000 or more 8,227 6,828 83.0 2,737 33.3 4,544 55.2
Table 5a. Number and percentage of public schools with paid library aides or clerical staff and regularly scheduled adult and student library volunteers during most
NOTE: These estimates are for traditional public schools. Traditional public schools include all public schools in the United States except public charter schools. Detail may not sum to totals because of rounding.SOURCE: U.S. Department of Education, National Center for Education Statistics, Schools and Staffing Survey, "Public School Library Media Center Questionnaire," 1999–2000.
23

Number of schools Percentage of schools Number of schools Percentage of schools Number of schools Percentage of schoolswith paid library aides with paid aides with adult with adult with student with student
Selected characteristics or clerical staff or clerical staff1 volunteers volunteers1 volunteers volunteers1
Total 6,064 35.6 9,908 58.1 4,192 24.6
Affiliation Catholic 2,831 39.9 4,626 65.2 1,588 22.4 Friends 29 41.5 41 57.9 13 18.6 Episcopal 111 34.8 229 71.9 82 25.9 Hebrew Day 48 33.0 52 35.3 22 15.0 Solomon Schechter 21 38.5 32 58.8 17 32.5 Other Jewish 91 36.7 126 51.1 88 35.4 Lutheran, Missouri Synod 243 31.2 548 70.3 136 17.5 Lutheran, Wisconsin Synod 17 9.7 134 77.0 15 8.8 Evangelical Lutheran 22 26.4 52 63.2 11 12.9 Other Lutheran ‡ ‡ ‡ ‡ ‡ ‡ Seventh-Day Adventist 118 20.1 289 49.0 156 26.5 Christian Schools International 154 45.7 247 73.6 96 28.5 American Association of Christian Schools 140 30.2 204 44.1 166 35.9 Association of Christian Schools International 460 29.4 1,016 64.8 585 37.4 National Association of Private Schools for Exceptional Children 48 27.1 90 50.8 88 49.8 Montessori 86 18.1 244 51.5 139 29.4 Independent Schools 435 61.8 463 65.7 199 28.2 National Independent Private School Associatio ‡ ‡ ‡ ‡ ‡ ‡ Other 1,194 32.2 1,471 39.7 781 21.1
NCES typology Catholic 2,831 39.9 4,626 65.2 1,588 22.4 Parochial 1,494 36.9 2,846 70.3 772 19.1 Diocesan 1,003 43.9 1,468 64.3 562 24.6 Private 334 43.7 311 40.8 254 33.2
Other religious 2,173 32.3 3,752 55.8 1,914 28.5 Conservative Christian 695 28.5 1,434 58.8 883 36.2 Affiliated 907 36.7 1,314 53.2 629 25.4 Unaffiliated 571 31.4 1,004 55.3 402 22.2
Nonsectarian 1,060 32.8 1,530 47.3 690 21.3 Regular 645 38.5 911 54.3 375 22.3 Special emphasis 267 28.7 450 48.3 205 22.0 Special education 147 23.6 170 27.1 110 17.7
All members of National Association of Independent Schools 459 57.2 532 66.2 249 31.0
See footnotes at end of table.
Table 5b. Number and percentage of private schools with paid library aides or clerical staff and regularly scheduled adult and student library volunteers during most recentTable 5b. full week, by affiliation and selected characteristics: 1999–2000
24

Number of schools Percentage of schools Number of schools Percentage of schools Number of schools Percentage of schoolswith paid library aides with paid aides with adult with adult with student with student
Selected characteristics or clerical staff or clerical staff1 volunteers volunteers1 volunteers volunteers1
Region Northeast 1,394 34.1 2,115 51.7 975 23.8 Midwest 1,629 32.9 3,199 64.7 936 18.9 South 1,767 34.4 2,797 54.5 1,612 31.4 West 1,275 44.2 1,797 62.3 669 23.2
Community type Central city 2,635 33.2 4,670 58.8 2,109 26.6 Urban fringe/large town 2,574 38.9 3,781 57.2 1,489 22.5 Rural/small town 855 34.2 1,457 58.2 594 23.8
School level Elementary 3,618 33.0 7,061 64.4 2,199 20.1 Secondary 871 44.6 695 35.6 641 32.8 Combined 1,575 38.1 2,151 52.0 1,352 32.7
Student enrollment Less than 100 676 15.1 2,283 51.0 897 20.0 100–199 1,546 36.2 2,395 56.1 760 17.8 200–499 2,734 42.9 4,023 63.1 1,729 27.1 500–749 598 50.6 767 64.9 480 40.6 750–999 330 67.0 300 61.0 205 41.7 1,000 or more 179 69.0 138 53.3 122 46.9
‡Reporting standards not met. (Too few cases.)1Percentages are calculated from estimate of number of schools with a library media center in table 1b.
NOTE: Detail may not sum to totals because of rounding.SOURCE: U.S. Department of Education, National Center for Education Statistics, Schools and Staffing Survey (SASS), "Private School Library Media Center Questionnaire," 1999–2000.
Table 5b. Number and percentage of private schools with paid library aides or clerical staff and regularly scheduled adult and student library volunteers during most recentTable 5b. full week, by affiliation and selected characteristics: 1999–2000—Continued
25

26

27
Section III: Library Media Center Expenditures and Collection Holdings
This section presents data on traditional public school and private school library media centers from the 1999–2000 Schools and Staffing Survey (SASS). These tables report on the library expenditures and aspects of the collection, including books, CD-ROMs, and DVDs. Survey questions about library expenditures and collection holdings asked for information from the previous school year. The average library expenditures of public schools increased between the 1993–94 and the 1999–2000 SASS. When adjusted for inflation, public schools spent an average of $7,900 on library expenditures in 1992–93. By 1998–99, public schools had increased their average library expenditures to $8,700 (table 6a). No difference was detected in average library expenditures for private schools between 1992–93 and 1998–99, when adjusted for inflation (table 6b). Although public school library media center expenditures were greater than those for private schools, these differences were not constant across school sizes. Public schools with fewer than 100 students spent an average of $3,700 for library materials, compared with $1,100 for private schools (tables 6a and 6b). For schools with more than 1,000, no difference was detected between the average expenditures of public and private schools. The percentage of library expenditures for the purchase or rental of books was higher for public and private elementary schools than for high schools or combined schools in 1999–2000. Seventy percent of public elementary schools’ library expenditures and 69 percent of private elementary schools’ library expenditures were for the purchase or rental of books (table 6a and 6b). In public high schools, 56 percent of library expenditures, and in public combined schools, 58 percent of library expenditures, were for the purchase or rental of books. In private high schools, 49 percent of library expenditures, and in private combined schools, 58 percent of library expenditures, were for the purchase or rental of books. A larger proportion of public school libraries than private school libraries held CD-ROMs and videotapes, DVDs, or laser discs in the collection. Eighty percent of public schools with library media centers held CD-ROMs and 92 percent held video materials in their library collections (table 7a). Fifty-five percent of private schools with school libraries owned CD-ROMs in their collections and 83 percent held video materials (table 7b).

Table 1a. 1999–2000
State and Percentage of library Average number of Average number ofselected Average library Average book expenditures books acquired of books held atcharacteristics expenditures1 expenditures2 spent on books2 during 1998-1999 end of 1998-1999
50 States and DC $8,729 $5,683 65.1 488 10,232 Alabama 7,941 4,942 62.2 412 10,928 Alaska 5,813 3,438 59.1 271 8,824 Arizona 8,568 6,292 73.4 613 14,048 Arkansas 6,630 4,490 67.7 353 8,208 California 12,079 9,168 75.9 749 11,584
Colorado 7,197 4,613 64.1 385 8,650 Connecticut 12,382 7,913 63.9 517 11,775 Delaware 7,971 5,907 74.1 482 10,676 District of Columbia 2,656 1,683 63.4 151 9,328 Florida 11,116 6,922 62.3 786 14,153
Georgia 11,556 7,165 62.0 640 11,756 Hawaii 7,795 5,457 70.0 488 12,750 Idaho 19,792 17,038 86.1 1,509 10,109 Illinois 7,623 4,705 61.7 462 8,781 Indiana 8,151 5,218 64.0 402 11,393
Iowa 5,647 3,321 58.8 288 8,408 Kansas 6,793 4,067 59.9 394 8,573 Kentucky 7,378 4,439 60.2 429 8,697 Louisiana 6,293 4,231 67.2 309 9,183 Maine 7,125 4,309 60.5 311 8,885
Maryland 11,649 6,624 56.9 477 9,416 Massachusetts 7,182 4,264 59.4 446 9,212 Michigan 7,046 4,605 65.4 343 8,944 Minnesota 8,890 5,561 62.6 463 13,279 Mississippi 7,593 5,417 71.3 443 11,538
Missouri 10,434 5,809 55.7 431 9,461 Montana 5,000 2,692 53.8 274 7,342 Nebraska 6,045 3,394 56.1 266 8,655 Nevada 9,861 7,044 71.4 634 12,739 New Hampshire 9,136 4,772 52.2 385 8,226
New Jersey 8,994 5,005 55.6 358 10,518 New Mexico 7,514 5,085 67.7 491 9,517 New York 8,907 5,885 66.1 523 10,561 North Carolina 11,038 7,248 65.7 512 10,239 North Dakota 6,047 3,526 58.3 351 10,722
See footnotes at end of table.
Table 6a. Average library expenditures and book holdings for public school library media centers, by state and selected characteristics:
28

Table 6a. 1999–2000—Continued
State and Percentage of library Average number of Average number ofselected Average library Average book expenditures books acquired of books held atcharacteristics expenditures1 expenditures2 spent on books2 during 1998-1999 end of 1998-1999
Ohio $5,873 $3,377 57.5 306 7,920 Oklahoma 5,995 3,863 64.4 319 7,698 Oregon 5,705 3,039 53.3 309 12,264 Pennsylvania 8,908 5,677 63.7 369 11,900 Rhode Island 6,499 3,869 59.5 348 7,942
South Carolina 8,281 5,942 71.8 438 9,305 South Dakota 5,844 3,352 57.4 329 8,713 Tennessee 9,206 6,075 66.0 585 9,339 Texas 9,980 6,927 69.4 619 10,351 Utah 5,994 4,001 66.7 425 8,348
Vermont 8,500 5,429 63.9 395 9,167 Virginia 10,131 6,439 63.6 770 12,229 Washington 7,893 5,557 70.4 513 10,584 West Virginia 4,560 2,875 63.0 231 6,873 Wisconsin 10,809 6,291 58.2 483 11,763 Wyoming 5,978 3,576 59.8 328 9,021Region Northeast 8,818 5,474 62.1 430 10,528 Midwest 7,579 4,558 60.1 385 9,486 South 9,170 5,996 65.4 538 10,340 West 9,548 6,921 72.5 601 10,860Community type Central city 8,400 5,714 68.0 533 9,201 Urban fringe/large town 10,029 6,533 65.1 538 11,532 Rural/small town 7,097 4,429 62.4 384 9,125School level Elementary 7,405 5,203 70.3 502 9,375 Secondary 13,059 7,352 56.3 460 13,164 Combined 7,487 4,360 58.2 364 8,337Student enrollment Less than 100 3,742 2,194 58.6 216 5,850 100–199 4,628 2,830 61.2 289 6,595 200–499 6,125 4,106 67.0 395 8,583 500–749 8,970 6,216 69.3 558 10,847 750–999 12,506 8,399 67.2 680 12,886 1,000 or more 19,604 11,409 58.2 759 17,1161 Includes total expenditure for books, video materials, CD-ROMs, current print or microform periodicals, and electronic subscriptions.2 Amount spent for rental or purchase of books.
Table 6a. Average library expenditures and book holdings for public school library media centers, by state and selected characteristics:
NOTE: These estimates are for traditional public schools. Traditional public schools include all public schools in the United States except public charter schools. Library expenditures and collection holdings were based on the 1998–1999 school year. Detail may not sum to totals because of rounding.SOURCE: U.S. Department of Education, National Center for Education Statistics, Schools and Staffing Survey, "Public School Library Media Center Questionnaire," 1999–2000.
29

Table 6b. 1999–2000
Percentage of library Average number of Average number ofAverage library Average book expenditures books acquired of books held at
Selected characteristics expenditures1 expenditures2 spent on books2 during 1998-1999 end of 1998-1999
Total $4,391 $2,660 60.6 327 7,192
Affiliation Catholic 4,084 2,281 55.9 311 7,833 Friends 6,945 3,782 54.5 354 9,352 Episcopal 8,053 4,655 57.8 467 9,928 Hebrew Day 2,865 2,196 76.7 208 5,249 Solomon Schechter 7,715 4,226 54.8 418 8,457 Other Jewish 5,176 3,323 64.2 296 6,543 Lutheran, Missouri Synod 3,074 1,834 59.7 387 5,310 Lutheran, Wisconsin Synod 2,180 1,259 57.7 133 5,106 Evangelical Lutheran 2,345 1,792 76.4 373 8,036 Other Lutheran ‡ ‡ ‡ ‡ ‡ Seventh-Day Adventist 1,624 934 57.5 164 3,905 Christian Schools International 4,291 2,889 67.3 351 9,571 American Association of Christian Schools 3,311 2,478 74.8 349 7,025 Association of Christian Schools International 3,056 1,982 64.9 351 6,138 National Association of Private Schools for Exceptional Children 4,584 2,204 48.1 228 4,732 Montessori 1,528 1,093 71.6 217 4,471 Independent Schools 18,911 11,006 58.2 763 17,302 National Independent Private School Association ‡ ‡ ‡ ‡ ‡ Other 3,794 2,625 69.2 296 5,623
NCES typology Catholic 4,084 2,281 55.9 311 7,833 Parochial 2,820 1,757 62.3 290 6,513 Diocesan 4,146 2,476 59.7 328 9,552 Private 10,603 4,479 42.2 375 9,695
Other religious 3,525 2,376 67.4 314 6,063 Conservative Christian 2,880 1,913 66.4 348 5,916 Affiliated 4,391 3,095 70.5 299 6,749 Unaffiliated 3,212 2,016 62.8 289 5,327
Nonsectarian 6,867 4,083 59.5 390 8,131 Regular 9,989 5,965 59.7 523 11,316 Special emphasis 3,653 2,240 61.3 277 5,269 Special education 3,276 1,779 54.3 202 3,848
All members of National Association of Independent Schools 18,041 9,572 53.1 666 15,855
See footnotes at end of table.
Table 6b. Average library expenditures and book holdings for private school library media centers, by affiliation and selected characteristics:
30

Table 6b. 1999–2000—Continued
Percentage of library Average number of Average number ofAverage library Average book expenditures books acquired of books held at
Selected characteristics expenditures1 expenditures2 spent on books2 during 1998-1999 end of 1998-1999
Region Northeast $4,713 $2,628 55.8 267 7,061 Midwest 3,058 1,859 60.8 287 6,910 South 5,623 3,578 63.6 424 7,465 West 4,031 2,448 60.7 309 7,376
Community type Central city 4,598 2,599 56.5 334 6,555 Urban fringe/large town 4,690 2,998 63.9 344 7,823 Rural/small town 2,946 1,960 66.5 262 7,546
School level Elementary 2,866 1,980 69.1 290 5,971 Secondary 8,982 4,365 48.6 304 10,689 Combined 6,265 3,657 58.4 436 8,775
Student enrollment Less than 100 1,114 669 60.1 170 3,250 100–199 3,135 2,136 68.1 310 5,996 200–499 4,773 2,919 61.1 362 8,217 500–749 10,701 6,350 59.3 600 14,297 750–999 15,651 8,214 52.5 648 16,821 1,000 or more 22,038 11,885 53.9 614 18,960
‡Reporting standards not met. (Too few cases.)1 Includes total expenditure for books, video materials, CD-ROMs, current print or microform periodicals, and electronic subscriptions.2 Amount spent for rental or purchase of books.NOTE: Library expenditures and collection holdings were based on the 1998–1999 school year.
Table 6b. Average library expenditures and book holdings for private school library media centers, by affiliation and selected characteristics:
SOURCE: U.S. Department of Education, National Center for Education Statistics, Schools and Staffing Survey (SASS), "Private School Library Media Center Questionnaire," 1999–2000.
31

Table 1a. 1999–2000
State and Average Averageselected Number Percentage number Average Number Percentage number Averagecharacteristics of schools of schools per school expenditures of schools of schools per school expenditures
50 States and DC 61,203 79.7 46 $336 70,979 92.4 292 $612 Alabama 1,092 84.0 46 250 1,272 97.9 325 702 Alaska 270 73.8 37 325 334 91.3 195 303 Arizona 729 73.6 33 239 950 95.9 328 511 Arkansas 849 78.0 19 208 1,052 96.6 253 544 California 4,244 66.9 26 298 4,945 78.0 227 408
Colorado 1,237 91.3 68 347 1,220 90.0 216 344 Connecticut 795 85.2 62 634 882 94.5 269 689 Delaware 125 91.9 49 198 126 92.4 192 588 District of Columbia 96 69.9 24 155 121 87.9 91 180 Florida 2,276 93.4 108 466 2,422 99.4 662 1,066
Georgia 1,637 95.7 71 640 1,710 100.0 505 1,051 Hawaii 236 95.7 62 328 241 97.8 400 264 Idaho 413 75.8 38 258 521 95.5 195 396 Illinois 2,498 68.7 37 202 3,229 88.8 224 467 Indiana 1,348 77.6 30 273 1,669 96.1 302 800
Iowa 1,219 83.3 50 227 1,124 76.8 103 207 Kansas 1,127 82.0 35 267 1,258 91.6 256 557 Kentucky 1,039 85.0 33 340 1,203 98.4 344 821 Louisiana 1,013 79.8 41 310 1,190 93.8 197 424 Maine 458 73.7 24 185 596 95.9 221 508
Maryland 1,068 87.1 66 411 1,165 95.0 360 640 Massachusetts 1,414 87.8 44 360 1,486 92.3 208 488 Michigan 2,113 71.8 43 293 2,540 86.3 193 483 Minnesota 1,259 84.9 65 329 1,393 93.9 244 747 Mississippi 738 85.9 31 331 844 98.3 288 525
Missouri 1,510 79.2 33 341 1,755 92.1 367 803 Montana 577 77.5 35 228 678 91.0 224 390 Nebraska 885 87.3 46 363 901 88.8 221 331 Nevada 348 82.8 24 270 405 96.5 226 367 New Hampshire 340 78.8 50 523 412 95.4 240 837
New Jersey 1,436 68.9 31 342 1,988 95.3 288 757 New Mexico 432 63.2 79 ! 310 569 83.3 244 398 New York 2,834 75.8 36 356 3,419 91.5 243 595 North Carolina 1,732 92.3 79 659 1,859 99.0 416 759 North Dakota 356 77.4 69 233 418 90.8 224 598See footnotes at end of table.
Table 7a. Number and percentage of public school library media centers with CD-ROMs or video materials, by state and selected characteristics:
Library media centers with CD-ROMs Library media centers with video materials1
32

Table 7a. 1999–2000—Continued
State and Average Averageselected Number Percentage number Average Number Percentage number Averagecharacteristics of schools of schools per school expenditures of schools of schools per school expenditures
Ohio 3,006 83.9 36 $287 3,482 97.2 221 $443 Oklahoma 1,409 79.1 41 375 1,686 94.6 315 490 Oregon 960 85.9 55 208 1,031 92.2 168 305 Pennsylvania 2,361 80.3 32 532 2,730 92.8 240 514 Rhode Island 186 67.0 25 175 263 94.7 185 479
South Carolina 897 86.7 30 256 1,003 97.0 330 480 South Dakota 420 73.5 33 238 506 88.5 233 499 Tennessee 1,250 84.0 149 ! 377 1,474 99.0 552 1,052 Texas 4,605 73.7 39 231 6,074 97.3 357 864 Utah 560 80.8 46 258 656 94.6 484 633 Vermont 287 86.6 36 395 301 90.8 267 479 Virginia 1,461 91.2 58 324 1,523 95.1 371 897 Washington 1,574 85.5 55 278 1,638 89.0 240 463 West Virginia 470 77.1 23 258 573 94.0 201 237 Wisconsin 1,726 88.6 55 605 1,816 93.2 343 1,054 Wyoming 285 82.3 51 317 326 94.3 203 418
Region Northeast 10,112 78.0 37 409 12,077 93.1 245 595 Midwest 17,468 79.0 42 304 20,090 90.8 244 577 South 21,757 83.6 58 356 25,297 97.2 385 773 West 11,866 75.6 41 285 13,515 86.1 242 411Community type Central city 14,009 77.7 53 325 16,348 90.6 261 565 Urban fringe/large town 28,662 82.5 48 376 32,682 94.0 333 698 Rural/small town 18,532 77.2 38 284 21,950 91.4 255 523 School level Elementary 43,737 77.1 48 273 52,372 92.3 253 517 Secondary 15,853 88.3 42 529 16,699 93.0 417 930 Combined 1,613 75.7 35 372 1,908 89.6 271 475Student enrollment Less than 100 2,335 66.0 32 226 2,812 79.4 163 310 100–199 4,564 67.6 31 176 6,236 92.4 171 318 200–499 23,543 77.8 40 247 28,009 92.5 220 420 500–749 16,956 84.4 51 352 18,917 94.1 299 625 750–999 6,661 84.1 44 403 7,329 92.6 361 834 1,000 or more 7,144 86.8 76 735 7,675 93.3 621 1,448
! Interpret with caution. (Estimates are unstable.)1 Video materials include tape, DVD, or laser disc titles.
Table 7a. Number and percentage of public school library media centers with CD-ROMs or video materials, by state and selected characteristics:
NOTE: These estimates are for traditional public schools. Traditional public schools include all public schools in the United States except public charter schools. Library collection holdings were based on the 1998–1999 school year. Detail may not sum to totals because of rounding.SOURCE: U.S. Department of Education, National Center for Education Statistics, Schools and Staffing Survey, "Public School Library Media Center Questionnaire," 1999–2000.
Library media centers with CD-ROMs Library media centers with video materials1
33

Table 7b. 1999–2000
Number Percentage Average Number Percentage AverageSelected characteristics of schools of schools expenditures of schools of schools expenditures
Total 9,442 55.4 $206 14,182 83.2 $337
Affiliation Catholic 4,050 57.1 236 6,251 88.1 332 Friends 40 56.5 186 51 72.3 418 Episcopal 159 50.1 196 283 88.9 615 Hebrew Day 61 41.5 64 106 72.5 112 Solomon Schechter 34 64.0 127 47 87.0 520 Other Jewish 99 40.1 395 173 69.7 350 Lutheran, Missouri Synod 395 50.7 315 613 78.7 316 Lutheran, Wisconsin Synod 66 38.1 188 121 69.5 273 Evangelical Lutheran 34 40.9 134 53 63.5 112 Other Lutheran ‡ ‡ ‡ ‡ ‡ ‡ Seventh-Day Adventist 320 54.3 98 503 85.3 139 Christian Schools International 238 70.7 135 282 83.9 237 American Association of Christian Schools 177 38.2 39 351 75.7 256 Association of Christian Schools International 776 49.5 118 1,380 88.1 350 National Association of Private Schools for Exceptional Children 81 45.8 229 ! 151 85.3 454 Montessori 273 57.6 78 390 82.3 86 Independent Schools 593 84.1 460 643 91.3 1,148 National Independent Private School Association ‡ ‡ ‡ ‡ ‡ ‡ Other 2,017 54.5 176 2,754 74.3 261
NCES typology Catholic 4,050 57.1 236 6,251 88.1 332 Parochial 1,978 48.8 167 3,594 88.7 251 Diocesan 1,469 64.3 266 1,990 87.2 357 Private 603 79.1 508 668 87.5 684
Other religious 2,966 44.1 143 5,112 76.0 302 Conservative Christian 1,187 48.7 101 2,008 82.4 338 Affiliated 1,125 45.5 161 1,869 75.6 246 Unaffiliated 655 36.1 175 1,235 68.1 329
Nonsectarian 2,427 75.0 272 2,819 87.2 423 Regular 1,367 81.5 316 1,488 88.7 593 Special emphasis 630 67.7 88 779 83.7 168 Special education 430 68.8 431 552 88.2 346
All members of National Association of Independent Schools 677 84.3 445 744 92.6 1,030
See footnotes at end of table.
Table 7b. Number and percentage of private school library media centers with CD-ROMs or video materials, by affiliation and selected characteristics:
Library media centers with CD-ROMs Library media centers with video materials1
34
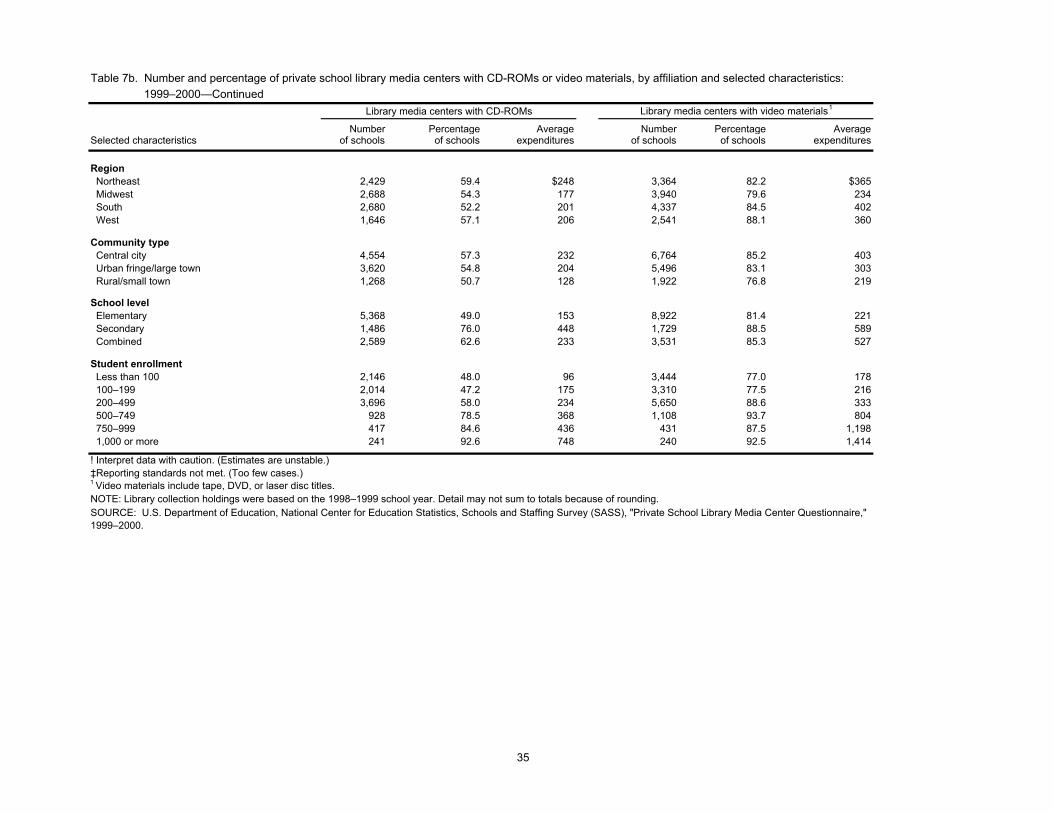
Table 7b. 1999–2000—Continued
Number Percentage Average Number Percentage AverageSelected characteristics of schools of schools expenditures of schools of schools expenditures
Region Northeast 2,429 59.4 $248 3,364 82.2 $365 Midwest 2,688 54.3 177 3,940 79.6 234 South 2,680 52.2 201 4,337 84.5 402 West 1,646 57.1 206 2,541 88.1 360
Community type Central city 4,554 57.3 232 6,764 85.2 403 Urban fringe/large town 3,620 54.8 204 5,496 83.1 303 Rural/small town 1,268 50.7 128 1,922 76.8 219
School level Elementary 5,368 49.0 153 8,922 81.4 221 Secondary 1,486 76.0 448 1,729 88.5 589 Combined 2,589 62.6 233 3,531 85.3 527
Student enrollment Less than 100 2,146 48.0 96 3,444 77.0 178 100–199 2,014 47.2 175 3,310 77.5 216 200–499 3,696 58.0 234 5,650 88.6 333 500–749 928 78.5 368 1,108 93.7 804 750–999 417 84.6 436 431 87.5 1,198 1,000 or more 241 92.6 748 240 92.5 1,414
! Interpret data with caution. (Estimates are unstable.)‡Reporting standards not met. (Too few cases.)1 Video materials include tape, DVD, or laser disc titles.NOTE: Library collection holdings were based on the 1998–1999 school year. Detail may not sum to totals because of rounding.SOURCE: U.S. Department of Education, National Center for Education Statistics, Schools and Staffing Survey (SASS), "Private School Library Media Center Questionnaire," 1999–2000.
Library media centers with CD-ROMs Library media centers with video materials1
Table 7b. Number and percentage of private school library media centers with CD-ROMs or video materials, by affiliation and selected characteristics:
35

36

37
Section IV: Library Media Center Policies This section presents data on traditional public school and private school library media centers from the 1999–2000 Schools and Staffing Survey (SASS). These tables report on library policies, such as frequency of regularly scheduled class visits, times when students can use the library independently, average number of books checked out per school, and borrowing privileges for parents and preschool siblings. Library media centers may practice different methods of scheduling class visits. Fixed scheduling consists of regularly scheduled class visits, usually on a weekly visit. Flexible scheduling allows teachers to bring their classes to the library media center when there is a need for library resources. Other school libraries adopt a combination approach to scheduling in which some classes or grades follow a fixed schedule and others visit the library whenever the need arises. The percentage of private schools with library media centers offering flexible scheduling increased from 27 percent in 1993–94 to 34 percent in 1999–2000 (table 8b). No such difference was detected for public schools where 30 percent in 1993–94 and 32 percent in 1999–2000 maintained a flexible schedule for class visits to the library (table 8a). Public schools tended to provide greater access than private schools to the library media center for students’ independent use before or after school. Fifty percent of public school library media centers scheduled times before or after school when students could use the library independently in 1999–2000 (table 9a). Thirty-six percent of private schools had set times before or after school when students could use the library independently (table 9b). The average number of books and other library materials checked out from the library media center during the most recent full week is a measure of library use. Among public schools, those with fewer than 100 students averaged 192 books and other library materials checked out—the lowest average weekly circulation. Public schools with an enrollment between 500 and 749 had the largest average number of library materials checked out during the most recent full week (815) (table 10a). Private schools with fewer than 100 students also had the smallest average number of library materials checked out (51) and the highest average weekly circulation (447) belonged to private schools with enrollments between 750 and 999 students (table 10b).

State and Percentage of library Percentage of library Percentage of libraryselected media centers having media centers having media centers having Percentage Percentage once every Percentage varies bycharacteristics flexible schedule fixed schedule combination scheduling weekly 2 weeks grade level
50 States and DC 31.8 42.8 25.5 76.7 7.6 15.6
Alabama 27.1 29.7 43.2 72.0 12.5 15.6 Alaska 33.3 38.3 28.4 71.4 4.3 24.3 Arizona 31.6 41.1 27.3 75.4 5.7 18.9 Arkansas 30.1 44.3 25.6 74.5 2.6 ! 22.9 California 24.5 60.3 15.2 85.7 4.3 10.0
Colorado 33.2 31.8 34.9 65.2 10.4 24.4 Connecticut 34.3 43.4 22.3 85.2 # 14.8 Delaware 32.2 43.7 24.2 72.2 9.1 18.7 District of Columbia 28.9 56.3 14.8 86.2 ‡ 9.3 Florida 40.7 33.4 25.9 70.6 22.3 7.0
Georgia 59.6 27.5 12.9 74.6 6.6 18.8 Hawaii 21.3 52.5 26.1 56.9 27.3 15.8 Idaho 35.0 45.2 19.8 76.6 6.0 17.5 Illinois 35.0 44.0 21.0 68.4 2.0 ! 29.6 Indiana 25.7 55.3 19.0 76.0 13.8 10.3
Iowa 42.1 29.5 28.4 77.3 2.6 20.1 Kansas 40.3 43.1 16.6 87.0 4.4 8.6 Kentucky 23.1 53.1 23.8 81.3 10.7 8.0 Louisiana 30.8 43.5 25.7 79.9 12.2 7.9 Maine 23.1 53.9 23.0 82.9 3.3 13.8
Maryland 31.3 55.0 13.7 71.7 16.1 12.2 Massachusetts 36.9 35.9 27.2 72.9 8.0 19.1 Michigan 30.6 46.3 23.1 75.1 8.0 16.9 Minnesota 32.6 33.4 34.0 60.3 6.8 32.9 Mississippi 31.8 50.9 17.3 80.3 6.8 12.9
Missouri 27.1 29.2 43.7 80.5 3.3 16.1 Montana 31.9 39.5 28.6 75.6 7.5 16.9 Nebraska 34.5 30.3 35.2 84.0 ‡ 14.3 Nevada 24.5 60.2 15.3 87.0 6.7 6.3 New Hampshire 30.6 45.4 23.9 85.6 4.6 9.7
New Jersey 22.0 56.0 22.1 75.7 9.3 15.0 New Mexico 29.5 38.9 31.6 72.2 5.3 22.4 New York 36.5 43.8 19.8 79.0 4.0 ! 17.0 North Carolina 37.5 37.5 25.0 75.5 18.6 5.9 North Dakota 25.4 29.0 45.6 79.1 # 20.9
See footnotes at end of table.
Table 8a. Percentage distribution of types of library schedules and frequency of regularly scheduled class visits by public school library media centers, by state and
Percentage distribution by type of scheduling Frequency of regularly scheduled class visits1
Table 8a. selected characteristics: 1999–2000
38

Table 8a. selected characteristics: 1999–2000—Continued
State and Percentage of library Percentage of library Percentage of libraryselected media centers having media centers having media centers having Percentage Percentage once every Percentage varies by characteristics flexible schedule fixed schedule combination scheduling weekly 2 weeks grade level
Ohio 27.7 50.6 21.7 86.9 5.2 7.9 Oklahoma 39.2 25.0 35.8 63.4 11.1 25.5 Oregon 29.9 46.5 23.6 74.2 6.0 ! 19.8 Pennsylvania 27.5 41.0 31.5 79.3 5.4 15.4 Rhode Island 24.8 62.4 12.8 92.1 6.3 ‡ South Carolina 38.7 32.9 28.5 70.6 15.0 14.4 South Dakota 34.5 31.4 34.2 75.5 ‡ 23.1 Tennessee 25.8 51.8 22.4 72.3 13.7 14.0 Texas 34.5 32.2 33.3 68.5 12.3 19.2 Utah 34.1 49.3 16.7 83.7 # 16.3 Vermont 32.8 33.0 34.2 81.1 9.8 9.1 Virginia 31.2 44.9 23.9 82.7 7.7 9.7 Washington 23.8 51.2 25.0 78.7 6.2 15.1 West Virginia 33.8 51.4 14.8 80.0 ‡ 17.1 Wisconsin 25.3 38.2 36.5 81.5 ‡ 17.1 Wyoming 29.7 43.7 26.6 70.4 12.4 17.2Region Northeast 30.8 44.8 24.4 79.0 5.6 15.4 Midwest 31.4 41.5 27.1 77.5 4.8 17.6 South 35.1 38.1 26.8 73.1 12.4 14.6 West 27.6 50.6 21.7 79.3 5.9 14.8
Community type Central city 31.5 44.6 23.9 77.9 7.5 14.7 Urban fringe/large town 30.1 45.9 24.0 76.9 8.1 15.0 Rural/small town 34.4 36.9 28.8 75.6 7.1 17.3
School level Elementary 21.6 50.9 27.5 81.7 6.3 12.0 Secondary 62.9 20.4 16.7 46.3 16.9 36.8 Combined 41.7 14.7 43.7 62.2 4.9 32.9Student enrollment Less than 100 38.5 27.4 34.0 74.1 3.1 22.9 100–199 30.6 37.6 31.8 77.7 2.2 20.1 200–499 24.9 48.9 26.1 84.3 3.9 11.8 500–749 26.6 46.8 26.6 74.8 9.1 16.2 750–999 39.0 36.4 24.6 66.9 17.6 15.5 1,000 or more 60.7 27.2 12.1 47.6 23.2 29.2
# Rounds to zero.! Interpret data with caution. (Estimates are unstable.)‡Reporting standards not met. (Too few cases.)1 For library media centers with regular and combined schedules.
Table 8a. Percentage distribution of types of library schedules and frequency of regulary scheduled class visits by public school library media centers, by state and
Percentage distribution by type of scheduling Frequency of regularly scheduled class visits1
NOTE: These estimates are for traditional public schools. Traditional public schools include all public schools in the United States except public charter schools. Detail may not sum to totals because of rounding.SOURCE: U.S. Department of Education, National Center for Education Statistics, Schools and Staffing Survey, "Public School Library Media Center Questionnaire," 1999–2000.
39

Table 8b. selected characteristics: 1999–2000
Percentage of library Percentage of library Percentage of librarymedia centers having media centers having media centers having Percentage Percentage once every Percentage varies by
Selected characteristics flexible schedule fixed schedule combination scheduling weekly 2 weeks grade level
Total 33.8 40.2 26.0 81.1 1.5 17.4
Affiliation Catholic 22.7 51.7 25.6 84.9 2.3 12.9 Friends 47.1 18.4 34.5 60.9 # 39.1 Episcopal 19.8 42.5 37.7 83.8 # 16.2 Hebrew Day 19.2 52.3 28.5 57.3 12.3 30.4 Solomon Schechter 17.5 24.9 57.6 60.0 5.3 34.7 Other Jewish 41.1 17.3 41.6 65.6 2.5 32.0 Lutheran, Missouri Synod 30.0 52.1 17.8 82.3 # 17.7 Lutheran, Wisconsin Synod 43.9 24.8 31.3 78.5 # 21.5 Evangelical Lutheran 16.9 57.6 25.5 84.8 ‡ 13.5 Other Lutheran ‡ ‡ ‡ ‡ ‡ ‡ Seventh-Day Adventist 56.0 31.5 12.5 83.6 # 16.4 Christian Schools International 17.2 35.3 47.5 79.0 # 21.0 American Association of Christian Schools 27.0 30.2 42.8 65.3 ‡ 30.7 Association of Christian Schools International 30.7 35.0 34.2 79.3 # 20.7 National Association of Private Schools for Exceptional Children 27.8 53.6 18.5 ! 41.9 ! ‡ 54.9 Montessori 79.3 10.7 10.0 79.4 # 20.6 Independent Schools 35.1 19.1 45.8 65.8 ‡ 33.3 National Independent Private School Association ‡ ‡ ‡ ‡ ‡ ‡ Other 51.2 29.6 19.1 83.1 # 16.9
NCES typology Catholic 22.7 51.7 25.6 84.9 2.3 12.9 Parochial 15.4 59.1 25.6 89.2 2.0 8.8 Diocesan 24.6 49.2 26.3 81.8 1.4 ! 16.7 Private 55.8 20.5 23.8 56.7 ‡ 34.1
Other religious 36.4 36.2 27.4 79.4 0.8 19.8 Conservative Christian 35.4 32.0 32.6 77.0 ‡ 22.1 Affiliated 36.6 37.3 26.2 79.6 1.2 19.3 Unaffiliated 37.5 40.3 22.1 82.5 ‡ 17.2
Nonsectarian 52.6 23.3 24.1 72.5 0.5 27.0 Regular 46.9 20.7 32.4 70.6 ‡ 28.9 Special emphasis 66.5 16.8 16.6 77.6 ‡ 21.9 Special education 47.3 39.8 12.9 72.7 ‡ 26.6
All members of National Association of Independent Schools 36.8 17.9 45.2 69.5 ‡ 29.7
See footnotes at end of table.
Table 8b. Percentage distribution of types of library schedules and frequency of regularly scheduled class visits by private school library media centers, by affiliation and
Type of scheduling Frequency of regularly scheduled class visits1
40

Table 8b. selected characteristics: 1999–2000—Continued
Percentage of library Percentage of library Percentage of librarymedia centers having media centers having media centers having Percentage Percentage once every Percentage varies by
Selected characteristics flexible schedule fixed schedule combination scheduling weekly 2 weeks grade level
Region Northeast 38.0 44.0 18.0 84.6 1.7 13.7 Midwest 30.1 44.0 25.9 77.4 1.1 ! 21.5 South 32.2 33.7 34.2 80.6 1.2 18.2 West 36.9 40.1 23.0 84.4 2.4 ! 13.2
Community type Central city 34.1 38.3 27.7 79.1 1.7 19.1 Urban fringe/large town 32.4 43.8 23.8 84.4 0.9 14.7 Rural/small town 36.4 36.9 26.8 78.5 2.4 ! 19.1
School level Elementary 24.8 50.8 24.4 86.6 1.4 11.9 Secondary 68.0 21.6 10.4 41.4 ‡ 57.4 Combined 41.3 21.0 37.7 72.7 1.7 25.6
Student enrollment Less than 100 53.6 32.9 13.5 81.6 ‡ 18.0 100–199 28.0 42.3 29.7 82.4 1.2 ! 16.4 200–499 23.0 46.3 30.7 83.1 1.3 15.6 500–749 26.4 39.1 34.5 74.5 2.3 23.2 750–999 47.0 23.3 29.7 63.9 8.3 27.8 1,000 or more 59.3 20.9 19.7 39.8 12.6 47.6
# Rounds to zero.! Interpret data with caution. (Estimates are unstable.)‡Reporting standards not met. (Too few cases.)1 For library media centers with regular and combined schedules.
Type of scheduling Frequency of regularly scheduled class visits1
SOURCE: U.S. Department of Education, National Center for Education Statistics, Schools and Staffing Survey (SASS), "Private School Library Media Center Questionnaire," 1999–2000.
Table 8b. Percentage distribution of types of library schedules and frequency of regularly scheduled class visits by private school library media centers, by affiliation and
41

Number of libraries Percentage of librariesState and with set times when with set times when when students can use the library independently1
selected students can use the students can use the Before or During During set times Between classescharacteristics library Independently library Independently after school lunch break throughout the day or during recess
50 States and DC 28,292 36.8 49.9 33.6 80.3 33.5 Alabama 341 26.2 43.4 18.2 85.7 35.4 Alaska 164 44.8 71.3 49.5 73.1 40.8 Arizona 354 35.7 54.8 46.6 67.7 42.0 Arkansas 505 46.4 46.5 30.3 79.4 41.8 California 3,472 54.8 46.3 48.6 70.1 37.2
Colorado 404 29.8 58.5 56.5 85.7 34.7 Connecticut 207 22.2 27.8 27.3 76.1 21.2 Delaware 44 32.0 62.2 ‡ 68.3 29.3 District of Columbia 74 53.7 25.1 28.4 74.8 17.6 Florida 609 25.0 57.4 23.9 85.0 20.2
Georgia 111 6.5 100.0 37.8 30.6 35.2 Hawaii 113 45.7 62.5 50.7 75.6 83.4 Idaho 172 31.6 66.0 47.8 74.8 49.7 Illinois 1,535 42.2 39.2 27.8 87.1 29.9 Indiana 589 33.9 48.2 32.1 79.9 37.4
Iowa 302 20.6 68.0 28.7 77.1 58.3 Kansas 490 35.7 47.2 19.3 80.1 49.5 Kentucky 413 33.8 42.5 11.9 81.2 29.6 Louisiana 572 45.1 56.1 38.0 80.4 44.3 Maine 185 29.8 30.1 17.9 84.9 19.1
Maryland 451 36.8 81.4 61.8 77.3 50.0 Massachusetts 678 42.1 44.9 24.7 79.6 18.2 Michigan 827 28.1 42.6 34.9 89.6 33.9 Minnesota 493 33.2 65.5 39.9 88.1 30.7 Mississippi 390 45.4 44.8 23.0 79.8 40.9
Missouri 470 24.7 51.8 19.1 89.0 34.8 Montana 255 34.2 57.6 37.1 84.6 48.7 Nebraska 307 30.3 38.7 16.6 86.6 24.0 Nevada 249 59.2 63.5 48.7 69.0 48.3 New Hampshire 134 31.1 26.5 14.9 74.6 45.4
New Jersey 1,032 49.5 52.8 37.1 84.2 22.2 New Mexico 299 43.8 37.4 21.5 85.4 41.5 New York 1,612 43.1 40.8 27.6 87.4 17.5 North Carolina 669 35.6 59.4 16.4 75.2 19.0 North Dakota 204 44.2 61.8 27.2 94.1 19.9
See footnotes at end of table.
Table 9a. Number and percentage of public school library media centers with scheduled times that students can use the library independently, by state
Percentage of school libraries offering set times
Table 1a. and selected characteristics: 1999–2000
42

Number of libraries Percentage of librariesState and with set times when with set times when when students can use the library independently1
selected students can use the students can use the Before or During During set times Between classescharacteristics library Independently library Independently after school lunch break throughout the day or during recess
Ohio 1,722 48.0 21.8 25.8 92.7 18.4 Oklahoma 374 21.0 38.3 34.4 87.6 43.6 Oregon 418 37.4 52.0 49.2 68.8 42.6 Pennsylvania 1,207 41.0 54.4 33.6 74.3 34.7 Rhode Island 148 53.5 33.3 26.1 90.8 38.2
South Carolina 297 28.8 74.9 46.5 85.7 62.3 South Dakota 173 30.3 41.1 12.2 95.5 28.4 Tennessee 705 47.3 42.8 10.7 74.7 21.9 Texas 2,193 35.1 60.8 36.5 84.3 32.2 Utah 263 37.9 67.5 36.8 57.9 48.3
Vermont 88 26.6 42.6 32.9 98.2 37.8 Virginia 548 34.2 75.6 20.9 65.2 36.5 Washington 631 34.3 77.8 69.8 58.6 74.0 West Virginia 225 36.9 45.4 24.7 80.7 15.6 Wisconsin 491 25.2 53.4 30.3 91.4 34.3 Wyoming 84 24.4 43.1 22.8 86.2 38.2
Region Northeast 5,291 40.8 45.3 29.8 82.2 24.2 Midwest 7,603 34.4 42.0 27.5 88.1 30.8 South 8,521 32.7 56.8 29.1 79.6 33.5 West 6,877 43.8 53.4 48.6 71.0 43.6
Community type Central city 7,485 41.5 48.3 32.8 79.1 28.4 Urban fringe/large town 12,742 36.7 52.0 35.6 77.7 35.0 Rural/small town 8,065 33.6 47.9 31.0 85.3 35.8 School level Elementary 23,367 41.2 44.0 27.4 82.1 28.9 Secondary 4,324 24.1 81.9 66.5 70.6 56.7 Combined 601 28.2 46.5 38.0 77.1 45.2
Student enrollment Less than 100 1,280 36.1 39.8 24.1 91.4 25.8 100–199 2,841 42.1 24.1 21.4 94.3 23.5 200–499 11,898 39.3 46.6 29.1 81.9 33.2 500–749 7,553 37.6 55.7 33.7 78.6 33.8 750–999 2,489 31.4 57.4 40.9 72.7 32.8 1,000 or more 2,231 27.1 78.0 69.8 61.1 52.1
‡Reporting standards not met. (Too few cases.)
Table 9a. Number and percentage of public school library media centers with scheduled times that students can use the library independently, by state
1Based on library media centers with scheduled times that students can use the library independently. School library may offer more than one scheduled period or set time.SOURCE: U.S. Department of Education, National Center for Education Statistics, Schools and Staffing Survey, "Public School Library Media Center Questionnaire," 1999–2000.
Table 1a. and selected characteristics: 1999–2000—Continued
Percentage of school libraries offering set times
43
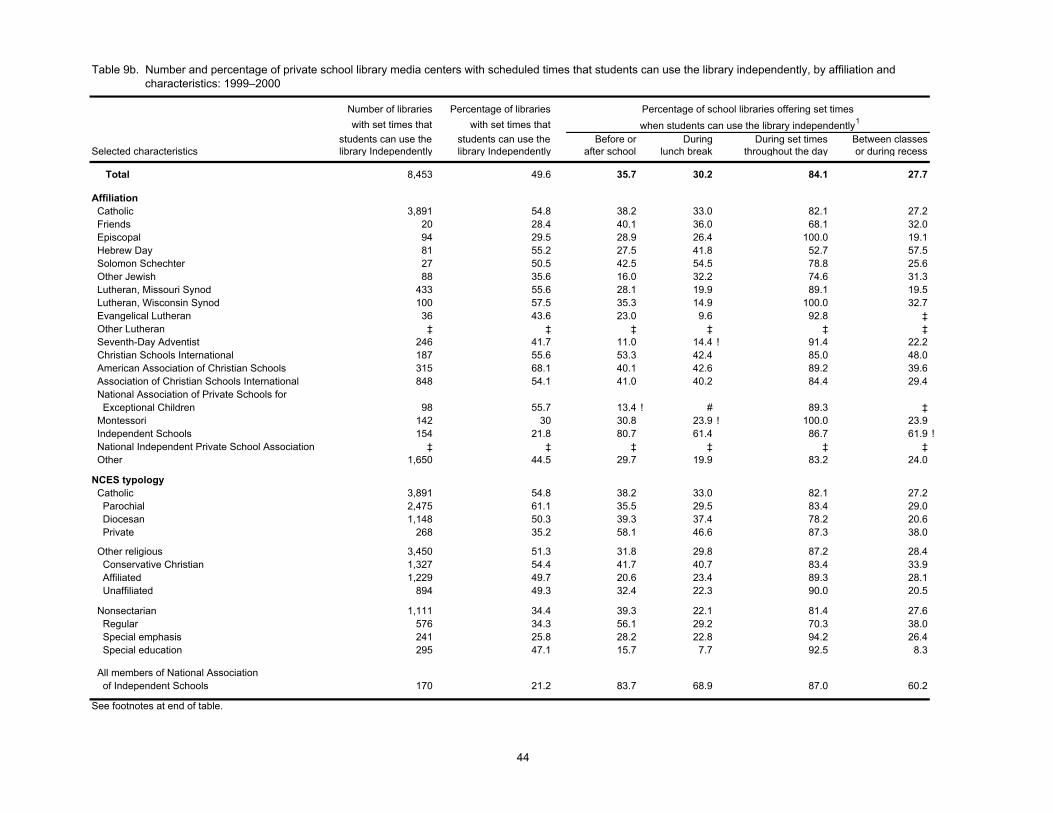
Table 9b. characteristics: 1999–2000
Number of libraries Percentage of libraries with set times that with set times that when students can use the library independently1
students can use the students can use the Before or During During set times Between classesSelected characteristics library Independently library Independently after school lunch break throughout the day or during recess
Total 8,453 49.6 35.7 30.2 84.1 27.7
Affiliation Catholic 3,891 54.8 38.2 33.0 82.1 27.2 Friends 20 28.4 40.1 36.0 68.1 32.0 Episcopal 94 29.5 28.9 26.4 100.0 19.1 Hebrew Day 81 55.2 27.5 41.8 52.7 57.5 Solomon Schechter 27 50.5 42.5 54.5 78.8 25.6 Other Jewish 88 35.6 16.0 32.2 74.6 31.3 Lutheran, Missouri Synod 433 55.6 28.1 19.9 89.1 19.5 Lutheran, Wisconsin Synod 100 57.5 35.3 14.9 100.0 32.7 Evangelical Lutheran 36 43.6 23.0 9.6 92.8 ‡ Other Lutheran ‡ ‡ ‡ ‡ ‡ ‡ Seventh-Day Adventist 246 41.7 11.0 14.4 ! 91.4 22.2 Christian Schools International 187 55.6 53.3 42.4 85.0 48.0 American Association of Christian Schools 315 68.1 40.1 42.6 89.2 39.6 Association of Christian Schools International 848 54.1 41.0 40.2 84.4 29.4 National Association of Private Schools for Exceptional Children 98 55.7 13.4 ! # 89.3 ‡ Montessori 142 30 30.8 23.9 ! 100.0 23.9 Independent Schools 154 21.8 80.7 61.4 86.7 61.9 ! National Independent Private School Association ‡ ‡ ‡ ‡ ‡ ‡ Other 1,650 44.5 29.7 19.9 83.2 24.0
NCES typology Catholic 3,891 54.8 38.2 33.0 82.1 27.2 Parochial 2,475 61.1 35.5 29.5 83.4 29.0 Diocesan 1,148 50.3 39.3 37.4 78.2 20.6 Private 268 35.2 58.1 46.6 87.3 38.0 Other religious 3,450 51.3 31.8 29.8 87.2 28.4 Conservative Christian 1,327 54.4 41.7 40.7 83.4 33.9 Affiliated 1,229 49.7 20.6 23.4 89.3 28.1 Unaffiliated 894 49.3 32.4 22.3 90.0 20.5
Nonsectarian 1,111 34.4 39.3 22.1 81.4 27.6 Regular 576 34.3 56.1 29.2 70.3 38.0 Special emphasis 241 25.8 28.2 22.8 94.2 26.4 Special education 295 47.1 15.7 7.7 92.5 8.3
All members of National Association of Independent Schools 170 21.2 83.7 68.9 87.0 60.2
See footnotes at end of table.
Table 9b. Number and percentage of private school library media centers with scheduled times that students can use the library independently, by affiliation and
Percentage of school libraries offering set times
44

Number of libraries Percentage of libraries with set times that with set times that when students can use the library independently1
students can use the students can use the Before or During During set times Between classesSelected characteristics library Independently library Independently after school lunch break throughout the day or during recess
Region Northeast 2,173 53.1 30.5 36.4 80.7 23.2 Midwest 2,325 47.0 30.7 21.8 87.2 25.4 South 2,520 49.1 43.7 33.8 86.6 32.5 West 1,435 49.8 37.8 28.3 79.9 29.8
Community type Central city 3,936 49.6 40.3 28.9 81.7 28.9 Urban fringe/large town 3,353 50.7 33.9 35.2 83.9 27.4 Rural/small town 1,164 46.5 25.4 20.4 93.0 24.6
School level Elementary 6,051 55.2 31.5 26.0 82.6 24.7 Secondary 626 32.0 69.9 62.7 78.4 48.5 Combined 1,776 42.9 38.1 33.1 91.1 30.7
Student enrollment Less than 100 1,854 41.4 19.7 19.1 89.6 22.8 100–199 2,401 56.2 25.3 18.3 86.8 17.8 200–499 3,438 53.9 45.9 37.4 81.5 32.8 500–749 493 41.7 63.1 65.2 69.0 49.6 750–999 184 37.4 48.7 49.7 86.2 44.6 1,000 or more 83 28.0 84.0 78.6 79.8 44.5
# Rounds to zero.! Interpret data with caution. (Estimates are unstable.)‡Reporting standards not met. (Too few cases.)1 Based on Library Media Centers with scheduled times that students can use the library independently. School LMC may indicate more than one scheduled period or set time.SOURCE: U.S. Department of Education, National Center for Education Statistics, Schools and Staffing Survey (SASS), "Private School Library Media Center Questionnaire," 1999–2000.
Percentage of school libraries offering set times
Table 9b. Number and percentage of private school library media centers with scheduled times that students can use the library independently, by affiliation and Table 9b. characteristics: 1999–2000—Continued
45

Table 10a. percentage of public school libraries with borrowing privileges for prekindergartners, kindergartners, and parents,Table 10a. by state and selected characteristics: 1999–2000
State and Average numberselected of library materialscharacteristics checked out per school1 Prekindergartners Kindergartners Parents
50 States and DC 605 13.5 52.0 80.5 Alabama 684 6.6 47.4 87.2 Alaska 425 35.3 72.0 92.7 Arizona 836 15.6 59.2 79.0 Arkansas 466 6.3 50.4 89.8 California 718 5.3 50.9 70.5
Colorado 496 14.3 58.9 90.2 Connecticut 494 14.8 56.7 90.3 Delaware 470 6.5 19.8 89.0 District of Columbia 164 18.9 38.3 80.5 Florida 913 19.2 61.8 85.4
Georgia 885 23.3 53.7 88.0 Hawaii 894 33.4 68.4 54.0 Idaho 862 9.0 45.9 87.2 Illinois 471 11.0 46.8 72.1 Indiana 598 10.6 54.1 74.6
Iowa 471 27.5 60.8 75.9 Kansas 594 23.0 63.0 92.9 Kentucky 612 11.7 59.0 83.8 Louisiana 411 9.5 34.3 87.9 Maine 311 9.5 61.4 87.5
Maryland 876 22.2 50.9 79.2 Massachusetts 360 5.5 39.5 79.7 Michigan 484 11.9 47.3 75.8 Minnesota 680 13.3 57.7 70.9 Mississippi 584 4.1 21.6 78.9
Missouri 466 22.2 59.3 81.1 Montana 315 25.9 67.6 92.6 Nebraska 428 13.8 70.2 84.6 Nevada 640 13.1 48.3 79.3 New Hampshire 416 9.0 48.3 85.8
New Jersey 451 8.9 52.8 72.8 New Mexico 571 16.4 54.7 88.9 New York 476 13.9 52.0 79.6 North Carolina 754 14.6 53.8 82.7 North Dakota 347 20.7 71.4 90.0
See footnotes at end of table.
Table 10a. Average number of public school library books and other materials checked out during the most recent full week and
Percentage of school libraries with borrowing privileges
46

Table 10a. percentage of public school libraries with borrowing privileges for prekindergartners, kindergartners, and parentsTable 10a. by state and selected characteristics: 1999–2000—Continued
State and Average numberselected of library materialscharacteristics checked out per school1 Prekindergartners Kindergartners Parents
Ohio 450 5.1 40.7 66.5 Oklahoma 401 20.1 47.0 88.7 Oregon 724 9.0 63.4 89.2 Pennsylvania 559 3.3 50.1 70.6 Rhode Island 362 3.4 30.0 67.7
South Carolina 649 18.0 37.5 88.1 South Dakota 294 23.8 61.0 90.6 Tennessee 882 5.3 43.5 88.0 Texas 837 15.0 47.5 82.8 Utah 758 5.8 46.4 73.7
Vermont 307 25.4 62.4 95.9 Virginia 731 29.4 64.3 92.4 Washington 703 14.8 61.0 86.1 West Virginia 306 15.9 42.5 81.3 Wisconsin 634 26.4 64.0 87.7 Wyoming 341 8.6 61.9 90.3
Region Northeast 461 9.4 50.6 78.0 Midwest 506 15.1 53.7 76.9 South 721 15.5 49.1 85.4 West 672 11.1 55.7 79.4
Community type Central city 609 14.1 56.6 80.8 Urban fringe/large town 694 11.1 50.0 78.6 Rural/small town 474 16.5 51.4 83.0 School level Elementary 726 15.6 65.1 82.1 Secondary 264 6.4 11.6 76.0 Combined 244 16.4 45.5 76.1
Student enrollment Less than 100 192 22.5 67.6 83.0 100–199 281 21.9 64.5 79.7 200–499 558 14.1 61.7 82.8 500–749 815 13.2 52.6 81.2 750–999 773 9.1 37.7 78.5 1,000 or more 548 5.3 11.7 71.71 Pertains to the total number of books and other materials checked out from the library media center during the most recent full week of school.
Table 10a. Average number of public school library books and other materials checked out during the most recent full week and
Percentages of school libraries with borrowing privileges
NOTE: These estimates are for traditional public schools. Traditional public schools include all public schools in the United States except public charter schools.SOURCE: U.S. Department of Education, National Center for Education Statistics, Schools and Staffing Survey, "Public School Library Media Center Questionnaire," 1999–2000.
47

Table 10b. school libraries with borrowing privileges for prekindergartners, kindergartners, and parents, by affiliation and selected characteristics: 1999–2000
Average numberof library materials
Selected characteristics checked out per school1 Prekindergartners Kindergartners Parents
Total 224 23.5 61.3 74.7
Affiliation Catholic 265 12.9 60.8 71.2 Friends 166 30.9 77.9 93.3 Episcopal 268 31.9 61.9 74.2 Hebrew Day 148 9.3 50.9 51.7 Solomon Schechter 328 14.6 85.6 84.9 Other Jewish 206 16.8 42.8 70.7 Lutheran, Missouri Synod 296 36.5 77.9 86.1 Lutheran, Wisconsin Synod 96 41.9 83.9 98.9 Evangelical Lutheran 208 40.5 80.9 76.0 Other Lutheran ‡ ‡ ‡ ‡ Seventh-Day Adventist 57 32.8 63.3 85.7 Christian Schools International 674 32.0 77.2 86.4 American Association of Christian Schools 117 26.2 57.1 79.0 Association of Christian Schools International 212 22.2 69.8 85.1 National Association of Private Schools for Exceptional Children 87 19.3 59.8 64.7 Montessori 81 57.0 74.4 77.4 Independent Schools 258 33.2 58.0 88.7 National Independent Private School Association ‡ ‡ ‡ ‡ Other 160 32.1 52.1 68.0
NCES typology Catholic 265 12.9 60.8 71.2 Parochial 300 17.0 69.8 72.4 Diocesan 248 6.8 58.4 70.8 Private 131 9.0 20.4 66.1
Other religious 214 27.7 63.8 76.8 Conservative Christian 174 20.3 62.8 81.6 Affiliated 219 38.0 67.9 74.3 Unaffiliated 262 23.6 59.6 73.5
Nonsectarian 152 38.0 57.2 77.9 Regular 175 41.6 62.2 87.1 Special emphasis 174 45.8 61.9 77.0 Special education 57 16.8 36.8 54.6
All members of National Association of Independent Schools 244 28.5 52.6 85.1
See footnotes at end of table.
Table 10b. Average number of private school library books and other materials checked out during the most recent full week and percentage of private
Percentage of school libraries with borrowing privileges
48

Table 10b. school libraries with borrowing privileges for prekindergartners, kindergartners, and parents, by affiliation and selected characteristics:
Average numberof library materials
Selected characteristics checked out per school1 Prekindergartners Kindergartners Parents
Region Northeast 178 21.0 57.7 64.7 Midwest 226 25.0 67.1 77.3 South 267 29.9 61.3 79.6 West 208 12.9 56.5 75.7
Community type Central city 235 22.5 58.4 73.9 Urban fringe/large town 241 24.6 65.1 73.6 Rural/small town 141 23.4 60.4 80.0
School level Elementary 262 27.7 73.7 74.7 Secondary 89 0.7 2.4 67.0 Combined 185 23.1 56.4 78.3
Student enrollment Less than 100 51 29.2 56.9 71.2 100–199 193 28.3 69.0 77.4 200–499 305 19.5 64.9 73.6 500–749 421 11.9 48.2 82.8 750–999 447 14.3 39.6 76.2 1,000 or more 374 12.3 22.9 75.8
‡Reporting standard not met. (Too few cases.)1 Pertains to the total number of books and other materials checked out from the library media center during the most recent full week of school.
Table 10b. Average number of private school library books and other materials checked out during the most recent full week and percentage of private
SOURCE: U.S. Department of Education, National Center for Education Statistics, Schools and Staffing Survey (SASS), "Private School Library Media Center Questionnaire," 1999–2000.
Percentages of school libraries with borrowing privileges
Table 10b. 1999–2000—Continued
49

50

51
Appendix A
Standard Error Tables

Table A1a. centers, by state and selected characteristics: 1999–2000
State and Percentage of publicselected Number of public Number of public schools with schools withcharacteristics schools library media centers library media centers
50 States and DC 261.6 419.7 0.40 Alabama 15.0 15.4 0.58 Alaska 7.9 16.8 3.21 Arizona 23.2 70.6 5.91 Arkansas 0.8 8.0 0.70 California 106.1 216.1 2.58
Colorado 10.0 25.5 1.57 Connecticut 5.3 16.5 1.72 Delaware 8.7 9.0 2.94 District of Columbia 2.3 4.3 3.08 Florida 36.9 44.5 1.25
Georgia 30.8 33.7 1.04 Hawaii 1.7 1.7 0.00 Idaho 5.5 11.2 1.64 Illinois 46.5 92.2 2.14 Indiana 31.1 31.8 0.66
Iowa 20.8 22.0 0.81 Kansas 19.3 26.1 1.43 Kentucky 31.9 36.0 1.66 Louisiana 23.2 63.7 3.91 Maine 5.2 17.4 2.29
Maryland 3.7 18.4 1.42 Massachusetts 30.8 46.0 2.11 Michigan 66.8 121.4 3.07 Minnesota 125.3 118.3 2.59 Mississippi 6.5 16.1 1.59
Missouri 70.2 72.7 1.14 Montana 5.6 23.2 2.69 Nebraska 31.9 52.8 4.36 Nevada 7.1 9.9 1.67 New Hampshire 4.6 13.0 2.79
New Jersey 12.2 38.2 1.67 New Mexico 6.4 14.1 1.71 New York 18.1 82.4 2.02 North Carolina 26.7 52.2 2.28 North Dakota 7.2 18.0 3.03
See footnotes at end of table.
Table A1a. Standard errors for number of public schools and number and percentage of public schools with library media
52

Table A1a. centers, by state and selected characteristics: 1999–2000—ContinuedState and Percentage of publicselected Number of public Number of public schools with schools withcharacteristics schools library media centers library media centers
Ohio 65.3 93.9 1.53 Oklahoma 5.9 12.9 0.67 Oregon 33.5 44.4 2.48 Pennsylvania 48.7 44.7 1.88 Rhode Island 3.8 5.4 1.34
South Carolina 17.1 20.2 0.86 South Dakota 10.8 26.6 3.43 Tennessee 21.1 24.0 1.03 Texas 65.9 95.0 1.42 Utah 7.1 16.3 2.20
Vermont 7.2 7.2 0.00 Virginia 117.3 119.2 1.44 Washington 16.7 33.4 1.62 West Virginia 16.1 30.8 3.30 Wisconsin 48.8 48.8 0.21 Wyoming 9.0 15.5 3.20
Region Northeast 62.8 117.8 0.87 Midwest 196.1 255.4 0.67 South 153.6 197.9 0.45 West 110.4 247.2 1.32
Community type Central city 368.1 359.9 1.09 Urban fringe/large town 473.8 482.9 0.59 Rural/small town 373.3 385.3 0.70 School level Elementary 256.0 375.9 0.47 Secondary 202.6 199.3 0.83 Combined 156.9 111.7 2.50
Student enrollment Less than 100 367.1 260.3 3.03 100–199 416.7 393.1 1.64 200–499 542.1 552.8 0.54 500–749 496.8 508.4 0.54 750–999 297.2 281.3 0.66 1,000 or more 219.4 214.7 0.79
Table A1a. Standard errors for number of public schools and number and percentage of public schools with library media
NOTE: These estimates are for traditional public schools. Traditional public schools include all public schools in the United States except public charter schools.SOURCE: U.S. Department of Education, National Center for Education Statistics (2002), Schools and Staffing Survey (SASS), "Public School Library Media Center Questionnaire," 1999–2000, and the SASS 1999–2000 Schools Without Libraries Restricted-Use Data File, September 2003.
53

Percentage of privateNumber of private Number of private schools with schools with
Selected characteristics schools library media centers library media centers
Total 238.6 323.2 1.11
Affiliation Catholic 24.3 74.1 0.90 Friends 9.9 10.5 2.37 Episcopal 25.9 29.0 4.41 Hebrew Day 4.7 14.2 5.69 Solomon Schechter — 1.1 1.79 Other Jewish 3.8 20.3 5.05 Lutheran, Missouri Synod 11.9 50.5 4.58 Lutheran, Wisconsin Synod — 12.6 3.54 Evangelical Lutheran — 4.3 3.55 Other Lutheran 13.6 — — Seventh-Day Adventist 26.6 52.9 5.46 Christian Schools International 36.4 37.8 3.33 American Association of Christian Schools 27.4 62.2 6.14 Association of Christian Schools International 20.5 99.4 3.67 National Association of Private Schools for Exceptional Children 55.2 48.9 9.33 Montessori 55.3 70.4 6.82 Independent Schools 0.8 5.5 0.77 National Independent Private School Association 37.4 — — Other 225.7 284.6 2.83
NCES typology Catholic 796.0 74.1 0.90 Parochial 14.4 62.6 1.34 Diocesan 3.2 58.9 2.29 Private 19.4 42.4 4.23
Other religious 1,277.0 141.6 1.78 Conservative Christian 110.6 157.3 2.97 Affiliated 156.0 141.6 3.49 Unaffiliated 177.7 250.0 2.53
Nonsectarian 600.0 200.3 3.39 Regular 40.6 164.4 6.60 Special emphasis 71.0 103.3 4.58 Special education 58.4 91.1 7.24
All members of National Association of Independent Schools 42.6 34.3 2.77
See footnotes at end of table.
Table A1b. Standard errors for number of private schools and number and percentage of private schools with library media Table A1b. centers, by affiliation and selected characteristics: 1999–2000
54

Percentage of privateNumber of private Number of private schools with schools with
Selected characteristics schools library media centers library media centers
Region Northeast 225.3 161.7 2.48 Midwest 339.9 179.2 2.88 South 288.5 231.8 2.29 West 182.6 154.2 3.07
Community type Central city 282.2 261.4 2.26 Urban fringe/large town 345.7 233.8 1.98 Rural/small town 284.0 139.1 2.86
School level Elementary 296.4 251.4 1.62 Secondary 138.8 91.2 3.59 Combined 316.0 173.8 2.28
Student enrollment Less than 100 372.4 286.3 2.20 100–199 248.0 217.7 2.32 200–499 180.9 172.7 1.36 500–749 73.2 58.9 2.48 750–999 34.4 35.1 1.12 1,000 or more 28.2 26.3 4.18
— Not available.
Table A1b. Standard errors for number of private schools and number and percentage of private schools with library media
SOURCE: U.S. Department of Education, National Center for Education Statistics (2002), Schools and Staffing Survey (SASS), "Private School Library Media Center Questionnaire," 1999–2000, and the SASS 1999–2000 Schools Without Libraries Restricted-Use Data File, September 2003.
Table A1b. centers, by affiliation and selected characteristics: 1999–2000—Continued
55

Table A2a. public schools with library media centers, by state and selected characteristics: 1999–2000
State and Number of schools Percentage of schoolsselected Number of pupils with paid state-certified with paid state-certified characteristics in public schools Number of pupils Percentage of pupils library media specialists library media specialists
50 States and DC 332,483.5 340,219.2 0.30 522.7 0.61 Alabama 24,796.3 23,648.3 0.68 21.3 1.19 Alaska 8,224.5 8,518.6 0.81 11.6 2.92 Arizona 48,708.4 49,029.2 1.54 70.4 4.20 Arkansas 13,692.2 13,826.3 0.59 23.7 2.09 California 172,506.8 178,005.5 1.48 159.6 2.55
Colorado 30,230.5 31,572.6 0.46 50.8 3.66 Connecticut 18,023.6 18,785.6 0.48 31.2 2.76 Delaware 11,219.7 11,355.2 0.65 10.4 3.58 District of Columbia 1,785.3 2,365.2 2.99 4.5 1.15 Florida 86,722.9 88,249.8 0.28 66.1 1.99
Georgia 40,118.7 41,857.3 0.71 33.7 0.00 Hawaii 3,785.6 3,785.6 0.00 5.6 2.30 Idaho 4,128.9 4,236.4 0.24 14.1 2.32 Illinois 56,790.7 62,687.8 0.70 158.4 3.98 Indiana 21,931.5 22,140.5 0.18 71.4 3.76
Iowa 20,394.7 21,070.7 0.51 39.7 2.36 Kansas 14,542.0 14,970.1 0.30 40.2 2.06 Kentucky 28,377.5 26,857.6 1.16 40.0 2.10 Louisiana 32,941.3 38,189.8 1.96 80.9 5.16 Maine 8,917.5 8,590.2 1.44 29.8 4.41
Maryland 20,155.9 23,860.2 1.35 51.5 3.62 Massachusetts 33,747.9 36,150.9 1.39 71.6 4.21 Michigan 79,679.2 91,223.2 1.86 164.0 4.58 Minnesota 71,327.2 71,179.7 0.72 113.8 2.80 Mississippi 18,199.2 18,489.5 0.36 23.5 2.21
Missouri 33,619.0 34,762.1 0.96 89.6 4.93 Montana 5,805.4 6,169.2 0.79 24.1 2.75 Nebraska 12,976.3 13,246.3 0.25 37.1 3.26 Nevada 13,431.3 14,105.0 0.31 14.3 2.74 New Hampshire 9,773.3 8,388.4 2.28 27.1 5.84
New Jersey 24,564.7 28,256.2 1.44 70.3 2.70 New Mexico 14,598.4 14,857.9 1.08 35.3 5.43 New York 81,583.1 103,325.0 1.90 130.0 2.87 North Carolina 36,125.7 37,772.0 0.52 60.8 2.36 North Dakota 4,811.3 5,082.1 2.52 20.5 2.08
See footnotes at end of table.
Table A2a. Standard errors for number of pupils in public schools, and number and percentage of pupils and state-certified library media specialists in
For schools with library media centers
56
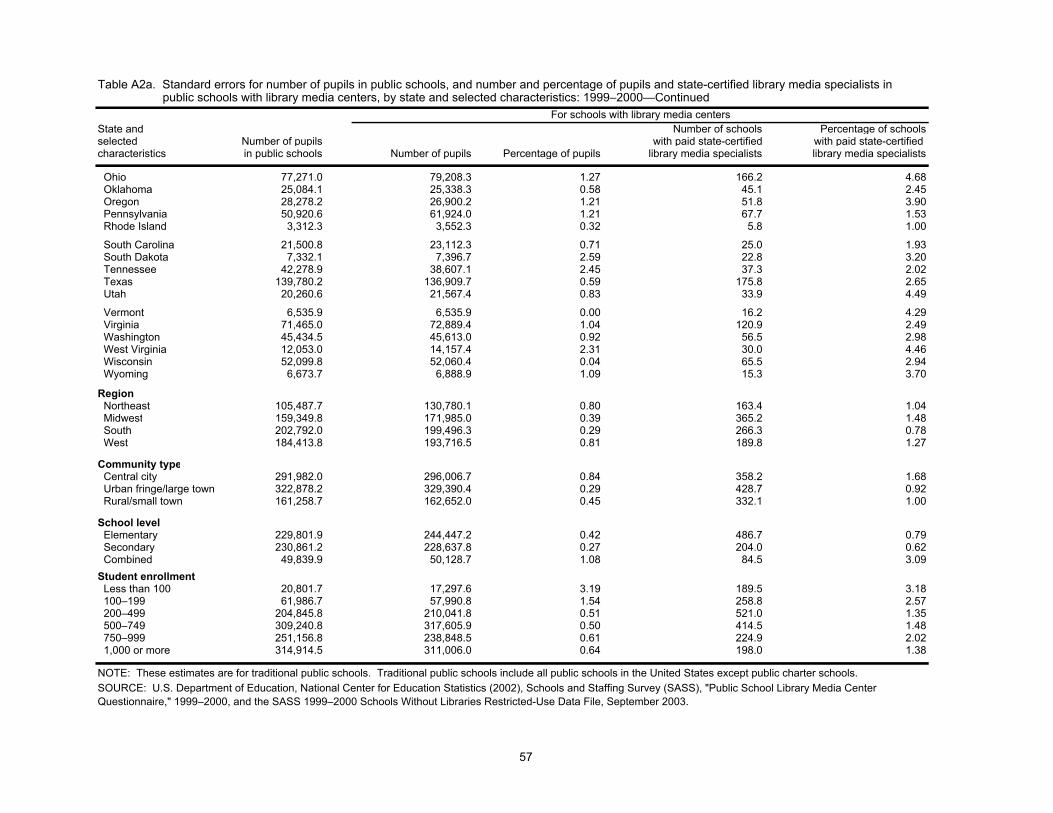
Table A2a. public schools with library media centers, by state and selected characteristics: 1999–2000—Continued
State and Number of schools Percentage of schoolsselected Number of pupils with paid state-certified with paid state-certified characteristics in public schools Number of pupils Percentage of pupils library media specialists library media specialists
Ohio 77,271.0 79,208.3 1.27 166.2 4.68 Oklahoma 25,084.1 25,338.3 0.58 45.1 2.45 Oregon 28,278.2 26,900.2 1.21 51.8 3.90 Pennsylvania 50,920.6 61,924.0 1.21 67.7 1.53 Rhode Island 3,312.3 3,552.3 0.32 5.8 1.00
South Carolina 21,500.8 23,112.3 0.71 25.0 1.93 South Dakota 7,332.1 7,396.7 2.59 22.8 3.20 Tennessee 42,278.9 38,607.1 2.45 37.3 2.02 Texas 139,780.2 136,909.7 0.59 175.8 2.65 Utah 20,260.6 21,567.4 0.83 33.9 4.49
Vermont 6,535.9 6,535.9 0.00 16.2 4.29 Virginia 71,465.0 72,889.4 1.04 120.9 2.49 Washington 45,434.5 45,613.0 0.92 56.5 2.98 West Virginia 12,053.0 14,157.4 2.31 30.0 4.46 Wisconsin 52,099.8 52,060.4 0.04 65.5 2.94 Wyoming 6,673.7 6,888.9 1.09 15.3 3.70
Region Northeast 105,487.7 130,780.1 0.80 163.4 1.04 Midwest 159,349.8 171,985.0 0.39 365.2 1.48 South 202,792.0 199,496.3 0.29 266.3 0.78 West 184,413.8 193,716.5 0.81 189.8 1.27
Community type Central city 291,982.0 296,006.7 0.84 358.2 1.68 Urban fringe/large town 322,878.2 329,390.4 0.29 428.7 0.92 Rural/small town 161,258.7 162,652.0 0.45 332.1 1.00 School level Elementary 229,801.9 244,447.2 0.42 486.7 0.79 Secondary 230,861.2 228,637.8 0.27 204.0 0.62 Combined 49,839.9 50,128.7 1.08 84.5 3.09Student enrollment Less than 100 20,801.7 17,297.6 3.19 189.5 3.18 100–199 61,986.7 57,990.8 1.54 258.8 2.57 200–499 204,845.8 210,041.8 0.51 521.0 1.35 500–749 309,240.8 317,605.9 0.50 414.5 1.48 750–999 251,156.8 238,848.5 0.61 224.9 2.02 1,000 or more 314,914.5 311,006.0 0.64 198.0 1.38
NOTE: These estimates are for traditional public schools. Traditional public schools include all public schools in the United States except public charter schools.SOURCE: U.S. Department of Education, National Center for Education Statistics (2002), Schools and Staffing Survey (SASS), "Public School Library Media Center Questionnaire," 1999–2000, and the SASS 1999–2000 Schools Without Libraries Restricted-Use Data File, September 2003.
Table A2a. Standard errors for number of pupils in public schools, and number and percentage of pupils and state-certified library media specialists in
For schools with library media centers
57
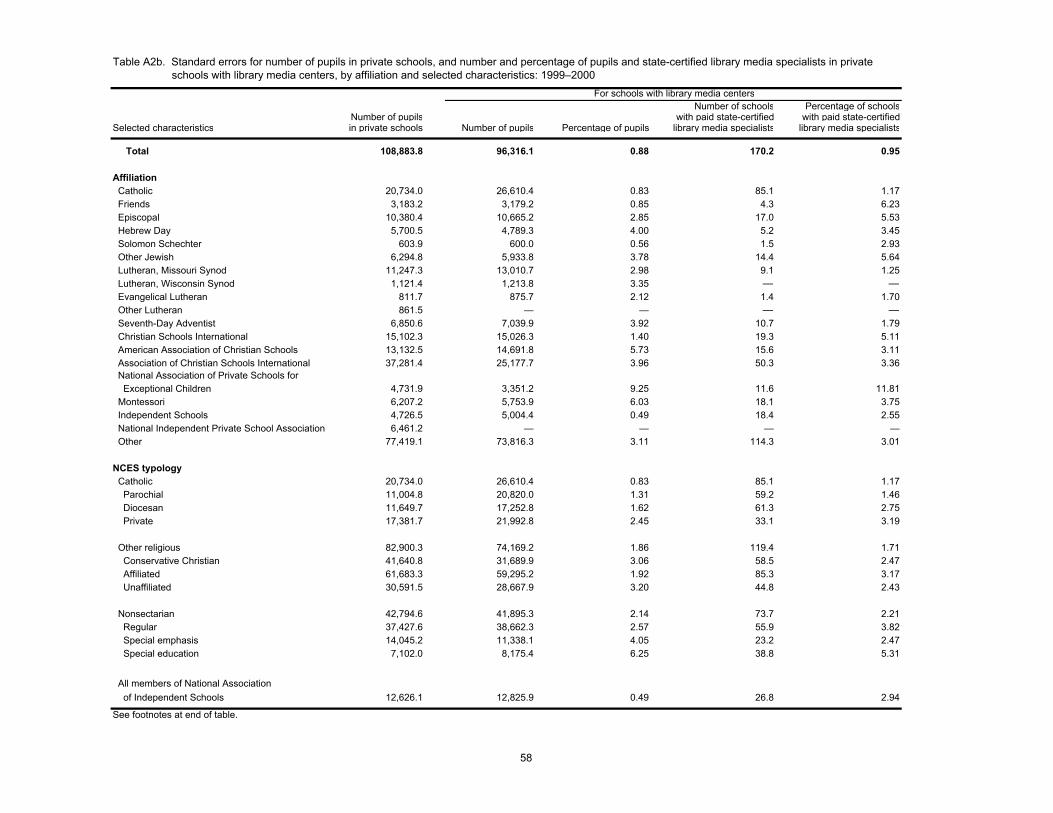
Number of schools Percentage of schoolsNumber of pupils with paid state-certified with paid state-certified
Selected characteristics in private schools Number of pupils Percentage of pupils library media specialists library media specialists
Total 108,883.8 96,316.1 0.88 170.2 0.95
Affiliation Catholic 20,734.0 26,610.4 0.83 85.1 1.17 Friends 3,183.2 3,179.2 0.85 4.3 6.23 Episcopal 10,380.4 10,665.2 2.85 17.0 5.53 Hebrew Day 5,700.5 4,789.3 4.00 5.2 3.45 Solomon Schechter 603.9 600.0 0.56 1.5 2.93 Other Jewish 6,294.8 5,933.8 3.78 14.4 5.64 Lutheran, Missouri Synod 11,247.3 13,010.7 2.98 9.1 1.25 Lutheran, Wisconsin Synod 1,121.4 1,213.8 3.35 — — Evangelical Lutheran 811.7 875.7 2.12 1.4 1.70 Other Lutheran 861.5 — — — — Seventh-Day Adventist 6,850.6 7,039.9 3.92 10.7 1.79 Christian Schools International 15,102.3 15,026.3 1.40 19.3 5.11 American Association of Christian Schools 13,132.5 14,691.8 5.73 15.6 3.11 Association of Christian Schools International 37,281.4 25,177.7 3.96 50.3 3.36 National Association of Private Schools for Exceptional Children 4,731.9 3,351.2 9.25 11.6 11.81 Montessori 6,207.2 5,753.9 6.03 18.1 3.75 Independent Schools 4,726.5 5,004.4 0.49 18.4 2.55 National Independent Private School Association 6,461.2 — — — — Other 77,419.1 73,816.3 3.11 114.3 3.01
NCES typology Catholic 20,734.0 26,610.4 0.83 85.1 1.17 Parochial 11,004.8 20,820.0 1.31 59.2 1.46 Diocesan 11,649.7 17,252.8 1.62 61.3 2.75 Private 17,381.7 21,992.8 2.45 33.1 3.19
Other religious 82,900.3 74,169.2 1.86 119.4 1.71 Conservative Christian 41,640.8 31,689.9 3.06 58.5 2.47 Affiliated 61,683.3 59,295.2 1.92 85.3 3.17 Unaffiliated 30,591.5 28,667.9 3.20 44.8 2.43
Nonsectarian 42,794.6 41,895.3 2.14 73.7 2.21 Regular 37,427.6 38,662.3 2.57 55.9 3.82 Special emphasis 14,045.2 11,338.1 4.05 23.2 2.47 Special education 7,102.0 8,175.4 6.25 38.8 5.31
All members of National Association of Independent Schools 12,626.1 12,825.9 0.49 26.8 2.94
See footnotes at end of table.
Table A2b. Standard errors for number of pupils in private schools, and number and percentage of pupils and state-certified library media specialists in private
For schools with library media centers
Table A2b. schools with library media centers, by affiliation and selected characteristics: 1999–2000
58

Number of schools Percentage of schoolsNumber of pupils with paid state-certified with paid state-certified
Selected characteristics in private schools Number of pupils Percentage of pupils library media specialists library media specialists
Region Northeast 39,694.1 40,292.2 1.35 54.8 1.29 Midwest 37,600.6 37,378.6 1.60 63.8 1.32 South 76,581.9 68,417.4 1.97 106.2 2.13 West 33,845.8 28,844.9 2.16 50.8 1.85
Community type Central city 84,066.7 77,547.1 1.26 108.7 1.43 Urban fringe/large town 63,962.5 52,618.7 1.44 89.2 1.38 Rural/small town 22,384.9 20,968.7 2.42 45.5 1.61
School level Elementary 46,934.2 40,145.9 1.19 96.1 0.90 Secondary 33,163.5 32,873.1 1.10 51.2 2.38 Combined 79,006.5 70,425.0 1.96 102.8 2.18
Student enrollment Less than 100 19,252.6 15,484.1 2.29 59.3 1.34 100–199 35,813.0 31,776.6 2.29 56.8 1.36 200–499 53,900.1 52,475.3 1.24 112.8 1.54 500–749 43,288.7 35,055.8 2.42 42.2 2.45 750–999 28,775.5 29,411.0 1.22 28.2 3.29 1,000 or more 43,907.7 38,111.9 5.72 24.9 3.63
— Not available.SOURCE: U.S. Department of Education, National Center for Education Statistics (2002), Schools and Staffing Survey (SASS), "Private School Library Media Center Questionnaire," 1999–2000, and the SASS 1999–2000 Schools Without Libraries Restricted-Use Data File, September 2003.
Table A2b. Standard errors for number of pupils in private schools, and number and percentage of pupils and state-certified library media specialists in private
For schools with library media centers
Table A2b. schools with library media centers, by affiliation and selected characteristics: 1999–2000—Continued
59

Table A3a. bachelor's degree or MLS or related degree as their highest degree, by state and selected characteristics: 1999–2000
State and Number of schools where Percentage of schools where Number of schools Percentage of schoolsselected paid professional staff has paid professional staff has where paid professional staff where paid professional staffcharacteristics bachelor's degree bachelor's degree has MLS or related degree1 has MLS or related degree1
50 States and DC 521.4 0.66 567.1 0.73 Alabama 18.4 1.41 45.6 3.27 Alaska 7.3 2.03 11.2 2.78 Arizona 38.3 3.55 60.1 4.78 Arkansas 39.9 3.59 34.5 3.34 California 177.6 2.69 105.8 1.69
Colorado 30.9 2.27 50.4 3.77 Connecticut 10.6 1.14 40.6 4.15 Delaware 7.3 5.49 7.7 4.85 District of Columbia 2.7 1.93 5.9 4.13 Florida 75.1 3.02 93.9 3.63
Georgia 7.2 0.42 70.2 3.68 Hawaii 5.3 2.18 9.8 3.82 Idaho 14.7 2.73 8.7 1.55 Illinois 104.0 2.83 153.3 3.99 Indiana 66.2 3.78 61.7 3.56
Iowa 56.0 3.72 54.1 3.73 Kansas 35.9 2.62 52.6 3.45 Kentucky 27.4 2.26 52.6 4.01 Louisiana 77.4 5.66 57.6 4.56 Maine 21.0 3.33 30.4 4.47
Maryland 42.7 3.51 61.1 5.05 Massachusetts 59.5 3.59 76.3 4.71 Michigan 62.3 2.02 141.0 4.38 Minnesota 87.6 5.70 91.3 5.43 Mississippi 32.0 3.64 32.6 3.76
Missouri 93.6 4.54 83.7 4.47 Montana 27.6 3.43 16.2 2.12 Nebraska 41.9 3.80 22.1 2.22 Nevada 15.9 3.62 14.7 3.56 New Hampshire 18.3 4.06 26.4 6.09
New Jersey 66.0 3.09 71.9 3.33 New Mexico 25.1 3.75 28.4 4.10 New York 66.0 1.77 120.3 3.01 North Carolina 63.8 3.39 98.7 4.93 North Dakota 18.4 2.87 4.2 0.88
See footnotes at end of table.
Table A3a. Standard errors for number and percentage of public schools with library media centers where paid professional staff have a
60

Table A3a. bachelor's degree or MLS or related degree as their highest degree, by state and selected characteristics: 1999–2000 Table A3a. —Continued
State and Number of schools where Percentage of schools where Number of schools Percentage of schoolsselected paid professional staff has paid professional staff has where paid professional staff where paid professional staffcharacteristics bachelor's degree bachelor's degree has MLS or related degree1 has MLS or related degree1
Ohio 92.6 2.60 114.7 3.29 Oklahoma 66.6 3.73 71.6 3.91 Oregon 45.5 3.95 37.8 3.12 Pennsylvania 158.4 5.36 176.6 6.00 Rhode Island 3.8 1.34 6.6 1.76
South Carolina 18.5 1.76 47.3 4.21 South Dakota 18.2 2.72 16.4 2.71 Tennessee 60.5 4.05 66.2 4.42 Texas 189.2 3.07 243.1 3.87 Utah 28.4 4.08 24.2 3.45
Vermont 12.8 3.86 16.3 4.67 Virginia 73.0 4.19 94.3 4.52 Washington 60.8 3.20 59.0 3.13 West Virginia 20.2 3.23 18.4 2.97 Wisconsin 66.9 3.23 81.8 4.06 Wyoming 13.6 3.73 11.2 3.37
Region Northeast 182.4 1.41 235.8 1.73 Midwest 239.8 1.01 315.3 1.47 South 260.8 1.00 333.1 1.24 West 212.9 1.31 155.9 1.01
Community type Central city 247.3 1.34 275.7 1.45 Urban fringe/large town 345.4 0.92 392.4 1.09 Rural/small town 300.5 1.16 288.0 1.21 School level Elementary 486.9 0.85 559.6 0.99 Secondary 134.5 0.67 169.0 0.81 Combined 29.3 1.48 58.7 2.68
Student enrollment Less than 100 101.9 2.69 137.8 3.51 100–199 194.8 2.77 163.7 2.31 200–499 310.7 1.00 404.8 1.18 500–749 289.4 1.33 333.9 1.50 750–999 154.9 1.80 176.1 2.04 1,000 or more 101.2 1.10 168.0 1.80
1Master’s Degree in Librarianship, Educational Media, Instructional Design, Instructional Technology, Library Science or Information Science as their highest degree.NOTE: These estimates are for traditional public schools. Traditional public schools include all public schools in the United States except public charter schools.
Table A3a. Standard errors for number and percentage of public schools with library media centers where paid professional staff have a
SOURCE: U.S. Department of Education, National Center for Education Statistics, Schools and Staffing Survey, "Public School Library Media Center Questionnaire," 1999–2000.
61

Number of schools where Percentage of schools where Number of schools where Percentage of schoolspaid professional staff has paid professional staff has paid professional staff has where paid professional staff
Selected characteristics bachelor's degree bachelor's degree MLS or related degree1 has MLS or related degree1
Total 174.3 1.02 142.3 0.81
AffiliationCatholic 106.5 1.50 65.9 0.88Friends 2.8 4.27 4.8 7.12Episcopal 15.7 4.13 17.5 5.89Hebrew Day 10.7 6.87 4.4 3.29Solomon Schechter 1.1 1.93 1.8 3.57Other Jewish 4.9 2.09 17.0 6.26Lutheran, Missouri Synod 24.9 3.24 17.6 2.47Lutheran, Wisconsin Synod 3.3 2.04 1.9 1.08Evangelical Lutheran 2.2 2.33 1.2 1.58Other Lutheran — — — —Seventh-Day Adventist 20.0 3.17 9.5 1.62Christian Schools International 19.7 4.73 14.0 3.84American Association of Christian Schools 21.5 4.03 17.5 3.46Association of Christian Schools International 50.7 3.38 45.0 2.89National Association of Private Schools for Exceptional Children 6.9 5.57 10.9 10.56Montessori 22.8 4.54 17.9 3.51Independent Schools 17.0 2.42 18.1 2.53National Independent Private School Association — — — —Other 116.5 2.77 95.5 2.54
NCES typologyCatholic 106.5 1.50 65.9 0.88 Parochial 77.3 1.84 48.4 1.19 Diocesan 66.8 2.85 36.4 1.65 Private 34.7 4.34 38.7 3.97
Other religious 106.4 1.53 93.6 1.41 Conservative Christian 59.1 2.41 50.7 2.09 Affiliated 69.4 2.51 52.8 1.99 Unaffiliated 44.6 2.32 2.88
Nonsectarian 91.9 2.49 70.9 2.13 Regular 84.4 4.09 52.3 4.04 Special emphasis 29.3 2.94 21.4 2.29 Special education 17.8 2.77 35.9 4.82
All members of National Association of Independent Schools 19.4 2.31 33.1 3.27
See footnotes at end of table.
Table A3b. Standard errors for number and percentage of private schools with library media centers where paid professional staff have a bachelor's degreeTable A3b. or MLS or related degree as their highest degree, by affiliation and selected characteristics: 1999–2000
62

Number of schools where Percentage of schools where Number of schools where Percentage of schoolspaid professional staff has paid professional staff has paid professional staff has where paid professional staff
Selected characteristics bachelor's degree bachelor's degree MLS or related degree1 has MLS or related degree1
Region Northeast 69.1 1.89 54.3 1.33 Midwest 88.7 1.79 47.2 1.02 South 126.4 2.21 82.7 1.86 West 46.1 1.63 52.5 1.82
Community type Central city 123.4 1.58 98.4 1.25 Urban fringe/large town 115.5 1.68 71.2 1.21 Rural/small town 61.4 2.49 37.8 1.40
School level Elementary 149.7 1.38 88.9 0.81 Secondary 38.6 1.99 52.6 2.22 Combined 77.6 1.78 72.9 1.62
Student enrollment Less than 100 65.5 1.50 53.5 1.20 100–199 97.2 2.14 48.4 1.18 200–499 125.2 1.85 94.5 1.34 500–749 41.1 3.08 35.0 2.41 750–999 20.1 3.23 19.7 3.34 1,000 or more 19.5 5.21 19.7 4.28
— Not available.1 Master’s Degree in Librarianship, Educational Media, Instructional Design, Instructional Technology, Library Science or Information Science as their highest degree.SOURCE: U.S. Department of Education, National Center for Education Statistics, Schools and Staffing Survey (SASS), "Private School Library Media Center Questionnaire," 1999–2000.
Table A3b. Standard errors for number and percentage of private schools with library media centers where paid professional staff have a bachelor's degreeTable A3b. or MLS or related degree as their highest degree, by affiliation and selected characteristics: 1999–2000—Continued
63

Table A4a. by state and selected characteristics: 1999–2000
State and Number of schools with Percentage of schools with Number of schools with Percentage of schools withselected paid full-time state-certified paid full-time state-certified paid part-time state-certified paid part-time state-certifiedcharacteristics library media specialist library media specialist library media specialist library media specialist
50 States and DC 535.7 0.65 444.5 0.58 Alabama 25.0 1.68 14.9 1.14 Alaska 9.3 2.32 7.7 2.11 Arizona 66.0 4.84 34.6 3.20 Arkansas 35.7 3.14 37.3 3.44 California 129.3 2.13 109.4 1.72
Colorado 52.2 3.72 30.3 2.25 Connecticut 31.0 2.96 17.9 1.88 Delaware 10.6 5.82 6.4 4.48 District of Columbia 4.5 1.15 — — Florida 64.2 1.97 9.2 0.37
Georgia 44.0 2.34 40.6 2.34 Hawaii 6.2 2.54 — — Idaho 11.0 1.82 8.1 1.47 Illinois 129.2 3.35 101.1 2.73 Indiana 67.1 3.81 63.5 3.55
Iowa 52.8 3.58 53.4 3.55 Kansas 45.1 3.40 55.8 3.91 Kentucky 53.8 3.62 38.4 3.14 Louisiana 79.3 5.54 50.8 3.96 Maine 18.6 3.07 29.2 4.49
Maryland 55.8 4.09 — — Massachusetts 71.2 4.09 38.5 2.44 Michigan 145.6 4.19 93.9 3.15 Minnesota 109.1 4.95 80.7 5.22 Mississippi 23.9 2.55 13.6 1.56
Missouri 100.5 5.39 68.1 3.62 Montana 24.7 3.29 26.5 3.35 Nebraska 32.7 2.81 37.1 3.82 Nevada 14.3 2.84 — — New Hampshire 24.6 5.63 18.7 4.17
New Jersey 67.5 2.98 56.2 2.64 New Mexico 35.5 5.30 20.7 3.09 New York 127.1 2.71 86.9 2.33 North Carolina 62.5 2.49 — — North Dakota 12.5 2.80 23.5 3.90
See footnotes at end of table.
Table A4a. Standard errors for number and percentage of public schools with paid full-time or part-time state-certified library media specialists,
64

Table A4a. by state and selected characteristics: 1999–2000—Continued
State and Number of schools with Percentage of schools with Number of schools with Percentage of schools withselected paid full-time state-certified paid full-time state-certified paid part-time state-certified paid part-time state-certifiedcharacteristics library media specialist library media specialist library media specialist library media specialist
Ohio 136.7 3.61 150.3 4.27 Oklahoma 70.4 3.90 63.5 3.58 Oregon 51.5 4.52 62.2 5.33 Pennsylvania 175.8 5.65 163.1 5.59 Rhode Island 5.4 1.78 5.9 1.84
South Carolina 33.3 2.52 — — South Dakota 19.3 3.43 19.8 3.09 Tennessee 43.0 2.55 — — Texas 196.7 3.09 138.0 2.20 Utah 29.5 3.89 19.6 2.86
Vermont 18.9 5.39 16.7 5.00 Virginia 119.7 2.95 — — Washington 72.7 3.80 51.9 2.86 West Virginia 26.8 4.47 18.1 2.88 Wisconsin 87.5 4.49 85.4 4.24 Wyoming 12.5 3.74 12.3 3.23
Region Northeast 215.0 1.50 195.8 1.51 Midwest 316.2 1.26 270.1 1.23 South 311.0 1.06 204.5 0.78 West 168.0 1.14 127.7 0.80
Community type Central city 321.0 1.66 209.3 1.12 Urban fringe/large town 389.7 0.97 264.7 0.73 Rural/small town 342.5 1.25 236.6 0.95 School level Elementary 480.3 0.82 440.7 0.77 Secondary 210.3 0.82 102.6 0.56 Combined 81.0 2.87 22.7 1.17
Student enrollment Less than 100 134.7 3.14 126.5 2.95 100–199 194.0 2.44 176.4 2.37 200–499 386.2 1.11 348.9 1.08 500–749 409.3 1.58 129.0 0.63 750–999 218.9 2.15 81.0 1.02 1,000 or more 189.3 1.50 68.7 0.82
— Not available.
Table A4a. Standard errors for number and percentage of public schools with paid full-time or part-time state-certified library media specialists,
NOTE: These estimates are for traditional public schools. Traditional public schools include all public schools in the United States except public charter schools.SOURCE: U.S. Department of Education, National Center for Education Statistics, Schools and Staffing Survey, "Public School Library Media Center Questionnaire," 1999–2000.
65
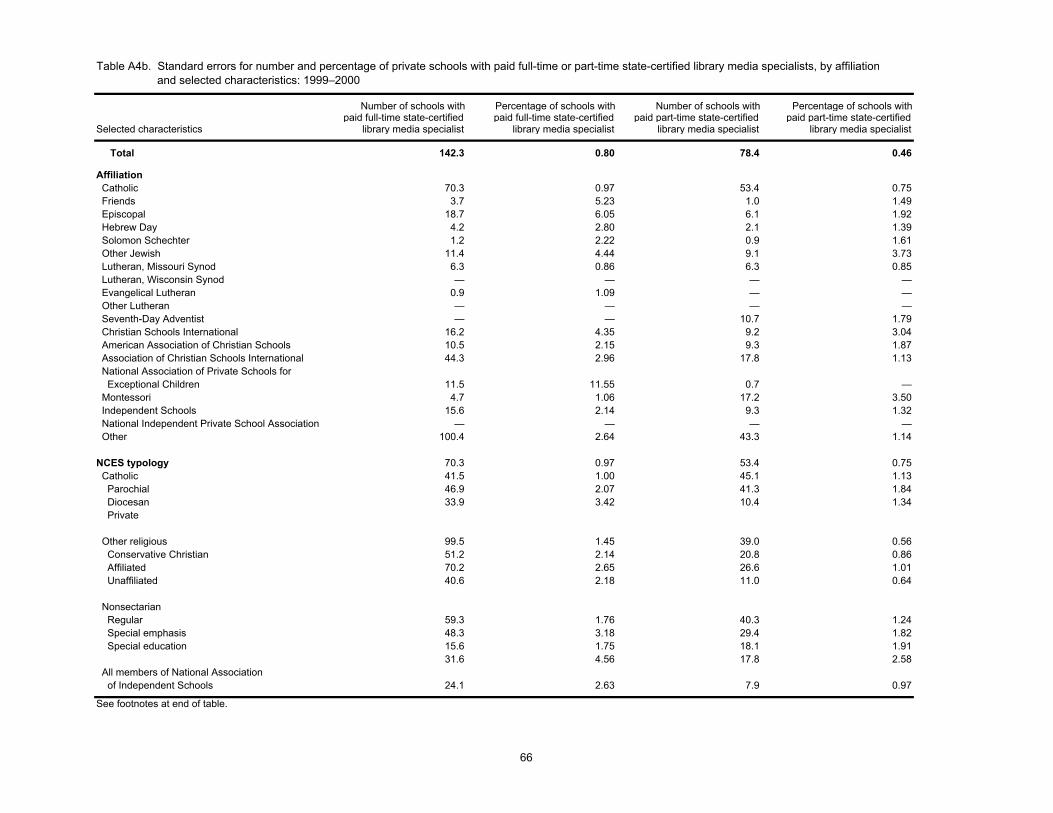
Number of schools with Percentage of schools with Number of schools with Percentage of schools with paid full-time state-certified paid full-time state-certified paid part-time state-certified paid part-time state-certified
Selected characteristics library media specialist library media specialist library media specialist library media specialist
Total 142.3 0.80 78.4 0.46
Affiliation Catholic 70.3 0.97 53.4 0.75 Friends 3.7 5.23 1.0 1.49 Episcopal 18.7 6.05 6.1 1.92 Hebrew Day 4.2 2.80 2.1 1.39 Solomon Schechter 1.2 2.22 0.9 1.61 Other Jewish 11.4 4.44 9.1 3.73 Lutheran, Missouri Synod 6.3 0.86 6.3 0.85 Lutheran, Wisconsin Synod — — — — Evangelical Lutheran 0.9 1.09 — — Other Lutheran — — — — Seventh-Day Adventist — — 10.7 1.79 Christian Schools International 16.2 4.35 9.2 3.04 American Association of Christian Schools 10.5 2.15 9.3 1.87 Association of Christian Schools International 44.3 2.96 17.8 1.13 National Association of Private Schools for Exceptional Children 11.5 11.55 0.7 — Montessori 4.7 1.06 17.2 3.50 Independent Schools 15.6 2.14 9.3 1.32 National Independent Private School Association — — — — Other 100.4 2.64 43.3 1.14
NCES typology 70.3 0.97 53.4 0.75 Catholic 41.5 1.00 45.1 1.13 Parochial 46.9 2.07 41.3 1.84 Diocesan 33.9 3.42 10.4 1.34 Private
Other religious 99.5 1.45 39.0 0.56 Conservative Christian 51.2 2.14 20.8 0.86 Affiliated 70.2 2.65 26.6 1.01 Unaffiliated 40.6 2.18 11.0 0.64
Nonsectarian Regular 59.3 1.76 40.3 1.24 Special emphasis 48.3 3.18 29.4 1.82 Special education 15.6 1.75 18.1 1.91
31.6 4.56 17.8 2.58 All members of National Association of Independent Schools 24.1 2.63 7.9 0.97
See footnotes at end of table.
Table A4b. Standard errors for number and percentage of private schools with paid full-time or part-time state-certified library media specialists, by affiliationTable A4b. and selected characteristics: 1999–2000
66

Number of paid Percentage of paid Number of paid Percentage paidfull-time state-certified full-time state-certified part-time state-certified part-time state-certified
Selected characteristics library media specialist library media specialist library media specialist library media specialist
Region Northeast 43.4 1.06 32.9 0.78 Midwest 50.5 1.02 47.3 0.98 South 95.8 1.92 44.0 0.84 West 46.1 1.62 22.0 0.80
Community type Central city 99.9 1.28 43.1 0.56 Urban fringe/large town 75.4 1.13 54.2 0.85 Rural/small town 30.5 1.16 40.6 1.56
School level Elementary 76.5 0.71 59.6 0.55 Secondary 46.0 2.18 16.6 0.81 Combined 89.1 1.94 45.8 1.07
Student enrollment Less than 100 40.8 0.92 42.8 0.97 100–199 44.6 1.02 43.8 1.06 200–499 99.2 1.44 52.3 0.78 500–749 35.1 2.28 19.8 1.54 750–999 27.1 3.56 7.8 1.50 1,000 or more 24.6 3.56 1.7 0.68
— Not available.
Table A4b. Standard errors for number and percentage of private schools with paid full-time or part-time state-certified library media specialists, by affiliationTable A4b. and selected characteristics: 1999–2000—Continued
SOURCE: U.S. Department of Education, National Center for Education Statistics, Schools and Staffing Survey (SASS), "Private School Library Media Center Questionnaire," 1999–2000.
67

Table A5a. volunteers during most recent full week, by state and selected characteristics: 1999–2000
State and Number of schools Percentage of schools Number of schools Percentage of schools Number of schools Percentage of schoolsselected with paid library aides with paid library aides with adult with adult with student with studentcharacteristics or clerical staff or clerical staff volunteers volunteers volunteers volunteers
50 States and DC 592.9 0.62 584.6 0.72 574.8 0.71 Alabama 37.5 2.74 44.7 3.35 51.8 4.05 Alaska 13.7 3.44 12.4 3.05 15.3 3.19 Arizona 72.9 3.19 68.1 5.83 54.1 5.29 Arkansas 42.7 3.94 37.0 3.39 40.7 3.75 California 239.4 2.47 264.3 4.18 204.0 3.08
Colorado 44.7 3.11 52.7 3.79 53.8 4.07 Connecticut 32.0 3.09 29.7 3.32 27.1 2.76 Delaware 7.2 4.66 7.9 4.30 7.2 4.13 District of Columbia 3.7 2.65 4.7 3.18 5.6 3.98 Florida 67.6 2.46 88.1 3.66 68.3 2.57
Georgia 67.2 3.52 70.3 3.86 66.8 3.95 Hawaii 7.7 3.13 9.2 3.70 7.1 2.95 Idaho 15.1 1.87 14.0 2.64 10.9 1.97 Illinois 112.8 3.10 147.1 4.10 129.1 3.39 Indiana 59.9 3.03 60.5 3.48 57.3 3.29
Iowa 40.3 2.61 44.4 3.02 42.5 3.01 Kansas 50.0 3.43 40.0 2.96 37.9 2.79 Kentucky 63.7 4.59 39.4 3.01 51.4 3.93 Louisiana 77.4 5.81 77.2 5.83 82.5 5.71 Maine 25.3 3.92 27.3 3.82 24.1 3.79
Maryland 58.4 4.87 72.2 5.53 61.4 4.91 Massachusetts 69.1 3.58 93.2 5.17 81.0 4.95 Michigan 148.4 4.07 137.6 4.32 111.1 3.44 Minnesota 113.9 4.10 84.8 4.70 70.9 4.20 Mississippi 23.1 2.60 20.4 2.33 22.5 2.52
Missouri 72.9 4.28 72.8 3.96 68.0 3.83 Montana 32.7 4.15 21.7 2.99 24.6 3.39 Nebraska 50.0 3.27 34.7 2.97 25.5 2.51 Nevada 15.7 3.54 15.8 3.80 13.9 2.88 New Hampshire 25.1 5.82 22.9 5.23 20.1 4.62
New Jersey 76.5 3.87 77.7 3.72 56.2 2.77 New Mexico 43.1 6.03 34.0 5.03 31.2 4.65 New York 133.8 3.35 134.9 3.56 110.2 2.87 North Carolina 78.8 3.90 80.3 4.16 91.5 4.48 North Dakota 19.5 3.79 11.5 2.43 12.5 2.58
See footnotes at end of table.
Table A5a. Standard errors for number and percentage of public schools with paid library aides or clerical staff and regularly scheduled adult and student library
68

Table A5a. volunteers during most recent full week, by state and selected characteristics: 1999–2000—Continued
State and Number of schools Percentage of schools Number of schools Percentage of schools Number of schools Percentage of schoolsselected with paid library aides with paid library aides with adult with adult with student with studentcharacteristics or clerical staff or clerical staff volunteers volunteers volunteers volunteers
Ohio 150.8 3.81 185.6 5.17 137.3 3.82 Oklahoma 71.4 3.95 55.5 3.13 64.0 3.59 Oregon 57.8 3.47 51.4 4.74 52.0 4.59 Pennsylvania 145.3 4.85 153.7 5.25 140.6 4.80 Rhode Island 4.5 1.53 7.0 2.26 6.4 2.00
South Carolina 41.1 3.75 43.5 4.08 47.9 4.37 South Dakota 25.5 4.11 17.8 2.95 15.7 2.55 Tennessee 67.3 4.48 65.1 4.30 58.9 3.90 Texas 200.3 2.98 193.6 3.17 182.8 3.00 Utah 30.5 4.27 25.1 3.41 31.1 4.26
Vermont 15.8 4.54 17.5 5.18 17.2 5.21 Virginia 99.9 4.33 99.1 3.66 82.8 4.05 Washington 50.6 2.23 66.7 3.64 72.5 3.81 West Virginia 19.5 3.16 30.9 4.37 26.6 4.47 Wisconsin 66.1 2.33 87.2 4.17 97.0 4.74 Wyoming 19.8 3.75 14.8 3.50 14.6 4.16
Region Northeast 211.7 1.58 252.5 1.89 213.2 1.62 Midwest 317.0 1.27 326.5 1.39 296.2 1.28 South 319.7 1.09 285.9 1.08 332.9 1.24 West 295.2 1.25 306.4 1.89 250.5 1.51
Community type Central city 341.0 1.46 342.5 1.62 334.1 1.64 Urban fringe/large town 487.5 0.87 463.8 1.23 385.1 0.92 Rural/small town 392.2 1.19 255.2 0.95 276.1 1.08 School level Elementary 566.1 0.78 574.3 0.98 524.7 0.89 Secondary 185.5 0.77 122.2 0.66 167.6 0.83 Combined 62.7 2.92 32.6 1.73 72.9 2.53
Student enrollment Less than 100 203.6 3.14 113.7 2.68 109.8 2.73 100–199 364.4 2.76 208.3 2.46 170.7 2.19 200–499 551.4 1.20 484.5 1.24 385.8 1.08 500–749 445.0 1.19 388.8 1.58 363.3 1.48 750–999 263.7 1.58 208.3 2.26 187.8 2.07 1,000 or more 202.2 1.22 145.2 1.46 166.7 1.61
Table A5a. Standard errors for number and percentage of public schools with paid library aides or clerical staff and regularly scheduled adult and student library
NOTE: These estimates are for traditional public schools. Traditional public schools include all public schools in the United States except public charter schools.SOURCE: U.S. Department of Education, National Center for Education Statistics, Schools and Staffing Survey, "Public School Library Media Center Questionnaire," 1999–2000.
69

Number of schools Percentage of schools Number of schools Percentage of schools Number of schools Percentage of schoolswith paid library aides with paid aides with adult with adult with student with student
Selected characteristics or clerical staff or clerical staff volunteers volunteers volunteers volunteers
Total 200.1 1.02 262.2 1.28 187.6 1.00
Affiliation Catholic 110.3 1.53 121.1 1.42 95.6 1.32 Friends 5.9 9.26 12.4 8.73 3.1 4.60 Episcopal 18.9 6.15 26.6 5.13 16.9 5.11 Hebrew Day 12.4 7.36 8.8 6.04 5.8 4.13 Solomon Schechter 1.7 3.37 2.1 3.46 1.8 3.40 Other Jewish 15.1 6.62 15.9 4.89 17.7 7.07 Lutheran, Missouri Synod 34.7 4.31 55.7 4.70 33.3 4.04 Lutheran, Wisconsin Synod 4.1 2.31 11.9 3.75 4.7 2.61 Evangelical Lutheran 2.2 2.72 4.1 3.50 2.0 2.14 Other Lutheran — — — — — — Seventh-Day Adventist 28.6 3.91 35.9 6.30 30.8 5.56 Christian Schools International 24.3 4.98 32.7 5.09 22.2 5.59 American Association of Christian Schools 41.1 6.58 43.1 6.95 41.4 7.77 Association of Christian Schools International 58.4 3.90 106.6 4.71 76.5 4.02 National Association of Private Schools for Exceptional Children 12.2 11.04 44.3 17.22 43.4 17.07 Montessori 36.8 7.00 57.2 6.94 46.8 8.27 Independent Schools 23.5 3.34 15.6 2.33 14.7 2.08 National Independent Private School Association — — — — — — Other 142.5 3.43 208.8 4.52 139.1 3.13
NCES typology Catholic 110.3 1.53 121.1 1.42 95.6 1.32 Parochial 90.9 2.20 91.8 1.87 71.6 1.72 Diocesan 71.4 2.79 77.2 2.66 54.9 2.38 Private 33.5 3.94 31.4 3.33 30.0 3.56
Other religious 139.6 1.72 181.5 2.35 147.2 1.88 Conservative Christian 77.7 2.97 126.8 3.55 95.2 3.36 Affiliated 121.6 3.70 99.6 3.66 109.1 3.73 Unaffiliated 69.2 3.40 106.2 4.31 66.2 3.21
Nonsectarian 96.6 3.01 146.2 3.83 87.8 2.90 Regular 62.9 4.66 125.0 6.00 59.5 3.37 Special emphasis 55.9 5.64 78.8 6.90 49.8 5.57 Special education 33.2 5.37 52.2 7.05 45.3 6.79
All members of National Association of Independent Schools 27.8 2.99 34.4 2.68 20.0 2.29
See footnotes at end of table.
Table A5b. Standard errors for number and percentage of private schools with paid library aides or clerical staff and regularly scheduled adult and student libraryTable A5b. volunteers during most recent full week, by affiliation and selected characteristics: 1999–2000
70

Number of schools Percentage of schools Number of schools Percentage of schools Number of schools Percentage of schoolswith paid library aides with paid aides with adult with adult with student with student
Selected characteristics or clerical staff or clerical staff volunteers volunteers volunteers volunteers
Region Northeast 100.9 2.20 112.1 2.82 84.0 1.94 Midwest 102.9 2.03 148.8 2.41 91.5 1.73 South 143.2 2.23 154.4 2.51 130.7 2.13 West 96.1 3.41 116.9 3.31 82.9 2.67
Community type Central city 130.6 1.54 209.7 2.07 134.0 1.53 Urban fringe/large town 151.8 1.80 178.7 1.99 129.9 1.64 Rural/small town 81.2 3.02 108.1 3.19 75.6 2.66
School level Elementary 177.6 1.46 196.0 1.66 162.5 1.35 Secondary 57.8 2.57 49.3 2.11 46.7 1.89 Combined 102.0 2.11 126.0 2.68 102.7 2.26
Student enrollment Less than 100 129.6 2.47 220.8 3.63 154.7 2.80 100–199 130.2 2.37 152.6 2.58 81.0 1.85 200–499 146.8 1.98 136.2 1.63 96.7 1.41 500–749 44.8 2.80 46.6 3.24 41.2 2.97 750–999 27.3 3.25 26.8 3.16 20.1 3.13 1,000 or more 17.5 5.17 19.4 4.59 19.7 4.80
— Not available.SOURCE: U.S. Department of Education, National Center for Education Statistics, Schools and Staffing Survey (SASS), "Private School Library Media Center Questionnaire," 1999–2000.
Table A5b. Standard errors for number and percentage of private schools with paid library aides or clerical staff and regularly scheduled adult and student library Table A5b. volunteers during most recent full week, by affiliation and selected characteristics: 1999–2000—Continued
71

Table A6a. characteristics: 1999–2000
State and Percentage of library Average number of Average number ofselected Average library Average book expenditures books acquired of books held atcharacteristics expenditures1 expenditures2 spent on books2 during 1998-1999 end of 1998-1999
50 States and DC $115.4 $89.2 0.60 8.8 114.0 Alabama 455.3 297.3 2.76 20.9 939.5 Alaska 477.9 390.5 3.84 16.8 359.5 Arizona 460.5 379.7 1.62 48.7 1,132.4 Arkansas 494.4 477.9 3.02 20.4 250.3 California 879.5 827.0 4.19 76.7 667.5
Colorado 577.7 566.3 3.56 19.6 381.6 Connecticut 778.9 441.1 2.74 30.5 733.5 Delaware 702.1 596.1 2.23 55.5 687.4 District of Columbia 181.5 143.2 2.53 12.9 828.0 Florida 596.5 546.2 2.51 58.1 966.6
Georgia 513.4 375.8 1.43 36.6 390.9 Hawaii 484.0 363.8 2.14 30.1 363.9 Idaho 974.6 928.1 1.23 72.1 519.1 Illinois 587.7 321.3 2.17 42.9 414.0 Indiana 450.7 275.7 1.28 32.4 906.2
Iowa 470.4 203.8 3.22 20.3 269.3 Kansas 280.2 175.2 1.54 35.0 334.4 Kentucky 309.1 221.9 1.35 27.5 336.6 Louisiana 1,393.2 1,111.5 4.00 31.8 486.1 Maine 563.6 276.3 5.41 13.1 676.0
Maryland 1,532.6 622.1 7.22 52.9 480.2 Massachusetts 326.1 258.6 2.40 78.5 311.2 Michigan 472.5 388.0 2.24 27.5 339.2 Minnesota 607.5 468.1 2.22 33.7 663.3 Mississippi 625.8 484.3 1.94 29.2 991.2
Missouri 702.3 416.6 2.55 28.7 484.1 Montana 249.9 150.9 1.48 23.3 264.8 Nebraska 436.5 282.1 2.57 20.8 495.1 Nevada 1,327.1 1,097.8 4.96 77.4 1,564.6 New Hampshire 1,254.7 340.3 6.13 37.8 418.5
New Jersey 474.2 346.2 2.06 26.3 440.3 New Mexico 489.0 377.7 4.03 43.0 1,102.0 New York 377.0 240.4 1.60 25.1 316.8 North Carolina 756.8 712.9 2.80 40.0 484.7 North Dakota 303.9 215.9 1.35 32.3 379.3
See footnotes at end of table.
Table A6a. Standard errors for average library expenditures and book holdings for public school library media centers, by state and selected
72

Table A6a. characteristics: 1999–2000—Continued
State and Percentage of library Average number of Average number ofselected Average library Average book expenditures books acquired of books held atcharacteristics expenditures1 expenditures2 spent on books2 during 1998-1999 end of 1998-1999
Ohio $677.9 $322.2 3.76 23.2 7,920.0 Oklahoma 389.1 301.5 2.10 17.4 7,698.0 Oregon 707.0 219.8 5.78 24.8 12,264.0 Pennsylvania 853.6 742.1 3.18 30.5 11,900.0 Rhode Island 228.0 101.4 2.13 18.6 7,942.0
South Carolina 490.0 358.7 1.89 29.0 9,305.0 South Dakota 290.1 152.2 1.42 17.5 8,713.0 Tennessee 1,914.1 1,767.8 8.01 71.4 9,339.0 Texas 430.5 364.5 1.44 36.8 10,351.0 Utah 286.4 197.6 1.56 30.4 8,348.0
Vermont 544.7 338.3 2.12 23.8 9,167.0 Virginia 497.3 325.2 1.45 62.5 12,229.0 Washington 453.1 349.9 2.06 33.4 10,584.0 West Virginia 435.6 355.6 3.83 20.6 6,873.0 Wisconsin 553.5 342.9 1.50 33.0 11,763.0 Wyoming 358.1 233.6 2.06 22.4 9,021.0
Region Northeast 254.3 191.0 0.98 14.7 10,528.0 Midwest 193.7 114.0 0.87 11.2 9,486.0 South 202.9 147.6 0.79 14.6 10,340.0 West 351.7 335.8 2.26 31.8 10,860.0
Community type Central city 268.5 190.9 0.99 21.3 9,201.0 Urban fringe/large town 220.6 170.8 0.96 14.7 11,532.0 Rural/small town 151.9 95.7 0.81 9.9 9,125.0 School level Elementary 142.1 115.1 0.85 11.4 9,375.0 Secondary 211.2 160.0 0.67 10.9 13,164.0 Combined 439.1 256.5 2.96 23.6 8,337.0
Student enrollment Less than 100 281.1 195.6 3.15 16.6 5,850.0 100–199 232.9 181.7 2.58 24.6 6,595.0 200–499 151.2 98.1 1.03 11.3 8,583.0 500–749 244.1 230.6 0.98 20.9 10,847.0 750–999 527.5 509.3 2.04 31.8 12,886.0 1,000 or more 660.3 389.1 1.44 34.0 17,116.0
1 Includes total expenditure for books, video materials, CD-ROMs, current print or microform periodicals, and electronic subscriptions.2 Amount spent for rental or purchase of books.
Table A6a. Standard errors for average library expenditures and book holdings for public school library media centers, by state and selected
NOTE: These estimates are for traditional public schools. Traditional public schools include all public schools in the United States except public charter schools.SOURCE: U.S. Department of Education, National Center for Education Statistics, Schools and Staffing Survey, "Public School Library Media Center Questionnaire," 1999–2000.
73

Table A6b. 1999–2000
Percentage of library Average number of Average number ofAverage library Average book expenditures books acquired of books held at
Selected characteristics expenditures1 expenditures2 spent on books2 during 1998-1999 end of 1998-1999
Total $198.6 $158.2 1.72 12.2 227.6
Affiliation Catholic 178.8 68.7 2.42 11.7 250.3 Friends 1,891.9 1047.0 1.78 89.5 2,199.3 Episcopal 1,218.9 659.7 1.47 56.6 725.3 Hebrew Day 565.6 454.8 2.73 38.1 735.4 Solomon Schechter 674.9 361.0 3.50 32.2 609.5 Other Jewish 687.3 452.7 4.45 43.7 644.1 Lutheran, Missouri Synod 350.3 287.9 6.64 62.0 398.7 Lutheran, Wisconsin Synod 246.6 120.1 4.50 10.5 331.8 Evangelical Lutheran 119.8 105.1 1.33 26.4 767.9 Other Lutheran — — — — — Seventh-Day Adventist 187.0 129.0 3.63 30.8 390.8 Christian Schools International 404.7 270.3 2.81 49.2 3,179.0 American Association of Christian Schools 1,184.4 1116.0 13.65 107.4 1,158.1 Association of Christian Schools International 641.8 554.1 6.66 67.2 510.3 National Association of Private Schools for Exceptional Children 1,779.6 948.0 3.76 81.9 1,538.3 Montessori 293.2 219.3 5.18 35.9 940.5 Independent Schools 571.1 419.3 1.04 22.2 745.0 National Independent Private School Association — — — — — Other 767.2 710.6 6.61 41.1 796.3
NCES typology Catholic 18.8 68.7 2.42 11.7 250.3 Parochial 151.0 81.6 3.32 16.5 231.9 Diocesan 199.5 158.4 1.66 25.1 703.3 Private 1,384.0 306.6 4.96 46.6 483.1
Other religious 424.6 403.6 4.05 21.1 410.4 Conservative Christian 447.3 392.0 5.23 50.4 415.3 Affiliated 990.9 998.0 8.10 27.3 948.1 Unaffiliated 282.5 195.6 2.92 32.8 360.2
Nonsectarian 491.0 300.7 1.78 37.3 603.5 Regular 949.1 586.1 2.06 60.2 1,115.8 Special emphasis 577.3 346.9 3.28 45.0 883.2 Special education 491.6 356.0 4.33 30.8 605.0
All members of National Association of Independent Schools 1,175.5 435.5 3.14 26.4 737.5
See footnotes at end of table.
Table A6b. Standard errors for average library expenditures and book holdings for private school library media centers, by affiliation and selected characteristics:
74

Table A6b. 1999–2000—Continued
Percentage of library Average number of Average number ofAverage library Average book expenditures books acquired of books held at
Selected characteristics expenditures1 expenditures2 spent on books2 during 1998-1999 end of 1998-1999
Region Northeast $347.9 $160.2 2.56 13.2 260.2 Midwest 135.4 97.5 1.93 13.6 427.7 South 553.7 518.5 3.87 33.3 405.7 West 280.5 188.9 1.73 27.7 805.1
Community type Central city 210.9 120.7 1.60 20.2 241.9 Urban fringe/large town 436.6 395.2 3.56 18.0 397.9 Rural/small town 305.8 258.3 3.01 29.5 781.5
School level Elementary 268.6 239.4 3.01 13.4 202.2 Secondary 434.3 244.0 1.31 14.2 719.9 Combined 326.3 233.0 2.37 31.8 662.8
Student enrollment Less than 100 107.1 91.4 3.69 21.1 220.5 100–199 593.9 578.4 7.28 26.7 416.9 200–499 237.3 162.6 2.71 17.6 320.1 500–749 486.2 349.2 1.40 38.6 1,538.6 750–999 697.7 329.4 1.35 40.9 1,018.8 1,000 or more 1,312.1 742.4 1.26 51.3 918.0
— Not available.1 Includes total expenditure for books, video materials, CD-ROMs, current print or microform periodicals, and electronic subscriptions.2 Amount spent for rental or purchase of books.
Table A6b. Standard errors for average library expenditures and book holdings for private school library media centers, by affiliation and selected characteristics:
SOURCE: U.S. Department of Education, National Center for Education Statistics, Schools and Staffing Survey (SASS), "Private School Library Media Center Questionnaire," 1999–2000.
75

Table A7a. selected characteristics: 1999–2000
State and Average Averageselected Number Percentage number Average Number Percentage number Averagecharacteristics of schools of schools per school expenditures of schools of schools per school expenditures
50 States and DC 586.3 0.64 1.8 $11.4 489.0 0.46 5.0 $12.8 Alabama 40.0 2.98 9.1 38.0 22.0 1.16 32.5 73.3 Alaska 15.6 2.46 4.0 62.0 16.4 1.55 10.4 50.5 Arizona 58.7 4.27 3.5 57.0 71.8 2.37 27.0 49.8 Arkansas 43.9 3.90 2.4 50.4 20.1 1.64 22.4 58.9 California 253.8 3.26 2.9 39.1 243.3 3.08 26.9 46.4
Colorado 37.6 2.17 8.6 58.3 46.5 2.91 29.2 43.1 Connecticut 25.6 2.27 5.6 87.1 27.0 2.36 21.6 49.5 Delaware 9.4 2.67 19.1 34.5 9.3 2.18 19.0 86.2 District of Columbia 6.2 3.73 3.4 28.8 4.4 1.94 6.2 19.4 Florida 57.2 1.65 12.8 33.3 43.8 0.35 40.0 76.0
Georgia 45.4 1.72 8.2 92.0 33.7 0.00 31.1 68.1 Hawaii 4.0 1.50 16.1 36.5 2.6 0.74 23.5 32.7 Idaho 16.9 2.86 3.6 26.0 13.2 1.71 6.9 21.6 Illinois 151.4 3.60 4.2 29.1 135.5 2.70 23.1 38.8 Indiana 84.4 4.22 3.6 46.2 37.6 1.23 29.4 100.6
Iowa 45.3 2.83 4.0 32.6 47.9 3.14 16.3 37.9 Kansas 46.7 2.95 3.0 75.1 41.1 2.78 19.7 57.7 Kentucky 41.2 2.52 3.4 47.8 36.7 0.89 20.1 58.9 Louisiana 74.1 4.95 8.8 64.8 69.8 2.89 23.5 59.5 Maine 34.3 5.23 4.1 22.0 19.8 2.26 12.6 59.5
Maryland 46.9 3.43 13.3 59.3 43.1 3.19 40.0 65.6 Massachusetts 77.9 3.84 6.5 50.5 68.0 3.06 18.1 45.3 Michigan 152.8 3.57 9.6 73.5 141.2 3.03 31.9 56.9 Minnesota 120.3 3.57 12.5 48.4 121.0 2.01 30.2 104.5 Mississippi 28.3 2.73 3.7 39.1 15.3 0.73 17.3 37.9
Missouri 95.6 3.61 4.7 60.0 83.0 2.84 62.1 127.7 Montana 24.0 2.76 2.5 25.7 29.9 2.48 18.3 38.3 Nebraska 50.0 2.18 5.0 54.6 53.7 2.47 37.8 34.0 Nevada 18.1 3.31 2.1 50.5 13.3 1.96 13.5 49.5 New Hampshire 27.2 5.77 6.9 176.6 17.9 2.72 22.9 98.5
New Jersey 79.7 3.92 5.1 35.7 47.8 1.39 19.5 72.7 New Mexico 43.9 6.35 41.9 105.3 42.5 6.10 27.8 47.8 New York 120.9 3.25 4.6 52.7 96.1 1.62 22.6 61.3 North Carolina 70.7 2.65 18.4 172.0 52.4 0.34 39.1 69.3 North Dakota 19.9 2.88 10.5 27.8 16.4 2.09 20.4 69.9
See footnotes at end of table.
Table A7a. Standard errors for number and percentage of public school library media centers with CD-ROMs or video materials, by state and
CD-ROMs Video materials1
76
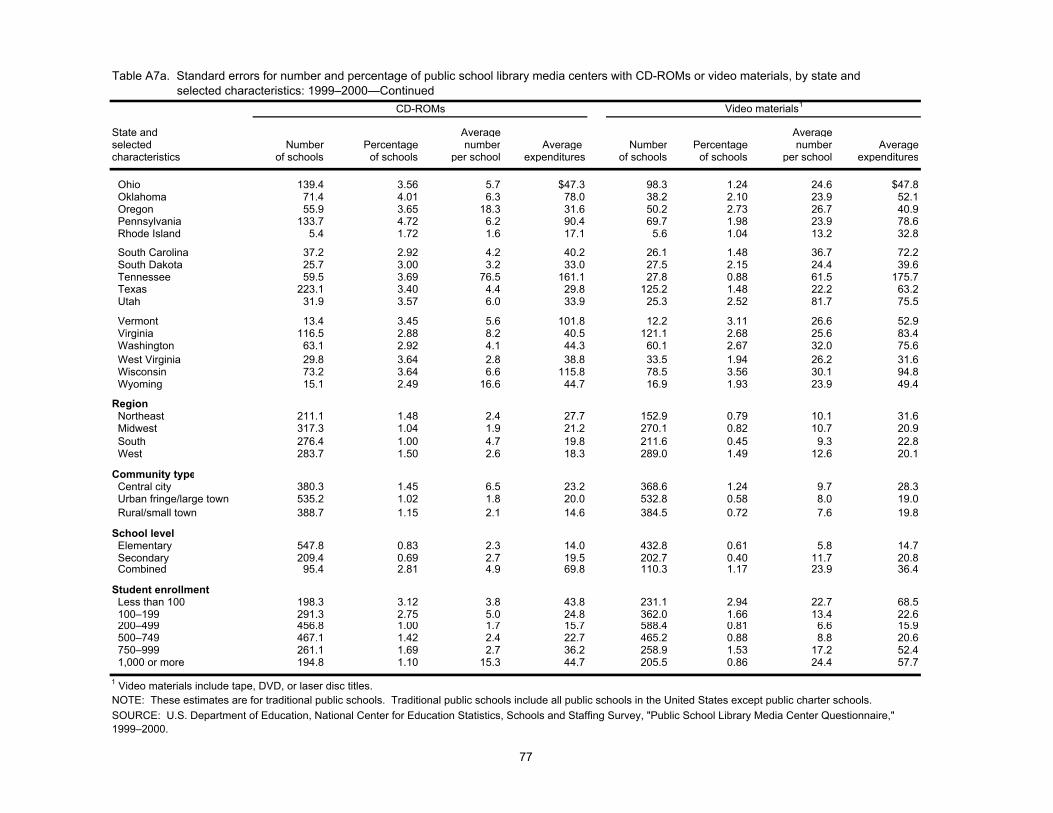
Table A7a. selected characteristics: 1999–2000—Continued
State and Average Averageselected Number Percentage number Average Number Percentage number Averagecharacteristics of schools of schools per school expenditures of schools of schools per school expenditures
Ohio 139.4 3.56 5.7 $47.3 98.3 1.24 24.6 $47.8 Oklahoma 71.4 4.01 6.3 78.0 38.2 2.10 23.9 52.1 Oregon 55.9 3.65 18.3 31.6 50.2 2.73 26.7 40.9 Pennsylvania 133.7 4.72 6.2 90.4 69.7 1.98 23.9 78.6 Rhode Island 5.4 1.72 1.6 17.1 5.6 1.04 13.2 32.8
South Carolina 37.2 2.92 4.2 40.2 26.1 1.48 36.7 72.2 South Dakota 25.7 3.00 3.2 33.0 27.5 2.15 24.4 39.6 Tennessee 59.5 3.69 76.5 161.1 27.8 0.88 61.5 175.7 Texas 223.1 3.40 4.4 29.8 125.2 1.48 22.2 63.2 Utah 31.9 3.57 6.0 33.9 25.3 2.52 81.7 75.5
Vermont 13.4 3.45 5.6 101.8 12.2 3.11 26.6 52.9 Virginia 116.5 2.88 8.2 40.5 121.1 2.68 25.6 83.4 Washington 63.1 2.92 4.1 44.3 60.1 2.67 32.0 75.6 West Virginia 29.8 3.64 2.8 38.8 33.5 1.94 26.2 31.6 Wisconsin 73.2 3.64 6.6 115.8 78.5 3.56 30.1 94.8 Wyoming 15.1 2.49 16.6 44.7 16.9 1.93 23.9 49.4
Region Northeast 211.1 1.48 2.4 27.7 152.9 0.79 10.1 31.6 Midwest 317.3 1.04 1.9 21.2 270.1 0.82 10.7 20.9 South 276.4 1.00 4.7 19.8 211.6 0.45 9.3 22.8 West 283.7 1.50 2.6 18.3 289.0 1.49 12.6 20.1
Community type Central city 380.3 1.45 6.5 23.2 368.6 1.24 9.7 28.3 Urban fringe/large town 535.2 1.02 1.8 20.0 532.8 0.58 8.0 19.0 Rural/small town 388.7 1.15 2.1 14.6 384.5 0.72 7.6 19.8 School level Elementary 547.8 0.83 2.3 14.0 432.8 0.61 5.8 14.7 Secondary 209.4 0.69 2.7 19.5 202.7 0.40 11.7 20.8 Combined 95.4 2.81 4.9 69.8 110.3 1.17 23.9 36.4
Student enrollment Less than 100 198.3 3.12 3.8 43.8 231.1 2.94 22.7 68.5 100–199 291.3 2.75 5.0 24.8 362.0 1.66 13.4 22.6 200–499 456.8 1.00 1.7 15.7 588.4 0.81 6.6 15.9 500–749 467.1 1.42 2.4 22.7 465.2 0.88 8.8 20.6 750–999 261.1 1.69 2.7 36.2 258.9 1.53 17.2 52.4 1,000 or more 194.8 1.10 15.3 44.7 205.5 0.86 24.4 57.7
1 Video materials include tape, DVD, or laser disc titles.NOTE: These estimates are for traditional public schools. Traditional public schools include all public schools in the United States except public charter schools.SOURCE: U.S. Department of Education, National Center for Education Statistics, Schools and Staffing Survey, "Public School Library Media Center Questionnaire," 1999–2000.
CD-ROMs Video materials1
Table A7a. Standard errors for number and percentage of public school library media centers with CD-ROMs or video materials, by state and
77

Table A7b. characteristics: 1999–2000
Number Percentage Average Number Percentage AverageSelected characteristics of schools of schools expenditures of schools of schools expenditures
Total 305.3 1.52 $14.3 291.5 0.99 $13.2
Affiliation Catholic 134.3 1.63 21.4 109.3 1.22 19.7 Friends 7.3 11.88 48.1 8.9 14.77 128.2 Episcopal 23.6 6.72 51.8 28.8 3.17 85.9 Hebrew Day 11.3 7.60 20.5 14.9 7.09 22.9 Solomon Schechter 1.3 2.39 14.4 1.1 1.67 33.8 Other Jewish 18.1 5.98 124.4 21.0 5.55 67.7 Lutheran, Missouri Synod 38.0 4.55 86.1 46.0 4.63 44.3 Lutheran, Wisconsin Synod 7.7 3.94 59.1 12.9 5.06 118.4 Evangelical Lutheran 3.1 3.02 20.7 4.4 3.15 11.2 Other Lutheran — — — — — — Seventh-Day Adventist 34.9 6.40 24.3 45.9 4.03 45.5 Christian Schools International 34.0 4.72 19.6 36.7 3.87 39.1 American Association of Christian Schools 39.8 6.69 9.6 55.4 5.82 63.0 Association of Christian Schools International 84.1 4.21 24.3 99.1 2.37 68.5 National Association of Private Schools for Exceptional Children 13.6 16.87 149.5 46.8 7.66 166.7 Montessori 58.5 7.61 16.3 72.8 6.53 25.0 Independent Schools 14.5 2.16 40.6 12.1 1.57 64.3 National Independent Private School Association — — — — — — Other 238.7 4.98 37.2 236.5 3.37 41.8
NCES typology Catholic 134.3 1.63 21.4 109.3 1.22 19.7 Parochial 86.7 2.05 29.6 73.1 1.32 21.8 Diocesan 78.5 3.09 27.0 75.2 2.30 29.7 Private 50.1 3.80 102.7 46.5 3.25 101.8
Other religious 141.0 2.05 14.6 196.0 1.92 24.7 Conservative Christian 116.0 3.59 16.3 131.5 2.50 54.8 Affiliated 75.3 3.16 28.0 113.2 3.73 30.1 Unaffiliated 73.7 3.86 38.7 103.6 4.03 47.9
Nonsectarian 209.8 3.98 36.7 188.8 2.74 35.8 Regular 161.1 5.33 59.8 160.2 4.60 63.5 Special emphasis 99.5 5.74 15.7 100.7 4.23 27.4 Special education 64.8 8.09 109.2 77.1 5.88 66.8
All members of National Association of Independent Schools 29.9 1.92 38.8 33.5 1.58 66.3
See footnotes at end of table.
Table A7b. Standard errors for number and percentage of private school library media centers with CD-ROMs or video materials, by affiliation and selected
CD-ROMs Video materials1
78

Table A7b. characteristics: 1999–2000—Continued
Number Percentage Average Number Percentage AverageSelected characteristics of schools of schools expenditures of schools of schools expenditures
Region Northeast 149.3 2.38 $23.5 147.5 1.87 $32.7 Midwest 162.2 2.86 23.1 160.0 2.43 22.9 South 151.1 2.64 18.8 194.8 2.27 27.6 West 138.4 3.31 47.0 148.3 1.91 45.6
Community type Central city 260.4 2.54 21.4 254.3 1.68 23.1 Urban fringe/large town 174.5 1.91 17.5 200.0 1.89 17.7 Rural/small town 96.9 3.35 22.2 128.4 3.30 32.7
School level Elementary 244.6 1.90 17.2 223.3 1.53 12.6 Secondary 82.3 2.55 46.7 85.5 1.30 45.2 Combined 127.4 2.50 22.6 153.9 1.67 40.2
Student enrollment Less than 100 205.0 3.61 17.2 233.2 2.65 30.3 100–199 143.8 2.48 30.5 167.5 2.79 26.7 200–499 152.1 1.90 23.6 193.4 1.40 21.9 500–749 49.4 2.23 38.9 54.7 1.51 56.5 750–999 31.5 2.99 72.3 32.2 2.96 121.9 1,000 or more 25.6 1.47 86.9 25.8 2.19 144.5
— Not available.1 Video materials include tape, DVD, or laser disc titles.
NOTE: Detail may not sum to totals because of rounding.SOURCE: U.S. Department of Education, National Center for Education Statistics, Schools and Staffing Survey (SASS), "Private School Library Media Center Questionnaire," 1999–2000.
CD-ROMs Video materials1
Table A7b. Standard errors for number and percentage of private school library media centers with CD-ROMs or video materials, by affiliation and selected
79

Table A8a. centers, by state and selected characteristics: 1999–2000
State and Percentage of library Percentage of library Percentage of library Percentage Percentageselected media centers having media centers having media centers having Percentage once every varies bycharacteristics flexible schedule fixed schedule combination scheduling weekly 2 weeks grade level
50 States and DC 0.63 0.81 0.60 0.74 0.43 0.76
Alabama 2.95 3.86 4.27 3.85 3.01 2.67 Alaska 2.97 3.17 3.00 2.91 1.33 2.68 Arizona 3.41 3.92 3.87 4.52 1.78 4.07 Arkansas 3.15 3.66 3.81 4.71 1.41 4.28 California 2.49 3.97 3.05 3.27 1.03 3.12
Colorado 3.47 3.79 3.61 4.39 4.20 3.26 Connecticut 3.61 3.75 2.68 3.55 — 3.55 Delaware 4.57 5.04 4.68 5.02 3.01 4.60 District of Columbia 2.96 3.39 2.80 2.89 — 2.50 Florida 3.79 4.00 2.47 3.69 3.62 1.62
Georgia 3.32 3.41 2.71 4.55 2.63 4.27 Hawaii 2.61 3.90 3.35 4.35 3.68 3.72 Idaho 2.74 2.61 1.82 1.54 0.71 1.46 Illinois 3.36 3.36 2.79 3.48 1.02 3.34 Indiana 2.93 4.21 3.38 4.01 3.67 2.18
Iowa 3.80 2.92 3.24 4.14 1.12 4.04 Kansas 4.12 4.22 2.98 3.39 1.74 2.92 Kentucky 2.60 3.88 3.38 3.15 2.47 2.06 Louisiana 4.94 5.50 5.45 4.83 3.80 2.69 Maine 3.10 4.99 4.12 3.78 1.34 3.52
Maryland 3.97 5.27 3.61 5.83 5.13 5.07 Massachusetts 3.79 4.70 4.26 4.53 2.15 4.32 Michigan 3.41 3.07 3.44 4.98 2.98 4.02 Minnesota 4.21 5.32 5.94 7.63 2.61 7.82 Mississippi 2.00 2.31 2.06 3.07 1.80 2.41
Missouri 3.70 4.37 5.08 5.78 1.27 5.61 Montana 3.29 2.75 3.02 3.27 1.57 2.87 Nebraska 3.90 3.14 3.41 3.10 — 2.96 Nevada 2.60 3.24 2.42 2.86 2.25 1.78 New Hampshire 4.13 6.49 6.49 4.58 3.16 3.51
New Jersey 2.21 3.52 3.13 3.79 3.35 2.37 New Mexico 4.92 5.14 6.65 7.35 2.09 7.06 New York 2.58 3.13 2.93 4.75 2.02 3.90 North Carolina 4.91 4.65 4.77 5.37 4.63 2.88 North Dakota 3.30 2.97 3.40 2.73 — 2.73
See footnotes at end of table.
Table A8a. Standard errors for percentage distribution of types of library schedules and frequency of regularly scheduled class visits by public school library media
Percentage distribution by type of scheduling Frequency of regularly scheduled class visits1
80

Table A8a. centers, by state and selected characteristics: 1999–2000—Continued
State and Percentage of library Percentage of library Percentage of library Percentage Percentageselected media centers having media centers having media centers having Percentage once every varies bycharacteristics flexible schedule fixed schedule combination scheduling weekly 2 weeks grade level
Ohio 2.62 3.89 3.14 2.90 1.85 2.16 Oklahoma 3.77 3.63 3.86 5.22 2.95 4.88 Oregon 3.47 5.26 4.34 5.16 3.58 3.77 Pennsylvania 4.67 5.18 5.11 4.46 2.64 4.13 Rhode Island 1.70 1.82 1.20 1.34 1.13 — South Carolina 3.60 4.71 4.90 4.85 3.62 4.15 South Dakota 3.42 2.66 3.27 3.29 — 3.21 Tennessee 3.66 5.07 3.79 5.06 4.15 3.93 Texas 3.09 3.53 3.41 3.64 2.08 3.57 Utah 4.05 4.38 3.32 4.60 — 4.60
Vermont 4.23 4.73 4.24 3.40 2.16 3.23 Virginia 3.57 4.40 3.84 3.78 2.30 3.02 Washington 2.80 3.76 3.61 3.28 1.35 3.14 West Virginia 4.20 4.94 2.95 3.93 — 3.39 Wisconsin 3.45 5.86 4.49 3.26 — 3.19 Wyoming 3.35 3.43 3.68 4.75 3.04 4.54Region Northeast 1.61 1.83 1.62 1.73 1.01 1.47 Midwest 1.18 1.34 1.08 1.39 0.69 1.25 South 1.13 1.32 1.06 1.37 0.91 1.22 West 1.10 1.73 1.34 1.54 0.64 1.52Community type Central city 1.34 1.42 1.36 1.56 0.89 1.61 Urban fringe/large town 0.97 1.14 0.86 1.08 0.67 1.00 Rural/small town 1.05 1.31 1.13 1.21 0.58 1.09
School level Elementary 0.80 1.04 0.78 0.80 0.48 0.84 Secondary 0.81 0.64 0.73 1.44 1.04 1.52 Combined 2.73 1.42 2.62 3.24 0.83 3.19
Student enrollment Less than 100 3.39 3.46 3.41 4.34 1.28 4.17 100–199 2.40 2.84 2.46 2.79 0.95 2.77 200–499 1.07 1.24 0.97 0.96 0.44 0.95 500–749 1.28 1.63 1.63 1.30 1.00 1.31 750–999 2.12 2.35 1.88 2.58 2.03 1.79 1,000 or more 1.50 1.49 1.19 2.61 2.29 2.13
— Not available.1 For library media centers with regular and combined schedules.
Percentage distribution by type of scheduling Frequency of regularly scheduled class visits1
NOTE: These estimates are for traditional public schools. Traditional public schools include all public schools in the United States except public charter schools. Detail may not sum to totals because of rounding.SOURCE: U.S. Department of Education, National Center for Education Statistics, Schools and Staffing Survey, "Public School Library Media Center Questionnaire," 1999–2000.
Table A8a. Standard errors for percentage distribution of types of library schedules and frequency of regularly scheduled class visits by public school library media
81

Percentage of library Percentage of library Percentage of library Percentage Percentagemedia centers have media centers have media centers have Percentage once every varies by
Selected characteristics flexible schedule fixed schedule combination scheduling weekly 2 weeks grade level
Total 1.15 1.16 0.95 1.01 0.34 0.93
Affiliation Catholic 1.16 1.35 1.32 1.32 0.64 1.33 Friends 11.37 4.71 7.44 3.62 — 3.62 Episcopal 4.40 6.44 5.60 4.56 — 4.56 Hebrew Day 7.06 8.67 6.02 9.00 4.43 9.19 Solomon Schechter 1.93 2.52 2.74 4.60 1.47 4.61 Other Jewish 6.77 3.78 6.77 6.98 0.74 7.17 Lutheran, Missouri Synod 4.73 5.27 3.87 4.60 — 4.60 Lutheran, Wisconsin Synod 4.20 4.41 5.75 6.14 — 6.14 Evangelical Lutheran 2.41 3.24 3.23 2.72 — 2.63 Other Lutheran — — — — — — Seventh-Day Adventist 7.28 6.99 4.60 7.66 — 7.66 Christian Schools International 3.33 5.82 5.59 4.70 — 4.70 American Association of Christian Schools 5.34 6.71 7.42 9.10 — 8.91 Association of Christian Schools International 4.47 4.11 4.09 4.36 — 4.36 National Association of Private Schools for — Exceptional Children 10.00 16.76 9.46 24.45 — 26.02 Montessori 4.93 3.70 3.22 9.22 — 9.22 Independent Schools 2.03 2.16 2.92 3.47 — 3.42 National Independent Private School Association — — — — — — Other 4.18 3.58 3.06 3.27 — 3.27
NCES typology Catholic 1.16 1.35 1.32 1.32 0.64 1.33 Parochial 1.38 2.15 1.97 1.57 0.58 1.51 Diocesan 2.19 2.56 2.67 2.64 0.84 2.61 Private 4.66 3.32 3.87 6.82 — 7.05
Other religious 1.84 2.10 1.76 2.08 0.31 1.99 Conservative Christian 3.30 3.40 3.24 3.64 — 3.56 Affiliated 3.38 3.85 2.61 2.98 0.33 2.89 Unaffiliated 3.83 3.99 2.77 4.11 — 4.10
Nonsectarian 3.97 3.18 3.15 3.86 0.18 3.84 Regular 6.01 4.23 5.15 5.21 — 5.17 Special emphasis 5.33 5.24 3.26 6.81 — 6.80 Special education 6.60 6.79 4.51 11.33 — 11.40
All members of National Association of Independent Schools 2.56 2.15 3.11 3.15 — 3.13
See footnotes at end of table.
Table A8b. Standard errors for percentage distribution of types of library schedules and frequency of regularly scheduled class visits by private school library media
Type of scheduling Frequency of regularly scheduled class visits1
Table A8b. centers, by affiliation and selected characteristics:
82
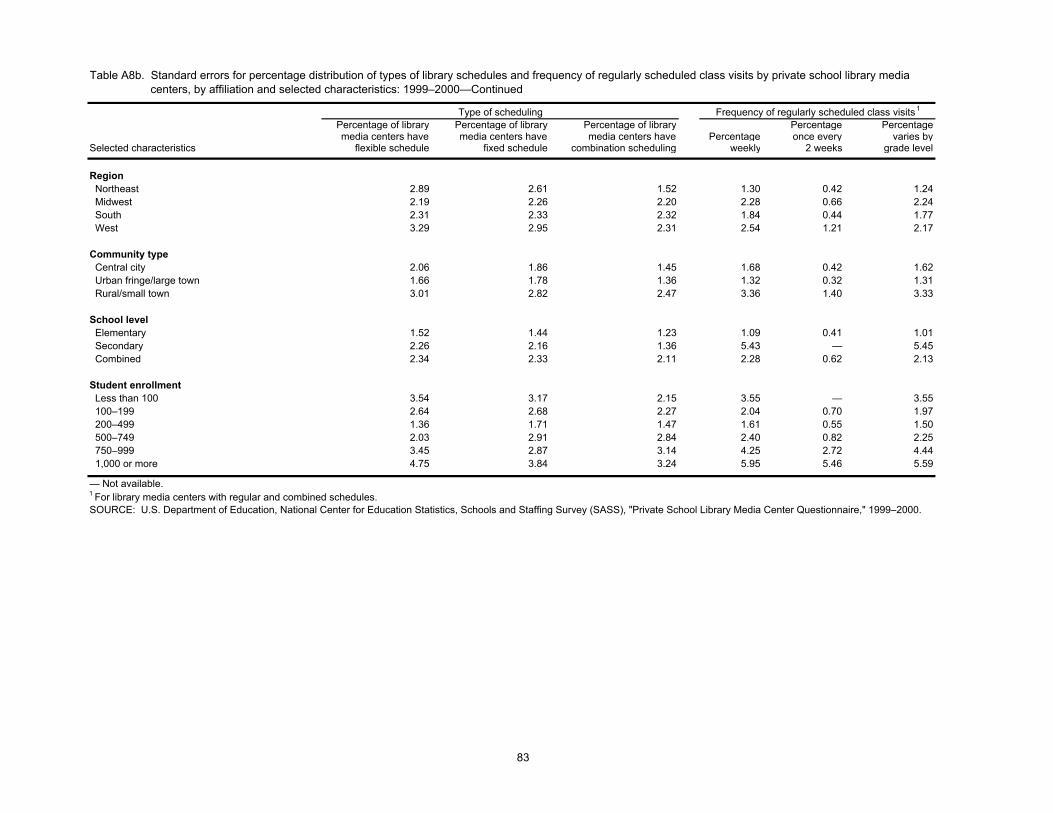
Percentage of library Percentage of library Percentage of library Percentage Percentagemedia centers have media centers have media centers have Percentage once every varies by
Selected characteristics flexible schedule fixed schedule combination scheduling weekly 2 weeks grade level
Region Northeast 2.89 2.61 1.52 1.30 0.42 1.24 Midwest 2.19 2.26 2.20 2.28 0.66 2.24 South 2.31 2.33 2.32 1.84 0.44 1.77 West 3.29 2.95 2.31 2.54 1.21 2.17
Community type Central city 2.06 1.86 1.45 1.68 0.42 1.62 Urban fringe/large town 1.66 1.78 1.36 1.32 0.32 1.31 Rural/small town 3.01 2.82 2.47 3.36 1.40 3.33
School level Elementary 1.52 1.44 1.23 1.09 0.41 1.01 Secondary 2.26 2.16 1.36 5.43 — 5.45 Combined 2.34 2.33 2.11 2.28 0.62 2.13
Student enrollment Less than 100 3.54 3.17 2.15 3.55 — 3.55 100–199 2.64 2.68 2.27 2.04 0.70 1.97 200–499 1.36 1.71 1.47 1.61 0.55 1.50 500–749 2.03 2.91 2.84 2.40 0.82 2.25 750–999 3.45 2.87 3.14 4.25 2.72 4.44 1,000 or more 4.75 3.84 3.24 5.95 5.46 5.59
— Not available.1 For library media centers with regular and combined schedules.
Type of scheduling Frequency of regularly scheduled class visits1
SOURCE: U.S. Department of Education, National Center for Education Statistics, Schools and Staffing Survey (SASS), "Private School Library Media Center Questionnaire," 1999–2000.
Table A8b. Standard errors for percentage distribution of types of library schedules and frequency of regularly scheduled class visits by private school library media Table A8b. centers, by affiliation and selected characteristics: 1999–2000—Continued
83

Number of libraries Percentage of librariesState and with set times when with set times when when students can use the library independently 1
selected students can use the students can use the Before or During During set times Between classescharacteristics library Independently library Independently after school lunch break throughout the day or during recess
50 States and DC 572.1 0.73 1.40 1.33 1.06 1.24
Alabama 40.2 3.04 8.41 4.84 6.03 7.46 Alaska 11.2 2.64 3.75 3.37 3.91 3.92 Arizona 50.1 4.33 9.13 9.36 5.96 7.26 Arkansas 37.2 3.39 6.16 5.04 5.33 6.40 California 276.6 4.30 4.35 5.71 4.98 5.23
Colorado 56.7 4.26 8.75 8.99 7.15 7.95 Connecticut 28.3 3.08 4.76 5.57 5.55 5.65 Delaware 6.9 4.52 6.77 — 7.15 6.57 District of Columbia 5.5 4.27 3.18 3.54 3.03 4.16 Florida 65.5 2.70 6.12 5.11 4.41 5.51
Georgia 26.1 1.52 0.00 13.63 12.17 11.56 Hawaii 9.0 3.68 5.56 7.61 4.94 4.84 Idaho 11.7 2.06 4.33 3.97 3.89 4.22 Illinois 142.0 3.71 5.87 4.48 3.40 3.96 Indiana 87.4 5.04 7.22 6.08 5.94 6.89
Iowa 35.6 2.43 6.81 7.46 5.82 6.96 Kansas 53.4 3.85 8.43 5.96 5.02 9.89 Kentucky 40.4 3.47 5.97 3.90 6.31 6.27 Louisiana 74.3 5.72 9.47 7.79 6.29 10.00 Maine 23.2 3.93 6.38 4.95 4.49 4.88
Maryland 73.9 6.03 5.78 8.07 6.20 8.37 Massachusetts 79.2 4.89 6.06 4.06 4.81 4.10 Michigan 120.9 3.86 7.63 7.87 4.00 7.25 Minnesota 81.5 4.47 11.63 10.73 5.08 11.09 Mississippi 24.6 2.96 4.26 3.65 6.18 5.17
Missouri 97.8 5.31 11.21 6.10 8.81 10.81 Montana 23.2 2.81 6.27 4.88 2.89 6.66 Nebraska 51.1 4.14 6.56 4.15 5.27 5.69 Nevada 16.4 3.68 4.43 4.40 4.01 5.49 New Hampshire 21.8 4.97 10.42 5.80 11.65 12.78
New Jersey 86.0 4.01 6.40 5.41 4.09 5.03 New Mexico 41.6 6.00 8.59 6.52 5.60 8.07 New York 167.4 4.34 4.70 4.20 2.75 4.06 North Carolina 94.9 4.72 7.79 4.45 5.36 4.49 North Dakota 20.9 3.90 5.86 5.20 2.87 4.02
See footnotes at end of table.
Table A9a. Standard errors for number and percentage of public school library media centers with scheduled times that students can use the library
Percentage of school libraries offering set times
Table A9a. independently, by state and selected characteristics: 1999–2000
84
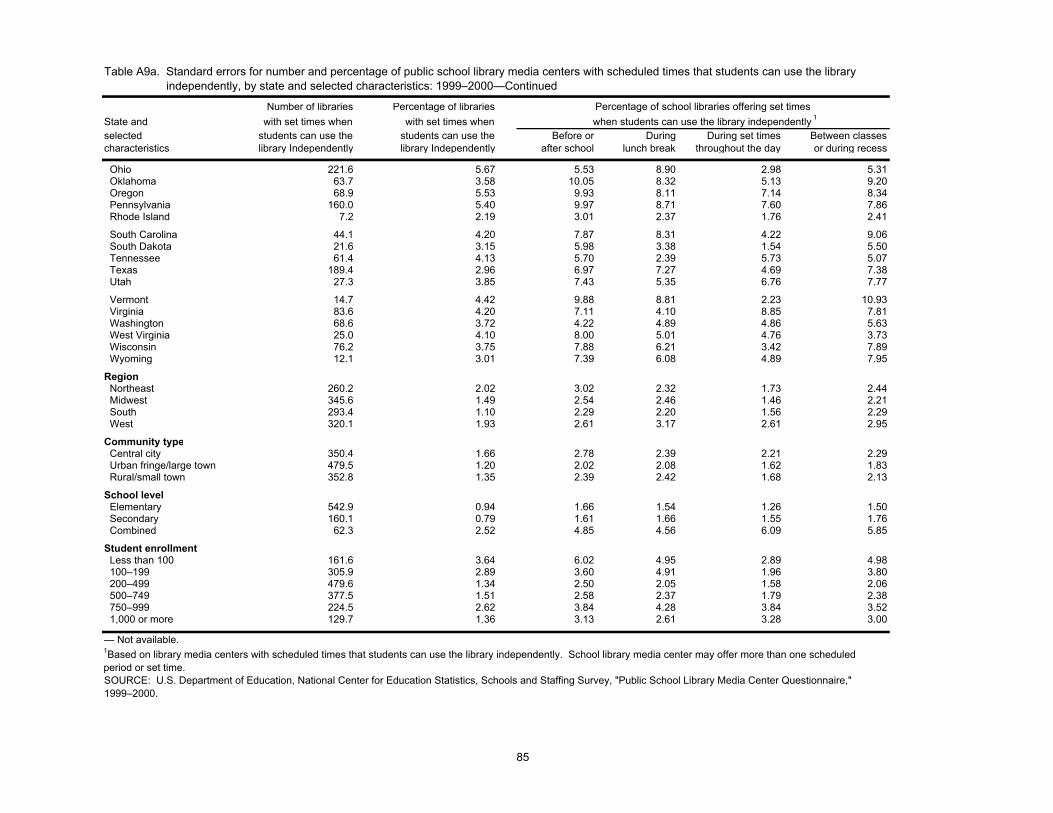
Number of libraries Percentage of librariesState and with set times when with set times when when students can use the library independently 1
selected students can use the students can use the Before or During During set times Between classescharacteristics library Independently library Independently after school lunch break throughout the day or during recess
Ohio 221.6 5.67 5.53 8.90 2.98 5.31 Oklahoma 63.7 3.58 10.05 8.32 5.13 9.20 Oregon 68.9 5.53 9.93 8.11 7.14 8.34 Pennsylvania 160.0 5.40 9.97 8.71 7.60 7.86 Rhode Island 7.2 2.19 3.01 2.37 1.76 2.41
South Carolina 44.1 4.20 7.87 8.31 4.22 9.06 South Dakota 21.6 3.15 5.98 3.38 1.54 5.50 Tennessee 61.4 4.13 5.70 2.39 5.73 5.07 Texas 189.4 2.96 6.97 7.27 4.69 7.38 Utah 27.3 3.85 7.43 5.35 6.76 7.77
Vermont 14.7 4.42 9.88 8.81 2.23 10.93 Virginia 83.6 4.20 7.11 4.10 8.85 7.81 Washington 68.6 3.72 4.22 4.89 4.86 5.63 West Virginia 25.0 4.10 8.00 5.01 4.76 3.73 Wisconsin 76.2 3.75 7.88 6.21 3.42 7.89 Wyoming 12.1 3.01 7.39 6.08 4.89 7.95
Region Northeast 260.2 2.02 3.02 2.32 1.73 2.44 Midwest 345.6 1.49 2.54 2.46 1.46 2.21 South 293.4 1.10 2.29 2.20 1.56 2.29 West 320.1 1.93 2.61 3.17 2.61 2.95
Community type Central city 350.4 1.66 2.78 2.39 2.21 2.29 Urban fringe/large town 479.5 1.20 2.02 2.08 1.62 1.83 Rural/small town 352.8 1.35 2.39 2.42 1.68 2.13 School level Elementary 542.9 0.94 1.66 1.54 1.26 1.50 Secondary 160.1 0.79 1.61 1.66 1.55 1.76 Combined 62.3 2.52 4.85 4.56 6.09 5.85
Student enrollment Less than 100 161.6 3.64 6.02 4.95 2.89 4.98 100–199 305.9 2.89 3.60 4.91 1.96 3.80 200–499 479.6 1.34 2.50 2.05 1.58 2.06 500–749 377.5 1.51 2.58 2.37 1.79 2.38 750–999 224.5 2.62 3.84 4.28 3.84 3.52 1,000 or more 129.7 1.36 3.13 2.61 3.28 3.00
— Not available.
Table A9a. Standard errors for number and percentage of public school library media centers with scheduled times that students can use the library
1Based on library media centers with scheduled times that students can use the library independently. School library media center may offer more than one scheduled period or set time.SOURCE: U.S. Department of Education, National Center for Education Statistics, Schools and Staffing Survey, "Public School Library Media Center Questionnaire," 1999–2000.
Table A9a. independently, by state and selected characteristics: 1999–2000—Continued
Percentage of school libraries offering set times
85

Number of libraries Percentage of libraries with set times when with set times when when students can use the library independently1
students can use the students can use the Before or During During set times Between classesSelected characteristics library Independently library Independently after school lunch break throughout the day or during recess
Total 285.5 1.53 1.85 1.49 1.51 1.54
Affiliation Catholic 123.1 1.57 2.22 1.93 1.79 2.07 Friends 3.5 5.89 4.76 4.77 4.14 4.78 Episcopal 18.3 5.58 10.27 9.72 0.00 5.94 Hebrew Day 14.2 8.07 10.75 10.57 10.62 10.50 Solomon Schechter 2.0 3.53 4.92 6.16 3.74 3.42 Other Jewish 16.6 6.55 5.25 7.50 9.14 9.21 Lutheran, Missouri Synod 45.5 4.56 7.39 5.70 4.68 5.76 Lutheran, Wisconsin Synod 10.0 4.71 6.14 4.19 0.00 7.14 Evangelical Lutheran 3.5 3.47 3.27 2.11 2.02 — Other Lutheran — — — — — — Seventh-Day Adventist 37.6 5.80 4.74 8.44 5.20 6.63 Christian Schools International 24.1 5.21 7.94 7.74 5.68 8.53 American Association of Christian Schools 48.8 6.30 7.98 7.32 4.61 7.80 Association of Christian Schools International 91.8 5.30 4.56 5.33 4.25 5.37 National Association of Private Schools for Exceptional Children 44.6 15.60 16.29 — 13.42 — Montessori 42.7 7.27 12.82 13.26 0.00 13.26 Independent Schools 14.3 2.02 4.83 8.15 5.17 8.03 National Independent Private School Association — — — — — — Other 217.6 4.76 5.35 4.65 4.87 4.68
NCES typology Catholic 123.1 1.57 2.22 1.93 1.79 2.07 Parochial 97.4 2.21 2.79 2.29 1.75 2.68 Diocesan 79.5 3.04 4.54 3.86 3.90 3.40 Private 34.6 4.27 8.10 8.29 3.88 6.63
Other religious 200.2 2.50 2.43 2.52 1.88 2.43 Conservative Christian 113.0 3.96 3.52 3.98 2.95 4.28 Affiliated 116.7 3.46 3.46 4.20 2.92 4.10 Unaffiliated 110.4 4.27 5.57 4.43 3.18 4.22
Nonsectarian 155.7 4.00 6.51 4.68 6.88 5.42 Regular 148.1 6.90 8.65 8.75 12.29 8.51 Special emphasis 59.6 6.53 9.61 8.89 5.98 9.95 Special education 56.6 6.20 4.86 3.25 3.52 3.37
All members of National Association of Independent Schools 17.0 2.02 4.92 6.98 4.98 7.58
See footnotes at end of table.
Table A9b. Standard errors for number and percentage of private school library media centers with scheduled times that students can use the library independently,
Percentage of school libraries offering set times
Table A9b. by affiliation and selected characteristics: 1999–2000
86

Number of libraries Percentage of libraries with set times when with set times whenstudents can use the students can use the Before or During During set times Between classes
Selected characteristics library Independently library Independently after school lunch break throughout the day or during recess
Region Northeast 118.1 2.46 3.16 3.12 2.48 2.50 Midwest 151.7 2.39 3.65 2.99 3.48 3.05 South 158.5 2.59 3.01 2.55 2.23 2.73 West 117.1 3.72 4.00 3.74 3.14 4.11
Community type Central city 201.9 2.18 2.84 2.55 2.21 2.14 Urban fringe/large town 181.7 2.10 2.66 2.48 2.28 2.49 Rural/small town 100.2 3.40 3.73 3.55 2.17 3.36
School level Elementary 231.3 2.14 2.26 1.81 2.07 1.91 Secondary 50.5 2.28 3.79 3.90 2.75 4.26 Combined 131.3 2.43 3.22 3.03 1.52 2.80
Student enrollment Less than 100 164.0 3.55 3.38 3.21 2.72 3.25 100–199 176.8 2.53 3.63 2.94 3.40 2.75 200–499 154.8 1.74 2.47 2.07 2.08 2.52 500–749 40.4 2.81 4.59 4.37 4.47 4.55 750–999 24.4 3.55 6.53 6.41 4.69 6.65 1,000 or more 10.6 3.43 4.22 5.37 5.46 6.81
— Not available.1 Based on Library Media Centers with scheduled times that students can use the library independently. School library media center may indicate more than one scheduled period or set timSOURCE: U.S. Department of Education, National Center for Education Statistics, Schools and Staffing Survey (SASS), "Private School Library Media Center Questionnaire," 1999–2000.
when students can use the library independently1Percentage of school libraries offering set times
Table A9b. Standard errors for number and percentage of private school library media centers with scheduled times that students can use the library independently, Table A9b. by affiliation and selected characteristics: 1999–2000—Continued
87

Table A10a. week and percentage of public school libraries with borrowing privileges for prekindergartners, kindergartners, and parents,Table A10a. by state and selected characteristics: 1999–2000
State and Average numberselected of library materialscharacteristics checked out1 Prekindergartners Kindergartners Parents
50 States and DC 9.1 0.50 0.71 0.59 Alabama 53.5 2.40 3.75 2.23 Alaska 49.0 2.94 3.01 1.73 Arizona 87.2 4.11 3.50 4.35 Arkansas 33.2 2.07 3.56 2.81 California 43.2 1.72 3.59 3.38
Colorado 24.9 3.01 3.99 2.60 Connecticut 33.6 2.98 3.32 1.58 Delaware 38.0 2.26 3.88 2.95 District of Columbia 19.9 2.64 4.02 3.25 Florida 57.0 2.27 3.71 2.03
Georgia 52.2 4.45 3.60 2.40 Hawaii 107.6 3.01 1.49 3.45 Idaho 48.8 1.73 2.14 1.74 Illinois 39.3 2.61 3.90 4.14 Indiana 42.6 3.02 3.58 4.10
Iowa 27.2 3.52 2.87 2.99 Kansas 39.7 3.45 2.95 1.86 Kentucky 46.8 2.90 2.97 2.94 Louisiana 42.8 4.03 5.88 3.82 Maine 26.5 2.07 3.87 3.46
Maryland 269.2 4.94 5.13 4.26 Massachusetts 25.8 1.96 4.84 3.72 Michigan 35.8 2.80 4.25 3.74 Minnesota 55.5 3.40 3.87 5.19 Mississippi 49.1 1.70 2.66 2.37
Missouri 44.8 4.43 4.30 4.50 Montana 19.3 2.65 2.99 1.92 Nebraska 43.1 2.88 3.12 2.00 Nevada 32.1 3.18 3.57 2.29 New Hampshire 35.9 3.04 6.22 4.73
New Jersey 37.0 1.89 3.80 2.78 New Mexico 76.6 5.12 5.76 3.05 New York 24.4 2.49 2.36 2.18 North Carolina 47.9 3.78 3.84 4.42 North Dakota 24.6 3.13 2.42 2.04
See footnotes at end of table.
Table A10a. Standard errors for average number of public school library books and other materials checked out during the most recent full
Percentage of school libraries with borrowing privileges for
88
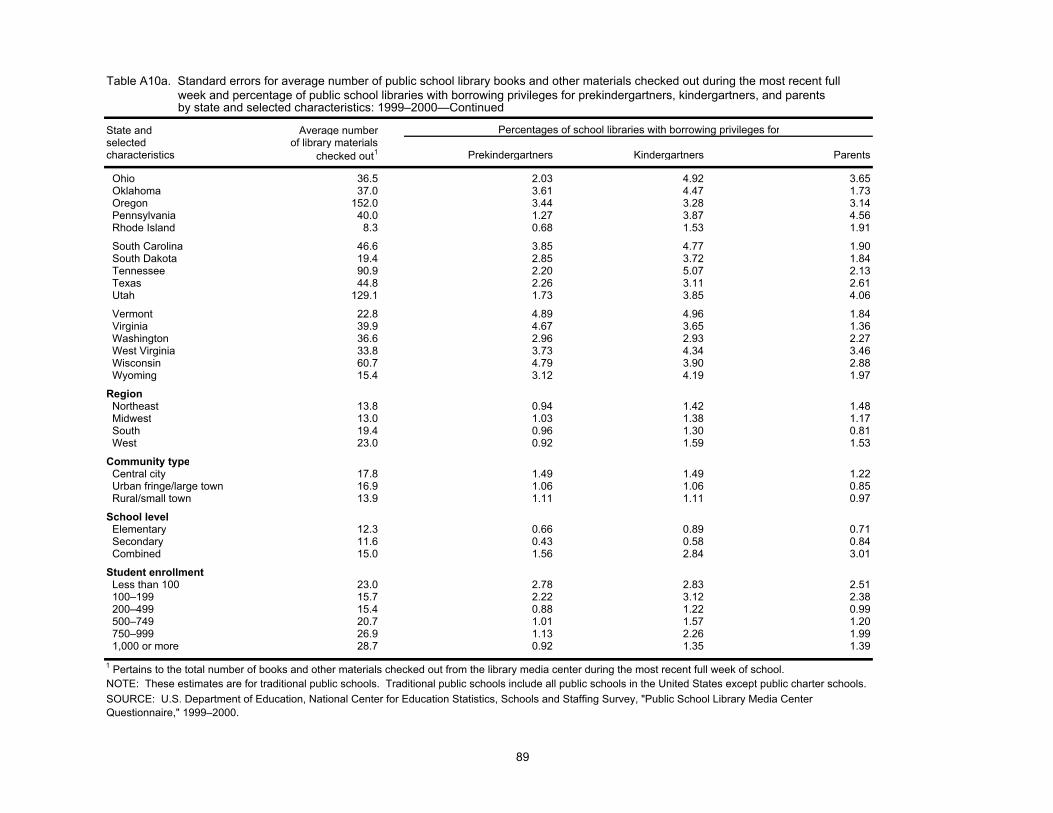
Table A10a. week and percentage of public school libraries with borrowing privileges for prekindergartners, kindergartners, and parentsTable A10a. by state and selected characteristics: 1999–2000—Continued
State and Average numberselected of library materialscharacteristics checked out1 Prekindergartners Kindergartners Parents
Ohio 36.5 2.03 4.92 3.65 Oklahoma 37.0 3.61 4.47 1.73 Oregon 152.0 3.44 3.28 3.14 Pennsylvania 40.0 1.27 3.87 4.56 Rhode Island 8.3 0.68 1.53 1.91
South Carolina 46.6 3.85 4.77 1.90 South Dakota 19.4 2.85 3.72 1.84 Tennessee 90.9 2.20 5.07 2.13 Texas 44.8 2.26 3.11 2.61 Utah 129.1 1.73 3.85 4.06
Vermont 22.8 4.89 4.96 1.84 Virginia 39.9 4.67 3.65 1.36 Washington 36.6 2.96 2.93 2.27 West Virginia 33.8 3.73 4.34 3.46 Wisconsin 60.7 4.79 3.90 2.88 Wyoming 15.4 3.12 4.19 1.97
Region Northeast 13.8 0.94 1.42 1.48 Midwest 13.0 1.03 1.38 1.17 South 19.4 0.96 1.30 0.81 West 23.0 0.92 1.59 1.53
Community type Central city 17.8 1.49 1.49 1.22 Urban fringe/large town 16.9 1.06 1.06 0.85 Rural/small town 13.9 1.11 1.11 0.97 School level Elementary 12.3 0.66 0.89 0.71 Secondary 11.6 0.43 0.58 0.84 Combined 15.0 1.56 2.84 3.01
Student enrollment Less than 100 23.0 2.78 2.83 2.51 100–199 15.7 2.22 3.12 2.38 200–499 15.4 0.88 1.22 0.99 500–749 20.7 1.01 1.57 1.20 750–999 26.9 1.13 2.26 1.99 1,000 or more 28.7 0.92 1.35 1.39
1 Pertains to the total number of books and other materials checked out from the library media center during the most recent full week of school.
Percentages of school libraries with borrowing privileges for
NOTE: These estimates are for traditional public schools. Traditional public schools include all public schools in the United States except public charter schools.SOURCE: U.S. Department of Education, National Center for Education Statistics, Schools and Staffing Survey, "Public School Library Media Center Questionnaire," 1999–2000.
Table A10a. Standard errors for average number of public school library books and other materials checked out during the most recent full
89

Table A10b. percentage of private school libraries with borrowing privileges for prekindergartners, kindergartners, and parents, by affiliation and selected
Average numberof library materials
Selected characteristics checked out per school1 Prekindergartners Kindergartners Parents
Total 10.6 1.33 1.12 1.03
Affiliation Catholic 6.4 1.18 1.42 1.43 Friends 44.4 7.06 4.98 1.76 Episcopal 27.5 4.84 5.31 6.34 Hebrew Day 20.9 3.14 7.67 8.22 Solomon Schechter 15.1 1.66 1.93 1.96 Other Jewish 30.5 4.71 4.99 5.33 Lutheran, Missouri Synod 61.4 4.60 5.86 3.84 Lutheran, Wisconsin Synod 8.7 4.71 2.70 0.21 Evangelical Lutheran 12.5 3.52 2.20 3.40 Other Lutheran — — — — Seventh-Day Adventist 12.3 5.88 5.87 3.95 Christian Schools International 297.5 5.24 3.76 3.29 American Association of Christian Schools 15.9 7.88 7.35 5.21 Association of Christian Schools International 22.8 3.57 3.63 3.37 National Association of Private Schools for Exceptional Children 38.3 9.10 14.54 13.98 Montessori 33.7 9.32 6.69 5.78 Independent Schools 12.7 2.51 2.20 1.84 National Independent Private School Association — — — — Other 28.9 4.08 3.35 3.91
NCES typology Catholic 6.4 1.18 1.42 1.43 Parochial 10.3 1.74 1.99 1.90 Diocesan 11.2 1.61 2.52 3.14 Private 10.9 3.35 4.66 3.29
Other religious 21.2 2.31 2.05 1.91 Conservative Christian 15.0 2.90 3.03 2.99 Affiliated 39.8 4.20 3.48 4.27 Unaffiliated 48.5 3.04 4.58 3.26
Nonsectarian 20.2 3.63 3.25 3.58 Regular 17.6 4.70 3.86 3.22 Special emphasis 61.3 8.10 7.47 7.26 Special education 8.6 4.56 7.75 8.40
All members of National Association of Independent Schools 12.5 2.73 2.61 2.10
See footnotes at end of table.
Table A10b. Standard errors for average number of private school library books and other materials checked out during the most recent full week and
Percentage of school libraries with borrowing privileges for
Table A10b. characteristics: 1999–2000
90

Table A10b. percentage of private school libraries with borrowing privileges for prekindergartners, kindergartners, and parents, by affiliation and selected
Average numberof library materials
Selected characteristics checked out per school1 Prekindergartners Kindergartners Parents
Region Northeast 8.0 2.55 1.99 2.10 Midwest 13.2 2.11 2.18 1.76 South 27.2 3.00 2.22 2.08 West 21.9 2.23 3.77 3.31
Community type Central city 17.5 1.84 1.83 1.85 Urban fringe/large town 13.7 1.88 1.75 1.88 Rural/small town 10.8 3.36 3.60 2.65
School level Elementary 13.7 1.86 1.45 1.47 Secondary 5.6 0.35 0.59 2.55 Combined 15.5 2.13 2.54 2.30
Student enrollment Less than 100 4.7 3.79 3.25 3.32 100–199 26.2 2.73 2.22 2.14 200–499 14.4 1.56 1.59 1.39 500–749 27.4 1.73 2.48 2.00 750–999 30.5 2.20 4.08 2.97 1,000 or more 33.7 4.97 4.99 3.66
— Not available.1 Pertains to the total number of books and other materials checked out from the library media center during the most recent full week of school.
Table A10b. Standard errors for average number of private school library books and other materials checked out during the most recent full week and
SOURCE: U.S. Department of Education, National Center for Education Statistics, Schools and Staffing Survey (SASS), "Private School Library Media Center Questionnaire," 1999–2000.
Percentages of school libraries with borrowing privileges for
Table A10b. characteristics: 1999–2000—Continued
91

92

93
Appendix B
Technical Notes

94

95
I. Overview of the Schools and Staffing Survey (SASS)
The Schools and Staffing Survey (SASS) is an integrated set of surveys sponsored by the National Center for Education Statistics (NCES). SASS was conducted in approximately 11,015 public and public charter schools nationwide, as well as about 3,500 private schools and 124 BIA-sponsored schools. SASS provides information about schools, principals, teachers, and library media centers and the general condition of America’s elementary, middle, and secondary schools. NCES initiated SASS in the mid-1980s in response to the need for information about basic conditions in schools as workplaces and learning environments. SASS has been conducted four times: in school years 1987–88, 1990–91, 1993–94, and in 1999–2000 by the U.S. Census Bureau. For each administration of SASS, NCES has reviewed the content to expand, retain, or delete topics covered in the previous administration. In this way, the survey’s capability for trend analysis is maintained, and new topics are added to address current concerns. The School Library Media Center Questionnaire was first added in the 1993–94 round of SASS. This report uses data from the 1999–2000 SASS public and private school datafiles and the public and private school library media center datafiles to focus on the relevant school and library media center components of the SASS. A more extensive description of the SASS can be found in the E.D. Tabs published in May 2002, Schools and Staffing Survey, 1999–2000: Overview of the Data for Public, Private, Public Charter, and Bureau of Indian Affairs Elementary and Secondary Schools (NCES 2002-313). The 1999–2000 SASS Library Media Center Questionnaires are used to collect data from school libraries regarding their facilities, staff, library expenditures, collection holdings, and policies. Copies of the full set of 1999–2000 SASS questionnaires may be obtained from the Schools and Staffing Survey home page on the World Wide Web at http://nces.ed.gov/surveys/sass.
II. Sampling Frames
Public Schools
The public school sampling frame was based on the 1997–98 school year Common Core of Data (CCD), a file of information collected annually by NCES from all state education agencies and believed to be the most complete public school listing available at the time of sample selection. The frame contains regular public schools and special purpose schools such as special education, vocational, and alternative schools. Schools funded by the Bureau of Indian Affairs and operated as public schools were included in the public school frame. The frame was enhanced with a list of schools operated by the Department of Defense. After the deletion of duplicate schools, schools outside of the United States, and schools that only teach

96
prekindergarten, kindergarten, or postsecondary students, 88,266 schools remained on the public school frame. Private Schools The sampling frame for private schools was the 1997–98 Private School Survey (PSS), updated with more current information from 1998–99 private school association lists (Broughman and Colaciello 1999). A list frame consisting of 28,164 schools was the primary private school frame. An area frame was taken from the 1997–98 PSS because there was no opportunity to update it prior to SASS data collection. The area frame consisted of 140 schools drawn from a sample of 3,142 counties throughout the nation, representing an estimated 1,760 schools.
The affiliation group for a school was determined in a hierarchical order; that is, if more than one definition applied, the school was classified into the first group that applied:
1) Military—membership in the Association of American Military Colleges and Schools;
2) Catholic—affiliation as Catholic or membership in the National Catholic Education Association or the Jesuit Secondary Education Association;
3) Friends—affiliation as Friends or membership in the Friends Council on Education;
4) Episcopal—affiliation as Episcopal or membership in the National Association of Episcopal Schools;
5) Hebrew Day—membership in the National Society for Hebrew Day Schools; 6) Solomon Schechter—membership in the Schechter Day Schools; 7) Other Jewish—any other Jewish affiliation; 8) Missouri Synod—membership in the Lutheran Church, Missouri Synod; 9) Wisconsin Synod—affiliation as Evangelical Lutheran, Wisconsin Synod or
membership in the Evangelical Lutheran Church, Wisconsin Synod; 10) Evangelical Lutheran—affiliation as Evangelical Lutheran Church in America
or membership in the Association of Evangelical Lutheran Churches; 11) Other Lutheran—any other Lutheran affiliation; 12) Seventh-Day Adventist—affiliation as Seventh-Day Adventist or membership
in the General Conference of Seventh-Day Adventist; 13) Christian Schools International—membership in Christian Schools
International; 14) American Association of Christian Schools—membership in the American
Association of Christian Schools; 15) Association of Christian Schools International—membership in the
Association of Christian Schools International;

97
16) National Association of Private Schools for Exceptional Children—membership in the National Association of Private Schools for Exceptional Children;
17) Montessori—membership in the American Montessori Society or other Montessori associations;
18) National Association of Independent Schools—membership in the National Association of Independent Schools;
19) National Independent Private School Association—membership in the National Independent Private School Association;
20) Other—no affiliation with or membership in any of the groups listed above. III. Data Collection Procedures
Data collection for the 1999–2000 SASS took place during the 1999–2000 school year. Each component began with a mail-out phase. This was followed by a second mailing, and additional nonresponse follow-up conducted by telephone from centralized telephone centers. Remaining nonrespondents were assigned to field staff, who obtained interviews by phone or personal visit.
IV. Sample Selection Procedures
Schools are the primary sampling unit in SASS. Public schools were selected to be representative at the national and state levels; private schools were selected to be representative at the national and affiliation levels. Once the public and private schools were selected, the library media center, if there was one in the school, was included in the sample.
V. Sample Sizes
The number of in-scope or eligible cases is sometimes referred to as the achieved sample size. This number excludes the out-of-scope cases, which were drawn for the sample but were not eligible for interview. For example, a school that had closed or a library media center that did not meet the definition of a library media center would be considered out-of-scope. Library media centers in public charter schools and schools funded by the BIA were considered out of scope for this report due to the low number of schools in these sectors. There were 1,010 completed interviews for public charter schools with library media centers and 120 completed interviews for BIA-funded schools with libraries in the 1999–2000 SASS.
The number of interviews is the number of in-scope (eligible) cases minus the eligible noninterview cases. The number of interviews is the unweighted number of cases that responded to enough items to be considered a valid interview. The noninterview cases include eligible cases that refused or returned questionnaires with too little valid data to be considered complete interviews for the survey.

98
Table B-1 provides information on the number of units sampled, the number found to be in-scope, and the number of complete interviews obtained in each component and sector of the 1999–2000 SASS. Table B-1. Number of library media centers, by sector and interview status: 1999–2000
Interview status Public School Library Media Centers
Private School Library Media Centers
Sampled 9,893 3,558 In-scope 8,065 2,324 Interviewed 7,715 2,086
NOTE: The number of in-scope cases in sample excludes out-of-scope or ineligible cases. The reason for an out-of-scope designation would be that the school does not have a library media center. SOURCE: U.S. Department of Education, National Center for Education Statistics, Schools and Staffing Survey, 1999-2000. “Public School Library Media Center Questionnaire,” “Private School Library Media Center Questionnaire.”
VI. Weighting
Weights of the sample units were developed to produce national and state estimates for public school and library media centers. The private school data were weighted to produce national estimates and affiliation group estimates. The basic weights were the inverse of the probability of selection and were adjusted for nonresponse and also to adjust the sample totals (based on responding, nonresponding, and out of scope cases) to the frame totals in order to reduce sampling variability.
The final weight assigned to each sample library and librarian is the product of the school’s basic weight (the inverse of the probability of the school’s selection for SASS) multiplied by factors that adjust the basic weight to account for the subsampling that occurred during nonresponse follow-up, unusual circumstances that affected the school’s probability of selection (e.g., the school having merged with another school or being listed twice on the school universe files), schools that did not respond to the Library Survey or to SASS, the weighted count of schools in SASS (with and without libraries), and the weighted count of private schools in PSS (with and without libraries).
The library replicate weights are generally similar to the school bootstrap replicate weight. These adjusted bootstrap replicate weights are provided on the file. Balanced Half-sample Replication (BHR) methodology was employed rather than bootstrap in the private area frame. These library sample records were assigned replicate weights by using the school BHR replicate basic weight. The weights on the additional data file used to calculate the percentage of schools with libraries and students in schools with libraries were adjusted for nonresponse. The first adjustment accounts for cases for which it was not known if the school had a library. Their cumulative weight was redistributed to the other cases. The second noninterview adjustment dealt with schools that did have a library media center and the library was a nonrespondent. Those weights were redistributed to cases with a completed library interview. For schools that did not complete a questionnaire but did indicate that the school did not have a library,

99
the cumulative weight was redistributed to schools that completed the interview and did not have libraries to adjust for nonresponse to the school questionnaire. The result of adjustments to the weights in this file can be considered to reflect the true probability of selection.
VII. Response Rates and Nonresponse Bias Analysis
The weighted and unweighted response rates for the School Library Media Center component of the 1999–2000 SASS are shown in table B-2. The unweighted response rates were calculated by dividing the number of interview cases by the number of eligible cases. The number of eligible cases was the number of sample cases minus the number of cases that were out-of-scope for the survey. Out-of-scope cases included those where the school was closed or the school had no library media center. All missing responses were imputed.
Table B-2. Unweighted and weighted response rates for the library media center Table B-2. survey, by sector: 1999–2000
Sector Unweighted Weighted Public School Library Media Centers
87.1
94.7
Private School Library Media Centers
87.1
87.7
SOURCE: U.S. Department of Education, National Center for Education Statistics, Schools and Staffing Survey, 1999-2000. “Public School Library Media Center Questionnaire” and “Private School Library Media Center Questionnaire.”
Item response rates for the public school library media center survey ranged from 100 percent to 43 percent. Item response rates for the private school library media center survey ranged from 100 percent to 47 percent. None of the items presented in this report had a response rate below 70 percent. A nonresponse bias analysis was conducted for each of the components of the 1999–2000 SASS. The analysis included two steps to evaluate the extent of potential bias introduced by public and private school library nonresponse. The detailed results of these bias analyses are reported in Nonrespone Bias Analysis for the 1999–2000 Schools and Staffing Survey (SASS) (Bokossa, Salvucci, and Ghosh forthcoming).
VIII. Accuracy of Estimates The statistics in this report are estimates derived from a sample. Two broad categories of error occur in such estimates: sampling and nonsampling errors. Sampling errors occur because observations are made only on samples of students, not on entire populations. Nonsampling errors can be attributed to a number of sources: ambiguous definitions; coverage; difference in interpreting questions; inability or unwillingness to give correct information; inability to obtain complete information about all library media centers in the sample (some

100
school libraries, schools, or school districts refused to participate, or the library media center respondent participated but answered only certain items); mistakes in recording or coding data; and other errors of collecting, processing, sampling, and imputing missing data. Some items, such as library expenditures, are subject to variation due to the possibility of a school receiving a gift or grant for the library media center.
IX. Comparison of Estimates
The Library Media Center component of the SASS was designed to produce estimates at the national and regional levels. It is also possible to compare public school libraries by state; private school libraries by affiliation. All other comparisons should be made with attention to the number of respondents in each comparison group as well as to the estimated variance. Standard errors were estimated using a bootstrap variance procedure that incorporates the design features of the complex survey sample design (Kaufman 1998). The percentage of schools that have library media centers and students in schools with libraries were calculated using the library files and an additional restricted-use file containing weights for public and private schools without libraries. Standard errors for those percentages were also calculated using the replicate weights on the library media center files and the additional file for schools without libraries. The numbers and percentages of schools with library media centers reported based on the 1993–94 SASS were calculated by a different method than the one used for this report. The estimates for the 1993–94 school year were based on responses made on the school files concerning whether or not the school had a library media center. The definition of a library media center used on the library questionnaire was not presented with the question on the school questionnaire.
X. Statistical Tests
The tests of significance used in this analysis are based on Student’s t statistics. Generally, whether a difference is considered statistically significant is determined by calculating a t value for the difference between a pair of proportions or means, and comparing this value to published tables of critical values for a predetermined alpha level. The alpha level is an a priori statement of the probability of inferring that a difference exists when, in fact, it does not. The alpha level used in this report is 0.05; differences discussed in the text have been tested and found significant at this level. Two-tailed tests were performed.

101
= 24.71
Student’s t values may be computed to test the difference between estimates with the following formula:
E1 – E2
sese 2
2
2
1 +
For example, the null hypothesis that the difference between the percentage of public and private schools with library media centers is zero can be tested. The null hypothesis is tested against the alternate hypothesis that the proportion of public schools with library media centers is different than the proportion of private schools with library media centers, with a two-tailed level of significance of .05.
To test the null hypothesis, the estimate for private schools with library media centers (62.6 percent) is subtracted from the estimate for public schools with school libraries (91.7 percent) (tables 1a and 1b). The difference is divided by the square root of the sum of the squared standard errors. The standard errors correspond to the public and private school estimates and can be located in appendix A, tables A1a and A1b. The resulting t statistic (24.71) is greater than the critical value of 1.96.
91.7 – 62.6
1.1421.0 22 +
The null hypothesis is rejected in favor of the alternative. In other words, the probability that the observed difference between the sample proportions of public and private schools with library media centers would have occurred by chance if the null hypothesis were true is less than .05. The difference between the percentage of public and private schools with library media centers is too great to attribute to chance. As the number of comparisons that are conducted at the same alpha level increases, it becomes more likely that at least one of the estimated differences will be significant merely by chance, that is, will be erroneously identified as different from zero. Even when there is no statistical difference between the means or percentages being compared, there is a 5 percent chance of getting a significant t value greater than 1.96 from sampling error alone. As the number of comparisons increases, the chance of making this type of error also increases.
t =
t =

102
XI. References
Bokossa, M., Salvucci, S., and Ghosh, D. (forthcoming). Nonrespone Bias Analysis for the 1999–2000 Schools and Staffing Survey (SASS). U.S. Department of Education, National Center for Education Statistics. Washington, DC: U.S. Government Printing Office.
Broughman, S.P. and Colaciello, L.A. (1999). Private School Universe Survey,
1997–98 (NCES 1999–319). U.S. Department of Education, National Center for Education Statistics. Washington, DC: U.S. Government Printing Office.
Gruber, K.J., Wiley, S.D., Broughman, S.P., Strizek, G. A., and Burian-
Fitzgerald, M. (2003). Schools and Staffing Survey, 1999–2000: Overview of the Data for Public, Private, Public Charter, and Bureau of Indian Affairs Elementary and Secondary Schools (NCES 2002-313). U.S. Department of Education, National Center for Education Statistics. Washington, DC: U.S. Government Printing Office.
Kaufman, S. (1998). “A Bootstrap Variance Estimator for Systematic PPS
Sampling,” in 1998 Proceedings of the Section on Survey Research Methods. Alexandria, VA: American Statistical Association, 769-774.
103
Appendix C
Supplemental Tables

104
105
Supplemental Tables
A preliminary set of tables was created when the data were final. Many of the tables in this report were based on those preliminary tables. Due to the small number of cases in many of the private school affiliations, only public school estimates are presented here. Table C1 addresses issues concerning technology in public school libraries and classrooms. In 1999–2000, 11 percent of public school library media centers had technology to assist library patrons with disabilities. The assistive technology referred to in the questionnaire includes Telecommunication Display Devices (TDDs) and specially equipped workstations. The other technology-related items in table C.1 involve the role of library media specialists in assisting teachers with technology. Public school library media specialists were more likely to help teachers use technology for learning (14 percent) than to help teachers with set-up and maintenance of technology (8 percent). Professional library staff is the focus of table C2. Data are presented on the number of public schools with state-certified library media specialists, the number of librarians in those schools, and the prevalence of state-certified itinerant school librarians. There were 58,000 public schools with state-certified library media specialists, and 62,000 state-certified public school library media specialists working in those schools in 1999–2000. Fifteen percent of the state-certified school librarians were itinerant; that is they had primary responsibility for the library for which they completed the questionnaire and also spent time in another school.

Table C1. with technology to assist patrons with disabilities, by state and selected characteristics:1999–2000
Percentage of schools in which Percentage of schools in which Percentage of schools withState and person who helps teachers person who helps teachers with library media centersselected Total number use technology for teaching technical set-up and maintenance Total number with technology to assistcharacteristics of schools is a library media specialist is a library media specialist of schools patrons with disabilities1
50 States and DC 83,824 14.0 8.3 76,807 11.3 Alabama 1,329 21.8 14.9 1,299 13.5 Alaska 466 2.8 3.1 366 12.7 Arizona 1,175 10.1 7.0 991 14.2 Arkansas 1,098 12.7 6.2 1,089 14.8 California 8,060 6.3 4.0 6,340 11.7 Colorado 1,412 22.0 16.3 1,355 13.8 Connecticut 1,009 15.3 4.1 934 6.0 Delaware 155 14.2 9.0 136 9.4 District of Columbia 158 11.3 6.5 138 ‡ Florida 2,601 14.7 ‡ 2,436 24.5 Georgia 1,735 32.5 16.8 1,710 21.6 Hawaii 247 ‡ 5.9 247 7.9 Idaho 621 10.3 2.6 545 11.5 Illinois 3,976 11.0 10.0 3,638 16.4 Indiana 1,781 17.5 8.2 1,737 13.7 Iowa 1,485 22.8 11.7 1,463 5.8 Kansas 1,401 12.8 8.5 1,374 5.8 Kentucky 1,317 28.4 9.6 1,222 9.4 Louisiana 1,428 18.6 11.9 1,269 8.7 Maine 708 4.6 2.7 621 5.5 Maryland 1,263 27.8 18.5 1,226 5.8 Massachusetts 1,712 4.6 ‡ 1,609 10.6 Michigan 3,413 22.6 12.9 2,942 14.7 Minnesota 1,674 24.9 13.7 1,483 14.3 Mississippi 934 9.3 4.7 859 6.7 Missouri 1,988 12.0 8.4 1,906 15.8 Montana 880 10.1 7.5 745 5.5 Nebraska 1,197 14.9 8.7 1,014 12.5 Nevada 439 ‡ 1.3 420 7.9 New Hampshire 453 5.3 ‡ 432 5.6 New Jersey 2,247 7.8 3.7 2,086 11.1 New Mexico 709 4.1 3.4 684 11.6 New York 4,090 8.8 4.6 3,738 10.2 North Carolina 2,014 28.4 16.3 1,877 7.2 North Dakota 552 3.5 ‡ 461 15.3
See footnotes at end of table.
Table C1. Percentage of public schools where a library media specialist assists teachers with technology and public school library media centers
Public schools with library media centers
106

Table C1. with technology to assist patrons with disabilities, by state and selected characteristics:1999–2000—Continued
Percentage of schools in which Percentage of schools in which Percentage of schools withState and person who helps teachers person who helps teachers with library media centersselected Total number use technology for teaching technical set-up and maintenance Total number with technology to assistcharacteristics of schools is a library media specialist is a library media specialist of schools patrons with disabilities1
Ohio 3,698 15.7 7.6 3,584 4.2 Oklahoma 1,822 12.9 6.6 1,782 8.7 Oregon 1,171 23.7 16.1 1,118 7.6 Pennsylvania 3,121 9.3 7.5 2,941 7.2 Rhode Island 292 8.9 5.2 277 ‡
South Carolina 1,066 39.6 27.1 1,035 9.0 South Dakota 779 5.5 5.3 571 11.7 Tennessee 1,534 17.0 12.0 1,488 11.5 Texas 6,650 4.9 2.0 6,246 13.6 Utah 740 6.0 5.2 693 8.6 Vermont 332 16.1 10.1 332 4.7 Virginia 1,740 21.6 12.1 1,602 9.3 Washington 2,008 21.8 9.4 1,841 5.2 West Virginia 798 14.2 10.3 610 9.8 Wisconsin 1,952 13.8 16.0 1,948 14.7 Wyoming 395 6.8 8.0 346 14.0
Region Northeast 13,964 8.5 4.7 12,969 8.7 Midwest 23,898 15.8 10.1 22,123 11.9 South 27,640 17.3 9.6 26,025 12.6 West 18,322 10.6 6.7 15,690 10.5Community type Central city 19,752 15.7 9.6 18,038 13.2 Urban fringe/large town 37,564 14.5 8.3 34,754 11.7 Rural/small town 26,508 11.9 7.2 24,015 9.3School level Elementary 59,973 15.8 9.5 56,715 9.9 Secondary 20,590 10.0 5.7 17,963 15.4 Combined 3,261 5.8 2.5 2,129 15.5Student enrollment Less than 100 7,099 7.4 4.9 3,540 8.4 100–199 7,932 8.9 6.4 6,748 8.0 200–499 31,689 17.0 10.7 30,280 9.5 500–749 20,660 14.9 8.2 20,095 12.1 750–999 8,036 12.1 6.6 7,917 12.3 1,000 or more 8,408 11.9 5.5 8,227 19.3‡ Reporting standards not met. (Too few cases.)
SOURCE: U.S. Department of Education, National Center for Education Statistics, Schools and Staffing Survey, "Public School Questionnaire" and "Public School Library Media Center Questionnaire," 1999–2000.
Table C1. Percentage of public schools where a library media specialist assists teachers with technology and public school library media centers
1 Technology to assist patrons with disabilites includes TDD and specially equipped work stations.NOTE: These estimates are for traditional public schools. Traditional public schools include all public schools in the United States except public charter schools. Detail may not sum to totals because of rounding.
Public schools with library media centers
107
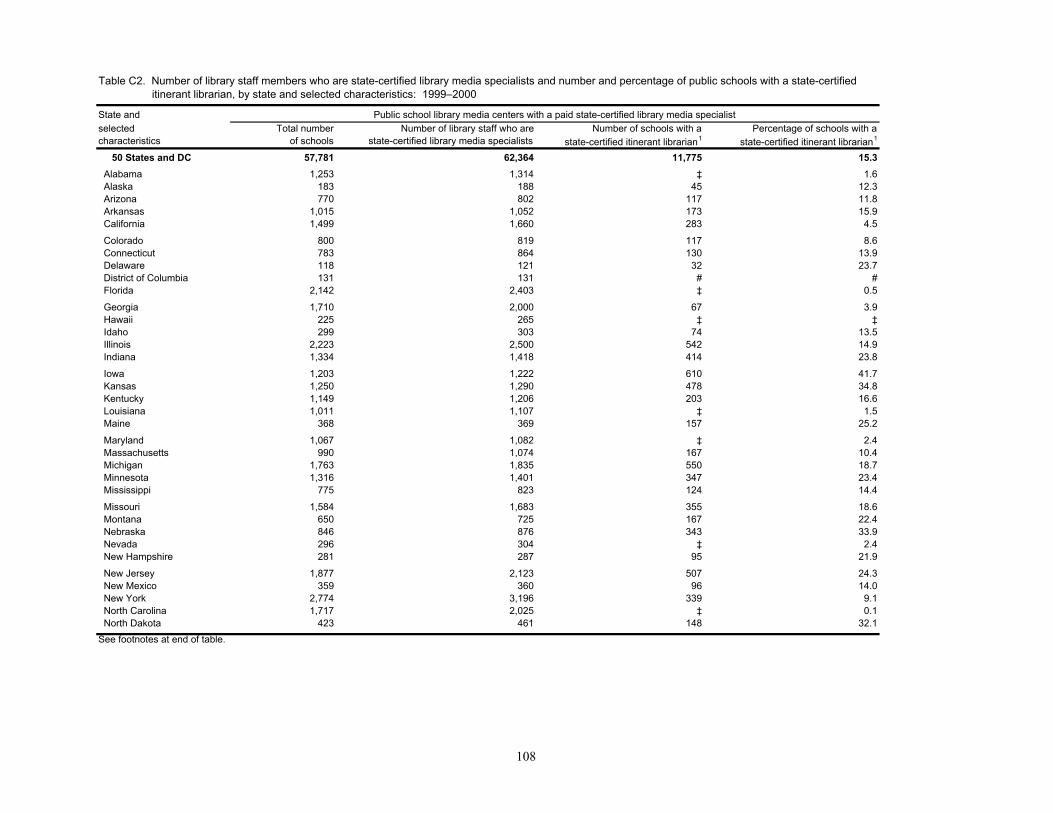
Table C2. itinerant librarian, by state and selected characteristics: 1999–2000
State andselected Total number Number of library staff who are Number of schools with a Percentage of schools with acharacteristics of schools state-certified library media specialists state-certified itinerant librarian1 state-certified itinerant librarian1
50 States and DC 57,781 62,364 11,775 15.3 Alabama 1,253 1,314 ‡ 1.6 Alaska 183 188 45 12.3 Arizona 770 802 117 11.8 Arkansas 1,015 1,052 173 15.9 California 1,499 1,660 283 4.5
Colorado 800 819 117 8.6 Connecticut 783 864 130 13.9 Delaware 118 121 32 23.7 District of Columbia 131 131 # # Florida 2,142 2,403 ‡ 0.5
Georgia 1,710 2,000 67 3.9 Hawaii 225 265 ‡ ‡ Idaho 299 303 74 13.5 Illinois 2,223 2,500 542 14.9 Indiana 1,334 1,418 414 23.8
Iowa 1,203 1,222 610 41.7 Kansas 1,250 1,290 478 34.8 Kentucky 1,149 1,206 203 16.6 Louisiana 1,011 1,107 ‡ 1.5 Maine 368 369 157 25.2
Maryland 1,067 1,082 ‡ 2.4 Massachusetts 990 1,074 167 10.4 Michigan 1,763 1,835 550 18.7 Minnesota 1,316 1,401 347 23.4 Mississippi 775 823 124 14.4
Missouri 1,584 1,683 355 18.6 Montana 650 725 167 22.4 Nebraska 846 876 343 33.9 Nevada 296 304 ‡ 2.4 New Hampshire 281 287 95 21.9
New Jersey 1,877 2,123 507 24.3 New Mexico 359 360 96 14.0 New York 2,774 3,196 339 9.1 North Carolina 1,717 2,025 ‡ 0.1 North Dakota 423 461 148 32.1See footnotes at end of table.
Table C2. Number of library staff members who are state-certified library media specialists and number and percentage of public schools with a state-certified
Public school library media centers with a paid state-certified library media specialist
108

Table C2. itinerant librarian, by state and selected characteristics: 1999–2000—Continued
State andselected Total number Number of library staff who are Number of schools with a Percentage of schools with acharacteristics of schools state-certified library media specialists state-certified itinerant librarian1 state-certified itinerant librarian1
Ohio 2,086 2,242 731 20.4 Oklahoma 1,615 1,664 560 31.4 Oregon 749 775 180 16.1 Pennsylvania 2,788 2,961 1,052 35.8 Rhode Island 262 304 117 42.1
South Carolina 972 1,093 # # South Dakota 384 396 131 23.0 Tennessee 1,395 1,558 35 2.3 Texas 5,363 5,694 950 15.2 Utah 402 406 76 11.0
Vermont 266 266 74 22.3 Virginia 1,529 1,791 30 1.8 Washington 1,441 1,467 271 14.7 West Virginia 406 418 ‡ 3.8 Wisconsin 1,711 1,793 673 34.5 Wyoming 224 248 98 28.4
Region Northeast 10,390 11,444 2,638 20.3 Midwest 16,122 17,116 5,322 24.1 South 23,370 25,482 2,280 8.8 West 7,899 8,322 1,535 9.8
Community type Central city 12,669 14,023 1,889 10.5 Urban fringe/large town 26,618 29,169 4,571 13.2 Rural/small town 18,493 19,172 5,315 22.1
School level Elementary 40,424 41,888 9,549 16.8 Secondary 16,052 19,097 2,044 11.4 Combined 1,304 1,379 182 8.5
Student enrollment Less than 100 2,176 2,220 957 27.0 100–199 4,452 4,613 2,302 34.1 200–499 22,204 22,687 6,548 21.6 500–749 15,569 16,078 1,411 7.0 750–999 6,020 6,334 306 3.9 1,000 or more 7,361 10,431 251 3.0
# Rounds to zero.‡ Reporting standards not met. (Too few cases.)1 An itinerant librarian is a staff member who has primary responsibility for the library media center and spends time in another school.NOTE: These estimates are for traditional public schools. Traditional public schools include all public schools in the United States except public charter schools. Detail may not sum to totals because of rounding.SOURCE: U.S. Department of Education, National Center for Education Statistics, Schools and Staffing Survey, "Public School Library Media Center Questionnaire," 1999–2000.
Table C2. Number of library staff members who are state-certified library media specialists and number and percentage of public schools with a state-certified
Public school library media centers with a paid state-certified library media specialist
109

Table C1.1. library media centers with technology to assist patrons with disabilities, by state and selected characteristics:1999–2000
Percentage of schools in which Percentage of schools in which Percentage of schools withState and person who helps teachers person who helps teachers with library media centersselected Total number use technology for teaching technical set-up and maintenance Total number with technology to assistcharacteristics of schools is a library media specialist is a library media specialist of schools patrons with disabilities1
50 States and DC 261.6 0.50 0.43 419.7 0.46
Alabama 15.0 2.77 2.80 15.4 2.51 Alaska 7.9 0.63 0.66 16.8 1.79 Arizona 23.2 2.08 1.86 70.6 3.06 Arkansas 0.8 3.04 1.90 8.0 2.67 California 106.1 1.82 1.44 216.1 2.96
Colorado 10.0 3.07 2.86 25.5 2.71 Connecticut 5.3 2.31 0.99 16.5 1.46 Delaware 8.7 2.65 2.86 9.0 3.03 District of Columbia 2.3 1.89 — 4.3 — Florida 36.9 2.45 1.34 44.5 2.41
Georgia 30.8 3.03 2.84 33.7 3.54 Hawaii 1.7 — 1.97 1.7 1.70 Idaho 5.5 0.97 0.50 11.2 1.32 Illinois 46.5 2.71 2.10 92.2 3.02 Indiana 31.1 2.83 2.55 31.8 3.25
Iowa 20.8 3.26 2.12 22.0 1.60 Kansas 19.3 2.95 2.34 26.1 0.99 Kentucky 31.9 3.35 1.87 36.0 1.84 Louisiana 23.2 4.46 3.71 63.7 2.82 Maine 5.2 1.75 1.02 17.4 1.87
Maryland 3.7 3.96 3.70 18.4 1.94 Massachusetts 30.8 1.56 — 46.0 2.38 Michigan 66.8 3.36 3.15 121.4 2.88 Minnesota 125.3 3.99 3.27 118.3 3.29 Mississippi 6.5 1.65 1.00 16.1 1.40
Missouri 70.2 3.28 2.52 72.7 5.06 Montana 5.6 1.40 1.30 23.2 1.20 Nebraska 31.9 1.82 1.59 52.8 1.97 Nevada 7.1 — 0.75 9.9 1.25 New Hampshire 4.6 2.04 — 13.0 2.09
New Jersey 12.2 2.03 1.54 38.2 2.72 New Mexico 6.4 1.60 1.69 14.1 3.15 New York 18.1 1.95 1.45 82.4 2.41 North Carolina 26.7 4.42 3.29 52.2 2.12 North Dakota 7.2 0.66 — 18.0 2.70
See footnotes at end of table.
Table C1.1. Standard errors for percentage of public schools where a library media specialist assists teachers with technology and public school
Public schools with library media centers
110

Table C1.1. library media centers with technology to assist patrons with disabilities, by state and selected characteristics:1999–2000—Continued
Percentage of schools in which Percentage of schools in which Percentage of schools withState and person who helps teachers person who helps teachers with library media centersselected Total number use technology for teaching technical set-up and maintenance Total number with technology to assistcharacteristics of schools is a library media specialist is a library media specialist of schools patrons with disabilities1
Ohio 65.3 3.06 2.31 93.9 2.01 Oklahoma 5.9 2.44 1.72 12.9 2.04 Oregon 33.5 4.02 3.64 44.4 2.55 Pennsylvania 48.7 3.27 2.87 44.7 1.94 Rhode Island 3.8 1.42 1.04 5.4 —
South Carolina 17.1 4.39 4.16 20.2 2.31 South Dakota 10.8 1.68 1.63 26.6 2.67 Tennessee 21.1 3.14 2.59 24.0 2.73 Texas 65.9 1.33 0.88 95.0 2.16 Utah 7.1 1.66 1.41 16.3 1.95
Vermont 7.2 3.95 3.36 7.2 1.81 Virginia 117.3 2.78 3.30 119.2 2.78 Washington 16.7 2.83 1.61 33.4 1.21 West Virginia 16.1 2.36 2.03 30.8 2.15 Wisconsin 48.8 2.88 2.69 48.8 3.30 Wyoming 9.0 1.91 1.86 15.5 3.12
Region Northeast 62.8 1.03 0.78 117.8 0.98 Midwest 196.1 1.07 0.89 255.4 0.98 South 153.6 0.87 0.71 197.9 0.80 West 110.4 0.98 0.82 247.2 1.30
Community type Central city 368.1 1.17 0.86 359.9 1.14 Urban fringe/large town 473.8 0.85 0.73 482.9 0.74 Rural/small town 373.3 0.72 0.56 385.3 0.66 School level Elementary 256.0 0.69 0.60 375.9 0.59 Secondary 202.6 0.51 0.36 199.3 0.67 Combined 156.9 0.82 0.42 111.7 1.74
Student enrollment Less than 100 367.1 1.66 1.41 260.3 1.93 100–199 416.7 1.76 1.18 393.1 1.29 200–499 542.1 0.90 0.67 552.8 0.71 500–749 496.8 0.88 0.73 508.4 1.19 750–999 297.2 1.26 0.94 281.3 1.51 1,000 or more 219.4 1.14 0.71 214.7 1.32
— Not available1 Technology to assist patrons with disabilites includesTDD and specially equipped work stations.NOTE: These estimates are for traditional public schools. Traditional public schools include all public schools in the United States except public charter schools. Detail may not sum to totals because of rounding.
SOURCE: U.S. Department of Education, National Center for Education Statistics, Schools and Staffing Survey, "Public School Questionnaire" and "Public School Library Media Center Questionnaire," 1999–2000.
Table C1.1. Standard errors for percentage of public schools where a library media specialist assists teachers with technology and public school
Public schools with library media centers
111

Table C2.1. with a state-certified itinerant librarian, by state and selected characteristics: 1999–2000
State andselected Total number Number of library staff who are Number of schools with a Percentage of schools with acharacteristics of schools state-certified library media specialists state-certified itinerant librarian1 state-certified itinerant librarian1
50 States and DC 522.7 602.4 414.6 0.55
Alabama 21.3 27.0 8.2 0.63 Alaska 11.6 11.9 8.1 2.24 Arizona 70.4 71.2 29.4 3.08 Arkansas 23.7 27.0 30.3 2.80 California 159.6 225.6 94.2 1.49
Colorado 50.8 53.4 28.1 2.10 Connecticut 31.2 36.9 20.9 2.29 Delaware 10.4 10.6 6.7 5.24 District of Columbia 4.5 4.5 — — Florida 66.1 85.2 — —
Georgia 33.7 51.1 28.2 1.65 Hawaii 5.6 8.9 — — Idaho 14.1 14.1 7.9 1.50 Illinois 158.4 176.2 99.3 2.81 Indiana 71.4 68.2 60.8 3.63
Iowa 39.7 39.6 45.7 3.32 Kansas 40.2 43.0 56.7 4.25 Kentucky 40.0 41.9 44.4 3.67 Louisiana 80.9 82.8 — — Maine 29.8 29.8 25.1 4.23
Maryland 51.5 51.5 — — Massachusetts 71.6 78.9 41.5 2.62 Michigan 164.0 171.3 98.8 3.52 Minnesota 113.8 118.1 79.6 5.66 Mississippi 23.5 24.9 19.1 2.26
Missouri 89.6 90.8 69.1 3.73 Montana 24.1 26.2 18.3 2.56 Nebraska 37.1 39.9 38.2 3.97 Nevada 14.3 14.6 — — New Hampshire 27.1 27.2 19.4 4.70
New Jersey 70.3 89.4 79.1 3.88 New Mexico 35.3 35.5 26.4 3.93 New York 130.0 147.3 92.6 2.50 North Carolina 60.8 77.2 — — North Dakota 20.5 22.3 18.8 4.33See footnotes at end of table.
Table C2.1. Standard errors for number of library staff members who are state-certified library media specialists and number and percentage of public schools
Public school library media centers with a paid state-certified library media specialist
112

Table C2.1. with a state-certified itinerant librarian, by state and selected characteristics: 1999–2000—ContinuedTable C2 1State andselected Total number Number of library staff who are Number of schools with a Percentage of schools with acharacteristics of schools state-certified library media specialists state-certified itinerant librarian1 state-certified itinerant librarian1
Ohio 166.2 196.3 167.5 4.77 Oklahoma 45.1 46.9 75.7 4.32 Oregon 51.8 50.7 42.1 3.84 Pennsylvania 67.7 91.2 103.3 3.61 Rhode Island 5.8 7.2 6.7 2.56
South Carolina 25.0 32.8 — — South Dakota 22.8 24.2 18.1 3.30 Tennessee 37.3 53.8 23.5 1.58 Texas 175.8 210.8 130.5 2.13 Utah 33.9 34.1 18.2 2.67
Vermont 16.2 16.2 13.2 4.11 Virginia 120.9 139.4 23.4 1.47 Washington 56.5 59.1 73.9 4.04 West Virginia 30.0 31.5 — — Wisconsin 65.5 68.8 77.3 4.13 Wyoming 15.3 23.0 13.9 4.20
Region Northeast 163.4 204.5 183.6 1.44 Midwest 365.2 402.0 307.6 1.45 South 266.3 324.3 175.3 0.68 West 189.8 255.9 131.2 0.84
Community type Central city 358.2 385.5 189.8 1.07 Urban fringe/large town 428.7 506.6 261.6 0.77 Rural/small town 332.1 338.2 246.4 1.07 School level Elementary 486.7 548.4 398.6 0.72 Secondary 204.0 251.3 104.2 0.59 Combined 84.5 92.0 44.2 2.10
Student enrollment Less than 100 189.5 190.9 131.7 3.99 100–199 258.8 286.5 214.0 3.43 200–499 521.0 555.9 342.6 1.19 500–749 414.5 455.4 135.4 0.69 750–999 224.9 230.9 86.2 1.09 1,000 or more 198.0 283.1 58.0 0.71
— Not available.1 An itinerant librarian is a staff member who has primary responsibility for the library media center and spends time in another school.NOTE: These estimates are for traditional public schools. Traditional public schools include all public schools in the United States except public charter schools. Detail may not sum to totals because of rounding.SOURCE: U.S. Department of Education, National Center for Education Statistics, Schools and Staffing Survey, "Public School Library Media Center Questionnaire," 1999–2000.
Table C2.1. Standard errors for number of library staff members who are state-certified library media specialists and number and percentage of public schools
Public school library media centers with a paid state-certified library media specialist
113

114

115
Appendix D
Glossary

116

117
Glossary
The following terms are defined as they apply to the School Library Media Center component of the Schools and Staffing Survey.
Affiliation. SASS uses 20 categories into which all private schools are divided based on religious orientation and association membership. These categories are Catholic, Friends, Episcopal, Hebrew Day, Solomon Schechter, Other Jewish, Missouri Synod Lutheran, Wisconsin Synod Lutheran, Evangelical Lutheran, Other Lutheran, Seventh-Day Adventist, Christian Schools International, American Association of Christian Schools, Association of Christian Schools International, National Association of Private School for Exceptional Children, Other, and Military Schools. Schools with multiple affiliations are classified by their first affiliation in the above list. These categories represent the private school sampling strata for SASS, therefore, the SASS private school sample is designed to support estimates for each of these affiliations categories. Membership in the National Association of Independent Schools (NAIS) is not used to determine the private school affiliation for SASS and is reported separately. Schools in NAIS may come from any affiliation category.
Automated circulation. The SASS questionnaires do not provide a definition for this term. A general definition is that the circulation of library materials process is automated, i.e. computerized.
Community type. A 3-level categorization based upon the 8-level categorization the National Center for Education Statistics uses to define locale. A central city school is a school located in a large or mid-size central city. An urban fringe/large town school is a school located in the urban fringe of a large or mid-size city, in a large town, or in a rural area within an urbanized metropolitan area. A rural/small town school is a school located in a small town or rural setting.
Library expenditures. Expenditures for information resources are divided into five categories: Books, video materials, CD-ROM titles, current print or microform periodical subscriptions, and electronic subscriptions. The SASS questionnaires also ask for total expenditures for information resources, and they may be greater than the sum of the five categories. Other types of library expenditures are for the professional collection, computer hardware and other communications equipment, and for other audio-visual equipment. Expenditures may vary greatly from one administration of the SASS to the next, due to the receipt of grants or gifts by library media centers.
Library media center. The SASS questionnaires define a Library Media Center as an organized collection of printed and/or audio-visual and/or computer resources which is administered as a unit, is located in a designated place or places, and makes resources and services available to students, teachers, and administrators. A Library Media Center may be called a library, media center, resource center, information center, instructional materials center, learning resource center, or some other name.

118
Library media specialist. A library media specialist is a school professional staff member who is state-certified in the field of library media.
Other library staff. The SASS library media center/library questionnaires define other paid library staff as full-time and part-time staff who are not certified as library media specialists and full-time and part-time library aides or clerical staff.
Private school. A private school is defined as a school not in the public system that provides instruction for any of grades 1–12 (or comparable ungraded levels). The instruction must be given in a building that is not used primarily as a private home.
Public school. A public school is defined as an institution that provides educational services for at least one of grades 1–12 (or comparable ungraded levels), has one or more teachers to give instruction, is located in one or more buildings, receives public funds as primary support and is operated by an education agency. Schools in juvenile detention centers and schools located on military bases and operated by the Department of Defense are included.
Region. Northeast: Connecticut, Maine, Massachusetts, New Hampshire, New Jersey, New York, Pennsylvania, Rhode Island, Vermont.
Midwest: Illinois, Indiana, Iowa, Kansas, Michigan, Minnesota, Missouri, Nebraska, North Dakota, Ohio, South Dakota, Wisconsin.
South: Alabama, Arkansas, Delaware, District of Columbia, Florida, Georgia, Kentucky, Louisiana, Maryland, Mississippi, North Carolina, Oklahoma, South Carolina, Tennessee, Texas, Virginia, West Virginia.
West: Alaska, Arizona, California, Colorado, Hawaii, Idaho, Montana, Nevada, New Mexico, Oregon, Utah, Washington, Wyoming.
School with combined grades. A combined school has one or more of grades K–6 and one or more of grades 9-12; for examples, schools with grades K–12, 6–12, 6–9, or 1–12 were classified as having combined grades. Schools in which all students are ungraded (i.e., not classified by standard grade levels) are also classified as combined.
School, elementary. A school is classified as elementary if it has one or more of grades K-6 and does not have any grade higher than grade 8; for example, schools with grades K-6, 1-3, or 6-8 are classified as elementary.
School, secondary. A school is classified as secondary if it has one or more of grades 7–12 and does not have any grade lower than grade 7; for example, schools with grades 9–12, 7–9, 10–12, or 7–8 are classified secondary.
State-certified library media specialist. The SASS library media center/library questionnaires define this term as paid professional staff who are certified by the state as library media specialists by meeting the state’s regular or standard certification requirements in the library media specialty area. Includes those who have completed all necessary course work and are eligible for full certification upon completion of a probationary period.

119
Traditional public school. Traditional public schools are the subset of all public schools that are not public charter schools. They include regular, special education, vocational/technical, and alternative schools. They also include schools in juvenile detention centers, schools located on military bases and operated by the Department of Defense, and Bureau of Indian Affairs-funded schools operated by local public school districts. See also the definitions for public and public charter schools.
Typology. Categories (three major with three sub-categories each) into which private schools are divided based on religious orientation, association membership, and program emphasis: 1) Catholic—parochial, diocesan, private; 2) Other religious—affiliated with a Conservative Christian school association, affiliated with a national denomination, unaffiliated; 3) Non-sectarian—regular, special program emphasis, special education.