the status of school science laboratory technicians in australian secondary schools
TRANSCRIPT

The Status of School Science Laboratory Technicians in Australian Secondary Schools Research report prepared for the Department of Education, Employment and Workplace Relations Prepared by Professor Mark Hackling Education Research Institute School of Education Edith Cowan University
May 2009 A study conducted by ECU in collaboration with ASTA and SETA
SETA

Page 2
Acknowledgements and disclaimer This project is funded by the Australian Government Department of Education, Employment and Workplace Relations as a quality teacher initiative under the Boosting Innovation, Science, Technology and Mathematics Teaching programme. The study was conducted by researchers at Edith Cowan University in collaboration with the Australian Science Teachers Association and Science Education Technicians Australia. The project was supported by a Steering Committee which provided valuable input and advice on the conduct of the study. The support and advice provided by A/Prof Vaille Dawson (Curtin University), Peter Turnbull (ASTA), Teresa Gigengack (SETA), Marilyn Miles (SETA) and DEEWR staff on the Steering Committee and Working Party is greatly appreciated. The enthusiastic support and cooperation of teachers in charge of science and science technicians in completing the questionnaire is acknowledged and greatly appreciated. The coding and collation of data was efficiently completed by Barbara Bowra, which has contributed significantly to the quality of this report. Policy documents, research reports and instruments provided by the UK Association for Science Education, the UK CLEAPSS advisory service and the Laboratory Technicians Association of Victoria were valuable resources for this Australian study. The views expressed in this report do not necessarily represent the views of Edith Cowan University, the Australian Science Teachers Association, Science Education Technicians Australia nor the views of the Australian Government Department of Education, Employment and Workplace Relations. The author accepts responsibility for the views expressed and all errors and omissions in this report.

Page 3
Contents
Executive Summary.............................................................................................................. 4
Context ......................................................................................................................... 4 Approach ...................................................................................................................... 4 Findings ........................................................................................................................ 4 Recommendations ........................................................................................................ 6
Context and Rationale .......................................................................................................... 8 Purpose and Research Questions........................................................................................ 10 Research Methods .............................................................................................................. 10
Sampling Frame.......................................................................................................... 10 Instrument Development ............................................................................................ 11 Ethics Approval .......................................................................................................... 12 Data Analysis.............................................................................................................. 12
Results ................................................................................................................................ 13 Demographic Data.......................................................................................................... 13
Types of Schools Included in the Study Sample ........................................................ 14 Schools with Technicians ............................................................................................... 14
Employment of Technicians: Full-time, part-time and casual ................................... 14 Technicians per school ............................................................................................... 15 Amount and Quality of Technical Support ................................................................ 16 Recruitment of Technicians........................................................................................ 18 Science Teaching Facilities at Schools....................................................................... 19 Range of Students and Science Subjects Supported................................................... 20 Levels of Servicing..................................................................................................... 21
Schools Without Technicians ......................................................................................... 25 The Technicians.............................................................................................................. 26
Background of Technicians........................................................................................ 26 Training of Technicians.............................................................................................. 29 Support for Technicians ............................................................................................. 31 The Role of the Technician ........................................................................................ 33 Technician’s Confidence with Tasks.......................................................................... 35 Improvements to the Training, Support and Roles of Technicians ............................ 36
Summary of Key Findings ................................................................................................. 42 Discussion, Conclusions and Recommendations ............................................................... 44
Discussion ...................................................................................................................... 44 Conclusions and Implications ........................................................................................ 49
Conclusions ................................................................................................................ 49 Implications ................................................................................................................ 50
Recommendations .......................................................................................................... 51 References .......................................................................................................................... 53 Appendices ......................................................................................................................... 54
Appendix 1: Association of Science Education service standards (Royal Society & ASE, 2001) ................................................................................................................. 54 Appendix 2: The Questionnaire.................................................................................. 55 Appendix 3: Categories of interview participants ...................................................... 69 Appendix 4: Supplementary demographic data ......................................................... 70 Appendix 5: Supplementary data about schools with technicians ............................. 72 Appendix 6: Supplementary data about schools without technicians ........................ 75 Appendix 7: Supplementary data about background of technicians .......................... 76

Page 4
Executive Summary
Context Australia needs a scientifically literate society and a supply of scientists and technologists to sustain a thriving economy and to address a wide range of social and environmental challenges. The goals of scientific literacy and a sufficient supply of science and technology graduates from higher education require that primary and secondary schools offer authentic and inquiry oriented science curricula that engage students and inspire them to continue their studies of science (Ainley et al., 2008). Science teachers depend heavily on good facilities and high quality technical support to implement an engaging and inquiry-oriented curriculum and this will be particularly important as Australia implements a national science curriculum. There has been very little research on the status of technical support for secondary school science, and most of this has been conducted in the United Kingdom (The Royal Society & ASE, 2001, 2002). Concerns about the status of technical support for science teaching programs in Australian schools by the Australian Science Teachers Association and Science Education Technicians Australia led to the Australian Government Department of Education, Employment and Workplace Relations (DEEWR) funding a study to investigate the training and support for technicians, their roles and the level of servicing provided by technicians for the teaching and learning of secondary science.
Approach This research study combined a large-scale questionnaire survey of Australian schools with interviews conducted with 18 key stakeholders with deep experience of the training, employment and support of school science technicians. Questionnaires were mailed to 2011 principals of schools that enrolled secondary students with a request that the teacher-in-charge of science and the technician complete the survey or if the school did not have a technician then the teacher-in-charge of science complete the survey and return it to the researchers. An overall return rate of 33% was achieved with questionnaires being returned by 607 schools and 824 technicians. The study sample included mainly schools with technicians, secondary and K-12 schools, and schools from all jurisdictions and sectors. Small remote schools and NSW government schools were not represented in the sample.
Findings Technicians and their roles Analysis of the questionnaire and interview data indicates that school science technicians have significant responsibilities and make an important contribution to the quality of teaching and learning of school science. Science technicians have diverse and demanding roles that include preparing resources for and supporting the teaching of science practical work in their schools. They also have significant responsibilities for health and safety, first aid, operating budgets, training and supervising other technicians, the care of animals, ensuring compliance with relevant codes, and security of the school’s science department. Some technicians are also required to supervise students. The most common patterns of employment of technicians were full-time only, part-time only and a combination of full-time and part-time, and there are indications that contract and part-time employment are becoming more common. Forty per cent of schools reported difficulty in recruiting technicians. The main difficulties related to the poor conditions of service, in particular the poor match between salary levels and responsibility which made it difficult to attract suitable applicants for technician positions. A large majority of the Australian technicians in the study sample are female, only 22% are less than 40 years of age and 40% are over 50 years of age. It would therefore be expected that significant numbers of our most experienced technicians will retire in the next five years. There is a core of the technician workforce that is both experienced and well qualified, however there are concerns about the training and support provided to technicians.

Page 5
Training and support There are three main concerns regarding the training, knowledge and skills of the technician workforce. First, the initial training of technicians provided by the vocational education and training sector is geared towards the requirements of the mining and medical pathology industries and the courses lack relevance for the quite different job requirements of school science technicians. Second, there is a high proportion of technicians who have completed no in-school training (47%) or no out-of-school training (27%) in the past five years. Third, there are staff providing support to science who are employed as generalist school support officers who may have no science or laboratory skills training. Lack of recent training would impact most particularly on technicians’ knowledge of the rapidly changing OH&S environment and of contemporary laboratory and learning technologies. Large numbers of questionnaire respondents and interview participants indicated that technicians require regular updates and retraining in the use of science equipment, in first aid and OH&S, and they need further IT training. Messages posted to science technician internet discussion boards indicate that many staff are struggling with inadequate science and technical knowledge. More than half of the technicians reported that they had access to the Internet, a technician at another school, online discussion boards, the local science technicians association and WorkSafe as sources of support. The most frequently used sources of support were those that were Internet based and accessible by computer, however, there are concerns about the accuracy and consistency of advice provided by internet based discussion boards. Twenty per cent or more technicians indicated they were in need of further support or training to competently perform a number of tasks related to newer laboratory practices and/or technology and 25% or more technicians indicated they needed further support or training with a number of important safety issues. Level of servicing The demand for services from technicians is influenced by the number of science laboratories, the layout of laboratories, preparation and store rooms and the range of science teaching programs to be supported. Over all the schools in the study sample that had technicians, a median of 1.06 FTE technicians per school supported a median of 700 students and four laboratories. In 90% of schools, technicians supported science teaching across Years 8-12 and also to Year 7 students in 63% of schools which would be in the four jurisdictions where Year 7 students are included in secondary schools. Thirty-six per cent of schools did not have sufficient technical support during school holidays for maintenance, stock-taking and occupational health and safety compliance activities. Many schools indicated that if they had more technical support the amount (46% of schools) and quality (59%) of practical work in the curriculum would be improved which suggests that the amount of technical support was less than optimal. There is great variability across jurisdictions, sectors and schools regarding the levels of servicing by technicians of science programs as measured by service factors (technician hours/hours of science class teaching). The median service factor for the sample of Australian schools with technicians was lower than for all school types surveyed in a large UK study (The Royal Society & ASE, 2001) and 96% of schools with technicians in the study sample had levels of servicing lower than the standard recommended by the UK Association for Science Education. The median service factor for the study sample was lower than the minimum standard set by the Laboratory Technicians Association of Victoria (LTAV, 2007). All sectors and jurisdictions had large numbers of schools with levels of servicing (service factor of <0.45) at which “Functions will be markedly reduced and in most cases no more than simple immediate maintenance and control will be possible” (Royal Society & ASE, 2001) and one would expect that the quality of the science curriculum in these schools is compromised. Schools without technicians Fifty-three schools without technicians returned completed surveys. The main reasons given for not having a technician were that the school was too small and budgetary constraints. In most cases the science teacher performed the duties of technician. As indicated by the LTAV (2007, p. 5) “the skills required are not normally possessed by most teachers and this is not a task that can

Page 6
be safely and efficiently carried out by an untrained person”. Given the pressures on teachers’ time, it is likely that teachers in these circumstances can only prepare limited resources for practical work and the quality of the curriculum is compromised. This view is supported by data from these schools indicating that having a technician would improve the quantity and quality of practical work in the implemented curriculum. Challenges There is a need to raise standards where they are less than optimal and compromise quality of support, teaching and learning, and safety. The greatest challenges relate to: providing an initial training that is specific to the needs of school science technicians; ensuring that all staff providing technical support to secondary science programs have at least minimum standards of training; the provision of an internet-based and authoritative source of advice and support; the provision of ongoing training and incentives for technicians to attend such training; providing levels of staffing that meet at least the ASE’s 0.6 service factor benchmark in all schools; and, improving employment conditions, salaries and career pathways so that sufficient well-qualified staff can be attracted to the profession. This study also raises broader questions about the roles played and contributions made by other school paraprofessional staff and how they can be trained, supported and used more effectively to support teaching and learning and effective school administration.
Recommendations The following research-informed recommendations are made to provide direction for actions that can be taken to improve the quality of technical support provided to secondary science programs in our schools. Recommendation 1: That the vocational education and training sector develop and offer courses for the initial training of technicians, aligned with the requirements of school science technicians and the school science curriculum. Suggested actions:
• A national forum convened by DEEWR with representatives of DEEWR Skills and Training, ASTA, SETA, TAFE/VET and science policy officers from all sectors establish a framework for the initial training of school science technicians.
• DEEWR recognise schools science technicians as an area of skills shortage so that job seekers become eligible for the services available to those seeking employment in areas of skill shortage.
Recommendation 2: That minimum standards be established for the training required for employment of science technicians in secondary schools and for their induction into the role. Suggested actions:
• A national forum be convened by DEEWR with representatives of ASTA, SETA and employing authorities to establish a minimum standard of training and induction for new appointments to the role of technician and for identifying mechanisms by which existing technicians can be supported to gain this qualification utilising appropriate skills recognition, distance and workplace learning mechanisms.
Recommendation 3: That nationally consistent job specifications be established for various levels of science technicians to which appropriate salary scales are linked. Suggested actions:
• A working party be established to review job specifications and salary scales for science technicians that currently exist in Australian jurisdictions and sectors and the position descriptions proposed by LTAV for technical assistants, technicians and senior technicians.
• A set of national levels be established for the appointment of technicians with appropriate job specifications, expected qualifications and salary scales.

Page 7
Recommendation 4: That mechanisms be established to enhance the availability of ongoing training for school science technicians and increase technicians’ participation in ongoing training Suggested actions:
• At a national forum and with other appropriate consultations identify priorities, providers and mechanisms for delivery of ongoing training for technicians
• Employing authorities be encouraged to fund and provide incentives for ongoing training of technicians.
Recommendation 5: That a minimum standard be established for technician servicing of secondary science programs. Suggested actions:
• At a DEEWR convened national forum with appropriate stakeholder representation establish an agreed minimal standard for the level of technician servicing for secondary science programs based on a service factor of at least 0.6.
• Mechanisms be developed by which schools report annually against this standard. Recommendation 6: That a national internet-based advisory service be established to provide consistent and authoritative advice and support to secondary school technicians and teachers Suggested actions:
• Resources be provided by DEEWR to investigate the UK CLEAPSS advisory service and in consultation with relevant Australian stakeholders develop a framework for the establishment of an Australian online advisory service and a national resource bank of standard procedures and chemical labels.
• Establish an online advisory service for an initial three-year trial period and conduct an evaluation to inform future options.
Recommendation 7: That resources be provided to facilitate ASTA and SETA’s involvement with and leadership of the development of national standards for the employment, roles and provision of training and ongoing support of technicians. Suggested actions:
• Resources be provided to enable ASTA and SETA to be represented and participate in national forums and consultations regarding the establishment of national standards for technicians.
Recommendation 8: That further research and development activity be funded to investigate ways of more effectively deploying paraprofessionals in Australian schools. Suggested actions:
• Further research and development activity is required to inform the establishment of national standards for the secondary school science technician workforce and to explore the support needs of primary science.
• A review be undertaken in five years time of the impact of initiatives taken in response to this report on the status of technical support for science teaching.
• The roles of the UK High Level Teaching Assistants in supporting the teaching and learning of science be reviewed with a view to trialing them in Australian schools.
• Further research is required to review the range of paraprofessionals that support teaching and learning and administration of schools and identify ways in which the work of paraprofessionals can be enhanced so that learning outcomes and school productivity can be maximised.
It is difficult to specify timelines for the implementation of these recommendations, however, it is recommended that a national forum of key stakeholders be convened by DEEWR, ASTA and SETA by September of 2009 so that initial consultation and discussions can commence on processes of implementation of the recommendations and suggested actions.

Page 8
Context and Rationale Science, engineering and technology play a crucial and increasingly important role in the Australian economy. “Science, engineering and technology (SET) skills are vital, as they provide the basis for an innovative and globally competitive workforce” (DEST, 2006, p.ix). SET skills shortages have been of concern to both industry, professional bodies (e.g., APPEA, 2005; Engineers Australia, 2007) and government (DEST, 2006). The National Engineering, Science and Technology Skills Summit held at Parliament House, Canberra in June 2007 received a number of submissions from bodies including Engineers Australia and the Royal Australian Chemical Institute highlighting concerns about the education and training of scientists and engineers and the need to attract school students to science. A high quality science education in primary and secondary schools contributes to developing scientific literacy and would be expected to predispose students to study the enabling sciences at university (Goodrum, Hackling & Rennie, 2001). Participation rates in senior secondary school science, as a percentage of the Year 12 cohort, have declined over the last 30 years and university enrolments in the natural and physical sciences have remained static since 2001 (Ainley, Kos & Nicholas, 2008). “Generating higher levels of participation in science-related studies at university appears to be partly dependant on strengthening science education in schools” (Ainley et al., 2008, p.82). A number of reviews and reports on secondary science education (e.g., Goodrum et al., 2001; Tytler, 2007) have highlighted problems with engaging students’ interest in the study of science and have suggested that the curriculum should be reformed so that it is more inquiry-oriented, provides greater opportunity for students in engage in practical science investigations and gives students a more authentic experience of science. Reforming secondary science education requires changes to the curriculum and also to teacher education. There is a need to attract larger numbers of able students into initial science teacher education to ensure an adequate supply of suitably qualified teachers of secondary science and to overcome problems of teacher shortage (Ainley et al., 2008; McKenzie, Kos, Walker & Hong, 2008). Initiatives such as Science by Doing (Australian Academy of Science, 2008) are addressing secondary science teachers’ needs for ongoing professional learning to support them incorporate more inquiry-oriented approaches to teaching and learning into the science curriculum. An interesting development in the UK has been the greater focus on the utilisation of paraprofessionals to support classroom teachers in creating high quality classroom environments and to enhance learning outcomes. For example, teaching assistants have been deployed with great effectiveness to support literacy learning and in special education settings.
People working in support roles are at the heart of school reform. The rapid growth in support staff numbers, the emergence of new higher level and specialist roles, and evidence from many research studies confirm that support staff are playing an essential role in school improvement – making schools more efficient, enriching experiences for children and strengthening teaching and learning. (School Workforce Development Board, Training and Development Agency for Schools, 2006, p. 5).
The UK Training and Development Agency for Schools is supporting the training and credentialing of specialist secondary science Higher Level Teaching Assistants (HLTAs) to support science teachers in the teaching and learning process. This would be particularly beneficial in practical classes where teachers need to manage groups of students conducting experiments with as many as 35 students in some Australian secondary schools. Under the provisions of the Schools Code of 1956, practical classes are limited to 20 students in Scottish schools so that teachers have a better opportunity to manage safety issues in addition to teaching. Science is a practical subject. Science curricula should give students the opportunity to practice the processes of investigation in authentic contexts, and in secondary schools this should involve working in well-equipped and supported laboratory environments. Authentic, practical science investigation work is needed to enhance the relevance of school science, actively engage students in learning and provide opportunities to develop the skills and processes that contribute to scientific literacy (Hackling, 2004; 2005). Science teachers are dependent on the support and technical skills of technicians in preparing equipment for practical science lessons, training

Page 9
teachers in the use of new equipment, preparing solutions and reagents for chemistry classes, obtaining and caring for animals used in science lessons, purchasing materials and equipment, and working with the teacher-in-charge of science to ensure that the school complies with chemical safety standards, animals ethics requirements and other occupational, health and safety issues.
Everyone actively involved in science education recognises the central role played by school and college technicians in the provision of high quality science education. Yet surprisingly little work has been undertaken to establish any kind of profile of the technician workforce (Royal Society & ASE, 2001, p. 1).
In response to concerns about the roles, training, support and conditions of service of school science laboratory technicians The British Royal Society and the Association for Science Education conducted a questionnaire survey of technicians (Royal Society & ASE, 2001) and a telephone survey of heads of science (Royal Society & ASE, 2002). This research identified issues associated with a shortage of well trained laboratory technicians, concerns about career structures, roles, staffing levels and ongoing training. The ASE developed a Service Factor (SF) metric and a set of standards against which the amount of technical support could be reported. The standards were set at SFs of 0.85 (recommended level of servicing), 0.7, 0.6 and 0.45 (a level at which service functions will be markedly reduced). Descriptors of the service standards are outlined in Appendix 1. Surveys of UK schools (Royal Society & ASE, 2001) showed that the median SFs for grammar and independent schools and for sixth form colleges were close to the 0.6 standard and that the median SF for comprehensive schools was close to the 0.45 standard. Heads of science explained that the lack of adequate technical support limited the amount and complexity of practical work they could offer students and that as a result lessons were often reduced to demonstrations and theory. The Laboratory Technicians Association of Victoria has established a policy (LTAV, 2007) that a minimum SF of 0.55 should apply to staffing of science laboratories in Victorian schools and that an additional SF loading of 0.1 should be applied where a number of conditions are not met (e.g., where laboratories are not on the ground floor). If the concerns about the lack of relevance and engagement, and the chalk and talk nature of secondary science education in Australia reported by Goodrum et al. (2001) are to be addressed and if the more inquiry-oriented curriculum advocated by Tytler (2007) is to be implemented, there is a need to ensure that the technical support provided for secondary school science in Australia is of the highest quality. Given that there has been no research conducted in Australia on a national scale to investigate the status and quality of secondary science technical support, there is a need to investigate the nature of technical support, the role of technicians and how they are trained and supported in their roles. Findings from such research could inform policy and practice relating to the training, support and deployment of technicians in ways that would enhance the quality of science education in our schools. Efforts to reform secondary science education through the implementation of new national curricula and more inquiry-oriented pedagogy will only be effective if science teachers are supported with adequate laboratory facilities, science equipment and with high quality technical support. Higher levels of technical support will be required to implement a more inquiry-oriented and authentic science curriculum. Failure to implement a more engaging secondary science curriculum will see the continued drift of students away from the sciences in the senior secondary years with serious consequences for university science enrolments and the quantity of trained professionals in science, engineering and technology that are needed to drive the Australian economy.

Page 10
Purpose and Research Questions The purpose of this research study is to investigate the current status of school science laboratory technicians in Australian secondary schools including their qualifications, roles and responsibilities, working conditions, staffing levels and ongoing training and support. More specifically, the study addresses the following research questions:
1. What range of qualifications is held by school science technicians in Australian secondary schools?
2. What range of duties and responsibilities is included in the roles of school science
laboratory technicians?
3. What training and support do school science technicians receive, what do they need and what are they able to access?
4. How can the role of school science technicians, training and support be improved to
enhance student learning outcomes in Australian schools?
Research Methods There has been very little previous research into the status and roles of school science technicians. The two main studies conducted to date (Royal Society & ASE, 2001; 2002) involved a questionnaire survey of technicians and a telephone survey of heads of science in the UK. The UK questionnaire was very long and addressed both educational and industrial issues. There were concerns that should such an extensive questionnaire be used in this study it would compromise the return rate and the generalisability of research findings. For this relatively small-scale and preliminary Australian research study, it was decided to develop a shorter questionnaire and one which focussed on only the educational issues associated with the roles of technicians. It was also considered important for teachers-in-charge of science to have the opportunity to provide information about their school, issues associated with staffing levels and recruitment of technicians. A questionnaire was therefore designed that would elicit information from both technicians and teachers-in-charge of science. Rather than limiting telephone interviews to heads of science as done in the second UK study (Royal Society & ASE, 2002) it was considered more appropriate to include a wider range of perspectives from a number of stakeholder groups including science policy officers, teachers-in-charge of science departments, TAFE personnel involved in the training of technicians, regional or advisory technicians, experienced secondary school technicians and those with occupational health and safety expertise. A mixed-methods approach involving a nation-wide questionnaire survey complemented with telephone interviews was therefore adopted to capitalise on the efficiency of data gathering using questionnaires and the capacity to elicit richer in-depth information from telephone interviews.
Sampling Frame The study planned to survey technicians and teachers-in-charge of science at schools in all Australian jurisdictions and educational sectors (Government, Catholic and Independent). Given limitations in the resources available for the research, it was not possible to survey all Australian secondary schools and colleges. Schools that were unlikely to have a science technician or to teach science as a separate subject were excluded. These were: remote schools with less than 200 students on the roll, provincial and metropolitan schools with less than 36 students on the roll, and schools with the word ‘special’ or ‘technical’ in the school names. Telephone interviews were conducted with 18 key stakeholders in laboratory science who had deep insights into the work of school science technicians. These included school science technicians, regional/advisory technicians, teachers-in-charge of science, science policy officers, a representative of the Australian Science Teachers Association, an occupational health and safety officer, and lecturers within the TAFE sector involved with training science technicians. Interview

Page 11
subjects were drawn from Government, Catholic and Independent school sectors and from all states and territories.
Instrument Development Two original instruments were developed for the study, a questionnaire and a telephone interview protocol. Both instruments were developed through extensive consultation with the project Steering Committee which comprised representatives of DEEWR, ASTA, SETA and ECU researchers. The questionnaire was developed through almost 20 rounds of drafts, consultation and revision before being piloted with a small sample of volunteer schools in several states and territories. The piloting identified a small number of items that needed revision to address issues of ambiguity. The questionnaire comprised four sections: Section A: About your School/College – to be completed by the teacher-in-charge of science. Section B: About the Laboratory Technician – to be completed by each laboratory technician. (Schools were asked to copy this section if the school employed more than one technician) Section C: Duties Associated with Laboratory/Practical Work – to be completed by the (senior) laboratory technician together with the teacher-in-charge of science. Section D: For Schools that do not Employ a Laboratory Technician – to be completed by the teacher-in-charge of science at schools that do not employ laboratory technicians. A copy of the questionnaire is attached as Appendix 2. A semi-structured interview protocol was developed that could be varied to suit the context and role of the participants. The interview comprised six open questions with a number of subsidiary follow-up questions that could be used in a flexible manner depending on the role and experience of the participants and their responses to the lead questions. The questions are outlined in Figure 1. What experience do you have of the role, training or support of secondary school science technicians? With which of these aspects do you have personal experience?
What is the current status of technical support provided for secondary school science programs? Quality of support? Amount of technical support? Any issues with recruiting suitably qualified and experienced staff?
What forms of support are available for technicians that can help them with authoritative advice on laboratory practices, labelling, handling and storage of chemicals, codes of practice for using animals in teaching and new laboratory technologies?
How are technicians employed and managed within schools?
How are technicians trained and provided with ongoing training once in the role? How adequate are current training provisions? How can training be improved?
The report to the Australian Government will include recommendations for change and improvement. Recommendations may address aspects to do with the role and work of technicians, their employment status, their training, and support provided to technicians. Name one recommendation that you would like to see included in the report? Why is this important?
Figure 1: Interview questions. Interviews were semi-structured so that there was flexibility to respond to issues raised by participants. Interviews were conducted by telephone and were digitally recorded.

Page 12
Ethics Approval Ethics approval was gained from the ECU Human Research Ethics Committee for the research design, instruments and procedures for gaining informed consent of participants. Written applications were then submitted to all state and territory education departments and to those state Catholic Education offices or dioceses that required central approval prior to approaching schools. Approval was gained from all jurisdictions except the NSW Department of Education. No surveys were sent to NSW government schools. Surveys were sent to schools in an envelope addressed to the principal. The covering information letter asked the principal to grant approval for the participation of his/her school in the research and where the jurisdiction required, the principal, teacher-in-charge of science and the technician were asked to completed consent forms. If the principal granted approval for the participation of his/her school, the survey was forwarded to the teacher-in-charge of science and the technician who completed the survey and returned it to the researchers in a pre-paid envelope. The questionnaire was anonymous in that the names of schools and participants were not recorded on the survey.
Data Analysis The questionnaire comprised a mix of item types including open response items, items where participants had to select a response from a set of supplied alternative responses and rating scale items. A sample of the returned questionnaires were read and re-read to identify the types of responses that had been provided to the open-ended questions and categories of responses were identified, named and described. A detailed coding manual was then written to guide the coding of responses to all items. Two experienced coders trial coded sets of questionnaires and codings were compared to identify any discrepancies. Revision of the coding manual to eliminate ambiguity and further trial codings were completed to ensure high inter-rater agreement. All questionnaires were then coded and codes were entered into coding boxes on the questionnaires. Codes were entered into SPSS spreadsheets for statistical analysis. The UK Association for Science Education (ASE) developed a metric called the service factor to quantify levels of technician support related to the hours of science teaching per week at the school. Reports of the UK research include data about levels of technician support in terms of a service factor (Royal Society & ASE, 2001). A service factor (SF) was therefore calculated for each school that supplied the data required for the calculation. Service factor = Technician hours per week Hours of science teaching per week The technician hours per week are the sum of hours of employment in one week of all technicians working at that school during term time. The hours of science teaching per week is the sum of hours of science teaching per week for all secondary classes at that school (i.e. Class A hours per week + Class B hours per week + Class C hours per week etc). Five hundred and fifty-seven schools provided sufficient data for the calculation of a SF. Some schools made errors in calculating the hours of science teaching time and were excluded from calculation of a SF. The telephone interviews were audio recorded using a digital recorder. After each interview an interview summary was written and important sections of the interview were transcribed in full. Interview summaries were read and re-read to identify issues mentioned by the participants. A form of constant comparative analysis was used to identify themes that emerged from the data and these were summarised and quotations were selected to illustrate the views of the participants.

Page 13
Results The results are presented in three main sections in which data are reported about schools with technicians, schools without technicians and about technicians themselves. The interpretation of research data needs to be informed by an analysis of demographic data to determine the extent to which findings can be generalised beyond the samples studied. These data are presented first.
Demographic Data Data were collected by interview and questionnaire. Interview participants included persons from all states and territories and from all educational sectors. The 18 participants comprised: four persons from the TAFE sector involved in training technicians, three science policy officers, three school science technicians, three teachers in-charge of science, one advisory technician, one occupational safety and health officer and, one representative of the Australian Science Teachers Association. Further details of the categories of interview participants are provided in Appendix 3. The questionnaire was mailed out to 2011 schools in all states and territories of Australia. The questionnaire was mailed to the principal of each school, who was asked to forward it to the teacher-in-charge of science and the science technicians in the school if they were happy for their school to participate in the study. Anecdotal evidence suggests that many technicians did not have an opportunity to complete the questionnaire as it was not forwarded to them. This will have had an effect on the return rate and may have biased the sample in that principals of schools with lower levels of technical support may have been less likely to allow their schools to participate in the study. The main features of the demographic data are reported here while more detailed tables are included in Appendix 4. Of the 663 schools that returned questionnaires, 660 were sufficiently complete (i.e., not missing major parts of Sections A and B) to be analysed and included in the study sample. Table 1 provides information about the numbers of questionnaires sent and returned which were included in the study sample. The overall return rate for questionnaires was 33%. Jurisdiction return rates ranged from 22% to 54% returns. Table 1: Numbers of surveys sent and received from each jurisdiction Jurisdiction Number
schools sent
surveys
Number schools with technicians
who returned surveys
Number schools without
technicians who returned surveys
Number of schools
who returned surveys
Per cent return rate
WA 244 82 7 89 36
SA 204 51 4 55 27
NT 24 12 1 13 54
QLD 424 162 21 183 43
NSW a 372 73 7 80 22
ACT 44 19 1 20 45
VIC 611 178 10 188 31
TAS 88 30 2 32 36
Total 2011 607 53 660 33 Note. a No surveys were sent to NSW government schools as NSW DET did not give permission for its schools to participate in the study.

Page 14
It should be noted that more than half of the returned surveys came from Queensland and Victorian schools. The return rate for government schools (38%) was higher than for non-government (28%) schools. The types of schools that returned surveys are reported in the following section.
Types of Schools Included in the Study Sample Data are presented here regarding types of schools represented in the study sample. These include schools from different sectors, school types based on year levels of student enrolment, location of schools, and schools with or without technicians. Fifty-one per cent of questionnaires were returned from government schools, 19% from Catholic schools and 30% from independent schools. It was requested that each technician in a school complete Section B of the questionnaire. Eight hundred and twenty-four technicians completed this section, 51% being from state schools and 18% and 31% from Catholic and independent schools respectively, which is the same proportion of schools returning surveys. The sample of schools comprised mainly secondary (Years 7/8-12) schools (56% of the sample) and K/P-12 schools (30%) with much smaller numbers of middle schools (6%), senior colleges (5%) and K-10 schools (3%). School locations were determined using classifications of metropolitan, provincial and remote based on postcodes. Almost all of the schools were located in metropolitan (60%) or provincial (37%) regions and only 10 remote schools (2%) returned questionnaires and were included in the study sample. Of the 660 schools that returned complete questionnaires, 607 (92%) were from schools with technicians and 53 (8%) were from schools without technicians. Key Finding 1. The study sample included mainly schools from metropolitan and provincial locations, schools from all jurisdictions, schools from all sectors, and a large majority were secondary schools and K/P-12 schools. The study sample did not include any NSW government schools and only included small numbers of remote schools, K-10 schools, middle schools and senior colleges. Most of the schools in the study sample employed a laboratory technician.
Given that the study sample contained no NSW government schools and only small numbers of some school types the research findings are not generalised beyond the study sample.
Schools with Technicians Data regarding schools with technicians are reported first; following this, data are reported for schools without technicians. More detailed tables of data for schools with technicians are provided in Appendix 5. Six hundred and seven schools with technicians returned complete questionnaires and almost all of these were secondary (7/8-12) schools (59%) and K/P-12 schools (29%) with much smaller numbers of middle schools (6%), senior colleges (5%) and K-10 schools (1%).
Employment of Technicians: Full-time, part-time and casual Questionnaire data indicated that the most common patterns of employment were full-time only (44%), part-time only (36%) and full- and part-time (18%). Sixty-three per cent of schools with technicians indicated they employed at least one full-time technician and other schools employed various combinations of full-time, part-time and casual technicians. However, 36% of schools indicated they employed only part-time technicians. Corroborating data from the questionnaire, interview participants indicated that there was a mixture of full- and part-time, permanent and temporary employees. Two participants commented that the number of part-time staff is increasing. In one jurisdiction, many technicians are employed on contracts from 30 days to 12 months depending on the school and whether a permanent position is available. In middle schools, technicians often had a shared role between two departments such as science and home economics.

Page 15
In most cases technicians are employed as general staff, as school support officers, school assistants or laboratory assistants and often at the lowest levels in the pay structure. Technicians are often on the same classification level as general office assistants, library assistants and home economics assistants. Management of technicians Interview participants described four models by which technicians are managed in schools. These were:
1. Teacher-in-charge of the science department manages the day-to-day duties of technicians.
2. Where there is more than one technician the senior technician manages the other technicians and reports to the teacher-in-charge of science.
3. Technicians may have to report to multiple managers if they work in two or more departments of the school and this can cause conflict.
4. Management by a member of the school administration occurs in schools where technicians are employed as general assistants rather than specifically as laboratory technicians.
The quality of support given to the science teaching program would be expected to be enhanced when support is provided by a specialist technician line-managed by the teacher-in-charge of science. Status in schools The general status of technicians in schools was perceived as fairly low. However, many interview participants commented that this depended on the school, the staff in the school and the technicians themselves. One technician stated "It is good (here) because I am treated on an equal level with the teachers. In my previous school you weren't to be seen out of the prep room." (P5). A number of interviewees provided quite negative examples of the low status of technicians. Technicians in some school were perceived as general helpers rather than highly skilled professionals. As one Science Policy Officer stated “In many schools, whilst employed as lab techs, a lot of lab tech work remains undone as the tech is used as a ‘dogs body’ to do admin duties such as photocopying that staff are too busy to do” (P9).
Technicians per School Five hundred and seventy-seven schools reported the number of secondary students enrolled at their schools. Schools that had technicians were placed into school population size categories based on secondary student enrolments. The mean number of technicians and the mean number of technician hours available to support science teaching were calculated for each school size category. These data are reported in Table 2 and show that larger schools have more technicians and more technician hours to support their science programs. Standard deviations are large indicating wide variation in provision of technical support within school size categories. Table 2: Mean number of technicians and mean number technician hours per school for schools of various sizes that have technicians. (n=577)
School population
Number of
schools
Mean number of technicians per school a
SD Mean number of technician hours per
school
SD
1 – 200 40 1.00 0 15 9.34
201 – 400 92 1.08 0.267 24 10.11
401 – 600 108 1.23 0.466 36 12.08
601 – 800 116 1.47 0.652 44 15.65
801 – 1000 102 1.64 0.910 50 23.18
1001 and over 119 2.23 1.180 68 35.38
All schools 577 1.52 0.859 43 26.55 Note. a Number not FTE.
Page 16
Key Finding 2 The most common patterns of employment of technicians were full-time only, part-time only and a combination of full-time and part-time. There are indications that contract and part-time employment are becoming more common. Perceptions of technicians’ status are fairly low. Line management of technicians varies with the nature of their position description. Less management problems arise where the science technician is a specialist managed by the teacher-in-charge of science. The number of technicians employed and the number of technician hours per week increased with school size. Standard deviations were large indicating that there was considerable variation about the mean values.
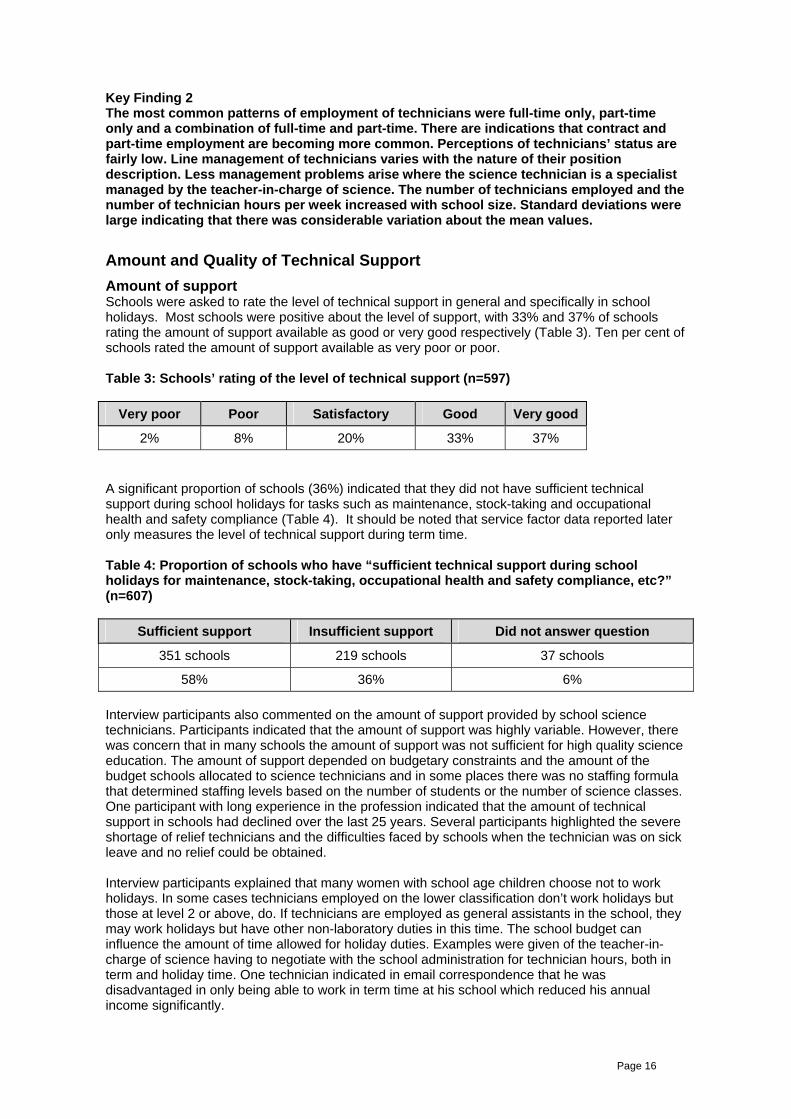
Amount and Quality of Technical Support Amount of support Schools were asked to rate the level of technical support in general and specifically in school holidays. Most schools were positive about the level of support, with 33% and 37% of schools rating the amount of support available as good or very good respectively (Table 3). Ten per cent of schools rated the amount of support available as very poor or poor. Table 3: Schools’ rating of the level of technical support (n=597)
Very poor Poor Satisfactory Good Very good
2% 8% 20% 33% 37% A significant proportion of schools (36%) indicated that they did not have sufficient technical support during school holidays for tasks such as maintenance, stock-taking and occupational health and safety compliance (Table 4). It should be noted that service factor data reported later only measures the level of technical support during term time. Table 4: Proportion of schools who have “sufficient technical support during school holidays for maintenance, stock-taking, occupational health and safety compliance, etc?” (n=607)
Sufficient support Insufficient support Did not answer question
351 schools 219 schools 37 schools
58% 36% 6% Interview participants also commented on the amount of support provided by school science technicians. Participants indicated that the amount of support was highly variable. However, there was concern that in many schools the amount of support was not sufficient for high quality science education. The amount of support depended on budgetary constraints and the amount of the budget schools allocated to science technicians and in some places there was no staffing formula that determined staffing levels based on the number of students or the number of science classes. One participant with long experience in the profession indicated that the amount of technical support in schools had declined over the last 25 years. Several participants highlighted the severe shortage of relief technicians and the difficulties faced by schools when the technician was on sick leave and no relief could be obtained. Interview participants explained that many women with school age children choose not to work holidays. In some cases technicians employed on the lower classification don’t work holidays but those at level 2 or above, do. If technicians are employed as general assistants in the school, they may work holidays but have other non-laboratory duties in this time. The school budget can influence the amount of time allowed for holiday duties. Examples were given of the teacher-in-charge of science having to negotiate with the school administration for technician hours, both in term and holiday time. One technician indicated in email correspondence that he was disadvantaged in only being able to work in term time at his school which reduced his annual income significantly.
Page 17
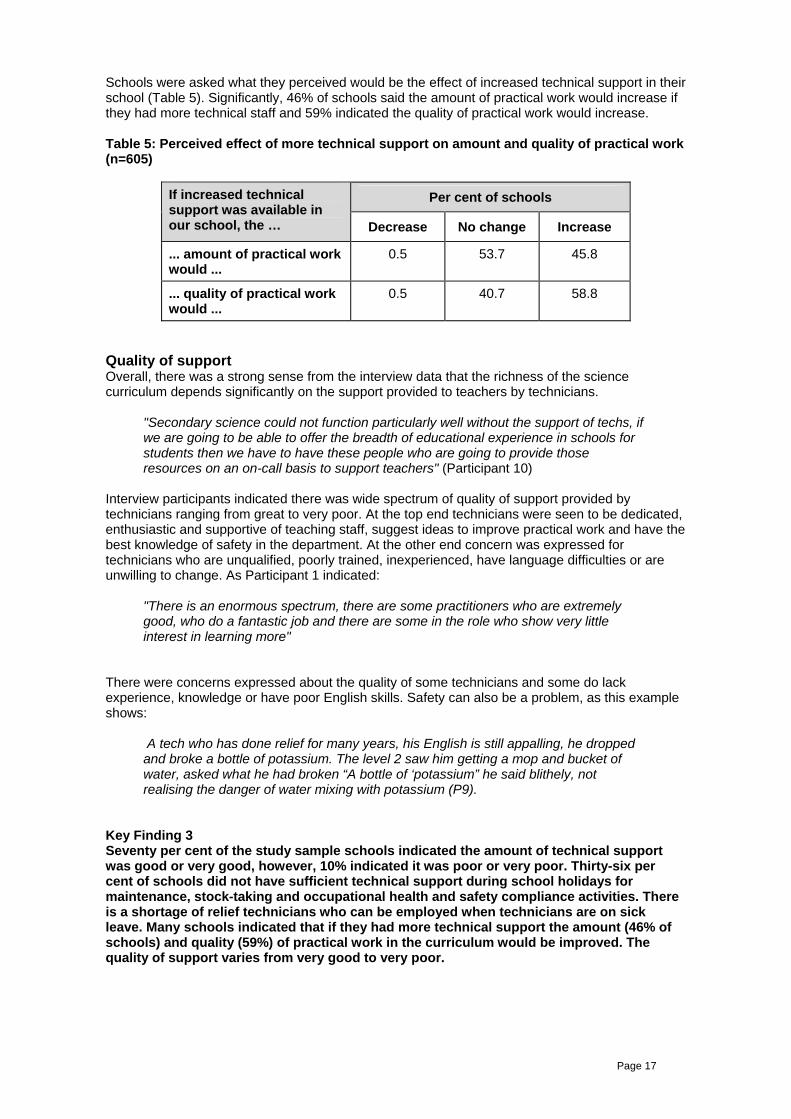
Schools were asked what they perceived would be the effect of increased technical support in their school (Table 5). Significantly, 46% of schools said the amount of practical work would increase if they had more technical staff and 59% indicated the quality of practical work would increase. Table 5: Perceived effect of more technical support on amount and quality of practical work (n=605)
Per cent of schools If increased technical support was available in our school, the … Decrease No change Increase
... amount of practical work would ...
0.5 53.7 45.8
... quality of practical work would ...
0.5 40.7 58.8
Quality of support Overall, there was a strong sense from the interview data that the richness of the science curriculum depends significantly on the support provided to teachers by technicians.
"Secondary science could not function particularly well without the support of techs, if we are going to be able to offer the breadth of educational experience in schools for students then we have to have these people who are going to provide those resources on an on-call basis to support teachers" (Participant 10)
Interview participants indicated there was wide spectrum of quality of support provided by technicians ranging from great to very poor. At the top end technicians were seen to be dedicated, enthusiastic and supportive of teaching staff, suggest ideas to improve practical work and have the best knowledge of safety in the department. At the other end concern was expressed for technicians who are unqualified, poorly trained, inexperienced, have language difficulties or are unwilling to change. As Participant 1 indicated:
"There is an enormous spectrum, there are some practitioners who are extremely good, who do a fantastic job and there are some in the role who show very little interest in learning more"
There were concerns expressed about the quality of some technicians and some do lack experience, knowledge or have poor English skills. Safety can also be a problem, as this example shows:
A tech who has done relief for many years, his English is still appalling, he dropped and broke a bottle of potassium. The level 2 saw him getting a mop and bucket of water, asked what he had broken “A bottle of ‘potassium” he said blithely, not realising the danger of water mixing with potassium (P9).
Key Finding 3 Seventy per cent of the study sample schools indicated the amount of technical support was good or very good, however, 10% indicated it was poor or very poor. Thirty-six per cent of schools did not have sufficient technical support during school holidays for maintenance, stock-taking and occupational health and safety compliance activities. There is a shortage of relief technicians who can be employed when technicians are on sick leave. Many schools indicated that if they had more technical support the amount (46% of schools) and quality (59%) of practical work in the curriculum would be improved. The quality of support varies from very good to very poor.

Page 18
Recruitment of Technicians Of the 607 schools, 40% indicated they had difficulty recruiting technicians, 55% had no difficulty and five per cent did not answer the question. The percentage of schools having difficulties recruiting technicians was slightly higher in metropolitan areas (44%) than in other locations (39%). The main reasons given for having difficulty in recruiting technicians related to the nature of applicants and the conditions of service (Table 6). The most commonly cited reasons for having difficulty with recruitment were; unsuitable applicants (42%), poor pay and work conditions (24%), and distance from the city (7%). Thirty-four schools also indicated that they had difficulty recruiting relief staff. Table 6: Reasons given by schools for difficulty with recruiting technicians (n=245) Reason No of schools Per cent of schools experiencing
recruitment difficulties Unsuitable applicants – inexperienced or not qualified 104 42 Poor pay 36 15 Hard to get relief staff 34 14 Work conditions 23 9 Location (too far from city) 16 7 Personality issues with current staff 1 0 Job satisfaction 1 0 No reason given 31 13 Many of the interview participants indicated that it is hard to find qualified and experienced people. Most schools advertised when they required technicians but the people applying were not necessarily suitable. The main reasons given for difficulties with attracting suitable staff related to the conditions of service. Pay was considered low compared to salaries for technicians in other sectors of employment such as mining and medical pathology. In some states the mining boom has drawn suitable people away from schools: “a good technician is by nature a problem solver so they can work in any industry" (P6). Participant 10 explained: “a number of techs are level 1 or 2 and they can get the same sort of pay ticking off the roll or covering books in the school library and they don’t have the same sort of safety responsibilities. There is no extra pay for extra responsibilities". One technician made an email submission to the researchers and explained that he was well qualified with a background in the chemical industry and was now looking to return to that industry.
The biggest reason I may leave this position to go to work in industry again is that the pay rate is not sufficient with the current costs of living. I am hampered somewhat by being employed during term-time only resulting in earning a salary on 40/41 weeks of the year and about 16 days of annual leave earned. If schools want to gain quality people with experience in working in sciences, then a more attractive salary may be needed.
The low position classification communicated that technicians are of low status and there is a lack of promotional pathways and many positions were temporary and did not lead to permanency of employment. Some participants also indicated that the roles in some jurisdictions are not science specialist positions and staff are required to provide general administrative support in other areas of the school, which makes the positions less attractive to well-qualified technicians. Because salary level is a major issue, some schools poach technicians from neighbouring schools by offering better pay or more hours of work. Concerns were expressed about the age profile of technicians, the imminent retirement of a large number of experienced technicians (see Appendix 7) and the need to actively recruit new technicians.

Page 19
Key Finding 4 Forty per cent of schools reported difficulty in recruiting technicians and difficulty was reported a little more frequently by metropolitan than in other schools. The main difficulties related to the poor conditions of service and the unsuitability of applicants. There was strong corroboration in the interviews of the questionnaire data that indicated that the amount and quality of technical support in schools is highly variable and that difficulties in recruiting suitable staff are strongly related to poor conditions of service and the poor match between salary and level of responsibility. Concerns were also expressed about the imminent retirement of a large number of experienced technicians.
Science Teaching Facilities at Schools Schools were asked to report the number of “equipped science laboratories (i.e. with sinks and gas outlets)” in their school. Only 577 schools answered this question. Some schools commented that they had laboratories without gas outlets (but not sinks) and this may explain why some schools did not respond to this question. The mean number of laboratories per school was 4.69, with a minimum number of one laboratory to a maximum of 14 laboratories in one school. The number of laboratories increased as the number of secondary students in the school increased in a consistent way (Table 7). Table 7: Number of laboratories compared to approximate number of secondary students in the school (n=577)
Approximate number of students in school
Mean number of
laboratories
SD Minimum Maximum
1 – 200 1.83 0.781 1 4
201 – 400 2.73 1.076 1 6
401 – 600 3.90 1.46 1 9
601 – 800 4.79 1.655 1 11
801 – 1000 5.72 1.721 2 12
1001 and over 6.90 2.222 1 14
All schools 4.69 2.278 1 14 The mean number of laboratories per school is reported by school type in Table 8. The data show that the school types with only secondary student enrolments (secondary schools and senior colleges) have the largest numbers of laboratories. The data for middle schools and K-10 schools are based on small sample sizes and would be more susceptible to sampling error. Table 8: Mean number of secondary students and mean number of laboratories for different school types (n=577 schools)
School type Mean number of secondary students on roll
Mean number of laboratories
All schools 740 4.69
Secondary schools (7/8 -12) 588 5.05
Senior colleges (Years 11 & 12) 785 5.23
Middle schools (Years 7/8 – 10) 588 3.64
K-10 schools 554 2.89
K/P – 12 schools 579 4.17
Page 20
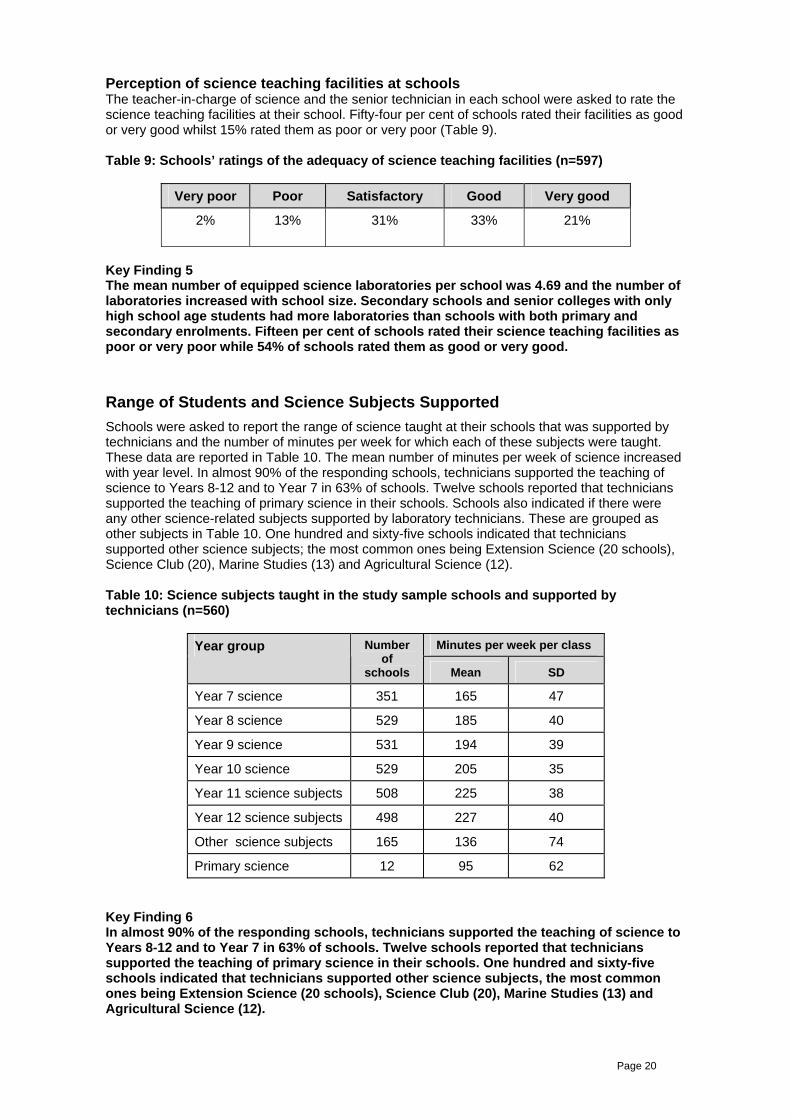
Perception of science teaching facilities at schools The teacher-in-charge of science and the senior technician in each school were asked to rate the science teaching facilities at their school. Fifty-four per cent of schools rated their facilities as good or very good whilst 15% rated them as poor or very poor (Table 9). Table 9: Schools’ ratings of the adequacy of science teaching facilities (n=597)
Very poor Poor Satisfactory Good Very good
2% 13% 31% 33% 21%
Key Finding 5 The mean number of equipped science laboratories per school was 4.69 and the number of laboratories increased with school size. Secondary schools and senior colleges with only high school age students had more laboratories than schools with both primary and secondary enrolments. Fifteen per cent of schools rated their science teaching facilities as poor or very poor while 54% of schools rated them as good or very good.
Range of Students and Science Subjects Supported Schools were asked to report the range of science taught at their schools that was supported by technicians and the number of minutes per week for which each of these subjects were taught. These data are reported in Table 10. The mean number of minutes per week of science increased with year level. In almost 90% of the responding schools, technicians supported the teaching of science to Years 8-12 and to Year 7 in 63% of schools. Twelve schools reported that technicians supported the teaching of primary science in their schools. Schools also indicated if there were any other science-related subjects supported by laboratory technicians. These are grouped as other subjects in Table 10. One hundred and sixty-five schools indicated that technicians supported other science subjects; the most common ones being Extension Science (20 schools), Science Club (20), Marine Studies (13) and Agricultural Science (12). Table 10: Science subjects taught in the study sample schools and supported by technicians (n=560)
Minutes per week per class Year group Number of
schools Mean SD
Year 7 science 351 165 47
Year 8 science 529 185 40
Year 9 science 531 194 39
Year 10 science 529 205 35
Year 11 science subjects 508 225 38
Year 12 science subjects 498 227 40
Other science subjects 165 136 74
Primary science 12 95 62 Key Finding 6 In almost 90% of the responding schools, technicians supported the teaching of science to Years 8-12 and to Year 7 in 63% of schools. Twelve schools reported that technicians supported the teaching of primary science in their schools. One hundred and sixty-five schools indicated that technicians supported other science subjects, the most common ones being Extension Science (20 schools), Science Club (20), Marine Studies (13) and Agricultural Science (12).

Page 21
Levels of Servicing Full-time equivalent technicians Appendix 5 provides a summary of the mean numbers of secondary students, laboratories, technician hours per week and number of full-time equivalent (FTE) technicians per school for all schools and for the different types of schools. Given the wide dispersion of data about the means as indicated by the large standard deviations, and the large influence a small number of extreme values can have on the mean, it was considered that median values would provide a better representation of the data. Median values are therefore reported for school size, numbers of technicians and laboratories. These data are presented in Table 11. Table 11: Median values for school size, number of laboratories and technicians by type of school (n=577) School type Number of
schools Median
number of pupils on
roll
Median number of
laboratories
Median number of technician hours per
week
Median number of
FTE technicians
a
Secondary schools (Years 7/8 -12) 344 800 5 38 1.06
Senior colleges (Years 11 & 12) 30 775 5 37 1.03
Middle schools (Years 7/8 – 10) 32 590 4 35 .97
K- 10 schools
8 380 2 23 .64
K/P – 12 schools 163 517 4 36 1.00
All schools 577 700 4 38 1.06
Note. a FTE = number of full time equivalent technician, where full time is assumed to be 36 hours per week Over all school types, these data show that the median of FTE technicians was 1.06 and they were responsible for supporting a median of 700 students and a median of four laboratories. Key Finding 7 Over all school types in the study sample with a technician, a median of 1.06 FTE technicians per school supported a median of 700 students and four laboratories. This is one measure of the level of technical support of secondary science in our schools, however, it does not take account of the time for which various classes and students are taught science. The UK ASE developed the Service Factor metric and used it in their research as a measure of the level of servicing of science which takes into account the relationship between the number of hours of technician time and the number of hours of science teaching. Service factors The range of service factors (SFs) for schools with technicians is first reported for the whole study sample and then they are reported for sectors, jurisdictions and types of schools. More detailed tables of data are presented in Appendix 5. A service factor was calculated for 557 schools, as per the ASE model and as used in the survey of school science technicians in the UK. Service factor = Technician hours per week . Hours of science teaching per week

Page 22
The technician hours per week are the sum of hours of employment in one week of all technicians working at that school during term time. The hours of science teaching per week is the sum of hours of science teaching per week for all secondary classes at that school ( i.e. Class A hours per week + Class B hours per week + Class C hours per week etc). The ASE (The Royal Society & ASE, 2001) set benchmarks for the quality of technical support for science teaching in schools. The recommended level of servicing is 0.85. At 0.6 the ASE explain that it will not be possible to deliver all functions adequately and at 0.45 functions will be markedly reduced. The full descriptions of these service standards are included in this report as Appendix 1. Service factors for the study sample of schools The range of service factors (SFs) was large with a small number of extreme values at each end of the distribution. Careful inspection of the raw data from schools which had extreme SF values revealed some errors made by schools in calculating the number of hours of science taught in their schools. These schools were omitted from the analysis. Service Factor values for the remaining schools are reported in Figure 2. Service factors ranged from 0.05 to 1.2; however, the majority of values were between 0.25 and 0.55
0.00 0.10 0.20 0.30 0.40 0.50 0.60 0.70 0.80 0.90 1.00 1.10 1.20
Service Factor (tech hours/science class hours)
0
20
40
60
Num
ber o
f sch
ools
Figure 2: Service Factor distribution for all schools that have a technician When the data are considered from a cumulative percentage perspective (Table 12), the percentage of schools with various levels of SF can be identified. Almost one-quarter of schools with technicians had a service factor of 0.3 or less, almost one-half had service factors of 0.4 or less and 70% had a service factor of 0.5 or less. Fifty-seven per cent of schools had service factors below 0.45, the lowest of the ASE benchmarks and 96% of schools had a service factor lower than the recommended standard of 0.85. Some of the schools with high SFs appear to be new schools with small enrolments which are establishing science departments.

Page 23
Table 12: Cumulative numbers and percentage of schools for increasing values of service factor – all school types (n=557)
Service factor range Number of schools
Per cent Cumulative per cent
0 0.10 2 0.4 0.4 0.11 0.20 25 4.5 4.8 0.21 0.30 107 19.2 24.1 0.31 0.40 128 23.0 47.0 0.41 0.50 130 23.3 70.4 0.51 0.60 71 12.7 83.1 0.61 0.70 47 8.4 91.6 0.71 0.80 21 3.8 95.3 0.81 0.90 10 1.8 97.1 0.91 1.00 6 1.1 98.2 > 1.00 10 1.8 100.0
Total 557 - -
Service factors for the educational sectors There was some variation in mean SF values across the three education sectors. Given that standard deviations were reasonably large, median values are reported. The median values are lower than the means because means were strongly influenced by a small number of extremely high SFs. Median SF values ranged across sectors from a low of 0.37 to a high of 0.44. The data indicate that SFs were lowest for Sector 1 and highest for Sector 3. Median SFs for all sectors are below the lowest of the ASE benchmarks. These data are represented as box plots in Figure 3.
0.00
0.20
0.40
0.60
0.80
1.00
1.20
1.40
sector 1 sector 2 sector 3
Sector
Serv
ice
Fact
or (t
ech
hour
s/sc
ienc
e cl
ass
hour
s)
Figure 3: Box plots of median service factors by sector

Page 24
The dark line in the middle of the box shows the median value and the upper and lower boundaries of the box include the second and third quartiles (25% to 75%) of schools i.e., the interquartile range. The ends of the vertical lines/whiskers show the range of values for all schools in that sector. The box plots show that the values for the middle 50% of schools are closely clustered around the median which may suggest these schools are staffed by formula. However, the whiskers show widely dispersed values for other schools with some extremely high and low values, especially for sectors two and three. Service factors for jurisdictions As expected there was variation in the medians and ranges of scores across the eight educational jurisdictions. These data are reported as box plots in Figure 4.
0.00
0.20
0.40
0.60
0.80
1.00
1.20
1.40
1 2 3 4 5 6 7 8
Jurisdictions
Serv
ice
fact
or (t
ech
hour
s/sc
ienc
e cl
ass
hour
s)
Figure 4: Box plot of median service factors by jurisdiction The data show that median SF values range across jurisdictions from a low of 0.31 to a high of 0.6; that is, the median for the sample of schools returning questionnaires in the best serviced jurisdiction is twice the median of the jurisdiction with the lowest level of servicing. The sizes of interquartile ranges are similar for most jurisdictions; however, the sample ranges do vary considerably. Service factors for school types Secondary and K/P-12 schools were the two largest samples of schools and had median SF values of 0.41 and 0.42 respectively. When the SF metric is used to compare levels of servicing at different school types, the data show that secondary and K/P-12 schools had the lowest levels of servicing. However, it should be noted that the data for school types with much higher levels of servicing (middle schools and K-10 schools) were based on much smaller sample sizes and would be more susceptible to sampling error. These data are represented graphically as box plots in Figure 5.

Page 25
0.00
0.20
0.40
0.60
0.80
1.00
1.20
1.40
Secondary K/P to 12 Seniorcollege
Middleschool
K to 10school
Type of School
Serv
ice
Fact
or (t
ech
hour
s/sc
ienc
e cl
ass
hour
s)
Figure 5: Box plots of service factor medians by school type The box plot for secondary schools shows that the middle 50% of schools are grouped over a narrow range and are close to the median; however, there are a number of outlier schools with SF values much greater than the median. The box plot for the K-10 schools is quite different with the middle 50% of schools spread over a wide interquartile range. Key Finding 8 Service Factors (SFs) for the study sample of schools that had technicians varied from a minimum of 0.05 to a maximum of 1.2 with a mean of 0.45 and a median of 0.41. There was some variation between medians for sectors, jurisdictions and school types. There was a wide range of SF values within some sectors and jurisdictions. Median SFs range from a low of 0.37 to a high of 0.44 across sectors and from a low of 0.31 to a high of 0.6 across educational jurisdictions. Secondary schools and K/P-12 schools had lower median SFs than other school types. The median SF for all schools in the study sample and for all sectors was below the lowest of the ASE benchmarks.
Schools Without Technicians Only 8% of the study sample (53 schools) was schools without a technician. About half of these schools (49%) were K/P-12 schools, which are often quite small regional schools. More detailed data is provided in Appendix 6. Sixty per cent of schools without technicians in the study sample were from provincial or remote areas while about 40% were from metropolitan areas. The major reason given for having no technicians in these schools was the school being too small (51% of schools) and 39% of these schools indicated budget constraints as reason for having no technician. Only a small number of schools gave difficulty in recruiting a suitable person as a reason (Table 13). In 92% of the schools without technicians, the science teacher performed the duties of the laboratory technician, an arrangement criticised in the literature (LTAV, 2007) and by interview participants.

Page 26
Table 13: Reasons for not having a laboratory technician (n=53)
Reason Number of responses a
Per cent of responses
School too small 36 51 Budget constraints 27 39 Difficulty with recruiting suitable person 5 7 Other 2 3 Total responses a 70 100
Note. a Schools could give more than one response These schools without technicians were asked to predict the effect of having a laboratory technician on the amount and quality of practical work included in the science curriculum. As shown in Table 14, the majority of schools said that it would lead to an increase in the amount (77% of schools) and quality of practical work (81%). Table 14: Predicted effect of the presence of a technician on the quantity and quality of practical work in schools without technicians (n=52).
Per cent of schools with response If the school did have a lab technician the ...
Decrease No change Increase
... amount of practical work would ...
2 21 77
... quality of practical work would ...
2 17 81
Key Finding 9 Of the schools without technicians in the study sample, about half were K/P-12 schools, 60% were from provincial and remote locations and 40% were from metropolitan locations. The main reasons given for having no technician were that the school was too small and budgetary constraints. In most cases the science teacher performed the duties of technician and a large majority of schools without technicians indicated that having a technician would improve the amount and quality of practical work in the science curriculum.
The Technicians
Background of Technicians The results in this section are based on responses from all technicians in schools that responded to the survey. More detailed data are provided in Appendix 7. The total number of technicians who responded was 824 and these came from 607 schools. Age, gender and experience Figure 6 shows the age and gender distribution of laboratory technicians in schools. The gender breakdown is 84% female to 16% males. Over 40% of technicians are over 50 years of age and six per cent are more than 60 years old. Only 22% are under 40 years of age. Concern was expressed by a number of interviewees about the aging technician population and the imminent retirement of a number of experienced technicians in the next few years. One participant indicated that one-fifth of the technicians in his jurisdiction are expected to retire at the end of the year.

Page 27
Figure 6: Distribution of technicians by age and gender There is a wide range of experience amongst technicians as shown in Table 15. The mean number of years of experience in school laboratories was 10.8 years and 5.9 years in non-school laboratories. Two per cent had no experience in school laboratories and 35% had five or less years of experience. Twenty-seven per cent of technicians had more than 15 years of experience in school laboratories. Sixty-one per cent of technicians had experience in non-school laboratories and 21% had more than 10 years of experience in these laboratories. Table 15: Experience of technicians in school and other laboratories (n=824)
Per cent of technicians Years of experience
In school laboratories In non-school laboratories
No experience 2 39 1 – 5 years 35 22 6 – 10 years 22 18 11 – 15 years 13 10 16 – 20 years 13 6 21 – 25 years 7 2 26 – 30 years 4 2 More than 30 years 3 1

Page 28
Membership of Professional Associations Two-thirds of the 824 technicians reported that they belonged to a professional association, and of these most belonged to a local science technicians association. Five per cent belonged to a science teachers association (Table 16). Table 16: Membership of professional science organisations by technicians (n=824)
Professional association a Number Per cent of technicians
Do not belong to a professional body 264 32
Belong to a professional body 547 66 Did not indicate 13 2
Belong to …. Local Science Technicians Association 540 66
Local Science Teachers Association 41 5 Other 15 2
No association specified 5 1 Note. a Respondents could give more than one association Qualifications Nine per cent of the 824 technicians had no TAFE/VET or other laboratory work qualifications that were relevant to their role. TAFE/VET qualifications held by the technicians are shown in Table 17. Thirty-eight per cent have a TAFE/VET qualification associated with laboratory work, the most common ones being a Certificate IV in Laboratory Techniques (or equivalent) or a Diploma of Laboratory Technology (or equivalent). Table 17: Australian TAFE/VET laboratory work qualifications held by technicians (n=824)
Australian TAFE/VET qualification Number Per cent of technicians
None held 506 61
Have qualification 310 38
No response 8 1
Of those who said yes (n=310)
Did not indicate qualification 5 1
Certificate II in Sampling and Measurement (or equivalent) 14 2
Certificate III in Laboratory Skills (or equivalent) 58 7
Certificate IV in Laboratory Techniques (or equivalent) 113 14
Diploma of Laboratory Technology (or equivalent) 130 16
Advanced Diploma of Laboratory Operations (or equivalent) 33 4
Other (Certificates in laboratory assisting, chemical technology, engineering, applied science medical technology, introductory lab skills; Advanced certificate in laboratory technology; Associate diploma in electronics; Diplomas in applied science, medical nucleography, applied chemistry; Associate degree in laboratory technology.)
35 4

Page 29
Eighty-two per cent of technicians reported that they held qualifications other than TAFE/VET laboratory work qualifications that they considered relevant to their work in schools (Table 18); some of these were TAFE/VET qualifications in areas such as teachers aid certificates. Half of the technicians had a first aid qualification, almost a third had a science degree and 28% had some other sort of TAFE/VET certificate or diploma. Table 18: Other relevant qualifications held by technicians (n=824) Qualification a Number who held qualification Per cent of technicians No other qualification 152 18
Yes, have 672 82
Of those who said yes,
First Aid 418 51
Bachelor of Science 258 31
Other TAFE/VET certificate/diploma (includes child support, teachers aid, food handling, electrical fitter)
229 28
OH&S (includes Chemwatch) b 84 10
Diploma of Education 66 8
Masters or PhD 33 4
Health science qualification (incl doctor, nurse, etc)
24 3
Overseas lab tech qualification 14 2
Have a qualification but not defined 16 2
Note. a Technicians could report as many as three qualifications b Chemwatch is a commercial organisation that provides training in use of their web based system for managing chemicals e.g., access to Materials Safety Data Sheets, risk assessment preparation and labels for decanted chemicals. Most of the other non-TAFE/VET qualifications were earned in Australia, while for example 21 science degrees had been earned in Asia. Key Finding 10 A large majority of technicians are female and 40% of technicians are over 50 years of age. Only 22% are under 40 years of age. The mean number of years of experience in school laboratories was 10.8 years and 5.9 years in non-school laboratories. Nine per cent of technicians have no relevant post-secondary education while 38% have a relevant TAFE/VET laboratory work qualification and 82% have some other related qualification such as first aid and science degrees. Most of the non-TAFE/VET qualifications were earned in Australia. Two-thirds of technicians report that they are members of a local school science technicians association.
Training of Technicians Data for this section is from two sources: interview participants were asked how technicians are trained and provided with ongoing training once in the role, the adequacy of current training provisions and how training can be improved whilst in the questionnaire technicians were asked about the training they had accessed in the past five years.

Page 30
Initial training Initial training varies widely. The types mentioned by interview participants were:
1. A TAFE/VET course. Most commonly this is the Certificate IV in Laboratory Skills, a 12 month course with some work experience. This course caters for all laboratory technicians, with an emphasis on providing staff for the mining and pathology industries; however, it is not available in all states. Two-distance education courses were also described, that require either the practical component to be done in the workplace (like an apprenticeship system) or as a block of study in the holidays. However, these courses had limitations.
2. Prior experience in industry. Some school technicians come from a background in the mining, industry, medical areas (pathology) and the wine industry. A number of these are women returning to work after children wanting more flexible hours. Prior experience in laboratory work is generally much narrower and more specialised that school based work.
3. Bachelor of Science degree. Many of these science graduates are from overseas and often have no specific training in laboratory work.
4. No training at all. People recruited by schools lacking any training have to learn by experience and with the training support that can be provided by the school.
Adequacy of initial training Interview participant’s views on the adequacy of the training ranged from generally OK to totally inadequate, depending on their role and point of view. OH&S was perceived to be generally well covered. None of the TAFE/VET courses specifically focussed on training school laboratory technicians and in one Certificate IV course there were just a few sessions specific to schools. In another state, the lecturer indicated that the course prepares them well in chemistry, biology, aseptic techniques, titration, sample preparation, basic bench skills, OH&S and laboratory management but there was no physics or data logging type work. Science policy officers indicated that science curriculum support is not covered at all in the available courses. Ongoing training Interview participants indicated that laboratory technicians associations provide professional development support and training in most jurisdictions, either via a central organisation or through small groups within regions. The science teachers associations provide some training and the annual CONASTA conference offered by the Australian Science Teachers Association has a laboratory technician stream. Given that CONASTA rotates through the jurisdictions, access to a conference within a technician’s jurisdiction may be limited to once in eight years. One state provides training by regional technicians but there are problems with this as this technician still has a workload at their own school which has to be picked up by the other technicians when the regional technician is conducting training. One state has a training and development officer who organises training and development for all staff in government schools. Technicians regularly do training with external providers for First Aid. Ongoing training is not compulsory in any jurisdiction and much depends on the enthusiasm of the individual technician, the encouragement of the teacher-in-charge of science and the availability of relief in the schools. Participation in Ongoing Training Technicians were asked to report any in-school or out-of-school training they had completed in the last five years (2004-2008). More detailed data are provided in Appendix 7. Participation in ‘In-school training’ Almost half of the 824 technicians (47%) reported they had completed no training at their school in the past five years. The most common forms of in-school training were OH&S training followed by general school PD and computer/IT training. Only 12% had been provided with induction training in the past five years while 37% of technicians had five years or less experience in school laboratories and would have commenced their career as a school science technician within the last five years. This is surprising given that induction training is an expectation of OH&S legislation. The most common providers of in-school training were outside organisations who accounted for 47% of trainings. The head of science (16%), senior technician (10%), other school staff (18%) and the education department (6%) also provided in-school training for technicians. Induction training was normally provided by the head of science or senior technician while OH&S training was most commonly provided by outside organisations.

Page 31
Participation in ‘Out-of-school training’ More than one quarter of technicians (27%) reported that they had done no out-of-school training in the last five years. The most common forms of out-of-school training were a general lab technician PD/in-service (54%), attending a conference (44%) and OH&S training (31%). Training was most often provided by laboratory technicians associations (to 56% of technicians) and other outside training organisations (47%). Science teachers associations (19%) and education systems (12%) were also important providers of training. Surprisingly TAFE only provided out-of-school training to 7% of the technicians. General lab technician PD/in-service was generally provided by laboratory technician associations, other training organisations or education systems while conferences were generally provided by laboratory technician or science teacher associations. Most of the OH&S training was provided by other training organisations. Most technicians reported that their schools supported their training costs (58% full costs, 32% some costs) while only seven per cent indicated that they were not supported. Key Finding 11 The initial training of technicians varies from TAFE/VET courses for technicians, science degrees to on the job learning by experience. None of the forms of training is satisfactory as they are not specifically designed for technicians employed in schools. One half of technicians reported they had completed no in-school training and one quarter reported they had completed no out-of-school training in the last five years. The most common forms of in-school training were OH&S training, general school PD and computer/IT training. The most common forms of out-of-school training were general in-service laboratory technician meetings, conferences and OH&S training. Ongoing training is provided by technicians, technicians associations, science teachers associations, education systems and other training providers. There need to be incentives to encourage all technicians to engage in ongoing training.
Support for Technicians Access to advice and support More than half of the technicians reported that they had access to the Internet, a technician at another school, online discussion boards, the local science technicians association and WorkSafe as sources of support (Table 19). Table 19: Access to support by technicians (n=824) Source of support
Per cent of technicians with access to support
Internet 95 A technician at another school 90 Online discussion board e.g., Chemtalk 76 Local Science Technicians Association 73 WorkSafe 67 Local Science Teachers Association 41 Regional or Senior Advisory Technician 37 CLEAPSS UK science advisory service 19 Chemwatch a
10 Other a (other teachers/staff, outside company, union, ) 4 Note. a These sources of support were not listed on the questionnaire but were coded due to frequency of responses. Regional science technicians were only available to a significant extent in two states, WA and Victoria, plus a few responses from Queensland. The UK CLEAPSS science advisory service is only available by subscription and was therefore only available to 19% of technicians. Similarly,

Page 32
access to science teachers associations may have been limited by membership fees. The most frequently used sources of support were those that were Internet based and accessible by computer, while those commonly never used by technicians were WorkSafe and the local science teachers association (Table 20). Table 20: Frequency of use of available support by technicians (n=824)
Frequency of use as per cent of technicians (n=824)
Source of support
Often (Daily-weekly)
Sometimes (Termly-annually)
Never used
Internet 64 20 11 A technician at another school 11 45 33 Online discussion board e.g., Chemtalk 28 17 30 Local Science Technicians Association 14 28 31 WorkSafe 5 21 40 Local Science Teachers Association 0 4 36 Regional or Senior Advisory Technician 6 11 19 CLEAPSS UK science advisory service 0 1 17 Chemwatch 5 4 1 Other (other teachers/staff, outside company, union) 2 1 1 In 85% of schools, technicians reported that they had convenient access to a source of advice on laboratory techniques and procedures and occupational health and safety issues, and 80% had access to advice on animal ethics codes and requirements. A number of posts to an online discussion board indicate that some technicians are struggling to identify sources of advice about some of the most fundamental aspects of chemical safety. For example, when stocktaking some technicians were seeking advice about where to find information on categorising chemicals so they could be stored safely in appropriate classes e.g., oxidisers, reducers, organics and inorganics. Support available Interview participants were asked about the forms of support that are available for technicians that can help them with authoritative advice on laboratory practices, labelling, handling and storage of chemicals, codes of practice for using animals in teaching and new laboratory technologies. The main sources of support for laboratory technicians were networks of technicians/technician associations. Technicians accessed this support either directly via contacts or via chat rooms in on-line forums. The most frequently mentioned forums were the Queensland and WA forums which were accessed by technicians in these states. Other sources of support were heads of department, teachers and regional technicians and advisors in jurisdictions that employed them. In one jurisdiction there is an OH&S support person in the state education department. For lone technicians or technicians in isolated schools, the internet was also a valuable source of support and help, as were textbooks. For help with labelling and handling chemicals, all of the above were used plus two other on-line resources; Chemwatch and the UK-based CLEAPSS advisory service. Both of these are accessed by subscription. A majority of interviewees with connections to schools indicated that Chemwatch access was available to all schools in their jurisdictions as the subscription was paid by education systems. CLEAPSS was more likely to be available to independent schools as it was considered

Page 33
more expensive. In one state all technicians were encouraged to do the chemical safety course presented by the Regional Technicians Group and facilitated by the science teachers association. In all jurisdictions, the animal ethics committees in government education departments were the major source of guidance and advice on animal welfare issues. Many indicated that a lot of schools did not use animals, either because of lack of technicians or lack of demand from teachers. Support with the adoption of new laboratory and learning technologies was very limited in some situations and better in others. In some situations the laboratory technicians were the last to know about new technologies, whilst others relied on internet searching for information, manufacturers’ manuals or workshops at science teacher and technician conferences. Occasionally, technicians in some schools were sent on training courses along with the science teachers. A number of email submissions indicated that support for technicians was inadequate and they noted the lack of induction and poor access to computers and telephones which could be used to seek advice and support. Key Finding 12 More than half of the technicians reported that they had access to the Internet, a technician at another school, online discussion boards, the local science technicians association and WorkSafe as sources of support. The most frequently used sources of support were those that were Internet based and accessible by computer. Support mechanisms for technicians are highly variable across jurisdictions and sectors. Access to authoritative advice and the quality of advice available through support networks is variable and concerns have been expressed about the accuracy of advice provided by discussion boards.
The Role of the Technician The results in this section were coded from data supplied by the teacher-in-charge of science and the senior or only technician at the school. Duties associated with laboratory work are reported first followed by other duties. More detailed data are provided in Appendix 7. Duties associated with laboratory work The teacher-in-charge of science and technician first responded to a list of duties and indicated who performed them. These data are summarised in Table 21. In a majority of schools technicians perform a wide range of duties based in the laboratories, the preparation room and tasks associated with health and safety. Some technicians are also responsible for animal care, ensuring the school complies with animal ethics requirements, and for the training and supervision of other technicians. There are some tasks which are performed by technicians in some schools but are the responsibility of science teachers at other schools rather than technicians. These responsibilities include: maintaining financial records and operating the science budget, trialling practical activities, demonstrating and explaining science equipment to teachers, writing risk assessment sheets for science activities, and housekeeping duties such as keeping laboratories tidy and taking equipment to the laboratories for lessons. Some duties were performed by other staff within the school. For example, conducting safety testing and tagging of electrical equipment was more often done by another person (79%) than the technician (13%). First aid was performed by another person, probably the school nurse, in about half of the schools while in the other half of schools the technician was responsible for first aid.

Page 34
Table 21: Duties associated with laboratory/practical work and who does them (n=604)
Per cent of schools where this person performs duty a
Duties Senior/The Lab.
Technician
Assistant Lab.
Technician Science Teacher Other Not
Applicable
Practical work in the laboratory
Deliver equipment to rooms and collect equipment from rooms 69 15 38 2 0
Keep laboratory clean and tidy 79 19 24 12 0
Assist the teacher or students with equipment 89 15 13 0 0
Work in the preparation room
Check in and store chemicals and equipment 95 15 1 0 0
Keep preparation room clean and tidy 93 21 1 1 0
Make up solutions, reagents and media 95 17 2 0 0
Carry out maintenance and repair of equipment 90 15 4 13 0
Trial practical activities 84 13 29 0 1
Store chemicals in correct classes and conditions as required by legislation 95 14 2 0 0
Update file of Material Safety Data Sheets 94 13 2 0 0
Write risk assessment sheets for preparation room tasks 73 7 14 2 9
Write risk assessment sheets for teaching activities 40 4 52 2 8
Label chemicals in compliance with legislation 94 14 2 0 0
Coordinate use of practical resources and facilities between science teachers 89 13 16 1 0
Demonstrate and explain use of equipment to teachers 82 10 26 2 2
Management of preparation room
Place orders and check deliveries 94 10 5 2 0
Maintain financial records 65 6 23 18 2
Operate the science budget 47 4 49 20 2
Conduct stock-take of chemicals and/or equipment 94 15 2 1 0
Animal Care
Routine feeding, care and monitoring of animals 43 9 11 2 44
Monitor animal welfare 43 8 10 2 43
Ensure compliance with animal ethics codes 51 6 15 34
Health and safety
Ensure safe storage of radioactive sources 59 6 6 1 35
Ensure safe disposal of hazardous wastes 93 10 5 1 1
Conduct safety checks on equipment 71 9 5 31 2
Conducts safety testing and tagging of electrical equipment in compliance with legislation 13 1 2 79 8
Check first aid kits and equipment 58 8 2 36 5
Obtain relevant licences, permits and external safety checks 37 2 12 43 13
Update/advise science staff on health and safety legislation and procedures 62 4 19 22 2
Provide First Aid to science students and teachers 46 7 19 49 5
Supervision of other laboratory staff
Induct and train other laboratory staff 42 2 6 4 52
Prioritise tasks and plan work of other laboratory staff 37 3 4 2 57 Note. a Some schools indicated that more than one person performed some duties, hence the percentages in each row do not sum to 100.

Page 35
Other duties The technicians reported that their roles often included other science-related duties such as shopping for science consumables, demonstrating in science classrooms, maintaining the science garden and meeting visiting speakers. Teachers-in-charge of science and technicians also indicated how often technicians performed a number of duties not directly associated with science laboratory work. In more than 40% of schools, technicians sometimes or often were required to provide learning technologies support, supervise students, assist in other learning areas, perform clerical duties, set up displays, locate library resources, attend science department and OH&S meetings. In 71% of schools, technicians were always responsible for locking-up the science department, which suggests technicians have an important role in securing the chemicals and expensive equipment found in preparation rooms and laboratories. There were several additional comments from technicians indicating they would like to be included in science department meetings to improve communication with teachers and to contribute to planning; a theme that emerged in the interviews. In some jurisdictions laboratory technicians are employed as general assistants or SPOs or SSOs and have duties other than those of a laboratory technician as part of their job description. Also, in smaller schools the laboratory technicians are employed part-time and make up a full-time load by taking on roles in other areas such as home economics, the library and administration. Key Finding 13 Science technicians have diverse and demanding roles. In addition to preparing and maintaining resources for laboratory classes, they have significant responsibilities for health and safety, first aid, operating budgets, training and supervising other technicians, the care of animals and ensuring compliance with relevant codes, and security of the school’s science department. Some technicians are sometimes required to supervise students. In addition many technicians perform a number of more routine ‘housekeeping’ and administrative duties within the science department and some work across a number of departments within schools.
Technician’s Confidence with Tasks Each technician was asked to indicate whether they were confident to perform a number of tasks to a competent level, were in need of support or further training to perform the tasks competently or whether the task was not required in their current role. These data are reported in Table 22. Sixty-five per cent or more technicians indicated they were confident with 13 of the 26 tasks, however, 20% or more technicians indicated they were in need of further support or training to competently perform 19 of the tasks. Many of these tasks related to newer laboratory practices and/or technology (e.g., working with data loggers) and are shaded in green in the table. However, of greatest concern were the 25% or more technicians who indicated they needed further support or training with a number of important safety issues. These are first aid, accident and emergency procedures, fire extinguishers, disposal of hazardous waste, radiation safety and preparation of risk assessment sheets and are shaded orange in the table. This is worrying given that the science technician is often considered an important source of advice on safety matters in science departments. A number of posts to an online discussion board indicate that unqualified technicians in some schools are unsure about what to do with dangerous chemicals such as chloroform and mercury and whether they are allowed in schools. Several posts were noted seeking advice on the venting of cabinets used to store flammable chemicals and expressing concerns about the health effects of breathing vapours from unvented cabinets.

Page 36
Table 22: Technician confidence with performing tasks associated with laboratory practice (n=824)
Per cent of technicians Task
Confident Need support or further training
No applicable (not part of role)
Making up solutions, reagents and media 94 6 1
Handling chemicals safely 94 6 0
Requirements of Material Safety Data Sheets 92 7 0
Labelling chemicals to comply with legislation 89 11 1
Storing chemicals in correct classes and conditions as required by legislation 86 13 1
Accidents and emergency procedures 73 25 1
Disposal of hazardous wastes 71 28 2
Fire extinguishers 70 28 2
Budgeting and maintaining financial records 70 15 15
Preparing risk assessment sheets for hazardous substances and procedures 69 27 5
First Aid 69 25 6
Forensic science: fingerprinting and chromatography 68 22 9
Working with digital cameras 67 25 8
Computer and ICT skills 63 36 1
Microscopy and microscope servicing 59 37 4
Requirements of animal ethics codes of practice 57 23 19
Microbiology / biotechnology 57 33 10
Maintaining aquaria, vivaria and animal handling, plant care 51 22 27
Training and supervision of other technicians 46 12 42
Organising rock collections 42 45 14
Electrophoresis 37 38 25
Radiation safety 35 33 32
Working with data loggers 30 57 13
Rocketry 23 41 36
Robotics and electronics 17 60 24
Setting-up telescopes for astronomy 14 45 41
Key Finding 14 Twenty per cent or more technicians indicated they were in need of further support or training to competently perform 19 of 26 tasks. Many of these tasks related to newer laboratory practices and/or technology (e.g., working with data loggers). However, of greatest concern were the 25% or more technicians who indicated they needed further support or training with a number of important safety issues (e.g., first aid, accident and emergency procedures, fire extinguishers, disposal of hazardous waste, radiation safety and preparation of risk assessment sheets). These data suggest there is an unmet training demand.
Improvements to the Training, Support and Roles of Technicians Interview participants and technicians and schools were asked to suggest any improvements or changes to the training, support and role of technicians. The questionnaire included an open-ended section in which technicians could respond to questions about changes they would like to see in the training, support and roles of technicians. Only 309 schools responded to all three parts

Page 37
of this section. It could be assumed that those that did not respond may not have had any pressing issues, or given that in many schools this section would have been completed by the technician and the teacher-in-charge of science together, that the technician may have been constrained in what could be reported in front of their line manager. The suggested changes reported by technicians were coded into categories and the frequency of responses in each category is reported in the following tables. Interview participants were also invited to make recommendations for change. Changes to training Thirty-four per cent of questionnaire respondents indicated that the training of school technicians needs to be specifically designed for the needs of school science technicians rather than just part of a general laboratory technicians courses which are often designed primarily for those working in mining and medical contexts. Regular updates and retraining in the use of equipment, in first aid and OH&S were requested by one-quarter of respondents and almost one-fifth required further IT training (Table 23). Table 23: Technicians’ responses to the question “What changes to your training would enable you to provide better support to the teaching of science in your school?”
Changes to training
Number Per cent of
respondents (n=309)
Per cent of all schools
(n=604)
None its OK 34 11 6 Technician training needs to be specific for schools 106 34 18
Regular update/training on equipment use, new equipment 78 25 13
Regular updates/training first aid/OH&S 78 25 13
IT training 57 18 9
Paid PD/relief for PD 30 10 5
Make available on-line/ for country people 24 8 4
Regular updates/training on animal ethics 5 2 1
Training managing students/conflict resolution 4 1 1
Chemwatch 3 1 0
Credit workplace learning 2 1 0
Total number of responses 421 There was general agreement amongst interview participants that training needed to improve. TAFE/VET courses should be designed so that they specifically cater for school laboratory technicians, rather than school technicians completing the existing courses that are focused on the needs of the mining and pathology industries. The role of the school technician is quite different to that of a mining technician in that school technicians support completely different types of laboratory work, has different risk assessment scenarios and must manage different storage situations. It was also suggested that training courses need to have a greater practical component based in schools and a stronger link to the science curriculum. “There needs to be a specific focus on professional learning through the curriculum pathway, not just OH&S, so they understand the whole gamut of education, so they can be a real partner in the process and not just the person who gets out the beakers etc.” (P10). Training courses need to have units in all major curriculum areas of science as well as general organisation of materials and technology skills. Participants stated that: "Teachers need to be able to rely on the knowledge of technicians. They need to know

Page 38
about all areas of science not be specialised" (P2). “Laboratory manager(s) must have a good grounding themselves in of all the sciences so they are intuitive about being able to support teachers with things they want (P 10). Five interviewees mentioned that training needs to be ongoing. Regular updates need to be available and preferably provided by the education systems. A number mentioned the importance of providing incentives for technicians to undertake further training by linking it to promotion and pay. One mentioned the importance of improving communication between training providers and school technicians so that their needs can be better met. Two spoke of the need for training to be available in a form suitable for people in remote locations. Interview participants made the following recommendations for changes to training:
1. There needs to be a training course qualification specifically for school laboratory technicians (4 interviewees). Training needs to focus on all science curriculum areas (1 interviewee).
2. There needs to be a mandatory minimum level of training/qualification for employment as a laboratory technician. (3 interviewees)
3. Regular ongoing training needs to be provided by the jurisdictions and seen as required for promotion. (2 interviewees)
Key Finding 15 Initial training needs to better address the specific needs of school science technicians, cover all science disciplines and be set in a curriculum context. Regular ongoing training is needed for technicians and there should be incentives to encourage technicians to participate in ongoing training. Changes to support The most commonly requested changes to support from questionnaire respondents related to having more technicians or hours of technician time available to service the needs of the science department (24% of respondents) and more support from staff and school administration (24%). In addition, many technicians indicated there was a need for more support from the laboratory technicians association, improved maintenance of science facilities, better facilities in the science department and a central resource of procedures and chemical labels (Table 24).

Page 39
Table 24: Technicians’ responses to the question “What changes to your support would enable you to provide better support to the teaching of science in your school?”
Changes to support
Number Per cent of
respondents (n=263)
Per cent of all schools (n=604)
None its OK 41 16 7
More technicians 64 24 11
More support from staff and administration 63 24 10
More from lab tech association, advisory staff 37 14 6
Better facilities, regular maintenance 27 10 4
Central archive of standard procedures/chemical labels 26 10 4
More networking between schools in area 16 6 3
Keep informed of curriculum changes 15 6 2
Feel isolated in school 14 5 2
More ICT support 11 4 2
Access to loan equipment 5 2 1
Agreed support ratio/formula 5 2 1
Relief for technicians when absent 2 1 0
Provide induction for all new staff 1 0 0
Total number of responses 327 Interview participants linked some OH&S issues to their needs for improved support and echoed many of the points made by the questionnaire respondents. They made the following recommendations:
1. Principals need to take on the duty of care for OH&S as the law states (1 interviewee) 2. Recognise that technicians have increased responsibility for safety now with more
teachers, especially in middle schools, not having a significant background in science. (2 interviewees)
3. Technicians are provided with a list of allowed chemicals for schools and information about approved mechanisms for disposal of old and unused chemicals. (1 interviewee)
4. Communication between laboratory technicians/managers in schools in regions needs to be more formalised (1 interviewee)
5. Better support is needed for laboratory technicians especially in country regions (2 interviewees)
6. Need a formula for allocation of technicians to schools that takes into account numbers of classes and students doing science (5 interviewees). The number of science technicians per school needs to increase if science is to remain a practical subject. (1 interviewee) “I would like to see science retain its practicality, without techs many teachers would baulk at doing much prac at all.” (P13).

Page 40
Key Finding 16 The most commonly requested changes to support related to having more technicians or hours of technician time available to service the needs of the science department and more support from staff and school administration. Interview participants confirmed this, indicating that staffing levels need to be improved and regulated. Technicians also required greater support with OH&S issues and an authoritative source of advice on laboratory procedures and safety. Changes to the role of technician The technicians identified a number of changes to their roles that would enhance the support they could provide to the science teaching program of the school (Table 25). More than one-third of respondents indicated they needed more technician time to service the demands of the science department, one-quarter indicated that technicians need greater recognition and status, and some wanted more opportunity to be involved in science department meetings, have better communication and share their knowledge with teachers, and contribute to planning. Some indicated that they would be more effective if they had less non-science laboratory related duties. Table 25: Technicians’ responses to the question “What changes to your role would enable you to provide better support to the teaching of science in your school?”
Changes to role
Number Per cent of
respondents (n=215)
Per cent of schools (n=604)
None its OK 41 19 7
More time to complete the work 73 34 12
Improve status, recognition 53 25 9
Work with teachers more, share knowledge, involved in planning 34 16 6
Less non-science lab duties 30 14 5
Duty of care, legal responsibilities need clarifying 12 6 2
Want to help in classroom more 8 4 1
Manage budget (not HOD) 4 2 1
Total number of responses 255 Status and conditions of service Some earlier identified themes were further developed in the ‘any other comments’ section of the questionnaire. Many indicated they enjoyed their jobs; however, there is a need for better pay scales, status and recognition of the value of their work especially given the high expectations placed on them by the science teaching staff (Table 26).

Page 41
Table 26: Technicians’ responses to the question “Do you have any other comments about your role as a laboratory technician?” (n=555) Other comments
Number Per cent of respondents
Per cent of schools
None given 309 56 51
Positive, like the job 75 14 12
Better status and recognition needed, be valued 85 15 14
Low pay/need right pay scale for the job 73 13 12
A very demanding job/high expectations by teachers 63 11 10
Job description for levels needs to be clearer 20 4 3
Better communication between teachers and techs needed 14 3 2
Have to coordinate multiple roles in the school 12 2 2
Lack of work in school holidays 10 2 2
Lack of safety knowledge of teachers 9 2 1
Lack of a career/promotion pathway 9 2 1
Total number of responses 679 These issues were also discussed with the interview participants who made the following recommendations:
1. Better pay for all technicians. (6 interviewees) 2. Higher status and recognition for laboratory technicians. (6 interviewees) 3. Technicians to have their own employment classification system, not to be grouped with
other more general assistants in schools. (6 interviewees) 4. There needs to be a recognised career pathway for technicians with reward and promotion
to attract and retain them in schools. (6 interviewees) 5. Security of employment for technicians is desired. (2 interviewees) 6. Australian Government to fund technicians in primary schools (1 interviewee)
Key Finding 17 Many technicians and interview participants indicated that technicians need greater recognition, status, salaries and career pathways. They also need their own employment classification system. Some technicians wanted more opportunity to be involved in science department meetings, have better communication and share their knowledge with teachers, and contribute to planning. Some indicated that they would be more effective if they had less non-science laboratory related duties and many indicated that staffing levels need to be improved. The importance of the role of technicians and the extent to which their role is under-valued were consistent themes emerging from the data and are best illustrated with the following quotations from the interviews:
“To acknowledge through whatever process possible, pay etc that they are handling often quite dangerous materials and that they are responsible for the safety of students in partnership with teachers” (P10). “The last 10 years has seen our workload increase because of labelling, hazardous chemicals, requirements and MSDS and problems with inexperienced teachers ... I have three teachers in my school teaching science who are PE or math trained, they

Page 42
just see an experiment in the book and write it out and when I see it I think 'Oh oh, I think this is best done as a demo’ ... and they will quite often come up and ask 'I don’t understand this, will you just run through this experiment with me', which I don’t mind" (P5).
Summary of Key Findings The key findings that emerged from the analysis of the data have been listed in Table 27. Table 27: Summary of key findings Number Key finding
1 The study sample included mainly schools from metropolitan and provincial locations, schools from all jurisdictions, schools from all sectors, and a large majority were secondary schools and K/P-12 schools. The study sample did not include any NSW government schools and only included small numbers of remote schools, K-10 schools, middle schools and senior colleges. Most of the schools in the study sample employed a laboratory technician.
Key finding 1 defines the study sample and as such indicates the limits to the generalisability of all other Key Findings
2 The most common patterns of employment of technicians were full-time only, part-time only and a combination of full-time and part-time. There are indications that contract and part-time employment are becoming more common. Perceptions of technicians’ status are fairly low. Line management of technicians varies with the nature of their position description. Less management problems arise where the science technician is a specialist managed by the teacher-in-charge of science. The number of technicians employed and the number of technician hours per week increased with school size. Standard deviations were large indicating that there was considerable variation about the mean values.
3 Almost 70% of study sample schools indicated the amount of technical support was good or very good, however, 10% indicated it was poor or very poor. Thirty-six per cent of schools did not have sufficient technical support during school holidays for maintenance, stock-taking and occupational health and safety compliance activities. There is a shortage of relief technicians who can be employed when technicians are on sick leave. Many schools indicated that if they had more technical support the amount (46% of schools) and quality (59%) of practical work in the curriculum would be improved. The quality of support varies from very good to very poor.
4 Forty per cent of schools reported difficulty in recruiting technicians and difficulty was reported a little more frequently by metropolitan than in other schools. The main difficulties related to the poor conditions of service and the unsuitability of applicants. There was strong corroboration in the interviews of the questionnaire data that indicated that the amount and quality of technical support in schools is highly variable and that difficulties in recruiting suitable staff are strongly related to poor conditions of service and the poor match between salary and level of responsibility. Concerns were also expressed about the imminent retirement of a large number of experienced technicians.
5 The mean number of equipped science laboratories per school was 4.69 and the number of laboratories increased with school size. Secondary schools and senior colleges with only high school age students had more laboratories than schools with both primary and secondary enrolments. Fifteen per cent of schools rated their science teaching facilities as poor or very poor while 54% of schools rated them as good or very good.
6 In almost 90% of the responding schools, technicians supported the teaching of science to Years 8-12 and to Year 7 in 63% of schools. Twelve schools reported that technicians supported the teaching of primary science in their schools. One hundred and sixty-five schools indicated that technicians supported other science subjects, the most common ones being Extension Science (20 schools), Science Club (20), Marine Studies (13) and Agricultural Science (12).

Page 43
7 Over all school types in the study sample with a technician, a median of 1.06 FTE technicians per school supported a median of 700 students and four laboratories.
8 Service Factors (SFs) for the study sample of schools that had technicians varied from a minimum of 0.05 to a maximum of 1.2 with a mean of 0.45 and a median of 0.41. There was some variation between medians for sectors, jurisdictions and school types. There was a wide range of SF values within some sectors and jurisdictions. Median SFs range from a low of 0.37 to a high of 0.44 across sectors and from a low of 0.31 to a high of 0.6 across educational jurisdictions. Secondary schools and K/P-12 schools had lower SFs than other school types. The median SF for all schools in the study sample and for all sectors was below the lowest of the ASE benchmarks.
9 Of the schools without technicians in the study sample, about half were K/P-12 schools, 60% were from provincial and remote locations and 40% were from metropolitan locations. The main reasons given for having no technician were that the school was too small and budgetary constraints. In most cases the science teacher performed the duties of technician and a large majority of schools without technicians indicated that having a technician would improve the amount and quality of practical work in the science curriculum.
10 A large majority of technicians are female and 40% of technicians are over 50 years of age. Only 22% are under 40 years of age. The mean number of years of experience in school laboratories was 10.8 years and 5.9 years in non-school laboratories. Nine per cent of technicians have no relevant post-secondary education while 38% have a relevant TAFE/VET qualification and 82% have some other related qualification such as first aid and science degrees. Most of the non-TAFE/VET qualifications were earned in Australia. Two-thirds of technicians report that they are members of a local school science technicians association.
11 The initial training of technicians varies from TAFE/VET courses for technicians, science degrees to on the job learning by experience. None of the forms of training is satisfactory as they are not specifically designed for technicians employed in schools. One half of technicians reported they had completed no in-school training and one quarter reported they had completed no out-of-school training in the last five years. The most common forms of in-school training were OH&S training, general school PD and computer/IT training. The most common forms of out-of-school training were general in-service laboratory technician meetings, conferences and OH&S training. Ongoing training is provided by technicians, technicians associations, science teachers associations, education systems and other training providers. There need to be incentives to encourage all technicians to engage in ongoing training.
12 More than half of the technicians reported that they had access to the Internet, a technician at another school, online discussion boards, the local science technicians association and WorkSafe as sources of support. The most frequently used sources of support were those that were Internet based and accessible by computer. Support mechanisms for technicians are highly variable across jurisdictions and sectors. Access to authoritative advice and the quality of advice available through support networks is variable and concerns have been expressed about the accuracy of advice provided by discussion boards.
13 Science technicians have diverse and demanding roles. In addition to preparing and maintaining resources for laboratory classes, they have significant responsibilities for health and safety, first aid, operating budgets, training and supervising other technicians, the care of animals and ensuring compliance with relevant codes, and security of the school’s science department. Some technicians are sometimes required to supervise students. In addition many technicians perform a number of more routine ‘housekeeping’ and administrative duties within the science department and some work across a number of departments within schools.

Page 44
14
Twenty per cent or more technicians indicated they were in need of further support or training to competently perform 19 of 26 tasks. Many of these tasks related to newer laboratory practices and/or technology (e.g., working with data loggers). However, of greatest concern were the 25% or more technicians who indicated they needed further support or training with a number of important safety issues (e.g., first aid, accident and emergency procedures, fire extinguishers, disposal of hazardous waste, radiation safety and preparation of risk assessment sheets). These data suggest there is an unmet training demand.
15 Initial training needs to better address the specific needs of school science technicians, cover all science disciplines and be set in a curriculum context. Regular ongoing training is needed for technicians and there should be incentives to encourage technicians to participate in ongoing training.
16
The most commonly requested changes to support related to having more technicians or hours of technician time available to service the needs of the science department and more support from staff and school administration. Interview participants confirmed this, indicating that staffing levels need to be improved and regulated. Technicians also required greater support with OH&S issues and an authoritative source of advice on laboratory procedures and safety.
17 Many technicians and interview participants indicated that technicians need greater recognition, status, salaries and career pathways. They also need their own employment classification system. Some technicians wanted more opportunity to be involved in science department meetings, have better communication and share their knowledge with teachers, and contribute to planning. Some indicated that they would be more effective if they had less non-science laboratory related duties and many indicated that staffing levels need to be improved.
Discussion, Conclusions and Recommendations Australia needs a scientifically literate society and a supply of scientists and technologists to sustain a thriving economy and to address a wide range of social and environmental challenges. The goals of scientific literacy and a sufficient supply of science and technology graduates from higher education require that primary and secondary schools offer authentic and inquiry oriented science curricula that engage students and inspire them to continue their studies of science (Ainley et al., 2008). Science teachers depend heavily on good facilities and high quality technical support to implement an engaging and inquiry-oriented curriculum and this will be particularly important as Australia implements a national science curriculum. There has been very little research on the status of technical support for secondary school science, and most of this has been conducted in the UK (The Royal Society & ASE, 2001, 2002). This research study combined a large-scale questionnaire survey of Australian schools with interviews conducted with key stakeholders with deep experience of the training, employment and support of school science technicians. Analysis of the data from the questionnaire and interviews generated 17 key findings (KF) which have been summarised in Table 27 and these key findings inform the discussion, conclusions and recommendations from the study.
Discussion The study sample When interpreting data, particularly from survey research, careful consideration needs to be given to the sample, how well it represents the population and any biases that might have occurred due to sampling. An overall return rate of 33% was achieved which is quite satisfactory for a mail survey with no follow-ups to non-responders. Surveys were received from 607 schools and from 824 technicians. Given that school principals had to approve the participation of their schools in the study before forwarding the survey to their staff, it is likely that the study sample was biased towards schools with good levels of technical support. It was not possible to survey all Australian schools that enrolled secondary students and therefore a number of very small schools that were unlikely to employ technicians was not surveyed. A relatively small number of schools without

Page 45
technicians returned surveys. The study sample included mainly schools from metropolitan and provincial locations, schools from all jurisdictions, schools from all sectors, and a large majority were secondary schools and K/P-12 schools (KF 1). NSW government schools were not represented in the study sample which limits the generalisability of the study findings. The technicians Science technicians have diverse and demanding roles that include preparing resources for and supporting the teaching of science practical work in their schools; and have significant responsibilities for health and safety, first aid, operating budgets, training and supervising other technicians, the care of animals and ensuring compliance with relevant codes and security of the school’s science department. Some technicians are also required to supervise students (KF 13). Given the significance of their responsibilities and the contribution they make to the delivery of quality science teaching and learning in our schools, careful consideration needs to be given to the employment of technicians, their initial and ongoing training and support, and the ways in which they work with the science teaching staff. The most common patterns of employment of technicians were full-time only, part-time only and a combination of full-time and part-time, and there are indications that contract and part-time employment are becoming more common (KF 2). Forty per cent of schools reported difficulty in recruiting technicians and difficulty was reported a little more frequently by metropolitan than in other schools. The main difficulties related to the poor conditions of service, in particular the poor match between salary levels and responsibility (KF 4) which made it difficult to attract suitable applicants for technician positions. The strong demand for workers with technician skills in the mining, pathology and wine industries in 2008, which offer highly competitive salaries, may partly explain the difficulty of recruiting technicians into schools. As noted by the UK Royal Society and ASE (2002) “The profession of technicians is not attracting young recruits; this is perhaps unsurprising considering technicians’ pay and conditions” (p. vii). A large majority of the Australian technicians in the study sample are female and 40% of technicians are over 50 years of age. It would therefore be expected that significant numbers of our most experienced technicians will retire in the next five years. Only 22% of technicians are less than 40 years of age which suggests that there is an urgent need to recruit more young people to the profession. The mean number of years of experience in school laboratories was 10.8 years and 5.9 years in non-school laboratories. Nine per cent of technicians have no post-secondary education relevant to laboratory work while 38% have an Australian TAFE/VET qualification related to laboratory work, 50% have first aid qualifications and 31% have science degrees (KF10). These data suggest that there is a core of the technician workforce that is both experienced and well-qualified. Training of technicians There are three main concerns regarding the training, knowledge and skills of the technician workforce. First, the initial training of technicians varies from TAFE/VET courses for technicians, science degrees to on-the-job learning by experience, and none of the forms of training is specifically designed for technicians employed in schools (KF 11). Interview data indicates that TAFE/VET courses for technicians are geared towards the requirements of the mining and medical pathology industries and the courses lack relevance for the quite different job requirements of school science technicians. Several of the study’s informants (KF 15) argued for the development of vocational education and training courses specific to the needs of school technicians that cover all science disciplines and are linked to the school science curriculum (see Recommendation 1). Second, the high proportion of technicians who have completed no in-school training (47%) or no out-of-school training (27%) in the past five years (KF 11); and, third, those staff providing support to science who are employed as generalist school support officers who may have no science or laboratory skills training. Lack of recent training would impact most particularly on technicians’ knowledge of the rapidly changing OH&S environment and of contemporary laboratory and learning technologies. Large numbers of informants indicated that technicians require regular updates and retraining in the use of equipment, in first aid and OH&S, and they need further IT training (KF 15). Ongoing training is provided by technicians, technicians associations, science teachers associations, education systems and other training providers. There need to be incentives to encourage all technicians to engage in ongoing training (KF 15) to ensure they have current knowledge and skills (see Recommendation 4).

Page 46
The employment of generalist school support officers to support science programs in schools, without any training in science laboratory work, raises serious questions about the quality of support they can provide to the science teaching program and about their ability to maintain a safe working environment. Messages posted to science technician internet discussion boards indicate that there are many staff struggling with inadequate science and technical knowledge. Minimum standards of training need to be established for all staff providing technical support to secondary science teaching programs in schools (see Recommendation 2). Levels of appointment of technicians Given that technicians have a range of levels of responsibilities there needs to be established various levels of appointment which are linked to qualifications, experience, job requirements and to salaries (see Recommendation 3). The Laboratory Technicians Association of Victoria’s policy statement (LTAV, 2007) argues for four levels of appointment; Technical Assistant (trainee), Technician, Senior Technician and Laboratory Manager. At the lowest level of appointment (Technical Assistant – trainee) there would be no requirement for qualifications, however, the appointee would be undergoing training in a vocational education and training course and be under the supervision of a trained technician rather than being supervised by a teacher. To be appointed at the level of Technician it would be expected that the person would hold a Certificate IV in a relevant area, Year 12 science subjects or equivalent. The policy (LTAV, 2007) indicates that persons appointed at the level of Technician would not be the sole technician at a school, as at this level they should not be responsible for ordering and budgeting. Senior Technicians who coordinate the laboratory support work of a science department require a Diploma of Applied Science or equivalent, or a Certificate IV with significant experience. The policy indicates that Senior Technician should be the minimum employment level for a sole technician in any school. Support for technicians More than half of the technicians reported that they had access to the Internet, a technician at another school, online discussion boards, the local science technicians association and WorkSafe as sources of support. The most frequently used sources of support were those that were Internet based and accessible by computer, however, there are concerns about the accuracy and consistency of advice provided by internet based discussion boards (KF 12). Support mechanisms for technicians are highly variable across jurisdictions and advisory/regional technicians are only available in some jurisdictions. In the UK there is a national advisory service called CLEAPSS, which specifically gives advice regarding practical science in schools. It advises and provides training on all aspects of school science, and this service is available not only to technicians but also to teachers, trainee teachers, science advisors, architects and health and safety advisors of member schools. All technicians (KF 16) need access to an internet based source of consistent and authoritative advice on laboratory practices, safe handling and disposal of chemicals, biological materials and radiation sources (see Recommendation 6). CLEAPSS is one model that could be considered for establishing an Australian science advisory service. Twenty per cent or more technicians indicated they were in need of further support or training to competently perform tasks related to newer laboratory practices and/or technology (e.g., working with data loggers). Of greatest concern were the 25% or more technicians who indicated they needed further support or training with a number of important safety issues (first aid, accident and emergency procedures, fire extinguishers, disposal of hazardous waste, radiation safety and preparation of risk assessment sheets) (KF 16). These data highlight the need for both ongoing support and training and for appropriate initial training of technicians. Laboratory technician associations that have been established in five jurisdictions and science teachers associations play important roles in the ongoing training and support of school science technicians. These associations need to be supported so that they can participate in consultations regarding reforms of the training and support for technicians (see Recommendation 7). The establishment of laboratory technicians associations in the ACT, NSW and the NT would strengthen the support and training available for school science technicians in those jurisdictions. Teaching assistants Consideration also needs to be given to the UK Training and Development Agency for Schools’ initiative of supporting the training and credentialing of specialist secondary science Higher Level Teaching Assistants (HLTAs) to support science teachers in the teaching and learning process. Given the large practical class sizes and inclusion policies typical of Australian education jurisdictions, management of small group inquiry-oriented practical work, with classes of 30 plus students of widely mixed abilities, is complex and teachers need the support of both skilled technicians and of teaching assistants (see Recommendation 8).

Page 47
Facilities This preliminary study did not investigate the adequacy of science preparation facilities, provision of fume hoods and other safety issues. Feedback was sought about the adequacy of the science teaching facilities and 54% of sample schools indicated their facilities were either good or very good. Of concern, is the 15% of schools who indicated their science teaching facilities were either poor or very poor (KF 5). A survey of 61 Australian secondary science teachers involved in the Science by Doing professional learning program revealed that:
One-quarter of the teachers indicated the budget for science at their school was not adequate. One-quarter indicated most classes were timetabled in a laboratory only once per week. Almost 40% had no internet access in any of the science rooms and 75% had to take their class to another part of the school so that students could work on computers. (Hackling, 2008, p. 30)
Inquiry based science education programs such as those advocated by Goodrum et al. (2001) and Tytler (2007) and exemplified by Science by Doing, require the integration of traditional laboratory facilities with contemporary ICT and learning technologies and the support of well-qualified and supported technical staff. The data from the Science by Doing evaluation indicate that some classes get quite limited access to laboratories and that there is a lack of integration of traditional laboratory and ICT facilities. Poor access to ICT facilities within science laboratories is likely to be more common in older laboratories, particularly those built in the 1960s as part of the Commonwealth science laboratories building program. Any new Commonwealth funded laboratory building program should also consider the technicians required to adequately service these new facilities. Levels of servicing The demand for services from technicians is influenced by the number of science laboratories, the layout of laboratories, preparation and store rooms, the number of students taught science and the time for which they are taught science, and the range of science teaching programs to be supported. Over all the schools in the study sample that had technicians, a median of 1.06 FTE technicians per school supported a median of 700 students and four laboratories (KF 7). In 90% of schools, technicians supported science teaching across Years 8-12 and also to Year 7 students in 63% of schools (KF 6). Many schools also offered enrichment or extension science subjects or clubs that required technician support. At this level, it is clear that schools have a significant demand for technical support. Almost 70% of the study sample of schools reported that the amount of technical support was good or very good while 10% indicated it was poor or very poor. Thirty-six per cent of schools did not have sufficient technical support during school holidays for maintenance, stock-taking and occupational health and safety compliance activities. Almost one half of schools (46%) indicated that if they had more technical support the amount of practical work in the curriculum would be improved and almost 60% indicated that the quality of practical work would be improved with more technical support (KF 3). These data suggest that the amount of technical support was less than optimal. The level of servicing is difficult to quantify as it is influenced by a number of factors. The ASE Service Factor (SF) metric has been used in this study because it takes account of the number of hours of available technician time during term time and the hours of science teaching summed across all secondary science classes serviced by technicians. An additional advantage of this metric is that Australian SF data can be benchmarked against UK SF data and the standards established by the ASE (Royal Society & ASE, 2001) and the Laboratory Technicians Association of Victoria (LTAV, 2007). The ASE established four standards of servicing (see Appendix 1). The recommended standard is an SF of 0.85 while the lowest standard (0.45) is defined as the level of servicing at which “Functions will be markedly reduced and in most cases no more than simple, immediate maintenance and control will be possible” (Royal Society & ASE, 2001, p. 3) and at these levels of servicing, delivery of practical programs are likely to be impaired. The LTAV (2007) policy states that the minimum standard should be set at a SF of 0.55 with additional weightings of 0.1 SF for less than optional conditions of facilities, layout of laboratories and preparation rooms. The median SF for all schools in the study sample that had technicians was 0.41 which is lower than the lowest of the ASE standards and lower than the median SFs for all types of secondary schools in the UK study (KF 8). Median SFs for UK comprehensive (0.47), grammar (0.58) and independent (0.59) schools and for sixth form colleges (0.62) were all higher than the median SF

Page 48
(0.41) for this sample of Australian schools. The median SF for the study sample was also much lower than the minimum standard set by the LTAV. There was a wide range of servicing levels across the study sample of schools with technicians and wide ranges within educational sectors and jurisdictions. All sectors and jurisdictions included significant numbers of schools with SFs lower than the ASE 0.45 standard. Over all schools with technicians in the study sample, 57% of schools were below the lowest ASE standard of 0.45, 82% has SFs lower than the 0.6 standard and 91% were lower than the 0.7 standard. Only 4% of schools had the recommended level of servicing of at least 0.85. At the 82% of schools with SFs lower than the 0.6 standard “It will not be possible to deliver all functions adequately and a restricted range of priorities will need to be identified” (Royal Society & ASE, 2001, p.3) and it is likely that in the 57% of schools in this sample which have SFs below the 0.45 standard that the delivery of the science curriculum, safety standards and ongoing maintenance will be seriously compromised. Nationally agreed minimum standards for technical support of science programs in Australian schools must be established (see Recommendation 5). Schools without technicians Fifty-three schools without technicians returned completed surveys. The main reasons given for not having a technician were that the school was too small and budgetary constraints. In most cases the science teacher performed the duties of technician and a large majority of schools without technicians indicated that having a technician would improve the amount and quality of practical work in the science curriculum (KF 9). Rural K-10 schools with small secondary enrolments have often not had a technician to support the science teaching program and typically the science teacher is required to both teach science and provide the technical support required for the practical component of the curriculum. This places considerable demands on the teachers in these schools, many of whom are inexperienced and recent graduates. The knowledge and skills required to be a technician are quite different to those possessed by teachers and as indicated by the LTAV (2007, p. 5) technical tasks cannot “be safely and efficiently carried out by an untrained person”. Given the pressures on teachers’ time, it is likely that teachers in these circumstances can only prepare limited resources for practical work and the quality of the curriculum is compromised. This view is supported by data from these schools indicating that having a technician would improve the quantity and quality of practical work in the implemented curriculum (KF 9). As indicated by The Royal Society and Association for Science Education, both achievement levels and safety will be compromised in schools without professional technician support:
A well-trained professional technician support service is essential if students are to experience a variety of experiments and investigative work. Without adequate numbers of science technicians in schools and colleges the learning experiences of students will be impaired, raising levels of achievement will be made hugely more difficult, and safety in school and college laboratories will be compromised. (Royal Society & ASE, 2002, pp.1-2).
Recommended changes Both questionnaire and interview data were gathered regarding changes that are needed to enhance technical support for the delivery of quality science teaching and learning programs in schools. The most commonly requested changes to support related to having more technicians or hours of technician time available to service the needs of the science department (KF 16) which corroborates the previously reported findings about servicing levels. Many technicians indicated that they need greater recognition, status, salaries and promotional pathways (KF 17), and some wanted more opportunity to be involved in science department meetings, have better communication and share their knowledge with teachers, contribute to planning, and have better support from the school administration. Some indicated that they would be more effective if they had less non-science laboratory related duties.

Page 49
Conclusions and Implications The findings from this research study are summarised first as conclusions to the research questions and then implications from the research are summarised.
Conclusions The study set out to answer four research questions and the main findings are summarised in relation to these.
1. What range of qualifications is held by school science technicians in Australian secondary schools?
Nine per cent of technicians in the study sample have no post-secondary education relevant to laboratory work while 38% have an Australian TAFE/VET qualification related to laboratory work, 50% have first aid qualifications and 31% have science degrees. 2. What range of duties and responsibilities is included in the roles of school science
laboratory technicians? Science technicians have diverse and demanding roles that include preparing resources for and supporting the teaching of science practical work in their schools; and, have significant responsibilities for health and safety, first aid, operating budgets, training and supervising other technicians, the care of animals and ensuring compliance with relevant codes, and security of the school’s science department. Some technicians are also required to supervise students.
3. What training and support do school science technicians receive, what do they need and what are they able to access?
The initial training of technicians varies from TAFE/VET courses for technicians, science degrees to on-the-job learning by experience, but none of the forms of training is specifically designed for technicians employed in schools. TAFE/VET courses for technicians are geared towards the requirements of the mining and medical pathology industries and the courses lack relevance for the quite different job requirements of school science technicians. Initial training courses offered by the vocational education and training sector need to be specific to the needs of school science technicians and linked to the science curriculum. A high proportion of technicians have completed no in-school training (47%) or no out-of-school training (27%) in the past five years; and, those staff providing support to science who are employed as generalist school support officers may have no science or laboratory skills training at all. Staff employed as school science technicians need greater access to ongoing training and incentives may be needed to increase technicians participation in training. Support mechanisms for technicians are highly variable across jurisdictions and sectors, and advisory/regional technicians are only available in some jurisdictions. More than half of the technicians reported that they had access to the Internet, a technician at another school, online discussion boards, the local science technicians association and WorkSafe as sources of support. The most frequently used sources of support were those that were Internet based and accessible by computer, however, there are concerns about the accuracy and consistency of advice provided by internet based discussion boards. Technicians and science teachers need access to an online source of authoritative advice on matters relating to laboratory procedures, handling chemicals and other OH&S matters.
4. How can the role of school science technicians, training and support be improved to enhance student learning outcomes in Australian schools?
Given that technicians have a range of levels of responsibilities there needs to be established various levels of appointment which are linked to qualifications, experience, job specifications and to salaries. Twenty per cent or more technicians indicated they were in need of further support or training to competently perform tasks related to newer laboratory practices and/or technology, and 25% or more technicians indicated they needed further support or training with a number of

Page 50
important safety issues. These data highlight the need for both ongoing support and training and for appropriate initial training of technicians. Initial training of technicians provided by the vocational education and training sector needs to be more focussed on the specific requirements of school science technicians. The development of an Australian online source of authoritative advice and support for technicians and science teachers, modelled on the services provided by the UK CLEAPSS organisation, is a high priority.
Implications School science technicians have significant responsibilities and make an important contribution to the quality of teaching and learning of school science. It will be difficult to implement more engaging and inquiry-oriented science curricula, raise achievement levels, produce scientifically literate citizens and inspire greater numbers of students to continue their studies of science without quality technical support for secondary science programs in our schools. The potential role of teaching assistants to work with small groups and help teachers manage large practical classes should also be explored. Australia has a core of well-trained and experienced technicians, many of whom are female and within a decade of retirement. However, there is great variability across jurisdictions, sectors and schools regarding the nature of initial training, employment conditions, levels of servicing as measured by service factors, and ongoing support. Significant numbers of technicians need further support and training to perform laboratory tasks and address safety matters confidently and competently. There is a need to raise standards where they are less than optimal and compromise quality of support, teaching and learning, and safety. The greatest challenges relate to: providing an initial training that is specific to the needs of school science technicians; ensuring that all staff providing technical support to secondary science programs have at least minimum standards of training; the provision of an internet-based and authoritative source of advice and support; the provision of ongoing training and incentives for technicians to attend such training; providing levels of staffing that meet at least the ASE’s 0.6 service factor benchmark in all schools; and, improving employment conditions, salaries and career pathways so that sufficient well-qualified staff can be attracted to the profession. Without addressing the technical support needs of secondary science it will be difficult to effectively implement a national science curriculum with a stronger focus on authentic and inquiry-oriented approaches to teaching and learning, and Australian will continue to lag behind other countries in science achievement standards. This study also raises broader questions about the roles played and contributions made by other paraprofessional staff in secondary schools and how they can be trained, supported and used more effectively to support teaching and learning and effective school administration. Further research is required to assess the technical support needs of primary science.

Page 51
Recommendations The following research-informed recommendations are made to provide direction for actions that can be taken to improve the quality of technical support provided to secondary science programs in our schools. Recommendation 1: That the vocational education and training sector develop and offer courses for the initial training of technicians, aligned with the requirements of school science technicians and the school science curriculum. Suggested actions:
• A national forum convened by DEEWR with representatives of DEEWR Skills and Training, ASTA, SETA, TAFE/VET and science policy officers from all sectors establish a framework for the initial training of school science technicians.
• DEEWR recognise schools science technicians as an area of skills shortage so that job seekers become eligible for the services available to those seeking employment in areas of skill shortage.
Recommendation 2: That minimum standards be established for the training required for employment of science technicians in secondary schools and for their induction into the role. Suggested actions:
• A national forum be convened by DEEWR with representatives of ASTA, SETA and employing authorities to establish a minimum standard of training and induction for new appointments to the role of technician and for identifying mechanisms by which existing technicians can be supported to gain this qualification utilising appropriate skills recognition, distance and workplace learning mechanisms.
Recommendation 3: That nationally consistent job specifications be established for various levels of science technicians to which appropriate salary scales are linked. Suggested actions:
• A working party be established to review job specifications and salary scales for science technicians that currently exist in Australian jurisdictions and sectors and the position descriptions proposed by LTAV for technical assistants, technicians and senior technicians.
• A set of national levels be established for the appointment of technicians with appropriate job specifications, expected qualifications and salary scales.
Recommendation 4: That mechanisms be established to enhance the availability of ongoing training for school science technicians and increase technicians’ participation in ongoing training. Suggested actions:
• At a national forum and with other appropriate consultations identify priorities, providers and mechanisms for delivery of ongoing training for technicians.
• Employing authorities be encouraged to fund and provide incentives for ongoing training of technicians.
Recommendation 5: That a minimum standard be established for technician servicing of secondary science programs. Suggested actions:
• At a DEEWR convened national forum with appropriate stakeholder representation establish an agreed minimal standard for the level of technician servicing for secondary science programs based on a service factor of at least 0.6.
• Mechanisms be developed by which schools report annually against this standard. Recommendation 6: That a national internet-based advisory service be established to provide consistent and authoritative advice and support to secondary school technicians and teachers.

Page 52
Suggested actions: • Resources be provided by DEEWR to investigate the UK CLEAPSS advisory service
and in consultation with relevant Australian stakeholders develop a framework for the establishment of an Australian online advisory service and a national resource bank of standard procedures and chemical labels.
• Establish an online advisory service for an initial three-year trial period and conduct an evaluation to inform future options.
Recommendation 7: That resources be provided to facilitate ASTA and SETA’s involvement with and leadership of the development of national standards for the employment, roles and provision of training and ongoing support of technicians. Suggested actions:
• Resources be provided to enable ASTA and SETA to be represented and participate in national forums and consultations regarding the establishment of national standards for technicians.
Recommendation 8: That further research and development activity be funded to investigate ways of more effectively deploying paraprofessionals in Australian schools. Suggested actions:
• Further research and development activity is required to inform the establishment of national standards for the secondary school science technician workforce and to explore the support needs of primary science.
• A review be undertaken in five years time of the impact of initiatives taken in response to this report on the status of technical support for science teaching.
• The roles of the UK High Level Teaching Assistants in supporting the teaching and learning of science be reviewed with a view to trailing them in Australian schools.
• Further research is required to review the range of paraprofessionals that support teaching and learning and administration of schools and identify ways in which the work of paraprofessionals can be enhanced so that learning outcomes and school productivity can be maximised.
It is difficult to specify timelines for the implementation of these recommendations, however, it is recommended that a national forum of key stakeholders be convened in Canberra by DEEWR, ASTA and SETA by September of 2009 so that initial consultation and discussions can commence on processes of implementation of the recommendations and suggested actions.

Page 53
References Ainley, J., Kos, J. & Nicholas, M. (2008). Participation in science, mathematics and technology in
Australian education. ACER research monograph No. 63. Camberwell, Victoria: ACER. APPEA (Australian Petroleum, Production and Exploration Association) (2005). APPEA
submission to the DEST audit of science, engineering and technology skills. Retrieved on November 17 from http://www.dest.gov.au/NR/rdonlyres/4AF9EE2A-D4D7-4C15-BA2E-A9F4165522DB/13070/APPEA_submission.pdf
DEST (Department of Education, Science and Training) (2006). Audit of science, engineering and
technology skills. Canberra: DEST Engineers Australia (2007). Position paper for skills summit. Retrieved on November 17, 2008
from http://www.apesma.asn.au/summit/papers.asp Goodrum, D., Hackling, M. & Rennie, L. (2001). The status and quality of teaching and learning of
science in Australian schools. Canberra: Department of Education, Training and Youth Affairs.
Hackling, M. W. (2004) Investigating in science. In G. Venville & V. Dawson (Eds.), The art of
teaching science (pp. 88-104). Crows Nest, NSW: Allen & Unwin. Hackling, M. W. (2005). Working scientifically: Implementing and assessing open investigation
work in science (Rev. ed.). Perth: Department of Education and Training. Retrieved from http://www.eddept.wa.edu.au/science/Teach/workingscientificallyrevised.pdf
Hackling, M. W. (2008). Science by Doing Pilot Program Interim Research and Evaluation Report
No1: Evaluation of the January 2008 professional learning workshop. Canberra: Australian Academy of Science.
Laboratory Technicians Association of Victoria (2007). Technical staff in schools, staffing and
conditions. Melbourne, VIC: LTAV. McKenzie, P., Kos, J., Walker, M. & Hong, J. (2008). Staff in Australia’s schools 2007. Canberra:
Department of Education, Employment and Workplace Relations. The Royal Society and the Association for Science Education (2001). Survey of science
technicians in schools and colleges. London: The Royal Society. The Royal Society and the Association for Science Education (2002). Supporting success:
Science technicians in schools and colleges. London: The Royal Society. Tytler, R. (2007). Re-imagining science education: Engaging students in science for Australia’s
future. Australian Education Review. Camberwell, Victoria: ACER.

Page 54
Appendices Appendix 1: Association of Science Education service standards (Royal Society & ASE, 2001) Service factor Description of service standard
0.85 This is the recommended allocation of technician support to science teaching for a compact suite of laboratories with adjoining preparation and storage space. All functions are feasible including the accessing of training and developing opportunities to meet the schools changing needs.
0.70
At this level of allocation provision of the full range of functions will depend upon recruiting well-qualified and experienced technicians. Where the full range is possible there will be a need to prioritise functions and decide on the emphasis of support required. It may still be possible to achieve a balance between resource related, design and development and direct support activities.
0.60
It will not be possible to deliver all functions adequately and a restricted range of priorities will need to be identified. Efficient management of resources and administration are likely to be affected and activities related to design and development of practical programmes and direct support will be in jeopardy. Functions possible may well depend on the skills and experience available and a policy for training will be essential to maintain the service.
0.45
Functions will be markedly reduced and in most cases no more than simple, immediate maintenance and control will be possible. In the long-term efficiency in these will be impaired. The availability and range of resources will become restricted and the development of effective practical programmes may be impaired. A supervisory structure for the less experienced may have to be provided from elsewhere. Regular training will be essential but difficult to accommodate.

Page 55
Appendix 2: The Questionnaire
Please note that the covering letter sent with the questionnaire was modified to suit the particular requirements of ethics approval from each educational jurisdiction and sector.

Page 56
The Status and Role of School Science Laboratory Technicians in Australian Secondary Schools Dear Principal, Teacher-in-Charge of Science and Laboratory Technician/s, We invite you to be involved in a nation-wide research study to investigate the current roles of school science laboratory technicians in Australian secondary schools. This research is funded by the Australian Government Department of Education, Employment and Workplace Relations and is being conducted by Edith Cowan University in collaboration with the Australian Science Teachers Association and Science Education Technicians Australia. The importance of laboratory technicians in supporting the teaching and learning of science is well recognised, however, to date there has been little research into the role and status of school science laboratory technicians in Australia. This study specifically aims to determine the:
• range of qualifications held by laboratory technicians in Australian secondary schools; • range of duties and responsibilities included in the roles of laboratory technicians; • the availability of training and support for laboratory technicians; and • ways in which training and support for technicians can be improved to enhance student
learning outcomes. Enclosed you will find an anonymous questionnaire to be completed by both the teacher-in-charge of science and the laboratory technician/s or person/s providing technical support for teachers of science. This should take approximately twenty minutes to complete. Even if your school does not have a laboratory technician, please complete the relevant parts of the questionnaire and return it in the reply paid envelope. All information provided will be anonymous, treated confidentially and used for research purposes only. No individuals or schools will be identified in any reports of the research. All data records will be stored securely and destroyed five years after the completion of the study. Please note that this project has the approval of the ECU Human Research Ethics Committee and meets the requirements for research in your school system. We will be happy to discuss any questions you may have about the questionnaire. Please direct questions regarding this research study to Professor Mark Hackling on 08 6304 5170 or [email protected]. If you have any concerns about the project or would like to talk to an independent person, you may contact the Research Ethics Officer at the Human Research Ethics Office, Edith Cowan University on 08 6304 2170 or [email protected]. Thank you very much for participating in this research study. Please complete the enclosed questionnaire within two weeks and return in the reply paid envelope provided. Regards Professor Mark HacklingDr Vaille Dawson Science EducationScience Education Edith Cowan University Edith Cowan University
Science Education Technicians Australia

Page 57
THIS SURVEY HAS 4 SECTIONS SECTION A: About your School/College – to be completed by the teacher-in-charge of science. SECTION B: About the Laboratory Technician – to be completed by each laboratory technician together with the teacher-in-charge of science. (Copy this section if the school employs more than one technician) SECTION C: Duties Associated with Laboratory/Practical Work – to be completed by the (senior) laboratory technician together with the teacher-in-charge of science. SECTION D: For Schools that Do Not Employ a Laboratory Technician – to be completed by the teacher-in-charge of science at schools that do not employ laboratory technicians.

Page 58
1. School sector: Government Catholic Independent (Tick one box) 2. School type: Secondary School (Yrs 7/8 – 12) Senior College (Yrs 10/11/12) Middle School (Yrs 7/8 – 10) K – 10 School K – 12 School Other (please specify) __________________________ 3.Approximate number of secondary school students at your school_________ 4.State / Territory ___________ 5.Your school’s postcode ______________ 6.Does your school employ one or more science laboratory technicians?
Yes Please continue with question 7 on this page.
No Please turn to the last page, complete questions 35-38 and then return this questionnaire in the enclosed reply paid envelope.
7.How many laboratory technicians are employed at this school? (Write number in the box/es) Full timePart timeCasual 8. How many hours per week during term time does this add up to?
(i.e. total hours per week of technician time available at your school in Term 3) 9. Do you have sufficient technical support during school holidays for maintenance, stock-taking, occupational health and safety compliance, etc? Yes No 10. Is the amount of science technical support available in your school (Tick one box)
Very poor Poor Satisfactory Good Very good 11. How would increased technical support affect the amount of practical work
included in your school’s science curriculum?
Decrease No change Increase 12. How would increased technical support affect the quality of practical work
in your school’s science curriculum?
Decrease No change Increase
SECTION A: About your School/College The following section is to be completed by the teacher-in-charge of science.
Please note that any information you provide will be anonymous

Page 59
13. Have you experienced difficulty in recruiting suitably qualified and experienced
laboratory technicians for your school?
No Yes If yes, explain why
_____________________________________________________ __________________________________________________________________
14.How many class groups are taught science in your school in Term 3?
Please complete the table below using the following example as your guide.
If a school has five Year 8 science classes the number of class groups is 5. If the Year 8s have science 5 periods per week and each period runs for 50 minutes, the number of minutes of science per class group per week is 250.
Type of class
Number of class groups
Number of minutes of science per class group per week
Year 7 Science
Year 8 Science
Year 9 Science
Year 10 Science
Year 11 science subjects
Year 12 science subjects
Other e.g. Marine Science, Year 10 Academic Extension
Science, Science Club
15. How many equipped science laboratories (i.e. with sinks and gas outlets) are there
in your school? 16. How would you describe the science teaching facilities at your school?
Very poor Poor Satisfactory Good Very good

Page 60
17.What is your gender? Male Female 18.What is your age group? 18 – 30 31 - 40 41-50 51 – 60 Over 60 19.How many years of experience do you have as a school laboratory technician? 20. How many years of experience do you have in laboratories other than in schools? 21. Do you belong to a professional science organisation e.g. local science technicians association? (Please tick the relevant box/es)
I do not belong to a professional body
I belong to: Local Science Technicians Association
Local Science Teachers Association Other: ___________________________
22.Do you hold any Australian TAFE/VET qualifications associated with the work of laboratory technicians?
No Please continue on with question 23.
Yes Please tick the box next to the relevant qualification/s.
Qualification
Certificate II in Sampling and Measurement (or equivalent)
Certificate III in Laboratory Skills (or equivalent)
Certificate IV in Laboratory Techniques (or equivalent)
Diploma of Laboratory Technology (or equivalent)
Advanced Diploma of Laboratory Operations (or equivalent)
Other – please specify:
SECTION B: About the Laboratory Technician Technician ___ of ___ This section is to be completed by each laboratory technician together with the teacher-in-charge of science.
For schools which employ two or more laboratory technicians, please copy this section (pp4-7) and complete for each technician and return with the completed questionnaire.
Please note that any information you provide will be anonymous

Page 61
23.Do you hold any other relevant qualifications (e.g. a science degree, first aid certificate
etc)? No Please continue on with question 24.
Please fill in the following table, give your qualification and the Yes country in which it was obtained.
24.Have you been provided with any in-school training associated with your job as a
school laboratory technician in the last five years (2004-2008)? This includes training provided by science equipment suppliers, regional or advisory technicians in your school system, from school staff members etc
No Please continue with question 25. Yes Please fill in the following table, noting the topic of your training and the provider of the training.
Topic of training e.g. induction
Provider of the training e.g. Head of Science
Qualification Country

Page 62
25. Have you undertaken any relevant further training external to your school such as training
courses, professional development or attended a conference in the last five years (2004-2008)?
No Please continue on with question 26.
Yes Please fill in the following table, noting the topic of training and the provider
Topic of course/professional development/conference
Provider of training
26.Does your current school normally fund your education/training costs? Yes, all costs Yes, some costs No 27. Do you have access to and use the following resources for support?
Please tick the boxes which indicate whether you have access to and how often you use these sources for support.
Access Frequency of use Source of support
Available
Not available
Often (Daily-weekly)
Sometimes (Monthly –
once per term)
Rarely (annually) or never
Regional or Senior Advisory Technician
A technician at another school
Local Science Technicians Association
Local Science Teachers Association
Online discussion board e.g., Chemtalk
CLEAPSS UK science advisory service
Internet
WorkSafe
Other (specify)

Page 63
28.In the following table, please tick the box indicating whether you feel:
Confident to perform tasks associated with these topics competently, OR Need support or further training to perform tasks associated with these topics confidently and
competently, OR Not applicable i.e. the task is not part of my role or not required at this school.
Topics/tasks
Con
fiden
t
Nee
d
supp
ort o
r fu
rthe
r tr
aini
ng
Not
ap
plic
able
Making up solutions, reagents and media
Storing chemicals in correct classes and conditions as required by legislation
Labelling chemicals to comply with legislation
Requirements of animal ethics codes of practice
Requirements of Material Safety Data Sheets Preparing risk assessment sheets for hazardous substances and procedures
Radiation safety
Disposal of hazardous wastes
Handling chemicals safely
Fire extinguishers
Maintaining aquaria, vivaria and animal handling
Organising rock collections
Accidents and emergency procedures
Setting-up telescopes for astronomy
Working with data loggers
Working with digital cameras
Microscopy and microscope servicing
Rocketry
Forensic science: fingerprinting and chromatography
Robotics and electronics
Electrophoresis
Microbiology / biotechnology
First Aid
Budgeting and maintaining financial records
Computer and ICT skills
Training and supervision of other technicians

Page 64
29. Please complete the following table by ticking the relevant boxes which indicate who most commonly performs these duties.
Duties Senior or the
Laboratory Technician
Assistant Laboratory Technician
Science Teacher
Other Not Applica
ble
Practical work in the laboratory Deliver equipment to rooms and collect equipment from rooms
Pc1
Keep laboratory clean and tidy Pc2
Assist the teacher or students with equipment Pc3
Work in the preparation room Check in and store chemicals and equipment Pr1
Keep preparation room clean and tidy Pr2
Make up solutions, reagents and media Pr3
Carry out maintenance and repair of equipment Pr4
Trial practical activities Pr5
Store chemicals in correct classes and conditions as required by legislation
Pr6
Update file of Material Safety Data Sheets Pr7
Write risk assessment sheets for preparation room tasks Pr8
Write risk assessment sheets for teaching activities Pr9
Label chemicals in compliance with legislation Pr10
Coordinate use of practical resources and facilities between science teachers
Pr11
Demonstrate and explain use of equipment to teachers Pr12
Management of preparation room Place orders and check deliveries Ma1
Maintain financial records Ma2
Operate the science budget Ma3
Conduct stocktake of chemicals and/or equipment Ma4
Animal Care Routine feeding, care and monitoring of animals Ac1
Monitor animal welfare Ac2
Ensure compliance with animal ethics codes Ac3
Health and safety Ensure safe storage of radioactive sources Hs1
Ensure safe disposal of hazardous wastes Hs2
Conduct safety checks on equipment Hs3
Conducts safety testing and tagging of electrical equipment in compliance with legislation
Hs4
Check first aid kits and equipment Hs5
Obtain relevant licences, permits and external safety checks Hs6
Update/advise science staff on health and safety legislation and procedures
Hs7
Provide First Aid to science students and teachers Hs8
Supervision of other laboratory staff Induct and train other laboratory staff Su1
Prioritize tasks and plan work of other laboratory staff Su2
SECTION C: Duties Associated with Laboratory/Practical Work
This section is to be completed by the (senior) laboratory technician together with the teacher-in-charge of science. Please note that any information you provide will be anonymous.

Page 65
30. Please list any other technical/support duties associated with laboratory/practical
work in the table below and indicate who performs them
Task
Senior or the Laboratory Technician
Assistant Laboratory Technician
Science Teacher
Other
31.Please tick the relevant boxes to indicate how often the laboratory technician/s perform
these tasks that are not directly associated with laboratory/practical work.
Task Often (Daily-weekly)
Sometimes (Monthly - once per term)
Rarely (annually) or never
Office use
Supporting teaching
Learning technologies support e.g. with audiovisual equipment / computers
B31st1
Supervising students in the classroom B31st2
Supervising students on science excursions B31st3
Assisting subject areas other than science B31st4
Administrative duties
Clerical duties e.g. photocopying, laminating, loaning out of textbooks
B31ad1
Setting up displays B31ad2
Locating library resources B31ad3
Loaning out and checking in of laptops B31ad4
Other responsibilities
Locking up the Science Department B31or1
Attending Science Department meetings B31or2
Attending Occupational Health and Safety Meetings
B31or3
Other (Please list the task and indicate how often you perform this task) B31ot1
B31ot2
B31ot3
B31ot4

Page 66
32.As a laboratory technician do you have convenient access to an authoritative source of advice on:
Tick one box Topic Yes No
Laboratory techniques and procedures Health and safety issues and legislative requirements Animal ethics codes and requirements 33.What changes to your training, support or role would enable you to provide better
support to the teaching of science in your school?
Training Support Role
34. Do you have any other comments about your role as a laboratory technician? Additional comments can be emailed to [email protected]. Any emailed comments will be de-identified and aggregated with other feedback to maintain confidentiality.

Page 67
Please turn to the end of page 11

Page 68
35.Please identify the main reason for having no laboratory technician at your school. Budget constraints School too small Don’t teach science Difficulty with recruiting a suitably qualified person
Other (Please explain)
___________________________________ 36.Who is responsible for performing the duties of a laboratory technician, such as
preparing for practical work? Science Teacher Other staff member Student
Unpaid volunteer Other ( Please explain) ___________ _________________________ 37. If your school did have a laboratory technician, how would this affect the amount of
practical work in your school’s science curriculum?
Decrease No change Increase
38. If your school did have a laboratory technician, how would this affect the quality of practical work in your school’s science curriculum?
Decrease No change Increase
You have now completed this questionnaire. Thank you for taking the time to answer these questions.
Please return the completed survey in the prepaid envelope which was included with your questionnaire.
If you have misplaced the prepaid envelope, please return to the address below. Professor Mark Hackling School of Education Edith Cowan University 100 Joondalup Drive JOONDALUP WA 6027
SECTION D: For Schools that Do Not Employ a Laboratory Technician This section is to be completed by the teacher-in-charge of science at schools that do not employa laboratory technician and answered No to question 6 on page 1.
Please note that any information you provide will be anonymous

Page 69
Appendix 3: Categories of interview participants Category Education sector Jurisdiction
Teacher association (ASTA) Government SA
Occupational Safety and Health (WorkSafe) WA
Teacher-in-charge of science Catholic WA
Teacher-in-charge of science Independent SA
Teacher-in-charge of science Government QLD
Laboratory technician Catholic NSW
Laboratory technician Government NT
Laboratory technician Government TAS
Advisory technician Government WA
Laboratory technician association (SALMA) SA
Laboratory technician association (LTAV) VIC
Science Policy Officer Government SA
Science Policy Officer Independent QLD
Science Policy Officer Government WA
Training Government ACT
Training Government SA
Training Government VIC
Training Government NSW

Page 70
Appendix 4: Supplementary demographic data Ap-Table 4A: Numbers of surveys sent and received by jurisdiction and sector
Government sector Catholic and Independent sectors Juris- -diction
Total number
of surveys
sent
Sent Returned Return rate (%)
Sent Returned Return rate (%)
WA 244 140 41 29 104 48 46
SA 204 112 36 32 92 19 21
NT 24 15 10 67 9 3 33
QLD 424 216 109 50 208 74 36
NSW 372 0 0 -a 372 80 22
ACT 44 27 11 41 17 9 53
VIC 611 310 106 34 301 81 27
TAS 88 60 25 42 28 7 25
Total 2011 880 338 38 1131 321 28 Note. a NSW DET did not give permission for its schools to participate in the study. Ap-Table 4B: Numbers of surveys sent and received by sector Sector School with
technicians Schools without
technicians All schools Per cent of
schools in the sample
Government 316 23 339 51
Catholic 120 3 123 19
Independent 170 27 197 30
Sector not indicated 1 0 1
Total 607 53 660 100

Page 71
Ap-Table 4C: Numbers of schools that completed the questionnaire by type of school
Number of schools School type With
technicians Without
technicians Total
Per cent of all schools in the
sample
Secondary school (Years 7/8 -12) 358 10 368 56
K/P – 12 School 173 26 199 30
Middle school (Years 7/8 – 10)
36 3 39 6
Senior college (Years 11 & 12)
31 1 32 5
K- 10 school 9 11 20 3
Other 0 2 2 0
Total 607 53 660 100 Ap-Table 4D: Location of schools
Number of schools School location a With
technicians Without
technicians Total
Per cent of all schools in the
sample
Metropolitan 379 20 399 60
Provincial 210 31 241 37
Remote 9 1 10 2
No postcode 9 0 9 1
Total 607 53 660 100 Note. a From DEEWR data of regional location determined by postcode.

Page 72
Appendix 5: Supplementary data about schools with technicians Ap-Table 5A: Combinations of full-time, part-time and casual technicians in schools that employ technicians (n=607) Technicians Number of schools Per cent of schools
Full-time only 268 44.2
Part-time only 217 35.7
Full-time and part-time 111 18.3
Full-time and casual 5 0.8
Casual only 3 0.5
Full-time, part-time and casual 2 0.3
Part-time and casual 1 0.2
Total 607 100 Ap-Table 5B: Proportions of schools that have experienced difficulty recruiting suitably qualified and experienced laboratory technicians by school location (n=607)
Had difficulty recruiting Did not have difficulty recruiting School location Number Per cent Number Per cent
Metropolitan 161 44 201 56
Provincial 75 123
Remote 6 3
No postcode 3
39
5
61
Total number of schools 245 40 332 55
No response to question 30 5 0 0

Page 73
Ap-Table 5C: School size and number of laboratories and technicians by school types for schools that provided data on student numbers (n=577) School type
Number of
schools
Mean no. of
students on roll
Mean number of labs
SD Mean tech
hours per week
SD Mean No of FTE
technicians*
SD
Secondary schools (Years 7/8 -12)
344 832 5.03 2.09 45.93 24.97 1.28 0.69
Senior colleges (Years 11 & 12)
30 774 5.23 2.34 43.67 23.58 1.21 0.66
Middle schools (Years 7/8 – 10)
32 587 3.69 1.71 34.88 14.43 0.97 0.40
K- 10 schools
8 553 2.63 2.56 25.00 18.84 0.69 0.52
K/P – 12 schools 163 579 4.19 2.54 39.85 31.21 1.11 0.87
All schools 577 740 4.69 2.28 43.19 26.55 1.20 0.74
Note. a FTE = number of full time equivalent technician, where full time is assumed to be 36 hours per week Ap-Table 5D: Comparison of service factors in schools in different sectors (n=556)
Service factor Sector Maximum Minimum Mean SD Median
1 0.80 0.15 0.40 0.147 0.37
2 1.20 0.12 0.45 0.193 0.41
3 1.14 0.05 0.47 0.192 0.44
All schools 1.20 0.05 0.45 0.186 0.41
Ap-Table 5E: Comparison of service factors for jurisdictions in ascending order of median values (n=557)
Service factor Jurisdiction Maximum Minimum Mean SD Median
1 0.81 0.05 0.35 0.154 0.31 2 0.89 0.13 0.38 0.191 0.32 3 0.56 0.22 0.38 0.105 0.36 4 1.14 0.15 0.43 0.172 0.4 5 1.2 0.24 0.54 0.332 0.42 6 1.16 0.2 0.49 0.197 0.46 7 0.96 0.12 0.47 0.149 0.46 8 1.2 0.17 0.64 0.236 0.6 All schools 1.2 0.05 0.45 0.186 0.41

Page 74
Ap-Table 5F: Comparison of service factors in different types of schools (n=557)
Service factor School type
Number of
schools Maximum Minimum Mean SD Median
Secondary schools (Years 7/8 -12) 329 1.20 0.12 0.42 0.150 0.41
K/P – 12 schools 159 1.14 0.05 0.46 0.208 0.42
Senior colleges (Years 11 & 12) 28 1.20 0.19 0.54 0.276 0.46
Middle schools (Years 7/8 – 10) 32 1.04 0.22 0.50 0.198 0.50
K-10 schools 9 1.05 0.15 0.61 0.333 0.54
All schools 557 1.20 0.05 0.45 0.186 0.41

Page 75
Appendix 6: Supplementary data about schools without technicians Ap-Table 6A: Types of schools without laboratory technicians (n=53)
School type Number of schools Per cent of schools in the study sample without technicians
K/P – 12 schools 26 49
K- 10 schools 11 21
Secondary schools (Years 7/8 -12) 10 19
Middle schools (Years 7/8 – 10) 3 6
Other types of schools 2 4
Senior colleges (Years 11 & 12) 1 2
Total 53 Ap-Table 6B: Locations of schools without lab technicians (n=53)
Number of schools School location
Number Per cent
Metropolitan 20 38
Provincial 31 58
Remote 1 2
No postcode 1 2
Total 53 100

Page 76
Appendix 7: Supplementary data about technicians Ap-Table 7A: Age and gender profile of technicians (n=813)
Per cent of technicians in the study sample Age range (years)
Males Females All
18 – 30 1.4 4.3 5.7
31 – 40 3.1 13.3 16.4
41 – 50 4.8 32.8 37.6
51 – 60 5.3 29.0 34.3
Over 60 1.7 4.3 6.0
All ages 16.2 83.8 100 Ap-Table 7B: Countries from which technicians obtained other qualifications (n=670)
Number of people Country
Australia USA UK Asia Europe South America
New Zealand & Pacific
Africa Totals
Bachelor of Science 208 4 6 21 7 2 6 4 258 Masters or PhD 21 3 1 6 1 0 1 0 33 First Aid 416 0 0 1 0 1 0 1 418 OH&S (including Chemwatch) 84 0 0 0 0 0 0 0 84 Other TAFE certficate/diploma 212 1 3 2 3 1 4 3 229 Overseas lab tech qualification 0 2 4 0 3 1 2 2 14 Diploma of Education 56 1 1 3 3 0 1 1 66 Health science qualification (incl doctor, nurse, etc)
21 0 0 1 0 0 1 1 24
Total responses 1018 11 15 34 17 6 15 10 1126 Ap-Table 7C: Topics of training attended by technicians as in-school training associated with their job as a school laboratory technician in the last five years (2004-2008) (n=824)
Topic of training. a Number who did training on this topic
Per cent of technicians
OH&S (includes fire extinguisher, waste management) 210 25
Other (personal development, administration, general school PD, etc) 163 20
Computer/IT 138 17
First aid 100 12
Use of laboratory equipment 102 12
Induction 96 12
Total number of responses 809 Note. a Technicians could report as many as six topics

Page 77
Ap-Table 7D: Attendance by technicians at out-of-school training associated with their job as a school laboratory technician in the last five years (2004-2008) (n=824)
Topic of external training Number who did training on this topic Per cent of technicians
General lab technician PD/in-service PD 449 54
Conference (lab tech, teacher) 365 44
OH &S (includes waste disposal) 258 31
Use of equipment 63 8
Chemwatch 53 6
First aid 42 5
TAFE course 30 4
Animal care 30 4
Other 6 1
Total responses 1296 Ap-Table 7E: Providers of in-school training accessed by school laboratory technicians in the last five years (2004-2008)? (n=824)
Number of technicians who did training with given providers.
Topic State Education
department
Head of science or
science teacher
Other person within school
Outside organisation
Senior technician Other Total
Induction 1 50 6 3 36 0 96
Computer/IT 2 21 62 45 7 1 138
First aid 0 3 23 72 0 2 100
OH&S (incl fire extinguisher, waste management)
23 19 17 127 24 0
210
Use of lab equipment 2 22 2 71 5 0 102
Other (personal dev, admin, etc 23 17 37 72 11 3 163
Total responses 51 132 147 390 83 6 809
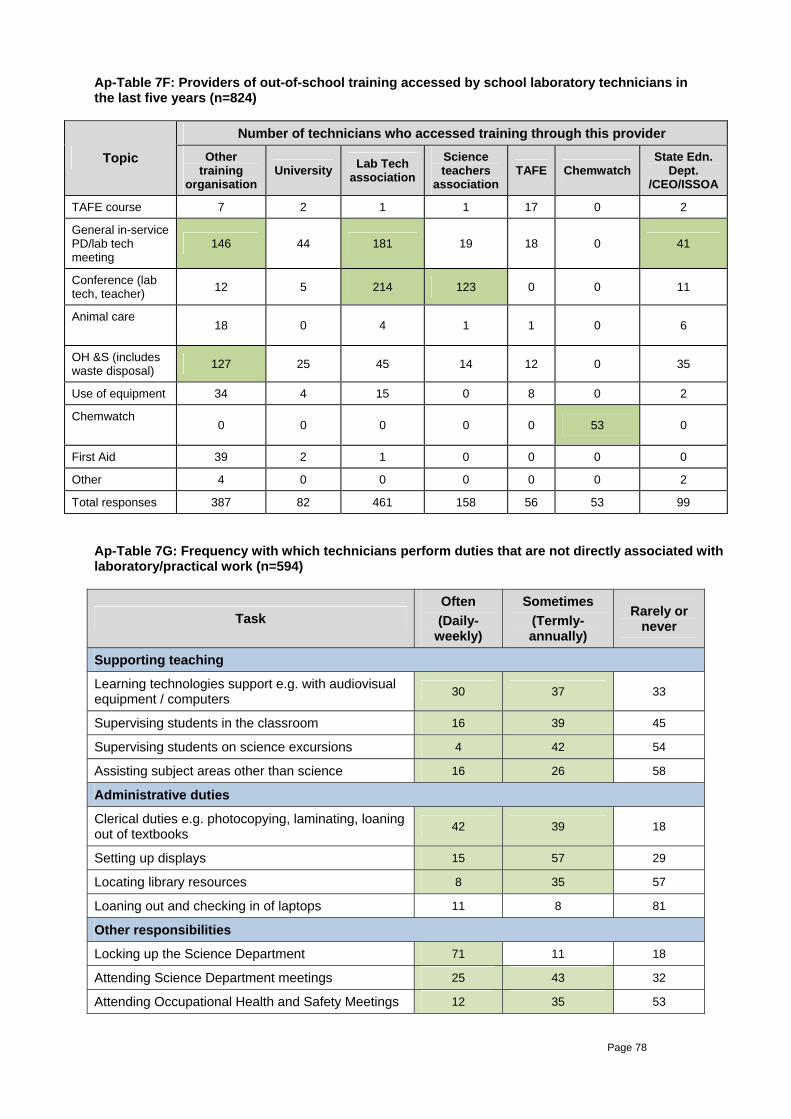
Page 78
Ap-Table 7F: Providers of out-of-school training accessed by school laboratory technicians in the last five years (n=824)
Number of technicians who accessed training through this provider
Topic Other training
organisation University Lab Tech
association Science teachers
association TAFE Chemwatch
State Edn. Dept.
/CEO/ISSOA
TAFE course 7 2 1 1 17 0 2
General in-service PD/lab tech meeting
146 44 181 19 18 0 41
Conference (lab tech, teacher) 12 5 214 123 0 0 11
Animal care
18 0 4 1 1 0 6
OH &S (includes waste disposal) 127 25 45 14 12 0 35
Use of equipment 34 4 15 0 8 0 2
Chemwatch
0 0 0 0 0 53 0
First Aid 39 2 1 0 0 0 0
Other 4 0 0 0 0 0 2
Total responses 387 82 461 158 56 53 99 Ap-Table 7G: Frequency with which technicians perform duties that are not directly associated with laboratory/practical work (n=594)
Task Often (Daily-
weekly)
Sometimes (Termly-annually)
Rarely or never
Supporting teaching
Learning technologies support e.g. with audiovisual equipment / computers 30 37 33
Supervising students in the classroom 16 39 45
Supervising students on science excursions 4 42 54
Assisting subject areas other than science 16 26 58
Administrative duties
Clerical duties e.g. photocopying, laminating, loaning out of textbooks 42 39 18
Setting up displays 15 57 29
Locating library resources 8 35 57
Loaning out and checking in of laptops 11 8 81
Other responsibilities
Locking up the Science Department 71 11 18
Attending Science Department meetings 25 43 32
Attending Occupational Health and Safety Meetings 12 35 53