the strategy to transform health care and the role of … · 1/16/2017 · the power of outcome...
TRANSCRIPT

1 Copyright © Michael Porter 2016
1
The Strategy to Transform Health Care
and The Role of Outcomes
No part of this publication may be reproduced, stored in a retrieval system, or transmitted in any form or by any means — electronic, mechanical, photocopying, recording, or otherwise — without the permission
of Michael E. Porter. For further references see www.isc.hbs.edu.
Professor Michael E. Porter
OECD Policy Forum
People at the Center: The Future of Health
Paris, France
www.isc.hbs.edu January 16, 2017

2 Copyright © Michael Porter 2016
100
200
300
2010 2005 2000 1995
Income
HC Spend
GDP
2013
100
200
300
400
Income
HC Spend
GDP
2013 2010 2005 2000 1995
100
200
Income
HC Spend
GDP
2013 2010 2005 2000 1995
100
200
300
Income
HC Spend
GDP
2013 2010 2005 2000 1995
100
150
200
250
Income
HC Spend
GDP
2013 2010 2005 2000 1995
250
200
150
100
Income
HC Spend
GDP
2013 2010 2005 2000 1995
Index
(1995=100)
18.0% of GDP Index
(1995=100)
Index
(1995=100)
Index
(1995=100)
Notes: Indexes based on local currencies; Income = Personal Disposable Income; HC expenditures as % of GDP are OECD estimates Source: Economist Intelligence Unit May 2014, BCG analysis
Index
(1995=100)
9.6% of GDP
The Health Care Problem is a Global Issue Health Care Spending vs GDP and Income
11.8% of GDP
10.9% of GDP
11.5% of GDP
9.7% of GDP
Index
(1995=100)
3 Copyright © Michael Porter 2016
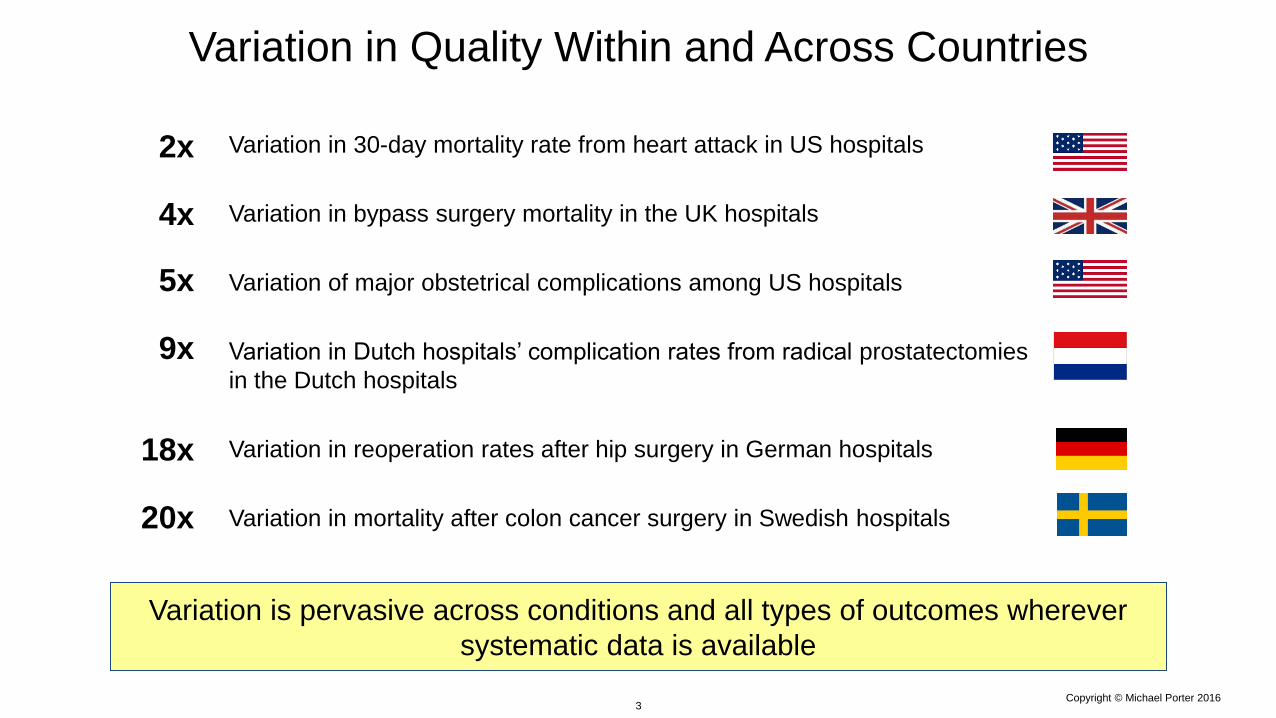
Variation in Quality Within and Across Countries
Variation is pervasive across conditions and all types of outcomes wherever
systematic data is available
Variation in 30-day mortality rate from heart attack in US hospitals
Variation in bypass surgery mortality in the UK hospitals
Variation of major obstetrical complications among US hospitals
Variation in Dutch hospitals’ complication rates from radical prostatectomies
in the Dutch hospitals
Variation in reoperation rates after hip surgery in German hospitals
Variation in mortality after colon cancer surgery in Swedish hospitals
4x
9x
18x
20x
2x
5x
4 Copyright © Michael Porter 2016
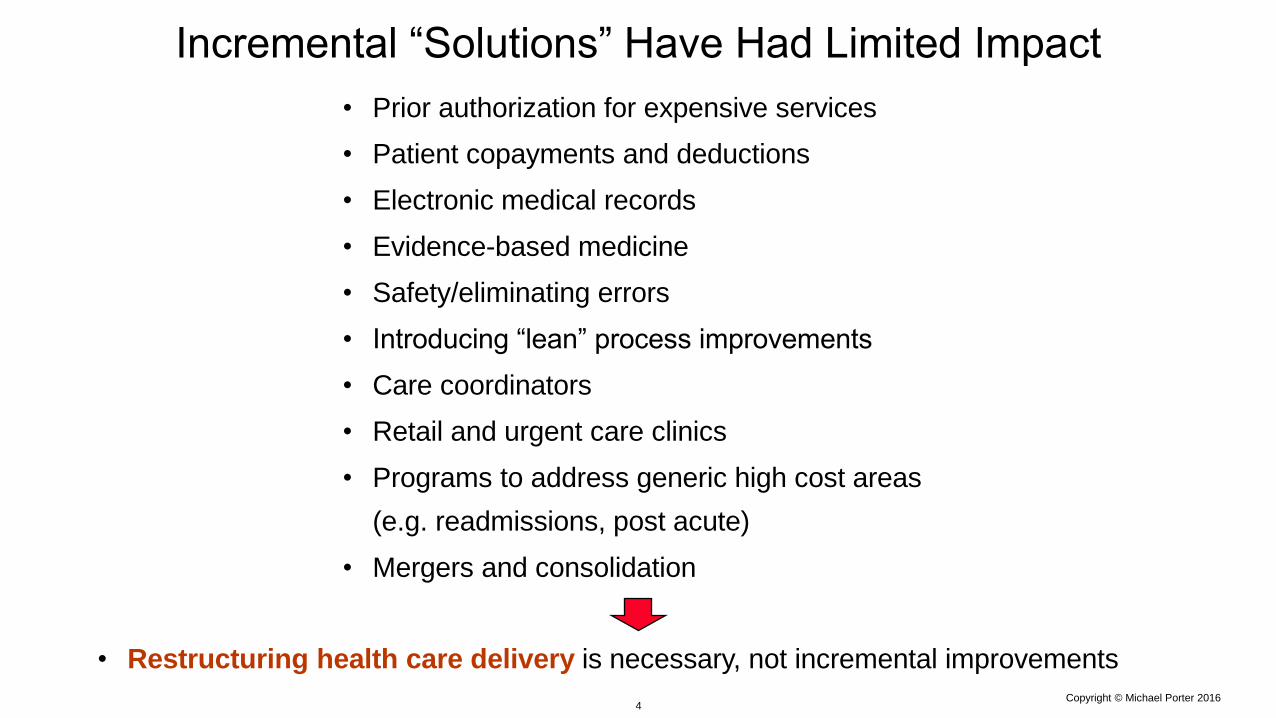
Incremental “Solutions” Have Had Limited Impact
• Prior authorization for expensive services
• Patient copayments and deductions
• Electronic medical records
• Evidence-based medicine
• Safety/eliminating errors
• Introducing “lean” process improvements
• Care coordinators
• Retail and urgent care clinics
• Programs to address generic high cost areas
(e.g. readmissions, post acute)
• Mergers and consolidation
• Restructuring health care delivery is necessary, not incremental improvements

5 Copyright © Michael Porter 2016
Solving the Health Care Problem
• The fundamental goal and purpose of health care is to improve
value for patients
• Delivering high value health care is the definition of success
• Value is the only goal that can unite the interests of system
participants
• Improving value is the only real solution
• The question is how to design health care delivery systems and
organizations that substantially improve patient value
Value = Health outcomes that matter to patients
Costs of delivering these outcomes
6 Copyright © Michael Porter 2016
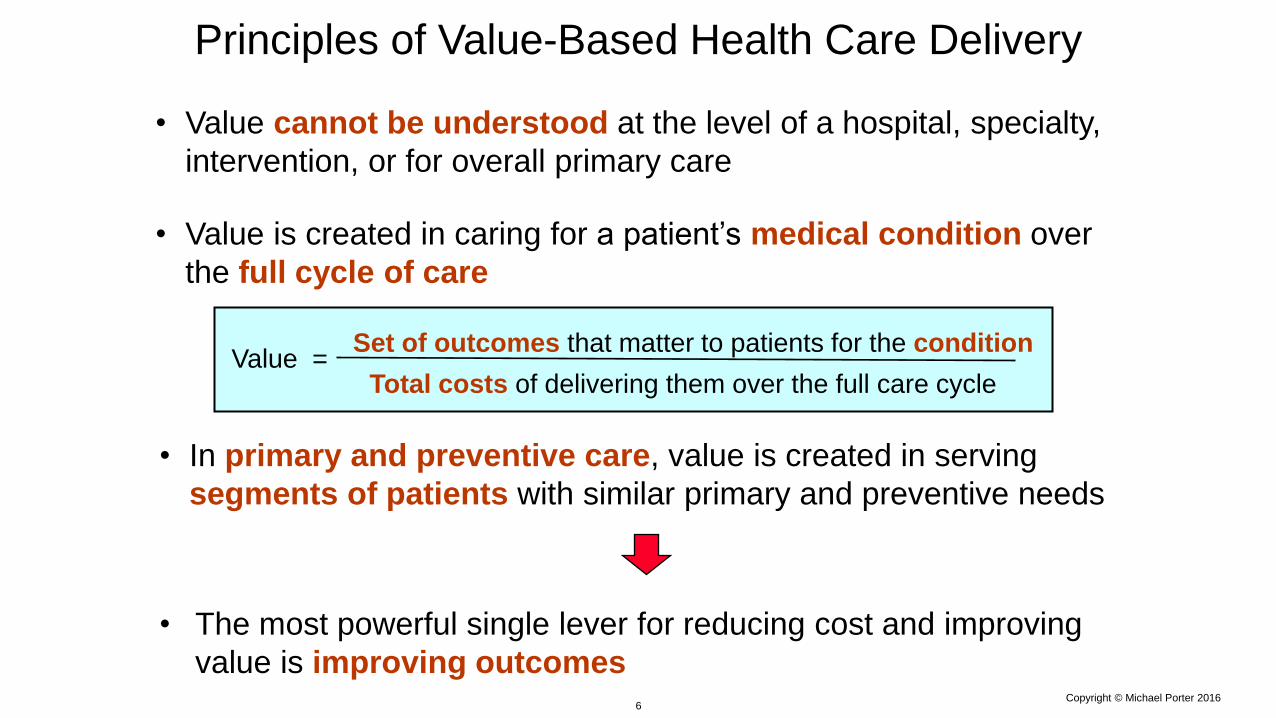
Principles of Value-Based Health Care Delivery
Value = Set of outcomes that matter to patients for the condition
Total costs of delivering them over the full care cycle
• In primary and preventive care, value is created in serving
segments of patients with similar primary and preventive needs
• The most powerful single lever for reducing cost and improving
value is improving outcomes
• Value cannot be understood at the level of a hospital, specialty,
intervention, or for overall primary care
• Value is created in caring for a patient’s medical condition over
the full cycle of care
7 Copyright © Michael Porter 2016
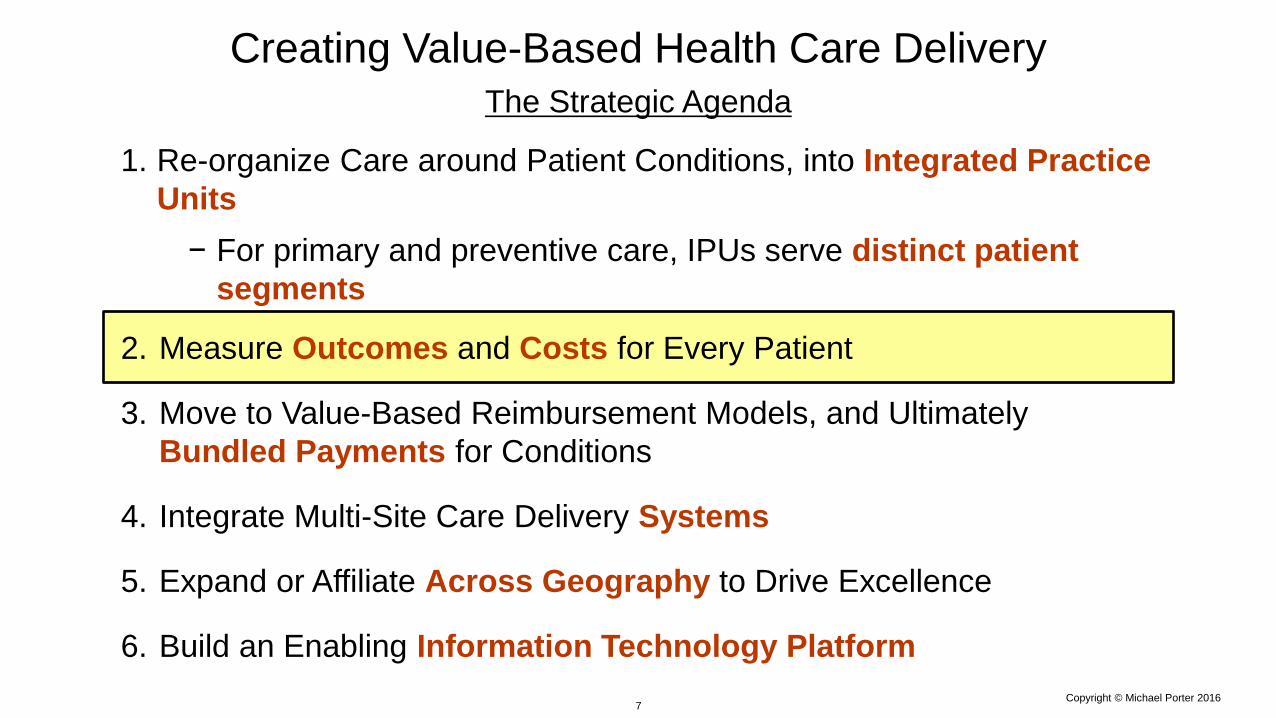
1. Re-organize Care around Patient Conditions, into Integrated Practice
Units
− For primary and preventive care, IPUs serve distinct patient
segments
2. Measure Outcomes and Costs for Every Patient
3. Move to Value-Based Reimbursement Models, and Ultimately
Bundled Payments for Conditions
4. Integrate Multi-Site Care Delivery Systems
5. Expand or Affiliate Across Geography to Drive Excellence
6. Build an Enabling Information Technology Platform
Creating Value-Based Health Care Delivery The Strategic Agenda

8 Copyright © Michael Porter 2016
The Power of Outcome Measurement in
Value-Based Health Care
• Outcomes are the most important information for patients
• Outcomes define success for every clinician and health care
organization
• Outcomes drive multidisciplinary care and care innovation
• Outcomes are essential components of any value-based payment
model
• Outcomes validate cost reduction that is truly value-enhancing
• Outcomes validate the areas for service line growth and affiliation

9 Copyright © Michael Porter 2016
9
Patient Experience,
Engagement, and
Adherence
E.g. PSA, Gleason
score, surgical margin
Protocols/Guidelines
Patient Initial
Conditions,
Risk Factors
Processes Indicators Outcomes
Structure
E.g., Staff certification, facilities standards
The Quality Measurement Landscape
10 Copyright © Michael Porter 2016
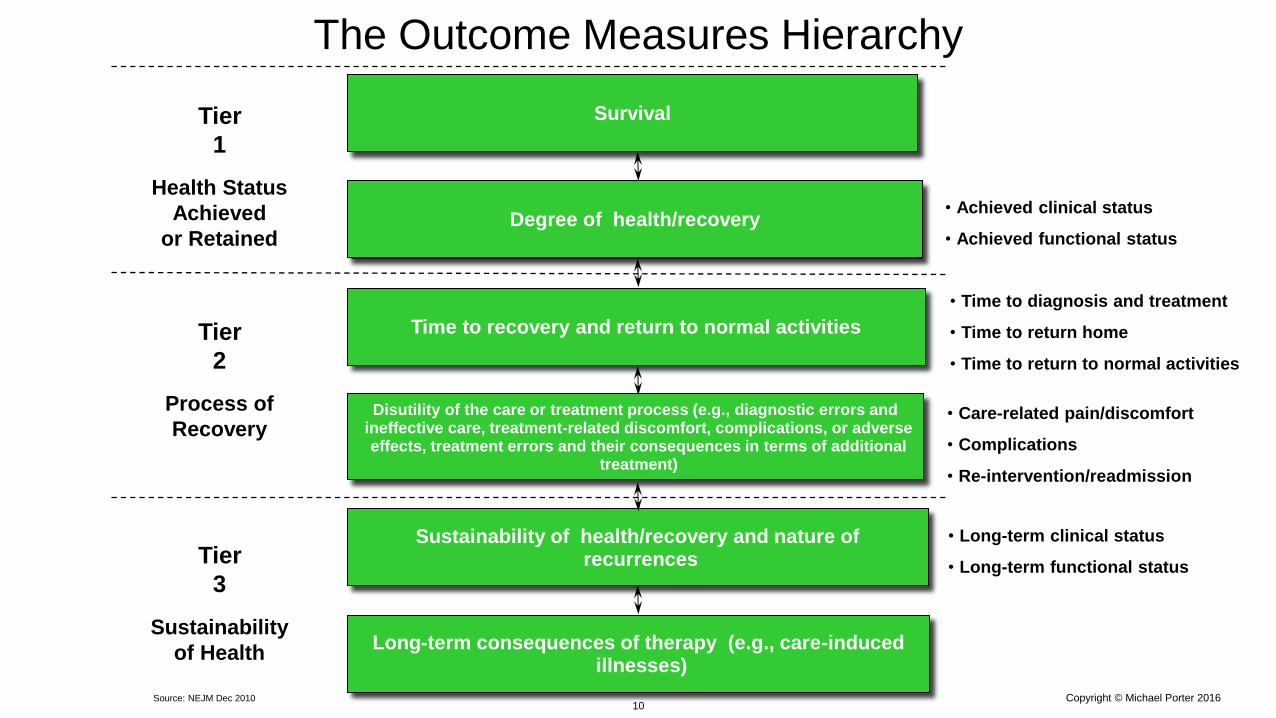
The Outcome Measures Hierarchy
Survival
Degree of health/recovery
Time to recovery and return to normal activities
Sustainability of health/recovery and nature of recurrences
Disutility of the care or treatment process (e.g., diagnostic errors and ineffective care, treatment-related discomfort, complications, or adverse effects, treatment errors and their consequences in terms of additional
treatment)
Long-term consequences of therapy (e.g., care-induced illnesses)
Tier
1
Tier
2
Tier
3
Health Status
Achieved
or Retained
Process of
Recovery
Sustainability
of Health
Source: NEJM Dec 2010
• Achieved clinical status
• Achieved functional status
• Care-related pain/discomfort
• Complications
• Re-intervention/readmission
• Long-term clinical status
• Long-term functional status
• Time to diagnosis and treatment
• Time to return home
• Time to return to normal activities
11 Copyright © Michael Porter 2016
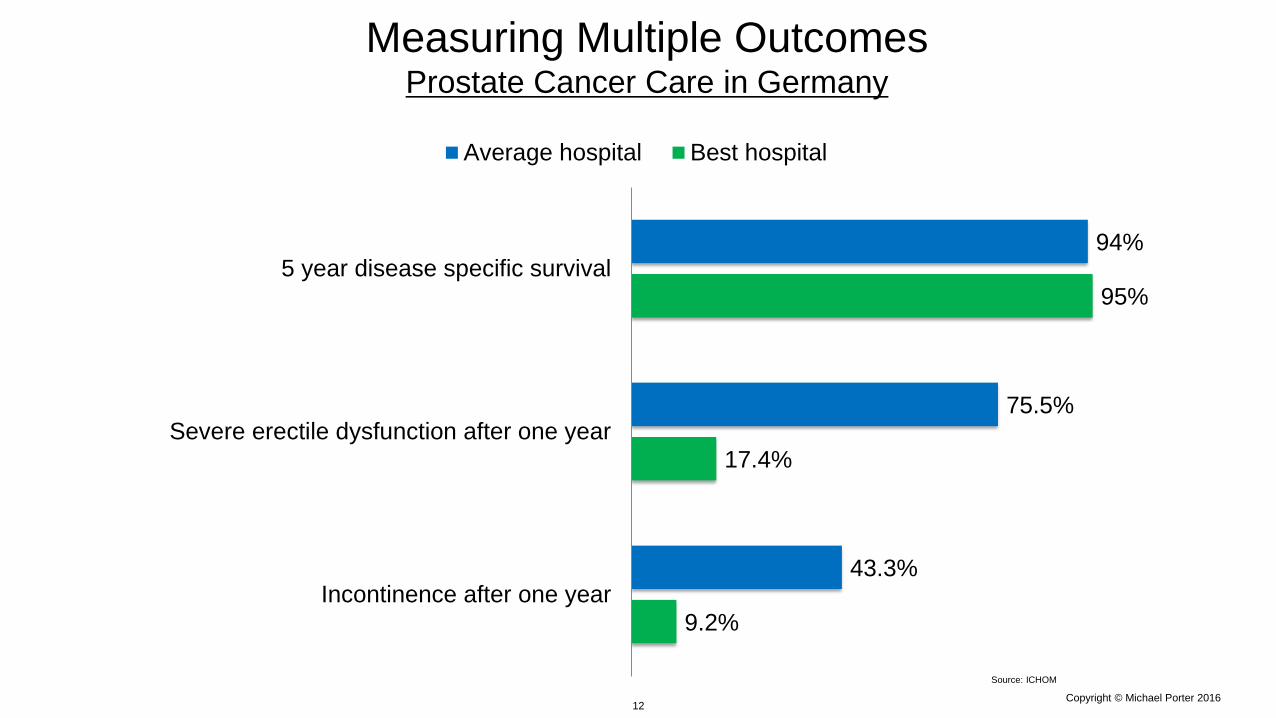
9.2%
17.4%
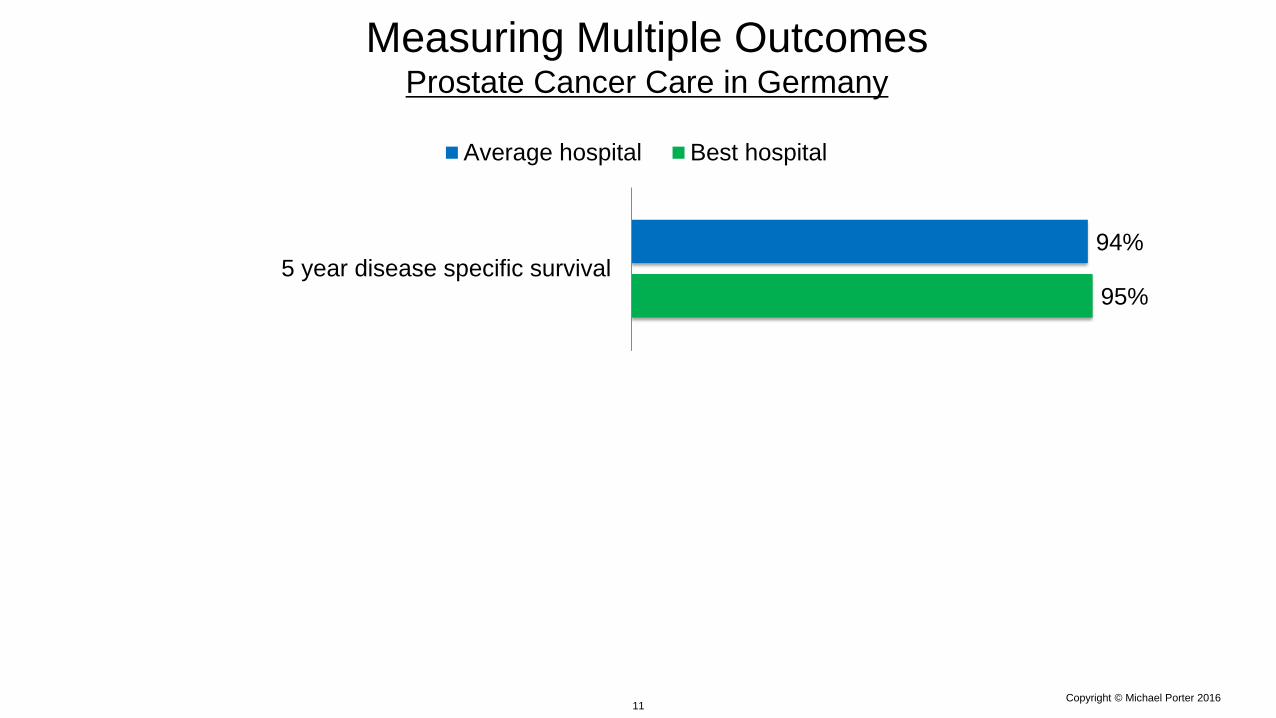
95%
43.3%
75.5%
94%
Incontinence after one year
Severe erectile dysfunction after one year
5 year disease specific survival
Average hospital Best hospital
Measuring Multiple Outcomes Prostate Cancer Care in Germany
Source: ICHOM
12 Copyright © Michael Porter 2016
9.2%
17.4%
95%
43.3%
75.5%
94%
Incontinence after one year
Severe erectile dysfunction after one year
5 year disease specific survival
Average hospital Best hospital
Measuring Multiple Outcomes Prostate Cancer Care in Germany
Source: ICHOM
13 Copyright © Michael Porter 2016
The International Consortium for Health Outcomes
Measurement
Our mission:
Unlock the potential of value-based health care by defining
global Standard Sets of outcome measures that really
matter to patients for the most relevant medical conditions,
and driving adoption and reporting of these measures
worldwide
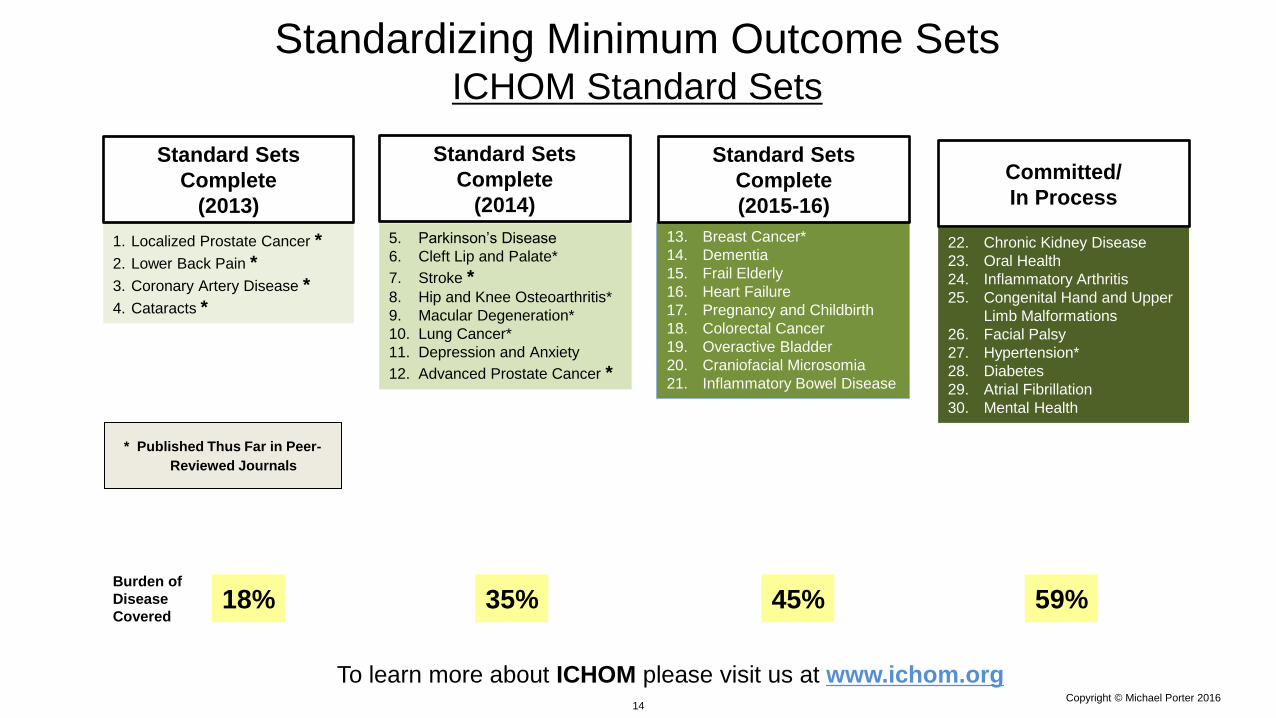
14 Copyright © Michael Porter 2016
18% 35% 45%
1. Localized Prostate Cancer *
2. Lower Back Pain *
3. Coronary Artery Disease *
4. Cataracts *
Standard Sets
Complete
(2013)
13. Breast Cancer*
14. Dementia
15. Frail Elderly
16. Heart Failure
17. Pregnancy and Childbirth
18. Colorectal Cancer
19. Overactive Bladder
20. Craniofacial Microsomia
21. Inflammatory Bowel Disease
Standard Sets
Complete
(2015-16)
5. Parkinson’s Disease
6. Cleft Lip and Palate*
7. Stroke * 8. Hip and Knee Osteoarthritis*
9. Macular Degeneration*
10. Lung Cancer*
11. Depression and Anxiety
12. Advanced Prostate Cancer *
Standard Sets
Complete
(2014)
22. Chronic Kidney Disease
23. Oral Health
24. Inflammatory Arthritis
25. Congenital Hand and Upper
Limb Malformations
26. Facial Palsy
27. Hypertension*
28. Diabetes
29. Atrial Fibrillation
30. Mental Health
Committed/
In Process
Burden of
Disease
Covered
Standardizing Minimum Outcome Sets ICHOM Standard Sets
* Published Thus Far in Peer-
Reviewed Journals
To learn more about ICHOM please visit us at www.ichom.org
59%

15 Copyright © Michael Porter 2016
Global Demand to Compare Outcomes is Accelerating

16 Copyright © Michael Porter 2016
Transforming Health Care
• We know the path forward
• Value for patients is the True North
• Value-based thinking will revolutionize care delivery, payment,
and strategy for health systems
• Standardized outcome measurement is the single most
powerful driver
• ICHOM is honored to partner with the OECD to support
health ministers in accelerating this agenda