the strength of masonry walls when · pdf file15th international brick and block masonry...
TRANSCRIPT

15th International Brick and Block Masonry Conference
Florianópolis – Brazil – 2012
THE STRENGTH OF MASONRY WALLS WHEN SUBJECT TO FLOOD LOADING
D.M. Herbert1; D.R. Gardner2; M. Harbottle3, T.G. Hughes4 1 PhD candidate, Cardiff School of Engineering, Cardiff University, UK, [email protected]
2 Lecturer, Cardiff School of Engineering, Cardiff University, UK, [email protected] 3 Lecturer, Cardiff School of Engineering, Cardiff University, UK, [email protected] 4 Professor, Cardiff School of Engineering, Cardiff University, UK, [email protected]
...
Flooding is increasingly becoming an issue for property owners and they are likely to turn to products designed to waterproof the exterior of the building in a bid to protect their homes. However, very limited research has been completed to assess the effect of the increased hydraulic load upon the structure of the building as a result of such products. This work has been almost exclusively theoretical and has suggested sealing brickwork to a height of between 0.6 m and 1 m. This paper details the initial findings of an experimental research programme that has been initiated to examine the effect of out-of-plane hydrostatic loading on masonry walls typical of domestic or commercial premises. Masonry panels of both brick and block units have been constructed at small scale (1/6th) and hydraulic out-of plane loading has been applied incrementally until failure occurred. The study has been completed using a geotechnical centrifuge to correctly model the effect of self-weight. An important consideration in the theoretical work is the contribution to stability arising from the axial in-plane loading provided by higher floors/roofs and consideration of this is included in the experimental setup. 3D digital image correlation (DIC) was employed to monitor the wall panel during test and allowed in and out-of-plane deflections to be obtained. A series of uniform lateral loading tests, using an air bag, have previously been conducted and have proven the validity of the experimental procedure. The performance of the wall panels tested in this study are presented and the results are compared to the findings from previous research.
Keywords: Flooding, Small scale, Centrifuge, Lateral, DIC
Theme: Research and testing INTRODUCTION Flooding is becoming a widespread issue and can cause extensive damage to properties and their owner’s contents when it strikes. Reasons for a higher number of flood events may be due to changes in climatic conditions, rising sea levels, change in land use and development in flood catchment areas (Jenkins et al. 2009; Wheater 2006; Wilson 2007). Construction within a river basin can often result in reduced ground permeability leading to greater surface water volumes being directed into streams and rivers. Flood defence schemes can help in many cases, but the current economic downturn is leading to reduced capital being available for such projects (Leake 2007). Property owners are therefore more likely to turn to products that will protect their buildings from flooding. In some cases resilient materials and design can be employed to allow the property to be quickly returned to a habitable state after flooding. Alternatively, a flood resistant system can be installed to the exterior of the building that will
maintain floodwater outside. Flood resistant products frequently rely on the structure of the building to retain the water, but very limited work has been conducted to assess the implications of this scenario. A review of the literature has identified a single experimental study on full-scale (prototype) masonry walls that suggested sealing to no greater than 0.9 m (Pace 1998). Later to this, a purely theoretical approach has been presented that concluded that properties could be sealed to a height of between 0.9 and 1 m (Kelman and Spence 2003). Building codes do not offer any specific guidance to allow the calculation of a safe working level, yet government advice often suggests not to exceed 0.9 m (BSI 2005; FEMA 2009; ODPM 2003). There is an obvious need to develop a suitable method to determine the safe height to which waterproofing products should be applied. This research programme has been initiated to examine the effect of out-of-plane hydrostatic loading on 1/6th scale (model) masonry wall panels typical of domestic or commercial properties. Small scale masonry modelling has been employed successfully by a number of researchers and it allows testing to be completed economically and safely (Herbert et al. 2011). Specimens have been constructed from model scale brick or block specimens cut from prototype materials. Scale effects required that the density (effect of self-weight) of both the masonry and water were increased to correctly model the behaviour of the prototype. Testing was completed under artificially enhanced gravity within a geotechnical centrifuge to correctly model self-weight effects. Hydrostatic loading has been applied incrementally to the specimens until failure. The experimental set up allowed for different edge support conditions and the application of additional axial load to the specimen. A series of tests have previously been completed with uniform (air-bag) lateral loading conditions to validate the testing procedure (Herbert et al. 2011). EXPERIMENTAL DESIGN Model scale brick units were cut from prototype units using a method developed in a previous research programme (Hughes et al. 2002). The cutting process ensured that the model and prototype units had consistent properties (Hughes et al. 2002). Baggeridge Mellowed Red solid stock clay bricks from the same batch were used throughout the study. The cutting process yielded approximately 70 model scale bricks from a single prototype unit. The larger dimensions of the block units necessitated a different cutting method to be developed and is described in detail elsewhere (Herbert et al. 2011). A single prototype block would yield approximately 100 model scale units. Cement-lime-aggregate mortars were used in this study. Various strength mortars are being used in the on-going programme, but the results presented here are restricted to M2 compressive strength class mortar of prescribed mixing ratio 1:1:10 (cement:lime:aggregate) by mass. Ordinary building sand was not suitable for the study as the maximum particle size of 2mm would be similar to the mortar bed height of 1.6 to 2 mm. Congleton HST95 aggregate was used in the model scale mortar and the maximum particle size was 0.3mm. A water to cement ratio of 2.6 was found to provide a suitable workability. During wall panel manufacture 25 mm mortar cubes were cast for compressive strength tests. Mortar cubes for the corresponding wall panel specimens were tested in compression using a 20kN capacity test machine at a loading rate of 0.033 mm/s. Wall panels were manufactured for lateral loading tests and were of the same dimensions throughout, as shown by Figure 1. To allow specimens to be constructed efficiently and consistently a jig was designed and manufactured. The jig allowed construction of both wall panels and wallettes. Manufacture involved firstly dry assembling the model scale units flat in

the jig, as shown by Figure 2. The entire assembly was then soaked in a water tank to condition the units. After 20 mins the jig was removed from the tank and mortar was applied to the units. Vibration was then applied to work the mortar into the joints and remove any air. Additional mortar was then added to ensure each joint was filled completely. To allow removal of the base plate with the alignment pins for the masonry units, a top plate was fitted to the jig and the entire assembly was inverted (rotated by 180°). Voids left by the locating pins were filled with mortar. Specimens were covered with plastic film and left to cure for 28 days before being tested. Seven days before the centrifuge test the covering was removed and the wall panels were allowed to dry naturally before applying a coat of matt white paint. A speckle pattern, as required for the digital image correlation (DIC) system, was applied to the specimen using fine tipped black marker pens.
Figure 1. Dimensions and coordinate system for wall panel specimens (dimensions given in brackets are the equivalent at prototype scale)
Figure 2. Jig used for the manufacture of wall panel specimens showing close up of locating pins

A centrifuge typically comprises a rotating arm to which the specimen is fixed in a gondola, as shown by Figure 3 (Hughes et al. 2002). Slip rings allow the transfer of fluids, power and data as the machine rotates. A pivoting gondola allows the specimen to be constructed and mounted in the same orientation, but due to the action of the Earth’s gravitational field, will be at a small angle below the horizontal during test. The gravitational field in the specimen varies due to this angle and typically causes an acceptable variation of +3 to -10% in the normal stress levels.
Figure 3. Overview of a typical centrifuge
The specimen test jig was designed and manufactured to suit the arrangement of the centrifuge gondola and provide the necessary fixings for the supports, loading and instrumentation systems. The edges of the specimens were simply supported and a vertical axial load was applied to the top of the walls using a lever arm assembly, as shown by Figure 4. The reaction surfaces for the hydrostatic lateral load were provided by the test jig. In order to contain the water during the test and after failure an open topped polythene bag was loosely fitted into the void behind the specimen and fixed only at the top edges. Water was delivered to the test jig through the slip rings and flow was controlled remotely via two solenoid valves. Water was first supplied to a measuring cylinder on the test jig prior to being directed into the bag behind the specimen. Measurement of the water level behind the specimen was made using an LVDT with a float attached, as shown by Figure 4 (A). Sensors were connected to a data logger mounted on the centrifuge that could be accessed remotely. Deflections of the wall panel in the x, y and z directions were measured using a 3D DIC system. The DIC system comprised two digital still cameras that were linked to a computer. The cameras 0 and 1 were positioned in front of the specimen, as shown by Figures 4 (A) and (B). Vic Snap capture software (2006, Correlated Solutions Inc., Columbia, SC, USA) allowed synchronised stereo images to be obtained of the specimen. Pre-test calibration of the system is completed by capturing images of a panel with markers positioned in a known grid layout in front of the cameras in different orientations (Featherston et al. 2011). The calibration process is completed in Vic3D analysis software (2006, Correlated Solutions Inc., Columbia, SC, USA), which determines the spatial (x,y and z) position of the grid from the stereo images. Analysis of the test specimen follows by comparing the x-y position of the speckle pattern throughout the test to that of a reference image, taken pre loading, for each camera view, as shown by Figure 5. The data from each camera view and the calibration process is then utilised to determine the out-of-plane z deflections. The DIC system was

operated remotely through a wireless link. Closed circuit television (CCTV) cameras were also used to monitor the test and the outputs of these were recorded as required.
(A)
(B)
Figure 4. Testing arrangement: (A) in cross section and (B) plan layout Prior to commencing the test the data logger and DIC system were synchronised and set to capture data every 10 s. The centrifuge was started and hydraulic loading was applied to the specimen in 10 mm level increments until failure occurred. Deflections in the z direction were monitored using the DIC system and were allowed to stabilise before applying the next load increment. The centrifuge was stopped at the end of the test and where possible the crack pattern was recorded from the specimen. Images captured after each level increment were then analysed using Vic3D to obtain displacements and contour plots of the specimen during test. The load-deflection response

was obtained by combining the deflections extracted from Vic3D and the data from the water level sensor. The DIC system also allowed the position and development of cracks to be identified during the loading process.
(A) (B)
Figure 5. Tracking the position of speckle pattern between (A) the reference image and (B) an image of the deformed specimen
EXPERIMENTAL RESULTS AND DISCUSSION The results presented here are part of an on-going research programme. Two test results are presented here and the specimens are as follows: - Specimen H1 was manufactured from aerated autoclaved cement (AAC) block units. - Specimen H2 was manufactured from brick units. Both specimens were simply supported on all four edges and a vertical compressive load equal to one additional storey of identical masonry was applied in each case. Centrifuge and mortar cube testing followed the procedures described earlier. Average compressive strengths of the mortar cubes for both specimens were found to be similar, as shown by Table 1. The strength of the mortar cubes was higher than that given by the prescribed mixing ratio.
Table 1. Average compressive strength of mortar cubes
Specimen Compressive strength, N/mm2 Coefficient of variation, % H1 2.61 11.28 H2 3.19 3.85
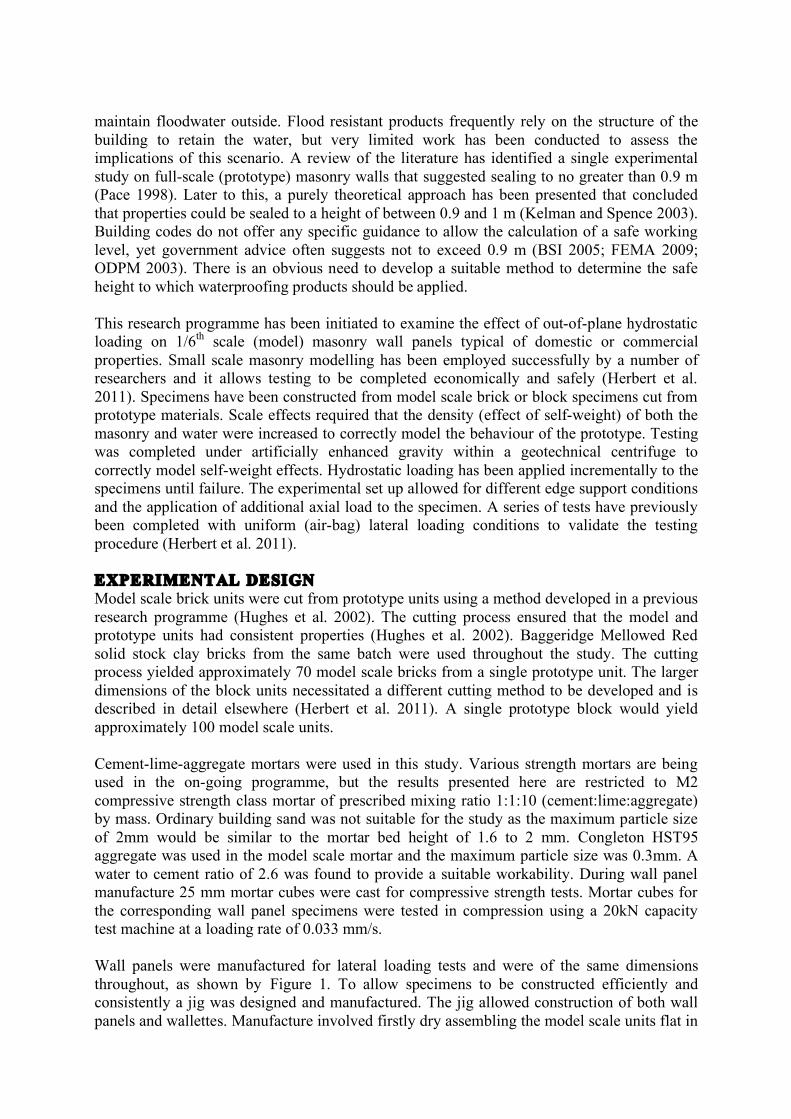
Specimen H1 initially cracked horizontally between courses 3 and 4, at a water level of 175 mm, as shown by Figure 6. Initial cracking occurred during level increment rather than at a stable state. Failure occurred rapidly in specimen H1 at a constant level of 175 mm (1.05 m at prototype scale) soon after initial cracking was evident. At failure additional cracks developed that were generally vertical or diagonal in direction. Cracks tended to pass through both the units and mortar joints. The cracks above the main horizontal crack tended towards the upper support, whilst those below tended towards the side or lower supports. Specimen H2 initially cracked horizontally and diagonally at a water level of 208 mm, just prior to final failure. Horizontal cracking was between courses 10 and 11 on the left hand side and centre of the panel and between courses 8 and 9 on the right hand side of the panel, as shown by Figure 6. Diagonal cracking was also apparent on the right and left of specimen H2 below the horizontal cracks. Failure of specimen H2 followed rapidly after initial cracking was observed at the same water level of 208 mm (1.25 m at prototype scale), when additional diagonal cracks formed in the upper section of the panel. Initial cracking and failure occurred
during level increment rather than at a stable state. The cracks below the horizontal crack tended towards the lower support and those above tended towards the side supports. The horizontal cracks occurred at approximately two thirds of the final failure water level in both specimens and the patterns were offset towards the base of the panels. A good degree of symmetry was observed in both specimens about a vertical centre line. Symmetry was shown about the horizontal crack in specimen H2, but was not apparent in specimen H1. Previous uniform (air-bag) lateral loading tests completed with AAC blocks tended to have a crack patterns that were centralised to height or slightly offset towards the top of the wall panels (Herbert et al. 2011). In addition the crack patterns in the uniformly loaded specimens were reasonably symmetric about the horizontal cracks.
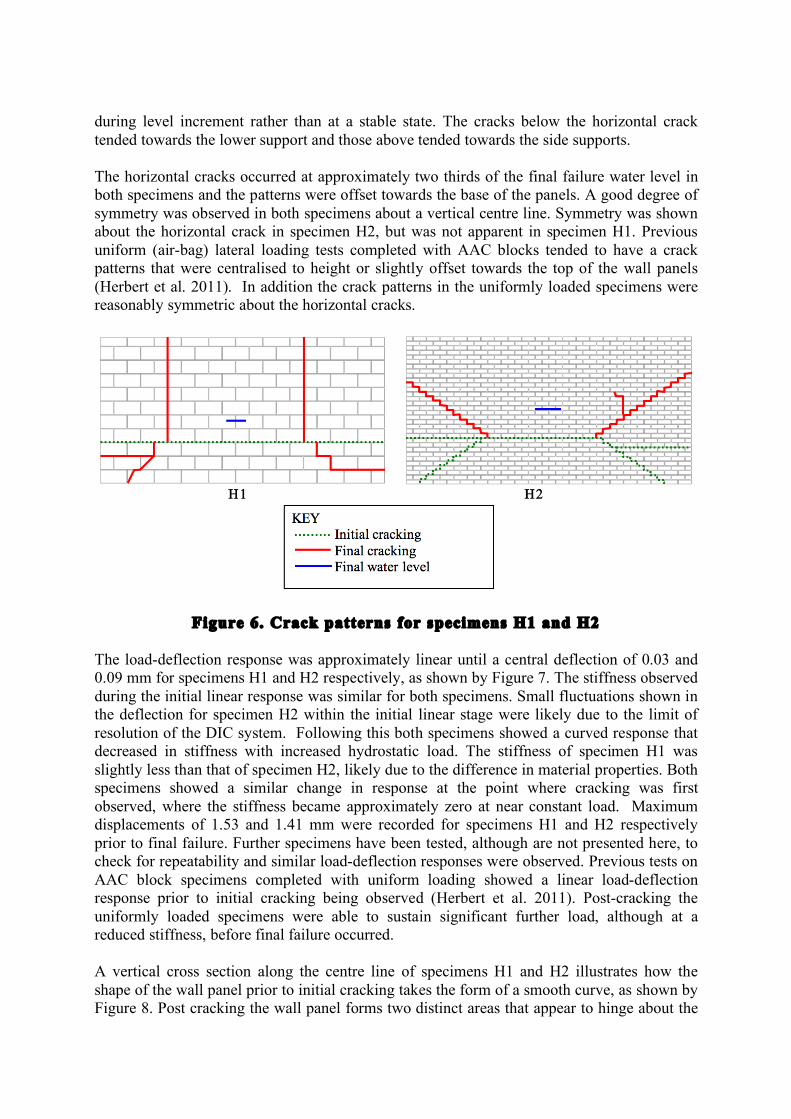
Figure 6. Crack patterns for specimens H1 and H2 The load-deflection response was approximately linear until a central deflection of 0.03 and 0.09 mm for specimens H1 and H2 respectively, as shown by Figure 7. The stiffness observed during the initial linear response was similar for both specimens. Small fluctuations shown in the deflection for specimen H2 within the initial linear stage were likely due to the limit of resolution of the DIC system. Following this both specimens showed a curved response that decreased in stiffness with increased hydrostatic load. The stiffness of specimen H1 was slightly less than that of specimen H2, likely due to the difference in material properties. Both specimens showed a similar change in response at the point where cracking was first observed, where the stiffness became approximately zero at near constant load. Maximum displacements of 1.53 and 1.41 mm were recorded for specimens H1 and H2 respectively prior to final failure. Further specimens have been tested, although are not presented here, to check for repeatability and similar load-deflection responses were observed. Previous tests on AAC block specimens completed with uniform loading showed a linear load-deflection response prior to initial cracking being observed (Herbert et al. 2011). Post-cracking the uniformly loaded specimens were able to sustain significant further load, although at a reduced stiffness, before final failure occurred. A vertical cross section along the centre line of specimens H1 and H2 illustrates how the shape of the wall panel prior to initial cracking takes the form of a smooth curve, as shown by Figure 8. Post cracking the wall panel forms two distinct areas that appear to hinge about the
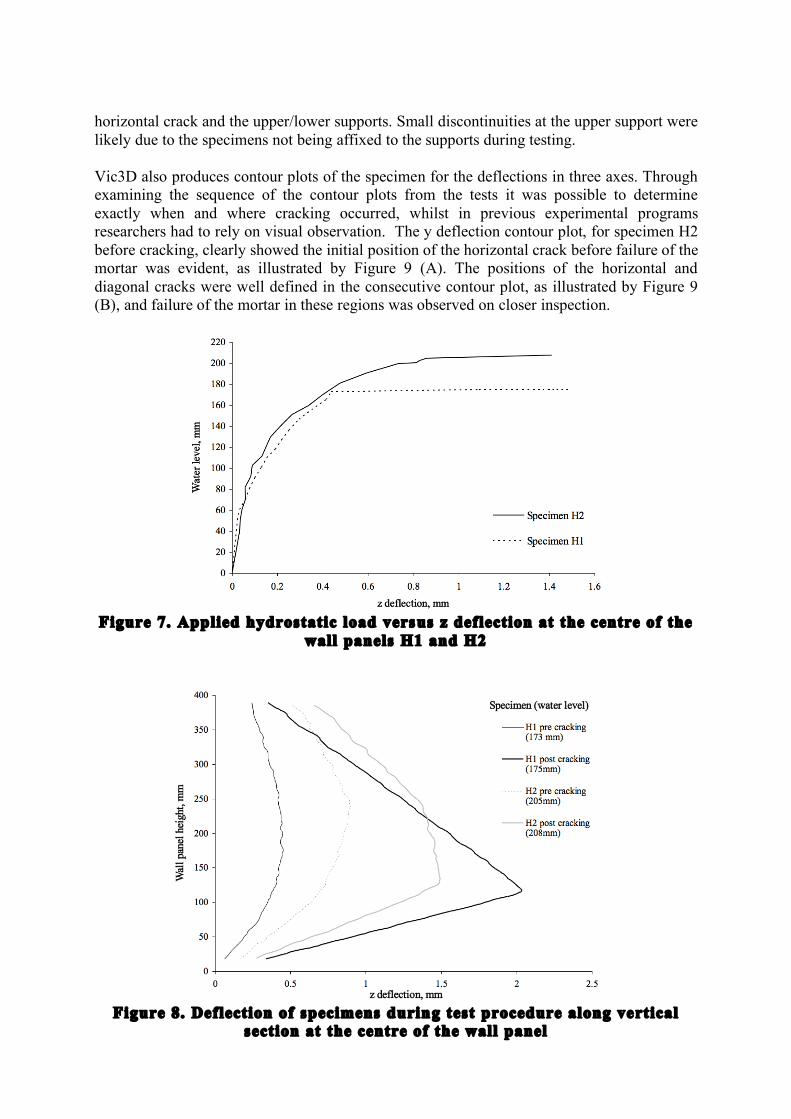
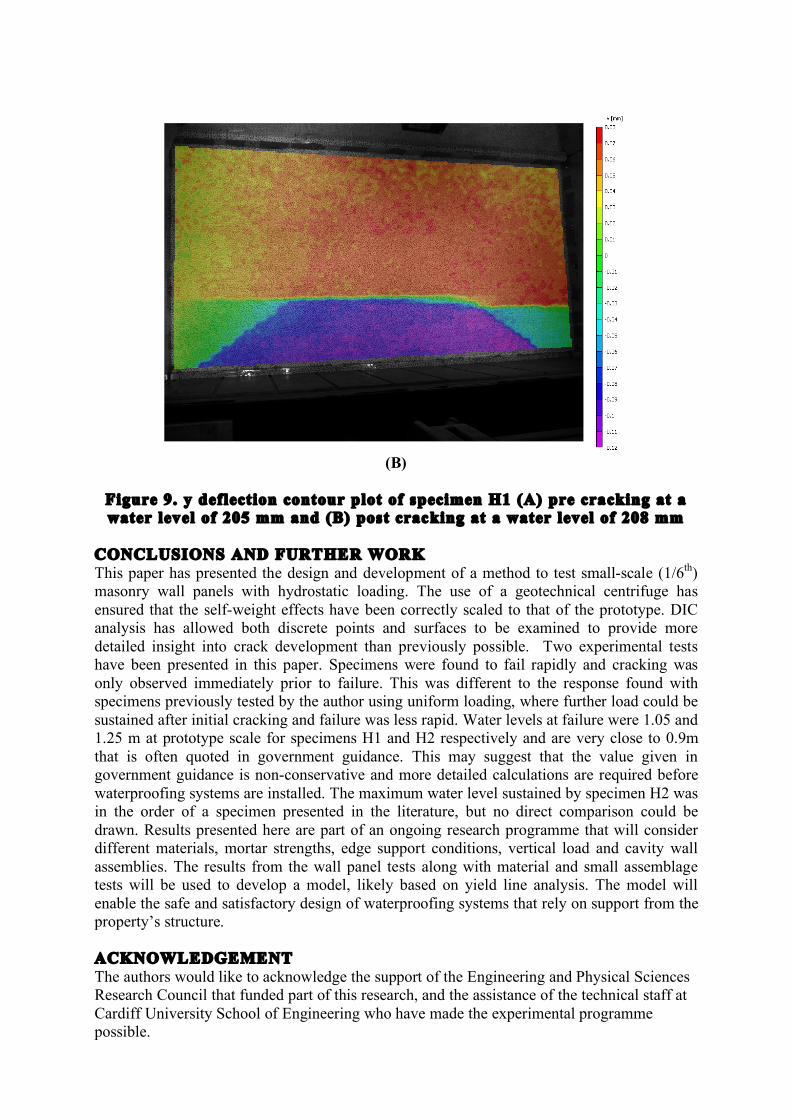
horizontal crack and the upper/lower supports. Small discontinuities at the upper support were likely due to the specimens not being affixed to the supports during testing. Vic3D also produces contour plots of the specimen for the deflections in three axes. Through examining the sequence of the contour plots from the tests it was possible to determine exactly when and where cracking occurred, whilst in previous experimental programs researchers had to rely on visual observation. The y deflection contour plot, for specimen H2 before cracking, clearly showed the initial position of the horizontal crack before failure of the mortar was evident, as illustrated by Figure 9 (A). The positions of the horizontal and diagonal cracks were well defined in the consecutive contour plot, as illustrated by Figure 9 (B), and failure of the mortar in these regions was observed on closer inspection.
Figure 7. Applied hydrostatic load versus z deflection at the centre of the
wall panels H1 and H2
Figure 8. Deflection of specimens during test procedure along vertical
section at the centre of the wall panel
Only one other experimental investigation applying hydrostatic loading to brick and block walls has been identified in the literature, although it was conducted at prototype scale (Pace 1998). Direct comparison to the results presented here was not possible for several reasons: additional support was provided to the rear of the walls through a timber studwork connected to the masonry by wall ties, the walls were longer at 7.93 m (1321 mm at 1/6th scale), and a higher strength mortar was used (average compressive strength 7.58 N/mm2). However, for a brickwork specimen of similar edge support conditions the maximum water level that was sustained before failure was 1.45 m (241 mm at 1/6th scale). The water level sustained was higher than that found in the results for the specimen H2 presented here and would be likely due to the combination of higher strength mortar and additional support provided by the studwork. In their study it was found that the specimen failed rapidly at the maximum load and prior to this the load-deflection response followed a smooth curve. The failure crack pattern was not recorded so no comparison could be drawn to the pattern observed for specimen H2. Further specimens of higher strength mortar are required to make a more direct comparison to the data available in the literature.
(A)
(B)
Figure 9. y deflection contour plot of specimen H1 (A) pre cracking at a water level of 205 mm and (B) post cracking at a water level of 208 mm
CONCLUSIONS AND FURTHER WORK This paper has presented the design and development of a method to test small-scale (1/6th) masonry wall panels with hydrostatic loading. The use of a geotechnical centrifuge has ensured that the self-weight effects have been correctly scaled to that of the prototype. DIC analysis has allowed both discrete points and surfaces to be examined to provide more detailed insight into crack development than previously possible. Two experimental tests have been presented in this paper. Specimens were found to fail rapidly and cracking was only observed immediately prior to failure. This was different to the response found with specimens previously tested by the author using uniform loading, where further load could be sustained after initial cracking and failure was less rapid. Water levels at failure were 1.05 and 1.25 m at prototype scale for specimens H1 and H2 respectively and are very close to 0.9m that is often quoted in government guidance. This may suggest that the value given in government guidance is non-conservative and more detailed calculations are required before waterproofing systems are installed. The maximum water level sustained by specimen H2 was in the order of a specimen presented in the literature, but no direct comparison could be drawn. Results presented here are part of an ongoing research programme that will consider different materials, mortar strengths, edge support conditions, vertical load and cavity wall assemblies. The results from the wall panel tests along with material and small assemblage tests will be used to develop a model, likely based on yield line analysis. The model will enable the safe and satisfactory design of waterproofing systems that rely on support from the property’s structure. ACKNOWLEDGEMENT The authors would like to acknowledge the support of the Engineering and Physical Sciences Research Council that funded part of this research, and the assistance of the technical staff at Cardiff University School of Engineering who have made the experimental programme possible.
REFERENCES BSI (2005) BS EN 1996-1-1:2005 Eurocode 6 - Design of masonry structures. Part 1-1
General rules for reinforced and unreinforced masonry structures, vol BS. BSI, London
Featherston CA, Eaton MJ, Holford KM (2011) Modelling the Effects of Geometric Imperfections on the Buckling and Initial Post-buckling Behaviour of Flat Plates Under Compression Using Measured Data. Strain. doi:10.1111/j.1475-1305.2011.00813.x
FEMA (2009) Homeowner's guide to retrofitting - six ways to protect your home from flooding. FEMA - US Dept. of Homeland Security
Herbert DM, Gardner DR, Harbottle M, Thomas J, Hughes TG (2011) The development of a new method for testing the lateral load capacity of small-scale masonry walls using a centrifuge and digital image correlation. Construction and Building Materials 25 (12):4465-4476
Hughes TG, Davies MCR, Taunton PR, Burroughs PO (2002) Centrifuge testing of small scale masonry. Masonry International 15 (3):80-86
Jenkins GJ, Murphy JM, Sexton DMH, Lowe JA, Jones P, Kilsby CG (2009) UK Climate Projections: Briefing report. Exeter, UK.
Kelman I, Spence R (2003) A limit analysis of unreinforced masonry failing under flood water pressures. Masonry International 16 (2):51-61
Leake J (2007) Labour plans flood defence cuts as Britian flounders in the deluge. The Sunday Times,
ODPM (2003) Preparing for floods: interim guidance for improving the flood resistance of domestic and small business properties. London
Pace CE (1998) Flood proofing tests - Tests of materials and systems for flood proofing structures. USACE, Washington D.C., USA
Wheater HS (2006) Flood hazard and management: a UK perspective. Philosophical transactions of The Royal Society 364 (1845):2135-2145
Wilson G (2007) New homes will be built on flood plains. Daily Telegraph, 23/7/2007,