the structure and dynamics of australia’s ... structure and dynamics of australia’s sheep...
TRANSCRIPT

THE STRUCTURE AND DYNAMICS OF
AUSTRALIA’S SHEEP
POPULATION
Prepared for
Office of the Chief Veterinary Officer June 2006
Prepared by Hassall & Associates Pty Ltd PO Box 1052 DUBBO NSW 2830 Ph: 02 6884 6250 Fax: 02 6884 6249

Structure and Dynamics of the Australian Sheep Industry
TABLE OF CONTENTS
EXECUTIVE SUMMARY................................................................................. 1 1 BACKGROUND......................................................................................... 3
1.1 PURPOSE OF THE STUDY ................................................................... 3 1.2 TERMS OF REFERENCE ..................................................................... 3 1.3 METHODS & DATABASE STRUCTURE ..................................................... 4
2 SHEEP IN AUSTRALIA............................................................................. 5 2.1 TRENDS ...................................................................................... 5 2.2 SHEEP REGIONS ............................................................................ 5 2.3 PRODUCTION SECTORS .................................................................... 8 2.4 DISTRIBUTION OF PRODUCTION SECTORS BY REGION ................................. 9 2.5 SHEEP & FARM NUMBERS BY PRODUCTION SECTOR ...................................11 2.6 IMPACT OF OVINE JOHNE'S DISEASE ...................................................12
3 REGIONAL SHEEP MOVEMENTS ............................................................ 15 3.1 DRIVERS OF MOVEMENT ..................................................................15 3.2 SHEEP – BEEF RELATIONSHIPS ..........................................................17 3.3 REGIONAL PROFILE & TYPICAL PROPERTIES ...........................................18
4 NATIONAL SHEEP MOVEMENTS ............................................................ 53 4.1 INTRODUCTION.............................................................................53 4.2 KEY FACTORS INFLUENCING TURNOFF NUMBERS AND TIMING........................53 4.3 NATIONAL PATTERNS & DRIVERS ........................................................54 4.4 MECHANISMS OF MOVEMENT .............................................................54 4.5 CONCLUSIONS..............................................................................62
5 REFERENCES......................................................................................... 64 APPENDIX 1 – TOP 140 STUD MERINO RAM DATA .................................... 66 APPENDIX 2 – NATIONAL SHEEP SALEYARD DATA ................................... 69 APPENDIX 3 – LIVE SHEEP EXPORT DATA................................................. 71 APPENDIX 4 – ABATTOIR THROUGHPUT DATA.......................................... 72 APPENDIX 5 - GLOSSARY.......................................................................... 74 Disclaimer - All care has been taken in the preparation of this report. Information from various sources has been incorporated in the report. Accordingly, we do not express any opinion on the accuracy of this information, nor does this company accept any responsibility to any other party who may rely on the content of this report.
HASSALL & ASSOCIATES PTY LTD (Inc in NSW). ABN 95 001 211 007 \\server\vol1\data\document\consulting\clients\au1-406_daff_sheep_pop\reports\sheep study final report v4.doc
Hassall & Associates Pty Ltd Page i
Structure and Dynamics of the Australian Sheep Industry
List of Tables
Table 1 Arrangement of data in the National sheep database ................................................ 4 Table 2 Australian sheep regions ............................................................................................ 6 Table 3 Distribution of sheep across sheep regions and production sectors ........................ 10 Table 4 Percentage of sheep properties with cattle by region & production sector ............... 17 Table 5 Region 3 Average Farm............................................................................................ 20 Table 6 Region 3 Typical Farm.............................................................................................. 21 Table 7 Region 6 Average Farm............................................................................................ 23 Table 8 Region 6 Typical Farm.............................................................................................. 24 Table 9 Region 7 Average Farm............................................................................................ 26 Table 10 Region 7 Typical Farm.............................................................................................. 27 Table 11 Region 8 Average Farm............................................................................................ 29 Table 12 Region 8 Typical Farm.............................................................................................. 30 Table 13 Region 9 Average Farm............................................................................................ 32 Table 14 Region 9 Typical Farm.............................................................................................. 33 Table 15 Region 10a Average Farm........................................................................................ 35 Table 16 Region 10a Typical Farm.......................................................................................... 36 Table 17 Region 10b Average Farm........................................................................................ 38 Table 18 Region 10b Typical Farm.......................................................................................... 39 Table 19 Region 11 Average Farm.......................................................................................... 41 Table 20 Region 11 Typical Farm............................................................................................ 42 Table 21 Region 12a Average Farm........................................................................................ 44 Table 22 Region 12a Typical Farm.......................................................................................... 45 Table 23 Region 12b Average Farm........................................................................................ 47 Table 24 Region 12b Typical Farm.......................................................................................... 48 Table 25 Region 124 Average Farm........................................................................................ 50 Table 26 Region 124 Typical Farm.......................................................................................... 51 Table 27 Timing of shows and the regions that participate. .................................................... 60
Hassall & Associates Pty Ltd Page ii


Structure and Dynamics of the Australian Sheep Industry
List of Figures
Figure 1 Sheep Regions ........................................................................................................... 1 Figure 2 Sheep numbers by production sector ......................................................................... 1 Figure 3 Significant patterns of movement ............................................................................... 2 Figure 4 Australian sheep industry trends – 1990 to 2004 ....................................................... 5 Figure 5 Australian sheep regions ............................................................................................ 6 Figure 6 Australian sheep population, proportion by region ..................................................... 7 Figure 7 Distribution of the Australian sheep flock by region.................................................... 7 Figure 8 Australian sheep production sectors, proportion by type............................................ 9 Figure 9 National sheep & farm numbers by production sector.............................................. 11 Figure 10 Destination of cull & surplus sheep from SRM & SRW sectors across Australia...... 12 Figure 11 Map of Australia showing OJD prevalence areas. .................................................... 13 Figure 12 Sheep numbers, beef numbers and crop areas ....................................................... 16 Figure 13 Merino Studs location by number of rams sold......................................................... 55 Figure 14 Distribution of non merino studs by meat breed ....................................................... 56 Figure 15 Distribution of sheep saleyard centers by throughput............................................... 57 Figure 16 Numbers of live sheep exported by port ................................................................... 58 Figure 17 Live Export Ports and seasonality of exports............................................................ 58 Figure 18 Sheep abattoir location & throughput ....................................................................... 59
Hassall & Associates Pty Ltd Page iii

Structure and Dynamics of the Australian Sheep Industry
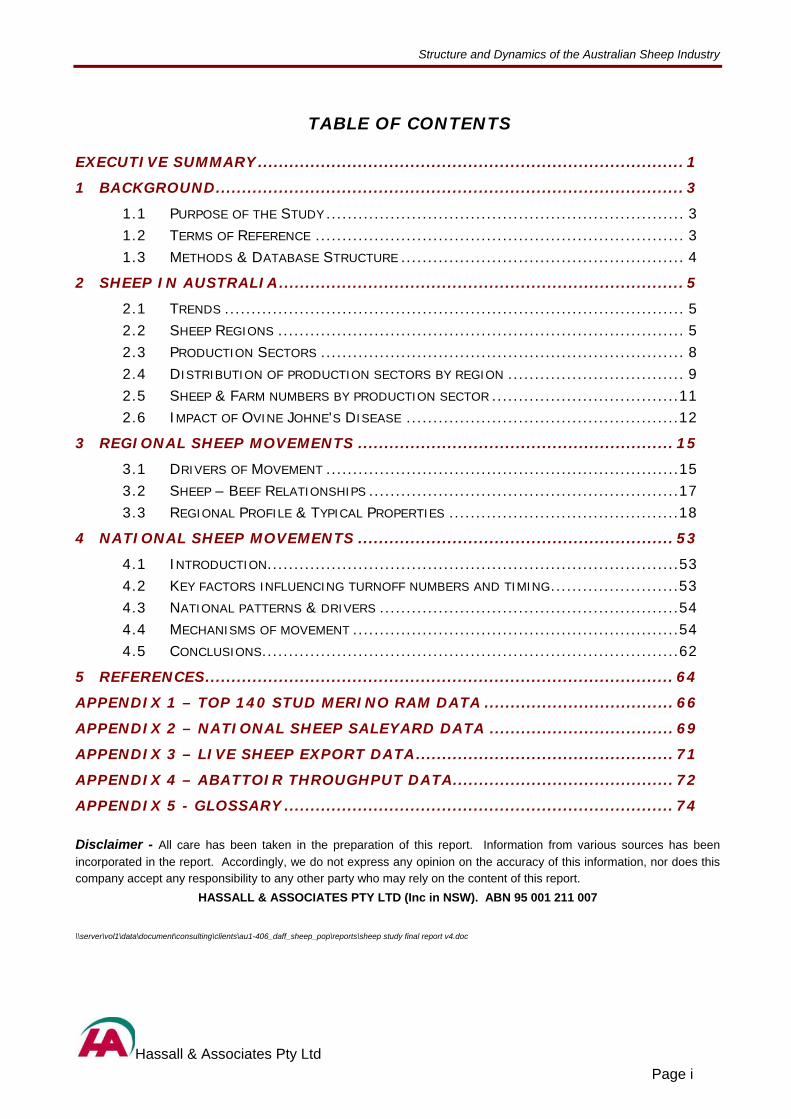
EXECUTIVE SUMMARY Figure 1 Sheep Regions
Expert opinion and available data have been gathered to identify and map movements of sheep within and between regions. The prime use of this data will be by the Office of the Chief Veterinary Officer (OCVO) within the Australian Government Department of Agriculture, Fisheries and Forestry (DAFF) to model potential disease outbreaks.
The national sheep flock is currently estimated at 104 million with two thirds of these sheep located in Regions 9, 10b and 12b as shown in Figure 1. These three regions have a largely Mediterranean climate that is favorable for the production of improved annual pastures and is suitable for cropping. Around 50% of these sheep properties also run cattle.
10a12b
12a
10b
9
11
73
124
65
8
Five sheep “experts” from around the nation used ABARE survey data together with their own knowledge to build a picture of a “typical” sheep farm for each of the 11 sheep regions across Australia. The national sheep flock was dissected into five discrete production sectors: 1) Self replacing wool (SRW)
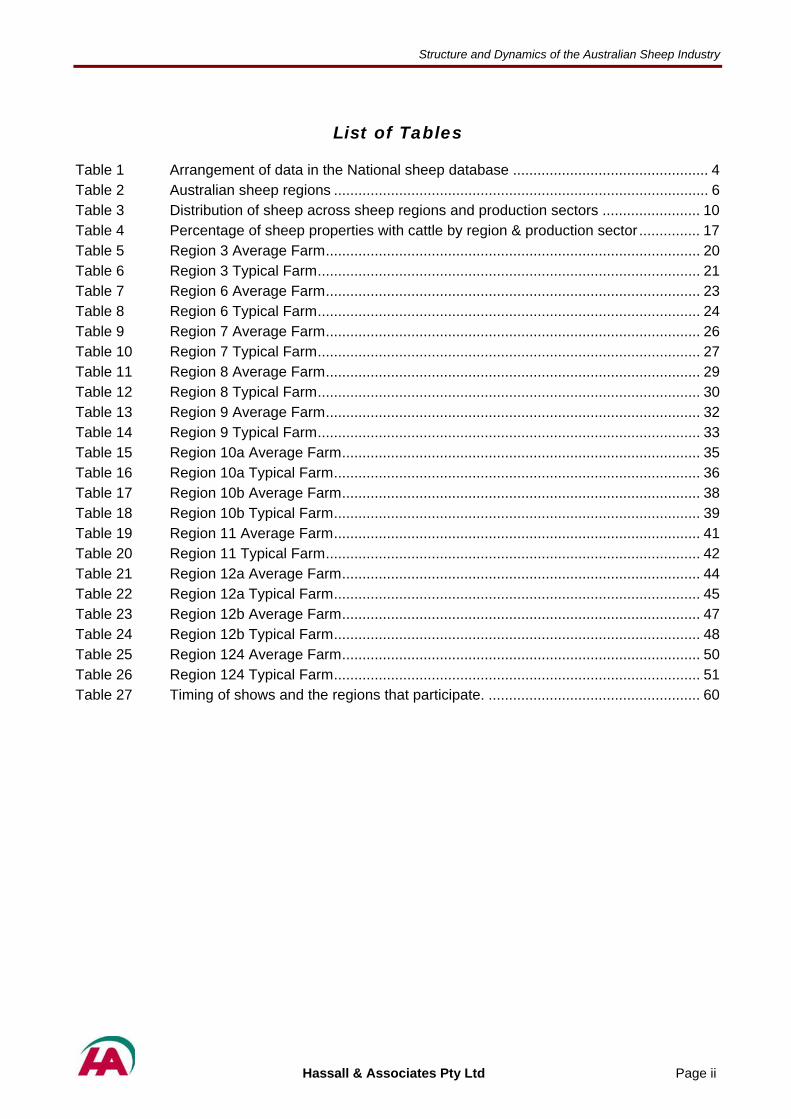
Figure 2 Sheep numbers by production sector 2) Self replacing meat (SRM) 3) Wether based (W) 4) Crossbred, and (XB) 5) Trading & Other (TO) Sheep movements in terms of size and timing are driven primarily by the type of production sector involved. For example, 78% of the national flock is involved in self replacing breeding systems where the only movements onto those properties will be stud rams and the only significant movement off the property will be cull for age (CFA) rams and ewes and surplus young sheep (hoggets or lambs).
SRW54%
SRM25%
W6%
XB3%
TO12%
Sheep movements are mostly restricted to within a 200km radius from where they were born and bred. For stud animals this radius of movement might be extended to 500km.
Hassall & Associates Pty Ltd Page 1
Structure and Dynamics of the Australian Sheep Industry
Droughts, recovery from droughts and large seasonal differentials will significantly increase the distances and number of sheep moved compared to a “normal” season. These factors drive the economics of the sale/purchase so that larger margins cover the increased travel costs. High value sheep, transport efficiencies and favourable commodity prices will also increase the distance sheep move. The geographic distribution of sheep studs, saleyards and live export centers impact on the size and number of consignments. The decline in the number of sheep studs and abattoirs, the increasing popularity of sale mechanisms alternate to saleyards (including internet based auctions), seasonal conditions and favorable prices results in sheep traveling further than they have in the past. The key factor influencing the size of sheep movements is economics and with a small profit margin for most sheep production sectors the distances sheep move will tend to be small. Other factors driving sheep movements include:
Technology Flock structure/breeding systems Disease Seasons Commodity price cycles Droughts and recovery from drought
Mechanisms to facilitate the movement of sheep vary from region to region, however the dominance of the self replacing production sector means that the location and number of stud rams sold will be a major mechanism in sheep movement. Other mechanisms include:
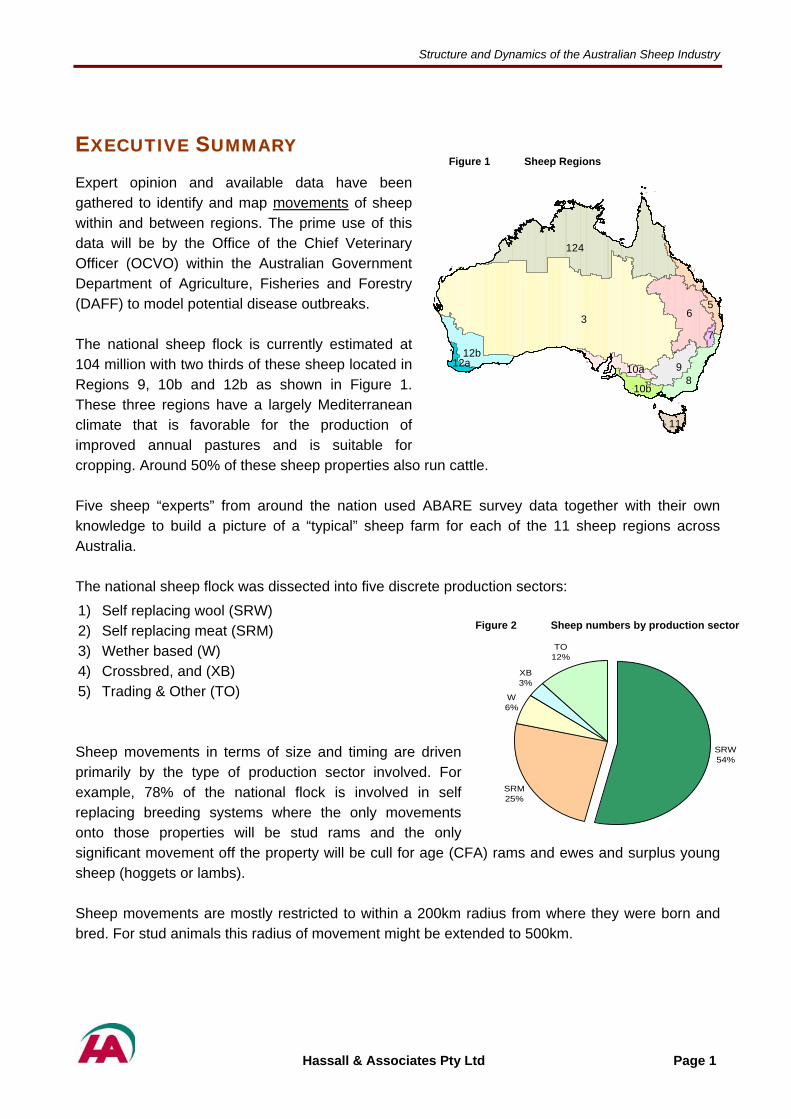
Saleyards Live Export Centres Abattoirs Shows Figure 3 Significant patterns of movement. Feedlots
The significant patterns of sheep movement are shown in Figure 3. The details on the size, timing and drivers of these movements are discussed in sections 3 and 4.
12a
11
10a
3 6
124
98
5
12b
10b
7
Hassall & Associates Pty Ltd Page 2

Structure and Dynamics of the Australian Sheep Industry
1 BACKGROUND
1.1 Purpose of the Study
The focus of this study was to gather expert opinion and data where possible to identify and map geographic regions and production sectors across Australia and to document movements of sheep within and between regions. The study required sheep movements to be reported in terms of the number and size of the consignments, the season of movement, the type of source or destination (saleyard, abattoir, live export etc) and the destination/source regions from/to a “typical farm”. The prime use of this data will be its use by the OCVO within DAFF to model future disease outbreaks.
1.2 Terms of Reference
The main tasks outlined in the terms of reference were to:
1. Identify and describe all relevant sectors/production systems within the Australian sheep meat and wool industries and detail their standard operating practices.
2. Identify within each sector any practices that significantly affect between-flock interactions.
3. Detail the nature of feeding systems/pasture predominant in each production system.
4. Detail the typical size and age structure of flocks in each sector and whether other animals are typically present on the same property.
5. Detail broad movement patterns of sheep within and between each production system identified in Task 1.
6. Detail movements onto and off of ‘typical’ properties within each production system and region identified in Task 1.
7. Identify industry factors that impact on the nature, timing and direction of sheep movements within each production system
8. Identify key factors (meteorological, environmental, sociological, financial etc) that affect when production units make animal purchases and sales.
9. Identify key areas of congregation or clustering of sheep as a result of movements (e.g. Assembly of animals for live export, saleyards and agricultural shows)
Hassall & Associates Pty Ltd Page 3

Structure and Dynamics of the Australian Sheep Industry
1.3 Methods & Database Structure
To facilitate the study of the structure and dynamics of the sheep industry, Australia was mapped into sheep production regions based on aggregated Australian Bureau of Agricultural and Resource Economics (ABARE) survey regions (see Figure 5, p.6). Statistical data regarding the composition of sheep production systems within these regions has also been obtained from ABARE and is included in the central sheep database. Sheep industry experts, state and territory departments of primary industries, Rural Lands Protection Board (RLPB) vets, Meat & Livestock Australia (MLA), National sheep stud associations, saleyard operators, AgForce Queensland as well as individual wool producers, have been consulted in order to identify sheep movements and the current issues faced by the various sheep producing regions. The Microsoft® Office Excel database that was developed to tabulate the sheep movement data was a single page, flat database to facilitate pivot table and crosstab analysis. It has been provided separately to the OVCO. It is 12 columns wide and contains 1,145 individual records arranged as follows in table 1: Table 1 Arrangement of data in the National sheep database
Database Area Description of Data
Rows 1 - 80 ABARE National sheep data 2004/05 with sheep flock structure data, number of properties, numbers of sheep on and off each farm by sheep region and production sector described in section 3.
Rows 81 - 249 Sheep expert data on what an average Self replacing wool farm would look like in terms of structure, movement, sales and purchase of individual classes of sheep by destination/source, feeding systems, agistment issues and proportion of sheep properties that also ran cattle. This data is replicated for eleven sheep production regions identified in this study.
Rows 250 - 418 Sheep expert data as above for the Self replacing meat sector.
Rows 419 - 586 Sheep expert data as above for the Wether based sector.
Rows 587 - 761 Sheep expert data as above for the Crossbred sector.
Rows 762 - 936 Sheep expert data as above for a Trading & Other sector.
Rows 937 - 1145 Data checking and summary area. This was constructed to test the integrity and consistency of the data supplied by the sheep experts and to provide crosstab summary tables for the report.
Hassall & Associates Pty Ltd Page 4

Structure and Dynamics of the Australian Sheep Industry
2 SHEEP IN AUSTRALIA
2.1 Trends
Over the past 15 years, the Australian wool industry has been characterised by low wool returns, declining sheep numbers, falling wool production and rising lamb returns (Figure 4). This has been driven by a long-term decrease in raw wool demand and competition from alternative fibres. As a result, the industry has experienced significant structural adjustment, including a shift from wool and mutton production towards lamb production. Growing demand for Australian lamb exports from the US, Europe and Asia has seen the proportion of lamb production exported more than double since the early 1990’s. This has contributed to increased specialisation, efficiency and profitability within the sheep industry. Figure 4 Australian sheep industry trends – 1990 to 2004
40
50
60
70
80
90
100
110
120
130
1990 1992 1994 1996 1998 2000 2002 2004
Lamb Production
Mutton Production
Sheep Numbers
Wool Production
Note: Wool production and sheep number indices are based on financial year data, with base year 1989/90 and Lamb and Mutton Production Indices are based on calendar year data with base year 1990 = 100%. Source: ABARE 2005a.
2.2 Sheep Regions
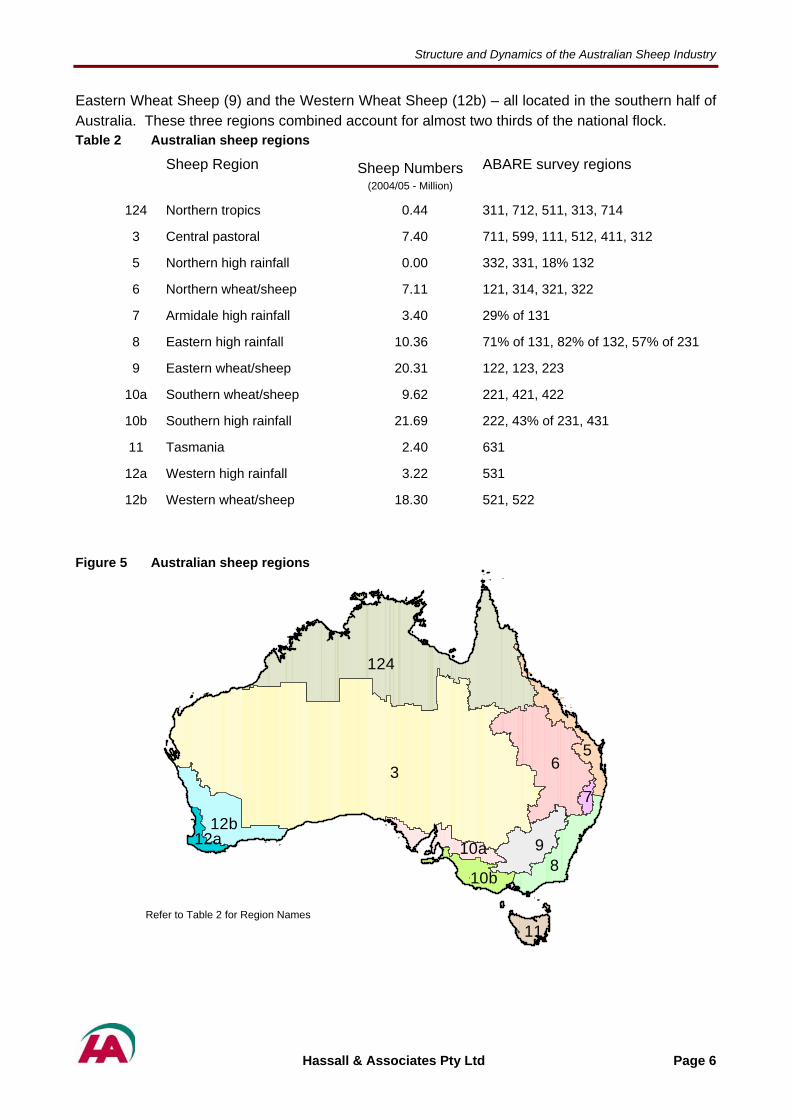
Eleven sheep production regions, based on the ABARE survey regions were identified across Australia. In order to keep some commonality the regions were defined and named in the same way as in a similar study of the beef industry (Ausvet 2006). In some regions there were good sheep husbandry reasons to split the existing regions, (i.e. 10a, 10b, 12a & 12b). In the case of northern Australia, Regions 1, 2 and 4 were aggregated as there are very few sheep in this region (0.5%). Region 5 was not included in this study as ABARE reports no commercial sheep numbers in this region. Regions, sheep numbers and their distribution are presented in Table 2, Figure 5 and Figure 7. Based on data collected by ABARE in 2004/05, the Australian sheep population is estimated at 104.29 million. The largest three regions by population are the Southern High Rainfall (10b),
Hassall & Associates Pty Ltd Page 5
Structure and Dynamics of the Australian Sheep Industry
Eastern Wheat Sheep (9) and the Western Wheat Sheep (12b) – all located in the southern half of Australia. These three regions combined account for almost two thirds of the national flock. Table 2 Australian sheep regions
Sheep Region Sheep Numbers (2004/05 - Million)
ABARE survey regions
124 Northern tropics 0.44 311, 712, 511, 313, 714
3 Central pastoral 7.40 711, 599, 111, 512, 411, 312
5 Northern high rainfall 0.00 332, 331, 18% 132
6 Northern wheat/sheep 7.11 121, 314, 321, 322
7 Armidale high rainfall 3.40 29% of 131
8 Eastern high rainfall 10.36 71% of 131, 82% of 132, 57% of 231
9 Eastern wheat/sheep 20.31 122, 123, 223
10a Southern wheat/sheep 9.62 221, 421, 422
10b Southern high rainfall 21.69 222, 43% of 231, 431
11 Tasmania 2.40 631
12a Western high rainfall 3.22 531
12b Western wheat/sheep 18.30 521, 522
Figure 5 Australian sheep regions
10a12b
12a
10b
9
11
73
124
65
8
Refer to Table 2 for Region Names
Hassall & Associates Pty Ltd Page 6
Structure and Dynamics of the Australian Sheep Industry
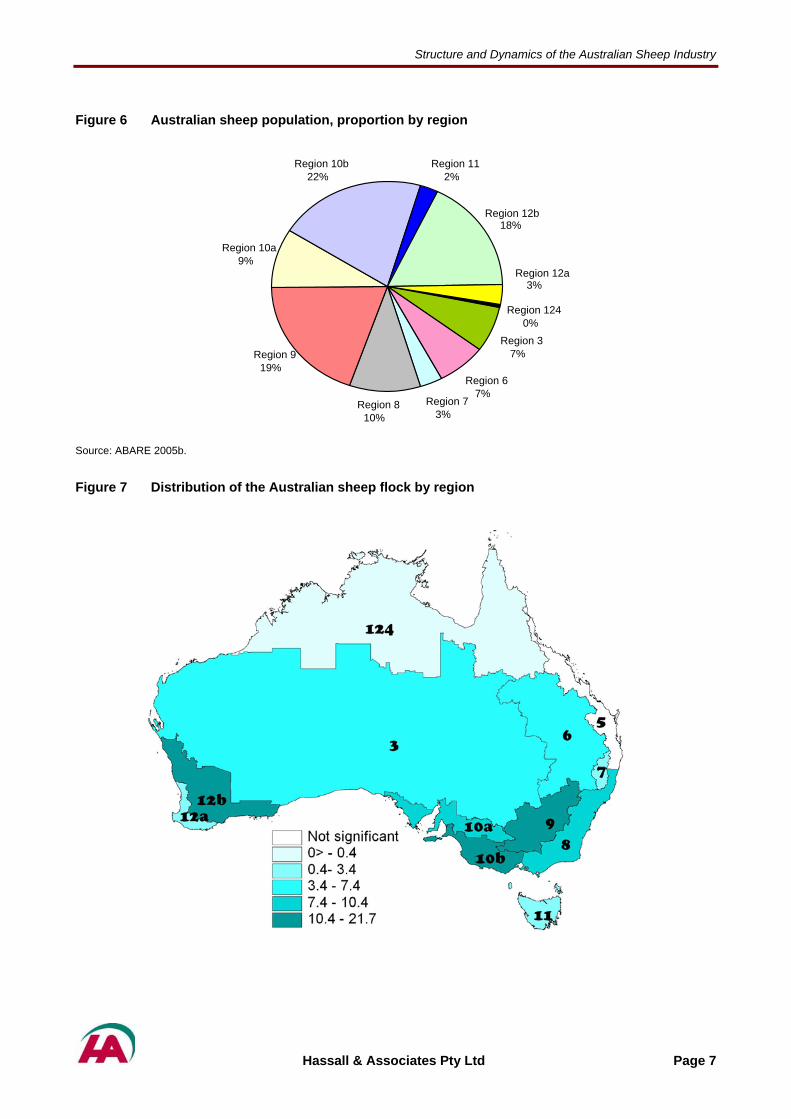
Figure 6 Australian sheep population, proportion by region
Region 10b Region 1122% 2%
18%Region 12b
Region 10a 9%
Region 12a 3%
Region 124 0%
Region 3Region 9 7%
19% Region 6
7%Region 7Region 8
3%10%
Source: ABARE 2005b.
Figure 7 Distribution of the Australian sheep flock by region
Hassall & Associates Pty Ltd Page 7
Structure and Dynamics of the Australian Sheep Industry
2.3 Production Sectors
The Australian sheep industry is characterised by a diverse range of production sectors. The following definitions were used by ABARE to stratify the national sheep flock into five production sectors.
A. Self replacing wool (SRW) – exists where sheep purchases represent less than 10% of the average number of sheep in a flock. This sector breeds its own ewe replacements with sheep sales comprising surplus young wethers and culls for age (CFA) sheep. Replacement rams are the only sheep purchase. In more recent times sheep producers in this sector are increasingly marketing surplus sheep into the more profitable lamb market.
B. Self replacing meat (SRM) – exists where sheep and lamb receipts are greater than 50% of total receipts. Very similar in structure to the self replacing wool sector with a reduced focus on wool quality and an emphasis on carcass attributes. This sector includes the traditional meat sheep breeds such as the White Suffolk, Dorset and traditional wool flocks finishing surplus sheep as lambs rather than hoggets. In some cases terminal meat sires might be used over the oldest ewe age group. It also includes the more recent imports of breeds like the Dorper and Damara that don’t produce any harvestable wool.
C. Wethers (W) – exists where wethers represent more than 50% of opening and closing sheep numbers. Replacement wethers are purchased with CFA wethers sold.
D. Cross Bred (XB) – exists where cross bred ewes represent more than 30% of ewes mated. In this sector the replacement ewes are purchased with all young sheep sold as lambs. The most common crossbred ewe is the first cross ewe which is usually the offspring of a Border Leicester ram and a merino ewe. These are usually mated to a meat ram like the Dorset.
E. Traders and other (TO) – the sheep not belonging to any of the above sectors, includes sheep feedlots.
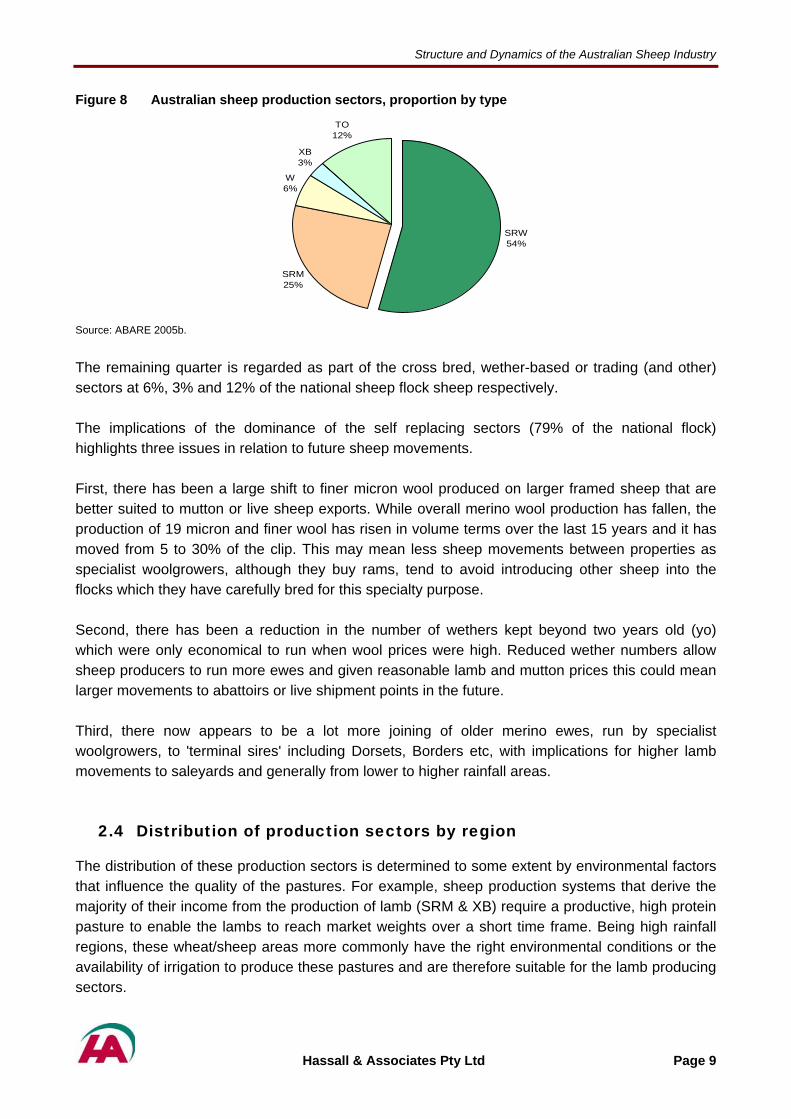
In reality few, if any, of the sheep production regions will solely exhibit characteristics of these “Typical” sectors. This is because an individual sheep producer may run two or even three different flocks of sheep from the different sectors listed above. As an aid to understanding the structure and dynamics of the national sheep flock these definitions were used to represent the “typical” properties found in each region. By far the largest sheep production sector in Australia is the self replacing wool enterprise. Just over half of the national flock is in this sector (54%). A further quarter of the flock resides in the self replacing meat sector.
Hassall & Associates Pty Ltd Page 8
Structure and Dynamics of the Australian Sheep Industry
Figure 8 Australian sheep production sectors, proportion by type
SRW54%
SRM25%
W6%
XB3%
TO12%
Source: ABARE 2005b.
The remaining quarter is regarded as part of the cross bred, wether-based or trading (and other) sectors at 6%, 3% and 12% of the national sheep flock sheep respectively. The implications of the dominance of the self replacing sectors (79% of the national flock) highlights three issues in relation to future sheep movements. First, there has been a large shift to finer micron wool produced on larger framed sheep that are better suited to mutton or live sheep exports. While overall merino wool production has fallen, the production of 19 micron and finer wool has risen in volume terms over the last 15 years and it has moved from 5 to 30% of the clip. This may mean less sheep movements between properties as specialist woolgrowers, although they buy rams, tend to avoid introducing other sheep into the flocks which they have carefully bred for this specialty purpose. Second, there has been a reduction in the number of wethers kept beyond two years old (yo) which were only economical to run when wool prices were high. Reduced wether numbers allow sheep producers to run more ewes and given reasonable lamb and mutton prices this could mean larger movements to abattoirs or live shipment points in the future. Third, there now appears to be a lot more joining of older merino ewes, run by specialist woolgrowers, to 'terminal sires' including Dorsets, Borders etc, with implications for higher lamb movements to saleyards and generally from lower to higher rainfall areas.
2.4 Distribution of production sectors by region
The distribution of these production sectors is determined to some extent by environmental factors that influence the quality of the pastures. For example, sheep production systems that derive the majority of their income from the production of lamb (SRM & XB) require a productive, high protein pasture to enable the lambs to reach market weights over a short time frame. Being high rainfall regions, these wheat/sheep areas more commonly have the right environmental conditions or the availability of irrigation to produce these pastures and are therefore suitable for the lamb producing sectors.
Hassall & Associates Pty Ltd Page 9

Structure and Dynamics of the Australian Sheep Industry
Eighty-four per cent of the national flock is located in areas that receive more than 350mm of rainfall per annum (pa). Conversely, the pastoral region of Australia (Region 3) has a very harsh climate with very low (<350mm) and unreliable rainfall. These environments are not always suitable for the production of the high quality pastures required to turn off quality prime lambs. Meat & Livestock Australia (MLA) are encouraging producers in these areas to concentrate on breeding lambs and turning them off at 12-14 weeks for another farm to finish them or to send to a feedlot. This breeding/finishing system may see greater numbers of lambs move from region 3 to the wheat/sheep Regions of 9 and 10b for finishing on improved or irrigated pastures. Whilst some of these movements may involve saleyards, others may be more difficult to monitor as they may involve shifting sheep to another farm owned by the same producer/group or direct farm to farm sales. However, location of a particular production sector usually has more to do with sheep producers varying the enterprise mix to take advantage of market opportunities or to reduce their exposure to a particular commodity (i.e. lamb, wool, hogget etc). This is certainly the case in WA where the right environmental conditions exist to produce high quality pastures but there are no XB flocks documented by ABARE in either region 12a or 12b. This is because sheep producers have decided to run SRM flocks which provide the opportunity to market both wool and lamb to suit market demand. The distribution of sheep across regions and production sectors is shown in Table 3. Table 3 Distribution of sheep across sheep regions and production sectors
Sheep Region Production Sector & Numbers of sheep (‘000)
No Name Total SRW SRM W XB TO
124 Northern tropics 436 436 0 0 0 0
3 Central pastoral 7,406 4,804 1,589 0 208 804
5 Northern high rainfall 0 0 0 0 0 0
6 Northern wheat/sheep 7,115 4,877 503 0 1,440 296
7 Armidale high rainfall 3,404 2,531 0 0 0 872
8 Eastern high rainfall 10,357 5,519 2,173 973 763 929
9 Eastern wheat/sheep 20,309 9,640 5,252 996 718 3,704
10a Southern wheat/sheep 9,623 4,344 3,515 0 166 1,598
10b Southern high rainfall 21,694 9,491 5,832 4,097 0 2,273
11 Tasmania 2,402 1,929 313 51 0 110
12a Western high rainfall 3,224 1,861 1,103 0 0 259
12b Western wheat/sheep 18,320 10,861 5,538 0 0 1,922
Totals 104,290 56,293 25,818 6,118 3,295 12,766
SRW = self replacing wool, SRM = self replacing meat, W = wethers, XB = crossbred, TO = trading & other.
Hassall & Associates Pty Ltd Page 10
Structure and Dynamics of the Australian Sheep Industry
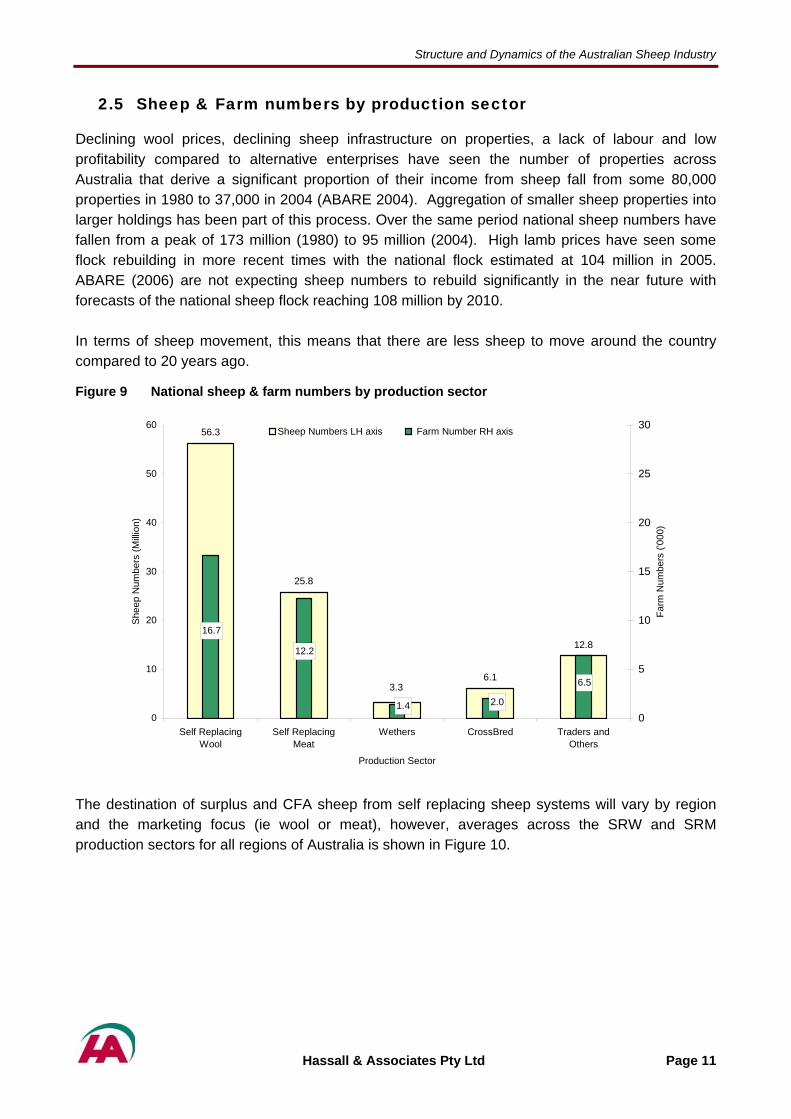
2.5 Sheep & Farm numbers by production sector
Declining wool prices, declining sheep infrastructure on properties, a lack of labour and low profitability compared to alternative enterprises have seen the number of properties across Australia that derive a significant proportion of their income from sheep fall from some 80,000 properties in 1980 to 37,000 in 2004 (ABARE 2004). Aggregation of smaller sheep properties into larger holdings has been part of this process. Over the same period national sheep numbers have fallen from a peak of 173 million (1980) to 95 million (2004). High lamb prices have seen some flock rebuilding in more recent times with the national flock estimated at 104 million in 2005. ABARE (2006) are not expecting sheep numbers to rebuild significantly in the near future with forecasts of the national sheep flock reaching 108 million by 2010. In terms of sheep movement, this means that there are less sheep to move around the country compared to 20 years ago.
Figure 9 National sheep & farm numbers by production sector
25.8
6.1
12.8
56.3
3.32.01.4
12.2
16.7
6.5
0
10
20
30
40
50
60
Self ReplacingWool
Self ReplacingMeat
Wethers CrossBred Traders andOthers
Production Sector
Shee
p N
umbe
rs (M
illion
)
0
5
10
15
20
25
30
Farm
Num
bers
('00
0)
Sheep Numbers LH axis Farm Number RH axis
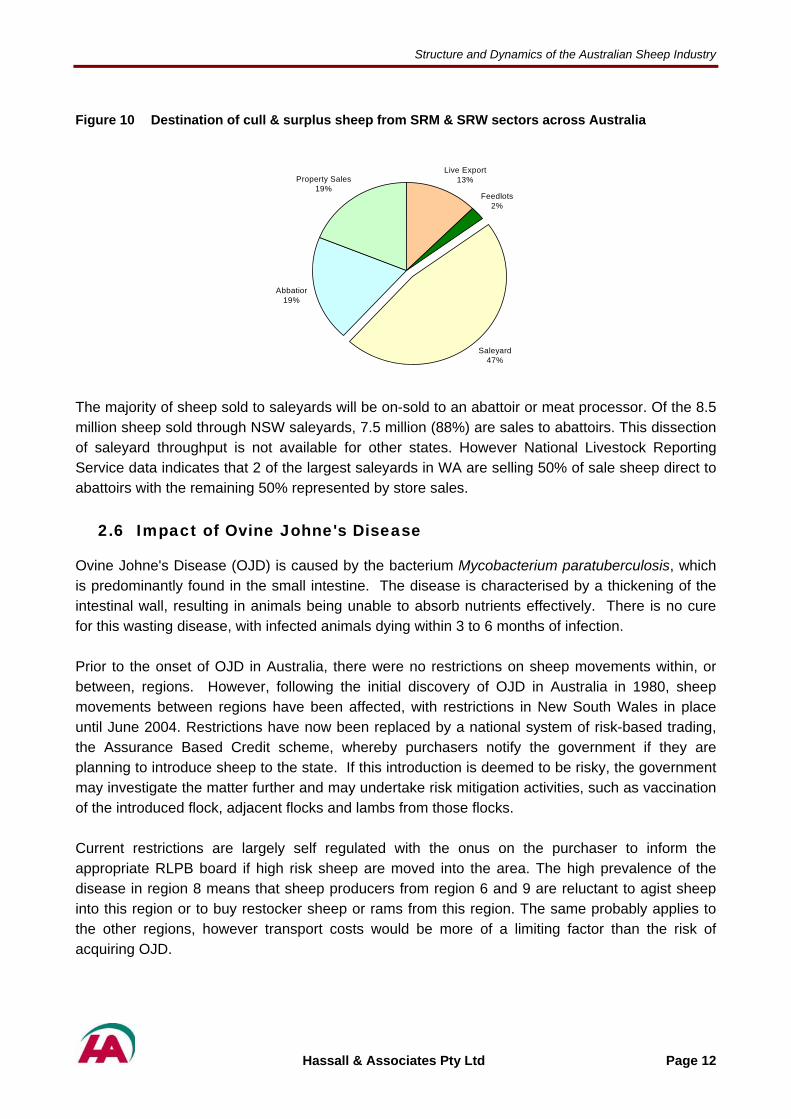
The destination of surplus and CFA sheep from self replacing sheep systems will vary by region and the marketing focus (ie wool or meat), however, averages across the SRW and SRM production sectors for all regions of Australia is shown in Figure 10.
Hassall & Associates Pty Ltd Page 11
Structure and Dynamics of the Australian Sheep Industry
Figure 10 Destination of cull & surplus sheep from SRM & SRW sectors across Australia
Live Export
13%
Feedlots2%
Saleyard47%
Property Sales19%
Abbatior19%
The majority of sheep sold to saleyards will be on-sold to an abattoir or meat processor. Of the 8.5 million sheep sold through NSW saleyards, 7.5 million (88%) are sales to abattoirs. This dissection of saleyard throughput is not available for other states. However National Livestock Reporting Service data indicates that 2 of the largest saleyards in WA are selling 50% of sale sheep direct to abattoirs with the remaining 50% represented by store sales.
2.6 Impact of Ovine Johne's Disease
Ovine Johne's Disease (OJD) is caused by the bacterium Mycobacterium paratuberculosis, which is predominantly found in the small intestine. The disease is characterised by a thickening of the intestinal wall, resulting in animals being unable to absorb nutrients effectively. There is no cure for this wasting disease, with infected animals dying within 3 to 6 months of infection. Prior to the onset of OJD in Australia, there were no restrictions on sheep movements within, or between, regions. However, following the initial discovery of OJD in Australia in 1980, sheep movements between regions have been affected, with restrictions in New South Wales in place until June 2004. Restrictions have now been replaced by a national system of risk-based trading, the Assurance Based Credit scheme, whereby purchasers notify the government if they are planning to introduce sheep to the state. If this introduction is deemed to be risky, the government may investigate the matter further and may undertake risk mitigation activities, such as vaccination of the introduced flock, adjacent flocks and lambs from those flocks. Current restrictions are largely self regulated with the onus on the purchaser to inform the appropriate RLPB board if high risk sheep are moved into the area. The high prevalence of the disease in region 8 means that sheep producers from region 6 and 9 are reluctant to agist sheep into this region or to buy restocker sheep or rams from this region. The same probably applies to the other regions, however transport costs would be more of a limiting factor than the risk of acquiring OJD.
Hassall & Associates Pty Ltd Page 12

Structure and Dynamics of the Australian Sheep Industry
Figure 11 Map of Australia showing OJD prevalence areas.
Legend
High Prevalence
Medium Prevalence
Low Prevalence
Very Low Prevalence
Source: NSW Department of Primary Industries website.
Dubbo RLPB Vet, Clive Roberts has a rule of thumb in relation to OJD and Footrot, “If you draw a line east/west and north/south through Dubbo, then the risk of acquiring OJD or footrot is an issue if you agist into or purchase stud or restocker sheep from the south east sector”. Sheep studs in OJD areas are probably most affected in terms of sheep movement, as it very important for them to sell their rams to remain viable. A vaccination program currently underway is reducing some of the impact OJD has had on sheep moving into and out of districts with a high OJD prevalence in region 8.
Hassall & Associates Pty Ltd Page 13

Structure and Dynamics of the Australian Sheep Industry
Hassall & Associates Pty Ltd Page 14

Structure and Dynamics of the Australian Sheep Industry
3 REGIONAL SHEEP MOVEMENTS
3.1 Drivers of Movement
There are drivers of sheep movement that are common to all sheep regions particularly when considering movements between regions.
1) Economics – low margin per animal – New South Wales (NSW) Department of Primary Industries (DPI) (2006) are currently showing a gross margin return (i.e. cash receipts less cash costs) of around $20 per dry sheep equivalent (DSE) for SRW production sectors. This means sheep producers often cannot afford to transport sheep very far for sale, to put sheep on agistment during droughts or to drought feed them for extended periods. Economics tends to limit the number of consignments and distances sheep move. High value sheep such as stud animals and prime lambs will move greater distances than the average sheep.
2) Technology – B-double transport vehicles are more efficient because they can legally carry 50% more sheep per single prime mover compared to a standard semi trailer. These vehicles have reduced stock transport costs by some 15% and so may assist in increasing sheep movements.
3) Flock structure/breeding systems – self replacing systems by their very nature have fewer movements compared to a crossbred or trading system. Aside from ram movements, self replacing systems breed their own ewe replacements and only sell cull or surplus young stock. Crossbred systems need to buy in replacement ewes as they sell all of the ewe and wether portions as lambs. Trading systems by definition buy and sell a variety of sheep classes throughout the year.
4) Disease – the risk of acquiring OJD (see section 2.6) or Footrot from sheep agisted into Region 8, or from stud/store sheep purchased from Region 8 still dampens sheep movements into adjoining Regions (R9 & R6). Disease is more likely to be a limiting factor on a local/regional scale as opposed to a national scale.
5) Seasons – agistment – in droughts some sheep are agisted (i.e. moved to another farm that has available pasture). However low profitability and risk of contracting a disease significantly limit the proportion of properties that agist sheep, especially when compared to the cattle industry. Across all regions 75% of sheep properties in the self replacing production sectors would never agist sheep and in the lower rainfall areas this proportion increases towards 100%. Seasons, and more importantly a big differential in seasonal conditions, is likely to increase the number of consignments and the distance sheep move.
Hassall & Associates Pty Ltd Page 15
Structure and Dynamics of the Australian Sheep Industry
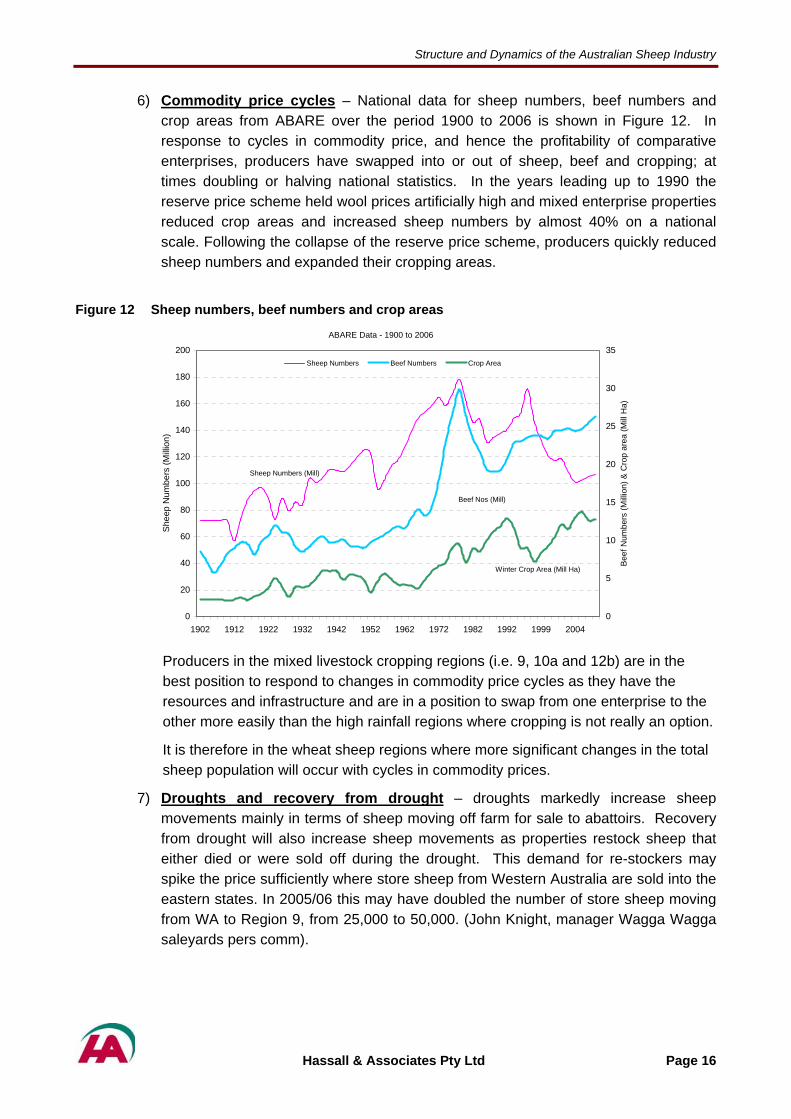
6) Commodity price cycles – National data for sheep numbers, beef numbers and crop areas from ABARE over the period 1900 to 2006 is shown in Figure 12. In response to cycles in commodity price, and hence the profitability of comparative enterprises, producers have swapped into or out of sheep, beef and cropping; at times doubling or halving national statistics. In the years leading up to 1990 the reserve price scheme held wool prices artificially high and mixed enterprise properties reduced crop areas and increased sheep numbers by almost 40% on a national scale. Following the collapse of the reserve price scheme, producers quickly reduced sheep numbers and expanded their cropping areas.
Figure 12 Sheep numbers, beef numbers and crop areas
0
20
40
60
80
100
120
140
160
180
200
1902 1912 1922 1932 1942 1952 1962 1972 1982 1992 1999 2004
She
ep N
umbe
rs (M
illio
n)
0
5
10
15
20
25
30
35
Beef
Num
bers
(Mill
ion)
& C
rop
area
(Mill
Ha)
Sheep Numbers Beef Numbers Crop Area
ABARE Data - 1900 to 2006
Winter Crop Area (Mill Ha)
Beef Nos (Mill)
Sheep Numbers (Mill)
Producers in the mixed livestock cropping regions (i.e. 9, 10a and 12b) are in the best position to respond to changes in commodity price cycles as they have the resources and infrastructure and are in a position to swap from one enterprise to the other more easily than the high rainfall regions where cropping is not really an option.
It is therefore in the wheat sheep regions where more significant changes in the total sheep population will occur with cycles in commodity prices.
7) Droughts and recovery from drought – droughts markedly increase sheep movements mainly in terms of sheep moving off farm for sale to abattoirs. Recovery from drought will also increase sheep movements as properties restock sheep that either died or were sold off during the drought. This demand for re-stockers may spike the price sufficiently where store sheep from Western Australia are sold into the eastern states. In 2005/06 this may have doubled the number of store sheep moving from WA to Region 9, from 25,000 to 50,000. (John Knight, manager Wagga Wagga saleyards pers comm).
Hassall & Associates Pty Ltd Page 16

Structure and Dynamics of the Australian Sheep Industry
3.2 Sheep – Beef Relationships
Cattle require much taller pastures to graze efficiently than do sheep. Whilst it is true they are complimentary in their grazing habits in mixed farming systems, if feed becomes short, producers will tend to either sell or agist cattle before sheep. This is largely driven by economics due to the high cost involved with drought feeding cattle. People are probably more willing to accept cattle in preference to sheep on agistment as the numbers involved are much smaller, they tend not to be as hard on the pastures and fences don’t have to be of as high a standard. The proportion of sheep properties that also have beef cattle has been summarized from ABARE data and presented in Table 4. The following trends are evident:
In the high rainfall areas the proportion of properties with cattle increases. Wool producing sectors (SRW & W) have higher proportions of properties with cattle compared to the meat producing sectors (SRM, XB).
In Western Australia, the proportion of sheep properties with cattle is almost half that of the eastern states’ wheat/sheep and high rainfall regions.
Table 4 Percentage of sheep properties with cattle by region & production sector
Production Sector - % properties with cattle No. Region Description SRW SRM W XB TO
124 Northern tropics 100 100
3 Central pastoral 35 25 100 60
6 Northern wheat/sheep 90 91 100 68
7 Armidale high rainfall 96 100
8 Eastern high rainfall 79 70 21 49 77
9 Eastern wheat/sheep 60 45 25 25 22
10a Southern wheat/sheep 20 20 30 20
10b Southern high rainfall 60 50 70 50
11 Tasmania 70 57 74 94
12a Western high rainfall 40 20 24
12b Western wheat/sheep 20 30 73 57
Source: ABARE Data 2004/05.
Hassall & Associates Pty Ltd Page 17
Structure and Dynamics of the Australian Sheep Industry
3.3 Regional Profile & Typical Properties
Five sheep ‘experts’ were asked to apply their industry expertise to the analysis of sheep industry data (ABARE and others) to define typical sheep movements for each sheep production sector and region in Australia. Each of these experts had over 30 years experience in the sheep industry and all currently own/manage a sheep flock or have family involvements in sheep. Some also have sheep stud and sheep processing backgrounds. The experts were;
1. Bob Hall JRL Hall & Co Western Australia 2. Graham Peart GRASS Merino Stud New South Wales 3. Jack Langberg PIRSA South Australia 4. Bob Richardson Ex AWC Victoria 5. Ian McConnell QDPI & F Queensland
It should be noted that the definitions used to dissect the ABARE data were quite broad and there are in reality many variations on the five production sectors used in this study. The final data tables were therefore somewhat “muddied” in trying to dissect the national flock into five discrete categories. It is for this very reason that expert industry knowledge was used to analyse these tables to derive “average” and “typical” sheep movements. "Average farm movements" - The ABARE data was used as a basis for the experts to define the flock structure of an average farm and the numbers of ewes joined. In some cases this base data was modified in light of local knowledge in order to more closely reflect longer term movements. Numbers of sheep sold and purchased were broken down into various sheep classes, assigned to a season and allocated on a percentage basis to live export, feedlot, saleyard, abattoir or on property destinations to/from particular regions. The percentages used aimed to profile the proportion of sheep sold to different destinations across the region. In this way the regional profile of sheep movements can be estimated by multiplying “average farm” data by the number of properties. Due to the regional focus in this table it was not possible to calculate the number of actual consignments to a particular destination. For example, some SRW properties send sheep to abattoirs, some to export, some to feedlots etc. and they have usually developed a marketing strategy to maximize returns from a particular destination. Droughts, commodity price cycles and disease will all impact on destinations and sources available to individual sheep breeders. The majority of individual properties would not send sheep to all of the potential turnoff destinations (i.e. live export, abattoir, saleyard etc). “Typical farm movements" - These tables represent a summary of expert opinion that shows the number of animals, number of consignments, season of movement and destination/source region for movements on/off “typical” properties within each production sector. Whilst it is recognised that such tightly defined properties may not exist in reality, this table represents the most likely behaviour of a farm located within each region. The range in flock sizes within a production sector and a region was calculated from the ABARE data set with average, maximum and minimum flock sizes at the 90% confidence interval.
Hassall & Associates Pty Ltd Page 18

Structure and Dynamics of the Australian Sheep Industry
Region 3 - Central Pastoral Geography The Central Pastoral region is the largest sheep producing region by geographic area (439M ha), covering the majority of Western Australia, South Australia, the far west of New South Wales, south-western Queensland and the southern half of the Northern Territory. The region is largely dominated by arid zone soils with deep sand dunes. These soils tend to be red in colour due to their poor leaching ability. There are three deserts in the region, and thus significant areas have limited grazing opportunities.
7.4 M Sheep on 1,575 properties
Climate Rainfall in the Central Pastoral area is generally below 350mm pa and highly variable. As plant growth is largely determined by available moisture, biomass production can vary by a factor of 10 from year to year. Plant establishment occurs intermittently, perhaps once every five years or more. Drought is a natural part of this cycle. Pastures Most livestock production in the Central Pastoral Region will continue to come from native grasses and shrubs such as saltbush, although some pasture introduction is possible in favoured areas. Pasture composition is largely determined by climate but is also altered by grazing pressure and fire. Pasture grasses are either perennial or ephemeral. Perennial grasses produce seed many times and are important in providing stable pastoral production, a quick response to small rainfall events and maintaining ground cover. Ephemeral species grow quickly after rain, set seed and die in a very short time, producing transient forage that is not always palatable. Over-grazing can result in the elimination of palatable perennials such as saltbush and a reduction in the seed reserves of favoured ephemeral species. Dominant Production Sector In the region 65 per cent of the flock are utilised in self replacing wool production enterprises. A further 20 per cent of sheep are part of the wether based enterprises. The Merino is the dominant breed, with surplus stock sold for meat. Merinos are regularly joined with meat breeds including Border Leicester, Dorset and Suffolk. Exotic meat breeds, such as Dorper, Damara, Dohne or SAMM, are becoming more common and may be used solely or crossed with Merino. Farm Size There is a large variation in the size of pastoral leases with a range between 3,000 and 500,000 hectares. Stocking Capacity The average stocking rate is 0.6 - 2 Dry Sheep Equivalent (DSE)/ha.
Hassall & Associates Pty Ltd Page 19
Structure and Dynamics of the Australian Sheep Industry
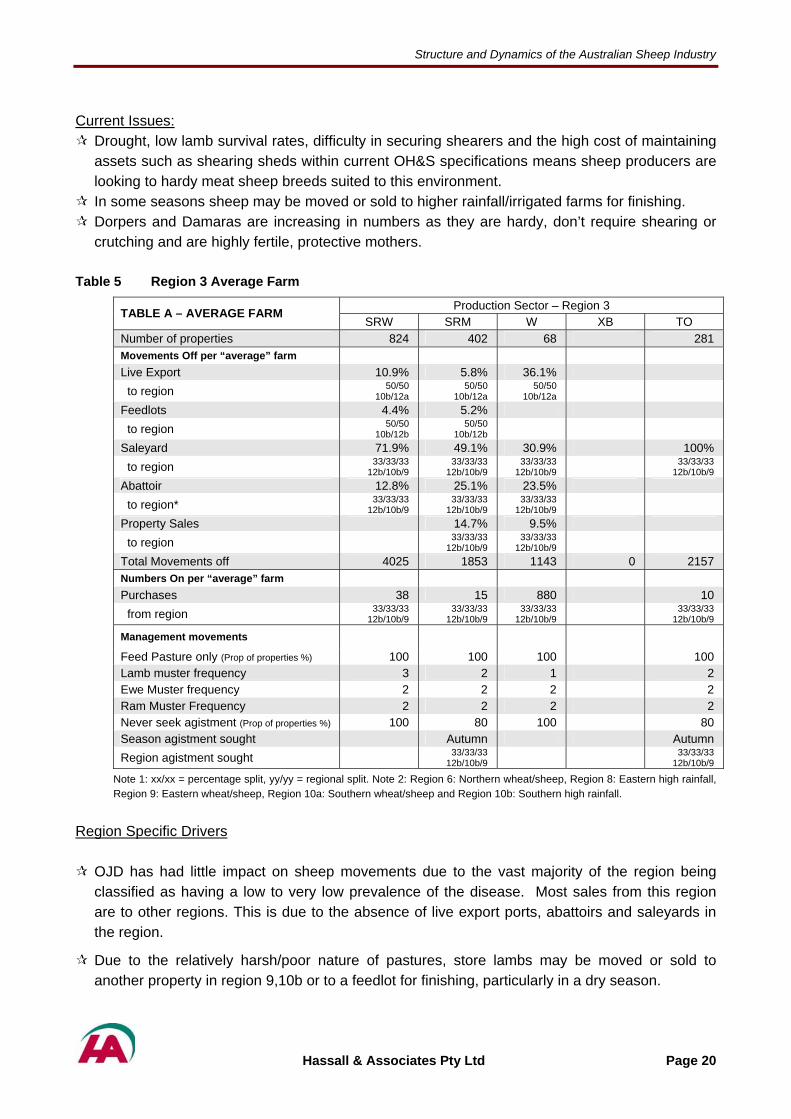
Current Issues:
Drought, low lamb survival rates, difficulty in securing shearers and the high cost of maintaining assets such as shearing sheds within current OH&S specifications means sheep producers are looking to hardy meat sheep breeds suited to this environment.
In some seasons sheep may be moved or sold to higher rainfall/irrigated farms for finishing. Dorpers and Damaras are increasing in numbers as they are hardy, don’t require shearing or crutching and are highly fertile, protective mothers.
Table 5 Region 3 Average Farm
Production Sector – Region 3 TABLE A – AVERAGE FARM SRW SRM W XB TO
Number of properties 824 402 68 281 Movements Off per “average” farm
Live Export 10.9% 5.8% 36.1% to region 50/50
10b/12a 50/50
10b/12a 50/50
10b/12a
Feedlots 4.4% 5.2% to region 50/50
10b/12b 50/50
10b/12b
Saleyard 71.9% 49.1% 30.9% 100% to region 33/33/33
12b/10b/9 33/33/33
12b/10b/9 33/33/33
12b/10b/9 33/33/33 12b/10b/9
Abattoir 12.8% 25.1% 23.5% to region* 33/33/33
12b/10b/9 33/33/33
12b/10b/9 33/33/33
12b/10b/9
Property Sales 14.7% 9.5% to region 33/33/33
12b/10b/9 33/33/33
12b/10b/9
Total Movements off 4025 1853 1143 0 2157 Numbers On per “average” farm Purchases 38 15 880 10 from region 33/33/33
12b/10b/9 33/33/33
12b/10b/9 33/33/33
12b/10b/9 33/33/33 12b/10b/9
Management movements
Feed Pasture only (Prop of properties %) 100 100 100 100 Lamb muster frequency 3 2 1 2 Ewe Muster frequency 2 2 2 2 Ram Muster Frequency 2 2 2 2 Never seek agistment (Prop of properties %) 100 80 100 80 Season agistment sought Autumn Autumn Region agistment sought 33/33/33
12b/10b/9 33/33/33 12b/10b/9
Note 1: xx/xx = percentage split, yy/yy = regional split. Note 2: Region 6: Northern wheat/sheep, Region 8: Eastern high rainfall, Region 9: Eastern wheat/sheep, Region 10a: Southern wheat/sheep and Region 10b: Southern high rainfall.
Region Specific Drivers
OJD has had little impact on sheep movements due to the vast majority of the region being classified as having a low to very low prevalence of the disease. Most sales from this region are to other regions. This is due to the absence of live export ports, abattoirs and saleyards in the region.
Due to the relatively harsh/poor nature of pastures, store lambs may be moved or sold to another property in region 9,10b or to a feedlot for finishing, particularly in a dry season.
Hassall & Associates Pty Ltd Page 20

Structure and Dynamics of the Australian Sheep Industry
Typical Farm management cycle A summer joining with a winter lambing. Weaning in spring with culling of rams, ewes and hoggets. Ram purchases about the same time as weaning. Lambs/weaner sales vary with climate & season bur are usually in spring or autumn. Most of the larger annual ram sales occur in the spring. Shearing tends to be clustered around autumn and spring but can occur at any time.
Table 6 Region 3 Typical Farm
Production Sector – Region 3 TABLE B - TYPICAL FARM SRW SRM W XB TO
Numbers (Consignments) Off
Live Export 422 (1) 78 (1) 275 (1) To Region 50/50
10b/12a 50/50
10b/12a 50/50
10b/12a
Season Spr/Sum Summer Spring
Feedlots To Region
Season
Saleyard 3603 (3) 699 (2) 593 (3) 1550 (3) To Region 33/33/33
12b/10b/9 33/33/33
12b/10b/9 33/33/33
12b/10b/9 33/33/33 12b/10b/9
Season Summer Sum/Aut Spr/Sum/Aut Spr/Sum
Abattoir 1076 (2) 275 (2) 607 (2) To Region 33/33/33
12b/10b/9 33/33/33
12b/10b/9 33/33/33 12b/10b/9
Season Spring Autumn Spring
Property Sales To Region
Season
Total Movements off 4025 (4) 1853 (5) 1143 (6) 2157 (5)
Numbers (Consignments) On
Purchases 38 (1) 15 (1) 880 (2) 510 (2) from Region 33/33/33
12b/10b/9 33/33/33
12b/10b/9 33/33/33
12b/10b/9 33/33/33 12b/10b/9
Season Summer Spring Spring Summer
Total Sheep/Farm - 30 June #
Average 6035 4939 2876 3364 Max (90% confidence interval) 6745 5249 5476 4132
Min (90% confidence interval) 5324 4629 276 2597
Note 1: (Z) = No of consignments – numbers per consignment may vary, Note 2 - xx/xx = percentage split, yy/yy = regional split
Note 3: Region 9: Eastern wheat/sheep, Region 10a: Southern wheat/sheep and Region 10b: Southern high rainfall.
ABARE Data 2004/2005.
Region Specific Drivers
Due to the large size of this region and the cost of transport in relation to the small margin on sheep, movements out of this region tend to be to the closest region.
Hassall & Associates Pty Ltd Page 21
Structure and Dynamics of the Australian Sheep Industry
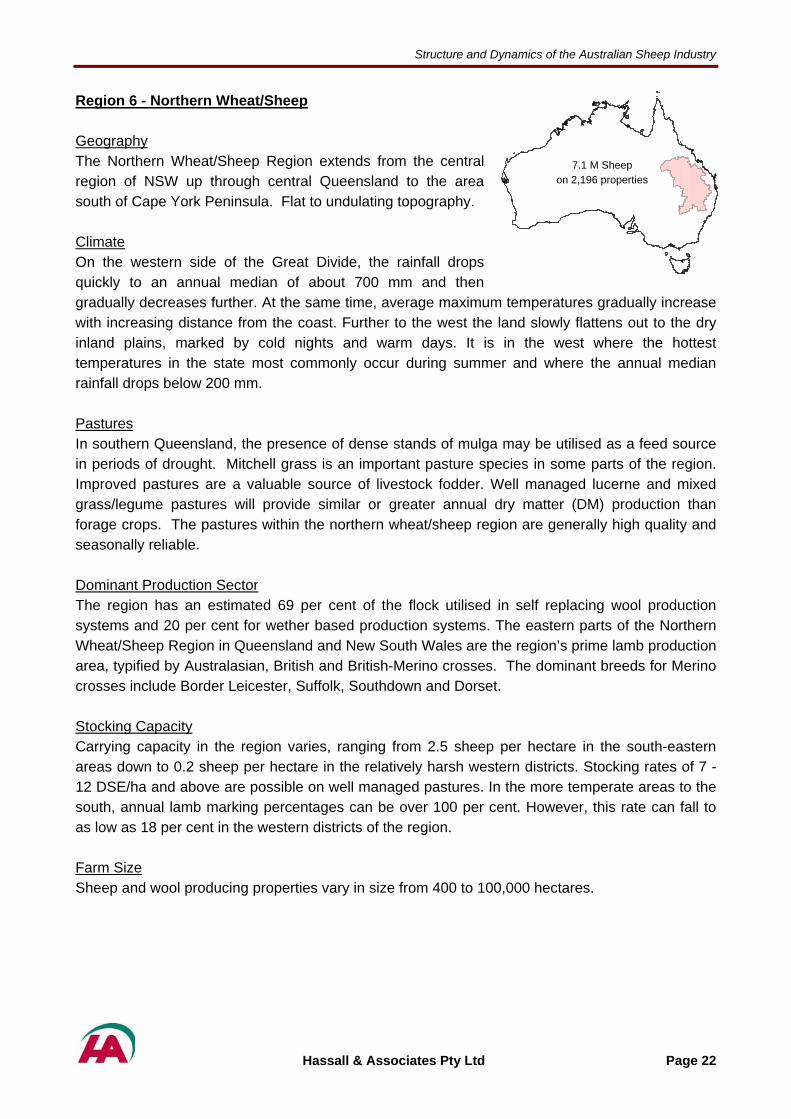
Region 6 - Northern Wheat/Sheep Geography The Northern Wheat/Sheep Region extends from the central region of NSW up through central Queensland to the area south of Cape York Peninsula. Flat to undulating topography. Climate On the western side of the Great Divide, the rainfall drops quickly to an annual median of about 700 mm and then gradually decreases further. At the same time, average maximum temperatures gradually increase with increasing distance from the coast. Further to the west the land slowly flattens out to the dry inland plains, marked by cold nights and warm days. It is in the west where the hottest temperatures in the state most commonly occur during summer and where the annual median rainfall drops below 200 mm.
7.1 M Sheep on 2,196 properties
Pastures In southern Queensland, the presence of dense stands of mulga may be utilised as a feed source in periods of drought. Mitchell grass is an important pasture species in some parts of the region. Improved pastures are a valuable source of livestock fodder. Well managed lucerne and mixed grass/legume pastures will provide similar or greater annual dry matter (DM) production than forage crops. The pastures within the northern wheat/sheep region are generally high quality and seasonally reliable. Dominant Production Sector The region has an estimated 69 per cent of the flock utilised in self replacing wool production systems and 20 per cent for wether based production systems. The eastern parts of the Northern Wheat/Sheep Region in Queensland and New South Wales are the region’s prime lamb production area, typified by Australasian, British and British-Merino crosses. The dominant breeds for Merino crosses include Border Leicester, Suffolk, Southdown and Dorset. Stocking Capacity Carrying capacity in the region varies, ranging from 2.5 sheep per hectare in the south-eastern areas down to 0.2 sheep per hectare in the relatively harsh western districts. Stocking rates of 7 - 12 DSE/ha and above are possible on well managed pastures. In the more temperate areas to the south, annual lamb marking percentages can be over 100 per cent. However, this rate can fall to as low as 18 per cent in the western districts of the region. Farm Size Sheep and wool producing properties vary in size from 400 to 100,000 hectares.
Hassall & Associates Pty Ltd Page 22
Structure and Dynamics of the Australian Sheep Industry
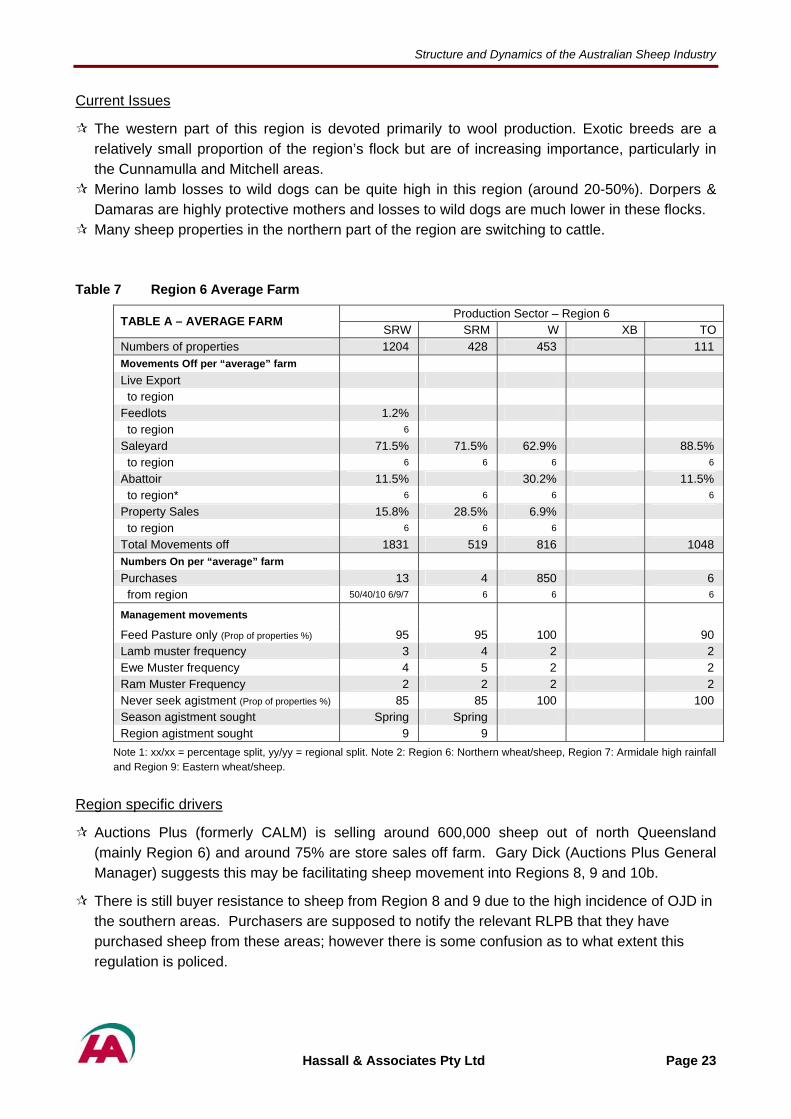
Current Issues
The western part of this region is devoted primarily to wool production. Exotic breeds are a relatively small proportion of the region’s flock but are of increasing importance, particularly in the Cunnamulla and Mitchell areas.
Merino lamb losses to wild dogs can be quite high in this region (around 20-50%). Dorpers & Damaras are highly protective mothers and losses to wild dogs are much lower in these flocks.
Many sheep properties in the northern part of the region are switching to cattle. Table 7 Region 6 Average Farm
Production Sector – Region 6 TABLE A – AVERAGE FARM SRW SRM W XB TO
Numbers of properties 1204 428 453 111 Movements Off per “average” farm
Live Export to region
Feedlots 1.2% to region 6
Saleyard 71.5% 71.5% 62.9% 88.5% to region 6 6 6 6
Abattoir 11.5% 30.2% 11.5% to region* 6 6 6 6
Property Sales 15.8% 28.5% 6.9% to region 6 6 6
Total Movements off 1831 519 816 1048 Numbers On per “average” farm Purchases 13 4 850 6 from region 50/40/10 6/9/7 6 6 6
Management movements
Feed Pasture only (Prop of properties %) 95 95 100 90 Lamb muster frequency 3 4 2 2 Ewe Muster frequency 4 5 2 2 Ram Muster Frequency 2 2 2 2 Never seek agistment (Prop of properties %) 85 85 100 100 Season agistment sought Spring Spring Region agistment sought 9 9
Note 1: xx/xx = percentage split, yy/yy = regional split. Note 2: Region 6: Northern wheat/sheep, Region 7: Armidale high rainfall and Region 9: Eastern wheat/sheep.
Region specific drivers
Auctions Plus (formerly CALM) is selling around 600,000 sheep out of north Queensland (mainly Region 6) and around 75% are store sales off farm. Gary Dick (Auctions Plus General Manager) suggests this may be facilitating sheep movement into Regions 8, 9 and 10b.
There is still buyer resistance to sheep from Region 8 and 9 due to the high incidence of OJD in the southern areas. Purchasers are supposed to notify the relevant RLPB that they have purchased sheep from these areas; however there is some confusion as to what extent this regulation is policed.
Hassall & Associates Pty Ltd Page 23
Structure and Dynamics of the Australian Sheep Industry
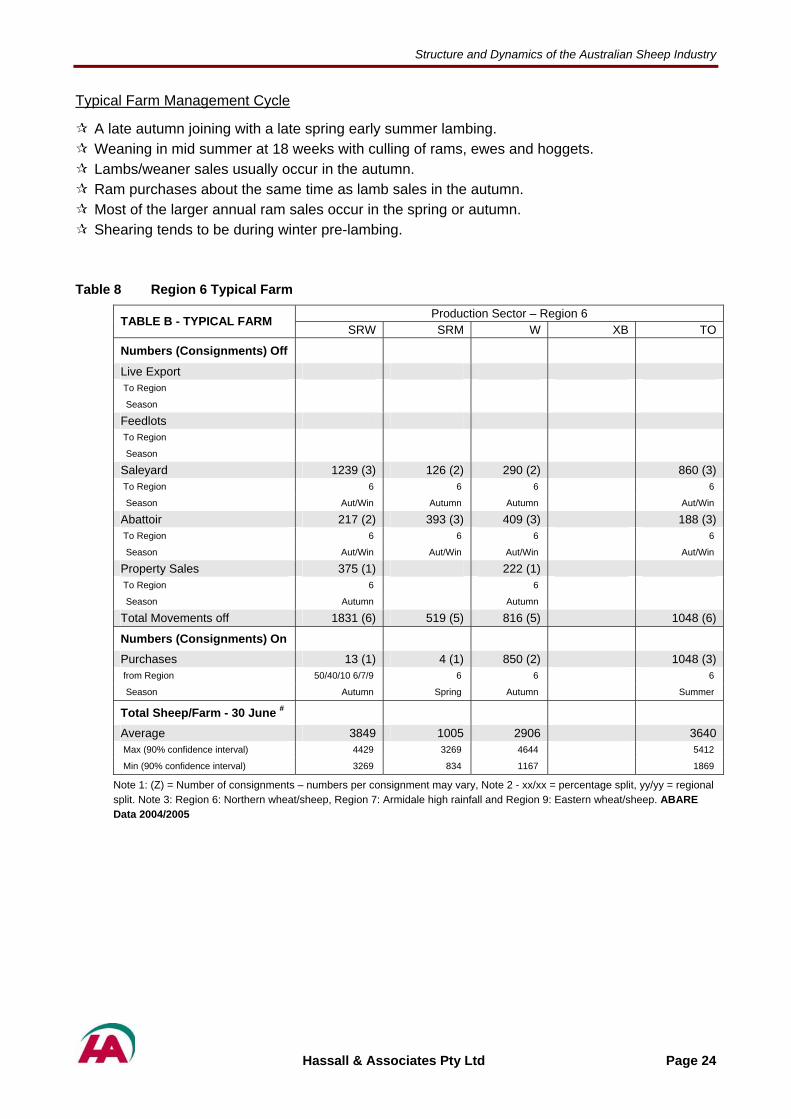
Typical Farm Management Cycle
A late autumn joining with a late spring early summer lambing. Weaning in mid summer at 18 weeks with culling of rams, ewes and hoggets. Lambs/weaner sales usually occur in the autumn. Ram purchases about the same time as lamb sales in the autumn. Most of the larger annual ram sales occur in the spring or autumn. Shearing tends to be during winter pre-lambing.
Table 8 Region 6 Typical Farm
Production Sector – Region 6 TABLE B - TYPICAL FARM SRW SRM W XB TO
Numbers (Consignments) Off
Live Export To Region
Season
Feedlots To Region
Season
Saleyard 1239 (3) 126 (2) 290 (2) 860 (3) To Region 6 6 6 6
Season Aut/Win Autumn Autumn Aut/Win
Abattoir 217 (2) 393 (3) 409 (3) 188 (3) To Region 6 6 6 6
Season Aut/Win Aut/Win Aut/Win Aut/Win
Property Sales 375 (1) 222 (1) To Region 6 6
Season Autumn Autumn
Total Movements off 1831 (6) 519 (5) 816 (5) 1048 (6)
Numbers (Consignments) On
Purchases 13 (1) 4 (1) 850 (2) 1048 (3) from Region 50/40/10 6/7/9 6 6 6
Season Autumn Spring Autumn Summer
Total Sheep/Farm - 30 June #
Average 3849 1005 2906 3640 Max (90% confidence interval) 4429 3269 4644 5412
Min (90% confidence interval) 3269 834 1167 1869
Note 1: (Z) = Number of consignments – numbers per consignment may vary, Note 2 - xx/xx = percentage split, yy/yy = regional split. Note 3: Region 6: Northern wheat/sheep, Region 7: Armidale high rainfall and Region 9: Eastern wheat/sheep. ABARE Data 2004/2005
Hassall & Associates Pty Ltd Page 24
Structure and Dynamics of the Australian Sheep Industry
3.4 M Sheep on 1,080 properties
Region 7 - Armidale High Rainfall Region Geography The Armidale High Rainfall region is located west of the Great Dividing Range and the region stretches from south of Armidale up to the Queensland border. It is the smallest region defined for the sheep population study. Climate Due to the region’s elevation, the climate tends to be temperate throughout the year, with rainfall from 700mm in the western areas up to 1200mm in the east. Elevated areas are very cold in the winter with severe frosts and occasional snow. Pastures Productive, temperate pasture species in this environment are frost and cold tolerant, producing the bulk of feed during the winter and spring months. Common pasture species in the region include white clover (Trifolium repens), tall fescue (Festuca arundinacea), perennial ryegrass (Lolium perenne) and redgrass (Bothriochloa macra). The pasture within this region is highly productive but very reliant on rainfall timing due to the extreme temperature faced in winter. Dominant Production Sector Approximately three quarters (74 per cent) of sheep are utilised for self replacing wool production, with the balance formed by trading or other use. Poll Dorset, White Suffolk and Border Leister are the three primary meat breeds used for crossing with ewes in the region. Less than 1 per cent of the region’s sheep flock is made up by exotic sheep breeds, with the main breeds present being the SAMM and Dohne. The Damara is also used to some extent in cross breeding. Farm Size These properties ranged in size from about 1200 ha on the north east slopes to over 6000 ha on the western clay soils. Stocking Capacity The average stocking rate is 6 - 10 DSE/ha. Current Issues
The presence of Chilean Needle Grass, which is unpalatable to livestock. Increasing resistance of internal parasites to drenches. A movement into more cattle grazing.
Hassall & Associates Pty Ltd Page 25
Structure and Dynamics of the Australian Sheep Industry
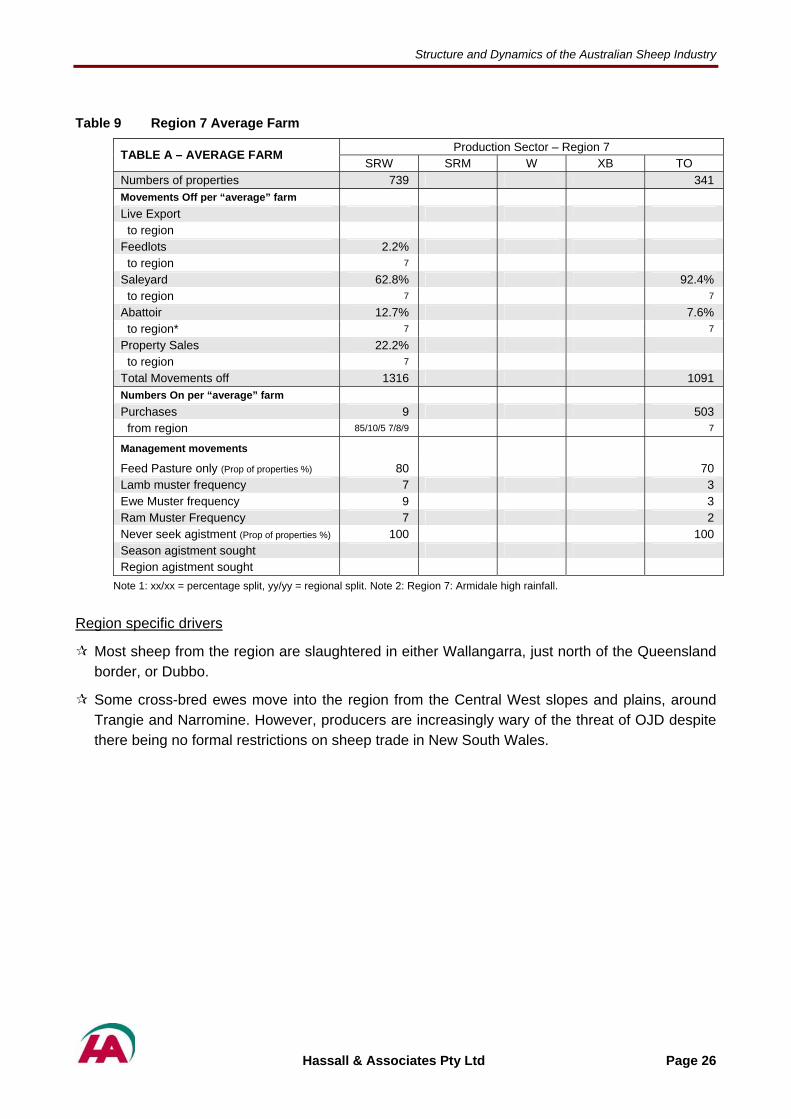
Table 9 Region 7 Average Farm
Production Sector – Region 7 TABLE A – AVERAGE FARM SRW SRM W XB TO
Numbers of properties 739 341 Movements Off per “average” farm
Live Export to region
Feedlots 2.2% to region 7
Saleyard 62.8% 92.4% to region 7 7
Abattoir 12.7% 7.6% to region* 7 7
Property Sales 22.2% to region 7
Total Movements off 1316 1091 Numbers On per “average” farm Purchases 9 503 from region 85/10/5 7/8/9 7
Management movements
Feed Pasture only (Prop of properties %) 80 70 Lamb muster frequency 7 3 Ewe Muster frequency 9 3 Ram Muster Frequency 7 2 Never seek agistment (Prop of properties %) 100 100 Season agistment sought Region agistment sought
Note 1: xx/xx = percentage split, yy/yy = regional split. Note 2: Region 7: Armidale high rainfall.
Region specific drivers
Most sheep from the region are slaughtered in either Wallangarra, just north of the Queensland border, or Dubbo.
Some cross-bred ewes move into the region from the Central West slopes and plains, around Trangie and Narromine. However, producers are increasingly wary of the threat of OJD despite there being no formal restrictions on sheep trade in New South Wales.
Hassall & Associates Pty Ltd Page 26
Structure and Dynamics of the Australian Sheep Industry
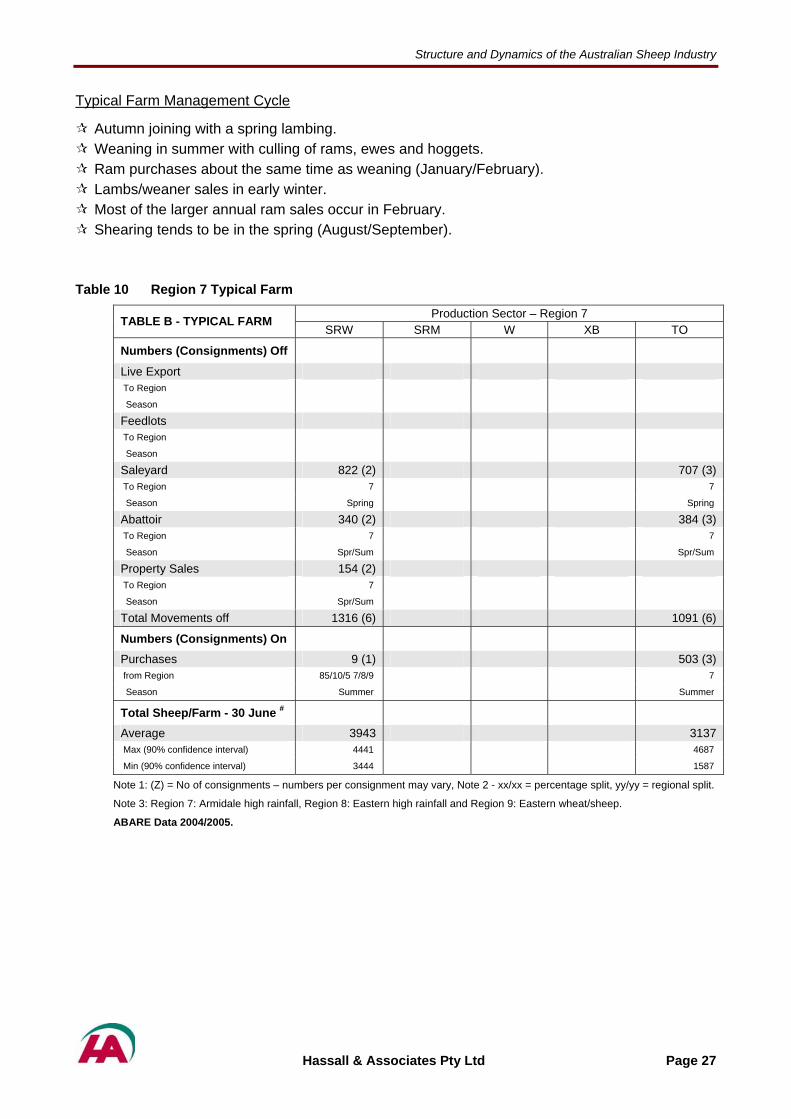
Typical Farm Management Cycle
Autumn joining with a spring lambing. Weaning in summer with culling of rams, ewes and hoggets. Ram purchases about the same time as weaning (January/February). Lambs/weaner sales in early winter. Most of the larger annual ram sales occur in February. Shearing tends to be in the spring (August/September).
Table 10 Region 7 Typical Farm
Production Sector – Region 7 TABLE B - TYPICAL FARM SRW SRM W XB TO
Numbers (Consignments) Off
Live Export To Region
Season
Feedlots To Region
Season
Saleyard 822 (2) 707 (3) To Region 7 7
Season Spring Spring
Abattoir 340 (2) 384 (3) To Region 7 7
Season Spr/Sum Spr/Sum
Property Sales 154 (2) To Region 7
Season Spr/Sum
Total Movements off 1316 (6) 1091 (6)
Numbers (Consignments) On
Purchases 9 (1) 503 (3) from Region 85/10/5 7/8/9 7
Season Summer Summer
Total Sheep/Farm - 30 June #
Average 3943 3137 Max (90% confidence interval) 4441 4687
Min (90% confidence interval) 3444 1587
Note 1: (Z) = No of consignments – numbers per consignment may vary, Note 2 - xx/xx = percentage split, yy/yy = regional split.
Note 3: Region 7: Armidale high rainfall, Region 8: Eastern high rainfall and Region 9: Eastern wheat/sheep.
ABARE Data 2004/2005.
Hassall & Associates Pty Ltd Page 27

Structure and Dynamics of the Australian Sheep Industry
10.4 M Sheep on 4,103 properties
Region 8 - Eastern High Rainfall Geography The Eastern High Rainfall region stretches in a crescent from northern New South Wales, through south eastern NSW including the Southern Tablelands and Snowy Mountains, down to the outskirts of Melbourne. Landscapes in the region vary, from the relatively flat areas near the eastern seaboard to the escarpments of the Tablelands. Climate Climate varies dramatically from frost free, high rainfall coastal plains to the snow covered peaks of Mt Kosiosko (2,280m). Rainfall varies from 600mm pa on the southern slopes to over 2000mm on the north coast. Vegetation Pastures range from productive, temperate pasture species which are frost and cold tolerant to a range of species adapted to the high rainfall environments including Kikuyu and Phalaris. In non agricultural areas vegetation is very diverse and extends to dry forests (such as Turpentine), heaths and moist forests located in valleys. Dominant Production Sector The dominant production system is self replacing wool production, at 53 per cent of sheep, with self replacing meat production systems also prominent at 20 per cent of the population. The dominant wool producing sheep breed is the merino. Increasingly, merinos are being joined with meat breeds as a result of the current high lamb prices and continuing low wool prices. Merinos are largely crossed with traditional meat breeds including Poll Dorset, White Suffolk, and to a lesser extent Border Leister, Dohne and SAMM. Farm Size Farm size varies from a few hectares on the densely populated coastal areas to around 2,000ha on the southern slopes and Tablelands. Stocking Capacity The average stocking rate is 4 - 8 DSE/ha. Current Issues
The high incidence of OJD in the region.
Degradation of pastures by Serrated Tussock in the southern parts of the region.
Sheep studs are investing in vaccination programs for OJD to try and maintain sales of stud stock to other regions.
Hassall & Associates Pty Ltd Page 28

Structure and Dynamics of the Australian Sheep Industry
Table 11 Region 8 Average Farm
Production Sector – Region 8 TABLE A – AVERAGE FARM SRW SRM W XB TO
Numbers of properties 1925 1061 495 303 319 Movements Off per “average” farm
Live Export to region
Feedlots to region
Saleyard 505 340 140 to region 8 8 50/50 8/9
Abattoir 204 138 214 1923 1907 to region* 50/50 8/9 50/50 9/10b 50/50 9/10b 50/50 9/10b 50/50 9/10b
Property Sales 200 185 291 1365 350
to region 8 50/50 9/10b 50/50 9/10b 50/25/25 8/9/10b
50/25/25 8/9/10b
Total Movements off 909 663 644 3288 2257 Numbers On per “average” farm Purchases 8 5 700 564 608
from region 8 60/20/20 8/9/10b
60/20/20 8/9/10b
50/50 8/9 50/50 8/9
Management movements
Feed Pasture only (Prop of properties %) 80 70 100 100 50 Lamb muster frequency 4 2 5 5 Ewe Muster frequency 4 3 5 5 Ram Muster Frequency 3 3 5 5 Never seek agistment (Prop of properties %) 95 70 100 95 100 Season agistment sought Winter Autumn Autumn Region agistment sought 8 8 8
Note 1: xx/xx = percentage split, yy/yy = regional split. Note 2: Region 8: Eastern high rainfall, Region 9: Eastern wheat/sheep and Region 10b: Southern wheat/sheep.
Region specific drivers
Footrot in the region means that there is buyer resistance outside this region. Producers in nearby regions fear that they might bring footrot onto their properties if they buy stud/store sheep from these regions or agist their own sheep into this region.
Given the relatively high mutton prices, the majority of producers send their stock to the Southern Meats Abattoirs (Harden) and others in the region for slaughter.
Sheep movements out of and into the region remain affected by OJD.
Hassall & Associates Pty Ltd Page 29

Structure and Dynamics of the Australian Sheep Industry
Typical Farm Management Cycle A summer joining with an autumn/winter lambing. Weaning in early summer with culling of rams, ewes and hoggets. Ram purchases prior to joining in for meat sires but in spring for fine wool rams. Lambs/weaner sales usually in spring, but some in autumn in poor seasons. Most of the larger fine wool annual ram sales occur in the spring. Shearing in early summer to avoid grass seed contamination of the fine wool.
Table 12 Region 8 Typical Farm
Production Sector – Region 8 TABLE B - TYPICAL FARM SRW SRM W XB TO
Numbers (Consignments) Off
Live Export To Region
Season
Feedlots To Region
Season
Saleyard 420 (2) 527 (2) 140 (2) To Region 8 8 50/50 8/9
Season Summer Summer
Abattoir 209 (1) 136 (2) 213 (2) 2188 (3) 1147 (2) To Region 50/50 8/9 50/50 9/10b 50/50 9/10b 50/50 9/10b 50/50 9/10b
Season Summer Summer Sum/Aut Summer Summer
Property Sales 280 (2) 291 (1) 1100 (1) 1110 (1) To Region 8 50/50 9/10b 50/25/25
8/9/10b 50/25/25 8/9/10b
Season Summer Sum/Aut Summer Summer
Total Movements off 909 (5) 663 (4) 644 (5) 3288 (4) 2257 (3)
Numbers (Consignments) On
Purchases 8 (1) 5 (1) 700 (1) 564 (3) 608 (3) from Region 8 60/20/20
8/9/10b 60/20/20 8/9/10b
50/50 8/9 50/50 8/9
Season Autumn Summer Summer Summer Spr/Sum
Total Sheep/Farm - 30 June #
Average 3575 2836 4375 1570 3058 Max (90% confidence interval) 5092 4190 7128 2041 3975
Min (90% confidence interval) 1482 2085 1623 1099 2140
Note 1: (Z) = No of consignments – numbers per consignment may vary, Note 2 - xx/xx = percentage split, yy/yy = regional split.
Note 3: Region 8: Eastern high rainfall, Region 9: Eastern wheat/sheep and Region 10b: Southern wheat/sheep.
ABARE Data 2004/2005.
Region specific drivers
The major driver for movement here is the presence of OJD & footrot which confine the majority of sales within the region. Most other sales are dominated by proximity to the region, however, sales to abattoirs and other properties will occur where there is a marketing advantage and/or evidence that OJD/footrot is not a problem on a specific farm.
Hassall & Associates Pty Ltd Page 30

Structure and Dynamics of the Australian Sheep Industry
Region 9 - Eastern Wheat/Sheep Geography The Eastern Wheat/Sheep region occupies much of central New South Wales and extends south, into central Victoria. Specifically, the region incorporates the Murrumbidgee, Central West and Central Macquarie in NSW, and the eastern Murray region around the NSW and Victorian border.
20.3 M Sheep on 9,347 properties
Climate On the western slopes the rainfall gradually decreases from 950mm pa on the upper slopes to 350mm pa on the western border. The frequency of winter snowfalls also decreases from east to west. Average maximum temperatures gradually increase as height above sea level decreases. Further to the west the land slowly flattens out into the dry inland plains, marked by cold nights and warm days. Vegetation A wide range of annual pastures and winter/summer crops are produced on irrigated and dryland properties across the region. Annual pastures include lucerne, phalaris, sub clover and white clover while wheat, oats, barley and canola are common winter crops that mixed sheep/cropping properties would produce. Native vegetation in the region varies considerably. Common species include Box, Gum and Grey Box, however, the area incorporates several landscapes including native grasslands, alpine herb fields, wet forests and woodlands. The Central West and Macquarie are characterised by Coolabah, Black Box, River Red Gum and Bimble Box woodlands, as well as Mitchell grass and wire grass. Red gums are also prevalent in the eastern Murray area. Dominant Production Sector Self replacing wool and meat production systems dominate at 47 per cent and 26 per cent of the sheep population respectively. A further 18 per cent of sheep are utilised for trading or other production purposes. Exotic meat breeds such as Damara and Dorper are becoming of increasing importance in the region. Increasingly, merino ewes are being crossed with meat breeds due to prevailing lower wool prices. It is estimated that, currently, close to 50 per cent of ewes are joined with meat breed rams. Stocking Capacity The average stocking rate is 3 - 7 DSE/ha. Current Issues
More Merino ewes are being crossed with meat breeds.
Although there has been a trend to increased percentages of merino ewes joined to meat rams, recent surveys (MLA 2005) suggest this is stabilized and in the 2005 lamb survey 64% of merino ewes were joined to merino rams.
Meat breeds such as the Dorper & Damara are increasing in importance.
Hassall & Associates Pty Ltd Page 31

Structure and Dynamics of the Australian Sheep Industry
Table 13 Region 9 Average Farm
Production Sector – Region 9 TABLE A – AVERAGE FARM SRW SRM W XB TO
3228 2816 271 893 2229 Numbers of properties Movements Off per “average” farm Live Export
to region
4.4% 5.4% Feedlots to region 9 9
45.4% 54.9% 69.9% 39.5% 48.4% Saleyard to region 9 9 9 9 9
20.8% 28.9% 28.0% 60.5% 46.6% Abattoir to region* 80/20 9/10b 9 9 9 9
29.4% 10.8% 2.1% 5.0% Property Sales to region 9 9 9 9
1357 957 708 818 1193 Total Movements off Numbers On per “average” farm Purchases 10 7 700 194 5 from region 9 9 9 9 9
Management movements
Feed Pasture only (Prop of properties %) 85% 75% 100% 80% 60% Lamb muster frequency 5 7 3 4 4 Ewe Muster frequency 6 7 3 5 3 Ram Muster Frequency 5 5 3 2 2 Never seek agistment (Prop of properties %) 90% 90% 100% 95% 100% Season agistment sought Autumn Autumn - Autumn Region agistment sought 6 6 6
Note 1: xx/xx = percentage split, yy/yy = regional split. Note 2: Region 6: Northern wheat/sheet, Region 9: Eastern wheat/sheep and Region 10b: Southern high rainfall.
Region specific drivers
OJD still dampens movement of sheep in the region even with restrictions removed in 2004. Risk of OJD infection limits purchases from and agistment into region 8.
Agistment to region 8 is also limited by the fact that sheep properties in region 8 are generally high input, high stocking rate, smaller grazing systems that don’t often have spare feed available to take on agistment.
This region lies in NSW where on average 88% of sales to saleyards are to slaughter and for the two major centres (Dubbo & Wagga Wagga) there are no store sales. The major store sheep selling centres in the region would be Narromine in the north and Jerilderie in the south.
Of the sheep sales through the Dubbo saleyard that are not for slaughter (mainly re-stockers) 80% would tend to move north and west within a 200km radius of the saleyard. Most of these sales would stay within the region, maybe 30% into the bottom tip of region 6.
Of the sheep sales through the Wagga Wagga saleyard that are not for slaughter (mainly re-stockers) 85% would tend to move from the west to the east within a 200km radius of the saleyard. This may move some sheep into Region 8.
Hassall & Associates Pty Ltd Page 32
Structure and Dynamics of the Australian Sheep Industry
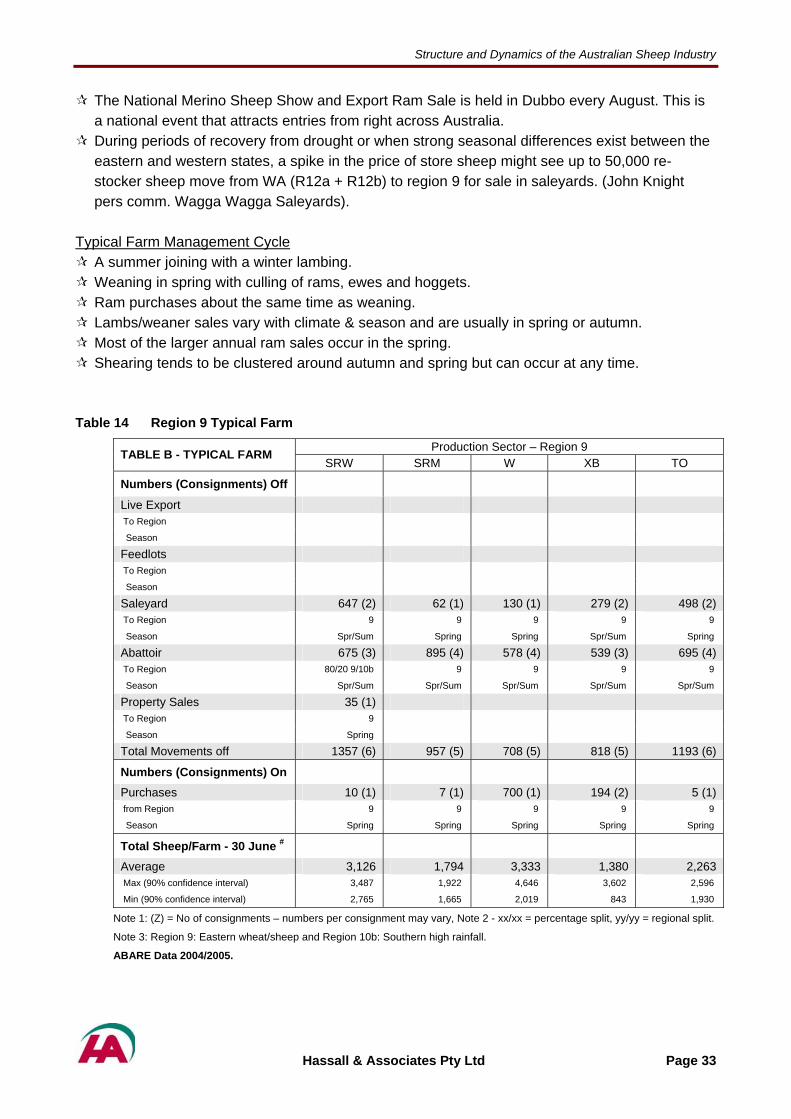
The National Merino Sheep Show and Export Ram Sale is held in Dubbo every August. This is a national event that attracts entries from right across Australia.
During periods of recovery from drought or when strong seasonal differences exist between the eastern and western states, a spike in the price of store sheep might see up to 50,000 re-stocker sheep move from WA (R12a + R12b) to region 9 for sale in saleyards. (John Knight pers comm. Wagga Wagga Saleyards).
Typical Farm Management Cycle
A summer joining with a winter lambing. Weaning in spring with culling of rams, ewes and hoggets. Ram purchases about the same time as weaning. Lambs/weaner sales vary with climate & season and are usually in spring or autumn. Most of the larger annual ram sales occur in the spring. Shearing tends to be clustered around autumn and spring but can occur at any time.
Table 14 Region 9 Typical Farm
Production Sector – Region 9 TABLE B - TYPICAL FARM SRW SRM W XB TO
Numbers (Consignments) Off
Live Export To Region
Season
Feedlots To Region
Season
Saleyard 647 (2) 62 (1) 130 (1) 279 (2) 498 (2) To Region 9 9 9 9 9
Season Spr/Sum Spring Spring Spr/Sum Spring
Abattoir 675 (3) 895 (4) 578 (4) 539 (3) 695 (4) To Region 80/20 9/10b 9 9 9 9
Season Spr/Sum Spr/Sum Spr/Sum Spr/Sum Spr/Sum
Property Sales 35 (1) To Region 9
Season Spring
Total Movements off 1357 (6) 957 (5) 708 (5) 818 (5) 1193 (6)
Numbers (Consignments) On
Purchases 10 (1) 7 (1) 700 (1) 194 (2) 5 (1) from Region 9 9 9 9 9
Season Spring Spring Spring Spring Spring
Total Sheep/Farm - 30 June #
Average 3,126 1,794 3,333 1,380 2,263 Max (90% confidence interval) 3,487 1,922 4,646 3,602 2,596
Min (90% confidence interval) 2,765 1,665 2,019 843 1,930
Note 1: (Z) = No of consignments – numbers per consignment may vary, Note 2 - xx/xx = percentage split, yy/yy = regional split.
Note 3: Region 9: Eastern wheat/sheep and Region 10b: Southern high rainfall.
ABARE Data 2004/2005.
Hassall & Associates Pty Ltd Page 33
Structure and Dynamics of the Australian Sheep Industry
Region 10a - Southern Wheat/Sheep
9.6 M Sheep on 5,636 properties
Geography The Southern Wheat/Sheep region extends from north-western Victoria into South Australia, to the Eyre Peninsula. The area west of the South Australian-Victorian border is characterised by dune ridges with intervening flats, creating seasonal freshwater lakes and swamps. Sporadic volcanic hills and granite outcrops are also features of the landscape. Climate Median annual rainfall ranges from 275 to 600 mm pa. The climate of South Australia varies from hot and dry in the interior to the milder and wetter climates of the southern Mount Lofty Ranges and the southeast coast of South Australia and southern Victoria. Pastures Increased use of superphosphate and medic pastures in the Eyre Peninsula since the 1950’s has resulted in improved soil fertility and pasture productivity. The pastures within this region are high quality and very productive. Dominant Production Sector Around 47 per cent of the flock are utilised in self replacing wool production systems, with a further 37 per cent used in self replacing meat production systems. There are very few exotic sheep in the region, with no commercial exotic sheep flocks. Merinos in the region tend to be crossed with Dorset and White Suffolk. Farm Size The farm holdings range from only 160 hectares to about 2300 hectares. Stocking Capacity The average stocking rate is 7 - 12 DSE/ha. Current Issues
Alternative enterprises such as cropping and cattle production are much more profitable than sheep. Consequently, producers in this mixed cropping/livestock region are shifting their enterprise mix from sheep into mixed farming and intensive cropping.
Increasing worm resistance.
Hassall & Associates Pty Ltd Page 34
Structure and Dynamics of the Australian Sheep Industry
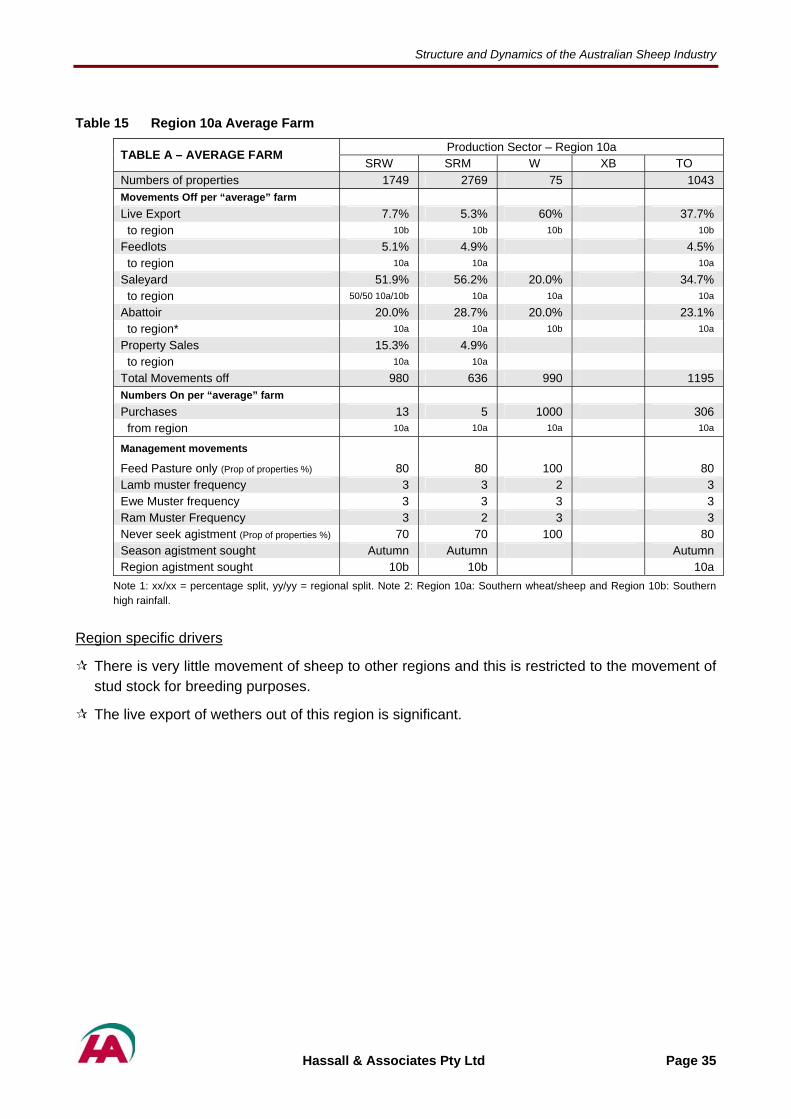
Table 15 Region 10a Average Farm
Production Sector – Region 10a TABLE A – AVERAGE FARM SRW SRM W XB TO
Numbers of properties 1749 2769 75 1043 Movements Off per “average” farm
Live Export 7.7% 5.3% 60% 37.7% to region 10b 10b 10b 10b
Feedlots 5.1% 4.9% 4.5% to region 10a 10a 10a
Saleyard 51.9% 56.2% 20.0% 34.7% to region 50/50 10a/10b 10a 10a 10a
Abattoir 20.0% 28.7% 20.0% 23.1% to region* 10a 10a 10b 10a
Property Sales 15.3% 4.9% to region 10a 10a
Total Movements off 980 636 990 1195 Numbers On per “average” farm Purchases 13 5 1000 306 from region 10a 10a 10a 10a
Management movements
Feed Pasture only (Prop of properties %) 80 80 100 80 Lamb muster frequency 3 3 2 3 Ewe Muster frequency 3 3 3 3 Ram Muster Frequency 3 2 3 3 Never seek agistment (Prop of properties %) 70 70 100 80 Season agistment sought Autumn Autumn Autumn Region agistment sought 10b 10b 10a
Note 1: xx/xx = percentage split, yy/yy = regional split. Note 2: Region 10a: Southern wheat/sheep and Region 10b: Southern high rainfall.
Region specific drivers
There is very little movement of sheep to other regions and this is restricted to the movement of stud stock for breeding purposes.
The live export of wethers out of this region is significant.
Hassall & Associates Pty Ltd Page 35

Structure and Dynamics of the Australian Sheep Industry
Typical Farm Management Cycle
A summer joining with an autumn/winter lambing. Weaning in spring with culling of rams, ewes and hoggets. Ram purchases at weaning (in the spring). Lambs/weaner sales usually in spring but some in autumn in poor seasons. Most of the larger fine wool annual ram sales occur in the spring. Shearing in winter to early spring.
Table 16 Region 10a Typical Farm
Production Sector – Region 10a TABLE B - TYPICAL FARM SRW SRM W XB TO
Numbers (Consignments) Off
Live Export 118 (2) 792 (1) To Region 10b 10b
Season Win/Spr Winter
Feedlots To Region
Season
Saleyard 588 (2) 179 (2) 913 (2) To Region 50/50 10a/10b 10a 10a
Season Spring Spring Spring
Abattoir 449 (2) 457 (3) 198 (2) 571 (3) To Region 10a 10a 10b 10a
Season Spr/Sum Spring Winter Spr/Sum/Aut
Property Sales To Region
Season
Total Movements off 980 (6) 636 (5) 990 (3) 1195 (5)
Numbers (Consignments) On
Purchases 13 (1) 5 (1) 1000 (2) 306 (2) from Region 50/50 10a/10b 50/50 10a/10b 10b 10a
Season Summer Spring Spring Spring
Total Sheep/Farm - 30 June #
Average 2106 1286 2712 1824 Max (90% confidence interval) 2528 1411 4643 2084
Min (90% confidence interval) 1684 1162 782 1565
Note 1: (Z) = No of consignments – numbers per consignment may vary, Note 2 - xx/xx = percentage split, yy/yy = regional split.
Note 3: Region 10a: Southern wheat/sheep and Region 10b: Southern high rainfall.
ABARE Data 2004/2005.
Hassall & Associates Pty Ltd Page 36
Structure and Dynamics of the Australian Sheep Industry
Region 10b - Southern High Rainfall
21.7 M Sheep on 7,513 properties
Geography The Southern High Rainfall region extends west from the Victorian Midlands, across the South Australian-Victorian border, and east to Kangaroo Island. The Victorian Midlands is characterised by undulating terrain with areas of woodland on relatively poor soils. The Grampians National Park is located in the east of the region, as are the goldfields. Climate The coastal strip south of the ranges is generally wetter except in the far east where the Strezlecki Ranges shelter eastern regions from the moisture laden south westerly winds. The probability of early autumn and late spring rains is considerably higher than north of the divide. Pastures Pastures in the Southern High Rainfall region are typically perennial ryegrass and subterranean clover whereas perennial grasses and white clover dominate in the Gippsland. These productive pastures rely heavily on the seasonal rainfall to maximise growth throughout the year. Dominant Production Sector A large number of sheep, 44 per cent, are utilised in self replacing wool production systems. This production is predominantly fine wool. Another 27 per cent are utilised in self replacing meat production systems. With 19 per cent of sheep also found in cross bred production systems, this region has by far the largest number of sheep in cross bred production systems. The majority of merino cross-breeding is undertaken with Dorsets and White Suffolks. The majority of the flock tends to be bred in the region, however, some ewe purchases are made from southern New South Wales and pastoral South Australia. Stocking Capacity The average carrying capacity is 4 - 6 DSE/ha. Current Issues
Increasing worm resistance amongst the flock.
Competition for land (arising from sub-division for hobby properties).
Moves to alternative enterprises such as tree crops and cattle.
Hassall & Associates Pty Ltd Page 37

Structure and Dynamics of the Australian Sheep Industry
Table 17 Region 10b Average Farm
Production Sector – Region 10b TABLE A – AVERAGE FARM SRW SRM W XB TO
Numbers of properties 3274 2347 702 1190 Movements Off per “average” farm
Live Export 6.5% 5.8% to region 10b 10b
Feedlots 4.3% 5.2% 8.7% 7.6% to region 10b 10b 10b 10b
Saleyard 63.7% 54.4% 45.5% 29.7% to region 10b 10b 10b 10b
Abattoir 14.1% 30.0% 45.7% 57.9% to region* 10b 10b 10b 10b
Property Sales 11.5% 4.5% 4.9% to region 10b 10b 10b
Total Movements off 1205 1335 3435 1545 Numbers On per “average” farm Purchases 18 8 615 407 from region 50/50 10a/10b 50/50 10a/10b 10b 10a
Management movements
Feed Pasture only (Prop of properties %) 70 50 60 60 Lamb muster frequency 4 4 4 4 Ewe Muster frequency 4 4 4 3 Ram Muster Frequency 3 2 3 3 Never seek agistment (Prop of properties %) 65 60 90 70 Season agistment sought Winter Autumn Autumn Autumn Region agistment sought 10b 10b 10b 10b
Note 1: xx/xx = percentage split, yy/yy = regional split. Note 2: Region 10a: Southern wheat/sheep and Region 10b: Southern high rainfall.
Region specific drivers
The majority of the flock tends to be bred in the region, however, some ewe purchases are made from southern New South Wales (region 9) and pastoral South Australia (10a).
Movement of sheep into the region is limited due to the presence of footrot.
Hassall & Associates Pty Ltd Page 38

Structure and Dynamics of the Australian Sheep Industry
Typical Farm Management Cycle A summer joining with an autumn/winter lambing. Weaning in spring with culling of rams, ewes and hoggets. Ram purchases at weaning (in the spring). Lambs/weaner sales usually in spring through to autumn. Most of the larger fine wool annual ram sales occur in the spring. Shearing tends to be around autumn and spring but can occur at any time.
Table 18 Region 10b Typical Farm
Production Sector – Region 10b TABLE B - TYPICAL FARM SRW SRM W XB TO
Numbers (Consignments) Off
Live Export 157 (1) 60 (1) To Region 10b 10b
Season Summer Winter
Feedlots To Region
Season
Saleyard 599 (2) 558 (2) 2147 (3) 907 (3) To Region 10b 10b 10b 10b
Season Spring Win/Spr Spr/Sum Spr/Sum
Abattoir 499 (2) 717 (2) 1288 (2) 638 (2) To Region 10b 10b 10b 10b
Season Spr/Sum/Aut All year Aut/Spr Sum/Aut
Property Sales To Region
Season
Total Movements off 1205 (5) 1335 (5) 3435 (5) 1545 (5)
Numbers (Consignments) On
Purchases 18 (1) 8 (1) 615 (2) 407 (2) from Region 50/50 10a/10b 50/50 10a/10b 10b 10a
Season Summer Spring Summer Spring
Total Sheep/Farm - 30 June #
Average 3130 2725 5038 3404 Max (90% confidence interval) 3404 3047 10522 4727
Min (90% confidence interval) 2856 2402 447 2081
Note 1: (Z) = No of consignments – numbers per consignment may vary, Note 2 - xx/xx = percentage split, yy/yy = regional split.
Note 3: Region 10a: Southern wheat/sheep and Region 10b: Southern high rainfall. ABARE Data 2004/2005.
Hassall & Associates Pty Ltd Page 39
Structure and Dynamics of the Australian Sheep Industry
Region 11 - Tasmania Geography Tasmania is the most mountainous Australian state. The Midlands, located between the Central Plateau sloping south-east and the mountains of the north-east corner of the state, is a highly productive agricultural area. Sheep are the most prevalent livestock in Tasmania with a majority of the flock located in the eastern half of the state (in particular, the Oatlands area). However, an estimated 20 per cent are located on the north-west coast and Bass Strait islands.
3.2 M Sheep on 797 properties
Climate Tasmania enjoys for the most part a 'temperate maritime' climate. The sea, never more than 115km distant, suppresses temperature extremes. The prevailing westerly airstream leads to a marked variation of cloudiness, rainfall and temperature. The result is that the West Coast and highlands are cool, wet and cloudy and the East Coast and lowlands are milder, drier and sunnier. Pastures Approximately half of the region’s fine wool flock is grazed on native grasslands as this is lighter feed which facilitates the production of finer wool. Common native pasture species in the region include kangaroo grass and tussock grass. Dominant Production Sector In this region the self replacing wool enterprises are the dominant production system at 80 per cent of the sheep population. A further 13 per cent are utilised in self replacing meat production enterprises. Wool producing breeds tend to be run in those areas of the state where rainfall is below 700mm. The wool production flock structures have changed over time as the demand for finer-wool breeds has increased. As a result, the Merino is the dominant sheep breed in Tasmania. Tasmanian wool thus tends to be approximately one micron finer than wool from the rest of Australia. Coupled with the fact that the wool tends to be relatively free from vegetable matter, Tasmanian superfine merino wool regularly achieves some of the highest prices in the world. The region also has a small flock of specialty carpet breeds, however flock numbers are declining due to competition from cheap imports. Farm Size The average sheep and wool producing farm size ranges from 100 ha to 700 ha. Stocking Capacity The average stocking rate is 7 - 11 DSE/ha.
Hassall & Associates Pty Ltd Page 40
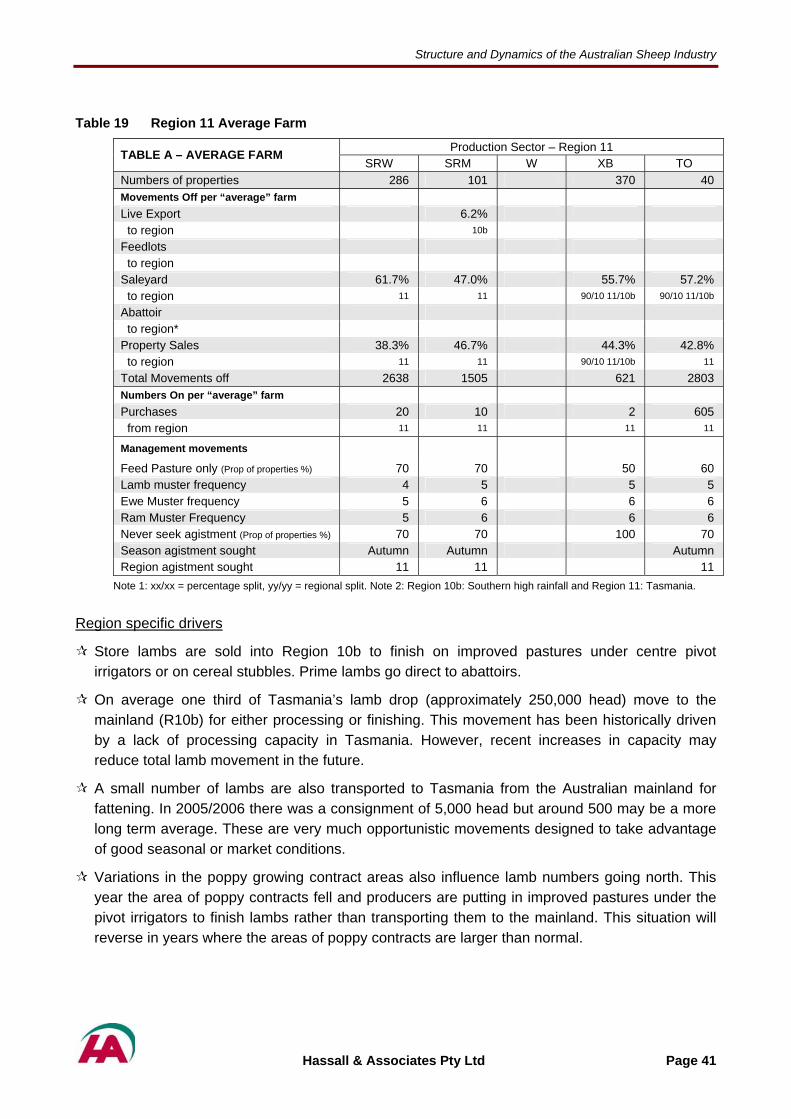
Structure and Dynamics of the Australian Sheep Industry
Table 19 Region 11 Average Farm
Production Sector – Region 11 TABLE A – AVERAGE FARM SRW SRM W XB TO
Numbers of properties 286 101 370 40 Movements Off per “average” farm
Live Export 6.2% to region 10b
Feedlots to region
Saleyard 61.7% 47.0% 55.7% 57.2% to region 11 11 90/10 11/10b 90/10 11/10b
Abattoir to region*
Property Sales 38.3% 46.7% 44.3% 42.8% to region 11 11 90/10 11/10b 11
Total Movements off 2638 1505 621 2803 Numbers On per “average” farm Purchases 20 10 2 605 from region 11 11 11 11
Management movements
Feed Pasture only (Prop of properties %) 70 70 50 60 Lamb muster frequency 4 5 5 5 Ewe Muster frequency 5 6 6 6 Ram Muster Frequency 5 6 6 6 Never seek agistment (Prop of properties %) 70 70 100 70 Season agistment sought Autumn Autumn Autumn Region agistment sought 11 11 11
Note 1: xx/xx = percentage split, yy/yy = regional split. Note 2: Region 10b: Southern high rainfall and Region 11: Tasmania.
Region specific drivers
Store lambs are sold into Region 10b to finish on improved pastures under centre pivot irrigators or on cereal stubbles. Prime lambs go direct to abattoirs.
On average one third of Tasmania’s lamb drop (approximately 250,000 head) move to the mainland (R10b) for either processing or finishing. This movement has been historically driven by a lack of processing capacity in Tasmania. However, recent increases in capacity may reduce total lamb movement in the future.
A small number of lambs are also transported to Tasmania from the Australian mainland for fattening. In 2005/2006 there was a consignment of 5,000 head but around 500 may be a more long term average. These are very much opportunistic movements designed to take advantage of good seasonal or market conditions.
Variations in the poppy growing contract areas also influence lamb numbers going north. This year the area of poppy contracts fell and producers are putting in improved pastures under the pivot irrigators to finish lambs rather than transporting them to the mainland. This situation will reverse in years where the areas of poppy contracts are larger than normal.
Hassall & Associates Pty Ltd Page 41

Structure and Dynamics of the Australian Sheep Industry
Typical Farm Management Cycle
A summer joining with an autumn/winter lambing. Weaning in early summer with culling of rams, ewes and hoggets. Ram purchases prior to joining in for meat sires, but in spring for fine wool rams. Lambs/weaner sales usually in spring but some in autumn in poor seasons. Most of the larger fine wool annual ram sales occur in the spring. Shearing in early summer to avoid grass seed contamination of the fine wool.
Table 20 Region 11 Typical Farm
Production Sector – Region 11 TABLE B - TYPICAL FARM SRW SRM W XB TO
Numbers (Consignments) Off
Live Export To Region
Season
Feedlots To Region
Season
Saleyard 1310 (2) 755 (2) 346 (2) 1603 (3) To Region 11 11 90/10 11/10b 90/10 11/10b
Season Summer Summer Summer Summer
Abattoir To Region
Season
Property Sales 1328 (2) 750 (2) 275 (2) 1200 (2) To Region 11 11 90/10 11/10b 11
Season Summer Summer Sum/Aut Sum/Aut/Win
Total Movements off 2638 (4) 1505 (4) 621 (4) 2803 (5)
Numbers (Consignments) On
Purchases 20 (1) 10 (1) 2 (1) 605 (3) from Region 11 11 11 11
Season Summer Spring Sum/Aut Sum/Aut
Total Sheep/Farm - 30 June #
Average 7411 4042 679 3843 Max (90% confidence interval) 8044 4719 1069 5154
Min (90% confidence interval) 6778 3364 288 2533
Note 1: (Z) = No. of consignments – numbers/consignment may vary, Note 2 - xx/xx = percentage split, yy/yy = regional split.
Note 3: Region 10b: Southern high rainfall and Region 11: Tasmania. ABARE Data 2004/2005.
Hassall & Associates Pty Ltd Page 42

Structure and Dynamics of the Australian Sheep Industry
Region 12a - Western High Rainfall Geography The Western High Rainfall region follows the coast of the south-most western tip of Western Australia. Climate Australia’s south west enjoys a mild Mediterranean climate with a cool wet winter and a warm dry summer. Winter (June to August) daytime temperatures average about 16 degrees while summer (December to February) averages a comfortable 27 degrees. As a general rule, the further south, the cooler the temperature.
3.2 M Sheep on 835 properties
Pastures The coastal plains are dominated by heathlands and shrublands that support hundreds of plant species per square kilometre. Growing perennials to mitigate dryland salinity is a challenge that Western Australian farmers currently face. There are also many farmers that use lucerne-based pastures in their grazing systems. Dominant Production Sector In this region 59 per cent of the flock are used in the self-replacing wool production system. A further 30 per cent are utilised in the self-replacing meat sheep production system. The population density in this region is one of the highest, given that it has the third highest sheep population and one of the smallest land areas. The presence of exotic sheep breeds in the region is limited to hobby properties. It is unlikely that this will develop further in the future, due to the suitability of more traditional breeds to the region’s climate. Merinos are the general base of the region’s flock, with Poll Dorsets, Suffolks and Border Leicesters utilised in cross-breeding. Farm Size Farm sizes range from 30-40ha hobby properties around the densely populated areas to 2500-4000ha properties concentrating on cropping and grazing. Stocking Capacity The average stocking rate is 1 – 6 DSE/ha.
Hassall & Associates Pty Ltd Page 43

Structure and Dynamics of the Australian Sheep Industry
Table 21 Region 12a Average Farm
Production Sector – Region 12a TABLE A – AVERAGE FARM SRW SRM W XB TO
Numbers of properties 280 403 152 Movements Off per “average” farm
Live Export 41.0% 67.9% 30.6% to region 12a 12a 12a
Feedlots 2.2% 2.4% 6.9% to region 12a 12a 12a
Saleyard 20.2% 9.9% 14.2% to region 50/50 12a/12b 30/70 12a/12b 12a
Abattoir 21.1% 18.5% 44.9%
to region* 30/60/10 12a/12b/10b
30/60/10 12a/12b/10b
12a
Property Sales 15.4% 1.3% 3.4%
to region 25/24/25/25 6/8/9/10a
30/70 12a/12b
Total Movements off 1350 1573 2966 Numbers On per “average” farm Purchases 10 12 160 from region 60/40 12a/12b 60/40 12a/12b 12a
Management movements
Feed Pasture only (Prop of properties %) 20 40 20 Lamb muster frequency 4 6 6 Ewe Muster frequency 6 2 5 Ram Muster Frequency 6 5 5 Never seek agistment (Prop of properties %) 60 80 70 Season agistment sought Winter Winter Win/Sum Region agistment sought 12a 12a 12a
Note 1: xx/xx = percentage split, yy/yy = regional split. Note 2: Region 6: Northern wheat/sheep, Region 8: Eastern high rainfall, Region 9: Eastern wheat/sheep, Region 10a: Southern wheat/sheep, Region 10b: Southern high rainfall, Region 12a: Western high rainfall and Region 12b: Western wheat/sheep.
Region specific drivers
Lack of processing facilities in WA can lead to a glut of lambs and an inability of abattoirs to meet processing demand. Consequently, one major carrier has moved up to 90,000 sheep from WA to SA for slaughter in a year (the droughts in SA had lead to spare abattoir capacity). In 2005/2006 the total number of WA lambs (R12a + R12b) processed in SA reached 250,000 (Jack Langberg PIRSA pers comm.) This was an exceptional year with a very good season in WA, a poor season in SA and record lamb prices to cover the additional freight. In an average year this number is closer to 100,000 lambs.
Movement of sheep to SA for slaughter usually occurs in the spring through to summer.
During periods of recovery from drought or when strong seasonal differences exist between the eastern and western states, a spike in the price of store sheep might see up to 50,000 re-stocker sheep move from WA (R12a + R12b) to region 9 for sale in saleyards. (John Knight pers comm. Wagga Wagga Saleyards). A longer term average movement would be around 25,000 sheep.
Hassall & Associates Pty Ltd Page 44

Structure and Dynamics of the Australian Sheep Industry
Typical Farm Management Cycle
Late spring joining with a winter lambing. Weaning in spring with culling of rams, ewes and hoggets. Ram purchases in the spring. Lambs/weaner sales vary with climate & season but are usually in spring or autumn. Most of the larger annual ram sales occur in the spring. Shearing tends to be in summer with a special shearing before Christmas to sell the culls.
Table 22 Region 12a Typical Farm
Production Sector – Region 12a TABLE B - TYPICAL FARM SRW SRM W XB TO
Numbers (Consignments) Off
Live Export 934 (2) 470 (2) 534 (2) To Region 12a 12a 12a
Season Spr/Sum Spr/Sum Spr/Sum
Feedlots 248 (1) 918 (1) To Region 12a 12a
Season Spring Spring
Saleyard 128 (2) 239 (2) 276 (2) To Region 50/50 12a/12b 30/70 12a/12b 12a
Season Summer Spring Spring
Abattoir 278 (2) 616 (2) 1238 (2) To Region 30/60/10
12a/12b/10b 30/60/10
12a/12b/10b 12a
Season Summer Spring Spr/Sum
Property Sales 10 (1) To Region 25/24/25/25
6/8/9/10a
Season Spring
Total Movements off 1350 (7) 1573 (7) 2966 (7)
Numbers (Consignments) On
Purchases 10 (1) 12 (1) 160 (3) from Region 60/40 12a/12b 60/40 12a/12b 12a
Season Spr/Sum Spr/Sum Spring
Total Sheep/Farm - 30 June #
Average 3702 3363 3688 Max (90% confidence interval) 4116 3994 4261
Min (90% confidence interval) 3288 2731 3115
Note 1: (Z) = Number of consignments – numbers per consignment may vary, Note 2 - xx/xx = percentage split, yy/yy = regional split.
Note 3: Region 6: Northern wheat/sheep, Region 8: Eastern high rainfall, Region 9: Eastern wheat/sheep, Region 10a: Southern wheat/sheep, Region 10b: Southern high rainfall, Region 12a: Western high rainfall and Region 12b: Western wheat/sheep.
ABARE Data 2004/2005.
Hassall & Associates Pty Ltd Page 45
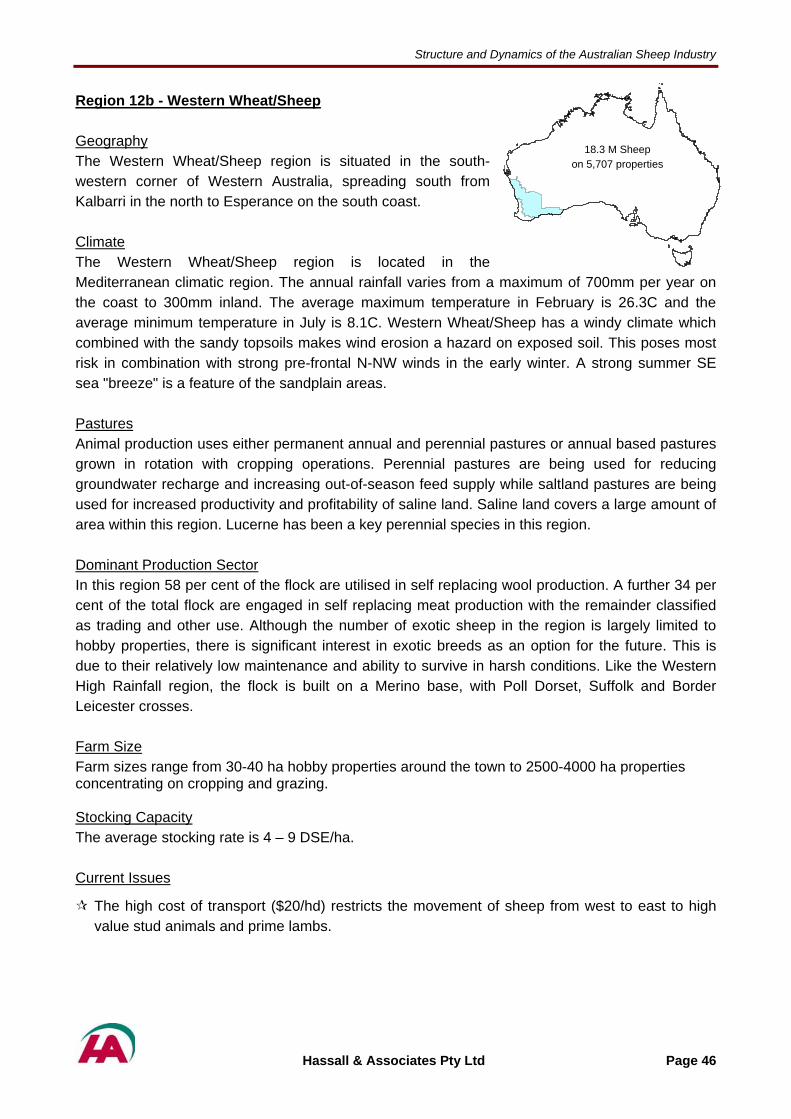
Structure and Dynamics of the Australian Sheep Industry
Region 12b - Western Wheat/Sheep Geography The Western Wheat/Sheep region is situated in the south-western corner of Western Australia, spreading south from Kalbarri in the north to Esperance on the south coast. Climate The Western Wheat/Sheep region is located in the Mediterranean climatic region. The annual rainfall varies from a maximum of 700mm per year on the coast to 300mm inland. The average maximum temperature in February is 26.3C and the average minimum temperature in July is 8.1C. Western Wheat/Sheep has a windy climate which combined with the sandy topsoils makes wind erosion a hazard on exposed soil. This poses most risk in combination with strong pre-frontal N-NW winds in the early winter. A strong summer SE sea "breeze" is a feature of the sandplain areas.
18.3 M Sheep on 5,707 properties
Pastures Animal production uses either permanent annual and perennial pastures or annual based pastures grown in rotation with cropping operations. Perennial pastures are being used for reducing groundwater recharge and increasing out-of-season feed supply while saltland pastures are being used for increased productivity and profitability of saline land. Saline land covers a large amount of area within this region. Lucerne has been a key perennial species in this region. Dominant Production Sector In this region 58 per cent of the flock are utilised in self replacing wool production. A further 34 per cent of the total flock are engaged in self replacing meat production with the remainder classified as trading and other use. Although the number of exotic sheep in the region is largely limited to hobby properties, there is significant interest in exotic breeds as an option for the future. This is due to their relatively low maintenance and ability to survive in harsh conditions. Like the Western High Rainfall region, the flock is built on a Merino base, with Poll Dorset, Suffolk and Border Leicester crosses. Farm Size Farm sizes range from 30-40 ha hobby properties around the town to 2500-4000 ha properties concentrating on cropping and grazing. Stocking Capacity The average stocking rate is 4 – 9 DSE/ha. Current Issues
The high cost of transport ($20/hd) restricts the movement of sheep from west to east to high value stud animals and prime lambs.
Hassall & Associates Pty Ltd Page 46

Structure and Dynamics of the Australian Sheep Industry
Table 23 Region 12b Average Farm
Production Sector – Region 12b TABLE A – AVERAGE FARM SRW SRM W XB TO
Numbers of properties 3069 1889 749 Movements Off per “average” farm
Live Export 40.7% 61.3% 36.0% to region 12a 12a 12a
Feedlots 1.3% 1.0% 11.5% to region 12a 12a 12a
Saleyard 21.4% 13.1% 17.8% to region 50/50 12a/12b 20/80 12a/12b 12a
Abattoir 23.9% 22.7% 31.9%
to region* 12a 30/60/10 12a/12b/10b
12a
Property Sales 12.6% 1.8% 2.9% to region 50/50 12a/12b 20/80 12a/12b 50/50 12a/12b
Total Movements off 2999 1240 1224 Numbers On per “average” farm Purchases 20 10 406 from region 80/20 12a/12b 80/20 12a/12b 12a
Management movements
Feed Pasture only (Prop of properties %) 10 30 20 Lamb muster frequency 5 5 6 Ewe Muster frequency 5 2 5 Ram Muster Frequency 5 5 5 Never seek agistment (Prop of properties %) 60 80 70 Season agistment sought Winter Winter Win/Sum Region agistment sought 12a 12a 12a/12b
Note 1: xx/xx = percentage split, yy/yy = regional split. Note 2: Region 10b: Southern high rainfall, Region 12a: Western high rainfall and Region 12b: Western wheat/sheep.
Region specific drivers
A lack of processing facilities in WA can lead to a glut of lambs and the inability of abattoirs to meet processing demand. One major carrier has moved up to 90,000 sheep from WA to SA for slaughter in a year (droughts in SA had lead to spare abattoir capacity). In 2005/2006 the total number of WA lambs (R12a + R12b) processed in SA reached 250,000 (Jack Langberg PIRSA pers comm.) This was an exceptional year with a very good season in WA, a poor season in SA and record lamb prices to cover the additional freight. In an average year this number is more like 100,000 lambs.
Movement of sheep to SA for slaughter usually occurs in the spring through to summer.
During periods of recovery from drought or when strong seasonal differences exist between the eastern and western states, a spike in the price of store sheep might see up to 50,000 re-stocker sheep move from WA (R12a + R12b) to Region 9 for sale in saleyards. (John Knight pers comm. Wagga Wagga Saleyards). A longer term average movement would be around 25,000 sheep.
There is a significant live export trade in this region.
Hassall & Associates Pty Ltd Page 47
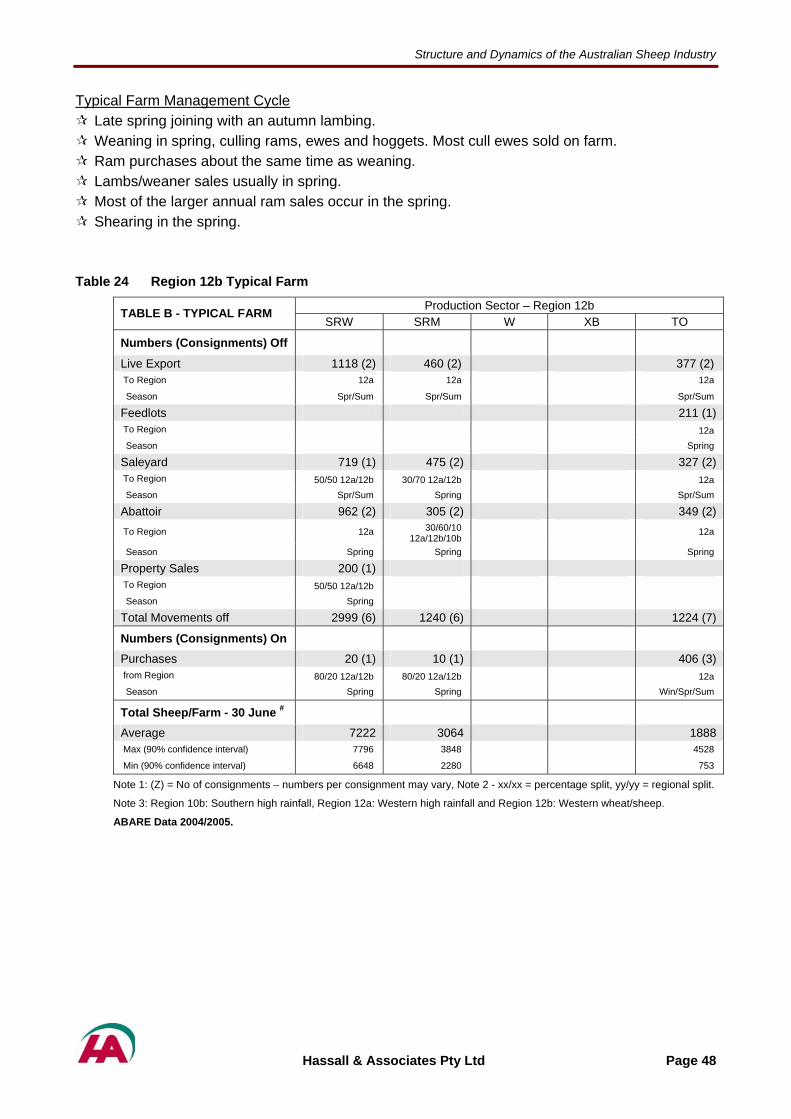
Structure and Dynamics of the Australian Sheep Industry
Typical Farm Management Cycle Late spring joining with an autumn lambing. Weaning in spring, culling rams, ewes and hoggets. Most cull ewes sold on farm. Ram purchases about the same time as weaning. Lambs/weaner sales usually in spring. Most of the larger annual ram sales occur in the spring. Shearing in the spring.
Table 24 Region 12b Typical Farm
Production Sector – Region 12b TABLE B - TYPICAL FARM SRW SRM W XB TO
Numbers (Consignments) Off
Live Export 1118 (2) 460 (2) 377 (2) To Region 12a 12a 12a
Season Spr/Sum Spr/Sum Spr/Sum
Feedlots 211 (1) To Region 12a Season Spring
Saleyard 719 (1) 475 (2) 327 (2) To Region 50/50 12a/12b 30/70 12a/12b 12a Season Spr/Sum Spring Spr/Sum
Abattoir 962 (2) 305 (2) 349 (2) To Region 12a 30/60/10
12a/12b/10b 12a
Season Spring Spring Spring
Property Sales 200 (1) To Region 50/50 12a/12b
Season Spring
Total Movements off 2999 (6) 1240 (6) 1224 (7)
Numbers (Consignments) On
Purchases 20 (1) 10 (1) 406 (3) from Region 80/20 12a/12b 80/20 12a/12b 12a Season Spring Spring Win/Spr/Sum
Total Sheep/Farm - 30 June #
Average 7222 3064 1888 Max (90% confidence interval) 7796 3848 4528
Min (90% confidence interval) 6648 2280 753
Note 1: (Z) = No of consignments – numbers per consignment may vary, Note 2 - xx/xx = percentage split, yy/yy = regional split.
Note 3: Region 10b: Southern high rainfall, Region 12a: Western high rainfall and Region 12b: Western wheat/sheep.
ABARE Data 2004/2005.
Hassall & Associates Pty Ltd Page 48
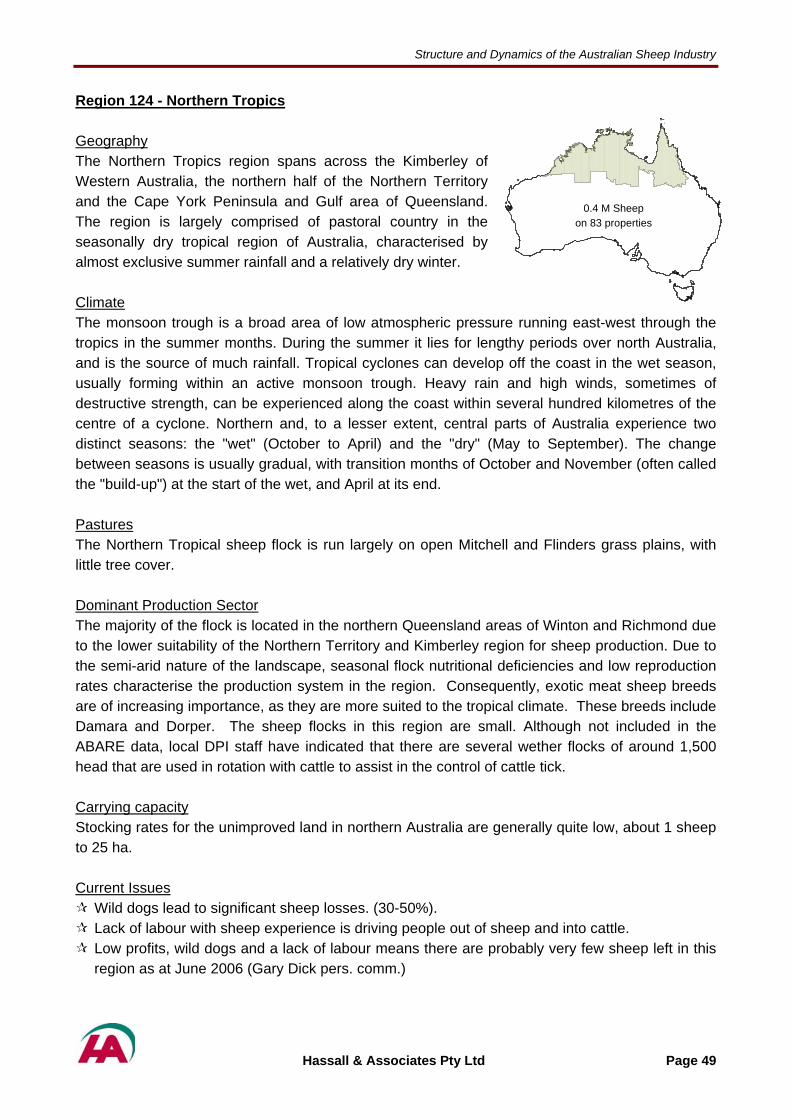
Structure and Dynamics of the Australian Sheep Industry
Region 124 - Northern Tropics
0.4 M Sheep on 83 properties
Geography The Northern Tropics region spans across the Kimberley of Western Australia, the northern half of the Northern Territory and the Cape York Peninsula and Gulf area of Queensland. The region is largely comprised of pastoral country in the seasonally dry tropical region of Australia, characterised by almost exclusive summer rainfall and a relatively dry winter. Climate The monsoon trough is a broad area of low atmospheric pressure running east-west through the tropics in the summer months. During the summer it lies for lengthy periods over north Australia, and is the source of much rainfall. Tropical cyclones can develop off the coast in the wet season, usually forming within an active monsoon trough. Heavy rain and high winds, sometimes of destructive strength, can be experienced along the coast within several hundred kilometres of the centre of a cyclone. Northern and, to a lesser extent, central parts of Australia experience two distinct seasons: the "wet" (October to April) and the "dry" (May to September). The change between seasons is usually gradual, with transition months of October and November (often called the "build-up") at the start of the wet, and April at its end. Pastures The Northern Tropical sheep flock is run largely on open Mitchell and Flinders grass plains, with little tree cover. Dominant Production Sector The majority of the flock is located in the northern Queensland areas of Winton and Richmond due to the lower suitability of the Northern Territory and Kimberley region for sheep production. Due to the semi-arid nature of the landscape, seasonal flock nutritional deficiencies and low reproduction rates characterise the production system in the region. Consequently, exotic meat sheep breeds are of increasing importance, as they are more suited to the tropical climate. These breeds include Damara and Dorper. The sheep flocks in this region are small. Although not included in the ABARE data, local DPI staff have indicated that there are several wether flocks of around 1,500 head that are used in rotation with cattle to assist in the control of cattle tick. Carrying capacity Stocking rates for the unimproved land in northern Australia are generally quite low, about 1 sheep to 25 ha. Current Issues
Wild dogs lead to significant sheep losses. (30-50%). Lack of labour with sheep experience is driving people out of sheep and into cattle. Low profits, wild dogs and a lack of labour means there are probably very few sheep left in this region as at June 2006 (Gary Dick pers. comm.)
Hassall & Associates Pty Ltd Page 49

Structure and Dynamics of the Australian Sheep Industry
Table 25 Region 124 Average Farm
Production Sector – Region 124 TABLE A – AVERAGE FARM SRW SRM W* XB TO
Numbers of properties 83 N/A Movements Off per “average” farm
Live Export to region
Feedlots to region
Saleyard to region
Abattoir 73.9% 100.0% to region* 6 6
Property Sales 26.1% to region 6
Total Movements off 3442 560 Numbers On per “average” farm Purchases 34 575 from region 6 6
Management movements
Feed Pasture only (Prop of properties %) 20 100 Lamb muster frequency 3 Ewe Muster frequency 2 1 Ram Muster Frequency 2 Never seek agistment (Prop of properties %) 50 100 Season agistment sought Winter Region agistment sought 6
Note 1: xx/xx = percentage split, yy/yy = regional split. Note 2: Region 6: Northern wheat/sheep. Note: No ABARE Data – Experts assumptions where possible.
Region specific drivers
The risk of Bluetongue disease spreading into the region’s cattle population and consequently affecting exports is a reason for the low number of sheep in the region.
Hassall & Associates Pty Ltd Page 50
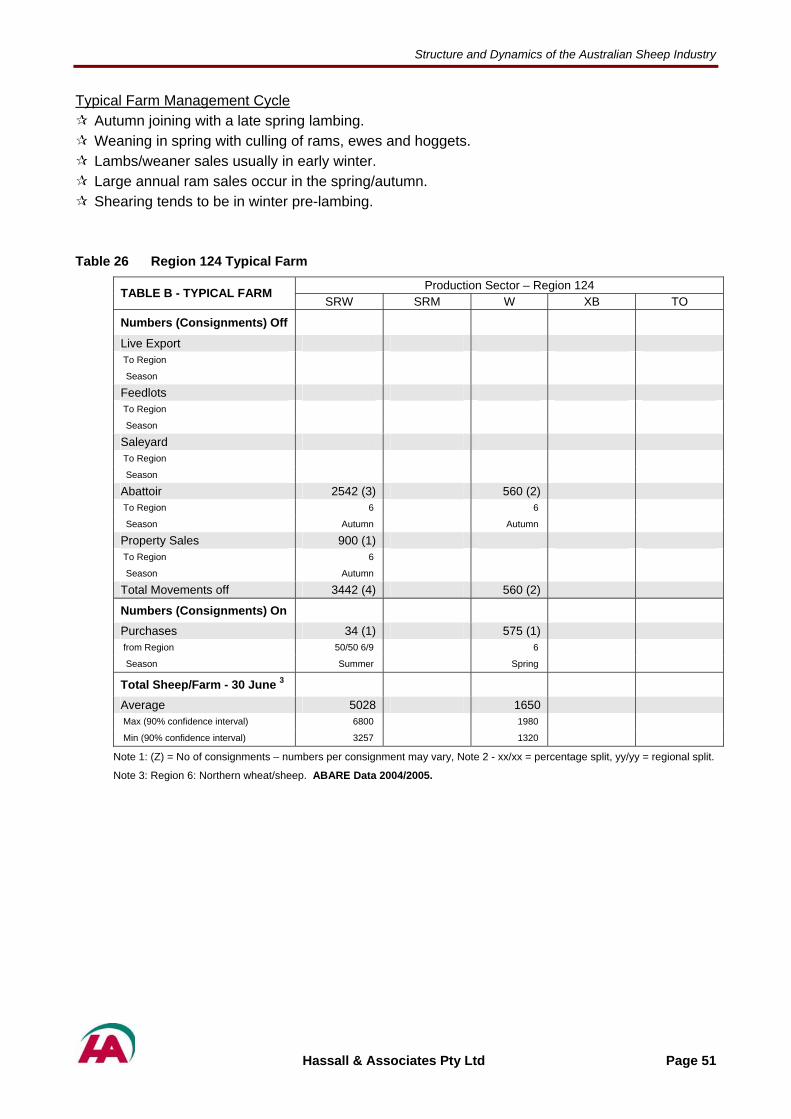
Structure and Dynamics of the Australian Sheep Industry
Typical Farm Management Cycle Autumn joining with a late spring lambing. Weaning in spring with culling of rams, ewes and hoggets. Lambs/weaner sales usually in early winter. Large annual ram sales occur in the spring/autumn. Shearing tends to be in winter pre-lambing.
Table 26 Region 124 Typical Farm
Production Sector – Region 124 TABLE B - TYPICAL FARM SRW SRM W XB TO
Numbers (Consignments) Off
Live Export To Region
Season
Feedlots To Region
Season
Saleyard To Region
Season
Abattoir 2542 (3) 560 (2) To Region 6 6
Season Autumn Autumn
Property Sales 900 (1) To Region 6
Season Autumn
Total Movements off 3442 (4) 560 (2)
Numbers (Consignments) On
Purchases 34 (1) 575 (1) from Region 50/50 6/9 6
Season Summer Spring
Total Sheep/Farm - 30 June 3
Average 5028 1650 Max (90% confidence interval) 6800 1980
Min (90% confidence interval) 3257 1320
Note 1: (Z) = No of consignments – numbers per consignment may vary, Note 2 - xx/xx = percentage split, yy/yy = regional split.
Note 3: Region 6: Northern wheat/sheep. ABARE Data 2004/2005.
Hassall & Associates Pty Ltd Page 51
Structure and Dynamics of the Australian Sheep Industry
Hassall & Associates Pty Ltd Page 52
Structure and Dynamics of the Australian Sheep Industry
4 NATIONAL SHEEP MOVEMENTS
4.1 Introduction
A range of seasonal, sociological & financial considerations influence the patterns of movement of sheep. In understanding the movements of sheep it is helpful to consider:
1. the key factors that influence the numbers and timing of sheep turnoff from a farm 2. the mechanisms by which sheep are sold, transferred and moved between farms or to
abattoirs.
4.2 Key factors influencing turnoff numbers and timing
The key factors which influence the timing and numbers of sheep turned off any farm are market signals, seasonal conditions and management expertise. These factors also influence the number of properties running sheep enterprises and the number of sheep on each farm. Wool and Lamb prices – The largest impact will be on turnoff numbers from each farm. Wool and lamb prices are especially important on mixed wheat sheep properties and when prices are low producers will devote less of their management time and dollars to nutrition, disease and parasite management which in turn reduces weaning percentages and turn off numbers. Currently, lamb and beef prices are double or in some cases triple the long term averages so there is some pressure to get out of SRW sheep and into beef or SRM sheep where environmental conditions or infrastructure such as cattle yards exist. High prices mean higher turn off numbers and justification for more movement to a finishing farm or feedlot.
Enterprise change – Personal preferences and the costs associated with major changes in the enterprise mix are significant factors that will limit significant changes in turnoff numbers or timing. The SRW sector is quite dynamic and when wool prices are high more management attention is devoted to wool and when lamb prices are high more attention is devoted to sale carcass. Tradition and conservative management reduce major swings in enterprise mix or management.
Seasonal conditions – Favourable seasonal conditions will lead to higher ewe fertility and weaning percentages and vice versa. In poor seasons or drought movements increase initially as producers sell down stock. Recovery from drought may see a spike in movement as producers restock. The impact on the timing of sales will be quite low.
Breed of sheep – A swing into more breeds like the Dorper would influence turnoff numbers more so than the timing of turnoff. Exotic breeds like the Dorper are capable of weaning 150% lambs (100 ewes with 150 lambs at weaning), Crossbreds in the order of 110% and Merinos 85%. The Dorper weaning percentage indicates the increased fertility as well as the excellent mothering capabilities of this breed.
Pasture productivity – Large areas of the pastoral region (R3) are suitable for breeding and wool production but are not reliably productive for lamb finishing. Economics may make it feasible to sell lambs from these regions earlier for finishing on other farms with more productive pastures or feedlots. Generally these farms will be in Regions 9 or 10b.
Hassall & Associates Pty Ltd Page 53
Structure and Dynamics of the Australian Sheep Industry
Personal preference & management – Personal preference, management and farm structure (enterprise mix, numbers of farms owned) will influence the timing of sheep sold, bought or moved to another farm.
Running down or building flock numbers – If producers decide to move into more cattle and cropping and less sheep then annual turnoff numbers will be higher and vice versa.
4.3 National patterns & drivers
National patterns are driven largely by economics given the small profit margin per sheep. In turn, proximity to marketing outlets, market price signals and personal preference will influence movement patterns.
West to East - Prime lamb and stud sheep from WA (Regions 12a & 12b) move to the eastern states – around 100,000 prime lambs annually, nearly all to abattoirs. Up to 25,000 store lambs also move to Wagga Wagga (Region 9) for sale in this region in an average year. Actual numbers will be very dependent on relative seasonal conditions. Movement is driven by marketing to a price advantage and the lack of prime lamb processing facilities in the west.
East to West - There is very limited movement east to west and this is restricted to mainly stud stock.
North to South – The general movement of sheep in the eastern states is from north to south – driven by access to the major saleyard and abattoir facilities. Restocker sheep also move from Queensland into NSW given differentials in seasonal conditions.
South to North – Store lambs move from Region 11 to Region 10b and numbers are driven by relative seasonal conditions, prices and a lack of processing capacity. Around 250,000 lambs (or one third of the Tasmanian lamb drop) move on average during the summer months. These movements are facilitated by the Bass Strait stock transportation subsidy and are contingent on seasonal conditions being different between Victoria and Tasmania.
4.4 Mechanisms of movement
Given the importance of self replacing sheep sectors in the Australian sheep population and the preference to purchase rams from sheep studs, the location and number of rams sold will have a major impact on where sheep move around the country. Transport to saleyards, abattoirs, shows, live export ports, other farms, feedlots and agistment are other movement mechanisms. Merino Sheep Studs - Although the number of rams required per farm is small (e.g. 2 rams per 100 ewes joined) movement of rams from studs to breeders will be significant across the country given that most flocks (except pure trading and wethers) will usually purchase some rams each year. Average ram sale numbers over the period 2002 to 2004 were 105, 815 stud rams from 1,038 stud Merino ram producers (Australian Stud Merino Breeders Association). Details behind this figure are presented in Appendix 1.
Hassall & Associates Pty Ltd Page 54
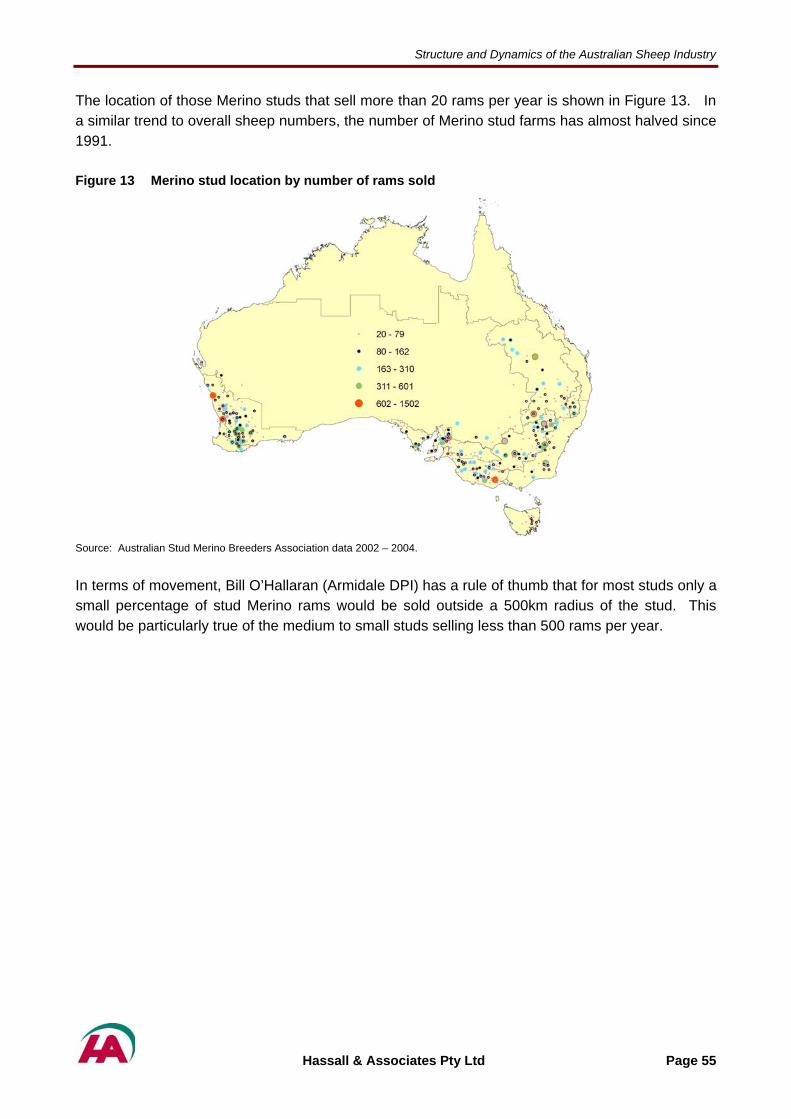
Structure and Dynamics of the Australian Sheep Industry
The location of those Merino studs that sell more than 20 rams per year is shown in Figure 13. In a similar trend to overall sheep numbers, the number of Merino stud farms has almost halved since 1991. Figure 13 Merino stud location by number of rams sold
Source: Australian Stud Merino Breeders Association data 2002 – 2004.
In terms of movement, Bill O’Hallaran (Armidale DPI) has a rule of thumb that for most studs only a small percentage of stud Merino rams would be sold outside a 500km radius of the stud. This would be particularly true of the medium to small studs selling less than 500 rams per year.
Hassall & Associates Pty Ltd Page 55
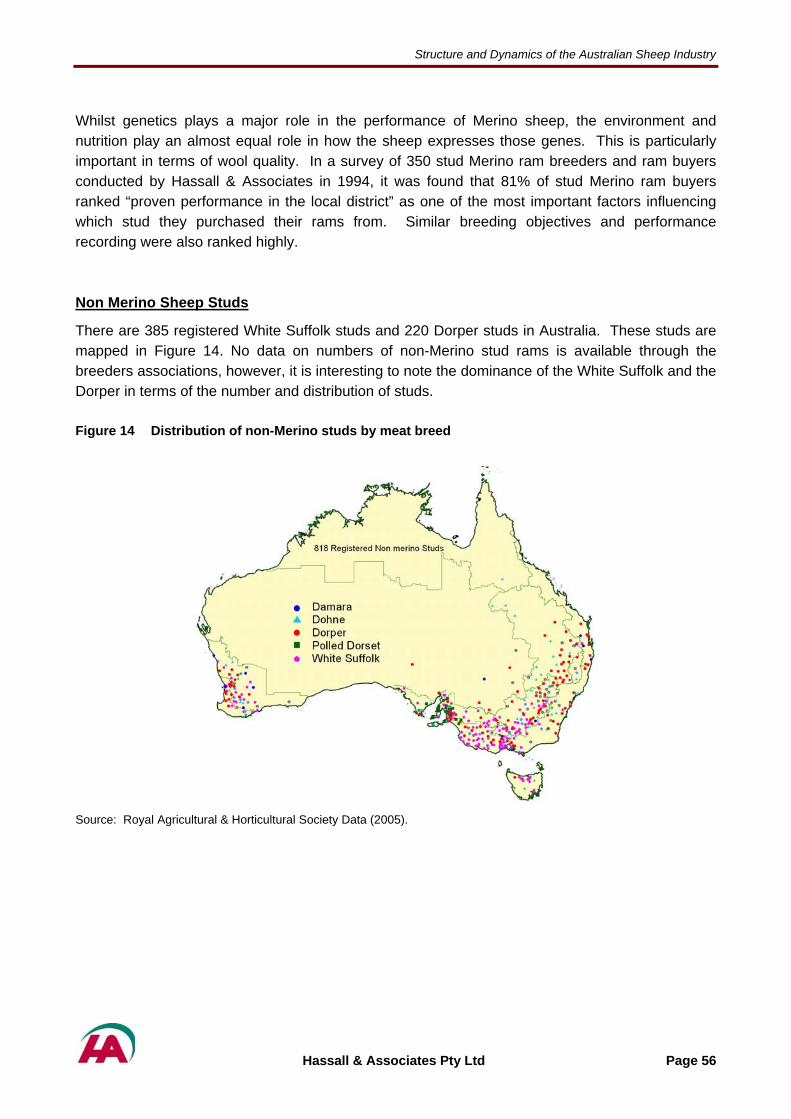
Structure and Dynamics of the Australian Sheep Industry
Whilst genetics plays a major role in the performance of Merino sheep, the environment and nutrition play an almost equal role in how the sheep expresses those genes. This is particularly important in terms of wool quality. In a survey of 350 stud Merino ram breeders and ram buyers conducted by Hassall & Associates in 1994, it was found that 81% of stud Merino ram buyers ranked “proven performance in the local district” as one of the most important factors influencing which stud they purchased their rams from. Similar breeding objectives and performance recording were also ranked highly. Non Merino Sheep Studs
There are 385 registered White Suffolk studs and 220 Dorper studs in Australia. These studs are mapped in Figure 14. No data on numbers of non-Merino stud rams is available through the breeders associations, however, it is interesting to note the dominance of the White Suffolk and the Dorper in terms of the number and distribution of studs. Figure 14 Distribution of non-Merino studs by meat breed
Source: Royal Agricultural & Horticultural Society Data (2005).
Hassall & Associates Pty Ltd Page 56
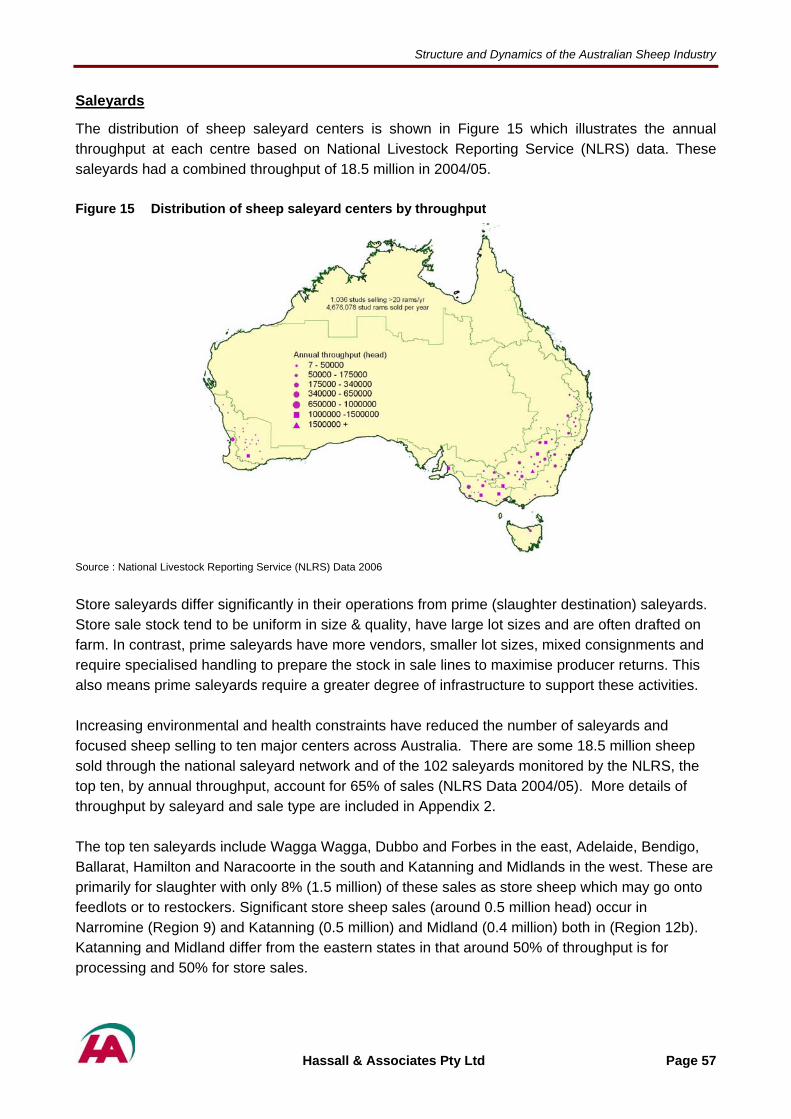
Structure and Dynamics of the Australian Sheep Industry
Saleyards
The distribution of sheep saleyard centers is shown in Figure 15 which illustrates the annual throughput at each centre based on National Livestock Reporting Service (NLRS) data. These saleyards had a combined throughput of 18.5 million in 2004/05. Figure 15 Distribution of sheep saleyard centers by throughput
Source : National Livestock Reporting Service (NLRS) Data 2006
Store saleyards differ significantly in their operations from prime (slaughter destination) saleyards. Store sale stock tend to be uniform in size & quality, have large lot sizes and are often drafted on farm. In contrast, prime saleyards have more vendors, smaller lot sizes, mixed consignments and require specialised handling to prepare the stock in sale lines to maximise producer returns. This also means prime saleyards require a greater degree of infrastructure to support these activities. Increasing environmental and health constraints have reduced the number of saleyards and focused sheep selling to ten major centers across Australia. There are some 18.5 million sheep sold through the national saleyard network and of the 102 saleyards monitored by the NLRS, the top ten, by annual throughput, account for 65% of sales (NLRS Data 2004/05). More details of throughput by saleyard and sale type are included in Appendix 2. The top ten saleyards include Wagga Wagga, Dubbo and Forbes in the east, Adelaide, Bendigo, Ballarat, Hamilton and Naracoorte in the south and Katanning and Midlands in the west. These are primarily for slaughter with only 8% (1.5 million) of these sales as store sheep which may go onto feedlots or to restockers. Significant store sheep sales (around 0.5 million head) occur in Narromine (Region 9) and Katanning (0.5 million) and Midland (0.4 million) both in (Region 12b). Katanning and Midland differ from the eastern states in that around 50% of throughput is for processing and 50% for store sales.
Hassall & Associates Pty Ltd Page 57
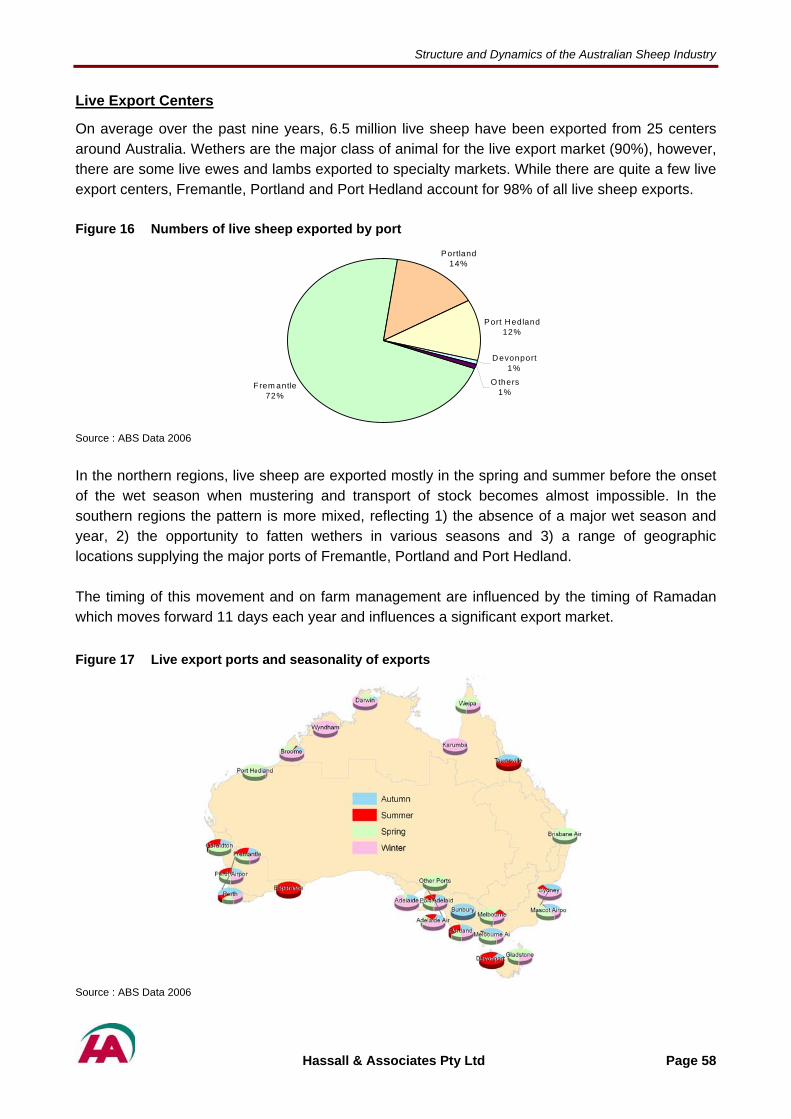
Structure and Dynamics of the Australian Sheep Industry
Live Export Centers
On average over the past nine years, 6.5 million live sheep have been exported from 25 centers around Australia. Wethers are the major class of animal for the live export market (90%), however, there are some live ewes and lambs exported to specialty markets. While there are quite a few live export centers, Fremantle, Portland and Port Hedland account for 98% of all live sheep exports. Figure 16 Numbers of live sheep exported by port
Frem antle72%
Portland14%
Port Hedland12%
Devonport1%
O thers1%
Source : ABS Data 2006
In the northern regions, live sheep are exported mostly in the spring and summer before the onset of the wet season when mustering and transport of stock becomes almost impossible. In the southern regions the pattern is more mixed, reflecting 1) the absence of a major wet season and year, 2) the opportunity to fatten wethers in various seasons and 3) a range of geographic locations supplying the major ports of Fremantle, Portland and Port Hedland. The timing of this movement and on farm management are influenced by the timing of Ramadan which moves forward 11 days each year and influences a significant export market.
Figure 17 Live export ports and seasonality of exports
Source : ABS Data 2006
Hassall & Associates Pty Ltd Page 58

Structure and Dynamics of the Australian Sheep Industry
Abattoirs
ABARE is forecasting 27 million sheep and lambs to be processed in 2005/06, almost 50% of this total would be processed at the ten largest factories scattered through Regions 8, 9, 10a, 10b, 12a and 12b.
Figure 18 Sheep abattoir location & throughput
Hassall & Associates Pty Ltd Page 59

Structure and Dynamics of the Australian Sheep Industry
Shows
There are eight Royal Agricultural Society shows held in each capital city across Australia every year. These shows gain exhibitors from many different areas of Australia. Table 27 shows the timing of the show as well as the region that the sheep come from in order to attend the show.
Table 27 Timing of shows and the regions that participate.
Month Show location Participates (Regions) Number of sheep
February Canberra 8, 9, 10a and 10b 526
March Sydney 3, 8, 9 and 10b 300 merinos 400 dual purpose
July Darwin 124 Not available
August Brisbane 5,6,7,8 and 9
September Adelaide 3, 10a and 10b
September Melbourne 3, 8, 9, 10a, 10b, 12a and 12
September Perth 10b, 12a and 12b
October Hobart 11
Source : Various Show Society Data
Breeding & Finishing
Traditionally, SRW Merino flocks have been run in the pastorawool, with CFA rams/ewes and surplus young sheep sold into 10a and 12b). MLA and DPI (NSW) are encouraging sheepbreeding sheep and selling young weaners (12 to 14 weeks)regions for finishing or to feedlots.
High lamb prices have made it economic to transport lambs aexercise. This can be a higher risk production strategy and lonon the relative prices of wool, lamb, mutton and replacement e
The ultimate impact of this strategy on sheep movements is dithat breeding/finishing will raise weaning percentages and alloturn this should increase the number of young sheep moving movements will be around nine months earlier in the season.
As Region 3 has only around 7% of the national flock, the tsmall. It may increase the proportion of movement that is betw
Hassall & Associates Pty Ltd
Not available
Not available
b 750
Not available
250 - 300
l region (Region 3) primarily for their the wheat/sheep regions (Regions 9, producers in region 3 to focus on into the more reliable wheat/sheep
nd provide a margin for the finishing g term profitability will be dependent wes.
fficult to predict. There is consensus w more ewes to be run per farm. In into Regions 9, 10a and 12b. These
otal scale of movement is relatively een farms rather than to abattoirs.
Page 60

Structure and Dynamics of the Australian Sheep Industry
Feedlots
Feedlots are generally located in the wheat/sheep region (Regions 6, 9, 10a & 12b). In good seasons they source most of their sheep from surplus young stock within the region. In poor seasons they need to source a greater proportion from Region 3. In Regions 7 and 8 the sheep are generally not suitable for feedlots as they are usually smaller framed, specialist fine wool sheep and producers are not keen to join them to a terminal sire in order to produce a more suitable lamb for the feedlot.
While lamb prices are high and grain prices are low, feedlots will provide a mechanism to move young sheep. In good seasons this movement will be predominantly intra-regional, with more inter- regional movement in the poor seasons.
Agistment
Agistment is not often used by sheep producers to provide feed for their stock in droughts or poor seasons. On average, across all regions and production sectors, 85% of sheep producers never agist their stock. The cost of transport and the actual cost of the agistment is often greater than the profit margin involved. There are also some concerns of OJD or footrot infecting their sheep during agistment (predominately to Region 8). The direction sheep move for agistment will depend greatly on significant seasonal differences between regions. Agistment of sheep is not a mechanism frequently used for moving sheep.
Hassall & Associates Pty Ltd Page 61

Structure and Dynamics of the Australian Sheep Industry
4.5 Conclusions
Sheep movements are mostly restricted to a 200km radius from where they were born and bred. This is largely due to there being generally a small profit margin per sheep and producers’ inability to economically justify moving sheep large distances. Other factors such as performance of bloodline in the local region and preference for same day purchase and arrival of sheep contribute to reasons why sheep tend not to move very far. For stud animals, this radius of movement might be extended to 500km as there are fewer animals to move, the producer may be able to transport them with farm vehicles and the economics of transport can be justified. Sheep movements in terms of size and timing are driven primarily by the type of production sector involved. Because 78% of the sheep in the national flock are involved in self replacing breeding systems, the only movements onto the properties will be stud rams and the only movement off the properties will be CFA rams and ewes and surplus young sheep (hoggets or lambs). In terms of percentages of ewes in a SRW farm flock joined this would mean:
0.05% rams moving onto the farm 18% cull sheep 64% young surplus sheep leaving the farm.
These proportions will vary predominantly with weaning percentages which in turn are driven by nutrition and genetics. Droughts, recovery from droughts and large seasonal differentials will significantly increase the distances and number of sheep moved compared to a “normal” season. For example, lamb movements from WA (R12a & 12b) to SA are up by 250% from 100,000 to 250,000 (2005/06) due to a strong seasonal differential and spare processing capacity in SA. These factors drive the economics of the sale/purchase so that larger margins cover the increased travel costs. High value sheep, transport efficiencies (such as B-doubles) and favourable commodity prices will also increase the distances sheep move. The spatial distribution and the number of sheep sold from sheep studs, saleyards and live export centers will also impact on the size and number of consignments. The decline in the number of sheep studs and abattoirs and the increasing popularity of on-farm auction technology such as “Auctions Plus” (an internet based system) may increase the distances sheep move in the future.
Hassall & Associates Pty Ltd Page 62
Structure and Dynamics of the Australian Sheep Industry
Hassall & Associates Pty Ltd Page 63
Structure and Dynamics of the Australian Sheep Industry
5 REFERENCES ABARE (2005a), Australian Commodity Statistics, Location: www.abare.gov.au
ABARE (2005b), Sheep composition, by production system, Australia & by Regional Zone 2004/05. Location: www.abare.gov.au
ABARE (2004), Australian Lamb 04.2, November Bureau of Meteorology (2006), Climate Averages. Location: www.bom.gov.au Commonwealth Department of Agriculture, Fisheries and Forestry (2006), Snapshot of the Livestock Export Industry. Location: http://www.affa.gov.au/content/output.cfm?ObjectID=E1B75863-343D-48A0-9CC388B4F451F899
Commonwealth Department of the Environment and Heritage (2006), Australia’s 15 National Biodiversity Hotspots. Location: http://www.deh.gov.au/biodiversity/hotspots/facts.html
Commonwealth Department of the Environment and Heritage (2003), Bushcare Support 2003: Native Vegetation Management. Location: http://www.deh.gov.au/land/publications/nvm-nsw-act/pubs/nsw-act-central-west.pdf
Hassall & Associates (1994) “An electronic register of Stud Merino ram breeders” Wool Research & Development Corporation (WRDC) Government of South Australia (2006), Atlas of South Australia. Location: http://www.atlas.sa.gov.au/go/resources/atlas-of-south-australia-1986/regional-areas/south-east
Murray Catchment Authority (2006), The Catchment. Location: http://www.murray.cma.nsw.gov.au/catchment.html
Murrumbidgee Catchment Management Authority (2006), Native vegetation in the Murrumbidgee Catchment. Location: http://www.murrumbidgee.cma.nsw.gov.au/11.0.html
National Farmers Federation (1991), Australian Agriculture: the complete reference guide, Morescope Pty Ltd, Victoria. National Parks Association of New South Wales (2006), Bioregions of Coastal New South Wales. Location: http://www.npansw.org.au/web/journal/200002/Febbioregions.htm
New South Wales Department of Primary Industries (2006), Ovine Johne's Disease. Location: http://www.agric.nsw.gov.au/reader/ojd
Hassall & Associates Pty Ltd Page 64

Structure and Dynamics of the Australian Sheep Industry
Northern Tasmania Development (2006), The Agriculture Industry. Location: http://www.northerntasmania.info/invest/agriculture.html
Parks & Wildlife Service Tasmania (2006), Plants of Tasmania. Location: http://www.parks.tas.gov.au/veg/grassland/index.html
Queensland Department of Primary Industries & Fisheries (2006), The Sheep and Wool Industry in Queensland. Location: http://www2.dpi.qld.gov.au/sheep/7925.html
Rural Workforce Support (2006), Tasmanian GP Atlas. Location: http://www.gpatlas.org.au/subsector.php?id=108348
Tasmanian Department of Primary Industries, Water and Environment (2006), Sheep. Location: http://www.dpiwe.tas.gov.au/inter.nsf/ThemeNodes/EGIL-534748?open
Tasmanian Department of Primary Industries, Water and Environment (2006), Wool. Location: http://www.dpiwe.tas.gov.au/inter.nsf/WebPages/EGIL-5HU344?open Tourism Tasmania (2006), About Tasmania: climate. Location: http://www.discovertasmania.com/home/index.cfm?SiteID=110
Tourism Tasmania (2006), What makes Tasmania different. Location: http://www.discovertasmania.com.au/home/tasmedia_index.cfm?level1=story%20leads&level2=what%20makes%20tas%20different&tasdifferentid=5
University of New England (2006), Kirby Pastures 3: Recommended Species of the Northern Tablelands. Location: http://www.une.edu.au/agronomy/pastures/teaching/units/agro321/kirbypastassess/3.htm
Victorian Department of Sustainability and Environment (2006), Victorian Midlands. Location: http://www.dse.vic.gov.au/dse/nrence.nsf/LinkView/C489566555FD713BCA256EEC000735661C26CB3A9ABC1C2FCA256EE700148D0B
World Wildlife Fund (2006), Southwestern Australia Forests and Scrub, Location: http://www.panda.org/about_wwf/where_we_work/ecoregions/swaustralia_forests_scrub.cfm
Hassall & Associates Pty Ltd Page 65

Structure and Dynamics of the Australian Sheep Industry
APPENDIX 1 – TOP 140 STUD MERINO RAM DATA Source : Australian Stud Merino Breeders Association (ASMBA) Data
Rank Stud Name 2002 2003 2004 % Change Average Posctode Region Region ID1 The Grange 2000 1990 1347 -33 1779 6069 Western High Rainfall 12a2 Egelabra 1967 1249 1289 -34 1502 2824 Northern Wheat/sheep 63 Hazeldean 1551 1385 1496 -4 1477 2630 Eastern High Rainfall 84 Haddon Rig 1041 1086 1191 14 1106 2824 Northern Wheat/sheep 65 Merryville 1383 850 870 -37 1034 2586 Eastern Wheat/sheep 96 Pooginook 880 990 630 -28 833 2716 Eastern Wheat/sheep 97 Well Gully Poll 765 800 807 5 791 4465 Northern Wheat/sheep 68 Woodyarrup 781 811 753 -4 782 6318 Western Wheat/Sheep 12b9 Uardry 591 736 773 31 700 2711 Eastern Wheat/sheep 9
10 East Bungaree 756 607 610 -19 658 5417 Southern Wheat/sheep 10a11 Wurrook 824 632 511 -38 656 3330 South West High Rainfall 10b12 Gum Hill Poll 617 703 635 3 652 5418 Southern Wheat/sheep 10a13 Moorundie Park Poll 450 900 600 33 650 5471 Southern Wheat/sheep 10a14 Mungadal 460 944 491 7 632 2711 Eastern Wheat/sheep 915 Roseville Park 610 650 630 3 630 2830 Eastern Wheat/sheep 916 Collinsville 700 596 508 -27 601 5418 Southern Wheat/sheep 10a17 Strath Haddon 600 600 600 0 600 6318 Western Wheat/Sheep 12b18 Lewisdale 684 586 468 -32 579 6370 Western Wheat/Sheep 12b19 Cranmore Park 696 551 420 -40 556 6510 Western Wheat/Sheep 12b20 Lewisdale Poll 684 548 422 -38 551 6370 Western Wheat/Sheep 12b21 Barloo 664 540 450 -32 551 6335 Western Wheat/Sheep 12b22 Nepowie Poll 520 590 520 0 543 6312 Western Wheat/Sheep 12b23 Jaloran 520 532 -100 526 6395 Western Wheat/Sheep 12b24 Billandri Poll 578 600 375 -35 518 6323 Western High Rainfall 12a25 Cardo 502 -100 502 6513 Western Wheat/Sheep 12b26 Mount Ascot 500 430 440 -12 457 4465 Northern Wheat/sheep 627 Salt Creek 625 404 320 -49 450 3272 South West High Rainfall 10b28 Goolgumbla 460 410 476 3 449 2716 Eastern Wheat/sheep 929 Yarrum Valley Poll 510 480 322 -37 437 6320 Western Wheat/Sheep 12b30 Kylie Poll 562 455 284 -49 434 6363 Western Wheat/Sheep 12b31 Middle View 472 389 396 -16 419 2630 Eastern High Rainfall 832 Nyowee Poll 200 505 520 160 408 5461 Southern Wheat/sheep 10a33 Old Cobran Poll 400 400 400 0 400 2710 Eastern Wheat/sheep 934 The Lagoons 440 385 360 -18 395 2584 Eastern High Rainfall 835 Rutherglen 418 403 302 -28 374 6372 Western Wheat/Sheep 12b36 Angenup 365 367 380 4 371 6395 Western Wheat/Sheep 12b37 Glanna 454 354 282 -38 363 2852 Eastern Wheat/sheep 938 Woolkabin 410 380 300 -27 363 6317 Western Wheat/Sheep 12b39 Greenfields 310 387 380 23 359 5419 Southern Wheat/sheep 10a40 Boonoke Poll 337 365 374 11 359 2710 Eastern Wheat/sheep 941 Woolkabin Poll 370 350 330 -11 350 6317 Western Wheat/Sheep 12b42 Wanganella 242 400 401 66 348 2710 Eastern Wheat/sheep 943 Kolindale 350 420 265 -24 345 6370 Western Wheat/Sheep 12b44 Willandra 310 375 320 3 335 2716 Eastern Wheat/sheep 945 East Mundalla 384 306 310 -19 333 6353 Western Wheat/Sheep 12b46 Sims Uardry 145 530 325 124 333 2711 Eastern Wheat/sheep 9
Hassall & Associates Pty Ltd Page 66

Structure and Dynamics of the Australian Sheep Industry
Rank Stud Name 2002 2003 2004 % Change Average Posctode Region Region ID
47 Collinsville Poll 450 297 250 -44 332 5418 Southern Wheat/sheep 10a48 North Ashrose Poll 172 513 305 77 330 5471 Southern Wheat/sheep 10a49 White River 305 347 327 7 326 5607 Southern Wheat/sheep 10a50 Greenfields Poll 210 408 347 65 322 5419 Southern Wheat/sheep 10a51 Nerstane 308 390 265 -14 321 2354 Armidale High Rainfall 752 North Ashrose 158 469 330 109 319 5418 Southern Wheat/sheep 10a53 Tara Park 410 300 245 -40 318 2586 Eastern Wheat/sheep 954 Seven Oaks North 315 360 280 -11 318 6421 Western Wheat/Sheep 12b55 Quailerup 520 280 149 -71 316 6315 Western Wheat/Sheep 12b56 Shahs Poll 343 352 234 -32 310 6409 Western Wheat/Sheep 12b57 Fleming Grove Poll 305 350 263 -14 306 6450 Western Wheat/Sheep 12b58 Lansdowne Poll 310 337 263 -15 303 4478 Northern Wheat/sheep 659 Pastora Poll 250 310 350 40 303 2656 Eastern Wheat/sheep 960 Faraway Poll 306 298 305 0 303 5272 South West High Rainfall 10b61 Mumblebone 411 238 248 -40 299 2820 Eastern Wheat/sheep 962 Barcaldine Downs 310 217 330 6 286 4725 Northern Wheat/sheep 663 Wallinar 283 275 248 -12 269 6318 Western Wheat/Sheep 12b64 Willemenup Poll 260 268 273 5 267 6335 Western Wheat/Sheep 12b65 Eungai 284 331 184 -35 266 6575 Western Wheat/Sheep 12b66 Concordia 342 322 110 -68 258 3536 Eastern Wheat/sheep 967 Hyfield 290 220 264 -9 258 6395 Western Wheat/Sheep 12b68 East Strathglen 250 260 260 4 257 6320 Western Wheat/Sheep 12b69 Rock-Bank 258 250 260 1 256 3294 South West High Rainfall 10b70 One Oak 270 230 260 -4 253 2716 Eastern Wheat/sheep 971 Woodpark 243 274 243 0 253 2716 Eastern Wheat/sheep 972 Severn Park 252 270 235 -7 252 2630 Eastern High Rainfall 873 Gunbar 250 -100 250 2652 Eastern Wheat/sheep 974 Shalimar Park 300 250 200 -33 250 2354 Armidale High Rainfall 775 Collandra North Poll 250 253 241 -4 248 5605 Southern Wheat/sheep 10a76 Haseley Poll 262 263 210 -20 245 6566 Western Wheat/Sheep 12b77 Barton Hill Poll 150 310 275 83 245 5417 Southern Wheat/sheep 10a78 Sunny Valley 249 237 -5 243 6395 Western Wheat/Sheep 12b79 Terrick Merinos 208 275 32 242 4472 Northern Wheat/sheep 680 Ejanding 264 225 233 -12 241 6461 Western Wheat/Sheep 12b81 Glen Donald 250 263 202 -19 238 3418 South West High Rainfall 10b82 Merrignee 252 251 212 -16 238 2586 Eastern Wheat/sheep 983 Genanegie 250 250 210 -16 237 2869 Eastern Wheat/sheep 984 Pemcaw 183 321 195 7 233 2844 Eastern Wheat/sheep 985 One Oak No 2 210 290 197 -6 232 2716 Eastern Wheat/sheep 986 Undabri Poll 125 145 419 235 230 4390 Northern Wheat/sheep 687 Windarra 263 260 162 -38 228 5271 South West High Rainfall 10b88 Boonoke 169 240 272 61 227 2710 Eastern Wheat/sheep 989 Lansdowne 182 295 200 10 226 4478 Northern Wheat/sheep 690 Walkindyer Poll 180 252 245 36 226 6535 Western Wheat/Sheep 12b91 Glendemar 256 210 210 -18 225 3380 South West High Rainfall 10b92 Willigulli North Poll 234 235 206 -12 225 6535 Western Wheat/Sheep 12b
Hassall & Associates Pty Ltd Page 67
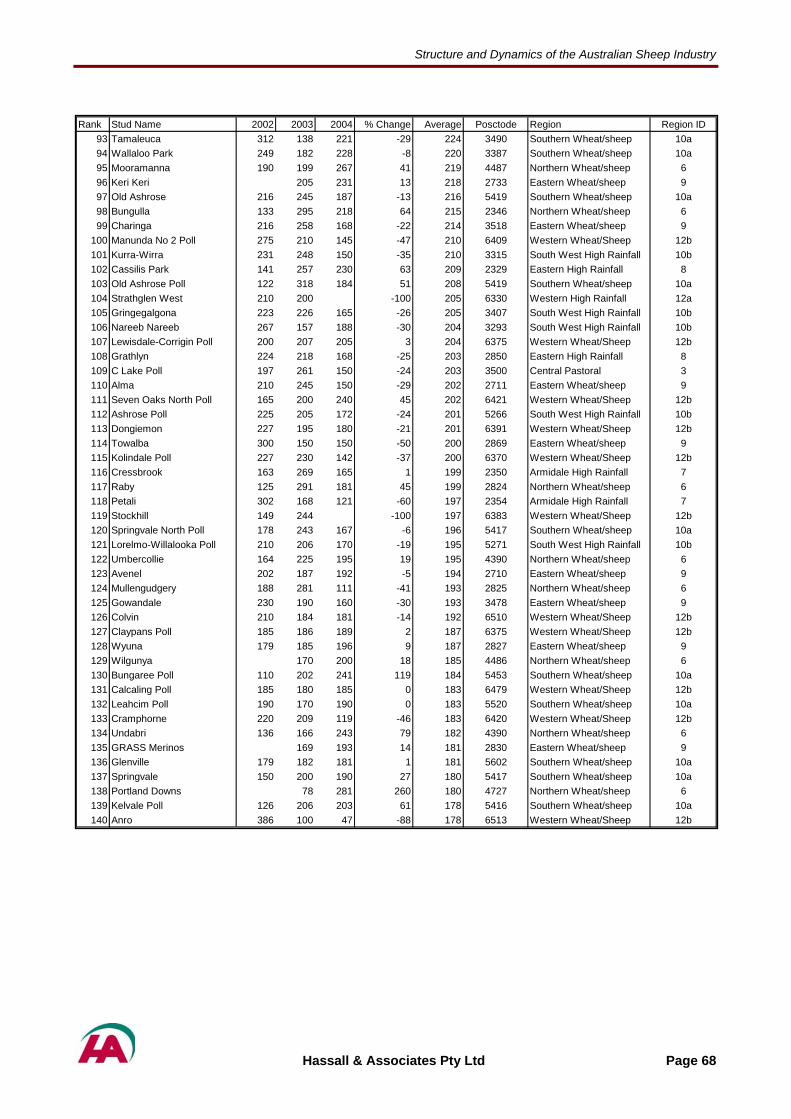
Structure and Dynamics of the Australian Sheep Industry
Rank Stud Name 2002 2003 2004 % Change Average Posctode Region Region ID
93 Tamaleuca 312 138 221 -29 224 3490 Southern Wheat/sheep 10a94 Wallaloo Park 249 182 228 -8 220 3387 Southern Wheat/sheep 10a95 Mooramanna 190 199 267 41 219 4487 Northern Wheat/sheep 696 Keri Keri 205 231 13 218 2733 Eastern Wheat/sheep 997 Old Ashrose 216 245 187 -13 216 5419 Southern Wheat/sheep 10a98 Bungulla 133 295 218 64 215 2346 Northern Wheat/sheep 699 Charinga 216 258 168 -22 214 3518 Eastern Wheat/sheep 9
100 Manunda No 2 Poll 275 210 145 -47 210 6409 Western Wheat/Sheep 12b101 Kurra-Wirra 231 248 150 -35 210 3315 South West High Rainfall 10b102 Cassilis Park 141 257 230 63 209 2329 Eastern High Rainfall 8103 Old Ashrose Poll 122 318 184 51 208 5419 Southern Wheat/sheep 10a104 Strathglen West 210 200 -100 205 6330 Western High Rainfall 12a105 Gringegalgona 223 226 165 -26 205 3407 South West High Rainfall 10b106 Nareeb Nareeb 267 157 188 -30 204 3293 South West High Rainfall 10b107 Lewisdale-Corrigin Poll 200 207 205 3 204 6375 Western Wheat/Sheep 12b108 Grathlyn 224 218 168 -25 203 2850 Eastern High Rainfall 8109 C Lake Poll 197 261 150 -24 203 3500 Central Pastoral 3110 Alma 210 245 150 -29 202 2711 Eastern Wheat/sheep 9111 Seven Oaks North Poll 165 200 240 45 202 6421 Western Wheat/Sheep 12b112 Ashrose Poll 225 205 172 -24 201 5266 South West High Rainfall 10b113 Dongiemon 227 195 180 -21 201 6391 Western Wheat/Sheep 12b114 Towalba 300 150 150 -50 200 2869 Eastern Wheat/sheep 9115 Kolindale Poll 227 230 142 -37 200 6370 Western Wheat/Sheep 12b116 Cressbrook 163 269 165 1 199 2350 Armidale High Rainfall 7117 Raby 125 291 181 45 199 2824 Northern Wheat/sheep 6118 Petali 302 168 121 -60 197 2354 Armidale High Rainfall 7119 Stockhill 149 244 -100 197 6383 Western Wheat/Sheep 12b120 Springvale North Poll 178 243 167 -6 196 5417 Southern Wheat/sheep 10a121 Lorelmo-Willalooka Poll 210 206 170 -19 195 5271 South West High Rainfall 10b122 Umbercollie 164 225 195 19 195 4390 Northern Wheat/sheep 6123 Avenel 202 187 192 -5 194 2710 Eastern Wheat/sheep 9124 Mullengudgery 188 281 111 -41 193 2825 Northern Wheat/sheep 6125 Gowandale 230 190 160 -30 193 3478 Eastern Wheat/sheep 9126 Colvin 210 184 181 -14 192 6510 Western Wheat/Sheep 12b127 Claypans Poll 185 186 189 2 187 6375 Western Wheat/Sheep 12b128 Wyuna 179 185 196 9 187 2827 Eastern Wheat/sheep 9129 Wilgunya 170 200 18 185 4486 Northern Wheat/sheep 6130 Bungaree Poll 110 202 241 119 184 5453 Southern Wheat/sheep 10a131 Calcaling Poll 185 180 185 0 183 6479 Western Wheat/Sheep 12b132 Leahcim Poll 190 170 190 0 183 5520 Southern Wheat/sheep 10a133 Cramphorne 220 209 119 -46 183 6420 Western Wheat/Sheep 12b134 Undabri 136 166 243 79 182 4390 Northern Wheat/sheep 6135 GRASS Merinos 169 193 14 181 2830 Eastern Wheat/sheep 9136 Glenville 179 182 181 1 181 5602 Southern Wheat/sheep 10a137 Springvale 150 200 190 27 180 5417 Southern Wheat/sheep 10a138 Portland Downs 78 281 260 180 4727 Northern Wheat/sheep 6139 Kelvale Poll 126 206 203 61 178 5416 Southern Wheat/sheep 10a140 Anro 386 100 47 -88 178 6513 Western Wheat/Sheep 12b
Hassall & Associates Pty Ltd Page 68

Structure and Dynamics of the Australian Sheep Industry
APPENDIX 2 – NATIONAL SHEEP SALEYARD DATA Source : National Livestock Reporting Service Data (NLRS) 2006
RANK SALEYARD PRIME STORE TOTAL STATE PCODE ZONE_ID ZONENAME
1 Wagga Wagga 1680299 0 1680299 NSW 2650 9 Eastern Wheat/sheep2 Dubbo 1429402 0 1429402 NSW 2830 9 Eastern Wheat/sheep3 Adelaide 0 1317233 SA 5000 10b South West High Rainfall4 Ballarat 0 1262140 VIC 3350 10b South West High Rainfall5 Bendigo 0 1236229 VIC 3550 9 Eastern Wheat/sheep6 Katanning 557983 557983 1115966 WA 6317 12b Western Wheat/Sheep7 Hamilton 0 1047226 VIC 3300 10b South West High Rainfall8 Forbes 1005331 11672 1017003 NSW 2871 9 Eastern Wheat/sheep9 Midland 432848 432848 865695 WA 6056 12a Western High Rainfall10 Naracoorte 0 652823 SA 5271 10b South West High Rainfall11 Horsham 0 466799 VIC 3400 10b South West High Rainfall12 Corowa 424268 25110 449378 NSW 2646 9 Eastern Wheat/sheep13 Griffith 407844 0 407844 NSW 2680 9 Eastern Wheat/sheep14 Narromine 391513 391513 NSW 2821 9 Eastern Wheat/sheep15 Goulburn 364883 8692 373575 NSW 2580 8 Eastern High Rainfall16 Cowra 340404 0 340404 NSW 2794 9 Eastern Wheat/sheep17 Tamworth 291140 5640 296780 NSW 2340 6 Northern Wheat/sheep18 Bathurst 288085 0 288085 NSW 2795 8 Eastern High Rainfall19 Deniliquin 151342 116776 268118 NSW 2710 9 Eastern Wheat/sheep20 Mount Gambier 0 254936 SA 5290 10b South West High Rainfall21 Launceston 0 200000 TAS 7250 11 Tasmania22 Swan hill 0 196431 VIC 3585 10a Southern Wheat/sheep23 Inverell 167522 9438 176960 NSW 2360 6 Northern Wheat/sheep24 Ouyen 0 165217 VIC 3490 10a Southern Wheat/sheep25 Dunedoo 103550 31550 135100 NSW 2844 9 Eastern Wheat/sheep26 Glen innes 133533 0 133533 NSW 2370 7 Armidale High Rainfall27 Geelong 0 129812 VIC 3220 10b South West High Rainfall28 Cooma 30465 90902 121367 NSW 2630 8 Eastern High Rainfall29 Wycheproof 0 114478 VIC 3527 10a Southern Wheat/sheep30 Jerilderie 109924 109924 NSW 2716 9 Eastern Wheat/sheep31 Warracknabeal 0 104300 VIC 3393 10b South West High Rainfall32 Young 102522 0 102522 NSW 2594 9 Eastern Wheat/sheep33 Cootamundra 99419 0 99419 NSW 2590 9 Eastern Wheat/sheep34 Armidale 99404 0 99404 NSW 2350 7 Armidale High Rainfall35 Warwick 97871 0 97871 QLD 4370 6 Northern Wheat/sheep36 Blayney 94118 0 94118 NSW 2799 8 Eastern High Rainfall37 Yarrawonga 0 88231 VIC 3730 9 Eastern Wheat/sheep38 West Wyalong 79529 79529 NSW 2671 9 Eastern Wheat/sheep39 Guyra 73689 2230 75919 NSW 2365 7 Armidale High Rainfall40 Kerang 0 74900 VIC 3579 10a Southern Wheat/sheep41 Orange 69655 0 69655 NSW 2800 8 Eastern High Rainfall42 Finley 67191 0 67191 NSW 2713 9 Eastern Wheat/sheep43 Dalby 53000 7314 60314 QLD 4405 6 Northern Wheat/sheep44 Bairnsdale 0 58117 VIC 3875 8 Eastern High Rainfall45 Temora 57342 0 57342 NSW 2666 9 Eastern Wheat/sheep46 Millicent 0 57104 SA 5280 10b South West High Rainfall47 Warrnambool 0 49325 VIC 3280 10b South West High Rainfall48 Balranald 40298 40298 NSW 2715 3 Central Pastoral49 Sale 0 38000 VIC 3850 8 Eastern High Rainfall50 Casterton 0 36818 VIC 3311 10b South West High Rainfall51 Northam 36687 36687 WA 6401 12b Western Wheat/Sheep
Hassall & Associates Pty Ltd Page 69
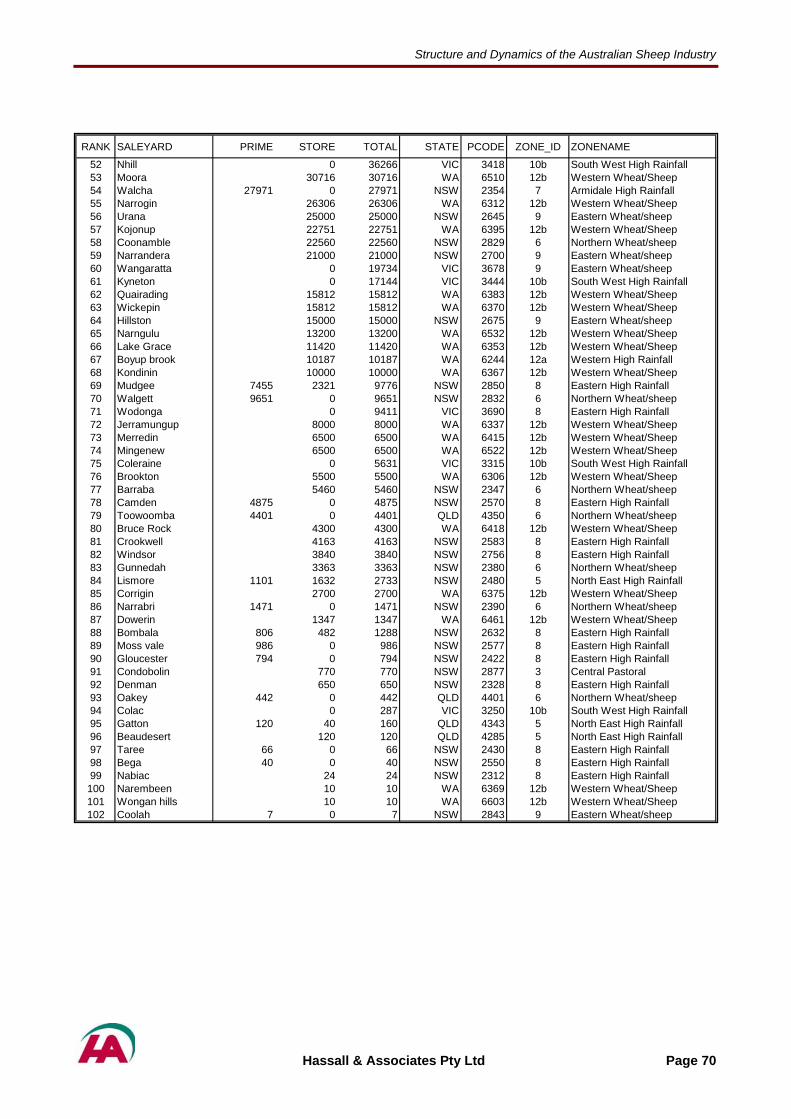
Structure and Dynamics of the Australian Sheep Industry
RANK SALEYARD PRIME STORE TOTAL STATE PCODE ZONE_ID ZONENAME
52 Nhill 0 36266 VIC 3418 10b South West High Rainfall53 Moora 30716 30716 WA 6510 12b Western Wheat/Sheep54 Walcha 27971 0 27971 NSW 2354 7 Armidale High Rainfall55 Narrogin 26306 26306 WA 6312 12b Western Wheat/Sheep56 Urana 25000 25000 NSW 2645 9 Eastern Wheat/sheep57 Kojonup 22751 22751 WA 6395 12b Western Wheat/Sheep58 Coonamble 22560 22560 NSW 2829 6 Northern Wheat/sheep59 Narrandera 21000 21000 NSW 2700 9 Eastern Wheat/sheep60 Wangaratta 0 19734 VIC 3678 9 Eastern Wheat/sheep61 Kyneton 0 17144 VIC 3444 10b South West High Rainfall62 Quairading 15812 15812 WA 6383 12b Western Wheat/Sheep63 Wickepin 15812 15812 WA 6370 12b Western Wheat/Sheep64 Hillston 15000 15000 NSW 2675 9 Eastern Wheat/sheep65 Narngulu 13200 13200 WA 6532 12b Western Wheat/Sheep66 Lake Grace 11420 11420 WA 6353 12b Western Wheat/Sheep67 Boyup brook 10187 10187 WA 6244 12a Western High Rainfall68 Kondinin 10000 10000 WA 6367 12b Western Wheat/Sheep69 Mudgee 7455 2321 9776 NSW 2850 8 Eastern High Rainfall70 Walgett 9651 0 9651 NSW 2832 6 Northern Wheat/sheep71 Wodonga 0 9411 VIC 3690 8 Eastern High Rainfall72 Jerramungup 8000 8000 WA 6337 12b Western Wheat/Sheep73 Merredin 6500 6500 WA 6415 12b Western Wheat/Sheep74 Mingenew 6500 6500 WA 6522 12b Western Wheat/Sheep75 Coleraine 0 5631 VIC 3315 10b South West High Rainfall76 Brookton 5500 5500 WA 6306 12b Western Wheat/Sheep77 Barraba 5460 5460 NSW 2347 6 Northern Wheat/sheep78 Camden 4875 0 4875 NSW 2570 8 Eastern High Rainfall79 Toowoomba 4401 0 4401 QLD 4350 6 Northern Wheat/sheep80 Bruce Rock 4300 4300 WA 6418 12b Western Wheat/Sheep81 Crookwell 4163 4163 NSW 2583 8 Eastern High Rainfall82 Windsor 3840 3840 NSW 2756 8 Eastern High Rainfall83 Gunnedah 3363 3363 NSW 2380 6 Northern Wheat/sheep84 Lismore 1101 1632 2733 NSW 2480 5 North East High Rainfall85 Corrigin 2700 2700 WA 6375 12b Western Wheat/Sheep86 Narrabri 1471 0 1471 NSW 2390 6 Northern Wheat/sheep87 Dowerin 1347 1347 WA 6461 12b Western Wheat/Sheep88 Bombala 806 482 1288 NSW 2632 8 Eastern High Rainfall89 Moss vale 986 0 986 NSW 2577 8 Eastern High Rainfall90 Gloucester 794 0 794 NSW 2422 8 Eastern High Rainfall91 Condobolin 770 770 NSW 2877 3 Central Pastoral92 Denman 650 650 NSW 2328 8 Eastern High Rainfall93 Oakey 442 0 442 QLD 4401 6 Northern Wheat/sheep94 Colac 0 287 VIC 3250 10b South West High Rainfall95 Gatton 120 40 160 QLD 4343 5 North East High Rainfall96 Beaudesert 120 120 QLD 4285 5 North East High Rainfall97 Taree 66 0 66 NSW 2430 8 Eastern High Rainfall98 Bega 40 0 40 NSW 2550 8 Eastern High Rainfall99 Nabiac 24 24 NSW 2312 8 Eastern High Rainfall
100 Narembeen 10 10 WA 6369 12b Western Wheat/Sheep101 Wongan hills 10 10 WA 6603 12b Western Wheat/Sheep102 Coolah 7 0 7 NSW 2843 9 Eastern Wheat/sheep
Hassall & Associates Pty Ltd Page 70

Structure and Dynamics of the Australian Sheep Industry
APPENDIX 3 – LIVE SHEEP EXPORT DATA Source : ABS Data 2006
PORT AUTUMN SUMMER SPRING WINTER TOTALFremantle 1,029,088 1,287,255 1,334,036 946,101 4,596,479
Portland 253,957 284,999 162,620 226,938 928,514Port Adelaid 183,718 168,248 210,973 206,481 769,421
Devonport 8,097 50,125 0 0 58,222Gladstone 0 0 7,709 2,827 10,536Geraldton 2,174 3,307 4,053 261 9,794
Broome 1,084 285 2,499 3,611 7,480Perth Airpor 1,737 1,959 1,700 1,894 7,291Esperance 0 5,605 0 0 5,605
Port Hedland 171 0 2,010 142 2,324Darwin 130 0 459 937 1,527
Melbourne 5 120 585 209 919Bunbury 748 0 0 0 748
Perth 384 68 143 139 734Other Ports 0 0 643 0 643
Adelaide 130 0 53 332 515Townsville 200 189 0 0 389
Adelaide Air 70 78 69 165 382Wyndham 0 0 0 286 286Karumba 0 0 0 221
Weipa 0 0 133 52 185Mascot Airpo 44 2 63 18 127Brisbane Air 0 0 1 0 0
PORT PCODE ZONE_IDAdelaide 5000 10b
Adelaide Air 5950 10bBrisbane Air 4000 5
Broome 6725 124Bunbury 5266 10b
Darwin 0800 124Devonport 7310 11Esperance 6450 12bFremantle 6160 12aGeraldton 6530 12bGladstone 7264 11Karumba 4891 124
Mascot Airpo 2000 8Melbourne 3000 10b
Other Ports 5000 10bPerth 6000 12a
Perth Airpor 6105 12aPort Adelaid 5000 10b
Port Hedland 6721 3Portland 2847 10b
Townsville 4810 5Weipa 4874 124
Wyndham 6740 124
Annual exports by port - 9 years average data ABS
221
Hassall & Associates Pty Ltd Page 71

Structure and Dynamics of the Australian Sheep Industry
APPENDIX 4 – ABATTOIR THROUGHPUT DATA Source : Australian Meat Processors Corporation Data 2006
ABATTOIR LOCATION STATE POSTCODE SIZE ZONENAME ZONE_IDBunganbah Meat Company Coonabarabran NSW 2357 C Eastern Wheat/sheep 9Burrangong Meat Processor Young NSW 2594 C Eastern Wheat/sheep 9Cowra Abattoir Pty Limite Cowra NSW 2794 B Eastern Wheat/sheep 9D A Holdings Pty Ltd Moruya NSW 2537 C Eastern High Rainfall 8Fletcher International Ex Dubbo NSW 2830 A Eastern Wheat/sheep 9G M Scott Pty Ltd Cootamundra NSW 2590 B Eastern Wheat/sheep 9Hirino Pty Ltd Gundagai NSW 2722 B Eastern Wheat/sheep 9J R Burnett Pty Ltd Kurri Kurri NSW 2327 C Eastern High Rainfall 8Narasell Pty Ltd Junee NSW 2663 B Eastern Wheat/sheep 9Peel Valley Exporters Pty Armidale NSW 2350 B Armidale High Rainfall 7Southern Meats Pty Ltd Goulburn NSW 2580 A Eastern High Rainfall 8Tolsat Pty Ltd Frederickton NSW 2440 C Eastern High Rainfall 8Wandeal Pastoral Co Ulladulla NSW 2539 C Eastern High Rainfall 8Wollondilly Abattoirs Pty Picton NSW 2571 C Eastern High Rainfall 8Woodbrae Holdings Pty Ltd Harden NSW 2587 B Eastern Wheat/sheep 9Ballyhigh Pty Ltd Warwick QLD 4370 C Northern Wheat/sheep 6Barcoo Butchery Blackall QLD 4472 C Northern Wheat/sheep 6Brisbane Valley Meats ESK QLD 4312 C North East High Rainfall 5Chaplain Abattoirs Miles QLD 4415 C Northern Wheat/sheep 6D R Plant AFT Plant Famil Charters Towers QLD 4820 C Northern High Rainfall 124Flinders Butchery Hughenden QLD 4821 C Northern High Rainfall 124Frazer's Butchery Augathella QLD 4477 C Northern Wheat/sheep 6Goondiwindi Meats Pty Ltd Goondiwindi QLD 4390 C Northern Wheat/sheep 6Gordon's Meats Bell QLD 4408 C Northern Wheat/sheep 6H F Gray Eumundi QLD 4562 C North East High Rainfall 5Halifax Butchery Halifax QLD 4850 C North East High Rainfall 5Highchester Pty Ltd Beaudesert QLD 4285 C North East High Rainfall 5J D & J I Allen Pty Ltd Stanthorpe QLD 4380 C Northern Wheat/sheep 6Jimbour Butchery Jimbour QLD 4406 C Northern Wheat/sheep 6Kemp Grazing Pty Ltd Sarina QLD 4737 C North East High Rainfall 5Killarney Abattoir Killarney QLD 4373 C Northern Wheat/sheep 6Maclagan Meats Maclagan QLD 5352 C Southern Wheat/sheep 10aMillmerran Meat Holdings Millmerran QLD 4357 C Northern Wheat/sheep 6Nelson Family Meats Jandowae QLD 4410 C Northern Wheat/sheep 6Quilpie Butchery Pty Ltd Quilpie QLD 4480 C Central Pastoral 3Rentport Pty Ltd Mundubbera QLD 4626 C North East High Rainfall 5RS & DJ Mitchell Monto QLD 4630 C Northern Wheat/sheep 6Southern Queensland Expor Armidale QLD 4383 B Northern Wheat/sheep 6Vitellin Pty Ltd Mount Morgan QLD 4714 C Northern Wheat/sheep 6B & G Pedler Nominees Pty Millicent SA 5280 C South West High Rainfall 10bConroys Port Pirie Abatto Port Pirie SA 5270 A South West High Rainfall 10bDalriada Meat Pty Ltd Keith SA 5267 C South West High Rainfall 10bHandke Bros Eudunda SA 5374 C Southern Wheat/sheep 10aLindner Meats Renmark SA 5341 C Central Pastoral 3Lobethal Abattoir Lobethal SA 5241 B South West High Rainfall 10bLoxton Abattoir Loxton SA 5333 C Southern Wheat/sheep 10aNormanville Meatworks Uni Yankalilla SA 5203 C South West High Rainfall 10bPinkertons Butchers Kingston SA 5272 C South West High Rainfall 10b
Note: A = >1,000,000 B = >370,000 <1,000,000 C = <370,000
Hassall & Associates Pty Ltd Page 72
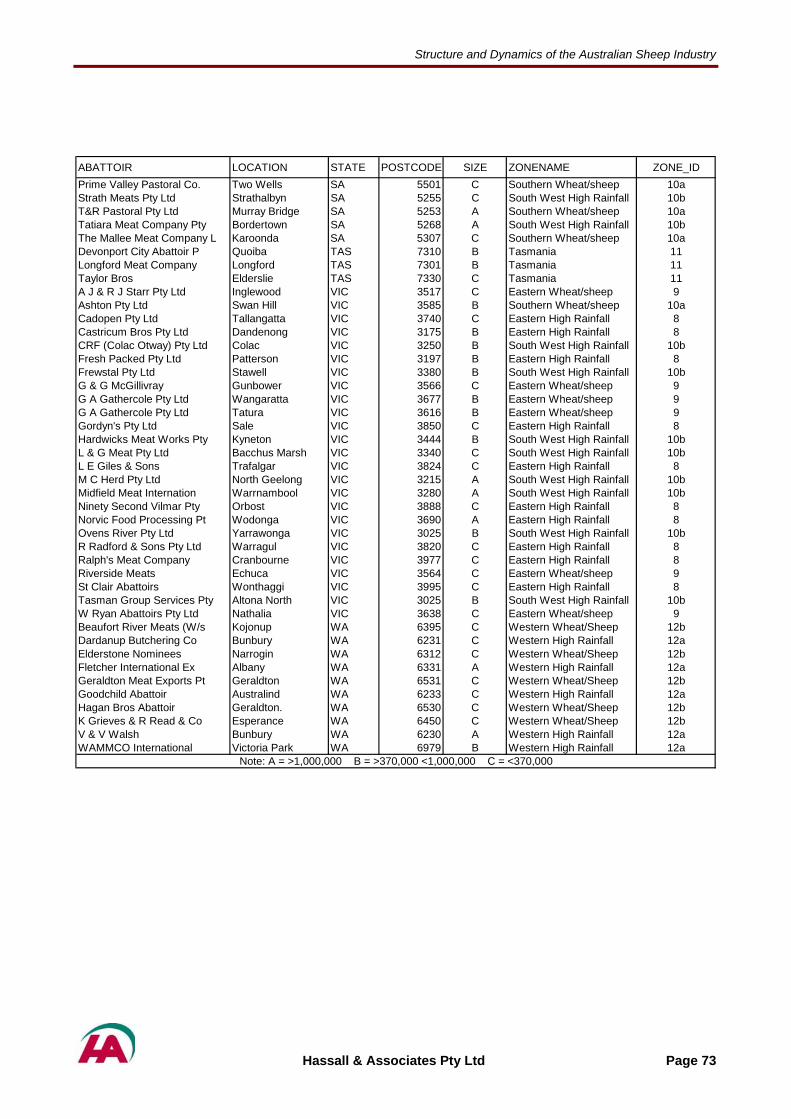
Structure and Dynamics of the Australian Sheep Industry
ABATTOIR LOCATION STATE POSTCODE SIZE ZONENAME ZONE_IDPrime Valley Pastoral Co. Two Wells SA 5501 C Southern Wheat/sheep 10aStrath Meats Pty Ltd Strathalbyn SA 5255 C South West High Rainfall 10bT&R Pastoral Pty Ltd Murray Bridge SA 5253 A Southern Wheat/sheep 10aTatiara Meat Company Pty Bordertown SA 5268 A South West High Rainfall 10bThe Mallee Meat Company L Karoonda SA 5307 C Southern Wheat/sheep 10aDevonport City Abattoir P Quoiba TAS 7310 B Tasmania 11Longford Meat Company Longford TAS 7301 B Tasmania 11Taylor Bros Elderslie TAS 7330 C Tasmania 11A J & R J Starr Pty Ltd Inglewood VIC 3517 C Eastern Wheat/sheep 9Ashton Pty Ltd Swan Hill VIC 3585 B Southern Wheat/sheep 10aCadopen Pty Ltd Tallangatta VIC 3740 C Eastern High Rainfall 8Castricum Bros Pty Ltd Dandenong VIC 3175 B Eastern High Rainfall 8CRF (Colac Otway) Pty Ltd Colac VIC 3250 B South West High Rainfall 10bFresh Packed Pty Ltd Patterson VIC 3197 B Eastern High Rainfall 8Frewstal Pty Ltd Stawell VIC 3380 B South West High Rainfall 10bG & G McGillivray Gunbower VIC 3566 C Eastern Wheat/sheep 9G A Gathercole Pty Ltd Wangaratta VIC 3677 B Eastern Wheat/sheep 9G A Gathercole Pty Ltd Tatura VIC 3616 B Eastern Wheat/sheep 9Gordyn's Pty Ltd Sale VIC 3850 C Eastern High Rainfall 8Hardwicks Meat Works Pty Kyneton VIC 3444 B South West High Rainfall 10bL & G Meat Pty Ltd Bacchus Marsh VIC 3340 C South West High Rainfall 10bL E Giles & Sons Trafalgar VIC 3824 C Eastern High Rainfall 8M C Herd Pty Ltd North Geelong VIC 3215 A South West High Rainfall 10bMidfield Meat Internation Warrnambool VIC 3280 A South West High Rainfall 10bNinety Second Vilmar Pty Orbost VIC 3888 C Eastern High Rainfall 8Norvic Food Processing Pt Wodonga VIC 3690 A Eastern High Rainfall 8Ovens River Pty Ltd Yarrawonga VIC 3025 B South West High Rainfall 10bR Radford & Sons Pty Ltd Warragul VIC 3820 C Eastern High Rainfall 8Ralph's Meat Company Cranbourne VIC 3977 C Eastern High Rainfall 8Riverside Meats Echuca VIC 3564 C Eastern Wheat/sheep 9St Clair Abattoirs Wonthaggi VIC 3995 C Eastern High Rainfall 8Tasman Group Services Pty Altona North VIC 3025 B South West High Rainfall 10bW Ryan Abattoirs Pty Ltd Nathalia VIC 3638 C Eastern Wheat/sheep 9Beaufort River Meats (W/s Kojonup WA 6395 C Western Wheat/Sheep 12bDardanup Butchering Co Bunbury WA 6231 C Western High Rainfall 12aElderstone Nominees Narrogin WA 6312 C Western Wheat/Sheep 12bFletcher International Ex Albany WA 6331 A Western High Rainfall 12aGeraldton Meat Exports Pt Geraldton WA 6531 C Western Wheat/Sheep 12bGoodchild Abattoir Australind WA 6233 C Western High Rainfall 12aHagan Bros Abattoir Geraldton. WA 6530 C Western Wheat/Sheep 12bK Grieves & R Read & Co Esperance WA 6450 C Western Wheat/Sheep 12bV & V Walsh Bunbury WA 6230 A Western High Rainfall 12aWAMMCO International Victoria Park WA 6979 B Western High Rainfall 12a
Note: A = >1,000,000 B = >370,000 <1,000,000 C = <370,000
Hassall & Associates Pty Ltd Page 73
Structure and Dynamics of the Australian Sheep Industry
APPENDIX 5 - GLOSSARY Abattoir: A plant or factory where sheep are slaughtered for food (also known as a processing plant, slaughterhouse, or meatworks).
Agent: Sells and buys sheep on behalf of clients.
AuctionsPlus: An internet based livestock auction system (see www.auctionsplus.com.au).
Border Leicester: A British breed of sheep that is used to cross with Merino to produce a prime lamb. The ewe lamb that is produced in this cross is then crossed with another meat sheep breed to produce second cross lambs that are used as a meat sheep.
B-Doubles: An articulated transport vehicle somewhere in between the size of a standard semi trailer and a road train. These vehicles are allowed in areas where road trains are not permitted and so have decreased costs to move sheep in these areas by increased efficiency.
Classing: Grouping together animals of similar types. These grouping are based on wool type or carcase structure. It is a way of removing inferior animals from flock.
Crossbred: The result of crossing two breeds, lines or strains.
F1 The first filial (daughter) generation or first cross. F2 x F3, etc. Subsequent filial generations or crosses after the F1 or first cross.
Crossbreeding: Mating animals from different breeds to utilise hybrid vigour (heterosis), breed complimentary and characteristics.
Cull for Age (CFA): To reject an animal from a breeding and/or production herd or flock, on the basis of age.
Culls: Sheep that are to be sold as they have been rejected from the breeding or production flock.
Cwt: Carcase weight – the weight of an animal's carcase. Generally refers to price quotes (e.g.: ¢/kg cwt – cents per kilogram carcase weight)
where the price for the animal is quoted per kilogram for the animal's carcase.
Damara: New breed in Australia, having been introduced to Australia in 1996. Damara are a hardy breed grown for their meat and hides. The main target market for this breed is the live sheep trade (Middle East), Asia and to a limited degree for the domestic market. These sheep have hair instead of wool so there fore they do not need to be shorn or crutched and don’t suffer from blowfly attacks. This makes them much less expensive to run.
Dentition: Number of permanent incisor teeth an animal has; relates to age.
Direct sale: The sale of sheep on property, direct to a lotfeeder, processor, backgrounder or restocker.
Dohne: A dual-purpose breed that allows the commercial producer to market both a quality heavy weight slaughter lamb and fine-medium white wool.
Dorper: Bred by South African Department of Agriculture in the 1930’s the Dorper is a cross of Dorset and Blackhead Persian with good lambing percentages and producing a high quality carcass. These sheep have hair instead of wool so therefore they do not need to be shorn or crutched and don’t suffer from blowfly attacks. This makes them less expensive to run. They are also highly fertile and perform well under rangeland conditions.
Dorset: The Dorset is recorded as being among the first of the oldest and purest breeds of sheep from England. They were first imported to Australia in 1895. The breed was enormously popular and did well in Australia. The Dorset excel in fecundity and early maturity. They produce quick maturing lambs with lean carcases and are able to remain 'fresh' under harsh conditions.
Drafts: Term applied to a group of lambs marketed by a producer.
Drought: Below average rainfall for an extended period of time.
Dry Sheep Equivalent (DSE): Is a measure based on the feed requirement of grazing animals, hence can be used to assess the
Hassall & Associates Pty Ltd Page 74

Structure and Dynamics of the Australian Sheep Industry
capacity of land to carry livestock. The standard unit is represented by the ability to maintain a 45 kg wether at constant body weight from one year to the next. Other animals are rated in relation to this.
Ewe: A female sheep with more than two permanent teeth.
Feeders: Lambs that are bought by graziers to be fed with grain and/or some other type of supplementary feeding.
First-cross: Type of lamb developed by mating a British bred ram, usually carpet wool (i.e. Border Leicester), with a Merino ewe.
FMD: Foot and mouth disease – a highly contagious disease that does not affect humans. FMD causes severe blistering in the mouth and inflammation of the hoof of the infected animal.
Footrot: A disease which causes severe economic loss, suffering due to lameness and disruption to normal farm operations. The economic losses result from reduced body weight and growth, decreased wool production and restrictions to marketing opportunities.
Fresh: Term used to describe the appearance of young, clean and sappy lambs.
Grassfed: An animal which has been fed on pasture (grass). Also used to describe the carcase when it is being sold.
Grazier: A farmer which raises livestock such as sheep or cattle. Also known as a producer or pastoralist.
Hogget: Castrated male and female sheep with no 'ram like' characteristics and up to two permanent teeth.
Husbandry: on sheep properties some or all of the following husbandry practices will be practiced:
(a) joining (b) pregnancy diagnosis (c) lambing (d) lamb marking/mulesing (e) weaning (f) culling breeders and (g) classing ewe hoggets.
Joining or Joined: Placing male animals with female animals with the intention of their mating.
Lambs: A young sheep still with its mother, or up to about five months of age.
Live export: Stock that are bought for the purpose of a live export shipment.
Lotfed: An animal fed in a feedlot.
Lotfeeding: The process of feeding cattle/sheep/lambs on grain in a feedlot.
Marking: To castrate (a lamb) usually associated with other procedures such as docking, ear-marking and drenching.
Merino: Primarily grown for wool production, although improved carcass quality gives this breed a dual purpose.
Mulesing: The removal of skin from around the anus of sheep to prevent the growth of wool. This is a practice which successfully controls blowfly strike. The Radical Mules operation removes even more skin, including a strip from the top of the tail.
Mutton: The flesh of fully grown sheep.
New season lambs: Another term for young lambs.
NLIS: National Livestock Identification System.
NLRS: National Livestock Reporting Service.
Ovine Johne’s Disease (OJD): A disease that spreads slowly, is difficult to detect early on, causes lowered weight gain and wool production and can kill about 10% of adult sheep each year if left unmanaged.
Pastoralist: A cattle or sheep farmer in northern and western regions of Australia.
Producer: A sheep or cattle farmer.
Ram: Mature entire male sheep. Flock ram: A non-pedigree ram used in a commercial flock. Stud ram: A pedigree (registered) ram.
Restocker: A producer or agent who purchases cattle/sheep/lambs and returns them to the farm.
Saleyard: A physical auction market where buyers and sellers trade cattle/sheep/lambs. Physical and store markets are conducted at a saleyard.
Hassall & Associates Pty Ltd Page 75

Structure and Dynamics of the Australian Sheep Industry
Self-Replacing Ewe Breeder Flocks: Flocks of sheep in which ewes breed their own replacements to maintain flock structure.
South African Mutton Merino (SAMM): This unique South African white wooled mutton sheep breed is considered to be a dual purpose breed
Second-cross (2X): The breed developed by mating a meat breed ram with a first-cross ewe.
Stocking density: Refers to the number of cattle/sheep/lambs a property or feedlot can or will run per area of land (e.g. DSE).
Store condition: An animal that is not in prime marketable condition.
Store sheep sale: A physical auction where normally store sheep and lambs are bought and sold. Most of the stock offered is for breeding or future finishing.
Supermarket: Large domestic processors buying stock for domestic supermarkets like Coles and Woolworths.
Supplementary fed: Sheep that have been mainly grazed on pasture, but also have access to a feed bin containing grain or hay or both.
Supply area: The region within which the yarding has been drawn from.
Traders: These are farmers who buy and sell sheep regularly. They don’t generally breed from any of their stock rather take stock in store condition and fatten them for market specifications.
Unfinished: Lambs that are lacking fat cover and have an appearance which suggest they could use some more feeding.
Weaner: A young animal that has been weaned from its mother’s milk to live completely on pasture.
Weaning: Separating lambs from their dams so that the offspring can no longer suckle.
Well conditioned: When a lamb or sheep has an adequate fat covering on the ribs and hips.
Wether: A male sheep that has been castrated as a lamb.
White Suffolk: The White Suffolk is an Australian breed developed for Australian conditions. It was
developed from breeding programs involving the Suffolk breed, initially, crossed with a white breed (mainly Poll Dorsets). The white Suffolk is proving to be the ideal prime lamb terminal sire in wide-ranging areas and environments of Australia. It is giving outstanding results in the dry, arid, pastoral regions; all types of agricultural, mixed farming areas; and also in higher rainfall districts.
Yardings: Refers to the number of sheep and lambs penned at an auction sale.
Young lamb: Male and female lambs with no 'ram like' characteristics. Generally suckers, unshorn.
Hassall & Associates Pty Ltd Page 76

Structure and Dynamics of the Australian Sheep Industry
General comments
1. Can we get the underlying spatial data for each of the figures in the text?
2. Need some data on the number, location and throughput of live export ports if possible.
3. Need some comment and detail on the size of the sheep feedlot industry and its location. Also, do sheep from feedlots go straight to abbatoirs or back to saleyards?
4. Expansion and clarification of the impact of footrot on the movement of sheep
5. Does the presence of drench resistant worms impact of sheep movement patterns?
6. some comment if available on the fate of sheep sold at saleyards. If there are few stores sales, are the majority of sheep sold at saleyards bought by abbatoirs?
7. A standard introduction for each region describing the geography, climate and pasture. Also list the number/location of major saleyards and abbatoirs in the region
Hassall & Associates Pty Ltd Page 77