the study of factors that influence consumer …
TRANSCRIPT
THE STUDY OF FACTORS THAT INFLUENCE CONSUMER PURCHASING
DECISIONS TOWARDS TOP THREE FAST FOOD BRANDS INCLUDING KFC,
PIZZA HUT AND LOTTERIA IN HOCHIMINH CITY, VIETNAM

THE STUDY OF FACTORS THAT INFLUENCE CONSUMER PURCHASING
DECISIONS TOWARDS TOP THREE FAST FOOD BRANDS INCLUDING KFC,
PIZZA HUT AND LOTTERIA IN HOCHIMINH CITY, VIETNAM
Pham Hong Giang
This Independent Study Manuscript Presented to
The Graduate School of Bangkok University
in Partial Fulfillment
of the Requirements for the Degree
Master of Business Administration
2016

© 2016
Pham Hong Giang
All Right Reserved


Hong Giang, P. M.B.A, February 2016, Graduate School, Bangkok University.
The Study of Factors that Influence Consumer Purchasing Decisions towards Top
Three Fast Food Brands Including Kfc, Pizza Hut and Lotteria in HoChiMinh City,
Vietnam (86 pp.)
Advisor: Sumas Wongsunopparat, Ph.D.
ABSTRACT
This research intends to investigate and identify factors that influence
consumer purchasing decisions towards top three fast food brands including KFC,
Pizza Hut and Lotteria in HoChiMinh city, Vietnam. The objectives of the studies are
to understand fast food consumer behavior as well as examine factors affecting
purchase intension towards fast food in Vietnam. It is a quantitative study using self-
administered questionnaire which is randomly distributed at shopping complex,
supermarket, stores in HoChiMinh city, Vietnam. The sample size is 400 respondents
who live in HoChiMinh, regularly consume fast food. The surveys reliability was
tested by Cronbach's alpha coefficient in which showed 0.966 (very high reliability
level). The data analysis process for this research is analyzed by SPSS statistic
program and present in table format with explanation on each. Several methods were
used to analyze statistics such as frequency and percentage, cross tabulation and
multinomial logistic regression was used to test hypotheses.
Keywords: KFC, Pizza Hut and Lotteria.

v
ACKNOWLEDGEMENT
I would like to thank Dr. Sumas Wongsunopparat for the kindness and support
he has shown during the past year it has taken me to finalize this Independent Study.
Furthermore, I would like to thank my parents for their endless love and support. I
would like to thank Mr. Jack as well for his assistance and guidance with this paper.
Last but not least, I would like to thank Bangkok University for the support for my
thesis.
I would like to express my deepest appreciation to all those who provided me
the possibility to complete this report. A special gratitude I give to my supervisor Dr.
Sumas, whose contribution in stimulating suggestions and encouragement, helped me
to coordinate my project especially in writing this report.

vi
TABLE OF CONTENTS
Page
ABSTRACT ................................................................................................................. iv
ACKNOWLEDGEMENT .............................................................................................v
TABLE OF CONTENTS ............................................................................................. vi
LIST OF TABLES ....................................................................................................... ix
LIST OF FIGURES ..................................................................................................... xi
CHAPTER 1: INTRODUCTION ..................................................................................1
1.1 Background of the Study .............................................................................1
1.2 Top Three Fast Food brands in Vietnam .....................................................3
1.2.1 KFC Brand ....................................................................................3
1.2.2 Pizza Hut Brand ............................................................................3
1.2.3 Lotteria Brand ...............................................................................3
1.3 Problem Statement .......................................................................................4
1.4 Aims of the Study ........................................................................................5
1.5 Research Questions ......................................................................................5
1.6 Research Scopes...........................................................................................6
1.7 The Layout of The study ..............................................................................6
CHAPTER 2: LITERATURE REVIEW .......................................................................8
2.1 Definition of Fast Food ................................................................................8
2.2 The Theory of Purchasing Behavior ............................................................8
2.3 Choice Theory ............................................................................................12
2.4 Marketing Mix Theory (7Ps) .....................................................................13
2.5 Brand Equity Theory..................................................................................16

vii
TABLE OF CONTENTS (Continued)
Page
CHAPTER 2: LITERATURE REVIEW (Continued) .................................................19
2.6 Previous Related Researches .....................................................................19
2.6.1 Theory of Reasoned Action – TRA ............................................19
2.6.2 Theory of Planned Behavior – TPB ............................................20
2.6.3 Model of Purchase Intention .......................................................21
2.7 Theoretical Framework ..............................................................................22
2.8 Hypotheses .................................................................................................24
CHAPTER 3: METHODOLOGY ...............................................................................31
3.1 Research design .........................................................................................31
3.2 Population and Samples .............................................................................31
3.3 Research Instruments .................................................................................32
3.4 Research Reliability ...................................................................................36
3.5 Data Collection ..........................................................................................37
3.6 Multinomial Logistic Regression ...............................................................38
3.7 Statistic for Data Analysis .........................................................................39
CHAPTER 4: ANALYSIS AND FINDINGS .............................................................41
4.1 The analysis of demographic and general information of samples ............41
4.2 The analysis of marketing mix (7Ps), brand equity ...................................46
4.2.1 Findings of hypotheses testing for Marketing mix (7Ps) ............48
4.2.2 Findings of hypotheses testing for Brand Equity ........................60
4.3 The analysis of customer behavior ............................................................62
viii
TABLE OF CONTENTS (Continued)
Page
CHAPTER 5: DISCUSSION AND CONCLUSION ..................................................69
5.1 Conclusion and discussion .........................................................................71
5.2 Recommendation for Future Research.......................................................75
BIBLIOGRAPHY ........................................................................................................76
APPENDIX ..................................................................................................................78
BIODATA....................................................................................................................85
LICENSE AGREEMENT ...........................................................................................86

ix
LIST OF TABLES
Page
Table 1: Level of Information Measurement and Criteria ...........................................33
Table 2: The Result of Cronbach’s Alpha Test with 30 Try-out Questionnaires ........37
Table 3: Frequency and Percentage of General Information; The most favorite fast
food brand ........................................................................................................42
Table 4: Cross tabulation of General Information; Always choose the favorite brand
......................................................................................................................................42
Table 5: Cross tabulation of Demographics; Gender ...................................................43
Table 6: Cross tabulation of Demographics; Age ........................................................44
Table 7: Cross tabulation of Demographics; Profession..............................................45
Table 8: Cross tabulation of Demographics; Marital status .........................................45
Table 9: Likelihood Ratio Tests ...................................................................................46
Table 10: Finding of hypotheses testing for Product in Marketing mix (7Ps) (KFC) .48
Table 11: Finding of hypotheses testing for Product in Marketing mix (7Ps) (Pizza
Hut) ..................................................................................................................50
Table 12: Finding of hypotheses testing for Price in Marketing mix (7Ps) (KFC) .....51
Table 13: Finding of hypotheses testing for Price in Marketing mix (7Ps) (Pizza Hut)
......................................................................................................................................52
Table 14: Finding of hypotheses testing for Place in Marketing mix (7Ps) (KFC) .....52
Table 15: Finding of hypotheses testing for Place in Marketing mix (7Ps) (Pizza Hut)
......................................................................................................................................53
Table 16: Finding of hypotheses testing for Promotion in Marketing mix (7Ps) (KFC)
......................................................................................................................................54

x
LIST OF TABLES (Continued)
Page
Table 17: Finding of hypotheses testing for Promotion in Marketing mix (7Ps) (Pizza
Hut....................................................................................................................55
Table 18: Finding of hypotheses testing for Process in Marketing mix (7Ps) (KFC) .55
Table 19: Finding of hypotheses testing for Process in Marketing mix (7Ps) (Pizza
Hut) ..................................................................................................................56
Table 20: Finding of hypotheses testing for Physical Environment in Marketing mix
(7Ps) (KFC) ......................................................................................................57
Table 21: Finding of hypotheses testing for Physical Environmental in Marketing mix
(7Ps) (Pizza Hut) ..............................................................................................58
Table 22: Finding of hypotheses testing for People in Marketing mix (7Ps) (KFC) ...58
Table 23: Finding of hypotheses testing for People in Marketing mix (7Ps) (Pizza
Hut) ..................................................................................................................59
Table 24: Finding of hypotheses testing for Brand Equity (KFC)...............................60
Table 25: Finding of hypotheses testing for Brand Equity (Pizza Hut) .......................61
Table 26: Cross tabulation of Consumer behavior; Eat at home (or) outside ..............62
Table 27: Cross tabulation of Consumer behavior; Eat fast food with ........................62
Table 28: Cross tabulation of Consumer behavior; Spend for fast food each time .....63
Table 29: Cross tabulation of Consumer behavior; Frequency of purchasing fast food
......................................................................................................................................64
Table 30: Cross tabulation of Consumer behavior; Suitable meal ..............................65
Table 31: Cross tabulation of Consumer behavior; Favorite taste ...............................66
Table 32: Cross tabulation of Consumer behavior; Fast food fit well with lifestyle ...66
Table 33: Cross tabulation of Consumer behavior; Personal desire effect on
purchasing fast food brands. ............................................................................67

xi
LIST OF FIGURES
Page
Figure 1 : Consumer Buying Process.............................................................................9
Figure 2 : Three Levels of 7Ps model ..........................................................................14
Figure 3 : Brand Equity Model (Source: David Aaker 1991) ......................................17
Figure 4 : Model of Reasoned Action – TRA (Fishbein, M. &Ajzen 1975) ...............20
Figure 5 : Model of Planned Behavior – TPB .............................................................20
Figure 6 : Model of Theory About Signal Brand .........................................................21
Figure 7 : Conceptual Model of Purchase Intention ....................................................21
Figure 8 : Research Framework ...................................................................................23
1
CHAPTER 1
INTRODUCTION
1.1 Background of the Study
Nowadays, with the developing society and people's living standards is
raising, the human life span has also increased. Therefore, people have more new
demands of life and one of them is the timing issue. The consumption of time for
daily activities includes many things in that may include the human meal. In addition
to being delicious, have enough quality to guarantee health, it must require less time.
This leads to contribute to promoting the establishment and development of fast food
system over the world.
According to market research firm IBISWorld, the total revenue of the fast
food restaurant industry generated approximately 191 billion U.S. dollars in 2013.
And in 2012, Yum! Brands who is the parent company of fast-food chains KFC, Pizza
Hut and Taco Bell, has earned 1.1 billion dollars in profits outside the United States
accounted for 70% of total revenue (IBISWorld, 2012). And in 10 emerging markets,
with a million people, Yum! Brands will build two fast food outlets. Meanwhile,
according to a survey of 14.134 consumers in 28 countries by the end of 2012 showed
that Asia is the market of fast food consumption hottest growth in the world (Nielsen,
2012). With only the Asia Pacific region has 30% of consumers go to eat outside at
least 1 time / week. Specifically, the percentage of the population eat outside family at
least 1 week/time is Hong Kong 61%, Malaysia 59%, Philippines 54%, Singapore
50% (Nielsen, 2012).
2
Vietnam with over 90 million inhabitants, of which 65% are young people
under the age of 35 and the economic growth rate in 2016 is expected to reach 9.5% is
attractive markets business conglomerates formula fast food (CIA, 2015). Currently,
apart from the fast food brand has been active abroad for many years, the fast food
market in Vietnam also began a fairly active. The presence of fast-food brands in the
country, as well as other foreign investors prepared penetration, making the fast food
market in Vietnam increasingly diverse and multiple options. Therefore, habits and
tastes of consumers will change. Therefore, the fast food chain store decorated space
should follow different groups including family space, friend space, to entice a large
range of clients, diversity ages.
In Vietnam, since fast food shops first appeared in Vietnam in 1994 (Chicken
Texas on Nguyen Trai Street, District 1), so far appeared fast food chain stores,
according to the European style, America, Asia mixed with the habits Vietnam
cuisine. Besides the hamburger, fried chicken, potato Cajun sauces with rice, cabbage
salad and corn salad, fast food market has currently in Vietnam is going on the
competition's extreme of his big three are KFC, Lotteria and Pizza Hut.
In Ho Chi Minh City (HCMC), on major routes have dense fast food outlets.
Each brand has its own strengths in order to please the guests. Most shops are located
in the corner of the spacious, attracting all glances. The foreign fast food when
entering Vietnam is processed "localized" in line with the taste of people.
Therefore the topic "The study of factors that influence consumer
purchasing decisions towards top three fast food brands including KFC, Pizza
Hut and Lotteria in Ho Chi Minh City, Vietnam" is very important and necessary.
3
1.2 Top Three Fast Food brands in Vietnam
1.2.1 KFC Brand
KFC is the phrase stands for Kentucky Fried Chicken, KFC famous over the
world with Orginal Recipe traditional chicken processing, created by the same secret
recipe mix between 11 spices and various herbs.
Owns 20,000 restaurants in 109 countries and territories worldwide, KFC
brought a great taste made from fresh chicken. In Vietnam, KFC has 136 stores, 68
own stores in HoChiMinh, large and small (FTA Research and Consultant). Each
place brings a cozy atmosphere, hot chicken flavor, spicy, crispy. Also KFC has many
promotions with attractive special price.
1.2.2 Pizza Hut Brand
Pizza Hut (also known under the name Pizza Hut, Inc.) is an American
restaurant chain is the international franchise specializing in providing dishes from
pizza with different styles, along with the side dishes including pasta, beef thigh,
breadsticks, and garlic bread. Pizza Hut is a subsidiary of Yum! Brands.
Appearing for the first time in Vietnam since 2007, until now Pizza Hut has
confirmed strong position with large network throughout the land of the letter S,
especially with the system 19 Pizza restaurant located in Ho Chi Minh potential and
development.
1.2.3 Lotteria Brand
Lotteria is the fast food chain stores first appeared in Japan in 1972, has now
developed in many East Asian countries such as China, Taiwan, Korea, Vietnam, ...
Lotteria imitated style bread McDonald's hamburger but famous as specialties created
its own brand for the shrimp burger in 1977.
4
Imported into Vietnam market in 2004, far Lotteria has a solid foothold in the
fast food market in here. With the continuous promotion of the unique, Lotteria
always attract attention and customer choice.
1.3 Problem Statement
In Vietnam, the number of fast food consumption increased mainly in urban
areas, especially in Ho Chi Minh City (HCMC) where developing day by day and
people have a better conditions, this reflects the overall growth and improved to life
thanks to the developing economies.
According to a market survey of fast food in big cities by the company Market
Research online W&S announced the end of 2012, the brands of fast food such as
KFC, Lotteria, Pizza Hut were the most used in Vietnam market (W&S Group, 2012).
The survey results of 272 people from 16 years old and up showed that the subjects
are studied go to fast food outlets at least 1 time in 3 months. In particular, the
customers from 24-29 ages are a group have highest rate in using fast food. Type of
fast food has many advantages such as convenience, product diversity and can meet
the demands of youth in space friendly, youthful. Under the common development,
fast food consumption trends will continue to growing in the future, especially in the
youth. These figures showed that the strong growth of the fast food market, the
number of sellers and buyers are increasing rapidly.
Currently, the fast food market in Vietnam in general is ongoing competition
of extreme of his three big as KFC, Lotteria and Pizza Hut. Meanwhile, the
Vietnamese fast food brand is quite rare with Pho 24, Vietmac, and Wrap & Roll. In
order to contribute to finding new solutions for Vietnamese enterprises on the fast
food market, the author will conduct dissertation research "the study of factors that
5
influence consumer purchasing decisions towards top three fast food brands
including KFC, Pizza Hut and Lotteria in Ho Chi Minh City, Vietnam" based on
research on consumer behavior about fast food has been conducted by many authors
on the world and published several models related to using behavior of fast food and
some studies have been done in Vietnam.
1.4 Aims of the Study
To clarify the main objective, the research conducted two targets following
details:
1. Identify the Factors that influence consumer purchasing decisions
towards top three fast food brands including KFC, Pizza Hut and Lotteria in
HCMC, Vietnam.
2. To understanding fast food consumer behavior in Vietnam.
1.5 Research Questions
To achieve these objectives the study, the research question was posed as
follows:
(1) What factors that influence consumer purchasing decisions towards
top three fast food brands including KFC, Pizza Hut and Lotteria in HCMC,
Vietnam?
(2) The degree of impact these factors that influence consumer
purchasing decisions towards top three fast food brands including KFC, Pizza
Hut and Lotteria in HCMC, Vietnam.
(3) From the result, how to apply it to develop marketing strategies for
a brand in the market.

6
1.6 Research Scopes
- The scope of content
This study surveys factors that influence consumer purchasing decisions and
investigates the relation of independent variables and purchase decision towards top
three fast food brands in Vietnam including KFC, Pizza Hut and Lotteria.
- The scope of methodology is quantitative.
- The scope of sample population: The survey is implemented by distributing a
self-administered questionnaire such as shopping complex, supermarket, store
in HCMC where have KFC, Pizza Hut and Lotteria brands and the sample size
is 400 respondents being consuming fast food living in HCMC, Vietnam.
1.7 The Layout of The study
Following is the chapter’s plan of this research:
Chapter 1: Introduction: In this first chapter of the research, following are the
main sections: background of the research, problem statement, objectives and aims,
research questions and scopes of the research.
Chapter 2: Literature Review: This chapter introduces the theoretical basis
and model studies of decision making by consumers and the Factors that influence
consumer purchasing decisions towards top three fast food brands including KFC,
Pizza Hut and Lotteria in HCMC, Vietnam. The previous studies are on the factors
affecting the use of fast-food consumers in the country and abroad. Combined with
the current status of business fast food market in Vietnam, the author proposes a
research model and hypotheses.

7
Chapter 3: Methodology: In this chapter of the research, the methodology
applied in research is described and discussed in the forms of research design,
research method and the research hypothesis.
Chapter 4: Finding and Analysis: This chapter discusses and provides
explanation for the research methodology and data analysis used in this study. This
chapter explains how to handle research data and analytical results.
Chapter 5: Conclusion: The concluding remarks are the practical significance
of the topic and propose some solutions applied research results into practice,
limitations and proposed topics subsequent studies.

8
CHAPTER 2
LITERATURE REVIEW
2.1 Definition of Fast Food
Fast food is a general term is used for a restricted menu of food about the
amount of food were cooked in a technical process (Bender, 1995). According to Data
Moniter's (2005), fast food is defined as the sale of food or beverages is an immediate
way for consumers eat at the store or take away. In Vietnam, the most fast food shops
commonly known the consumer are KFC, Jollibee, Loteria, and Pizza Hut. According
to Franchise Direct in 2011: "Fast food shops" where packaged food production to
serve immediately. The fast food restaurant will "produce" the dish in a job chain
from order processing to serve (Sharma et al., 2005). The fast-food dishes mainly
hamburger (bagels inside clamp cheese, meat, and vegetables), pasta, chicken, and
drinks are fizzy drinks like Coca-Cola, Pepsi, 7Up…
2.2 The Theory of Purchasing Behavior
Consumer behavior is a process that involves the personal choice of
purchasing, using or abandoning the products, services, ideas, or experiences to meet
the needs and wants itself (Solomon, 1998). Consumers are defined as any individual;
of all ages participate in the process. According to Solomon (1998), buying behavior
of consumers is the behavior that occurs when a consumer decides to buy a product. It
is an internal thought process (a process often called buying process) and it starts
when consumers recognize a need or desire to buy something, the study of factors
before purchase and include the following actions when the consumer purchase
9
experience consider before deciding whether to use products / services again in the
future (Destiny, Cheuk Man LUI, 2012).
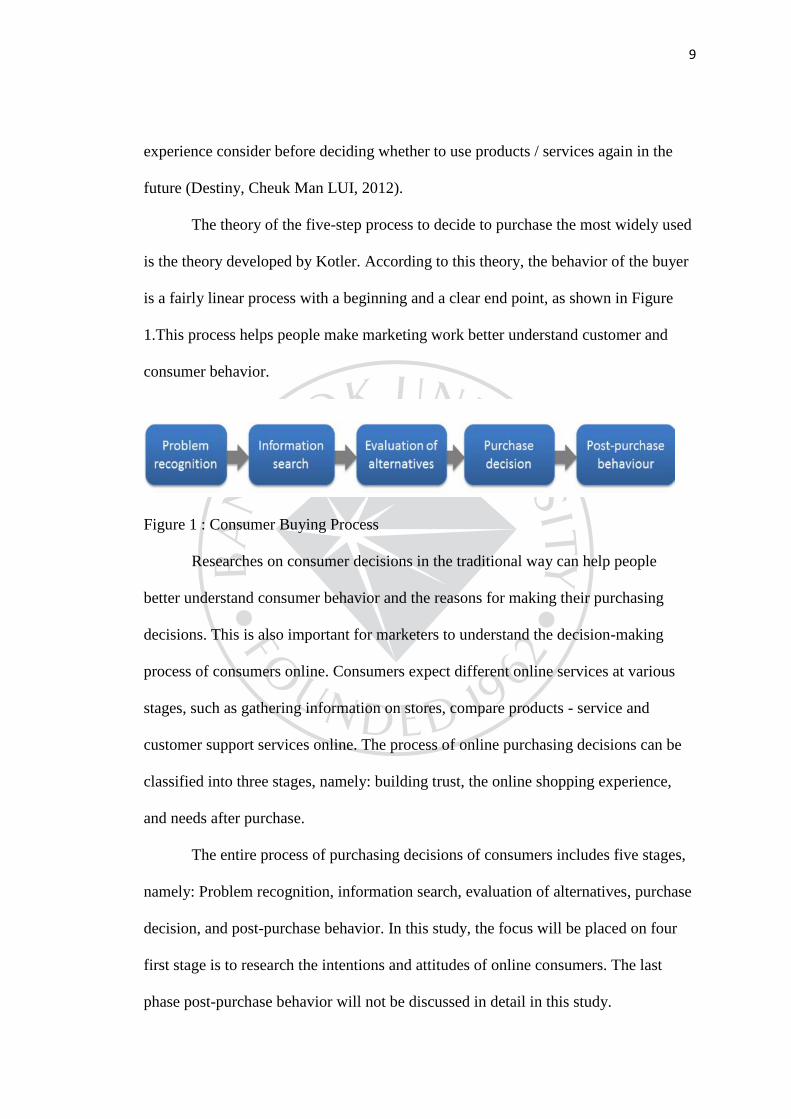
The theory of the five-step process to decide to purchase the most widely used
is the theory developed by Kotler. According to this theory, the behavior of the buyer
is a fairly linear process with a beginning and a clear end point, as shown in Figure
1.This process helps people make marketing work better understand customer and
consumer behavior.
Figure 1 : Consumer Buying Process
Researches on consumer decisions in the traditional way can help people
better understand consumer behavior and the reasons for making their purchasing
decisions. This is also important for marketers to understand the decision-making
process of consumers online. Consumers expect different online services at various
stages, such as gathering information on stores, compare products - service and
customer support services online. The process of online purchasing decisions can be
classified into three stages, namely: building trust, the online shopping experience,
and needs after purchase.
The entire process of purchasing decisions of consumers includes five stages,
namely: Problem recognition, information search, evaluation of alternatives, purchase
decision, and post-purchase behavior. In this study, the focus will be placed on four
first stage is to research the intentions and attitudes of online consumers. The last
phase post-purchase behavior will not be discussed in detail in this study.

10
(1) Problem recognition
The trend of the consumer is to solve a problem depends on the degree of
difference between the desired and actual situation related. Problem recognition may
be the causes are caused by intrinsic factors such as consumer's financial situation and
the advertisements also. Advertising on the internet can be used in activating the
needs of consumers. Therefore, online sellers can capture potential customers at this
stage by anticipating the needs and problems of consumers.
(2) Information search
When consumers have demanded, they will begin collecting information to
solve problems that needs. This is very important for online sellers for help
salespeople know and understand the process of online purchasing decisions and
focus on how to attract consumers who are looking for information and supply giving
them the information they wanted. The researchers had previously said that the use of
the Internet have a positive impact on online shopping behavior of consumers and
intend to shop online (Dennis C., B. Harris L., and Sandhu, 2002). Potential online
customers to use the internet as a basis for collecting information and they tend to
have a positive attitude towards online shopping. Research by Citrin and partners
(2000) also suggested that creative consumers will impact on their propensity to shop
online directly. So in the information search stage, the creativity of consumers and
the way they use Internet affect positively to the online shopping behavior of
consumers (TakKee HUI and David WAN, 2004).
(3) Evaluation of alternatives
Whenhaving enough information necessary for the purchase, consumers will
assess between different alternatives among that information to make purchasing
11
decisions. In the traditional purchase decision process, consumers evaluate
alternatives by evaluating the performance of the product or service; consider the cost
of a purchase, the relevant factors that affect to purchase as social norms and
relationships with others and how the products are related to their individual (Jobber
D., 1998). As consumers evaluate alternatives in the online shopping process, the
safety of the transaction is also very important and has an impact on consumers'
decisions.
(4) Purchase decision
After the evaluation phase of alternatives, consumers have rated the selected
item. There are two factors affecting between evaluation stages and purchasing
decisions. The first is the attitude of others, loved ones, friends and colleagues of the
reference group may change the ranking of the selected item even if the consumer had
intended to buy. Secondly, there may be some situations factor affecting products may
suddenly raise or other needs more pressing. However, online shopping is often done
in a more private environment to the influence of others may be reduced at the time of
purchase decision. Even if a consumer has decided to exact product they will buy, still
have some sub decisions in a purchase decision is made. The sub decisions include
price range, the point of sale, time of purchase, quantity purchased, and payment
methods.
Despite all the theories about the recognition of the needs, searching for
information and evaluation as the basis for the decision to buy, there are some
situations cannot apply the theory above. This phenomenon is called impulse
shopping or impulsive shopping. Impulsive shopping occurs when consumers decide
to purchase based on impulse and their momentary feelings. Factors affecting impulse

12
shopping decisions are the personal standard that consumer has set for himself. If
consumers have set goals and targets certain, they will know exactly what they want,
so they are less likely to impulse shopping. The second is self-control. The third and
most important, the needs of consumers change. Even when the two components are
not affected, if they change their mind before, it will change buying decisions.
2.3 Choice Theory
According to the William Glasser Institute (2010), choice theory was
developed by Dr. William Glasser in the 1960’s which mention that choice theory
psychology is a new enlightenment of human behavior (The Glasser Institue Ireland,
n.d). According to Glasser’s theory (1998), choice theory emphasizes:
- Whatever we do is behave (both good and bad), all behaviors are chosen.
- We are internally motivated, not externally motivated by the world around us.
- If we are upset, unhappy that is because we choose behave like that.
- In the past, we are not victims otherwise we choose to be.
- We are never constantly seeking to live in our quality world (people, things,
activities, values and beliefs).
According to choice theory of Glasser (1998) shows that we choose
everything we do, it expresses that behavior is a constant attempt to satisfy one or
more of our five basic needs include: First is survival, this means people need to eat,
to drink, warm clothes, shelter…The second is to love and belonging, it is about our
relationship such as friendships, work, family or social that we belong to. Third is to
be powerful, people like to achieve things have status feel worthwhile such as victory
feeling, and have respect from others. Fourth is to be freedom, it is about our need for
independence. And the last one is to have fun, this is gives us contentment and

13
enjoyment. These needs are thought to be inborn and we are responsible for the
choices we make.
Basic concepts of choice theory: 10 Axioms.
1. There is only one person that we can control behavior is ourselves.
2. Information is all what we can get from other. How we solve that
information is our choice or their choice.
3. All long-lasting psychological problems are relationship problems.
4. Nowadays, the problem relationship is a part of life.
5. What happened in the past that was hurting has a great deal to do with
what we are today, but rethink this painful past contributes a little bit,
therefore what we need to do now is improve an important relationship.
6. We can only satisfy our needs by satisfying the all things in our
Quality World.
7. Whatever we do is behave.
8. All behavior is Total Behavior and is composed four components:
acting, thinking, feeling and physiology.
9. We can only control our feeling and physiology indirectly by how we
choose to act and think.
10. All total behavior is nominated by verbs and named by the part that is
the most recognizable.
2.4 Marketing Mix Theory (7Ps)
The 7Ps model is a marketing model that modifies the 4Ps model. The 7Ps is
generally used in the service industries. 7Ps Marketing model is one of the theories

14
advanced trends in the marketing status of corporate governance and organizational
governance.
Figure 2 : Three Levels of 7Ps Model
7Ps model consists of 3 levels: level 1 is "4P" means 4 basic elements of
marketing management. That group of solution (or strategic) Products, from concept
to product manufacturing, in that product definition is a set of benefits; The next
group is the solution Price, from the cost of distribution of discounting and consumer
prices; Next is the solution for the distribution and sales, and eventual solutions
Promotion of brand products.
- Product: A product is an item that is produced or built to meet consumer
needs and satisfaction of a certain group of people. The product can be tangible or
intangible objects (goods or service).
P7
Physical Environment
P1
Product
P2
Price P3
Place
P4
Promotion
P5
People
P6
Process
3 LEVELS OF 7Ps MODEL
LEVEL 3 >
LEADERSHIP SOLUTIONS
LEVEL 2 >
MANAGEMENT SOLUTIONS
LEVEL 1 >
MARKET SOLUTIONS

15
- Price: The price of the product is the level of money that a customer pays for
buying a product. Price is also a very important component of the marketing mix
definition as it determines your firm's survival and profit.
- Place: Place or distribution is very important part of the product mix
definition which be used to transfer products from the manufacturers to end users, or
who can be industrial users in B2C or B2B.
There are many distribution strategies, including: Exclusive, intensive,
selective distribution and franchising.
- Promotion: Promotion is an important component of marketing as defines
seller’s effort to encourage consumers to buy more products then it can boost brand
recognition and sales. Promotion is comprised of various elements like:
o Sales Organization: is one of popular activities in nowadays
because it can be attracting brands, consumers and measurable with the
amount of participants. (Wongmontha, 1999).
o Direct marketing: is communicate directly towards consumers
via mail order or catalogue sales.
o Public Relations: is to increasing brand image or company
reputation through press releases, sponsorship deals, seminars or exhibitions
and conferences.
o Advertising.
o Sales Promotion.
o Personal Selling.

16
- People: People are important in marketing because the company's employees
related directly to the business. Therefore, to become the successful business that is
important to hire and train the right employees to deliver superior service to customer.
- Process: Process is comprised of various elements like:
o Especially relevant to service industries.
o How are services consumed?
- Physical environment: This is comprised of various elements like:
o Facilities.
o Infrastructure.
o Service delivery.
2.5 Brand Equity Theory
Brand equity is understood as the unique value that the brand brings to the
stakeholders (business itself, customers, shareholders, employees ...). When talking
about brand equity, it is interested in two aspects. First, the perceived value is the
emotions, the feelings of consumers to the brand. Second, the financial value of
consumer behavior - they choose to use the brand of the organization or are
competitors.
17
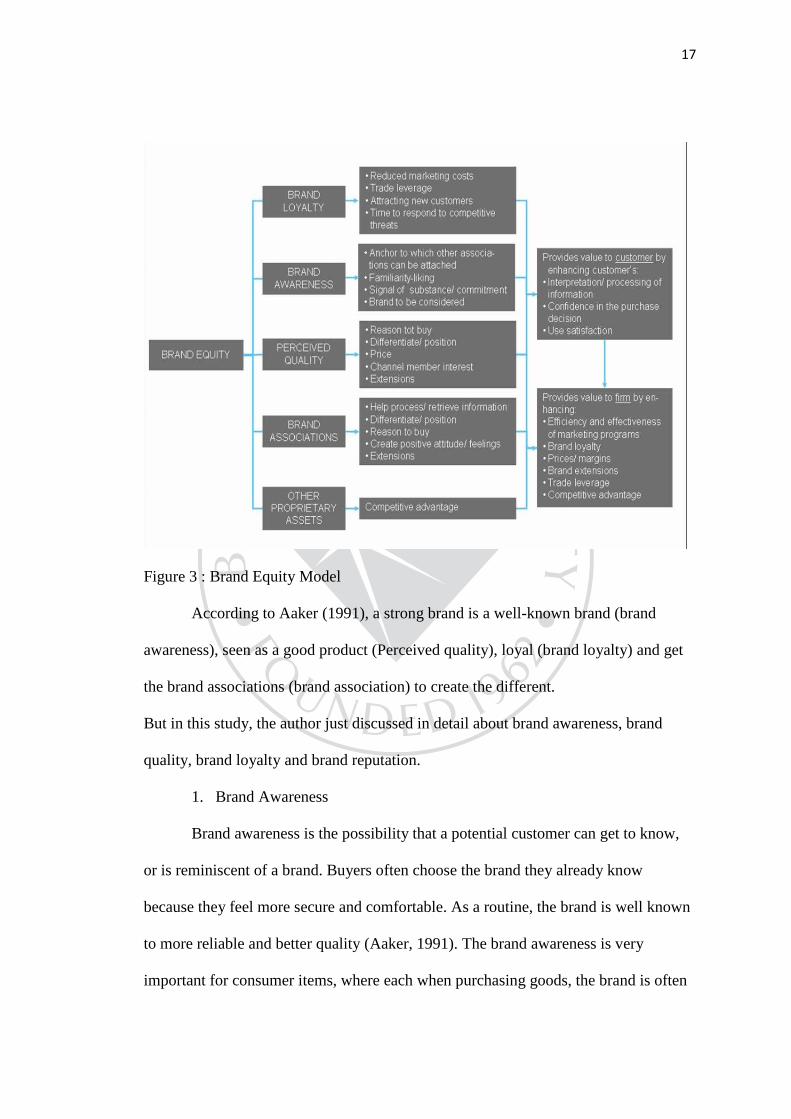
Figure 3 : Brand Equity Model
According to Aaker (1991), a strong brand is a well-known brand (brand
awareness), seen as a good product (Perceived quality), loyal (brand loyalty) and get
the brand associations (brand association) to create the different.
But in this study, the author just discussed in detail about brand awareness, brand
quality, brand loyalty and brand reputation.
1. Brand Awareness
Brand awareness is the possibility that a potential customer can get to know,
or is reminiscent of a brand. Buyers often choose the brand they already know
because they feel more secure and comfortable. As a routine, the brand is well known
to more reliable and better quality (Aaker, 1991). The brand awareness is very
important for consumer items, where each when purchasing goods, the brand is often

18
planned in advance. In this case, the brand is not known will not have the opportunity
to choose.
This attribute can be measured by the following indicators ladder:
• Top of mind: Referring to the first time when it comes to product
categories.
• Brand recall: They are able to think of brand and products of the
brand without suggest or recommend.
• Brand recognition: They are able to think of brand after suggesting
them some information related the brand.
• Unaware of brand: Means consumers never know that brand before.
2. Brand Quality
Perceived value, which is the difference between the total value consumers
receive and the value they expect from a product when deciding to buy at a certain
cost.
A brand often accompanied by an overall feel of the customers on product
quality. Brand quality will directly influence purchase decisions and customer loyalty,
especially in cases where the buyer does not have time or cannot thoroughly
researched product features before buying. Brand quality, and support for the
identification of a high-price policy will therefore create more profits for reinvestment
in branding.
3. Brand Loyalty
According to the Pareto rule (1896) is usually applied many fields so the 20%
of customers will bring 80% of profits for the business. The strongest brands are
being recognized and guaranteed by the "fans" is. And add to that, the new clients
19
seeking a far costlier than maintaining old customers. This is particularly important in
markets where the transition to using the products of competitors more easily. For a
loyal customer base, the company has been a huge benefit that customers will be
introduced and persuaded family and friends use the company's products.
In addition, brand loyalty will make competitors frustrated in trying to entice
new customers because of the cost that they would spend so large that it does not
effectively bringing high.
It can be asserted that customer loyalty is the greatest asset of a brand.
4. Brand Reputation
Brand reputation refers to how a particular brand as the overall quality or
character as viewed by others in general. When consumers trust your company, and
always feel good about purchasing your services or goods mean there is a favorable
brand reputation. On the other hand, an unfavorable brand reputation will cause
consumers to distrust your company and be hesitant about purchasing your products
or services.
2.6 Previous Related Researches
2.6.1 Theory of Reasoned Action – TRA
Theory of Reasoned Action TRA (Fishbein & Ajzen, 1975) shows that the
combination of the components of the attitude in a structure designed to anticipate and
better analysis of consumer behavior in society based on two fundamental concepts:
(1) The attitude of consumers towards the implementation of acts.
(2) The subjective norm of consumer.
The attitude of the TRA can be considered as the model of multi-attribute
behavior (Fishbein & Ajzen, 1975).
20
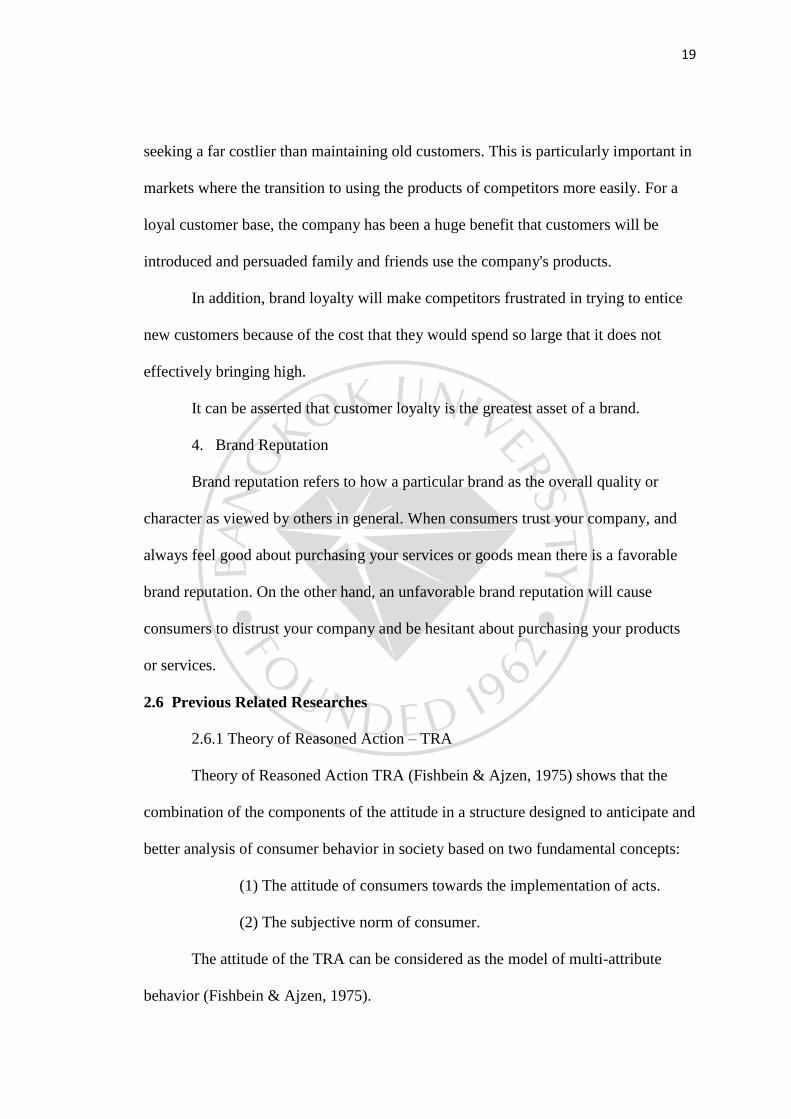
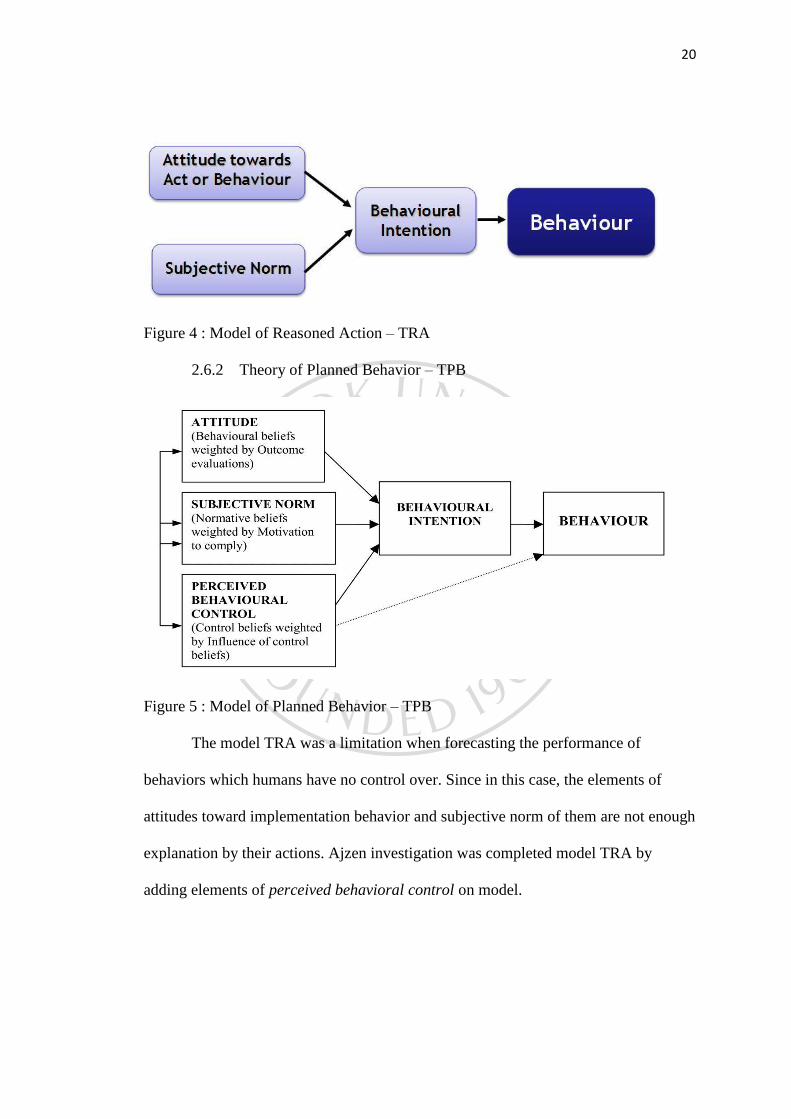
Figure 4 : Model of Reasoned Action – TRA
2.6.2 Theory of Planned Behavior – TPB
Figure 5 : Model of Planned Behavior – TPB
The model TRA was a limitation when forecasting the performance of
behaviors which humans have no control over. Since in this case, the elements of
attitudes toward implementation behavior and subjective norm of them are not enough
explanation by their actions. Ajzen investigation was completed model TRA by
adding elements of perceived behavioral control on model.
21
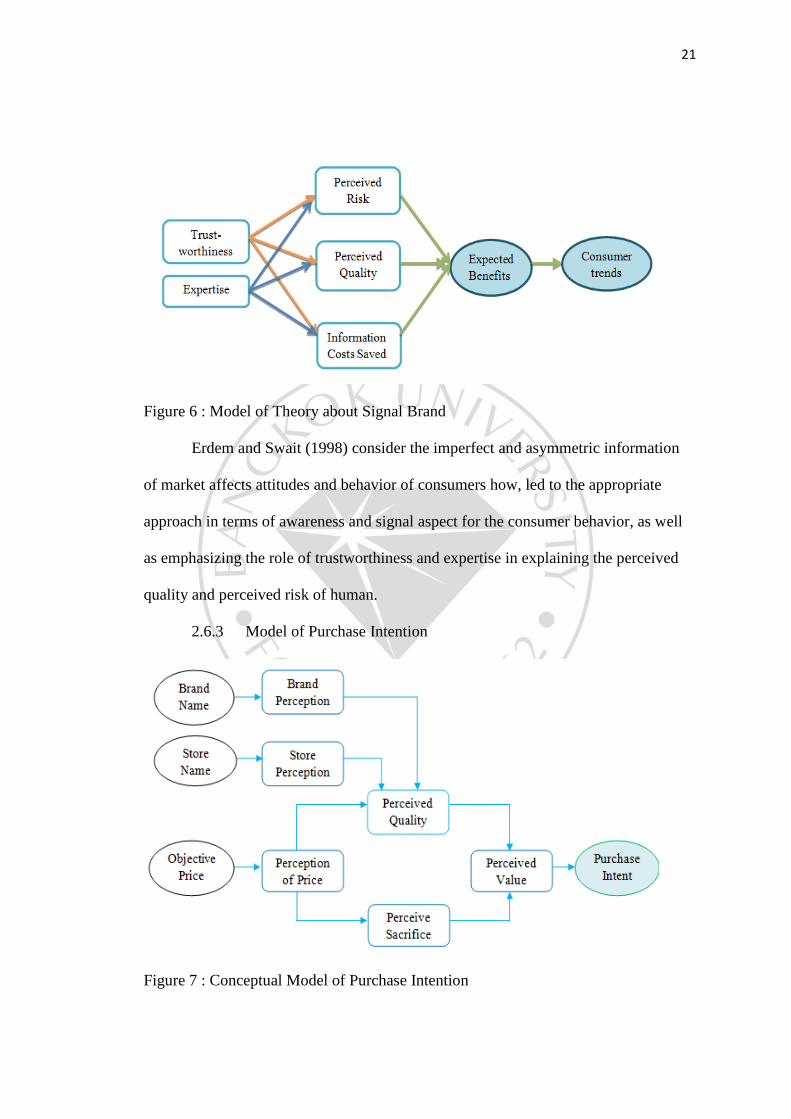
Figure 6 : Model of Theory about Signal Brand
Erdem and Swait (1998) consider the imperfect and asymmetric information
of market affects attitudes and behavior of consumers how, led to the appropriate
approach in terms of awareness and signal aspect for the consumer behavior, as well
as emphasizing the role of trustworthiness and expertise in explaining the perceived
quality and perceived risk of human.
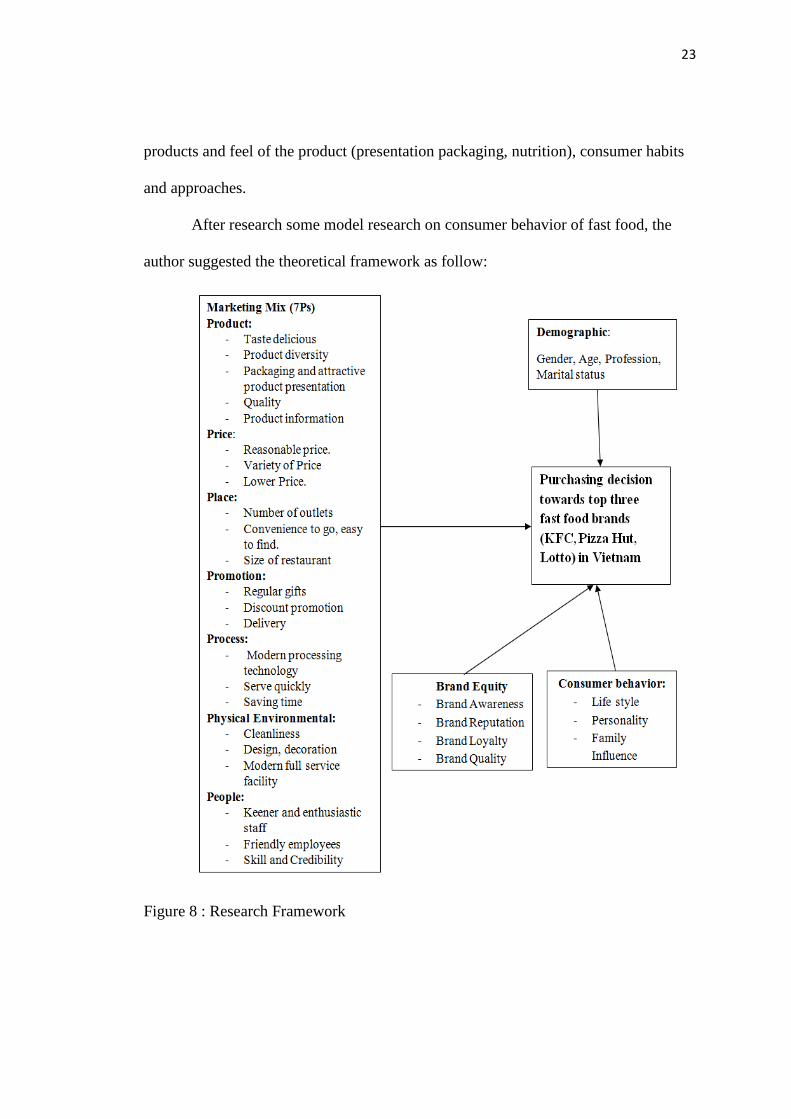
2.6.3 Model of Purchase Intention
Figure 7 : Conceptual Model of Purchase Intention

22
Based on the model of Zeithaml (1998) assumed price and brand are two
important elements of perceived quality and the positive impact of consumer trends.
Dodds, Monroe, Grewal 1991 were built a model to checking the relationship directly
and indirectly among exogenous factors (price, brand, store name) to assess buyer's
product about factors related to perception and have an impact on consumption trends.
Research shows that important roles of the value that consumers perceive. This value
may promote or hinder select a brand because this value is the result of received
quality and cost was spent of the consumer.
2.7 Theoretical Framework
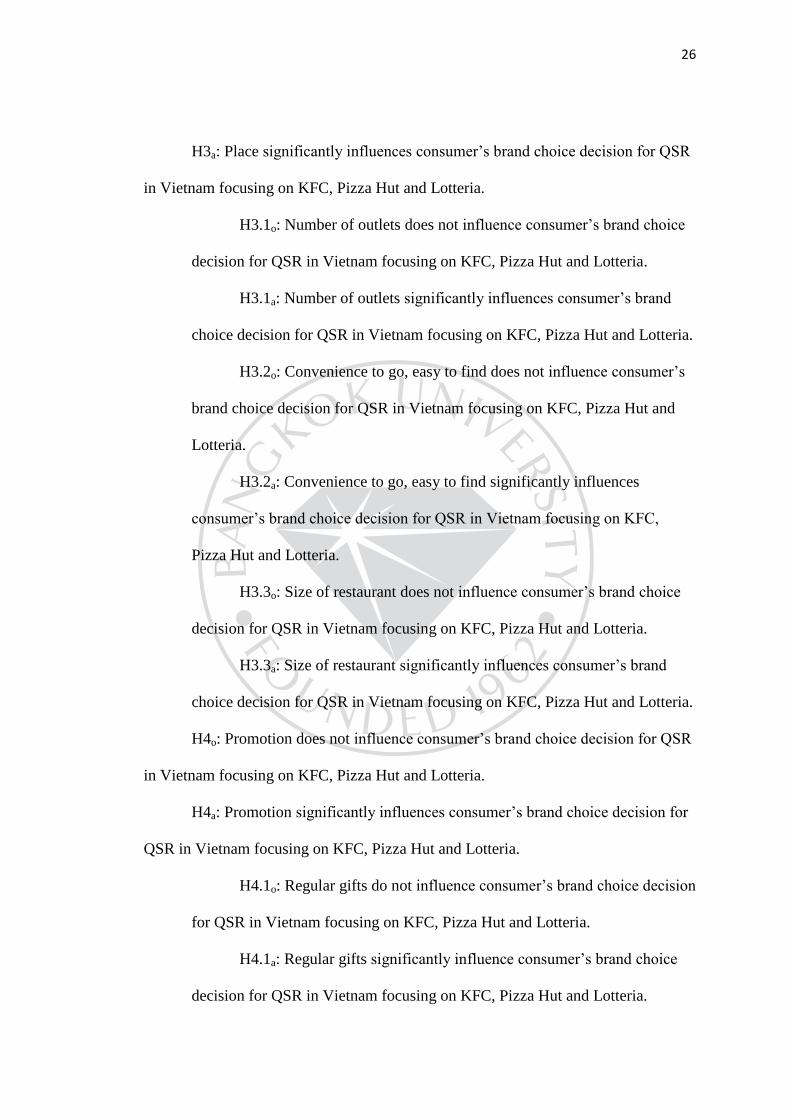
According to Cuma (2001), price, health issues will greatly affect to
consumption of fast food. And follow M. Iqbal Zafar (2002), factors influence to fast
food consumer behavior in Pakistan are: the amount of spending on fast food,
product's information, feeling about fast food (delicious, taste...), a type of fast food
that consumers often use, price, appreciate the style of serving staff. Meanwhile,
research by Van (2010) pointed out that convenience, taste, health, television is the
main reason to choose fast food. Pattaraporn (2011) theorized that demographic
factors, psychological factors, and the marketing mix (7Ps) are the factors that
influence selection of fast food, in that the major factors have a big impact to fast food
such as the happiness while using fast food, the members in family like fast food, fast
food is the modern consumer's style, reasonable price, price variety, packaging,
quality prices, promotional discounts. In Vietnam, the study by Luu (2011) shows that
the quality, hygiene and food safety are an important group of factors influence
consumer behavior canned food originating from China, followed by price and utility
23
products and feel of the product (presentation packaging, nutrition), consumer habits
and approaches.
After research some model research on consumer behavior of fast food, the
author suggested the theoretical framework as follow:
Figure 8 : Research Framework

24
2.8 Hypotheses
After considering the theories, the research problem and objective for thus
study, these are the following hypothesis:
H1o: Product does not influence consumer’s brand choice decision for QSR in
Vietnam focusing on KFC, Pizza Hut and Lotteria.
H1a: Product significantly influences consumer’s brand choice decision for
QSR in Vietnam focusing on KFC, Pizza Hut and Lotteria.
H1.1o: Taste delicious does not influence consumer’s brand choice
decision for QSR in Vietnam focusing on KFC, Pizza Hut and Lotteria.
H1.1a: Taste delicious significantly influences consumer’s brand
choice decision for QSR in Vietnam focusing on KFC, Pizza Hut and Lotteria.
H1.2o: Product diversity does not influence consumer’s brand choice
decision for QSR in Vietnam focusing on KFC, Pizza Hut and Lotteria.
H1.2a: Product diversity significantly influences consumer’s brand
choice decision for QSR in Vietnam focusing on KFC, Pizza Hut and Lotteria.
H1.3o: Packaging and attractive product presentation does not
influence consumer’s brand choice decision for QSR in Vietnam focusing on
KFC, Pizza Hut and Lotteria.
H1.3a: Packaging and attractive product presentation significantly
influences consumer’s brand choice decision for QSR in Vietnam focusing on
KFC, Pizza Hut and Lotteria.
H1.4o: Quality does not influence consumer’s brand choice decision
for QSR in Vietnam focusing on KFC, Pizza Hut and Lotteria
25
H1.4a: Quality significantly influences consumer’s brand choice
decision for QSR in Vietnam focusing on KFC, Pizza Hut and Lotteria.
H1.5o: Product information does not influence consumer’s brand
choice decision for QSR in Vietnam focusing on KFC, Pizza Hut and Lotteria.
H1.5a: Product information significantly influences consumer’s brand
choice decision for QSR in Vietnam focusing on KFC, Pizza Hut and Lotteria.
H2o: Price does not influence consumer’s brand choice decision for QSR in
Vietnam focusing on KFC, Pizza Hut and Lotteria.
H2a: Price significantly influences consumer’s brand choice decision for QSR
in Vietnam focusing on KFC, Pizza Hut and Lotteria.
H2.1o: Reasonable price does not influence consumer’s brand choice
decision for QSR in Vietnam focusing on KFC, Pizza Hut and Lotteria.
H2.1a: Reasonable price significantly influences consumer’s brand
choice decision for QSR in Vietnam focusing on KFC, Pizza Hut and Lotteria.
H2.2o: Variety of price does not influence consumer’s brand choice
decision for QSR in Vietnam focusing on KFC, Pizza Hut and Lotteria.
H2.2a: Variety of price significantly influences consumer’s brand
choice decision for QSR in Vietnam focusing on KFC, Pizza Hut and Lotteria.
H2.3o: Lower price does not influence consumer’s brand choice
decision for QSR in Vietnam focusing on KFC, Pizza Hut and Lotteria.
H2.3o: Lower price significantly influences consumer’s brand choice
decision for QSR in Vietnam focusing on KFC, Pizza Hut and Lotteria.
H3o: Place does not influence consumer’s brand choice decision for QSR in
Vietnam focusing on KFC, Pizza Hut and Lotteria.
26
H3a: Place significantly influences consumer’s brand choice decision for QSR
in Vietnam focusing on KFC, Pizza Hut and Lotteria.
H3.1o: Number of outlets does not influence consumer’s brand choice
decision for QSR in Vietnam focusing on KFC, Pizza Hut and Lotteria.
H3.1a: Number of outlets significantly influences consumer’s brand
choice decision for QSR in Vietnam focusing on KFC, Pizza Hut and Lotteria.
H3.2o: Convenience to go, easy to find does not influence consumer’s
brand choice decision for QSR in Vietnam focusing on KFC, Pizza Hut and
Lotteria.
H3.2a: Convenience to go, easy to find significantly influences
consumer’s brand choice decision for QSR in Vietnam focusing on KFC,
Pizza Hut and Lotteria.
H3.3o: Size of restaurant does not influence consumer’s brand choice
decision for QSR in Vietnam focusing on KFC, Pizza Hut and Lotteria.
H3.3a: Size of restaurant significantly influences consumer’s brand
choice decision for QSR in Vietnam focusing on KFC, Pizza Hut and Lotteria.
H4o: Promotion does not influence consumer’s brand choice decision for QSR
in Vietnam focusing on KFC, Pizza Hut and Lotteria.
H4a: Promotion significantly influences consumer’s brand choice decision for
QSR in Vietnam focusing on KFC, Pizza Hut and Lotteria.
H4.1o: Regular gifts do not influence consumer’s brand choice decision
for QSR in Vietnam focusing on KFC, Pizza Hut and Lotteria.
H4.1a: Regular gifts significantly influence consumer’s brand choice
decision for QSR in Vietnam focusing on KFC, Pizza Hut and Lotteria.
27
H4.2o: Discount promotion does not influence consumer’s brand
choice decision for QSR in Vietnam focusing on KFC, Pizza Hut and Lotteria.
H4.2a: Discount promotion significantly influences consumer’s brand
choice decision for QSR in Vietnam focusing on KFC, Pizza Hut and Lotteria.
H4.3o: Delivery does not influence consumer’s brand choice decision
for QSR in Vietnam focusing on KFC, Pizza Hut and Lotteria.
H4.3a: Delivery significantly influences consumer’s brand choice
decision for QSR in Vietnam focusing on KFC, Pizza Hut and Lotteria.
H5o: Process does not influence consumer’s brand choice decision for QSR in
Vietnam focusing on KFC, Pizza Hut and Lotteria.
H5a: Process significantly influences consumer’s brand choice decision for
QSR in Vietnam focusing on KFC, Pizza Hut and Lotteria.
H5.1o: Modern processing technology does not influence consumer’s
brand choice decision for QSR in Vietnam focusing on KFC, Pizza Hut and
Lotteria.
H5.1a: Modern processing technology significantly influences
consumer’s brand choice decision for QSR in Vietnam focusing on KFC,
Pizza Hut and Lotteria.
H5.2o: Serve quickly does not influence consumer’s brand choice
decision for QSR in Vietnam focusing on KFC, Pizza Hut and Lotteria.
H5.2a: Serve quickly does not influence consumer’s brand choice
decision for QSR in Vietnam focusing on KFC, Pizza Hut and Lotteria.
H5.3o: Saving time does not influence consumer’s brand choice
decision for QSR in Vietnam focusing on KFC, Pizza Hut and Lotteria.

28
H5.3a: Saving time significantly influences consumer’s brand choice
decision for QSR in Vietnam focusing on KFC, Pizza Hut and Lotteria.
H6o: Physical environment does not influence consumer’s brand choice
decision for QSR in Vietnam focusing on KFC, Pizza Hut and Lotteria.
H6a: Physical environment significantly influences consumer’s brand choice
decision for QSR in Vietnam focusing on KFC, Pizza Hut and Lotteria.
H6.1o: Cleanliness does not influence consumer’s brand choice
decision for QSR in Vietnam focusing on KFC, Pizza Hut and Lotteria.
H6.1a: Cleanliness significantly influences consumer’s brand choice
decision for QSR in Vietnam focusing on KFC, Pizza Hut and Lotteria.
H6.2o: Design, decoration does not influence consumer’s brand choice
decision for QSR in Vietnam focusing on KFC, Pizza Hut and Lotteria.
H6.2a: Design, decoration significantly influences consumer’s brand
choice decision for QSR in Vietnam focusing on KFC, Pizza Hut and Lotteria.
H6.3o: Modern full service facility does not influence consumer’s
brand choice decision for QSR in Vietnam focusing on KFC, Pizza Hut and
Lotteria.
H6.3a: Modern full service facility significantly influences consumer’s
brand choice decision for QSR in Vietnam focusing on KFC, Pizza Hut and
Lotteria.
H7o: People do not influence consumer’s brand choice decision for QSR in
Vietnam focusing on KFC, Pizza Hut and Lotteria.
H7a: People significantly influence consumer’s brand choice decision for QSR
in Vietnam focusing on KFC, Pizza Hut and Lotteria.

29
H7.1o: Keener and enthusiastic staff does not influence consumer’s
brand choice decision for QSR in Vietnam focusing on KFC, Pizza Hut and
Lotteria.
H7.1a: Keener and enthusiastic staff significantly influences
consumer’s brand choice decision for QSR in Vietnam focusing on KFC,
Pizza Hut and Lotteria.
H7.2o: Friendly employee does not influence consumer’s brand choice
decision for QSR in Vietnam focusing on KFC, Pizza Hut and Lotteria.
H7.2a: Friendly employee significantly influences consumer’s brand
choice decision for QSR in Vietnam focusing on KFC, Pizza Hut and Lotteria.
H7.3o: Skill and Credibility does not influence consumer’s brand
choice decision for QSR in Vietnam focusing on KFC, Pizza Hut and Lotteria.
H7.3a: Skill and Credibility significantly influences consumer’s brand
choice decision for QSR in Vietnam focusing on KFC, Pizza Hut and Lotteria.
H8o: Brand equity does not influence consumer’s brand choice decision for
QSR in Vietnam focusing on KFC, Pizza Hut and Lotteria.
H8a: Brand equity significantly influences consumer’s brand choice decision
for QSR in Vietnam focusing on KFC, Pizza Hut and Lotteria.
H8.1o: Brand Awareness does not influence consumer’s brand choice
decision for QSR in Vietnam focusing on KFC, Pizza Hut and Lotteria.
H8.1a: Brand Awareness significantly influences consumer’s brand
choice decision for QSR in Vietnam focusing on KFC, Pizza Hut and Lotteria.
H8.2o: Brand reputation does not influence consumer’s brand choice
decision for QSR in Vietnam focusing on KFC, Pizza Hut and Lotteria.
30
H8.2a: Brand reputation significantly influences consumer’s brand
choice decision for QSR in Vietnam focusing on KFC, Pizza Hut and Lotteria.
H8.3o: Brand Loyalty does not influence consumer’s brand choice
decision for QSR in Vietnam focusing on KFC, Pizza Hut and Lotteria.
H8.3a: Brand Loyalty significantly influences consumer’s brand choice
decision for QSR in Vietnam focusing on KFC, Pizza Hut and Lotteria.
H8.4o: Brand Quality does not influence consumer’s brand choice
decision for QSR in Vietnam focusing on KFC, Pizza Hut and Lotteria.
H8.4a: Brand Quality significantly influences consumer’s brand choice
decision for QSR in Vietnam focusing on KFC, Pizza Hut and Lotteria.
31
CHAPTER 3
METHODOLOGY
In this chapter, it presents the discussion on research and the methodology be
used. It also discusses description of the research design, population and samples,
research instrument, research reliability, data collection and statistic for data analysis.
3.1 Research design
The study pursues the quantitative method because its output is derived from a
great deal of primary data which makes it more solid and measurable (Qualitative and
Quantitative Research, n.d.). The sampling method is convenience sampling, which is
a measurement in non-probability sampling category. The survey is implemented by
distributing a self-administered questionnaire such as shopping complex, supermarket,
and store in HCMC where KFC, Pizza Hut and Lotteria brands have. According to
Gingery (2011), answering without skilled interviewers probably mislead respondents
in some points.
3.2 Population and Samples
Population
Population from this study identified as the customers from KFC, Pizza Hut
and Lotteria which are located in HCMC, Vietnam.
Sample and Sample Size
A sample from this study is customers from KFC, Pizza Hut and Lotteria,
which are located in HCMC, Vietnam; however the population in this study is infinite
population. So, according to Pongwichai (2009), the researcher will determine sample
size by applying an equation at confidences level of 95% and precision levels = 0.05.

32
Sample size (n) =
.
Where e = the level of precision (= 0.05 at the confidence level of 95%)
Z = 1.96 at the confidence level of 95%. The value for Z is found in statistical
tables which contain the area under the normal curve.
Applied the fomular: (n) =
( )
( ) = 385 customers
Therefore, the sample size in this study is 385 people who are the customers
from KFC, Pizza Hut and Lotteria, which are located in HoChiMinh, Vietnam.
Nevertheless, this study compares relationship of marketing mix, brand name and
customer behavior among three different fast food brands in HoChiMinh, Vietnam,
consequently the researcher extended the margin of error by adding up sample size
sample to 400 customers.
3.3 Research Instruments
The researcher used questionnaire as an instrument to collect data in order to
examine and identify what aspects within the marketing mix (7Ps), brand equity and
customer behavior that help contribute to purchasing decision. The questionnaire
consists of four parts as followed:
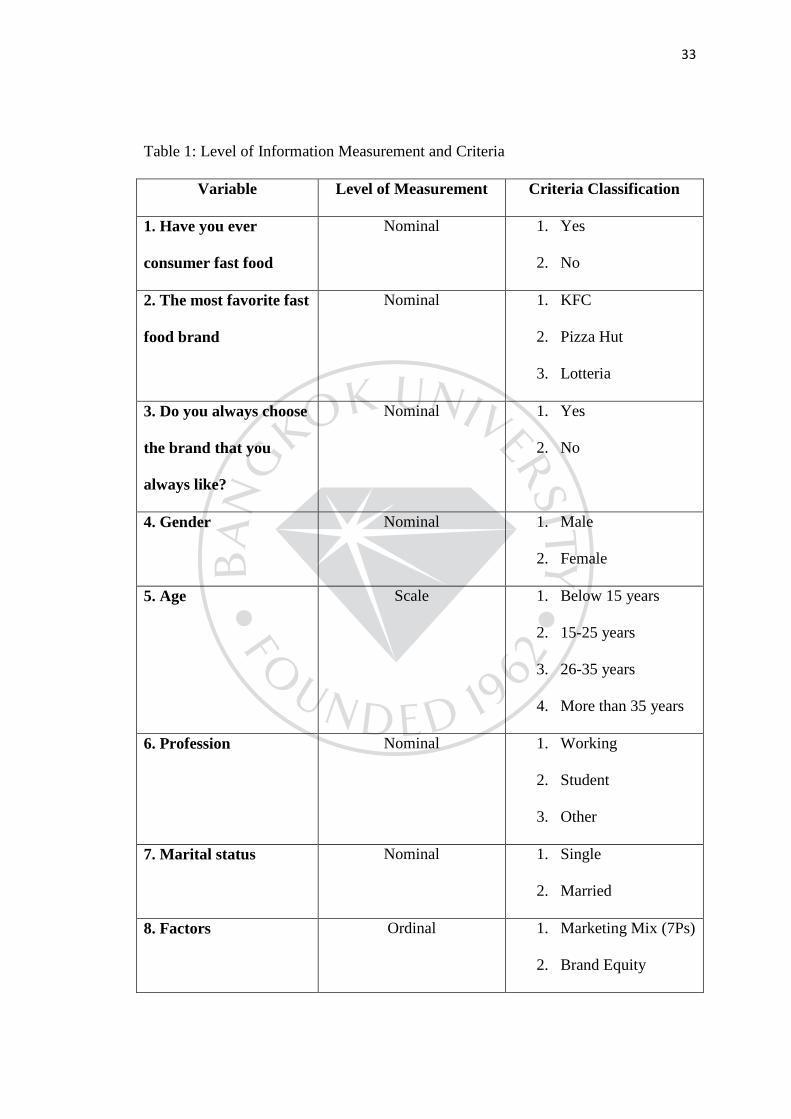
Part 1: Comprise of general information and demographics: Such as gender,
age, profession, status, the most favorite fast food brand, factors… The questions are
close-ended questionnaire and the answer to each question is a check list type with a
total number of 7 questions and the 1 question is in Likert Scale to the checking
influence level of factors.
33
Table 1: Level of Information Measurement and Criteria
Variable Level of Measurement Criteria Classification
1. Have you ever
consumer fast food
Nominal 1. Yes
2. No
2. The most favorite fast
food brand
Nominal 1. KFC
2. Pizza Hut
3. Lotteria
3. Do you always choose
the brand that you
always like?
Nominal 1. Yes
2. No
4. Gender Nominal 1. Male
2. Female
5. Age Scale 1. Below 15 years
2. 15-25 years
3. 26-35 years
4. More than 35 years
6. Profession Nominal 1. Working
2. Student
3. Other
7. Marital status Nominal 1. Single
2. Married
8. Factors Ordinal 1. Marketing Mix (7Ps)
2. Brand Equity

34
Part 2: Questions about marketing mix (7Ps) in a Likert Scale: The questions
consist of seven dimensions presented in marketing mix which are
1. Product (5 questions)
1.1 Taste delicious.
1.2 Product diversity.
1.3 Packaging and attractive product presentation.
1.4 Quality.
1.5 Product information.
2. Price (3 questions)
2.1 Reasonable Price.
2.2 Variety of Price.
2.3 Lower Price.
3. Place (3 questions)
3.1 Number of outlets.
3.2 Convenience to go, easy to find.
3.3 Size of restaurant.
4. Promotion (3 questions)
4.1 Regular gifts.
4.2 Discount promotion.
4.3 Delivery.
5. Process (3 questions)
5.1 Modern processing technology.
5.2 Serve quickly.
5.3 Saving time.
35
6. Physical environment (3 questions)
6.1 Cleanliness.
6.2 Design, decoration.
6.3 Modern full service facility.
7. People (3 questions)
7.1 Keener and enthusiastic staff.
7.2 Friendly employees.
7.3 Skill and Credibility.
Part 3: Questions about Brand equity in a Likert Scale: The questions consist
of four dimensions presented in brand which are:
1. Brand Awareness.
2. Brand Reputation.
3. Brand Loyalty.
4. Brand Quality.
All items were rated by respondents on a five-point Likert scale. Each
questions scaled from “Strongly Disagree” to “Strong Agree” statement with the
weight (score) are set from 5 points to 1 point.
Interval Class = ( )
=
( )
= 0.8
Therefore, the average score can be translating as
Average score of 4.21 – 5.00 refers to a highest level
Average score of 3.41 – 4.20 refers to a high level
Average score of 2.61 – 3.40 refers to a medium level.
Average score of 1.81 – 2.60 refers to a low level
Average score of 1.00 – 1.80 refers to a lowest level

36
Part 4: Consumer Behavior: The questions are close-ended questionnaire and
the answer of each question is check list type with a total number of 8 questions.
1. Do you usually cook at home for daily meals or eat outside?
2. You like to visit food joint with?
3. How much do you spend for fast food each time?
4. How often do you purchase fast food?
5. What is your meal that you prefer to consume fast food?
6. Which taste do you prefer to eat?
7. Do you think that fast food restaurant fit well with your lifestyle?
8. Do you think that personal desire has an effect on your purchasing fast
food brands?
3.4 Research Reliability
In this chapter, the researcher used a survey research by distributing the
questionnaires to the sample units. Before distributing the questionnaire, the
researcher will do with 30 surveys first, for check the reliability statistics. The
reliability test for this research is processed on computer program by using
Cronbach’s alpha coefficient. If the reliability statistics of the survey is more than 0.7,
the questionnaires reliability is acceptable (Cronbach, 1951; Olorunniwo et al., 2006).
Table a: Reliability Statistics
Cronbach's Alpha N of Items
.966 50
The value of Cronbach’s alpha coefficient of the 30 pre-test questionnaires is
0.966 with n of items = 50. As a result, shown in Table 2, the value of Cronbach’s

37
alpha for general information and demographics, marketing mix (7Ps), brand equity
and consumer behavior are 0.876, 0.980, 0.870, 0.741 respectively. And all acceptable
value of alpha should be about 0.7 (Olorunniwo et al., 2006). From this
questionnaires, the overall Cronbach’s alpha coefficient value is all higher than the
benchmark value of 0.7 and has the value higher than 0.9 therefore according to
Cronbach (1951); Olorunniwo et al. (2006) this questionnaire has a high reliability
level and the desirability level is good.
Table 2: The Result of Cronbach’s Alpha Test with 30 Try-out Questionnaires
Variables Cronbach’s Alpha Number of Items
All Parts
General Information and Demographics
Marketing Mix (7Ps)
Brand Name
Consumer Behavior
.966
.876
.980
.870
.741
50
15
23
4
8
3.5 Data Collection
In this study, data used within this research comprise of two types of data,
which are primary and secondary data.
1. Primary Data are data received from questionnaire instruments that has been
self-administered by sample group which are customers from KFC, Pizza Hut and
Lotteria shops that located in HCMC, Vietnam with the total number of
questionnaires is 400 copies.

38
2. Secondary Data are information that has been collected from the review of
literature in related topics such as books, articles, research and the Internet.
Data collection process has been done in the December of 2015 to January of
2016 by distributing a self-administered questionnaire in area of HCMC, Vietnam
such as shopping complex, supermarket, and store. In order to receive the target
amount of questionnaire from each brand, the researcher used screening question
before distributing questionnaire as “Have you ever consumer fast food?” If the
respondents choose yes, the researcher will hand out a specific brand questionnaire to
the respondents and wait until the respondents finish the questionnaire to collect it.
The process will be repeating till target amount has been fulfilled.
3.6 Multinomial Logistic Regression
Multinomial logistic regression is the linear regression analysis to perform
when the dependent variable is insignificant with equal or more than two levels.
Therefore, it is an extension of logistic regression, which analyzes binary dependents.
Since the SPSS output of the analysis is a little different to the logistic regression
output, multinomial regression is sometimes used instead.
Same all linear regressions, the multinomial regression is a predictive analysis.
Multinomial regression is used to explain and describe data and the relationship
between one or more continuous-level independent variables and one dependent
nominal variable. In this study, the author assumed that dependent variable is
“Purchasing decision towards top three fast food brands KFC, Pizza Hut and Lotteria
in Vietnam”, and some independent variables are marketing mix (7Ps), brand equity,
demographics and consumer behavior.

39
Standard linear regression requests the dependent variable to be of continuous-
level scale. Logistic regression leaps the gap by supposing that the dependent variable
is a stochastic event. The dependent variable defines the outcome of this stochastic
event with a density function (a function of cumulative probabilities ranging from 0 to
1). The author then contend one event happens if the probability is less than 0.05 and
the reverse event happens when probability is greater than 0.05.
There are two kinds of tests for individual independent variables: Likelihood
ratio test to estimate every relationship between a dependent variable and an
independent variable. The second type is the Wald test evaluates whether or not the
independent variable is statistically significant in dissimilar between the two groups in
each of the embedded binary logistic collation.
If an independent variable has an overall relationship to the dependent
variable, it may or may not be statistically significant in dissimilar between sets of
groups described by the dependent variable.
3.7 Statistic for Data Analysis
The data analysis process for this research is analyzed by SPSS statistic
program and present in table format with explanation on each.
- Descriptive statistic by using frequency and percentage to finding the
most favorite fast food brand in Vietnam.
- Cross tabulation to analyze categorical data classified in different
group for explaining general information and demographics data as age,
gender, profession, do you always choose the brand that you like and current
marital status.

40
- Multinomial logistic regression analysis to test hypotheses that both
variable groups are quantitative.

41
CHAPTER 4
DATA ANALYSIS AND FINDINGS
In this chapter, it shows the results from the data analyses that are presented.
The analysis part will be conducted by using the framework of references from the
second chapter and method given in the previous chapter.
Four hundred surveys were initially sent to people inside HCMC, Vietnam
such as KFC, Pizza Hut, Lotteria stores, or shopping malls, centers. With 400
returned, the response rate was 100%. It is divided into 3 parts which are following,
and SPSS program is used to analysis the data.
Part 1: The analysis of demographic and general information of samples by
using cross tabulation.
Part 2: The analysis of marketing mix (7Ps), brand equity by using
multinomial logistic regression.
Part 3: The analysis of customer behavior by using cross tabulation.
4.1 The analysis of demographic and general information of samples
For the first part – general information and demographics, the respondents
were asked about personal data such as the favorite fast food brand, age, gender,
profession, marital status...

42
Table 1: Frequency and Percentage of General Information; the most favorite fast
food brand
Valid Frequency Percent
KFC 167 41.8
Pizza Hut 108 27.0
Lotteria 125 31.3
Total 400 100.0
According to the information displayed in Table 3 shows that the most favorite
fast food brand is KFC which contain 167 respondents (41.8%) while 125 respondents
(31.3%) of Lotteria and 108 respondents (27%) of Pizza Hut.
Table 2: Cross tabulation of General Information; Always choose the favorite brand
Count
The brand that you always
choose Total
Yes No
The most favorite fast
food brand
KFC 119 48 167
Pizza Hut 91 17 108
Lotteria 96 29 125
Total 306 94 400
From Table 4, most of respondents choose KFC brand always chooses the
brand they like which equal to 119 respondents, and 48 respondents don’t always

43
choose the brand they like. 91 respondents choose Pizza Hut brand always chooses
the brand they like and 17 respondents don’t always choose the brand they like. For
respondents choose Lotteria brand, most of the respondents always choose the brand
they like which equal to 96 respondents, and 29 respondents don’t always choose the
brand they like.
Table 3: Cross tabulation of Demographics; Gender
Count
Gender
Total
Male Female
The most favorite fast food
brand
KFC 95 72 167
Pizza Hut 36 72 108
Lotteria 53 72 125
Total 184 216 400
According to the information displayed in Table 5 shows that the majority
gender of respondents chooses the KFC brand are male, which equal to 95
respondents and female 72 respondents. For respondents choose the Pizza Hut brand,
the majority gender is female which equal to 72 respondents, male 36 respondents.
For respondents choose the Lotteria brand, the majority gender is female which equal
to 72 respondents, male 53 respondents.

44
Table 4: Cross tabulation of Demographics; Age
Age
Total Below 15
years
15-25
years
26-35
years
More than
35 years
The most favorite
fast food brand
KFC 14 124 24 5 167
Pizza
Hut
14 65 26 3 108
Lotteria 6 95 16 8 125
Total 34 284 66 16 400
From Table 6 the majority age of respondents chooses the KFC brand are 15-
25 years old, which equal to 124 respondents, 26-35 years old 24 respondents, below
15 years old 14 respondents and more than 35 years old 5 respondents. For
respondents choose the Pizza Hut brand, the majority age is 15-25 years old which
equal to 65 respondents, 26-35 years old 26 respondents, below 15 years old 14
respondents and more than 35 years old 3 respondents respectively. For respondents
choose the Lotteria brand, the majority age is 15-25 years old which equal to 95
respondents, 26-35 years old 16 respondents, below 15 years old 6 respondents and
more than 35 years old 8 respondents respectively.

45
Table 5: Cross tabulation of Demographics; Profession
Profession
Total
Working Student Other
The most favorite fast
food brand
KFC 63 95 9 167
Pizza Hut 57 49 2 108
Lotteria 60 60 5 125
Total 180 204 16 400
From Table 7 the majority profession of respondents chooses the KFC brand
are student which equal to 95 respondents, followed by working 63 respondents and
other 9 respondents. For respondents choose the Pizza Hut brand, the majority
profession is working which equal to 57 respondents, followed by student 49
respondents and other 2 respondents. For respondents choose the Lotteria brand 60
respondents are student, 60 respondents are working and other 5 respondents.
Table 6: Cross tabulation of Demographics; Marital status
Marital status Total
Single Married
The most favorite fast food
brand
KFC 144 23 167
Pizza Hut 91 17 108
Lotteria 100 25 125
Total 335 65 400

46
According to the information displayed in Table 8 shows that the majority
marital status of respondents chooses the KFC brand are single, which equal to 144
respondents and married 23 respondents. For respondents choose the Pizza Hut brand,
the majority marital status is single which equal to 91 respondents and married 17
respondents. For respondents choose the Lotteria brand, the majority marital status is
single which equal to 100 respondents and married 25 respondents.
Generally, the most favorite fast-food brand is KFC and respondents always
choose the brand they like. Respondents are both male and female, however audience
targeting mainly are student, ages 15-25 years, and single, active, able to access
information easily.
4.2 The analysis of marketing mix (7Ps), brand equity
Table 7: Likelihood Ratio Tests
Effect Model Fitting
Criteria
Likelihood Ratio Tests
-2 Log Likelihood
of Reduced Model
Chi-Square df Sig.
(Q8.1) Product 424.532a 47.105 12 .000
(Q8.2) Price 394.785 17.358 12 .137
(Q8.3) Place 464.531 87.104 12 .000
(Q8.4) Promotion 426.210a 48.782 12 .000
(Q8.5) Process 447.771 70.344 12 .000
(Q8.6) Physical
Environment
442.695 65.268 12 .000

47
Table 8 (Continued): Likelihood Ratio Tests
Effect Model Fitting
Criteria
Likelihood Ratio Tests
-2 Log Likelihood
of Reduced Model
Chi-Square df Sig.
(Q8.7) People 470.269 92.842 12 .000
(Q8.8) Brand Equity 427.093 49.666 12 .000
The chi-square statistic is the difference in -2 log-likelihoods between the final
model and a reduced model. The reduced model is formed by omitting an effect
from the final model. The null hypothesis is that all parameters of that effect are 0.
a. Unexpected singularities in the Hessian matrix are encountered. This
indicates that either some predictor variables should be excluded or some
categories should be merged.
Based on Multinomial Logistic Regression, the author can pretty much reject
almost all hypotheses with more than 95% confidence (p-value < .05) except Price
variable that seems insignificantly influence brand choices. In conclusion, the author
can reject all null hypotheses (except H2o: beta_Price = 0 vs. H2a: beta_Price is not
equal zero), and accept alternative hypotheses that product, place, promotion, process,
physical environment, people and brand equity significantly influence consumer’s
brand choice decision for QSR in Vietnam focusing on KFC, Pizza Hut and Lotteria.
The hypothesis testing results are shown in Table 9 as followings;
H1a: Product significantly influences consumer’s brand choice decision for
QSR in Vietnam focusing on KFC, Pizza Hut and Lotteria (0.000 < 0.05).

48
H2o: Price does not significantly influences consumer’s brand choice decision
for QSR in Vietnam focusing on KFC, Pizza Hut and Lotteria (0.137 > 0.05).
H3a: Place significantly influences consumer’s brand choice decision for QSR
in Vietnam focusing on KFC, Pizza Hut and Lotteria (0.000 < 0.05).
H4a: Promotion significantly influences consumer’s brand choice decision for
QSR in Vietnam focusing on KFC, Pizza Hut and Lotteria (0.000 < 0.05).
H5a: Process significantly influences consumer’s brand choice decision for
QSR in Vietnam focusing on KFC, Pizza Hut and Lotteria (0.000 < 0.05).
H6a: Physical environment significantly influences consumer’s brand choice
decision for QSR in Vietnam focusing on KFC, Pizza Hut and Lotteria (0.000 < 0.05).
H7a: People significantly influences consumer’s brand choice decision for
QSR in Vietnam focusing on KFC, Pizza Hut and Lotteria (0.000 < 0.05).
H8a: Brand equity significantly influences consumer’s brand choice decision
for QSR in Vietnam focusing on KFC, Pizza Hut and Lotteria (0.000 < 0.05).
4.2.1 Findings of hypotheses testing for Marketing mix (7Ps)
Table 9: Finding of hypotheses testing for Product in Marketing mix (7Ps) (KFC)
The most favorite fast food branda B Std. Error Wald Df Sig.
KFC
[Q9.1=4] Taste delicious .615 .520 1.396 1 .237
[Q9.2=4] Product diversity .490 .429 1.306 1 .253

49
Table 10 (Continued): Finding of hypotheses testing for Product in Marketing mix
(7Ps) (KFC)
The most favorite fast food
branda
B Std. Error Wald Df Sig.
KFC
[Q9.3=4]
Packaging and
attractive product
presentation
-.995 .458 4.716 1 .030
[Q9.4=4] Quality -1.235 .333 13.722 1 .000
[Q9.5=4] Product
information
1.205 .447 7.263 1 .007
The hypothesis testing results are shown in Table 10 as followings;
H1.1o: Taste delicious does not significantly influence consumer’s brand
choice decision for QSR in HCMC, Vietnam (0.237 > 0.05).
H1.2o: Product diversity does not significantly influence consumer’s brand
choice decision for QSR in HCMC, Vietnam (0.253 > 0.05).
H1.3a: Packaging and attractive product presentation significantly influences
consumer’s brand choice decision for QSR in HCMC, Vietnam (0.03 < 0.05).
H1.4a: Quality significantly influences consumer’s brand choice decision for
QSR in HCMC, Vietnam (0.000 < 0.05).
H1.5a: Product information significantly influences consumer’s brand choice
decision for QSR in HCMC, Vietnam (0.007 < 0.05).
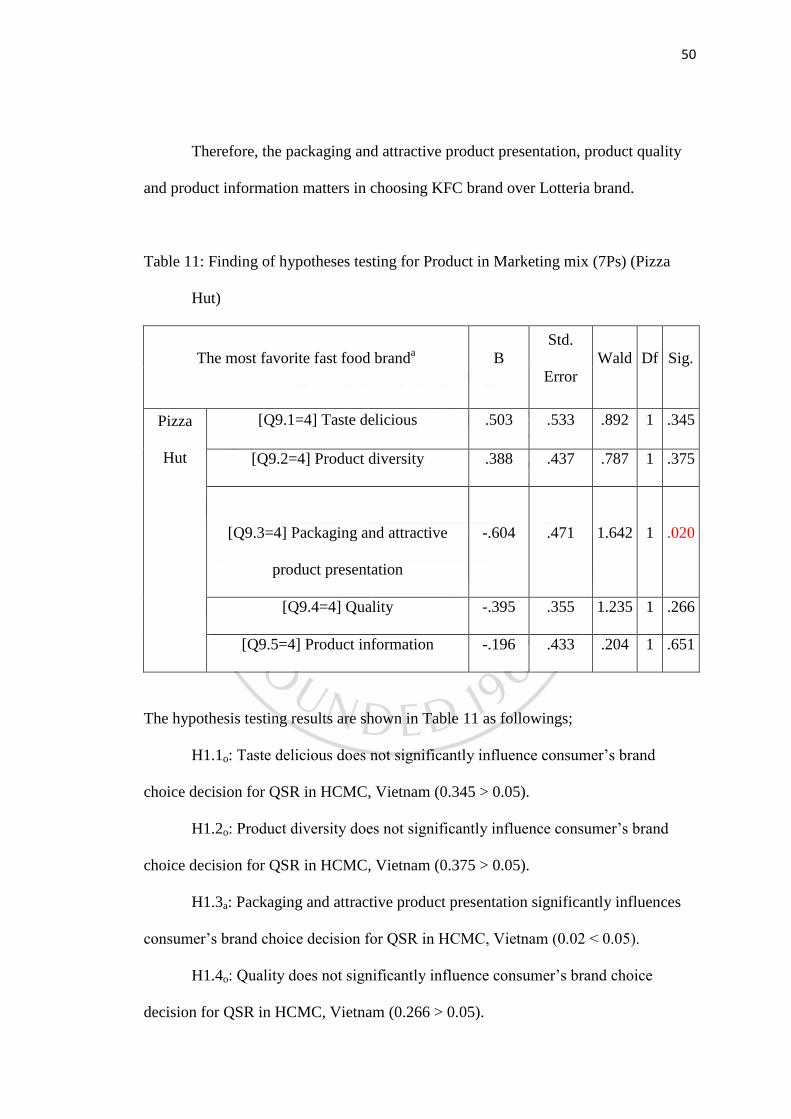
50
Therefore, the packaging and attractive product presentation, product quality
and product information matters in choosing KFC brand over Lotteria brand.
Table 11: Finding of hypotheses testing for Product in Marketing mix (7Ps) (Pizza
Hut)
The most favorite fast food branda B
Std.
Error
Wald Df Sig.
Pizza
Hut
[Q9.1=4] Taste delicious .503 .533 .892 1 .345
[Q9.2=4] Product diversity .388 .437 .787 1 .375
[Q9.3=4] Packaging and attractive
product presentation
-.604 .471 1.642 1 .020
[Q9.4=4] Quality -.395 .355 1.235 1 .266
[Q9.5=4] Product information -.196 .433 .204 1 .651
The hypothesis testing results are shown in Table 11 as followings;
H1.1o: Taste delicious does not significantly influence consumer’s brand
choice decision for QSR in HCMC, Vietnam (0.345 > 0.05).
H1.2o: Product diversity does not significantly influence consumer’s brand
choice decision for QSR in HCMC, Vietnam (0.375 > 0.05).
H1.3a: Packaging and attractive product presentation significantly influences
consumer’s brand choice decision for QSR in HCMC, Vietnam (0.02 < 0.05).
H1.4o: Quality does not significantly influence consumer’s brand choice
decision for QSR in HCMC, Vietnam (0.266 > 0.05).
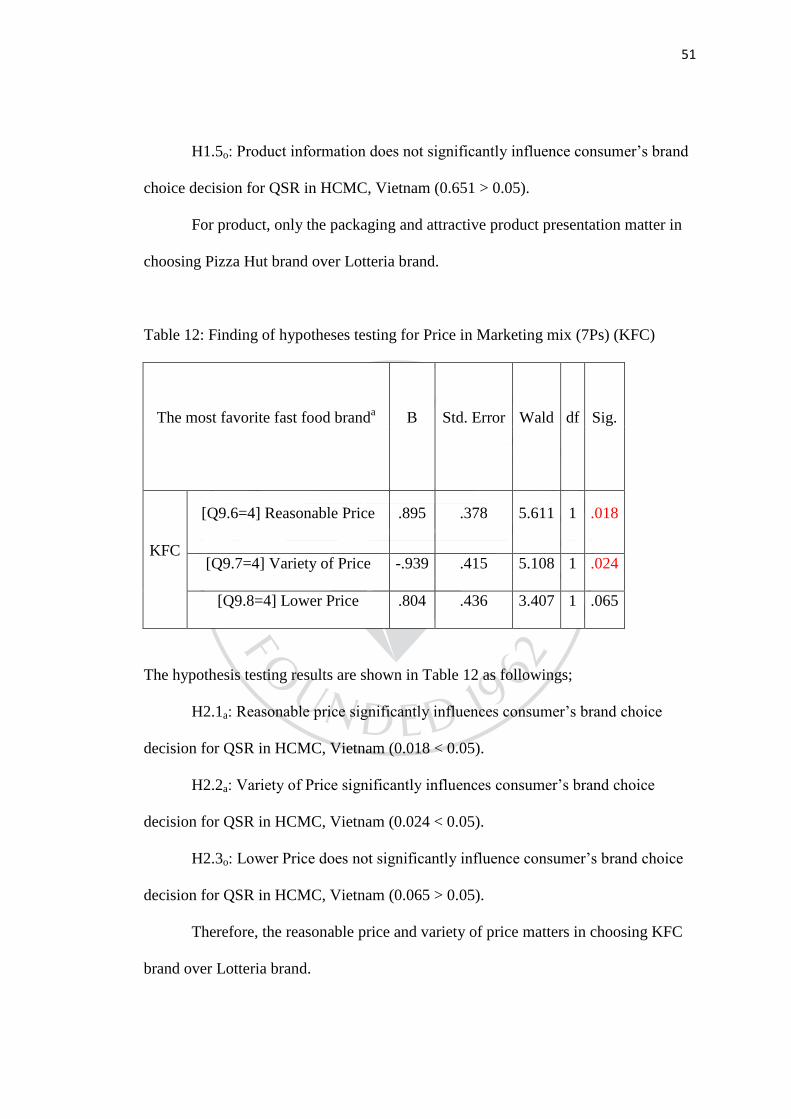
51
H1.5o: Product information does not significantly influence consumer’s brand
choice decision for QSR in HCMC, Vietnam (0.651 > 0.05).
For product, only the packaging and attractive product presentation matter in
choosing Pizza Hut brand over Lotteria brand.
Table 12: Finding of hypotheses testing for Price in Marketing mix (7Ps) (KFC)
The most favorite fast food branda B Std. Error Wald df Sig.
KFC
[Q9.6=4] Reasonable Price .895 .378 5.611 1 .018
[Q9.7=4] Variety of Price -.939 .415 5.108 1 .024
[Q9.8=4] Lower Price .804 .436 3.407 1 .065
The hypothesis testing results are shown in Table 12 as followings;
H2.1a: Reasonable price significantly influences consumer’s brand choice
decision for QSR in HCMC, Vietnam (0.018 < 0.05).
H2.2a: Variety of Price significantly influences consumer’s brand choice
decision for QSR in HCMC, Vietnam (0.024 < 0.05).
H2.3o: Lower Price does not significantly influence consumer’s brand choice
decision for QSR in HCMC, Vietnam (0.065 > 0.05).
Therefore, the reasonable price and variety of price matters in choosing KFC
brand over Lotteria brand.

52
Table 13: Finding of hypotheses testing for Price in Marketing mix (7Ps) (Pizza Hut)
The most favorite fast food branda B Std. Error Wald df Sig.
Pizza Hut
[Q9.6=4] Reasonable Price .663 .409 2.633 1 .024
[Q9.7=4] Variety of Price -.543 .440 1.529 1 .216
[Q9.8=4] Lower Price -.032 .475 .005 1 .946
As per above Table 13 shown the hypothesis testing results as followings:
H2.1a: Reasonable price significantly influences consumer’s brand choice
decision for QSR in HCMC, Vietnam (0.024 < 0.05).
H2.2o: Variety of Price does not significantly influence consumer’s brand
choice decision for QSR in HCMC, Vietnam (0.216 > 0.05).
H2.3o: Lower Price does not significantly influence consumer’s brand choice
decision for QSR in HCMC, Vietnam (0.946 > 0.05).
For Price, only reasonable price matter in choosing Pizza Hut brand over
Lotteria brand.
Table 14: Finding of hypotheses testing for Place in Marketing mix (7Ps) (KFC)
The most favorite fast food branda B Std. Error Wald df Sig.
KFC
[Q9.9=4] Number of outlets 1.138 .499 5.210 1 .022
[Q9.10=4] Convenience to go, easy to find -.903 .405 4.968 1 .026
[Q9.11=4] Size of restaurant. -.405 .443 .835 1 .361

53
The hypothesis testing results are shown in Table 14 as followings;
H3.1a: Number of outlets significantly influences consumer’s brand choice
decision for QSR in HCMC, Vietnam (0.022 < 0.05).
H3.2a: Convenience to go, easy to find significantly influences consumer’s
brand choice decision for QSR in HCMC, Vietnam (0.026 < 0.05).
H3.3o: Size of restaurant does not significantly influence consumer’s brand
choice decision for QSR in HCMC, Vietnam (0.361 > 0.05).
Therefore, for the Place: number of outlets, convenience to go and easy to find
matters in choosing KFC brand over Lotteria brand.
Table 15: Finding of hypotheses testing for Place in Marketing mix (7Ps) (Pizza Hut)
The most favorite fast food branda B
Std.
Error
Wald df Sig.
Pizza
Hut
[Q9.9=5] Number of outlets .375 .401 .878 1 .349
[Q9.10=4] Convenience to go, easy to
find
.184 .467 .154 1 .694
[Q9.11=4] Size of restaurant
-
1.063
.467 5.189 1 .023
As per above Table 15 shown the hypothesis testing results as followings:
H3.1o: Number of outlets does not significantly influence consumer’s brand
choice decision for QSR in HCMC, Vietnam (0.349 > 0.05).
H3.2a: Convenience to go, easy to find is not significantly influences
consumer’s brand choice decision for QSR in HCMC, Vietnam (0.694 > 0.05).

54
H3.3a: Size of restaurant significantly influences consumer’s brand choice
decision for QSR in HCMC, Vietnam (0.023 < 0.05).
For Place, only size of restaurant matter in choosing Pizza Hut brand over
Lotteria brand.
Table 16: Finding of hypotheses testing for Promotion in Marketing mix (7Ps) (KFC)
The most favorite fast food branda B Std. Error Wald df Sig.
KFC
[Q9.12=5] Regular gifts .824 .344 5.744 1 .017
[Q9.13=4] Discount promotion .358 .358 .999 1 .318
[Q9.14=4] Delivery -.931 .420 4.918 1 .027
The hypothesis testing results are shown in Table 16 as followings;
H4.1a: Regular gifts significantly influences consumer’s brand choice decision
for QSR in HCMC, Vietnam (0.017 < 0.05).
H4.2o: Discount promotion does not significantly influence consumer’s brand
choice decision for QSR in HCMC, Vietnam (0.318 > 0.05).
H4.3a: Delivery significantly influences consumer’s brand choice decision for
QSR in HCMC, Vietnam (0.027 < 0.05).
Therefore, for Promotion, the regular gifts and delivery matters in choosing
KFC brand over Lotteria brand.

55
Table 17: Finding of hypotheses testing for Promotion in Marketing mix (7Ps)
(Pizza Hut)
The most favorite fast food branda B Std. Error Wald df Sig.
Pizza Hut
[Q9.12=5] Regular gifts .673 .363 3.441 1 .046
[Q9.13=4] Discount promotion .535 .434 1.521 1 .218
[Q9.14=4] Delivery -1.911 .471 16.458 1 .000
As per above Table 17 shown the hypothesis testing results as followings:
H4.1a: Regular gifts significantly influences consumer’s brand choice decision
for QSR in HCMC, Vietnam (0.046 < 0.05).
H4.2o: Discount promotion does not significantly influence consumer’s brand
choice decision for QSR in HCMC, Vietnam (0.218 > 0.05).
H4.3a: Delivery significantly influences consumer’s brand choice decision for
QSR in HCMC, Vietnam (0.000 < 0.05).
So for Promotion, the regular gifts and delivery matters in choosing Pizza Hut
brand over Lotteria brand.
Table 18: Finding of hypotheses testing for Process in Marketing mix (7Ps) (KFC)
The most favorite fast food branda B Std. Error Wald Df Sig.
KFC
[Q9.15=5] Modern processing technology .695 .324 4.591 1 .032
[Q9.16=4] Serve quickly .116 .396 .086 1 .769
[Q9.17=4] Saving time -.371 .372 .994 1 .319

56
The hypothesis testing results are shown in Table 18 as followings;
H5.1a: Modern processing technology significantly influences consumer’s
brand choice decision for QSR in HCMC, Vietnam (0.032 < 0.05).
H5.2o: Serve quickly does not significantly influence consumer’s brand choice
decision for QSR in HCMC, Vietnam (0.769 > 0.05).
H5.3o: Saving time does not significantly influence consumer’s brand choice
decision for QSR in HCMC, Vietnam (0.319 > 0.05).
Therefore, for Process, only modern processing technology matter in choosing
KFC brand over Lotteria brand.
Table 19: Finding of hypotheses testing for Process in Marketing mix (7Ps) (Pizza
Hut)
The most favorite fast food branda B
Std.
Error
Wald df Sig.
Pizza
Hut
[Q9.15=4] Modern processing
technology
1.510 .412 13.409 1 .000
[Q9.16=4] Serve quickly -.445 .426 1.093 1 .296
[Q9.17=4] Saving time
-
1.102
.405 7.389 1 .007
As per above Table 19 shown the hypothesis testing results as followings:
H5.1a: Modern processing technology significantly influences consumer’s
brand choice decision for QSR in HCMC, Vietnam (0.000 < 0.05).
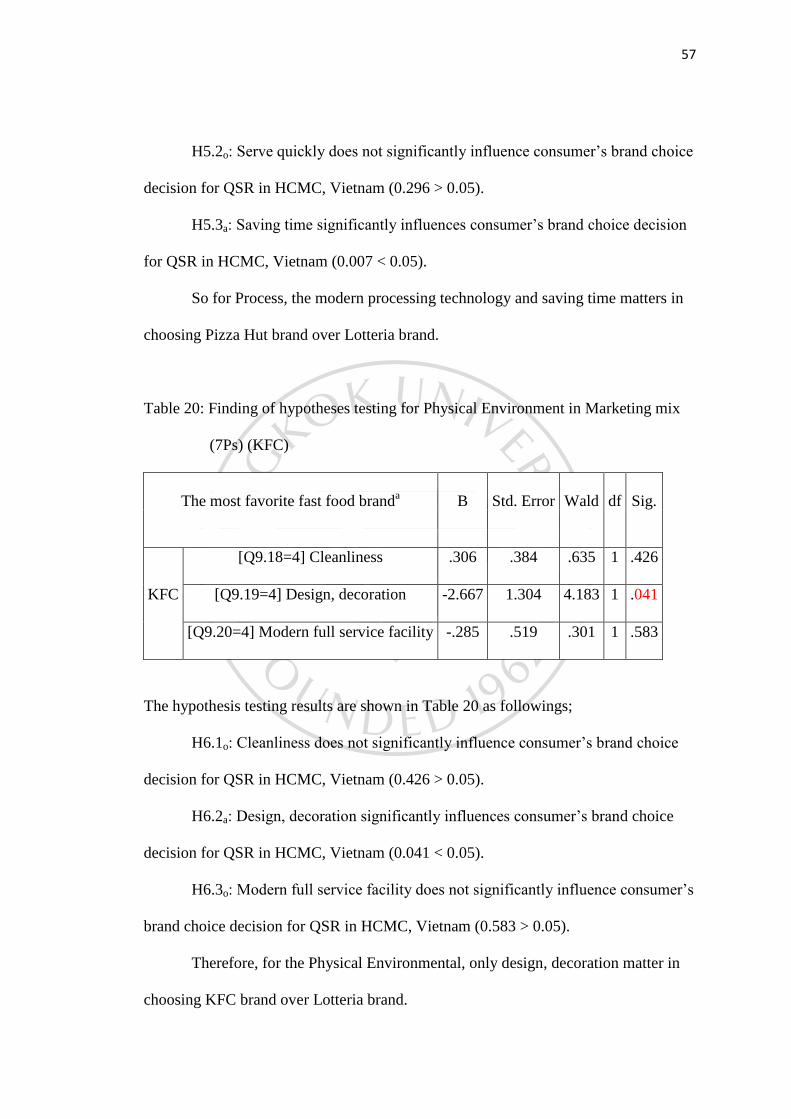
57
H5.2o: Serve quickly does not significantly influence consumer’s brand choice
decision for QSR in HCMC, Vietnam (0.296 > 0.05).
H5.3a: Saving time significantly influences consumer’s brand choice decision
for QSR in HCMC, Vietnam (0.007 < 0.05).
So for Process, the modern processing technology and saving time matters in
choosing Pizza Hut brand over Lotteria brand.
Table 20: Finding of hypotheses testing for Physical Environment in Marketing mix
(7Ps) (KFC)
The most favorite fast food branda B Std. Error Wald df Sig.
KFC
[Q9.18=4] Cleanliness .306 .384 .635 1 .426
[Q9.19=4] Design, decoration -2.667 1.304 4.183 1 .041
[Q9.20=4] Modern full service facility -.285 .519 .301 1 .583
The hypothesis testing results are shown in Table 20 as followings;
H6.1o: Cleanliness does not significantly influence consumer’s brand choice
decision for QSR in HCMC, Vietnam (0.426 > 0.05).
H6.2a: Design, decoration significantly influences consumer’s brand choice
decision for QSR in HCMC, Vietnam (0.041 < 0.05).
H6.3o: Modern full service facility does not significantly influence consumer’s
brand choice decision for QSR in HCMC, Vietnam (0.583 > 0.05).
Therefore, for the Physical Environmental, only design, decoration matter in
choosing KFC brand over Lotteria brand.
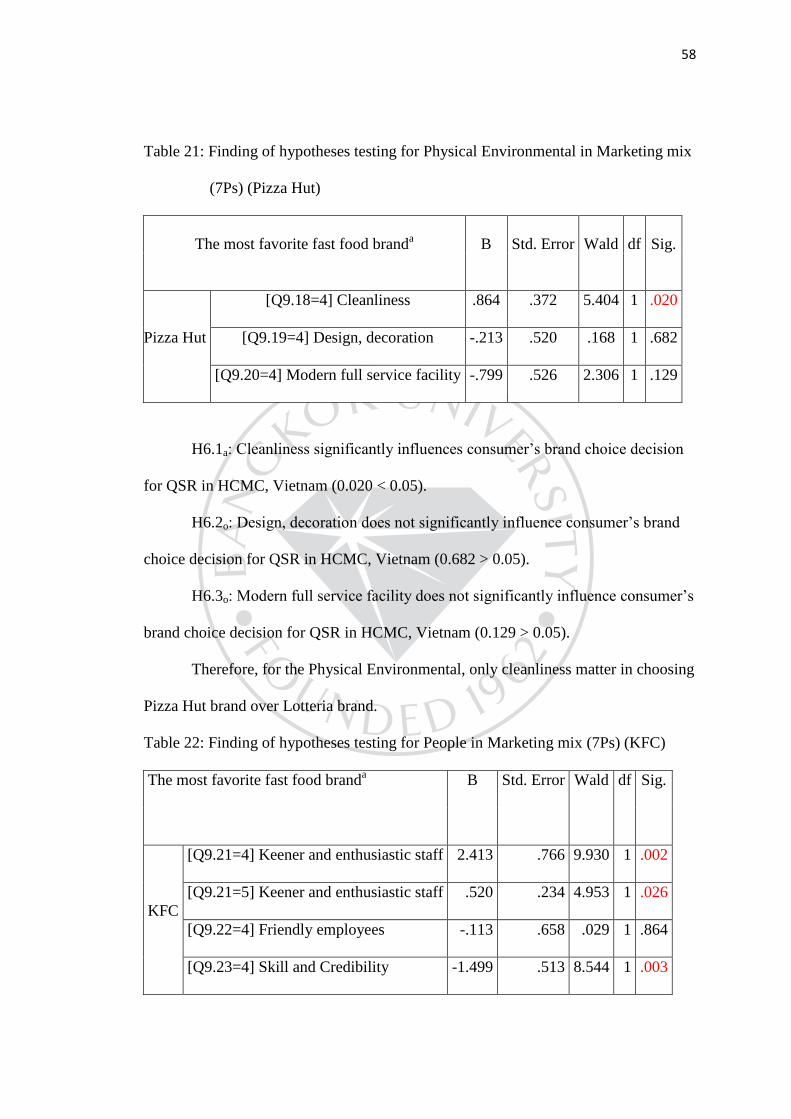
58
Table 21: Finding of hypotheses testing for Physical Environmental in Marketing mix
(7Ps) (Pizza Hut)
The most favorite fast food branda B Std. Error Wald df Sig.
Pizza Hut
[Q9.18=4] Cleanliness .864 .372 5.404 1 .020
[Q9.19=4] Design, decoration -.213 .520 .168 1 .682
[Q9.20=4] Modern full service facility -.799 .526 2.306 1 .129
H6.1a: Cleanliness significantly influences consumer’s brand choice decision
for QSR in HCMC, Vietnam (0.020 < 0.05).
H6.2o: Design, decoration does not significantly influence consumer’s brand
choice decision for QSR in HCMC, Vietnam (0.682 > 0.05).
H6.3o: Modern full service facility does not significantly influence consumer’s
brand choice decision for QSR in HCMC, Vietnam (0.129 > 0.05).
Therefore, for the Physical Environmental, only cleanliness matter in choosing
Pizza Hut brand over Lotteria brand.
Table 22: Finding of hypotheses testing for People in Marketing mix (7Ps) (KFC)
The most favorite fast food branda B Std. Error Wald df Sig.
KFC
[Q9.21=4] Keener and enthusiastic staff 2.413 .766 9.930 1 .002
[Q9.21=5] Keener and enthusiastic staff .520 .234 4.953 1 .026
[Q9.22=4] Friendly employees -.113 .658 .029 1 .864
[Q9.23=4] Skill and Credibility -1.499 .513 8.544 1 .003

59
The hypothesis testing results are shown in Table 22 as followings;
H7.1a: Keener and enthusiastic staff significantly influences consumer’s brand
choice decision for QSR in HCMC, Vietnam (0.002 < 0.05) and (0.026 < 0.05).
H7.2o: Friendly employees does not significantly influence consumer’s brand
choice decision for QSR in HCMC, Vietnam (0.864 > 0.05).
H7.3a: Skill and credibility significantly influences consumer’s brand choice
decision for QSR in HCMC, Vietnam (0.003 < 0.05).
Therefore, for People, the keener and enthusiastic staff, skill and credibility
matters in choosing KFC brand over Lotteria brand.
Table 23: Finding of hypotheses testing for People in Marketing mix (7Ps) (Pizza
Hut)
The most favorite fast food branda B
Std.
Error
Wald df Sig.
Pizza
Hut
[Q9.21=4] Keener and enthusiastic
staff
1.104 .910 1.471 1 .225
[Q9.22=4] Friendly employees 1.018 .854 1.422 1 .233
[Q9.23=4] Skill and Credibility
-
1.636
.574 8.105 1 .004
As per above Table 23 shown the hypothesis testing results as followings:
H7.1o: Keener and enthusiastic staff does not significantly influence
consumer’s brand choice decision for QSR in HCMC, Vietnam (0.225 > 0.05)
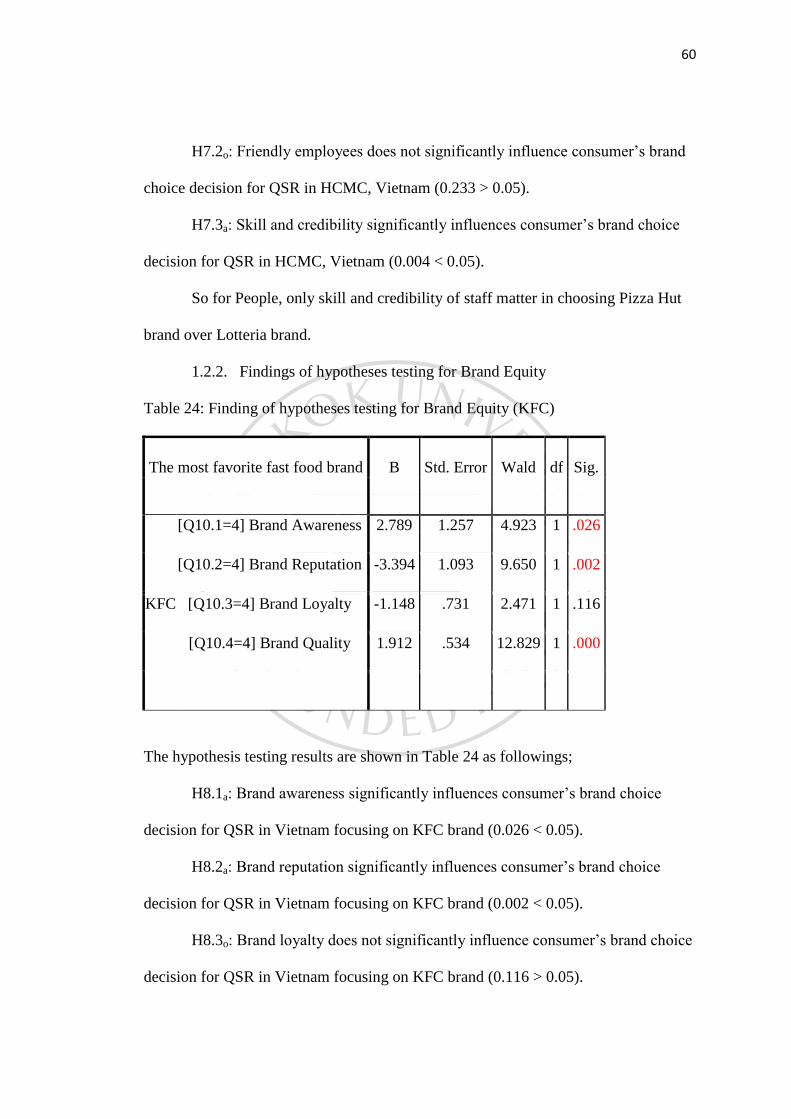
60
H7.2o: Friendly employees does not significantly influence consumer’s brand
choice decision for QSR in HCMC, Vietnam (0.233 > 0.05).
H7.3a: Skill and credibility significantly influences consumer’s brand choice
decision for QSR in HCMC, Vietnam (0.004 < 0.05).
So for People, only skill and credibility of staff matter in choosing Pizza Hut
brand over Lotteria brand.
1.2.2. Findings of hypotheses testing for Brand Equity
Table 24: Finding of hypotheses testing for Brand Equity (KFC)
The most favorite fast food brand B Std. Error Wald df Sig.
KFC
[Q10.1=4] Brand Awareness 2.789 1.257 4.923 1 .026
[Q10.2=4] Brand Reputation -3.394 1.093 9.650 1 .002
[Q10.3=4] Brand Loyalty -1.148 .731 2.471 1 .116
[Q10.4=4] Brand Quality 1.912 .534 12.829 1 .000
The hypothesis testing results are shown in Table 24 as followings;
H8.1a: Brand awareness significantly influences consumer’s brand choice
decision for QSR in Vietnam focusing on KFC brand (0.026 < 0.05).
H8.2a: Brand reputation significantly influences consumer’s brand choice
decision for QSR in Vietnam focusing on KFC brand (0.002 < 0.05).
H8.3o: Brand loyalty does not significantly influence consumer’s brand choice
decision for QSR in Vietnam focusing on KFC brand (0.116 > 0.05).
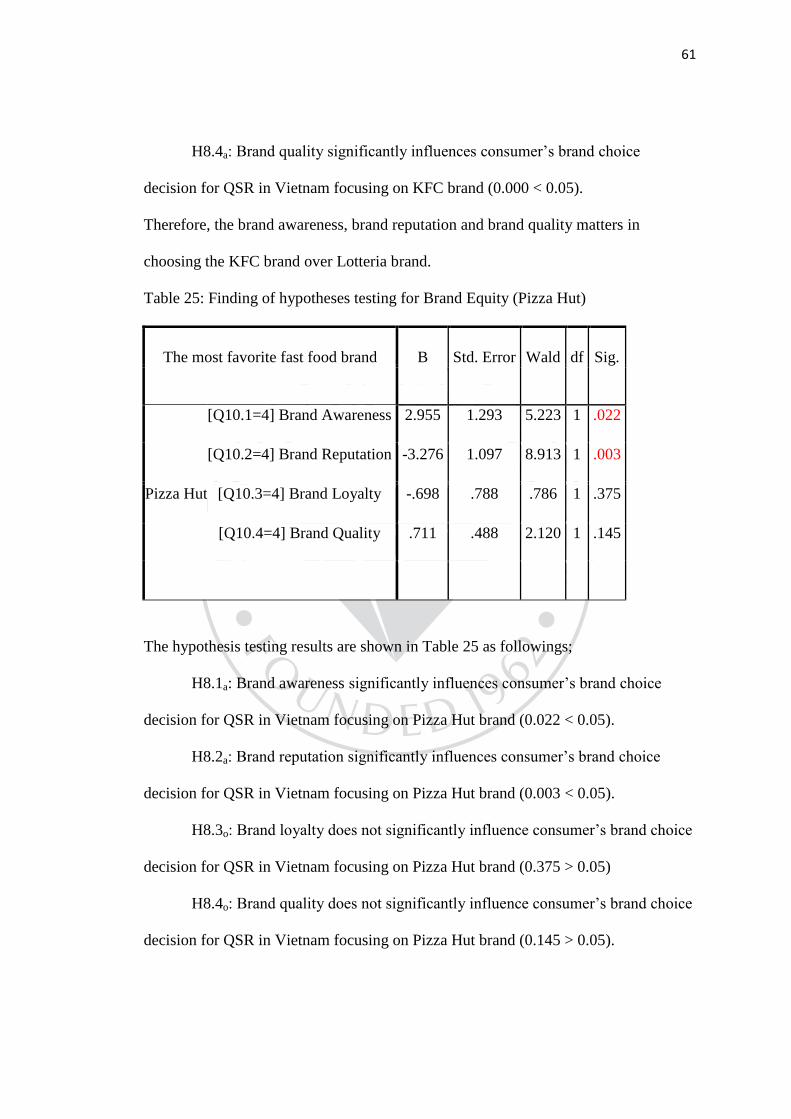
61
H8.4a: Brand quality significantly influences consumer’s brand choice
decision for QSR in Vietnam focusing on KFC brand (0.000 < 0.05).
Therefore, the brand awareness, brand reputation and brand quality matters in
choosing the KFC brand over Lotteria brand.
Table 25: Finding of hypotheses testing for Brand Equity (Pizza Hut)
The most favorite fast food brand B Std. Error Wald df Sig.
Pizza Hut
[Q10.1=4] Brand Awareness 2.955 1.293 5.223 1 .022
[Q10.2=4] Brand Reputation -3.276 1.097 8.913 1 .003
[Q10.3=4] Brand Loyalty -.698 .788 .786 1 .375
[Q10.4=4] Brand Quality .711 .488 2.120 1 .145
The hypothesis testing results are shown in Table 25 as followings;
H8.1a: Brand awareness significantly influences consumer’s brand choice
decision for QSR in Vietnam focusing on Pizza Hut brand (0.022 < 0.05).
H8.2a: Brand reputation significantly influences consumer’s brand choice
decision for QSR in Vietnam focusing on Pizza Hut brand (0.003 < 0.05).
H8.3o: Brand loyalty does not significantly influence consumer’s brand choice
decision for QSR in Vietnam focusing on Pizza Hut brand (0.375 > 0.05)
H8.4o: Brand quality does not significantly influence consumer’s brand choice
decision for QSR in Vietnam focusing on Pizza Hut brand (0.145 > 0.05).

62
Therefore, the brand awareness and brand reputation matters in choosing the Pizza
Hut brand over Lotteria brand.
4.3 The analysis of customer behavior
Table 26: Cross tabulation of Consumer behavior; Eat at home (or) outside
Eat at home (or) outside
Total
Eat at home Eat outside
The most favorite fast food brand
KFC 70 97 167
Pizza Hut 45 63 108
Lotteria 48 77 125
Total 163 237 400
According to this detail analysis Table 26 shows that 70 respondents eat at
home and 97 respondents eat out side choose KFC brand. While 45 respondents eat at
home and 63 respondents eat outside choose Pizza Hut. And respondents choose
Lotteria brand is 48 eat at home and 77 eat outside.
Table 27: Cross tabulation of Consumer behavior; Eat fast food with
Eat fast food with
Total
Family Friends Alone
The most favorite fast food brand
KFC 45 108 14 167
Pizza Hut 41 62 5 108
Lotteria 30 79 16 125
Total 116 249 35 400

63
From Table 27 we can see that, 45 respondents choose eat fast food with
family, 108 respondents eat with friends, and 14 respondents eat alone choose KFC
brand. While in total number 125 respondents choose Lotteria brand, 30 respondents
eat with family, 79 respondents eat with friends and 16 respondents eat alone. And for
choosing Pizza Hut brand, 41 respondents eat with family, 62 respondents eat with
friends and 5 respondents eat alone.
Table 28: Cross tabulation of Consumer behavior; Spend for fast food each time
Spend for fast food each time
Total Over
1,000,000
VND (>50$)
From 500,000
to 1,000,000
VND (25$-
50$)
Below
500,000
VND (<
25$)
Below
100,000
VND (<
5$)
The most
favorite
fast food
brand
KFC 12 23 96 36 167
Pizza
Hut
4 14 69 21 108
Lotteria 1 12 72 40 125
Total 17 49 237 97 400
According to this detail analysis Table 28, respondents choose KFC brand
spends for fast food each time over 1,000,000 VND is 12 respondents, from
500,000VND to 1,000,000VND is 23 respondents, below 500,000VND is 96
respondents and below 100,000VND is 36 respondents.

64
Respondents choose Pizza Hut brand spends for fast food each time over
1,000,000VND is 4 respondents, from 500,000VND to 1,000,000VND is 14
respondents, below 500,000VND is 69 respondents and below 100,000VND is 21
respondents.
Respondents choose Lotteria brand spends for fast food each time over
1,000,000VND is 1 respondent, from 500,000VND to 1,000,000VND is 12
respondents, below 500,000VND is 72 respondents and below 100,000VND is 42
respondents.
Table 29: Cross tabulation of Consumer behavior; Frequency of purchasing fast food
Frequency of purchasing fast food
Total Once a
week
Over 3 times
per week
3 times
per week
2 times
per week
The most favorite
fast food brand
KFC 78 28 18 43 167
Pizza
Hut
69 6 9 24 108
Lotteria 83 7 7 28 125
Total 230 41 34 95 400
The majority frequency of purchasing fast food by respondents choose KFC
brand are once a week which equal to 78 respondents, twice a week 43 respondents,
over 3 times a week 28 respondents and 3 times a week 18 respondents respectively.
The majority frequency of purchasing fast food by respondents choose Pizza
Hut brand are once a week which equal to 69 respondents, twice a week 24

65
respondents, 3 times a week 9 respondents and over 3 times a week 6 respondents
respectively.
The majority frequency of purchasing fast food by respondents choose
Lotteria brand are once a week which equal to 83 respondents, twice a week 28
respondents, over 3 times a week and 3 times a week are 7 respondents respectively.
Table 30: Cross tabulation of Consumer behavior; Suitable meal
Suitable meal
Total
Breakfast Lunch Dinner
The most favorite fast food brand
KFC 13 36 118 167
Pizza Hut 3 34 71 108
Lotteria 3 35 87 125
Total 19 105 276 400
From this Table 30, the majority suitable meal of respondents choose KFC
brand are dinner which equal to 118 respondents, have lunch 36 respondents, and
breakfast 13 respondents respectively. For respondents choose Pizza Hut brand, the
majority suitable meal is dinner which equal to 71 respondents, have lunch 34
respondents, and breakfast 3 respondents respectively. For respondents choose
Lotteria brand, the majority suitable meal is dinner which equal to 87 respondents,
have lunch 35 respondents, and breakfast 3 respondents respectively.

66
Table 31: Cross tabulation of Consumer behavior; Favorite taste
Favorite taste
Total
Salt Sour Sweet Spicy
The most favorite fast food brand
KFC 43 13 26 85 167
Pizza Hut 43 8 30 27 108
Lotteria 53 4 22 46 125
Total 139 25 78 158 400
From this Table 31, the majority favorite taste of respondents choose KFC
brand are spicy which equal to 85 respondents, salt 43 respondents, sweet 26
respondents and sour 13 respondents respectively. For respondents choose Pizza Hut
brand, the majority favorite taste is salt which equal to 43 respondents, sweet 30
respondents, spicy 27 respondents and sour 8 respondents respectively. For
respondents choose Lotteria brand, the majority favorite taste is salt which equal to 53
respondents, spicy 46 respondents, sweet 22 and sour 4 respondents respectively.
Table 32: Cross tabulation of Consumer behavior; Fast food fit well with lifestyle
Do you think that fast food restaurant
fit well with your lifestyle? Total
Yes No
The most favorite fast
food brand
KFC 104 63 167
Pizza Hut 58 50 108
Lotteria 80 45 125
Total 242 158 400

67
From Table 32, most of respondents choose KFC think that fast food
restaurant fit well with their lifestyle which equal to 104 respondents, and 63
respondents don’t think fast food restaurant fit well with their lifestyle. 58
respondents choose Pizza Hut brand thinks that fast food restaurant fit well with their
lifestyle and 50 respondents don’t think that fast food restaurant fit well with their
lifestyle. For respondents choose Lotteria brand, most of respondents think that fast
food restaurant fit well with their lifestyle which equal to 80 respondents, and 45
respondents don’t think that fast food restaurant fit well with their lifestyle.
Table 33: Cross tabulation of Consumer behavior; Personal desire effect on
purchasing fast food brands
Do you think that personal desire has an
effect on your purchasing fast food brands? Total
Yes No
The most favorite
fast food brand
KFC 149 18 167
Pizza
Hut
94 14 108
Lotteria 114 11 125
Total 357 43 400
Most of respondents choose KFC brand think that personal desire has an effect
on their purchasing decision which equal to 149 respondents and 18 respondents don’t
think that personal desire has an effect on their purchasing decision. For respondents
choose Pizza Hut brand, 94 respondents think that personal desire has an effect on
68
their purchasing decision and 14 respondents don’t think that personal desire has an
effect on their purchasing decision. For respondents choose Lotteria brand, most of
respondents think that personal desire has an effect on their purchasing decision
which equal to 114 respondents and 11 respondents don’t think that personal desire
has an effect on their purchasing decision.
Generally, from those results we analyzed above show that most of consumers
choose fast food in Vietnam often eat outside with friends than eat at home. They like
spicy taste and the suitable meal is dinner. Frequency of purchasing fast food is once a
week and spend below 500,000VND (below 25$) for fast food each time. Most of
respondents think that fast food restaurant fit well with their lifestyle and personal
desire has an effect on their purchasing fast food brands.
69
CHAPTER 5
DISCUSSION AND CONCLUSION
In this chapter, it presents the summary the overall important component of
this scholar, discussion and recommends some opinions for future related research.
The study of factors that influence consumer purchasing decisions towards top
three fast food brands including KFC, Pizza Hut and Lotteria in HoChiMinh City,
Vietnam and then create the marketing strategies. This study has two objective of
study as:
- Identify the factors that influence consumer purchasing decisions towards top
three fast food brands in Vietnam (KFC, Pizza Hut and Lotteria).
- Understanding fast food consumer behavior in Vietnam.
Following the conceptual framework in order to investigate purchase decision
of fast food in Vietnam that the author mentioned in previous chapters, the hypotheses
are scoped as:
- H1o (Product): beta_H1.1o (Taste delicious), beta_H1.2o (Product diversity),
beta_H1.3o (Packaging and attractive product presentation), beta_H1.4o
(Quality), beta_H1.5o (Product information) = 0.
H1a (Product): at least one of beta_H1.1a (Taste delicious), at least one of
beta_H1.2a (Product diversity), at least one of beta_H1.3a (Packaging and
attractive product presentation), at least one of beta_H1.4a (Quality), at least
one of beta_H1.5a (Product information) # 0.
- H2o (Price): beta_H2.1o (Reasonable Price), beta_H2.2o (Variety of Price),
beta_H2.3o (Lower Price) = 0.

70
H2a (Price): at least one of beta_H2.1a (Reasonable Price), at least one of
beta_H2.2a (Variety of Price), at least one of beta_H2.3a (Lower Price) # 0.
- H3o (Place): beta_H3.1o (Number of outlets), beta_H3.2o (Convenience to go,
easy to find), beta_H3.3o (Size of restaurant) = 0.
H3a (Place): at least one of beta_H3.1a (Number of outlets), at least one of
beta_H3.2a (Convenience to go, easy to find), at least one of beta_H3.3a (Size
of restaurant) # 0.
- H4o (Promotion): beta_H4.1o (Regular gifts), beta_H4.2o (Discount
promotion), beta_H4.3o (Delivery) = 0.
H4a (Promotion): at least one of beta_H4.1a (Regular gifts), at least one of
beta_H4.2a (Discount promotion), at least one of beta_H4.3 (Delivery) # 0.
- H5o (Process): beta_H5.1o (Modern processing technology), beta_H5.2o (Serve
quickly), beta_H5.3o (Saving time) = 0.
H5a (Process): at least one of beta_H5.1a (Modern processing technology), at
least one of beta_H5.2a (Serve quickly), at least one of beta_H5.3a (Saving
time) # 0.
- H6o (Physical environment): beta_H6.1o (Cleanliness), beta_H6.2o (Design,
decoration), beta_H6.3o (Modern full service facility) = 0.
H6a (Physical environment): at least one of beta_H6.1a (Cleanliness), at least
one of beta_H6.2a (Design, decoration), at least one of beta_H6.3a (Modern
full service facility) # 0.
- H7o (People): beta_H7.1o (Keener and enthusiastic staff), beta_H7.2o (Friendly
employees), beta_H7.3o (Skill and Credibility) = 0.

71
H7a (People): at least one of beta_H7.1a (Keener and enthusiastic staff), at
least one of beta_H7.2a (Friendly employees), at least one of beta_H7.3a (Skill
and Credibility) # 0.
- H8o (Brand Equity): beta_H8.1o (Brand Awareness), beta_H8.2o (Brand
Reputation), beta_H8.3o (Brand Loyalty), beta_H8.4o (Brand Quality) = 0.
H8a (Brand Equity): at least one of beta_H8.1a (Brand Awareness), at least one
of beta_H8.2a (Brand Reputation), at least one of beta_H8.3a (Brand Loyalty),
at least one of beta_H8.4o (Brand Quality) # 0.
The research methodology is quantitative in that the data collecting tool is
self-administered questionnaire implemented by distributing questionnaire such as
shopping complex, supermarket, store in HCMC where have KFC, Pizza Hut and
Lotteria brands. And the sample size is 400 respondents being consuming fast food
living in HCMC, Vietnam. The hypotheses are analyzed through cross tabulation,
frequency and multinomial logistic regression method.
5.1 Conclusion and discussion
The most favorite fast-food brand is KFC with the number 167 out of 400
respondents (or 41.8%) followed by Lotteria range by the number of 125 out of 400
respondents (or 31.3%) and Pizza Hut with the number of 108 out of 400 respondents
(or 27.0%) and almost respondents always choose use the brand they like.
In the analysis of cross tabulation shows that:
The majority respondents choose KFC brand are male with the number of 95
out of 167 respondents (or 46%), are in range 15-25 years old (124 out of 167
respondents), are student (95 out of 167 respondents) and are single (144 out of 167
respondents) respectively. Most of respondents choose KFC brand often go out to eat
72
(58%) with friends and spend for fast food each time below 500,00VND (57.4%).
Usually, they consume fast food once a week (46.7%) for dinner (70.6%) and their
favorite taste is spicy (50.9%). The majority respondents think that fast food
restaurant fit well with their lifestyle (62.2%) and they also think that personal desire
has an effect on their purchasing fast food brands (89.2%).
For the respondents choose Pizza Hut, most of respondents are female with the
number of 72 out of 108 respondents, are in range 15-25 years old (65 out of 108
respondents), are working (57 out of 108 respondents) and are single (91 out of 108
respondents) respectively. Most of respondents choose Pizza Hut brand often go out
to eat (58.3%) with friends and spend for fast food each time below 500,00VND
(63.8%). Usually, they consume fast food once a week (63.8%) for dinner (65.7%)
and their favorite taste is salt (39.8%). The majority respondents think that fast food
restaurant fit well with their lifestyle (53.7%) and they also think that personal desire
has an effect on their purchasing fast food brands (87.0%).
And the majority respondents choose Lotteria brand are female with the
number of 72 out of 125 respondents, are in range 15-25 years old (95 out of 125
respondents), are student and working with same number is 60 out of 125
respondents) and are single (100 out of 125 respondents) respectively. Most of
respondents choose Lotteria brand often go out to eat (61.6%) with friends and spend
for fast food each time below 500,00VND (57.6%). Usually, they consume fast food
once a week (66.4%) for dinner (69.6%) and their favorite taste is salt (42.4%). The
majority respondents think that fast food restaurant fit well with their lifestyle (64%)
and they also think that personal desire has an effect on their purchasing fast food
brands (91.2%).

73
In the analysis of multinomial logistic regression, the result of KFC and Pizza
Hut and compare with Lotteria in the standard level of (0.05) are significant and that
influence consumer’s brand choice decision for QSR in Vietnam.
After analyzing with multinomial logistic regression of marketing mix (7Ps)
and brand equity, the output highlights the main reasons to choosing consume fast
food are driven by both KFC and Pizza Hut playing in the mainstream segment.
- The first factor is Product is comprised of 5 statements, in that, packaging
and attractive product (agree) (0.030 <0.05), product quality (agree) (0.000 < 0.05)
and product information (agree) (0.007 <0.05) are significantly influences consumer
purchase decision for KFC brand than Lotteria brand. And for Pizza Hut brand, only
packaging and attractive product (agree) (0.020 <0.05) is significantly influences
consumer purchase decision for Pizza Hut brand than Lotteria brand.
- The second factor is Price is comprised of 3 statements, in that, reasonable
price (agree) (0.018 <0.05) and variety of price (agree) (0.024 < 0.05) are
significantly influences consumer purchase decision for KFC brand than Lotteria
brand. While Pizza Hut brand, only reasonable price (agree) (0.024 < 0.05) is
significantly influences consumer purchase decision for Pizza Hut brand than Lotteria
brand.
- The third factor is Place is comprised of 3 statements, in that, number of
outlets (agree) (0.022 < 0.05) and convenience to go, easy to find (agree) (0.026 <
0.05) are significantly influences consumer purchase decision for KFC brand than
Lotteria brand. While Pizza Hut brand, only size of restaurant (agree) (0.023 < 0.05)
is significantly influences consumer purchase decision for Pizza Hut brand than
Lotteria brand.
74
- The fourth factor is Promotion is comprised 3 statements, in that, regular gifts
(total agree) (0.017 < 0.05) and delivery (agree) (0.027 < 0.05) are significantly
influences consumer purchase decision for KFC brand than Lotteria brand, same as
KFC, with regular gifts (total agree) (0.046 < 0.05) and delivery (agree) (0.000 <
0.05) are significantly influences consumer purchase decision for Pizza Hut brand
than Lotteria brand.
- The fifth factor is Process is comprised 3 statements, in that, only modern
processing technology (total agree) (0.032 < 0.05) is significantly influences
consumer purchase decision for KFC brand than Lotteria brand. While Pizza Hut,
both of modern processing technology (agree) (0.000 < 0.05) and saving time (0.007
< 0.05) are significantly influences consumer purchase decision for Pizza Hut brand
than Lotteria brand.
- The sixth factor is Physical Environmental is comprised 3 statements, in that,
only design, decoration (agree) (0.041 < 0.05) is significantly influences consumer
purchase decision for KFC brand than Lotteria brand. While the Pizza Hut brand,
cleanliness (agree) (0.020 < 0.05) is significantly influences consumer purchase
decision for Pizza Hut brand than Lotteria brand.
- The seventh factor is People is comprised 3 statements, in that, keener and
enthusiastic (agree) (0.002 < 0.05) and (total agree) (0.026 < 0.05) and skill,
credibility of staff (agree) (0.003 < 0.05) are significantly influences consumer
purchase decision for KFC brand than Lotteria brand. While for Pizza Hut brand, only
skill and credibility of staff (agree) (0.004 < 0.05) is significantly influences
consumer purchase decision for Pizza Hut brand than Lotteria brand.

75
- The eighth factor is Brand Equity is comprised 4 statements, in that, brand
awareness (agree) (0.026 < 0.05), brand reputation (agree) (0.002 < 0.05), brand
quality (agree) (0.000 < 0.05) are significantly influences consumer purchase decision
for KFC brand than Lotteria brand. While Pizza Hut, only brand awareness (agree)
(0.022 < 0.05) and brand reputation (agree) (0.003 < 0.05) are significantly influences
consumer purchase decision for Pizza Hut brand than Lotteria brand.
5.2 Recommendation for Future Research
Overall, the research results achieved its objectives is to identify the factors
that influence consumer purchasing decisions toward top three fast food brands
including KFC, Pizza Hut and Lotteria in Vietnam. Because of time limited, this study
is only focus on specific sample group that is Vietnamese consumers who live in
Hochiminh city. The finding and result might not cover total population of
Vietnamese consumers. Therefore, further research suggests if the sample should be a
larger and include diversified of consumers who live in different cities such as Ha Noi
city (the capital of Vietnam) or DaNang city, Haiphong... The result will lead to more
understandings of Vietnamese consumers towards the fast food brand.
76
BIBLIOGRAPHY
Aaker, D. A. (1991). Managing brand equity: Capitalizing on the value of a brand
name. New York: Free Press.
Aaker, D. (n.d.). Aaker’s Brand Loyalty Pyramid. Retrieved from
http://www.eurib.org/fileadmin/user_upload/Documenten/PDF/Merktrouw_E
NGELS/t_-_Brand_Loyalty_piramide_van_Aaker__EN_.pdf.
Akbay. (2001). Consumer characteristics influencing fast food consuming in Turkey.
Turkey: University of Sutcu Imam, Kahramanmaras.
Ajzen, I., & Fishbein, M. (1975). Belief, Attitude, Intention and Behavior: An
Introduction to Theory and Research. Reading, MS: Addison-Wesley Pub.
Brucks, M., & Zeithaml, V. A. (1991). Price and brand name as indicators of quality
demensions. Cambridge: Marketing Science Institute.
Erdem, T., & Keane, M. P. (1996). Decision making under uncertainty: Capturing
dynamic brand choice processes in turbulent consumer goods markets.
Marketing Science, 15, 1-21.
Glasser, W. (1998). Choice Theory. Retrieved from
http://www.choicetheory.com/ct.htm.
Kotler, P. & Keller, K. (2011). Marketing Management (14th ed.). London: Pearson
Education.
The William Glasser Institute Ireland. (n.d.). Welcome to choice theory psychology.
Retrieved from: http://www.wgii.ie/index.php/138-uncategorized/202-failte2.
Pattaraporn, J. (2011). Consumer attitudes toward Quick Service Restaurant in
Thailand: The study influencing factors effecting purchase making decision.
Thailand: Malar-dalen University.

77
Solomon, M. (1995). Consumer Behaviour (3rd
ed.). New Jersey: Prentice Hall.
Van Zyl, M.K. (2010). Characteristics and factor influencing fast food intake of
young adult con-sumers in Johannesburg, South Africa. South Africa:
Woolworths South Africa ( Pty) Ltd, Cape Town.
Frank, B. (2012). The formation of consumer attitudes and intentions towards fast
food restaurants. Managing Service Quality: An International Journal, 22(3),
260-282.

APPENDIX

79
QUESTIONNAIRES ( ENGLISH )
THE STUDY OF FACTORS THAT INFLUENCE CONSUMER
PURCHASING DECISIONS TOWARDS TOP THREE FAST FOOD BRANDS
INCLUDING KFC, PIZZA HUT AND LOTTERIA IN VIETNAM
The survey is divided into 4 parts:
Part 1: General Information and Demographics
Part 2: Marketing Mix (7Ps)
Part 3: Brand Equity
Part 4: Consumer Behavior
Part 1: General information and Demographics
Q1. Have you ever consumer fast food?
Yes No
Q2. What is your most favorite fast food brand? (Choose only one)
KFC Pizza Hut Lotteria
Q3. Do you always choose the brand that you always like?
Yes No
Q4. Gender.
Male Female
Q5. Age
Below 15 years 15-25 years
26-35 years More than 35 years

80
Q6. What is your profession?
Working Student
Others
Q7. Current marital status.
Single Married
Q8. Ranking the below factors influence your brand purchasing decision in Q2.
Factors
Opinion Level
Strongly
Disagree
Disagree
Disagree
somewhat
Neutral
Agree
somewhat
Agree
Strongly
Agree
Product
Price
Place
Promotion
Process
Physical
Environment
People
Brand name
Part 2: Marketing Mix (7Ps)
Q9. Please indicate how much do you think the following factors affect your
brand purchasing decision, from 1) strongly agree, 2) Disagree, 3) Moderate, 4)
Agree, 5) Strongly Agree.
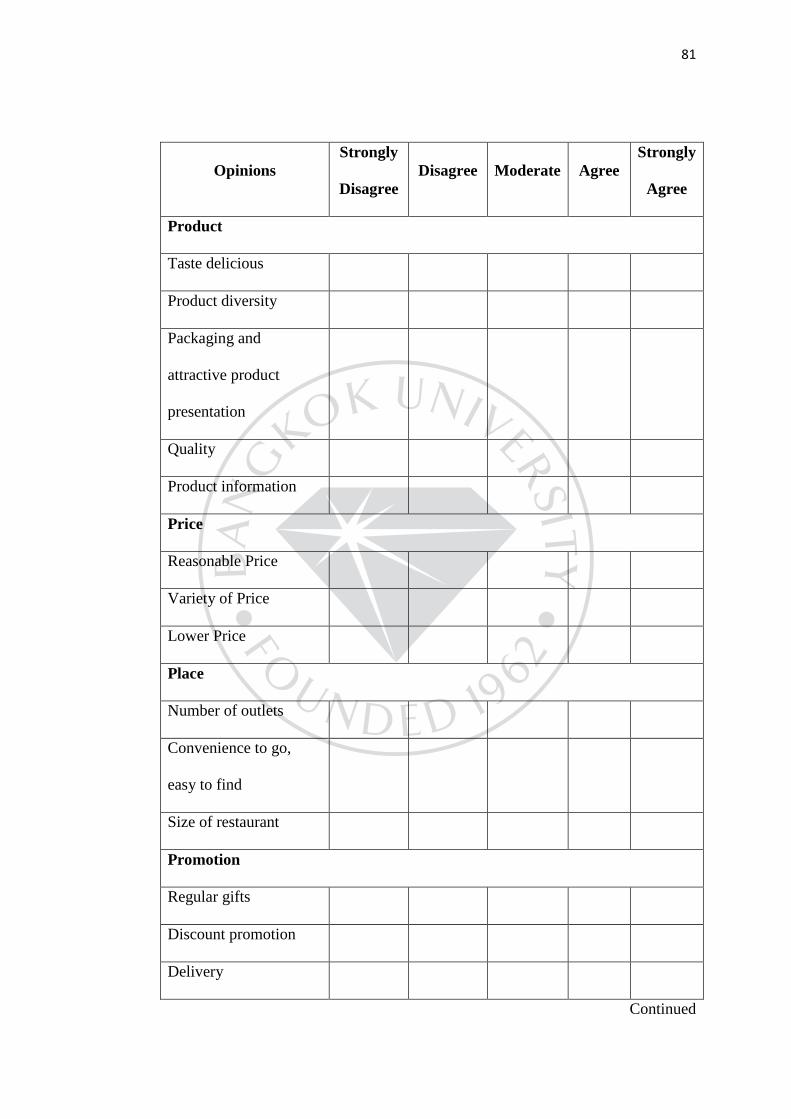
81
Opinions
Strongly
Disagree
Disagree Moderate Agree
Strongly
Agree
Product
Taste delicious
Product diversity
Packaging and
attractive product
presentation
Quality
Product information
Price
Reasonable Price
Variety of Price
Lower Price
Place
Number of outlets
Convenience to go,
easy to find
Size of restaurant
Promotion
Regular gifts
Discount promotion
Delivery
Continued
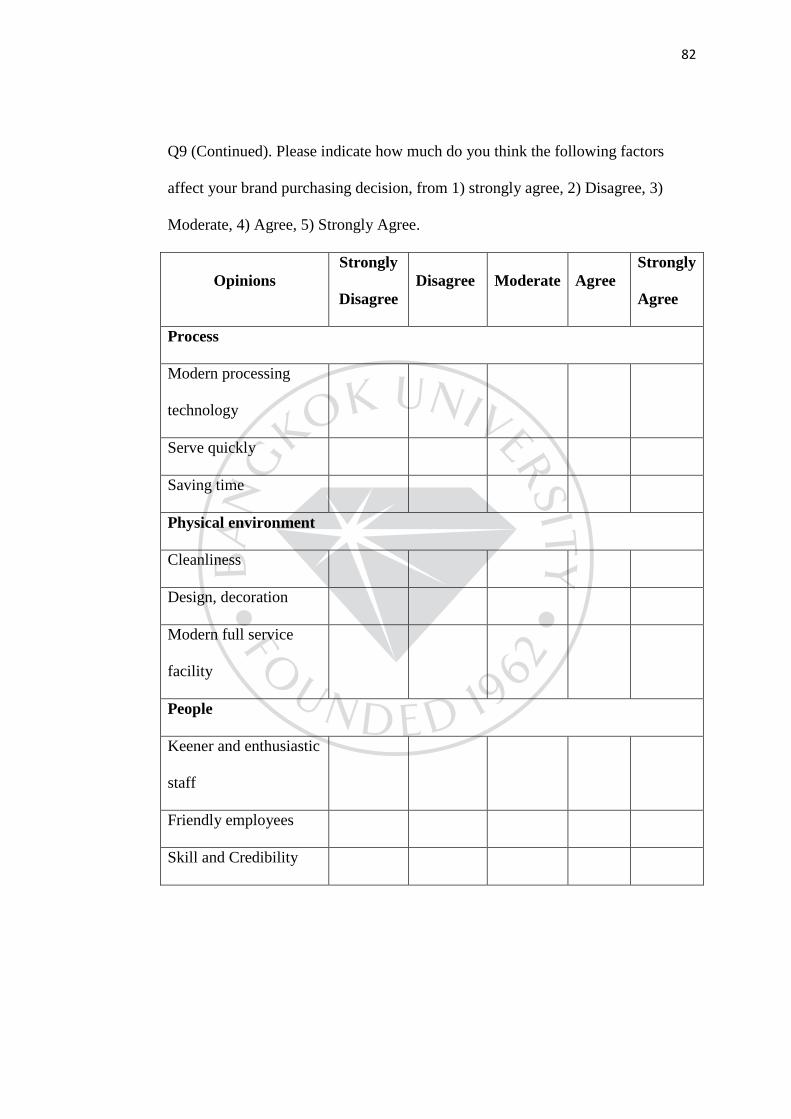
82
Q9 (Continued). Please indicate how much do you think the following factors
affect your brand purchasing decision, from 1) strongly agree, 2) Disagree, 3)
Moderate, 4) Agree, 5) Strongly Agree.
Opinions
Strongly
Disagree
Disagree Moderate Agree
Strongly
Agree
Process
Modern processing
technology
Serve quickly
Saving time
Physical environment
Cleanliness
Design, decoration
Modern full service
facility
People
Keener and enthusiastic
staff
Friendly employees
Skill and Credibility

83
Part 3: Brand Equity
Q10. Please indicate how much do you think the following factors affect your
brand purchasing decision, from 1) strongly agree, 2) Disagree, 3) Moderate, 4)
Agree, 5) Strongly Agree.
Opinions
Strongly
Disagree
Disagree Moderate Agree
Strongly
Agree
Brand Awareness
Brand Reputation
Brand Loyalty
Brand Quality
Part 4: Consumer Behavior
Q11. Do you usually cook at home for daily meals or eat outside?
Eat at home Eat outside
Q12. You like to visit food joint with?
Family Friends Alone
Q13. How much do you spend for fast food each time?
Over 1,000,000 VND From 500,000 to 1,000,000 VND
Below 500,000 VND Below 100,000 VND
Q14. How often do you purchase fast food?
Once a week Over 3 times per week
3 times per week 2 times per week
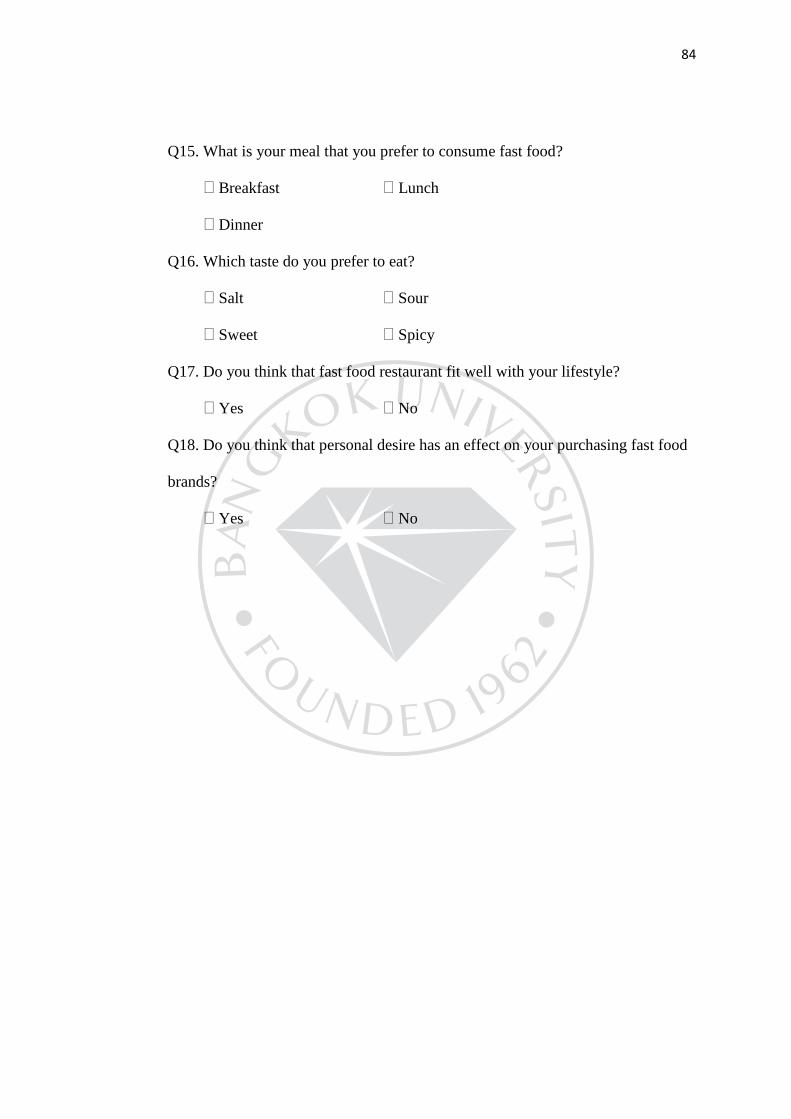
84
Q15. What is your meal that you prefer to consume fast food?
Breakfast Lunch
Dinner
Q16. Which taste do you prefer to eat?
Salt Sour
Sweet Spicy
Q17. Do you think that fast food restaurant fit well with your lifestyle?
Yes No
Q18. Do you think that personal desire has an effect on your purchasing fast food
brands?
Yes No
85
BIODATA
Name – Surname: Hong Giang, Pham
Address: 49 soi Pridi 4, Prakhanong, Sukhumvit 71, Watana, Bangkok 10110
Contact Number: +66 94660 1406
Email: [email protected]
Education Background: Bachelor of Business Administration
Work Experience: -

