the study of the corrosion behavior of gas nitriding
TRANSCRIPT
The Study of the Corrosion Behavior of Gas Nitriding Treated L80 Steel in Simulated
Environment for the Slotted Liners of SAGD
by
Xueyuan Chen
A thesis submitted in partial fulfilment of the requirements for the degree of
Master of Science
in
Materials Engineering
Department of Chemical and Materials Engineering
University of Alberta
©Xueyuan Chen, 2016

ii
Abstract
The oil sand in Alberta province is mainly extracted by Steam Assisted Gravity Drainage (SAGD)
technique which employs the slotted liners as the primary sand screening system. However, the
slotted liners made of L80 carbon steel suffer from severe corrosion and erosion problems in the
downhole environment containing aggressive species. However, conventional protection methods,
such as inhibitors and cathodic protection methods are not applicable to this environment. Gas
nitriding, as a well-established surface treatment method, has been widely applied in metallurgical
processes to form an erosion resistance surface layer in extreme environment since this treatment
grows a high hardness layer of ceramic iron nitrides (Fe-N) on the surface of carbon steel. Iron
nitrides are also believed to have great potential to boost the corrosion resistance in various
environment, but the corrosion behavior and the stability of GN carbon steel is seldom studied in
any environment similar to the one that slotted liners have. Therefore, gas nitriding (GN) was
selected as a coating candidate for liners in this thesis. The lab-scale GN treatment in tube furnace
on L80 carbon steel was optimized by varying nitriding time, temperature and ammonia gas
flowrate to grow a thick, compact and pure compound layer on L80. The corrosion behavior of
GN treated L80 will be tested in the simulated environment by using various electrochemical tests
such as Potentiodynamic Polarization (PD) curves and Electrochemical Impedance Spectroscopy
(EIS). The surface characterization techniques such as digital microscope (DM), Scanning
Electron Microscope (SEM), Energy-Dispersive X-ray Spectroscopy (EDX) and X-ray Diffraction
(XRD) are also employed to investigate the microstructure, morphology and compositions of GN
treated L80.
With a treatment at 40 mL/min of flowrate at 530 °C for 15 h, GN treated L80 achieved a
significantly decreased corrosion rate of 0.023 mm/year in the simulated environment with
iii
saturated carbon dioxide (CO2) at 20°C. The significantly decreased corrosion rate was about one
order of magnitude lower than that of L80 without treatment tested in the same environment. The
longer GN duration increased the thickness of the compound layer but the temperature and flowrate
were treated as a pair for the optimized dissociation rate to produce a compact compound layer.
Double-layer equivalent circuit was used to fit the EIS data and the results suggested that the Rp,
3.96 × 10⁵ Ω·cm2, of GN treated L80 tested in the simulated environment was very close to that
of alloy 800, which is one of the corrosion resistant materials applied in oil sand industry, and two
orders of magnitude larger than that of L80. GN treated L80 was believed to be a more suitable
material for the application of slotted liners due to wider and more stable passivation zone shown
in PD curve. The XRD results showed that the surface composition of GN treated L80 did not have
significant change before and after the immersion test, while the SEM and EDX provided the same
confirmative evidence that both of the compositional and dimensional stability of GN treated L80
maintained after 24 h immersion test. From the potentiostatic polarization test at the applied
potential of + 0.2 V vs. Ag/AgCl, the stable and decreased current density indicated that GN treated
L80 not only had stable corrosion resistance in the simulated environment but also had lower
overall corrosion rate than the value predicted by PD test. Therefore, GN treated L80 had
significantly improved corrosion resistance of L80 in the simulated environment and it was a
competitive candidate for the application as a corrosion resistant material for the slotted liners of
SAGD system.

iv
Preface
Chapter 1 is the introduction of my research work. It includes the background of my research, the
defining of problems and my motivation and objective of the work.
Chapter 2 is the literature review relate to my research.
Chapter 3 is the brief introduction of the principles of the main techniques and methods that I used
to conduct my research.
Chapter 4 is the optimization of GN process by varying the duration, temperature and flowrate.
Chapter 5 is the comparisons of L80, GN treated L80 and alloy 800 in the simulated environment
by using electrochemical tests.
Chapter 6 is the investigations of the compositional, dimensional and electrochemical stabilities
of the GN treated L80.
None of the experimental results used in this thesis has been published as journal article, books,
conference papers etc. My supervisor, Dr. Jing-Li Luo, provided me valuable suggestions on the
experimental design and results interpretation. She also helped me on revising the grammar and
vocabulary of my thesis. Dr. Hong Luo, PDF fellow in our corrosion lab, helped me with designing
and setting up GN system and corrosion cell. Dr. Qinying Wang, PDF in our corrosion lab taught
me the EIS analysis. Hongbo Shi, a 4th year petroleum engineering student, helped me on sample
pretreatment as a volunteer. Some of the surface characterization tests were done by the technicians
from other departments, such as the XRD done by Nancy Zhang in NanoFAB and SEM by Gerein
Nathan in Department of Erath and Atmospheric Science at University of Alberta. I performed
most of the experiments, data analysis and results interpretations and the writings.

v
This thesis was done as part of the research project in collaborated with RGL Reservoir
Management Incorporation (RGL Inc.).
My research was also financially support by Natural Sciences and Engineering Research
Council of Canada (NSERC).
There was no conflict of interests to financially or personally compromise or bias professional
judgment and objectivity of my research.

vi
Acknowledgement
I would like to take this opportunity to express my gratitude to all the people who gave great helps
for my master studies in Department of Chemical and Materials at University of Alberta.
Firstly, I would like to give my most sincere gratitude to my supervisor, Dr. Jing-Li Luo, who gave
me numerous kind and patient helps not only on the academic and research areas, but also on my
personal life and career development. Without her support, I could not complete my research. I
will not forget the knowledge she taught me, the skills she helped me to developed, the professional
ethics and the enthusiasm of scientific researches she delivered and these will give me great helps
for my life and career as a material science engineer.
Then, I would like to thank to Dr. Hong Luo and Dr. Qinying Wang for giving me valuable
suggestions and assistance on the experimental design and data analysis. Without your effort on
my experimental design and research, my work could not be smoothly proceeded. I do appreciate
every experiments you helped me with and the data analysis methods and experience you provided
me.
My deep appreciation also goes to my exam chair, Dr. Leijun Li, supervisor committee members,
Dr. Thomas Etsell, Dr. Qi Liu and Dr. Jing-Li Luo for their great suggestions to help the progress
of my research.
Most importantly, I must express my thanks to my group members from corrosion lab, Dr. Chen
Shen, Xianzong Wang, Dr. Yashar Behnamian, Zeynab Shirband, Ermia Aghaie, Zhong Li and
Kaiyang Li. Thanks for the valuable suggestions you raised during the group meeting. The same
thanks to the group members in fuel cell group: Dr. Bin Hua, Yaqian Zhang, Subiao Liu, Yifei
Sun, Lin Cui, Wenfei Zhang, for the advice you provided to fill out some of my knowledge gaps.

vii
Special thanks to the undergraduate student, Hongbo Shi, who spent his spring and summer time
in the lab to help me doing sample preparations. Without his help, I could not finish all the
experiments in scheduled time period.
Some of the delicate images and data were contributed from the hard working technicians or
researchers from other departments. Therefore, sincere thanks to Shiraz Merali and Dr. Nancy
Zhang from NanoFAB, Dr. Nathan Gerein from Department of Erath and Atmospheric Science,
and Jason Dibbs from Faculty of Chemistry, for their great efforts to assist me manufacturing the
apparatus or doing the various characterization analysis by using advanced techniques.
Last by not least, I also would like to give my sincere gratitude to my parents, Qunyao Chen and
Hui Tang, and my boyfriend, Chi Man Li, for their constant love and support.
My research was financially supported by RGL Inc. and NSERC. Thanks for their generous
supports to this project.

viii
Table of Contents
Abstract ........................................................................................................................................................ ii
Preface ......................................................................................................................................................... iv
Acknowledgement ...................................................................................................................................... vi
Table of Contents ..................................................................................................................................... viii
List of Figures ............................................................................................................................................ xii
List of Tables ............................................................................................................................................. xv
List of Abbreviations ................................................................................................................................ xvi
Nomenclature ........................................................................................................................................... xvii
Chapter 1. Introduction .............................................................................................................................. 1
1.1 The Introduction of Steam Assisted Gravity Drainage System .................................................... 1
1.2 The Problems: Corrosion and Erosion ........................................................................................... 3
1.3 The Objective and Scope of My Research ...................................................................................... 4
1.4 The Significance and Innovation of My Approaches ..................................................................... 4
1.5 Techniques Used to Conducted My Research ................................................................................ 5
Chapter 2. Literature Review .................................................................................................................... 7
2.1 The Corrosion Environment of Slotted Liners ............................................................................... 7
2.1.1 Acid Gases ................................................................................................................................... 7
2.1.2 The Chemical Compositions of Bitumen and Formation Water ........................................... 7
2.1.3 Casing Grade of Slotted Liners ................................................................................................. 8
2.2 The Corrosion Mechanism in this Simulated Environment ......................................................... 9
2.2.1 The Effect of Carbon Dioxide (CO2) ........................................................................................ 9
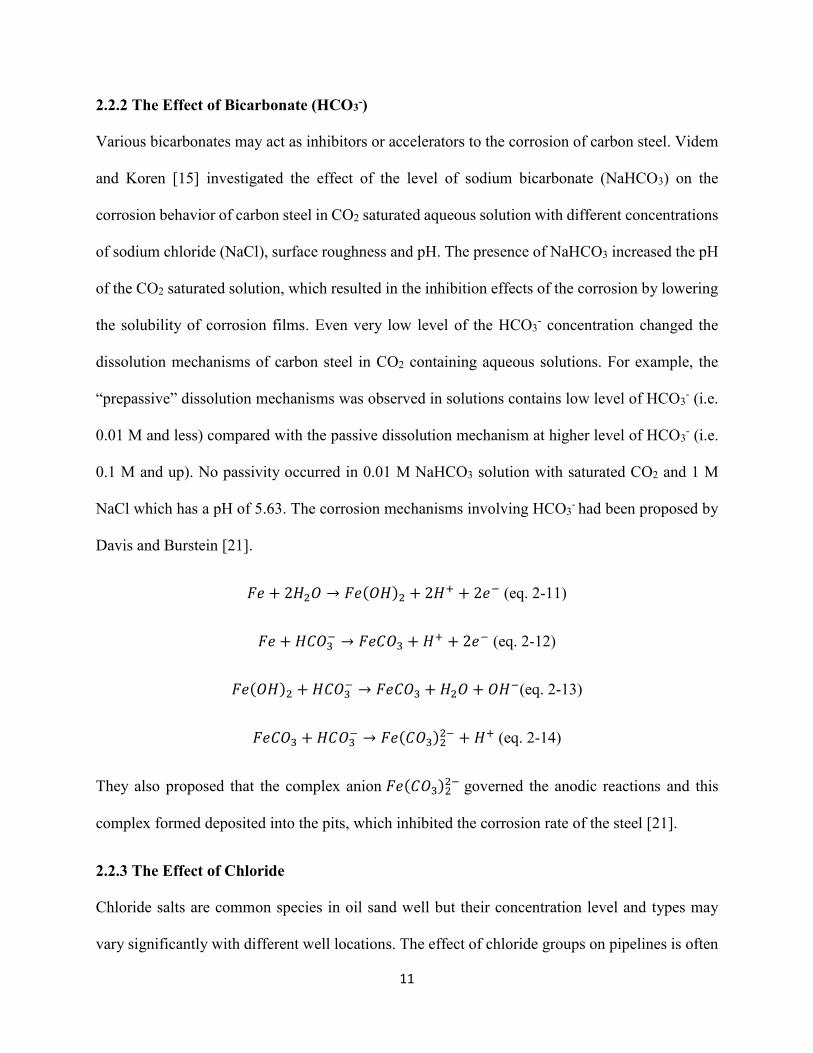
2.2.2 The Effect of Bicarbonate (HCO3-) ......................................................................................... 11
2.2.3 The Effect of Chloride ............................................................................................................. 11
2.3 Corrosion Protection Methods ....................................................................................................... 12
2.3.1 Inhibitors .................................................................................................................................. 12
2.3.2 Cathodic Protection ................................................................................................................. 13
2.3.3 Coatings .................................................................................................................................... 14
2.3.4. Other Approaches of Coatings Candidates for Slotted Liners ........................................... 15
2.4 Nitriding Treatment ........................................................................................................................ 16
2.4.1 Gas Nitriding ............................................................................................................................ 16

ix
2.4.2 Salt-bath nitriding .................................................................................................................... 17
2.4.3 Plasma nitriding ....................................................................................................................... 17
2.5 Gas Nitriding ................................................................................................................................... 18
2.5.1 Mechanism ................................................................................................................................ 18
2.5.2 Procedure .................................................................................................................................. 20
2.5.3 Microstructure and Composition ........................................................................................... 23
2.5.5 Applications and Advantages .................................................................................................. 24
2.5.6 More Advantages ..................................................................................................................... 26
2.6 The Corrosion and Wear Resistance of Nitriding Steels ............................................................. 27
2.6.1 The Sweet Corrosion of Nitriding Steels ................................................................................ 28
2.6.2 The Effect of Alloy Elements on Nitriding in Acidic Environment ..................................... 30
2.6.4 Improvement on Corrosion and Wear Resistance by Other Nitriding Methods ............... 31
2.6.5 Wear Resistance of Nitriding Steel ......................................................................................... 33
Chapter 3. Techniques .............................................................................................................................. 35
3.1 Electrochemical Tests ..................................................................................................................... 35
3.1.1 Three-Electrode Cell ................................................................................................................ 35
3.1.2 Electrochemical Impedance Spectroscopy ............................................................................. 36
3.1.3 Polarization Curves.................................................................................................................. 39
3.1.4 Potentiostatic Polarization ...................................................................................................... 42
3.2 Surface Characterization ............................................................................................................... 42
3.2.1 Microscopy ................................................................................................................................ 42
3.2.2 Energy-Dispersive X-ray Spectroscopy .................................................................................. 44
3.2.3 X-ray Diffraction ...................................................................................................................... 44
Chapter 4.The Optimization of Gas Nitriding Schedule ....................................................................... 45
4.1 Experimental Procedure................................................................................................................. 45
4.1.1 Gas Nitriding of L80 ................................................................................................................ 45
4.1.2 Solution Preparation ................................................................................................................ 48
4.1.3 Electrochemical Tests .............................................................................................................. 49
4.1.4 Surface Characterization ........................................................................................................ 50
4.2 Optimization of Nitriding Duration .............................................................................................. 50
4.2.1 Surface Characterization ........................................................................................................ 51
4.2.2 Electrochemical Tests .............................................................................................................. 54
4.2.3 The Effect of Nitriding Duration on the Industrial Application for Slotted Liners........... 57

x
4.2.4 Conclusions ............................................................................................................................... 58
4.3 The Optimization of Nitriding Temperature ................................................................................ 59
4.3.1 Surface Characterization ........................................................................................................ 60
4.3.2 Electrochemical Tests .............................................................................................................. 62
4.3.3 The Sensitivity of Nitriding Temperature .............................................................................. 64
4.3.4 Conclusions ............................................................................................................................... 65
4.4 The Optimization of Ammonia Flow rate ..................................................................................... 66
4.4.1 Surface Characterization ........................................................................................................ 67
4.4.2 Electrochemical Tests .............................................................................................................. 70
4.4.3 The Effect of Nitriding Temperature and Flow Rate on the Dissociation Rate ................. 72
4.4.4 Conclusions ............................................................................................................................... 73
4.5 Conclusions of Chapter 4 ............................................................................................................... 74
Chapter 5. The Corrosion Behavior of Gas Nitriding Steel .................................................................. 76
5.1 Experimental Procedure................................................................................................................. 76
5.2 Electrochemical Tests ..................................................................................................................... 77
5.2.1 Potentiodynamic Polarization Curves .................................................................................... 77
5.2.2 EIS Tests ................................................................................................................................... 79
5.2.3 EC Modeling ............................................................................................................................. 80
5.3 Surface Characterization ............................................................................................................... 84
5.4 Conclusions for Chapter 5 .............................................................................................................. 87
Chapter 6. The Stability Tests ................................................................................................................. 88
6.1 Experimental Procedure................................................................................................................. 88
6.1.1 Immersion Tests ....................................................................................................................... 88
6.1.2 Surface Characterization ........................................................................................................ 88
6.1.3 Electrochemical Tests .............................................................................................................. 89
6.3 Dimensional Stability ...................................................................................................................... 93
6.4 Corrosion Resistance ...................................................................................................................... 94
6.6 Conclusions of Chapter 6 ............................................................................................................... 95
Chapter 7. Conclusions ............................................................................................................................. 97
Chapter 8. Future Work ........................................................................................................................... 99
8.1 Further Optimization ..................................................................................................................... 99
8.2 Complex Simulated Solution .......................................................................................................... 99
8.3 Effect of H2S and Its Synergism with CO2 .................................................................................. 100

xi
8.4 HPHT Environment with Water ................................................................................................. 100
8.5 Erosion Resistance and Its Synergism with Corrosion .............................................................. 101
Reference ................................................................................................................................................. 103
Appendices ............................................................................................................................................... 111
Reproducibility .................................................................................................................................... 111
Electrochemistry Tests Data .............................................................................................................. 113

xii
List of Figures
Figure 1-1. The world oil reserves ranking……………………………………………………….2
Figure 1-2. The working principle of SAGD well completion……………………………………2
Figure 1-3. A failed section of slotted liner with considerable amount of corrosion stains………3
Figure 2-1. The typical cathodic protection system for well casing…………………………..…14
Figure 2-2. TeflonTM coated pipes……………………………………………..…………………16
Figure 2-3. SiloniteTM coated parts……………………………………………………………….16
Figure 2-4. The schematic of plasma nitriding…………………………………………………..18
Figure 2-5. The Schematic of ammonia decomposition and nitrogen interstitial diffusion……..19
Figure 2-6. Iron-Nitrogen equilibrium diagram………………………………………………….19
Figure 2-7. The Schematic of lab-scale gas nitriding set up……………………………………..21
Figure 2-8. The sample time and temperature schedule of a “one-stage” gas nitriding process...21
Figure 2-9. The industrial-scale “pot-type” gas nitriding furnace……………………………….22
Figure 2-10. The schematic of industrial-scale gas nitriding furnace……………………………23
Figure 2-11. Schematic of a typical nitriding treated structure………………………………….24
Figure 2-12. The typical microstructure of gas nitriding treated specimen…………………...…24
Figure 2-13. The hardness profile across of the 38HMG (nitralloy 135)………………….…….25
Figure 2-14. Approximate relative costs of various surface treatments………………………....26
Figure 2-15. The hardness depth profile of the GN treated steel for 2 h and 10 h………………34
Figure 3-1. The Schematic of a three-electrode cell setup……………………………………….35
Figure 3-2. A typical Impedance Bode plot……………………………………………………...37
Figure 3-3. A typical Nyquist plot……………………………………………………………….37
Figure 3-4. The schematic diagram of a simplified Randles cell………………………………..39

xiii
Figure 3-5. The schematic diagram of a coating system………………………...………………39
Figure 3-6. The Tafel extrapolation to estimate the Icorr and Ecorr of the Potentiodynamic
polarization curves……………………………………..………………………………………..40
Figure 3-7. A standard Potentiodynamic anodic polarization plot of 430 SS…………………...41
Figure 3-8. The schematic setup of an optical microscope………………………………………43
Figure 3-9. The schematic setup of SEM………………………………………………………..43
Figure 4-1. Thermolyne 79300 tube furnace……………………………………………...……..47
Figure 4-2. Figure 4-2. The schematic of three-electrode cell for specimens immersed in standard
simulated solution with saturated CO2 at 20°C, 1 atm.…………………………………………..50
Figure 4-3. The DM images of cross-section of GN treated L80 treated with different nitriding
duration taken at 400 X and 1000 X……………………………………………………………53
Figure 4–4. The effect of nitriding duration on the potentiodynamic polarization curves of nitriding
treated specimens in CO2 saturated simulation environment at 20°C. …………………………...55
Figure 4-5. The effect of nitriding duration on the EIS (Nyquist plot) of nitriding treated specimens
in the CO2 saturated simulated environment at 20°C………………………………57
Figure 4-6. The DM images of cross-section of GN treated L80 treated with different nitriding
temperature taken at 400 X and 1000 X…………………………………………………………61
Figure 4-7. The effect of nitriding temperature on the potentiodynamic polarization curves of
nitriding treated L80 specimens in CO2 saturated simulated environment at 20°C……………63
Figure 4-8. The effect of nitriding temperature on the EIS (Nyquist plot) test of nitriding treated
specimens in CO2 saturated simulated solution at 20°C. ……………………………………….64
Figure 4-9. The DM images of cross-section of GN treated L80 treated with different nitriding
temperature taken at 400 X and 1000 X……………………………………………………….69
Figure 4-10. The effect of ammonia flowrate on the potentiodynamic polarization curves of
nitriding treated L80 specimens in CO2 saturated simulated environment at 20°C…………….71
xiv
Figure 4-11. The effect of ammonia flowrate on the EIS (Nyquist plot) test of nitriding treated
specimens in CO2 saturated simulated solution at 20°C…………………………………………72
Figure 5-1. The potentiodynamic polarization curves of GN treated L80, Alloy 800 and L80 in the
same simulated solution with saturated CO2 at 20°C…………………………………………78
Figure 5-2. The Nyquist plot of different materials tested in the same environment…………...79
Figure 5-3. The Phase Bode plot of different materials tested in the same environment………..80
Figure 5-4. The EC fitting for the EIS data of GN treated L80 and Alloy 800 tested in the simulated
environment………………………………………………………………………………….….81
Figure 5-5. The EC fitting for the EIS data of L80 tested in the simulated environment……….81
Figure 5-6. The DM images of suface morphologies of different materials before and after the
potentiodynamic plorizaion tests in the same simulated environment………………………..…86
Figure 6-1. The XRD pattern of L80 and GN treated L80 specimens before and after the immersion
test in CO2 saturated simulated solution at 20 °C for 24 h………………………………..…..91
Figure 6-2. The surface EDX spectrum of GN treated L80 specimens before and after the
immersion test………………………………………………………………………………92
Figure 6-3. The secondary electron SEM images of surface morphology of GN treated L80 before
and after the immersion test………………………………………………………….……..94
Figure 6-4. The potentiostatic polarization curve of the GN treated L80 tested in simulated
environment with a constant applied potential, 0.2 V vs. Ag/AgCl, for 72 ……………………...95

xv
List of Tables
Table 2-1. The purpose of each stages of a “one-stage” gas nitriding process…………………..22
Table 3-1. The common electrical elements for EC model……………………………………...38
Table 4-1. The chemical compositions of L80……………………………………..……………46
Table 4-2. The composition of standard simulated solution……………………………………..49
Table 4-3. The matrix of optimization of nitriding duration…………………………..………..51
Table 4–4. The effect of nitriding duration on the corrosion current and corrosion rate of GN
treated L80…………………………………………………………………………………….56
Table 4-5. The matrix of optimization of nitriding temperature…………………………………59
Table 4-6. The effect of nitriding temperature on the corrosion current and corrosion rate of GN
treated L80………………………………………………….………………………………...63
Table 4-7. The matrix of optimization of ammonia flowrate……………………………………67
Table 4-8.The effect of ammonia flowrate on the corrosion current and corrosion rate of GN
treated L80……………………………………….....…………………………………………71
Table 5-1. The comparison of corrosion current density and corrosion rate of L80, GN treated L80
and alloy 800 in the same simulated environment………………………………………………78
Table 5-2. The EC fitting of GN treated L80 and alloy 800 tested in the same simulated
environment………………………………………………………………………………...83
Table 5-3. The EC fitting of L80 tested in the simulated environment…………………………84
Table 6-1. The composition of compound layer before and after the immersion test………….93

xvi
List of Abbreviations
SAGD Steam-assisted Gravity Drainage
HPHT High Pressure and High Temperature
GN Gas Nitriding
PD Potentiodynamic Polarization
EIS Electrochemical Impedance Spectroscopy
SEM Scanning Electron Microscope
XRD X-ray Diffraction
AES Auger Electron Spectroscopy
EDX Energy Dispersive X-ray
API American Petroleum Institute
CP Cathodic Protection
FBE Fusion Bonded Epoxy
PTFE Polytetrafluoroethene
SS Stainless Steel
AMS American Society for Materials
WE Working Electrode
RE Reference Electrode
CE Counter Electrode
AC Alternative Current
EC Equivalent Circuit
DM Digital Microscope
CRA Corrosion Resistance Alloy

xvii
Nomenclature
ε Fe2-3N phase
γ’ Fe4N phase
Z Impedance, Ω
R Resistance, Ω
Zre The real component of the impedance, Ω
Zim The imaginary component of the impedance, Ω
θ Phase angle, °
C Capacitance, F
E Potential, V or mV
I Current, A or µA
τ Time constant, s
Rs Resistance of solution, Ω
Rp Resistance to solution to surface interface, Ω
Cdl Capacitance of double layer, S-sn
Cc Capacitance of coating, S-sn
Rpo, Rpf Resistance of the pore, Ω
Rct Resistance of the coating, Ω
Ecorr Free corrosion potential, V or mV
Icorr Free corrosion Current, A or µA
βA, Anodic Tafel constants
βC Cathodic Tafel constants
E.W. Equivalent weight of the working electrode, g
d Density of the corroding species, g/cm2

xviii
λ Wavelength of incident wave, nm
d Lattice spacing, nm
θ Incident angle in Bragg’s Equation, °

1
Chapter 1. Introduction
1.1 The Introduction of Steam Assisted Gravity Drainage System
Alberta has the world third largest crude oil reserves (Figure 1-1), which is about 13% of the total
amount reserves in the world. The daily crude oil production barrels from oil sand reservoirs in
Alberta was as high as 1.9 million in 2011[1]. However, 80% of the oil sands are not suitable for
surface mining since they are deposited in deep ground. Therefore, in-situ methods such as steam
assisted gravity drainage (SAGD) must be applied to pump up the bitumen for further treatment.
With this technique, steam is injected into bitumen-rich oil sand trough the upper horizontal well.
Steam lowers the viscosity of bitumen, which allows it flowing into the slotted liner of the bottom
producer well. The heated and diluted bitumen is pumped to the ground and stored for upgrading
(Figure 1-2) [2]. However, various corrosive agents either generated during aquathermolysis
process or intrinsically contained in the formation, significantly reduce the service life of slotted
liners by degradation processes such as sweet corrosion (CO2 corrosion), sour corrosion (H2S
corrosion), H2S/CO2 synergism corrosion, sulfide stress corrosion (SSC) and erosion [4]. The
Faculty of Engineering at the University of Alberta is currently collaborating with RGL Reservoir
Management Inc., a leading supplier of completions tools for enhanced oil recovery, for the
designing of SAGD sand control and tooling system. One of the objectives of this collaborative
project is to reduce the corrosion and erosion damage of the slotted liners by development of
protective coatings with the ultimate goal of reducing the manufacturing cost and increase
production efficiency.

2
Figure 1-1. The world oil reserves ranking [1].
Figure 1-2. The working principle of SAGD well completion [3].
0
50
100
150
200
250
300
350
Bill
ion
s o
f b
arre
ls

3
1.2 The Problems: Corrosion and Erosion
The corrosion and erosion of slotted liners could be severe after long terms of service. The
corrosion rates of carbon steel in sweet and sour environments depend on various parameters such
as fluid chemistry, steel surface treatment and temperatures etc. The main corrosion products
formed by sweet corrosion, iron carbonate (FeCO3), can either precipitate on the steel surface as a
protective layer especially at elevated temperature or disperse into the fluid, which results in
unacceptable corrosion rate [6]. The corrosion and erosion roughen the liners wall and result in
deformation. They cause problems such as the fouling, plugging, passing of oversized particles
and reduced oil quality. Many different protections have been developed to mitigate the corrosion
of carbon steels as oil liners; however, commonly used corrosion control methods such as
inhibitors and cathodic protection are not suitable for slotted liners due to high costs and
environmental issues [5]. Therefore, surface treatment or coating is the only feasible protection
method to increase both of the corrosion and erosion resistances of carbon steel in sweet and sour
environment.
Figure 1-3. A failed section of slotted liner with considerable amount of corrosion stains [5].
4
1.3 The Objective and Scope of My Research
Therefore, to maintain the screening efficiency and increase the lifetime of slotted liners, our group
had been working on the development of an economic coating that can be industrially applied on
slotted liners to increase both the corrosion and erosion resistance in the sweet and sour
environment. Dr. Hong Luo had been working on the development of tungsten carbide-embedded
nickel coating by electro plating and Dr. Qinying Wang had been working on the investigation of
chromized coating by pack cementation. The objective of my work is to explore the feasibility of
the GN to improve the corrosion resistance of L80 in the simulated environment of slotted liners.
In this experiment, lab-scale GN by using tube furnace was constructed to form iron nitride coating
on L80 carbon steel. The optimizations of GN treatment schedule by varying nitriding time,
nitriding temperature and ammonia gas flowrate were conducted in this research. The corrosion
resistance of GN treated L80 was tested in the simulated environment of slotted liners. The
corrosion behavior of nitriding treated specimens were compared with L80 carbon steel which is
the current material used for slotted liners and alloy 800 which is commonly used in the oil well
injector for H2S-rich environment. This research examined the corrosion resistance and the
stability of the GN treated L80 in the simulated environment of slotted liners.
1.4 The Significance and Innovation of My Approaches
Although GN is a widely applied industrial method, the systematical investigations of the
corrosion resistance of GN treated steel in the solution with CO2 are seldom conducted since the
application of GN treated material is generally in dry environment as a material with the primary
purpose for high wear resistance [7]. Lack of researches and reports of the behavioral analysis of
the corrosion of GN treated carbon steel in solution drove me to research the feasibility of this
well-established and economic technique for the application on the slotted liners. Most labs used

5
the plasma nitriding treated carbon steels as their tests subjects. Due to the different mechanisms,
the plasma nitriding treated carbon steel is expected to have much better corrosion resistance than
GN treated carbon steel. However, this technique could not be used for industrial-scale mass-
production. There is one group, headed by Dr. Bingying Wang, in China University of Petroleum,
did some preliminary researches on the investigation of the corrosion resistance of GN treated steel
in CO2 containing environment. However, they did not systematically optimize their nitriding
process and they did not perform any stability test. Moreover, the composition of carbon steel is
also a crucial factor which significantly alters the composition and formation of the nitriding layers.
Therefore, their data could not be directly referred to predict the corrosion resistance of GN treated
L80 in the simulated environment. Furthermore, the conventional nitriding treatment aims for the
primary purpose of case hardening but not the high corrosion resistance. Consequently, the GN
treatment schedule must be modified to maximize the density and purity of compound layer, which
results in significantly increased corrosion resistance. However, it is usually not the conventional
industrial practice. Therefore, self-developed GN treatments must be done to predict the corrosion
behavior of GN treated L80 in simulated environment of slotted liners.
1.5 Techniques Used to Conducted My Research
The GN treatment of L80 carbon steel was mainly achieved by using a tube furnace with a quartz
tube. For the corrosion behavior analysis, electrochemical measurements and tests such as
potentiodynamic polarization curves and electrochemical impedance spectroscopy (EIS) were
used to test electrochemical behavior of specimen in simulated environment. Tafel fitting and
equivalent circuit modeling were the main analysis methods applied to interpret the data from
electrochemical tests. Surface analysis methods such as digital microscopy (DM) and scanning
electron microscopy (SEM) were used to characterize the surface morphology and microstructure

6
of specimen. The surface compositional analysis before and after the immersion tests were
achieved by using X-ray diffraction (XRD) and energy dispersive x-ray (EDX). Last but not least,
the tests of stability and degradation resistance were accomplished by immersion test and
potentiostatic polarization test. With both the assistance of electrochemical tests and surface
characterization analysis techniques, the corrosion behavior of the coatings can be systematically
and comprehensively evaluated.

7
Chapter 2. Literature Review
2.1 The Corrosion Environment of Slotted Liners
2.1.1 Acid Gases
The generation of acid gases such as CO2, H2S and sulphur dioxide (SO2) along with small amount
of hydrogen (H2) and methane (CH4) are usually from the aquathermolysis process, which is the
in-situ technology used to reduce the viscosity of bitumen by injecting HPHT water steam into the
oil sand well [8]. This gaseous phase separated from this process usually contains as high as 35 -
40 mol% of CO2 and 2 - 3 mol% of H2S [9]. Some researchers argued that the sweet corrosion
itself does not significant increase the corrosion rate since the operation temperature (higher than
200°C) significantly decreases the solubility of CO2 in the water phase. Therefore, the pH of
produced water is usually not acidic, which passive corrosion behavior is generally expected [9].
Therefore, the water chemistries were predicted with only mild corrosion effects with uniform
corrosion rate of 0.06 mm/y on carbon steel in this operation environment. However, according to
the field data gathered by Whittaker et al. [10] from the corrosion products of liners after only five-
year of service, the actual uniform corrosion rate of failed segment from McMurray reserves was
measured as high as 8 mm/year. In their study, the XRD results showed that 80 % of corrosion
products resulted from the corrosion involves CO2 and only 15 % iron sulfide were from H2S
corrosion. They also concluded that the acidic environment usually resulted in much porous
corrosion products deposition than neutral or alkaline environment. Therefore, my research started
with the most common and dominated sweet corrosion as the main corrosion mechanism of the
simulated environment.
2.1.2 The Chemical Compositions of Bitumen and Formation Water
The tar sand usually consists of 86 % of silica sand and clay, which are designed to be partially
removed by the slotted liners. The crude bitumen is only about 10 % from the tar sand, and the rest

8
is 4 % saline water [11]. The injected steam increases the moisture level of the tar sand and three
phases form. The erosion of the liners is mainly caused by the solid particles; but the water phase
accounts for the corrosion. The produced water usually contains ion or anions groups such as
chloride (Cl-), carbonate (CO32-), bicarbonate (HCO3
-) and sulfate (SO42-), and cations such as Na+,
Ca2+, Mg2+ and K+ [9]. The concentration of different species varies significantly in different oil
reserves. These species may have either inhibiting or detrimental effect on the corrosion behavior
of steel in this environment. For example, Cl-, as a common species in oil sand, has a well-known
detrimental effect on accelerating the localized corrosion by the breakdown of passive films
formed on stainless steel (SS) [12]. By contrast, the formation water from McMurray and Grand
Rapids formations contains 750 ppm HCO3-, which inhibits the corrosion by increasing the pH of
water [10]. This research selected the “sodium-chloride-bicarbonate” basal water type, which is a
common type from McMurray formation [13], as the reference solution for the simulated solution
for the tests.
2.1.3 Casing Grade of Slotted Liners
In this study, L80 was selected as the core material since L80 is the existing material in application
for slotted liners. L80 is manufactured under American Petroleum Institute (API) specification
5CT, which has a minimum yield strength of 565 MPa [14]. L80 is available in type 1, 9Cr and
13Cr. 9Cr was popular in the past for CO2 and H2S contaminated wells, but it has been replaced
by the most costly 13Cr, which has better CO2 induced weight-loss corrosion resistance; however,
the high susceptibility of corrosion induced by sour environment limits 13Cr to the application in
reservoirs where the partial pressure of H2S is lower than 1.5 psi. Type 1 L80, which is usually
abbreviated as L80, is the least expensive L80 steel, but it is more susceptible to weight-loss

9
corrosion. It is one of the most commonly applied pipeline materials for oil and gas field nowadays
[15].
2.2 The Corrosion Mechanism in this Simulated Environment
2.2.1 The Effect of Carbon Dioxide (CO2)
The corrosion of carbon steel in water with dissolved CO2 has been studied for several decades to
investigate and predict the corrosion behavior of carbon steel in oil and gas field. The solubility of
CO2 mainly depends on the partial pressure of CO2, temperature and also the species present in
bitumen. The corrosion processes involve CO2, H2O and Fe generally go through the reactions list
below[16] [17],
Absorption of gaseous CO2,
𝐶𝑂2(𝑔) + 𝐻2𝑂(𝑙) ↔ 𝐻2𝐶𝑂3(𝑎𝑞) (eq. 2-1)
The acidification,
𝐻2𝐶𝑂3 ↔ 𝐻+ + 𝐻𝐶𝑂3− (eq. 2-2)
𝐻𝐶𝑂3− ↔ 𝐻+ + 𝐶𝑂3
2− (eq. 2-3)
The anodic reaction is simply the oxidation of iron,
𝐹𝑒 → 𝐹𝑒2+ + 2𝑒− (eq. 2-4)
The cathodic reactions occur either by the direct reduction of hydrogen,
2𝐻+ + 2𝑒− → 𝐻2(eq. 2-5)
Or by the reduction of carbonate,
𝐻2𝐶𝑂3 + 𝑒− →1
2𝐻2 + 𝐻𝐶𝑂3
− (eq. 2-6)

10
𝐻𝐶𝑂3− →
1
2𝐻2 + 𝐶𝑂3
2− (eq. 2-7)
Oxides may form either with carbonates,
𝐶𝑂32− + 𝐹𝑒2+ → 𝐹𝑒𝐶𝑂3 (eq. 2-8)
Or react with bicarbonates,
𝐹𝑒2+ + 2𝐻𝐶𝑂3− → 𝐹𝑒(𝐻𝐶𝑂3)2 (eq. 2-9)
𝐹𝑒(𝐻𝐶𝑂3)2 → 𝐹𝑒𝐶𝑂3 + 𝐶𝑂2 + 𝐻2𝑂 (eq. 2-10)
A protective film with brittle and loosely adhered iron carbonate (FeCO3) is the main corrosion
product. Finely dispersed Fe3C formed during heat treatment provide better adhesion for protective
layer since FeCO3 tends to segregate in the voids where Fe selectively dissolved [18]. The
solubility of FeCO3 is faster in more acidic solution due to the accelerated Fe2+ products formation
[16]. When the amount of Fe2+ and CO32- exceed their solubilities in the aqueous phase, they
precipitate onto the steel surface with different morphologies [18]. From Palacious and Shadley’
study [19], they suggested that the FeCO3 is usually porous, which allows Cl-, CO32-, and HCO3
-
transfer from the solution into the corrosion production to reach the alloy interface. The thin
protective film become more compact with time as the deposition of newly formed corrosion
product filling in the voids of previous formed corrosion products. The porosity of film decreases
with the increase of Cl- due to the segregation of Cl– [20]. The corrosion products can be easily
removed by the flow due to the Cl--induced coating spallation [10] and solid impurities in the real
operation environment. Therefore, the corrosion products generally did not provide sufficient
protections based on the data obtained in their immersion tests [20].
11
2.2.2 The Effect of Bicarbonate (HCO3-)
Various bicarbonates may act as inhibitors or accelerators to the corrosion of carbon steel. Videm
and Koren [15] investigated the effect of the level of sodium bicarbonate (NaHCO3) on the
corrosion behavior of carbon steel in CO2 saturated aqueous solution with different concentrations
of sodium chloride (NaCl), surface roughness and pH. The presence of NaHCO3 increased the pH
of the CO2 saturated solution, which resulted in the inhibition effects of the corrosion by lowering
the solubility of corrosion films. Even very low level of the HCO3- concentration changed the
dissolution mechanisms of carbon steel in CO2 containing aqueous solutions. For example, the
“prepassive” dissolution mechanisms was observed in solutions contains low level of HCO3- (i.e.
0.01 M and less) compared with the passive dissolution mechanism at higher level of HCO3- (i.e.
0.1 M and up). No passivity occurred in 0.01 M NaHCO3 solution with saturated CO2 and 1 M
NaCl which has a pH of 5.63. The corrosion mechanisms involving HCO3- had been proposed by
Davis and Burstein [21].
𝐹𝑒 + 2𝐻2𝑂 → 𝐹𝑒(𝑂𝐻)2 + 2𝐻+ + 2𝑒− (eq. 2-11)
𝐹𝑒 + 𝐻𝐶𝑂3− → 𝐹𝑒𝐶𝑂3 + 𝐻+ + 2𝑒− (eq. 2-12)
𝐹𝑒(𝑂𝐻)2 + 𝐻𝐶𝑂3− → 𝐹𝑒𝐶𝑂3 + 𝐻2𝑂 + 𝑂𝐻−(eq. 2-13)
𝐹𝑒𝐶𝑂3 + 𝐻𝐶𝑂3− → 𝐹𝑒(𝐶𝑂3)2
2− + 𝐻+ (eq. 2-14)
They also proposed that the complex anion 𝐹𝑒(𝐶𝑂3)22− governed the anodic reactions and this
complex formed deposited into the pits, which inhibited the corrosion rate of the steel [21].
2.2.3 The Effect of Chloride
Chloride salts are common species in oil sand well but their concentration level and types may
vary significantly with different well locations. The effect of chloride groups on pipelines is often

12
complex as reported. The content of Cl- cannot change the composition of corrosion product films
but it assists the breakdown of film since the size of Cl- is small enough to penetrate through the
protective film to segregate as clusters between the film and metal interface, which decreases the
adhesiveness of the film [20]. The proposed anodic reactions are:
𝐹𝑒 + 𝐶𝑙− + 𝐻2𝑂 → [𝐹𝑒𝐶𝑙(𝑂𝐻)]𝑎𝑑− + 𝐻+ + 𝑒− (eq. 2-15)
[𝐹𝑒𝐶𝑙(𝑂𝐻)]𝑎𝑑− → 𝐹𝑒𝐶𝑙𝑂𝐻 + 𝑒− (eq. 2-16)
𝐹𝑒𝐶𝑙𝑂𝐻 + 𝐻+ → 𝐹𝑒2+ + 𝐶𝑙− + 𝐻2𝑂 (eq. 2-17)
The concentration of NaCl may be up to 3M in some oil reserves [16]. The presence of Cl- always
relates to the initiation of pitting corrosion. Liu et al. studied the effects of chloride content on CO2
corrosion of N80 carbon steel in simulated oil and gas well environments. They concluded that the
corrosion rate of N80 in solution with 25 g/mol of Cl- and anions such as Ca2+ and Mg2+ resulted
in a peaked corrosion rate of about 4.0 mm/yr in an environment with 20 bar partial pressure of
CO2. This corrosion rate was about twice of the corrosion rate in the brine without Cl-. High level
of Cl- , which was larger than 80 g/L, might inhibit the corrosion process since it decreased the
solubility of CO2 in aqueous phase [20].
2.3 Corrosion Protection Methods
2.3.1 Inhibitors
Inhibitors are commonly added into the injected steam to modify the environment in deep well.
For example, in the wells in McMurray reserves, oxygen scavenger ammonium bisulfite
((NH4)HSO4) is added to reduce the corrosion induced by dissolved oxygen. Caustic injection of
sodium hydroxide (NaOH) is adapted to increase the pH of environment by reducing the solubility
of carbon dioxide in water phase [10]. However, due to the special structure of slotted liners, both

13
the efficiency and the recovery of the inhibitors are extremely low in this case [22]. Moreover, the
inhibitors built up through the operation not only contaminate the basal water, but also significantly
lower the quality of oil production. Therefore, inhibitors could not be used as a major corrosion
protection method for slotted liners.
2.3.2 Cathodic Protection
Although cathodic protection (CP) for oil well is expensive and difficult to perform in most cases,
it is still another avenue to protect the liners by either sacrificing a more active piece of metal to
draw corrosion away from the pipe itself (galvanic action) or impress a certain protective current
[23]. The CP system for well casing (Figure 2-1) is an impressed current CP system which requires
a large active anode bed to protect the well casing [24]. Although CP is a powerful tool to protect
the well casing, its efficiency is limited especially at the deep end of the well [25]. Oliphant from
Devon Canada tried in determining the current requirement for oil well by using average current
density, the E-log test, casing potential profiles and mathematical modeling. He concluded that
coated well casings were observed with lower current requirements and better current distribution,
which increased the protection efficiency and lowered the operation costs [26]. Therefore, to have
a coating as the primary corrosion protection method is necessary for the corrosion protection of
slotted liners.

14
Figure 2-1. The typical cathodic protection system for well casing [24].
2.3.3 Coatings
Coating is the most common method to prevent the external corrosion of oil pipelines by sealing
fusion bonded epoxy (FBE) and polyethylene on the outer surface of the pipelines [27]. However,
the conventional methods could not be applied on slotted liners because the operation temperature
of slotted liners is typical around 250°C, which is higher than the maximum service temperature
of FBE. Moreover, the slotted liners require both internal and external coating, but the FBE cannot
be evenly applied on the slotted liners with such a complex geometry [27]. Therefore, new methods
or improvements must be developed to effectively protect the liners from corrosion. Ceramic
coating was our primary candidate since ceramic coating is believed to have both outstanding
corrosion and erosion resistance at high temperature. Several researches on various nitriding
coating showed promising results in the application in oil industry.
2.3.3.1 Diffusion Coating
Diffusion coating is a heat treatment method to form a corrosion, wear and fatigue resistant coating
at the surface of metal or alloy at high temperature. Diffusion coating produces a diffusion zone
15
with compositional gradient which formed by the chemical reactions between substrate and
treatment media. The treatment media could be solid, liquid or gas [28]. Generally, diffusion
coating will have better coating adhesion due to the presence of diffusion layer. Therefore, it has
higher resistance to the thermal shock induced coating spallation [29]. Moreover, diffusion coating
is a well-established and cost-efficient industrial treatment. Therefore, I selected GN as the primary
coating candidate for the corrosion protection coating on slotted liners. The researches on the
corrosion resistance of nitriding treated alloy will be discussed in sections 2.5 and 2.6.
2.3.4. Other Approaches of Coatings Candidates for Slotted Liners
Beside the GN treatment mentioned in previous sections, the researches on many other coating
techniques for the slotted liners are also in progress. For example, EnCana Corporation conducted
several tests on the polytetrafluoroethene (PTFE), or so called TeflonTM coating (Figure 2-2) [30],
which has a maximum operation temperature above 260℃. Another feature of this material is the
“non-sticky” property to oil which results in the mitigation of plugging of solid particles [31, 32].
On the other hand, ceramic coatings are also being investigated due to their inert chemical
properties and high strength at high temperatures. SiloniteTM coating (Figure 2-3), mainly consists
of SiO2, was also developed by EnTech® especially due to its extremely high resistance in sour
corrosion environment [30]. This dense and smooth ultra-thin coating was tested to have
outstanding corrosion and wear resistance in many aggressive environment. However, the thermal
expansion coefficient of PTFE is more than ten times of the thermal expansion of steel. The
disbondment at high temperature due to expansion induced cracks may be a concern for the
application of this material [34]. Moreover, silica deposited by hot fusion technique has an
intrinsically weak bonding with ferrous material, which may indicate that this coating is more
susceptible to coating spallation induced by mechanical forces [35].
16
Figure 2-2. TeflonTM coated pipes [30].
Figure 2-3. SiloniteTM coated parts [33].
2.4 Nitriding Treatment
2.4.1 Gas Nitriding
Gas nitriding (GN), which had been developed since early 1900s, is the most widely applied
industrial-scale nitriding method [36]. GN process involves the diffusion of nitrogen into the
surface of steels by dissociation of ammonia (NH3) at 500°C to 580°C. The composition and
microstructure of iron nitrides formed on the steel surface in this process are effected by the

17
controls of nitriding parameters such as the nitriding duration and temperature. “Single-stage” GN,
which is the schedule applied in this research, is the simplest GN schedule. It requires lower
operation temperatures and forms a shallower nitride-rich layer but with higher hardness and less
dimensional distortion. Moreover, GN is the most economic nitriding treatment. Although the
drawback of this method is the long treatment duration and low efficiency, it is so far the most
industrially favorable nitriding method [36]. GN treated steel with improved chemical and
mechanical properties is considered as a promising candidate for the slotted liner of SAGD system;
therefore, lab-scale gas nitriding was developed and optimized for the surface treatment of L80
steel in this research.
2.4.2 Salt-bath nitriding
Salt bath nitriding is another industrial-scale nitriding treatment, which was firstly developed as
an alternative of gas nitriding. It involves the dissociation of cyanide to cyanate at the same
temperature with GN treatment and leads to the liberated nitrogen to be readily diffused into the
iron matrix. Compared with GN, salt bath nitriding shortens the process time to less than 10 h but
the toxicity of the cyanide salts and its hazardous impact on environment let it fall out of favor for
the industrial application in recent decades [36]. Although some of the companies still adopt this
method as their primary nitriding method, our lab did not attempt this method for our research by
considering the accessibility and toxicity of the raw materials.
2.4.3 Plasma nitriding
Plasma nitriding is the latest nitriding technique, which achieves the nitriding effect by the
ionization of nitrogen gas at lower temperature (Figure 2-4). Therefore, this method is also called
“glow discharge” nitriding. Plasma nitriding is the most efficient nitriding method; it not only
further shortens the process time, but also has the highest precision of properties control. However,

18
both the capital and operation costs of this technique are much higher than the GN and salt-bath
nitriding [36]. This technique cannot be applied to process large pieces. However, most
experiments conducted in the lab refer to this technique as their fabrication method. Therefore,
their interpretations are only partially adopted as the reference to my research in section 2.6.
Figure 2-4. The schematic of plasma nitriding [39].
2.5 Gas Nitriding
2.5.1 Mechanism
The GN process usually involves the partially dissociation of ammonia gas at 500°C to 580°C by
the following simple reaction:
2𝑁𝐻3 ↔ 2𝑁 + 3𝐻2 (eq. 2-18)
Some of liberated nitrogen atoms recombine into nitrogen gas and flow out with undissociated
ammonia and produced hydrogen. The remaining of liberated nitrogen atoms slowly diffuse into
the steel at these temperatures (Figure 2-5) to form either face-centered cubic γ’ phase, Fe4N,
19
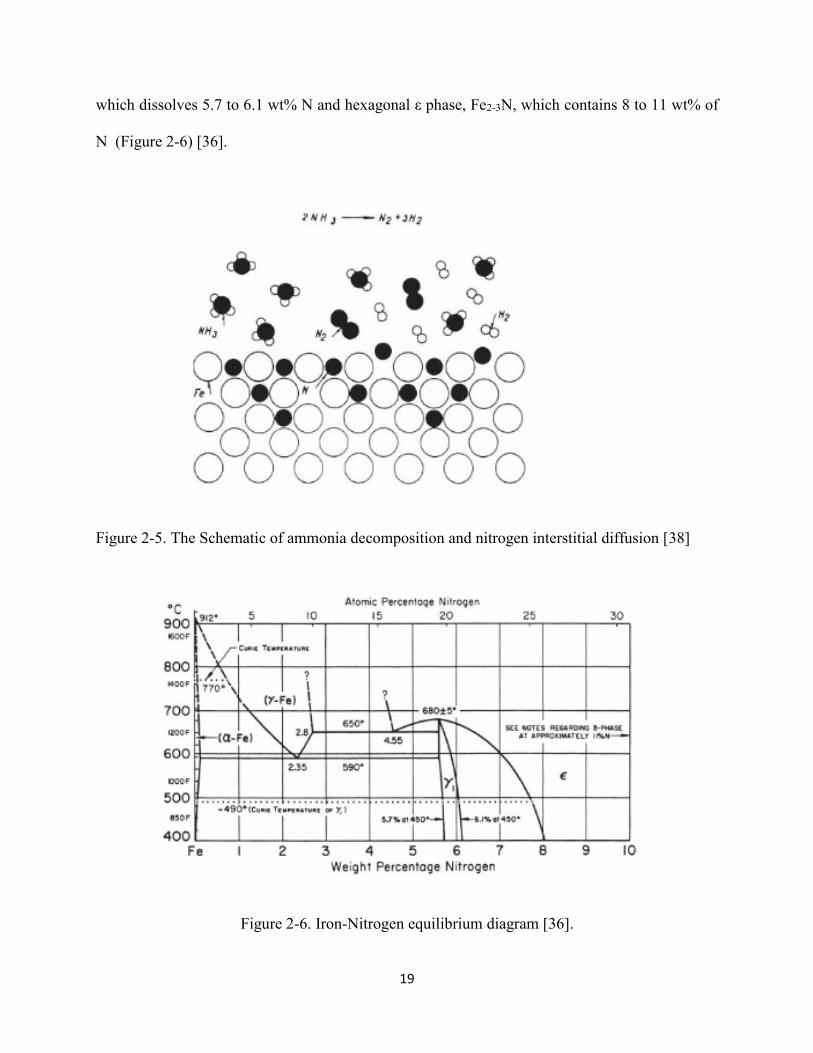
which dissolves 5.7 to 6.1 wt% N and hexagonal ε phase, Fe2-3N, which contains 8 to 11 wt% of
N (Figure 2-6) [36].
Figure 2-5. The Schematic of ammonia decomposition and nitrogen interstitial diffusion [38]
Figure 2-6. Iron-Nitrogen equilibrium diagram [36].

20
2.5.2 Procedure
Since the industrial-scale GN furnace was not available in this research, I constructed the lab-scale
gas nitriding set-up according to the industrial-scale gas nitriding furnace by using a tube furnace
as the heating equipment and quartz tube as the gas chamber and sample holder (Figure 2-7). The
working gas was the high purity anhydrous ammonia gas. Nitrogen gas was used as the purge gas
before the gas nitriding process in order to prevent explosion caused by the mixing of ammonia
gas and air, and flushing gas after the gas nitriding in order to remove the ammonia gas from the
tube for its irritant smell. The tube furnace was programed based on the “one-stage” gas nitriding
schedule (Figure 2-8) since this treatment only have one diffusion stage (Table 2-1). The reason
to use this nitriding schedule was because this schedule results in the least specimen deformation
[36] which is important to the dimensional uniformity of slotted liners. The gas washing bottle was
applied to minimize the discharge of ammonia directly into the atmosphere since the solubility of
ammonia is very high (maximum solubility: 700 mL ammonia gas in 1 mL of water at standard
atmosphere pressure at 25°C [36]) in water. The GN set-up was placed in the fumehood to prevent
gas leaks during the treatment. The industrial-scale (Figure 2-9) GN furnace nowadays has been
developed with computer controlled system, which is capable of extremely precise temperature
and flowrate control. The industrial GN furnace follows the same principle of the lab set-up but
with a stirring fan on the top to ensure the temperature and the uniformity of gases phase (Figure
2-10).

21
Figure 2-7. The Schematic of lab-scale gas nitriding set up.
Figure 2-8. The sample time and temperature schedule of a “one-stage” gas nitriding process.
Pre-heating
Absorption
Diffusion
De-nitriding
Cooling
NH3
N2
520°C NH
3+N
2+H
2
N2+H
2
Fumehood
H2O+NH
3
Specimens
Inlet Outlet
Quartz tube
Tube furnace
Gas washing bottle

22
Table 2-1. The purpose of each stages of a “one-stage” gas nitriding process [36].
Stage Purpose
Pre-heating To preheat the specimens to nitriding temperature; to allow ammonia
expel the nitrogen injected to prevent the mixing of air and ammonia.
Absorption To allow the dissociated nitrogen steadily and slowly absorbing onto
the surface of specimens.
Diffusion To create a large diffusional layer by increasing the dissociation rate of
ammonia and diffusion rate of nitrogen into the core material.
De-nitriding To decrease the brittleness of surface compound layer by removing the
surplus nitrogen from this layer.
Cooling To cool the temperature of nitrided specimens to room temperature for
specimens collection.
Figure 2-9. The industrial-scale “pot-type” gas nitriding furnace [38].

23
Figure 2-10. The schematic of industrial-scale gas nitriding furnace [36].
2.5.3 Microstructure and Composition
The surface structure of nitriding steel highly depends on the chemical compositions and the
nitriding conditions. However, it generally consists of a compound layer with mixture of γ’ (Fe4N)
and ε (Fe2-3N) and a diffusion zone (Figure 2-11,12), which is the substrate with diffused nitrides
[39]. The compound layer with higher hardness and inert chemical properties is the effective layer
to resist the corrosion and erosion. The thickness of compound layer is usually around 10 µm but
the diffusion zone can extend to 200 µm from the interface of compound layer toward the core of
substrate [39]. ε phase is reported with higher corrosion resistance and less brittleness [36].
Therefore, treatment schedule needs to be varied to obtain the ε phase as much as possible.
Alloying elements, such as chromium (Cr) and vanadium (V), are beneficial for the nitriding

24
process since the formation of nitrides zone increases the microhardness of the diffusion layer.
Therefore, SS usually forms more complex diffusion layer due to higher amount of alloying
elements [36]. Since L80 is a plain carbon steel with very limited amount of alloying elements, the
GN process of L80 and expected properties should be similar to those of normal carbon steel.
Figure 2-11. Schematic of a typical nitriding treated structure [36].
Figure 2-12. The typical microstructure of GN treated specimen [36].
2.5.5 Applications and Advantages
The most commonly known application of GN treated steel is for the hot-work forming tools such
as forging dies since this technique significantly increases both the hardness of surface and
Diffusion zone
Compound zone / white layer
Transition zone
Core material

25
diffusion zone (Figure 2-13). The operation environment of GN treated steels are typically as high
as 500°C; therefore, nitriding treated steel is thermally stable at high temperature [40]. GN treated
steels are also widely used as heavy duty machine components in automotive and aerospace
industries due to its high wear resistance. The compound layer is ductile enough to maintain the
dimensional stability after long term of service [40]. The corrosion resistance of compound layer
also has great potential to be used as anticorrosion nitriding material. One of the examples is the
rams for hydraulic systems of excavators working in salt and copper mines [40]. The ram made of
40HM or 18G2A steel as heavy as 320 kg was GN treated in a pit furnace at 570°C for 4 hr. The
nitriding ram had successfully withstood the exposure to salt spray exceeding 264 h without signs
of corrosion. The corrosion resistance retained even with some point defects detected after years
of operation due to the presence of nitride - rich diffusion layer [40]. This application not only
indicated that GN treated steels have great resistance to penetration of the aggressive species in
solution but also suggested the promising stability of GN treated steels in humid environments.
Figure 2-13. The hardness profile across of the 38HMG (Nitralloy 135) [40]
26
2.5.6 More Advantages
Besides the advantages mentioned in the previous subsection, some other features also allow GN
to become one of the most competitive candidates for the application as slotted liners. For the
industrial-scale production, the cost-effectiveness of the mass production of large pieces becomes
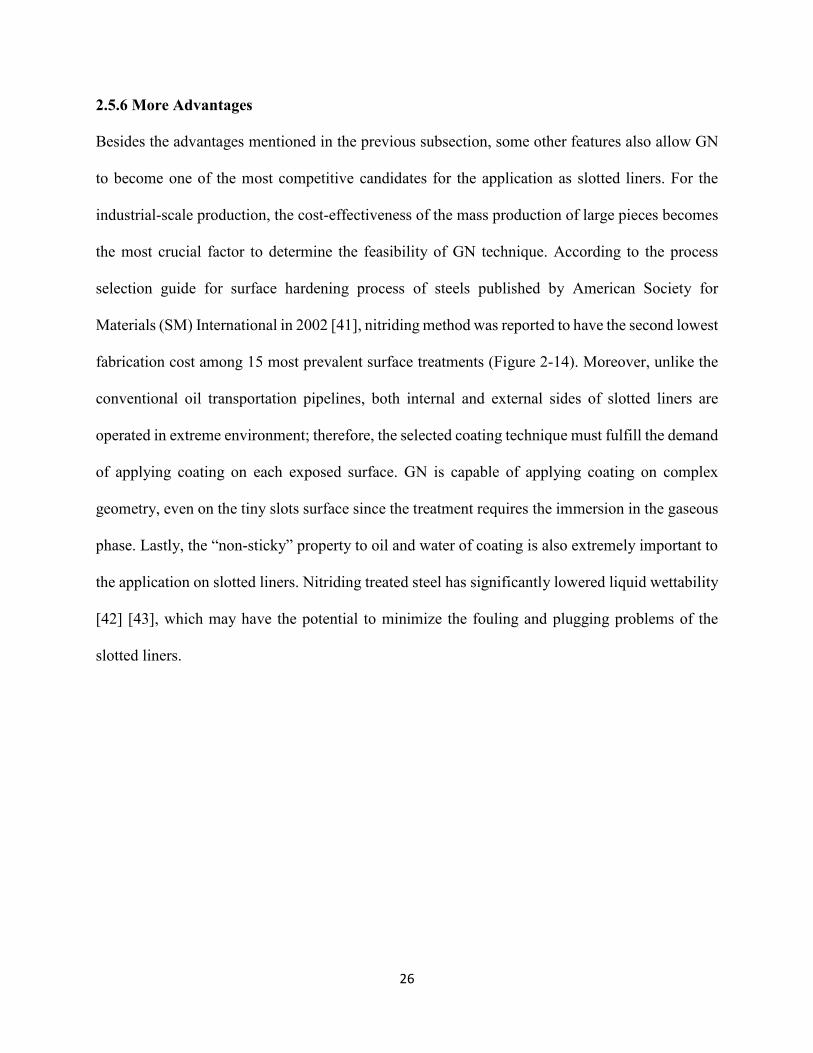
the most crucial factor to determine the feasibility of GN technique. According to the process
selection guide for surface hardening process of steels published by American Society for
Materials (SM) International in 2002 [41], nitriding method was reported to have the second lowest
fabrication cost among 15 most prevalent surface treatments (Figure 2-14). Moreover, unlike the
conventional oil transportation pipelines, both internal and external sides of slotted liners are
operated in extreme environment; therefore, the selected coating technique must fulfill the demand
of applying coating on each exposed surface. GN is capable of applying coating on complex
geometry, even on the tiny slots surface since the treatment requires the immersion in the gaseous
phase. Lastly, the “non-sticky” property to oil and water of coating is also extremely important to
the application on slotted liners. Nitriding treated steel has significantly lowered liquid wettability
[42] [43], which may have the potential to minimize the fouling and plugging problems of the
slotted liners.
27
Figure 2-14. Approximate relative costs of various surface treatments [41].
2.6 The Corrosion and Wear Resistance of Nitriding Steels
The excellent wear resistance of GN treated specimens at dry HTHP environment has been proven.
However, the corrosion behavior of GN treated carbon steel is not well-studied, especially in CO2
containing solution because the existing application of gas nitriding steel in humid environment or
solution is very limited. Since the water acts as the electrolyte to corrosive species, the operation
environment of slotted liners is prone to cause much severer corrosion behavior on GN treated
specimens and the driving corrosion mechanisms may be different from the environment without
much water. Dr. Bingying Wang’s group in China University of Petroleum [44, 45] was working
on the effect of CO2 containing solution on the corrosion behavior of GN treated steels. Their
studies were focused on steels with typically higher amount of Cr content than L80, which has no
Cr in the matrix. Since the chromium nitride has higher corrosion resistance than iron nitride, to
directly use their results to predict the corrosion mechanism and behavior of L80 carbon steel in

28
the simulated environment of slotted liners is not reliable. Furthermore, they did not report any
stability tests, which is essential to the characterization of coating performance in extreme
environment. Therefore, the GN schedules for L80 were optimized in this research for long term
uses in the simulated environment of slotted liners.
2.6.1 The Sweet Corrosion of Nitriding Steels
Wang et al. [44] carried a series of corrosion and wear resistance tests on GN treated steels.
Significant increases of hardness from 275 HV (substrate) to 675 HV (compound layer) were
observed for the 40Cr steel GN treated in ammonia at 550°C for 10 hrs. The gradual change of
hardness resulted from the formation of diffusion layer ensures the firm bond between the nitride
rich layer and substrate. The SEM results of 40Cr steel after 10 h of GN treatment showed that
their treatment tended forming finer, more compact and ordered scale of corrosion product FeCO3
in 3.5% NaCl solution with 80 psi CO2 pressure at 60°C. The weight loss experiment suggested a
decreased corrosion rate from 9.929 mg/m2 ·h of untreated specimen to 7.555 mg/m2 ·h (GN
treated). However, they only compared the corrosion resistance of the effect on nitriding duration
by doing electrochemical tests on GN steel treated for 2 h and 10 h. The typical industrial
application of gas nitriding treatment is usually much longer than 10 h [36]. Therefore, I doubt that
with such a short nitriding time, the formation of a surface nitrides layer would not be compact
enough to characterize the effects of nitriding layer. Moreover, they did not investigate the
relationship between nitriding duration to the corrosion resistance. Only two nitriding durations
could not suggest a reliable relation between the nitriding duration to the corrosion resistance of
nitriding steel.
Wang et al. [45] also observed that the corrosion potential of gas nitriding treated Cr40 steel was
elevated from -599.0 mV vs. SCE (untreated) to -265.9 mV vs. SCE (GN treated for 10 h) in the
29
same solution with 3.5 wt% NaCl and 80 psi CO2 at 30 °C. The corrosion current significantly
decreased from 42.68 µA/cm2 to 8.550 µA/cm2, which indicated a great drop of corrosion rate in
this environment. The passivation region of GN treated specimen showed great corrosion
inhibition effect. By contrast, the Cr40 steel without GN treatment tends to active dissolution.
These electrochemical results indicated GN steel was a promising corrosion resistant material in a
CO2 containing solution. However, a single value of corrosion rate and a potentiodynamic curve
cannot determine the corrosion behavior of GN treated L80. Therefore, I decided to take an insight
of the corrosion behavior of GN treated L80 in CO2 containing environment by using equivalent
circuit modeling for the EIS tests.
According to another research by Wang et al. on 35CrMo [46], nitriding steels were also reported
with better anchoring effect on the corrosion products deposited on the surface to further inhibit
the sweet corrosion. Unlike the loosely attached porous corrosion products obtained from the sweet
corrosion on carbon steel in CO2 environment, the corrosion product FeCO3 deposited on nitriding
steel was observed with fine and compact crystalline morphology. This greatly enhanced property
suggested that the nitriding layer retained the protection effect by the deposition of compact
corrosion products even with a slight degree of coating degradation. It is an important property for
the long term service of GN treated steel in the real operation environment. Therefore, a series of
stability tests were designed to verify these observations of corrosion product depositions in my
research.
Liu [47] studied the corrosion resistance of nitriding treated 45 steel in the CO2 containing
produced water from oil well. He reported that the corrosion current increased with the decreases
of pH of solution by varying the amount of CO2 dissolved; however, the corrosion current
increased with the increase of temperature even when the solubility of CO2 in the solution dropped

30
significantly. These results suggested that the effect of CO2 may not be an issue at the operation
temperature of slotted liners because the corrosion mechanism at high temperature was not
dominated by the sweet corrosion mechanism. However, the corrosion mechanism of nitriding
steels might significantly vary in the HPHT environment since the high pressure dramatically
increases the solubility of CO2 in water. Therefore, further researches on the corrosion resistance
of GN treated steel applied as slotted liners should also be conducted at HPHT environment.
2.6.2 The Effect of Alloy Elements on Nitriding in Acidic Environment
Generally, the presence of alloy elements increases the corrosion resistances of nitriding steels due
to the formation of complex nitrides [36]. For example, Chen et al. [48] tested the corrosion
resistance of GN treated Fe-9.0Al-30Mn-1.8C alloy at 550 °C for 4 h in 10% HCl solution. The
pitting potential of this treated alloy in this environment shifts from -750 mV vs SCE to +30 mV
vs. SCE. The corrosion current was approximately three orders of magnitude smaller than the
untreated alloy in the same environment. Moreover, only nano-sized pits were observed after the
immersion test after 24 h. This observation suggested GN treated alloy had significantly increased
corrosion resistance and stability in acidic solution. However, since this alloy contained about 9
wt% of Al, this allows the co-formation of Al-N and Fe-N as the nitrides group in the compound
layer. By contrast, L80 has limited types and amount of alloy elements. Therefore, this strong
inhibition effect reported from Chen et al. might not be observed on GN treated L80. Most
researches were conducted on alloys with various alloying elements. Therefore, the
electrochemical tests should be conducted exclusively on GN treated L80 to predict the corrosion
resistance of it in the simulated environment.
31
2.6.3 The Effect of Cl- on Nitriding Steels
Most of the corrosion tests on nitriding steels were conducted in solutions containing NaCl. Cl-
has very well-known detrimental effects on the penetration and breakdown of passive layer [20].
Therefore, the penetration and segregation of Cl- in the interface between compound layer and
diffusion layer may result in localized corrosion and coating spallation. Fortunately, most of the
literature revealed that GN treated steels have outstanding resistance to the penetration of Cl-. Yeh
et al. [49] conducted series of tests on corrosion behaviors of GN SACM 645 steel at 530°C for
several different nitriding duration. They reported that the corrosion current density of GN treated
SACM 645 for 12 h tested in 3.5 wt% NaCl solution decreased form 1.0×10⁻⁵ A/cm2 to 3.0×10⁻⁷
A/cm2. They explained that the decrease of corrosion current density was because Cl- neither
reacted nor penetrated through the nitride layer to react with substrate. However, it could diffuse
through the opening crack of compound layer to react with the substrate. Therefore, the corrosion
resistances of nitriding steels obtained were determined by the composition and microstructure of
substrates [50]. This finding addressed the importance of the compactness of compound layer since
the fact that the corrosion of substrate L80 is severe in this environment. Therefore, the problem
that I strived to solve was to decrease the surface defects by continuously optimizing the treatment
schedules.
2.6.4 Improvement on Corrosion and Wear Resistance by Other Nitriding Methods
Since GN is difficult to be directly conducted in most institutes due to the large volume of the
equipment, most researches on the corrosion behavior of nitriding material were conducted by
using the most innovative plasma nitriding method. Niu et al. [51] conducted the electrochemical
tests on MG400 steel nitrided by laser 450 plasma nitriding technique in the ground water
simulation solution. The corrosion current density tested in this environment was as low as
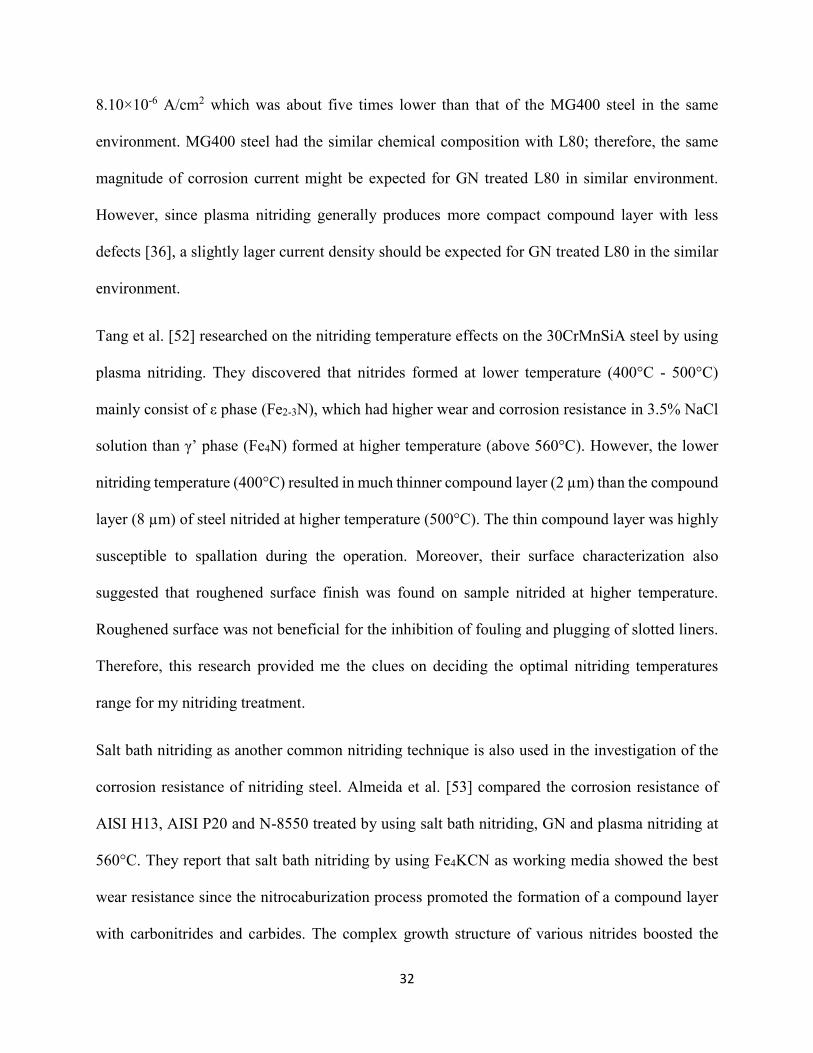
32
8.10×10⁻⁶ A/cm2 which was about five times lower than that of the MG400 steel in the same
environment. MG400 steel had the similar chemical composition with L80; therefore, the same
magnitude of corrosion current might be expected for GN treated L80 in similar environment.
However, since plasma nitriding generally produces more compact compound layer with less
defects [36], a slightly lager current density should be expected for GN treated L80 in the similar
environment.
Tang et al. [52] researched on the nitriding temperature effects on the 30CrMnSiA steel by using
plasma nitriding. They discovered that nitrides formed at lower temperature (400°C - 500°C)
mainly consist of ε phase (Fe2-3N), which had higher wear and corrosion resistance in 3.5% NaCl
solution than γ’ phase (Fe4N) formed at higher temperature (above 560°C). However, the lower
nitriding temperature (400°C) resulted in much thinner compound layer (2 µm) than the compound
layer (8 µm) of steel nitrided at higher temperature (500°C). The thin compound layer was highly
susceptible to spallation during the operation. Moreover, their surface characterization also
suggested that roughened surface finish was found on sample nitrided at higher temperature.
Roughened surface was not beneficial for the inhibition of fouling and plugging of slotted liners.
Therefore, this research provided me the clues on deciding the optimal nitriding temperatures
range for my nitriding treatment.
Salt bath nitriding as another common nitriding technique is also used in the investigation of the
corrosion resistance of nitriding steel. Almeida et al. [53] compared the corrosion resistance of
AISI H13, AISI P20 and N-8550 treated by using salt bath nitriding, GN and plasma nitriding at
560°C. They report that salt bath nitriding by using Fe4KCN as working media showed the best
wear resistance since the nitrocaburization process promoted the formation of a compound layer
with carbonitrides and carbides. The complex growth structure of various nitrides boosted the

33
microhardness of the surface. However, they did not carry out the corrosion tests on the treated
specimens. According to the researches on the corrosion resistance of iron nitride and iron carbide
from Weber et al. [54], they reported that the corrosion resistance of γ’ phase iron nitride was two
times better than the corrosion resistance of iron carbide tested in the same environment since iron
nitrides generally formed a more dense and closed layer. Therefore, the corrosion resistance of salt
bath nitriding steel might be lower than the corrosion resistance of the nitriding steels treated by
other methods.
2.6.5 Wear Resistance of Nitriding Steel
The wear resistance of nitriding steel is a well-studied property since GN treated steels have been
widely applied as heavy duty tooling parts [40]. Wang et al. [44] performed mill tests by using a
MG-200 high speed friction and wear testing machine. They observed that the Cr40 steel after 10
h of GN treatment had higher micro-hardness of the diffusion layers since the nitrides that
precipitated between the grain boundaries distort the lattice to increase the resistance to
deformation. The presence of diffusion layer was important to the slotted liners since the diffusion
layer had much higher hardness compared with the substrate (Figure 2-15). This layer with about
200 µm of thickness retained a high hardness even after the top compound layer was worn off or
chipped off during long time of service. The wear resistance of GN treated steels is not emphasized
in this research, but it is planned in the future work to complete the study of the erosion resistance
of GN treated steel in the simulated environment.
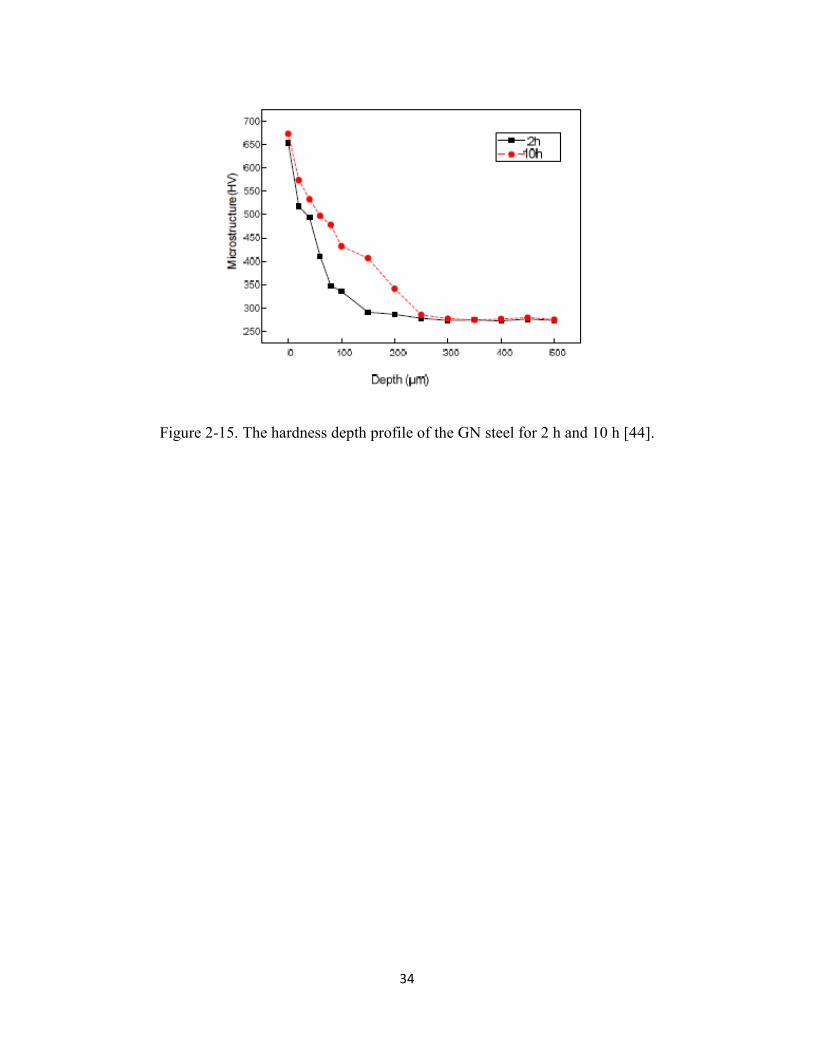
34
Figure 2-15. The hardness depth profile of the GN steel for 2 h and 10 h [44].

35
Chapter 3. Techniques
3.1 Electrochemical Tests
3.1.1 Three-Electrode Cell
Three-electrode cell is one of the most commonly used electrochemical setup for corrosion tests.
The electrode of interest, which is named working electrode (WE), acts as the anode of the reaction.
The potential of WE is measured with respect to the reference electrode (RE), which provides a
constant potential Eref to be compared with the measured potential of WE in different tests. The
RE used in my research is Ag/AgCl in saturated KCl electrode, which has a constant potential of
0.199 V at 298.15 K, because it is thermally stable even when used at a temperature as high as
80°C. A platinum (Pt) plate is used as the counter electrode (CE) which allows the transfer of
current. It functions as a cathode to WE to provide a circuit for current to be measured [55, 56].
Figure 3-1. The Schematic of a three-electrode cell setup.
WE: Specimen
RE: Ag/AgCl CE: Pt plate
Electrolyte
Potential Control
Current Flows

36
3.1.2 Electrochemical Impedance Spectroscopy
3.1.2.1 Bode and Nyquist Plots
Electrochemical impedance spectroscopy (EIS) is a non-destructive test which is used to measure
the resistivity and capacity of specimen by collecting the current response to the alternative current
(AC) potential signal at different applied frequencies. It is a widely used standardized
characterization technique for electrochemical tests. The fluctuations reveal the chemical reactions
undergoing [57]. Impedance (Z) or resistance (R) is the ability of a circuit to resist the flow of
current in response to an AC. The total impedance of the system can be expressed as equation 3-
1, where Zre denotes the real component of the impedance and Zim represents the imaginary part of
the impendence. With the Zre on x-axis and Zim on y-axis, the vector |Z| can be calculated [58].
EIS data may be presented as a Bode plot (Figure 3-2) or a Nyquist plot (Figure 3-3). The Bode
plots examine the dependence of the impedance or phase angle (θ) on the frequency. On the other
hand, the Nyquist plot is a more popular representation of the EIS data. These plots directly
compare the impedance of different tests conducted separately. Both of the plots are used to
interpret the corrosion behavior of the specimens tested in the simulated environment in this
research [58].
|Z| = Zre + Zim (eq. 3-1)

37
Figure 3-2. A typical Impedance Bode plot [58]
Figure 3-3. A typical Nyquist plot [58]

38
3.1.2.2 Equivalent Circuit
Besides the Bode and Nyquist plots, the data of EIS measurement can be interpreted by using
electrical circuit elements called equivalent circuit (EC) modeling [59]. Most of the circuit
elements in the model are common electrical elements such as resistors, capacitors, and inductors
(Table 3-1).
Table 3-1. The common electrical elements for EC model [59].
Component Current vs. Potential Impedance
Resistor E= IR Z = R
Inductor E = L di/dt Z = jωL
Capacitor I = C dE/dt Z = 1/jωC
Z, impedance (R), is the resistance of current. The total impedance of the system is the sum of R
and capacitance (C, farads), shown by eq. 3-2.
Z(𝜔) = 𝑅 +1
𝑗𝜔𝐶 (eq. 3-2 )
The time constant τ, in s, calculated by multiplying the impedance of resistor and capacitor (eq. 3-
3 ), measures the accumulation of charge at the interface,
τ = 𝑅𝐶 (eq. 3-3)
Two EC models were applied in this research. Randles cell is for the EIS data of L80 tested in the
simulated environment. The schematic of equivalent circuit (Figure 3-4) consists of three parts: a

39
resistor Rs, which stands for the resistance to current flow in solution, and a resistor Rp, which
stands for the resistance of the surface to solution interface; and the capacitance Cdl, or the charge
storage capacity, of the surface.
Figure 3-4. The schematic diagram of a simplified Randles cell [59].
The other model used is a commonly accepted model for a porous coating on an active metal
(Figure 3-5). The capacitance of the coating, repressed by Cc, is usually smaller than the double
layer capacitance (Cdl). The pore resistance (Rpo) is the resistance of ionic conduction passing the
pores of the coating, and the Rct represents the resistance of the coating [59-61].
Figure 3-5. The schematic diagram of a coating system [59].
3.1.3 Polarization Curves
3.1.3.1 Potentiodynamic Polarization
The potentiodynamic polarization curve is one of the most commonly used methods to examine
the corrosion behavior of a system by plotting potential (E) versus log current (I). This technique
records the change of current with respect to the potential versus the reference electrode applied.

40
Free corrosion potential (Ecorr) and free corrosion current (Icorr) are obtained by the Tafel
extrapolation within ±25 mV versus reference electrode of anodic polarization curve and cathodic
polarization curve (Figure 3-6) [62]. Most active alloys, like the carbon steel, exhibit dynamic
dissolution in some environments by showing a continuous increase of current with respect to the
increase of potential, but some materials may have a passive region, shown in Figure 3-7, the
inhibition effect within a range of potential applied is shown by a small and stable current
generation [62]. A good coating should have a small Icorr and more positive Ecorr in a test
environment. The presence or formation of passive zone is also essential for a coating system.
Figure 3-6. The Tafel extrapolation to estimate the Icorr and Ecorr of the potentiodynamic
polarization curves [62].

41
Figure 3-7. A standard potentiodynamic anodic polarization plot of 430 SS [63].
3.1.3.2 Corrosion Rate
The potentiodynamic polarization test measures the corrosion rate, usually expressed in
mm/year. The Icorr can be calculated by equation 3-4 [63],
𝐼𝑐𝑜𝑟𝑟 =𝛽𝐴𝛽𝐶
2.3(𝛽𝐴+𝛽𝐶)
∆𝑖
∆𝐸 (eq. 3-4)
∆𝑖
∆𝐸= reciprocal of the slope of the linear polarization,
βA, βC = anodic and cathodic Tafel constants,
Icorr = corrosion current density in µA/cm2.
Then, the corrosion rate can be calculated by using equation 3-15 [63],
𝐶𝑜𝑟𝑟𝑜𝑠𝑖𝑜𝑛 𝑅𝑎𝑡𝑒 (𝑚𝑚/𝑦𝑒𝑎𝑟) =3.27×10⁻³𝐼𝑐𝑜𝑟𝑟(𝐸.𝑊.)
𝑑 (eq. 3-5)
E.W. = equivalent weight of the working electrode (g),
d = density of the corroding species (g/cm2),

42
Icorr= corrosion current density (µA/cm2).
This calculated corrosion rate can predict the real corrosion rate of the material in its operating
environment.
3.1.4 Potentiostatic Polarization
The potentiostatic polarization test collects the current generated with respect to the time at a
constantly applied potential to observe the electrochemical performance of a system [63]. The
fluctuation and tendency of current density indicate the stability of the tested specimen within a
period of time. A good coating should maintain a small current generation with small fluctuation
within a long time period. This technique was used to determine the electrochemical behavior of
the specimen in simulated environment in this research.
3.2 Surface Characterization
3.2.1 Microscopy
Digital microscopes (DM) and scanning electron microscope (SEM) were two microscopies
employed to provide highly magnified images of the specimen for the surface microstructure and
morphology analysis in this research. Optical microscope magnifies the image of small sample by
using visible light and a series of lenses (Figure 3-8). Digital microscope, which is the combination
of an optical microscope and a camera, allows the capture and measurement of images with
magnifications up to 1000X [64]. This technique is perfect to measure the thickness of the
compound layer but the surface morphology is analyzed by using SEM. SEM uses an electron
beam to excite the surface of sample to emit electrons and photons, which are collected by the
secondary electron or backscatter detectors (Figure 3-9). Secondary electron detector was used in
this research since this detector provides nm-scale resolution images, which facilitated the
morphology analysis of my specimens [65].
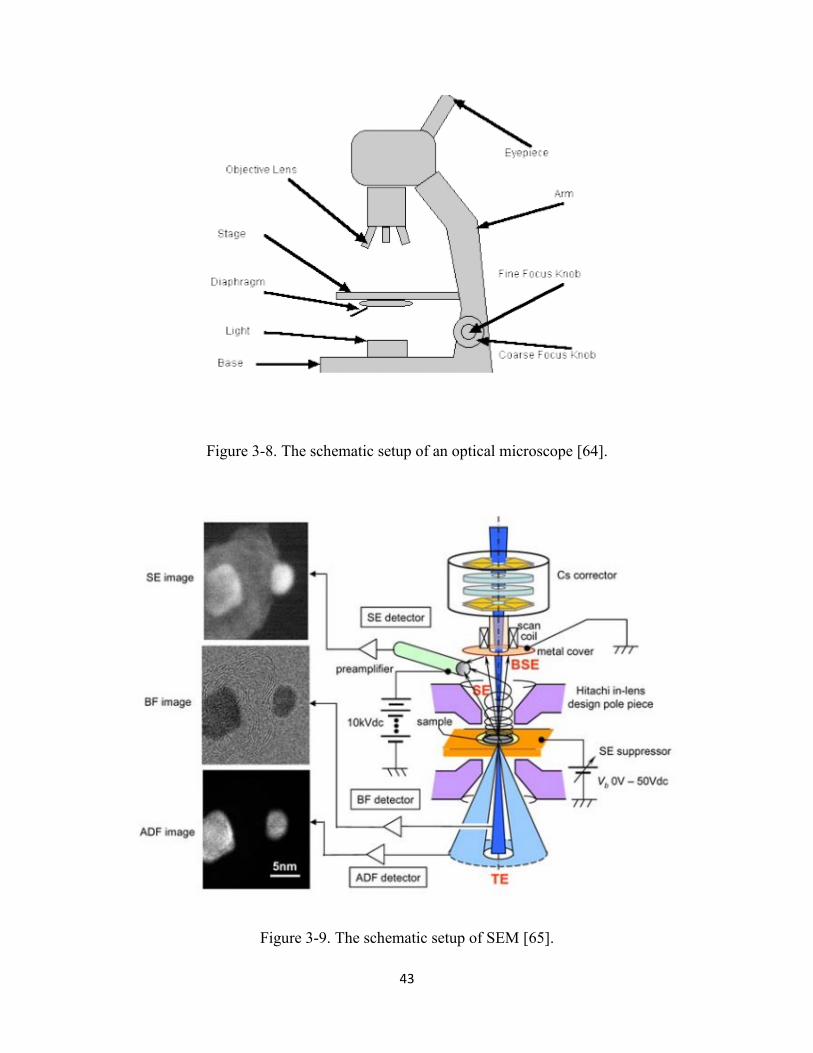
43
Figure 3-8. The schematic setup of an optical microscope [64].
Figure 3-9. The schematic setup of SEM [65].
44
3.2.2 Energy-Dispersive X-ray Spectroscopy
Energy-Dispersive x-ray spectroscopy is a detector that can be coupled with SEM to identify the
compositional distribution and elementary abundance of the sample. This detector captures the
energy released by filling the inner shell electrons to the vacancies left by the excitement of outer
shell electrons. This technique produces EDX spectrum with intensity peaks of different elements
[66]. The EDX spectrum and composition calculation were used to determine the compositions of
the nitriding specimens before and after the immersion tests in this research.
3.2.3 X-ray Diffraction
Compared with EDX, X-ray diffraction (XRD) provides a more precise compositional analysis of
the compound. X-rays are emitted by the bombardment of metal target on the sample. The incident
beam ionizes the electrons from the outer most shell and the detector captures signal to identify
the “foot print”, lattice spacing d, of each material by using Bragg Equation (eq. 3-4) [67].
nλ = 2dsinθ (eq. 3-4)
n = positive order integer,
λ = wavelength of incident wave, nm,
d = lattice spacing, nm,
θ = incident angle, °,
Each compound has it unique and identical diffraction pattern, which can be used to determine the
composition of a complex material. Both bulk and thin-film XRD modes were used to reveal the
compositions of substrate and coating layer in this research.

45
Chapter 4.The Optimization of Gas Nitriding Schedule
The nitriding schedules for L80 carbon steel were optimized in this chapter in order to obtain a
GN treated L80 specimen with the best corrosion resistance in the simulated environment. The
optimization of nitriding process is a tedious process since the formation of nitrides layer depends
on various factors, such as the sample pretreatment, the composition of substrate, nitriding duration,
nitriding temperature, ammonia flowrate, gas pressure etc. The nitriding schedule should always
be modified based on the properties of the material treated to fulfill different application purposes.
In this research, three factors, nitriding duration, temperature and ammonia flowrate were selected
to optimize the nitriding schedule to produce a highly corrosion resistant nitrides layer on L80
substrate. The morphologies of nitrides layers and the corrosion resistances of specimens treated
with different schedules will be compared and studied in this chapter.
4.1 Experimental Procedure
4.1.1 Gas Nitriding of L80
4.1.1.1 Sample Preparation
L80 (Table 4-1) specimens were cut from as-received plate with 1.00 cm × 1.00 cm × 0.15 cm
dimensions. A square surface was polished with 240, 400, 600, 800 and 1200 grid LECO silicon
carbide sand papers, respectively. Then, the samples were further polished by using LECO polish
cloth with 1.0 µm Buehler alumina micropolish powder (standard polishing procedure). The
polished L80 specimens were preserved in acetone to prevent corrosion and the formation of an
oxides layer. The polished samples were rinsed with acetone, ethanol and deionized water for 5
min in ultrasound water bath respectively (standard rinsing procedure). The rinsed samples were
dried by pressurized air flow at room temperature and kept dry in sample bag before the gas
nitriding process. All the chemicals used in this process were analytical grade reagents.

46
Table 4-1. The chemical compositions of L80 [68].
C Mn Cr Ni Cu S Si Fe
Max 0.430 1.900 - 0.250 0.030 0.030 0.450 Balanced
4.1.1.2 Gas Nitriding
Firstly, water was used to clean and dry both inside and outside of the quartz tube and its cap
especially the parts around the opening. The specimens were placed inside an alumina tray inside
the quartz tube as near as possible to the center. No more than eight specimens were placed in the
tube each time since overlay of samples was not allowed. The polished surfaces of specimens were
placed upward to ensure the largest contact volume with gaseous phase. After the specimens had
been properly placed in the tube, the quartz cap was sealed tightly. The tube was placed in the
Thermolyne 79300 tube furnace (Figure 4-1) by lifting its front latch. The center of the tube was
placed right below the temperature sensor for temperature accuracy. The sealing of cap and
connections must be double checked since the cap and connections might loosen during the
movement of tube. The furnace latch was closed. The furnace and gas washing bottle were placed
inside the fumehood. All the pipes were connected as shown in Figure 2-7.

47
Figure 4-1. Thermolyne 79300 tube furnace [69].
When the tube was sealed and the furnace was closed, set the flowrate of nitrogen gas (99.9999%
purity, Praxair) to 1000 mL/min at a pressure of 20 psi. A small amount of soapy water was sprayed
onto all the connection parts. If bubbles were observed, the leak source were tighten or sealed and
the leak test was carried again until no leak source was detected. The nitrogen gas flow was set
for more than 10 minutes before introducing the ammonia gas. The controller of the furnace was
programed for the heating process. Before shutting down the nitrogen gas flow, the anhydrous
ammonia (99.995% purity, Praxair) was introduced to the quartz tube at the designed flowrate with
a pressure of 20 psi.
When the furnace cooled below 120°C, nitrogen gas (99.9999% purity, Praxair) was introduced at
a flowrate of 1000 mL/min and 20 psi pressure into the quartz tube for 10 min. The ammonia gas
supply was shut down after introducing nitrogen gas. When the furnace cooled to room

48
temperature, the latch of the furnace could be opened and the quartz tube was taken out. Nitrided
samples were removed carefully form the tube.
4.1.1.3 Sample Post-Treatment
A group of nitrided specimens was used for the electrochemical tests. The back side of the nitriding
surface was welded with 1/24’ 062-60/40 Canada Metal soldering wire by using Weller WLC
100TM soldering station. The sealing agent used was the West System epoxy resin 205TM. All the
sides were sealed with epoxy resin except a nitriding surface with an average exposure area of 0.85
cm2. Before each electrochemical experiment, sealed specimens were rinsed following the
standard rinsing procedure. The other group of nitrided specimens were directly sealed inside the
epoxy resin without the welding procedure. A 1.00 cm × 0.15 cm surface (cross-section) area was
polished by the standard polishing procedure. The polished cross-section after the standard rinsing
procedure was etched with Nital solution (5 wt% nitric acid in ethanol) for 15 s. After the etching,
the etched cross-section was rinsed by deionized water and air dried for observation by using DM.
The L80 without nitriding treatments was directly welded with wire, polished with standard
polishing procedure, sealed with epoxy, rinsed by standard procedure and dried for the
electrochemical tests.
4.1.2 Solution Preparation
The composition of standard simulated solution used in this research was listed in Table 4-2. All
the chemicals used were reagent grade. If not specially stated, all the tests used this standard
solution for the simulated solution.

49
Table 4-2. The composition of standard simulated solution.
NaCl (g) NaHCO3 (g) Deionized water (L)
58.44 0.84 1.00
4.1.3 Electrochemical Tests
The electrochemical tests used the three-electrode cell shown in figure 4-2. The WE was the GN
treated L80, the RE was the Accun.et® Cat.313-6 Ag/AgCl in saturated KCl solution, and the CE
was a Pt plate. N2 was pumped into the container with 200 mL simulated solution with a flow rate
of 500 mL/min at an inlet pressure of 20 psi for the deaeration of the solution for 15 min. After the
deaeration, CO2 was pumped into the simulated solution at 20 mL/min and 20 psi before the test
for at least 30 min to ensure the saturation of CO2. All three electrodes connected to the
electrochemical workstation Gamry reference 3000TM potentiostat well. The specimen, rinsed by
standard rinsing procedure and air dried right before each test, was immersed into the solution 30
min before the EIS for stabilization. EIS measurements were performed at the free corrosion
potential with a 10 mV amplitude signal and a range of applied frequencies from 100 kHz to 0.01
Hz. The initial delay for the open circuit potential measurement was set to be 30 min.
Potentiodynamic polarization is a surface destructive measurement; therefore, it was applied after
EIS measurement by sweeping the potential with a constant rate of 1 mV/s from -800 mV vs.
Ag/AgCl to 1500 mV/s vs. Ag/AgCl or ceased when the current generated was larger than 30mA.
The test data were collected by using Gamry Instruments Framework 5.58a and analyzed by using
Gamry Echem Analyst 5.58. At least five times of electrochemical tests were carried out for each
nitriding schedule to ensure the reliability of the data.

50
Figure 4-2. The schematic of three-electrode cell for specimens immersed in standard simulated
solution with saturated CO2 at 20°C, 1 atm.
4.1.4 Surface Characterization
The sealed and etched cross-section of GN treated L80 was observed by using Keyence VH-Z100R
DM. The images of cross-section at magnifications of 400X and 1000X were taken for the
comparison of the thickness of compound and diffusional layers. The tested specimens were rinsed
by the standard rinsing process before and after the electrochemical tests.
4.2 Optimization of Nitriding Duration
Nitriding duration can influence the formation of nitrides layer and the electrochemical properties
of the nitriding specimen. The optimization of nitriding duration selected three time durations, 8
h, 12 h, and 16 h, based on the literature and my preliminary optimization process (Table 4-3) [36,
44, 45]. A group of eight samples were GN treated with either schedule. Each schedule was
performed at least three times. A schedule with optimized nitriding duration which produces the
most corrosion resistant nitrides layer were selected and studied in this section.
Electrochemical Workstation
CO2 inlet CO
2 outlet
WE: Specimen
RE: Ag/AgCl CE: Pt plate
Simulated solution
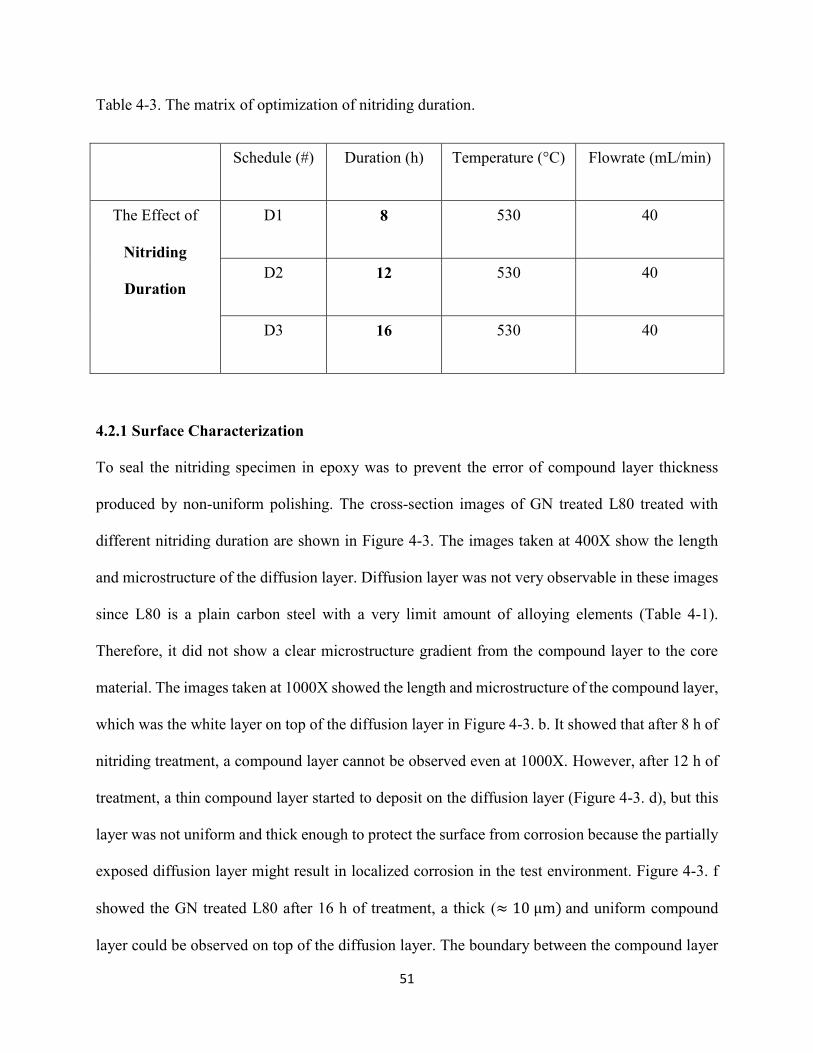
51
Table 4-3. The matrix of optimization of nitriding duration.
Schedule (#) Duration (h) Temperature (°C) Flowrate (mL/min)
The Effect of
Nitriding
Duration
D1 8 530 40
D2 12 530 40
D3 16 530 40
4.2.1 Surface Characterization
To seal the nitriding specimen in epoxy was to prevent the error of compound layer thickness
produced by non-uniform polishing. The cross-section images of GN treated L80 treated with
different nitriding duration are shown in Figure 4-3. The images taken at 400X show the length
and microstructure of the diffusion layer. Diffusion layer was not very observable in these images
since L80 is a plain carbon steel with a very limit amount of alloying elements (Table 4-1).
Therefore, it did not show a clear microstructure gradient from the compound layer to the core
material. The images taken at 1000X showed the length and microstructure of the compound layer,
which was the white layer on top of the diffusion layer in Figure 4-3. b. It showed that after 8 h of
nitriding treatment, a compound layer cannot be observed even at 1000X. However, after 12 h of
treatment, a thin compound layer started to deposit on the diffusion layer (Figure 4-3. d), but this
layer was not uniform and thick enough to protect the surface from corrosion because the partially
exposed diffusion layer might result in localized corrosion in the test environment. Figure 4-3. f
showed the GN treated L80 after 16 h of treatment, a thick (≈ 10 μm) and uniform compound
layer could be observed on top of the diffusion layer. The boundary between the compound layer

52
and diffusion layer was very distinct. It indicated the purity of the compound layer should be higher
than that of the specimens treated by the previous two schedules. These results suggested that with
the increase of GN duration, the thickness of compound layer increased. Generally, the higher the
thickness of the coating, the better the corrosion resistance of it since the coating created a thick
boundary, which made it difficult or took longer time to be penetrated by the aggressive species.
However, the corrosion resistance of a coating is not solely based on the thickness. The
compactness is also a vital factor, which was tested by the electrochemical tests in the next section.
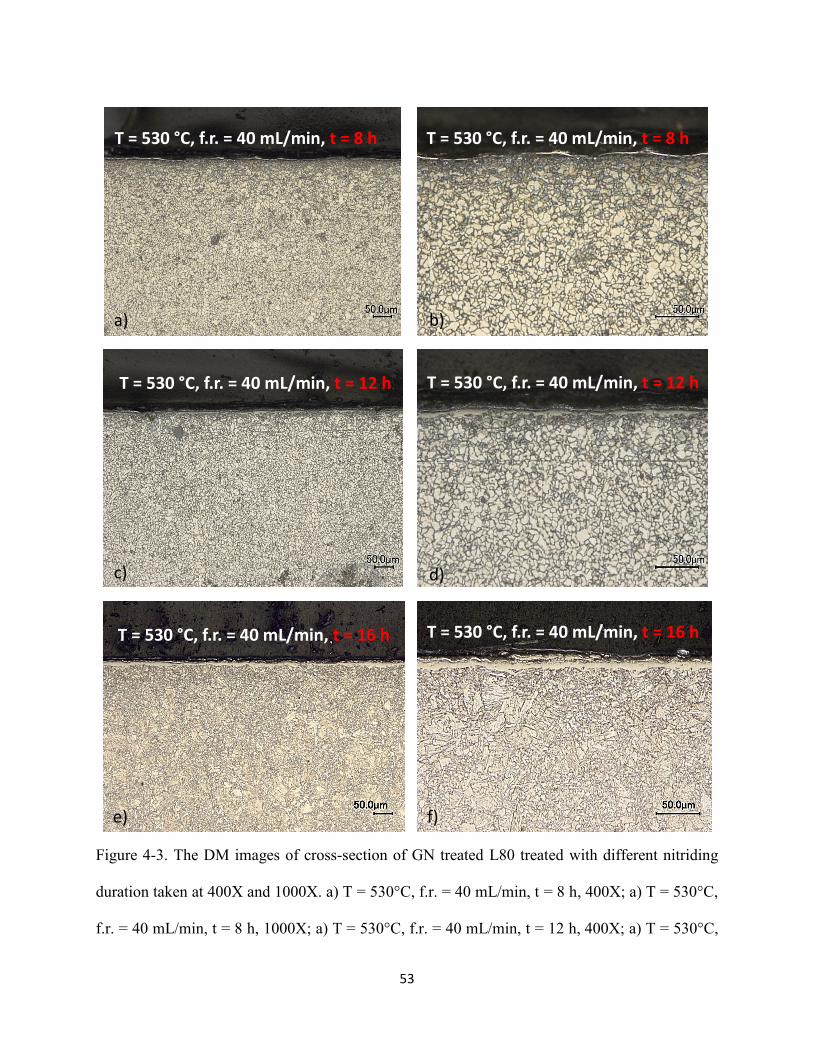
53
Figure 4-3. The DM images of cross-section of GN treated L80 treated with different nitriding
duration taken at 400X and 1000X. a) T = 530°C, f.r. = 40 mL/min, t = 8 h, 400X; a) T = 530°C,
f.r. = 40 mL/min, t = 8 h, 1000X; a) T = 530°C, f.r. = 40 mL/min, t = 12 h, 400X; a) T = 530°C,
T = 530 °C, f.r. = 40 mL/min, t = 8 h T = 530 °C, f.r. = 40 mL/min, t = 8 h
a) b)
T = 530 °C, f.r. = 40 mL/min, t = 16 h
T = 530 °C, f.r. = 40 mL/min, t = 12 h T = 530 °C, f.r. = 40 mL/min, t = 12 h
T = 530 °C, f.r. = 40 mL/min, t = 16 h
c) d)
e) f)
54
f.r. = 40 mL/min, t = 12 h, 1000X; a) T = 530°C, f.r. = 40 mL/min, t = 16 h, 400X; a) T = 530°C,
f.r. = 40 mL/min, t = 16 h, 1000X.
4.2.2 Electrochemical Tests
The potentiodynamic polarization curves of specimens treated with different nitriding schedule
and L80 without GN treatment tested in the simulation environment are shown in Figure 4-4. The
most representative curves of each schedule were selected to be shown in this figure. L80 in this
environment showed an active dissolution behavior in which the increase of current density with
the increase of potential applied was large, and 30 mA/cm2 of current density was achieved before
the penitential reached 0 V vs. Ag/AgCl. It indicated that L80 had very poor corrosion resistance
in this environment since the corrosion products formed in this near neutral but slightly acidic (pH
= 5.78) environment was non-protective [70]. Therefore, the corrosion rate of L80, calculated by
using eq. 3-5, was as large as 0.222 mm/year. By contrast, the GN treated L80 specimens with
either schedule had passivation zones, where the increase of current densities with an increase of
potential within a range was not apparent. Although the corrosion current of L80 after 8 h of
treatment was similar to that of L80 without nitriding treatment, the formation of nitrides on the
surface enhanced the corrosion resistance of L80 due to the presence of a passivation zone since
the iron nitrides had a much higher corrosion potential [45]. Therefore, the corrosion occurred
preferentially at the boundary of the surface inclusions or partially exposed core material [50]. The
surface pits formed during nitriding had a better anchoring effect for the deposition of corrosion
products than a uniformly corroded surface [46]. Therefore, passivation effects could be observed
for GN treated specimens with thin and non-uniform compound layers. After 12 h of treatment,
with the increase of compactness and amounts of surface nitrides, the corrosion potential of
specimens treated after longer duration increased from -0.68 V vs. Ag/AgCl to -0.58 V vs.
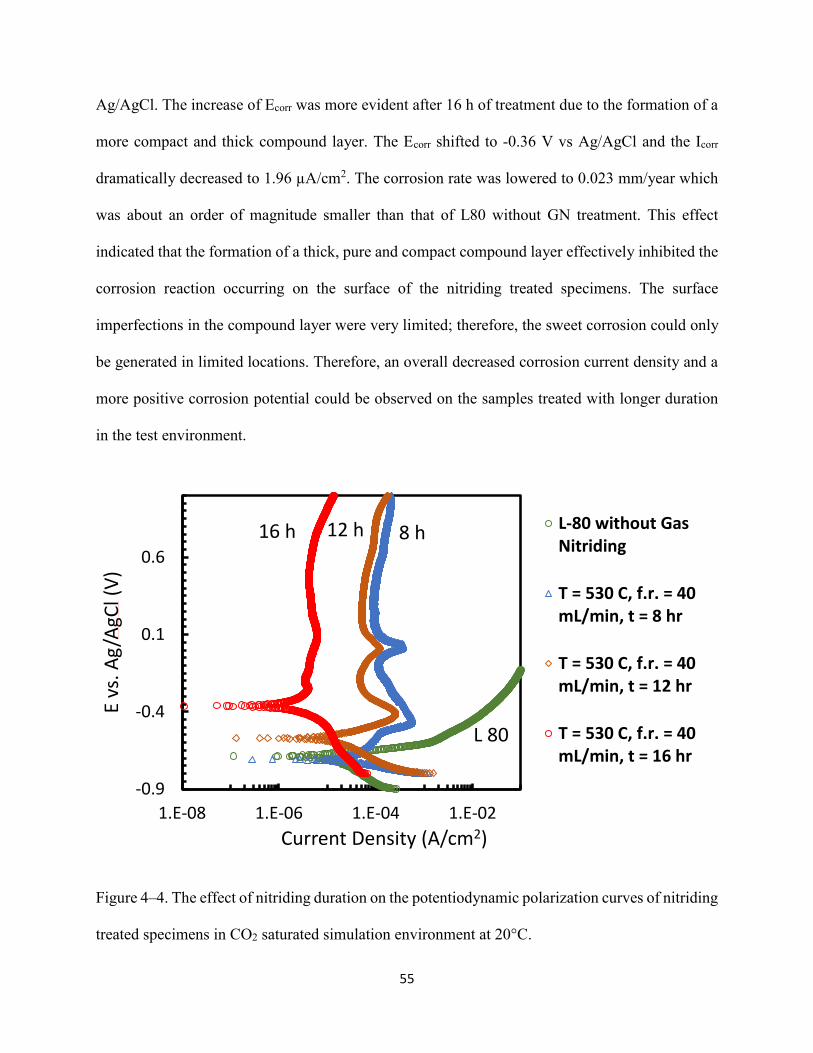
55
Ag/AgCl. The increase of Ecorr was more evident after 16 h of treatment due to the formation of a
more compact and thick compound layer. The Ecorr shifted to -0.36 V vs Ag/AgCl and the Icorr
dramatically decreased to 1.96 µA/cm2. The corrosion rate was lowered to 0.023 mm/year which
was about an order of magnitude smaller than that of L80 without GN treatment. This effect
indicated that the formation of a thick, pure and compact compound layer effectively inhibited the
corrosion reaction occurring on the surface of the nitriding treated specimens. The surface
imperfections in the compound layer were very limited; therefore, the sweet corrosion could only
be generated in limited locations. Therefore, an overall decreased corrosion current density and a
more positive corrosion potential could be observed on the samples treated with longer duration
in the test environment.
Figure 4–4. The effect of nitriding duration on the potentiodynamic polarization curves of nitriding
treated specimens in CO2 saturated simulation environment at 20°C.
-0.9
-0.4
0.1
0.6
1.E-08 1.E-06 1.E-04 1.E-02
E vs
. Ag
/AgC
l(V
)
Current Density (A/cm2)
L-80 without GasNitriding
T = 530 C, f.r. = 40mL/min, t = 8 hr
T = 530 C, f.r. = 40mL/min, t = 12 hr
T = 530 C, f.r. = 40mL/min, t = 16 hr
8 h16 h
L 80
12 h
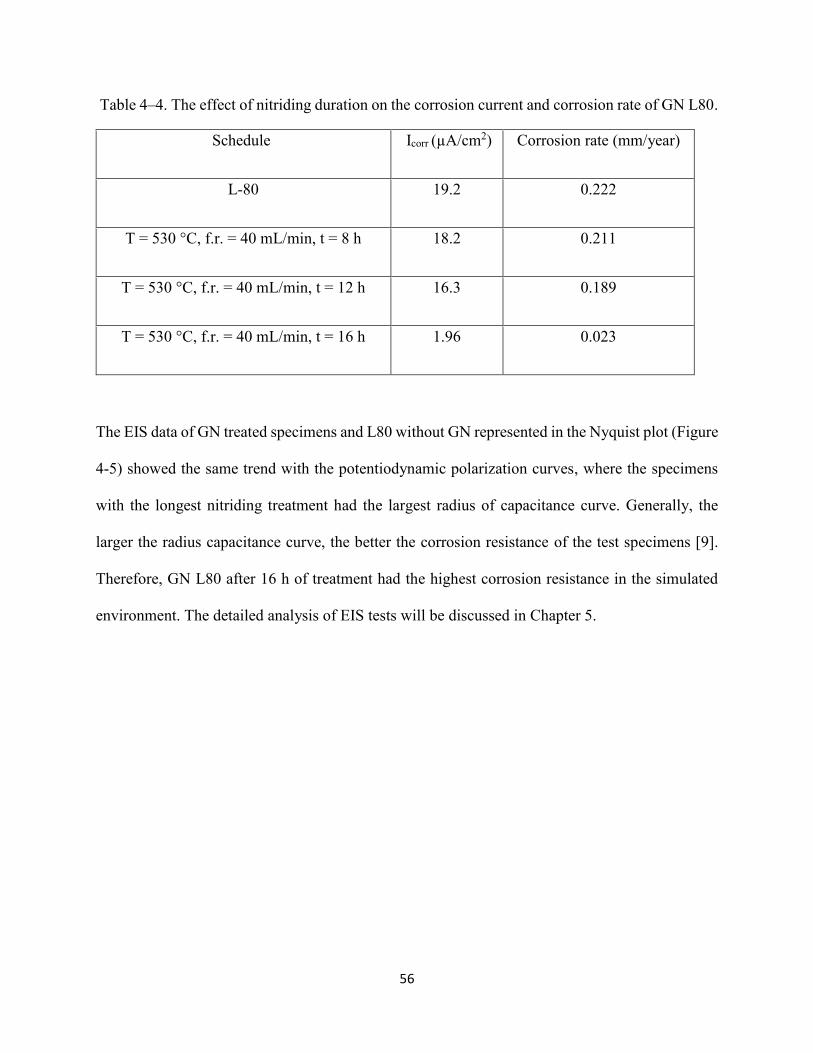
56
Table 4–4. The effect of nitriding duration on the corrosion current and corrosion rate of GN L80.
The EIS data of GN treated specimens and L80 without GN represented in the Nyquist plot (Figure
4-5) showed the same trend with the potentiodynamic polarization curves, where the specimens
with the longest nitriding treatment had the largest radius of capacitance curve. Generally, the
larger the radius capacitance curve, the better the corrosion resistance of the test specimens [9].
Therefore, GN L80 after 16 h of treatment had the highest corrosion resistance in the simulated
environment. The detailed analysis of EIS tests will be discussed in Chapter 5.
Schedule Icorr (µA/cm2) Corrosion rate (mm/year)
L-80 19.2 0.222
T = 530 °C, f.r. = 40 mL/min, t = 8 h 18.2 0.211
T = 530 °C, f.r. = 40 mL/min, t = 12 h 16.3 0.189
T = 530 °C, f.r. = 40 mL/min, t = 16 h 1.96 0.023

57
Figure 4-5. The effect of nitriding duration on the EIS (Nyquist plot) of nitriding treated specimens
in the CO2 saturated simulated environment at 20°C
4.2.3 The Effect of Nitriding Duration on the Industrial Application for Slotted Liners
The results of the optimization of nitriding duration revealed a simple relationship that the longer
the nitriding time, the better the corrosion resistance. However, it did not indicate that a “perfect”
corrosion free coating for the steel would be produced after an infinite long time of treatment. The
deposition rate of compound layer slows down after a long term treatment since the diffusion of
liberated nitrogen into the compound layer becomes more difficult when the compactness of the
compound layer was higher [36]. Moreover, the inclusions such as Fe3C, intrinsically present at
the surface, always interrupted the formation of nitrides and the compactness. The purity of the
iron nitrides will not achieve the perfect state. Therefore, after long term of treatment, usually
0
10
20
30
40
50
0 10 20 30 40 50
Z im
ag (k
oh
m·c
m2)
Zreal (kohm·cm2)
L-80 without GasNitrding
T = 530 C, f.r. = 40mL/min, t = 8 hr
T = 530 C, f.r. = 40mL/min, t = 12 hr
T = 530 C, f.r. = 40mL/min, t = 16 hr
0
1
2
3
4
0 1 2 3 4
Z im
ag (k
oh
m·c
m2)
Zreal (kohm·cm2)

58
longer than 96 h [36], the specimen may reach a “saturation state”, which the growth of compound
layer is too slow for industrial-scale production. However, the corrosion resistance of the saturated
nitriding steel is not necessarily larger than the corrosion resistance of “non-saturated” nitriding
steel. Furthermore, due to the special geometry requirements of slotted liners, the thickness of the
coating should be thin as the purpose of corrosion protection is fulfilled. A thicker coating
decreases the screening efficiency of the slotted liners, and most importantly, it requires extra
revision of the existing design and production, which may not be acceptable for the sponsors of
the project.
4.2.4 Conclusions
The effect of nitriding duration on the corrosion resistance of GN treated L80 in the simulated
environment was examined in section 4.2. Based on the etched cross-sectional images taken by
using DM, longer nitriding duration could produce a thicker and more uniform compound layer
on the L80 specimen. The potentiodynamic polarization curves suggested that the corrosion
potential of GN treated L80 with optimized duration shifted to the most positive region and the
corrosion current density of GN treated L80 with optimized duration dramatically decreased
compared to those of L80 without nitriding treatment. The corrosion rate of specimen with the
optimized nitriding duration lowered the corrosion rate in the simulated environment about one
order of magnitude because the compound layer was sufficiently pure and compact to prevent the
corrosion occurring in the weak spots such as inclusions and cracks. GN treatment with either
duration produced passivation zones that showed in the potentiodynamic polarization curves,
which indicated that GN produces surface nitrides with better anchoring effect of the corrosion
products. The corrosion products deposited in a protective manner significantly inhibited the
corrosion reactions. The EIS data also suggested that the specimen with the longest treatment

59
showed the best corrosion resistance because of the largest radius of capacitance curve obtained
in this measurement. The results of optimization of GN duration suggested that specimen with 16
h of treatment had much higher corrosion resistance than the specimens treated with 12 h or 8 h.
However, a “saturated” nitriding steel is not cost-effective because it takes longer time to produce
and the corrosion resistance is not necessarily higher than “non-saturated” nitriding steel. An
extremely thick coating is also not acceptable for slotted liners.
4.3 The Optimization of Nitriding Temperature
Nitriding temperature is the main factor to influence the composition of compound layer and the
growth rate of compound layer [36]. The optimization of nitriding temperature selected three
temperature, 520°C, 530°C and 540°C based on the literature and my preliminary optimization
process (Table 4-5) [36, 44]. A group of eight samples were GN treated with either schedule. Each
schedule was performed at least three times. In this optimization process, a schedule with
optimized nitriding temperature at specified flowrate, which produced the most corrosion resistant
nitrides layer, was selected and studied.
Table 4-5. The matrix of optimization of nitriding temperature.
Schedule (#) Duration (h) Temperature (°C) Flowrate
(mL/min)
The Effect of
Nitriding
Temperature
T1 16 520 40
T2 16 530 40
T3 16 540 40

60
4.3.1 Surface Characterization
The cross-section images of GN treated L80 with different nitriding temperatures are shown in
Figure 4-6. The images taken at 400X show the length and microstructure of the diffusion layer
and the images taken at 1000X show the length and microstructure of compound layer. Figure 4-
6. b shows that at a treatment of 520°C, a uniform but thin compound layer could be observed on
top of the diffusion layer. The compound layer tended to become thicker and more uniform by
treatment at 530°C (Figure 4-6. d). However, the increase of temperature did not guarantee the
increase of compound layer. The compound layer formed at 540°C was not uniform and the
thickness could not be measured. These results indicated there was an optimal nitriding
temperature at a certain flow rate which resulted in the optimal dissociation rate of the ammonia
gas. The optimal dissociation rate enabled the uniform and effective deposition of the compound
layer. Lower temperature resulted in low deposition rate; thus, a thin compound layer was
produced with limited resistance to the penetration of aggressive species. By contrast, high
temperature enabled the rapid dissociation of ammonia gas, which resulted in the non-uniform and
cluster growth mechanisms [36]. The discontinuous and porous formation of the compound layer
was not expected to have improved resistance in the simulated environment.

61
Figure 4-6. The DM images of cross-section of GN treated L80 treated with different nitriding
temperature taken at 400X and 1000X. a) T = 520°C, f.r. = 40 mL/min, t = 16 h, 400X; a) T =
520°C, f.r. = 40 mL/min, t = 16 h, 1000X; a) T = 530°C, f.r. = 40 mL/min, t = 16 h, 400X; a) T =
T = 520 °C, f.r. = 40 mL/min, t = 16 h
T = 520 °C, f.r. = 40 mL/min, t = 16 h
T = 530 °C, f.r. = 40 mL/min, t = 16 h T = 530 °C, f.r. = 40 mL/min, t = 16 h
T = 540 °C, f.r. = 40 mL/min, t = 16 h T = 540 °C, f.r. = 40 mL/min, t = 16 h
a) b)
c) d)
e) f)

62
530°C, f.r. = 40 mL/min, t = 16 h, 1000X; a) T = 540°C, f.r. = 40 mL/min, t = 16 h, 400X; a) T =
540°C, f.r. = 40 mL/min, t = 16 h, 1000X.
4.3.2 Electrochemical Tests
The effect of nitriding temperature on the potentiodynamic polarization curves of nitriding treated
L80 specimens in the simulated environment is shown in Figure 4-7. The curves of specimens
treated at 520°C and 540°C showed very similar patterns because the nitrides layers formed at both
treatment were either too thin or too porous to prevent the penetration of corrosive species in the
simulated solution. Although the deposition of corrosion products enhanced the corrosion
resistance of the treated specimens, indicated by the presence of passivation zones, the corrosion
rates and corrosion potentials measured from the specimens treated with non-optimal temperatures
were of the same order of magnitude, which was around 0.200 mm/year (Table 4-6) and -0.68 V
vs. Ag/AgCl, of L80 without treatment. By contrast, the specimen treated at 530°C showed
superior corrosion resistance due to the formation of a thick, uniform, compact and pure compound
layer. These results indicated that at a specified flow rate, there was an optimal temperature to
allow the effective formation of corrosion resistant compound layer.

63
Figure 4-7. The effect of nitriding temperature on the potentiodynamic polarization curves of
nitriding treated L80 specimens in CO2 saturated simulated environment at 20°C.
Table 4-6. The effect of nitriding temperature on the corrosion current and corrosion rate of GN
L80.
Schedule Icorr (µA/cm2) Corrosion rate (mm/year)
L-80 19.2 0.222
T = 520 °C, f.r. = 40 mL/min, t =16 h 16.8 0.194
T = 530 °C, f.r. = 40 mL/min, t = 16 h 1.96 0.023
T = 540 °C, f.r. = 40 mL/min, t = 16 h 17.8 0.206
-0.9
-0.7
-0.5
-0.3
-0.1
0.1
0.3
1.E-08 1.E-06 1.E-04 1.E-02
E vs
. Ag
/AgC
l(V
)
Current Density (A/cm2)
L-80 without GasNitriding
T = 520 C, f.r. = 40mL/min, t = 16 hr
T = 530 C, f.r. = 40mL/min, t = 16 hr
T = 540 C, f.r. = 40mL/min, t = 16 hr
L80
540◦C 520◦C
530◦C

64
The EIS data of GN treated specimens and L80 without GN represented in Nyquist plot (Figure 4-
8) showed the same trend with the potentiodynamic polarization curves, where the specimens
treated at the optimal temperature at this flow rate had the largest radius of capacitance curve.
Therefore, GN treated L80 at 530°C at a flow rate of 40 mL/min had the highest corrosion
resistance in the simulated environment.
Figure 4-8. The effect of nitriding temperature on the EIS (Nyquist plot) test of nitriding treated
specimens in CO2 saturated simulated solution at 20°C.
4.3.3 The Sensitivity of Nitriding Temperature
The sensitivity of the treatment temperature range seems to be an issue for industrial application
since the lab data showed such short temperature range which resulted in significantly different
corrosion resistances. Some people may question that the high sensitivity of the narrow
temperature range may not be applicable to the industrial-scale production. However, the
0
5
10
15
20
25
30
35
40
45
50
0 5 10 15 20 25 30 35 40 45 50
Z im
ag (k
oh
m·c
m2)
Zreal (kohm·cm2)
L-80 without Gas Nitriding
T = 520 C, f.r. = 40 mL/min, t = 16 hr
T = 530 C, f.r. = 40 mL/min, t = 16 hr
T = 540 C, f.r. = 40 mL/min, t = 16 hr
0
1
2
3
4
0 1 2 3 4
Z im
ag (k
oh
m·c
m2)
Zreal (kohm·cm2)

65
sensitivity of the temperature range is actually not an issue because the geometry of the lab
apparatus exaggerated the effect of temperature changes on the overall dissociation rate of
ammonia gas. The heating zone of gas chamber of this nitriding treatment was less than 300 mL
with a point thermal detector. Unlike the industrial-scale pot furnace (Figure 2-9), the lab-scale
furnace did not have an air circulating system which facilitates the uniform distribution of
temperature and gaseous phase. Therefore, in such a confined and static space with a slow flow
rate, the subtle change of temperature had considerable effects on the dissociation rate of the
system. The industrial-scale production may yield a result that specimens treated at both 520°C
and 540°C are measured with higher corrosion resistances than the lab data, but the discussion of
optimal nitriding temperature is still valid but with a wider temperature range. The industrial-scale
nitriding temperature is around 500°C - 580°C [36]. However, based on the composition and
different application purposes of nitriding steels, the industrial applied nitriding temperature range
is usually narrowed down to less than 30°C at a reasonable gas flow rate [36].
4.3.4 Conclusions
The effect of GN temperature on the corrosion resistance of GN treated L80 in the simulated
environment was examined in section 4.3. Based on the etched cross-section images taken by using
DM, only the treatment at the optimal nitriding temperature produced a thick and uniform
compound layer. The potentiodynamic polarization curves suggested that the corrosion potential
of the specimen treated at the optimal temperature shifted to the more positive region and the
corrosion current density was about one order of magnitude smaller than the corrosion current
density of L80 without treatment. The treatments done at non-optimal temperatures showed similar
corrosion current densities with L80 without treatment because the thin and porous compound
layers were not protective in the simulated environment. The EIS data also suggested that the
66
specimen treated at the optimal temperature showed the best corrosion resistance because of the
largest radius of capacitance curve obtained in this measurement. The results of optimization of
GN temperature suggested that specimen treated at 530°C at 40 mL/min had the best corrosion
resistance in the simulated environment than the specimens treated at 520°C and 540°C. The high
sensitivity of temperature range is not an issue in the industrial-scale application because the
geometry and setup of lab-scale nitriding apparatus exaggerated the effect of temperature changes
on the properties of nitriding steels. The optimization of nitriding temperature was still valid but
with a wider temperature range for the industrial application.
4.4 The Optimization of Ammonia Flow rate
Ammonia gas flow rate is the trickiest parameter among all the three parameters. Nitriding duration
and temperature are intrinsic properties, which are not varied with the size of apparatus. However,
the ammonia gas flow rate is an extrinsic parameter, which must be altered based on the geometry
and volume of the heating chamber. Generally, researchers do not mention the flow rate of their
experiments since the flow rate they used only worked for their specific setup, which cannot be
directly referenced in my research. Therefore, the selection of flow rate for optimization of
schedules was based on my own preliminary optimization processes. The optimization of ammonia
flow rate selected three flow rate, 35 mL/min, 40 mL/min and 45 mL/min (Table 4-7). A group of
eight samples were GN treated with either schedule. Each schedule was performed at least three
times. A schedule with specific ammonia flow rate at the optimized temperature, which produces
the most corrosion resistant nitrides layer, was selected and studied in this section.

67
Table 4-7. The matrix of optimization of ammonia flowrate.
Schedule (#) Duration (h) Temperature (°C) Flowrate (mL/min)
The Effect
of
Ammonia
Flowrate
F1 16 530 35
F2 16 530 40
F3 16 530 45
4.4.1 Surface Characterization
The cross-section images of GN treated L80 with different ammonia flow rates are shown in Figure
4-9. The images taken at 400X show the length and microstructure of diffusion layer and the
images taken at 1000X show the length and microstructure of compound layer. Figure 4-9. a and
b show the cross-section images of specimen treated at 35 mL/min of ammonia flowrate. A thick
but non-uniform compound layer could be observed on the top of the diffusion layer. The boundary
between the compound layer and diffusion layer was vague, which indicated that the large
dissociate rate produced higher amount of liberated nitrogen atoms, which were forced to be
rapidly diffused into the matrix at higher partial pressure [36]. However, this rapid diffusion was
not favorable for the formation of compact compound layer but a layer with a considerable amount
of un-reacted iron. The specimen treated at 45 mL/min of flow rate .Figure 4-9. e and f showed a
compound layer with similar thickness compared with other specimens treated at different flow
rates. However, due to the low dissociation rate, the density of compound layer was lower since
the amount of liberated nitrogen that entered the compound layer was limited [36]. Therefore, the
diffusion was not effective and a porous structure with micro-cracks was produced. These results
suggested that at a certain nitriding temperature, there was an optimal ammonia flow rate to allow

68
the effective growth of a compact compound layer. The thickness of the compound layer was not
determined by the flow rate of ammonia gas since the diffusion of nitrogen was a temperature and
time determined variable. However, the flow rate had strong effects on the compactness of the
compound layer, which was examined by electrochemical tests.
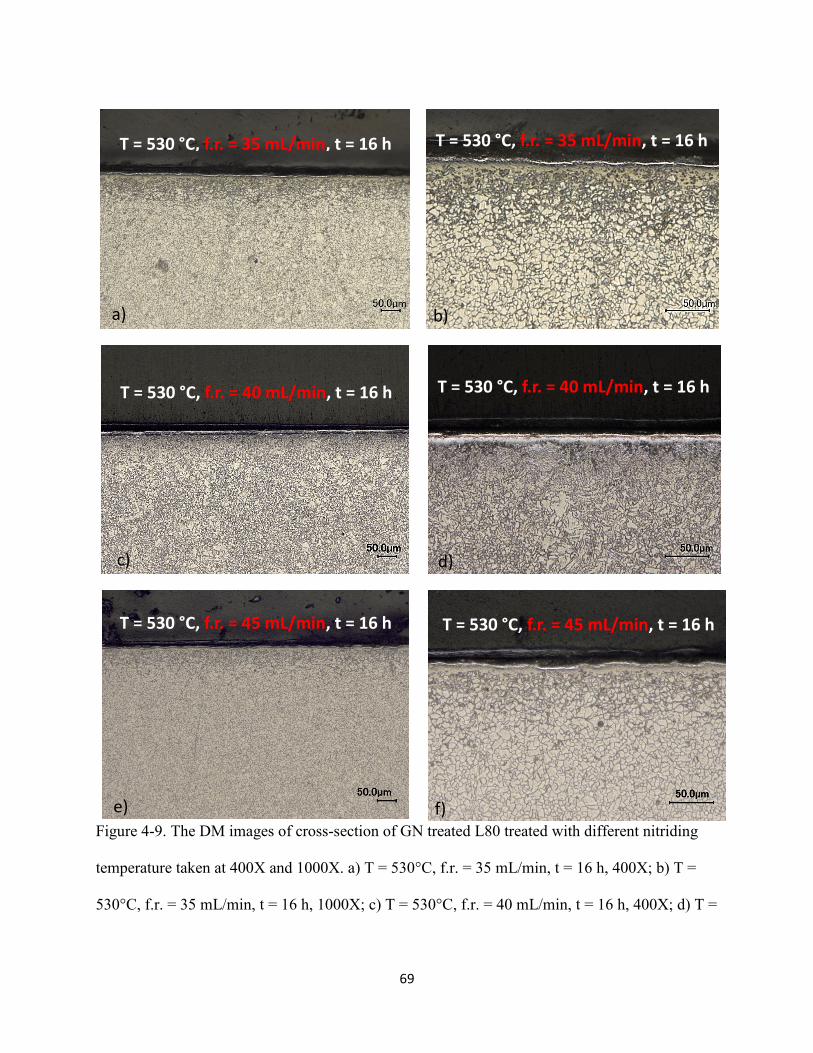
69
Figure 4-9. The DM images of cross-section of GN treated L80 treated with different nitriding
temperature taken at 400X and 1000X. a) T = 530°C, f.r. = 35 mL/min, t = 16 h, 400X; b) T =
530°C, f.r. = 35 mL/min, t = 16 h, 1000X; c) T = 530°C, f.r. = 40 mL/min, t = 16 h, 400X; d) T =
T = 530 °C, f.r. = 35 mL/min, t = 16 h T = 530 °C, f.r. = 35 mL/min, t = 16 h
T = 530 °C, f.r. = 40 mL/min, t = 16 h T = 530 °C, f.r. = 40 mL/min, t = 16 h
T = 530 °C, f.r. = 45 mL/min, t = 16 h T = 530 °C, f.r. = 45 mL/min, t = 16 h
a) b)
c) d)
e) f)

70
530°C, f.r. = 40 mL/min, t = 16 h, 1000X; e) T = 530°C, f.r. = 45 mL/min, t = 16 h, 400X; f) T =
530°C, f.r. = 45 mL/min, t = 16 h, 1000X
4.4.2 Electrochemical Tests
The effect of ammonia flow rate on the potentiodynamic polarization curves of GN treated L80
specimens in the simulated environment is shown in Figure 4-10. The curve of specimens treated
with 35mL/min of flow rate did not show decreases of the current generated or the shift of
corrosion potential. The passivation zone of specimen treated with this schedule was not stable as
those treated with other flow rates since the large amount of non-reacted iron remaining in the
compound layer still participated in the corrosion reaction. Therefore, a large free corrosion current
was detected. This morphology also enhanced the occurrence of localized corrosion and a high
corrosion rate would be expected. By contrast, even though the compound layer formed at 45
mL/min of flow rate was not compact, most micro-cracks might not penetrate the layer and the
sufficiently small crack size prevented the occurrence of localized corrosion. Therefore, the overall
corrosion resistance of this specimen increased and the corrosion rate decreased to 0.165 mm/year
(Table 4-8). The specimen treated with 40 mL/min of ammonia flowrate showed the best corrosion
resistance due to the formation of a thick, uniform and compact compound layer. These results
indicated that at a specific temperature, there was an optimal ammonia flowrate to allow the
effective formation of a corrosion resistant compound layer.

71
Figure 4-10. The effect of ammonia flowrate on the potentiodynamic polarization curves of
nitriding treated L80 specimens in CO2 saturated simulated environment at 20°C.
Table 4-8.The effect of ammonia flowrate on the corrosion current and corrosion rate of GN
L80.
-0.9
-0.7
-0.5
-0.3
-0.1
0.1
1.E-08 1.E-06 1.E-04 1.E-02
V v
s. A
g/A
gCl (
V)
Current Density (A/cm2)
L-80 without GasNitriding
T = 530 C, f.r. = 35mL/min, t = 16 hr
T = 530 C, f.r. = 40mL/min, t = 16 hr
T = 530 C, f.r. = 45mL/min, t = 16 hr
Schedule Icorr (µA/cm2) Corrosion rate (mm/year)
L-80 19.2 0.222
T = 530 °C, f.r. = 35 mL/min, t = 16 hr 14.3 0.235
T = 530 °C, f.r. = 40 mL/min, t = 16 hr 1.96 0.023
T = 530 °C, f.r. = 45 mL/min, t = 16 hr 20.3 0.165
L80
35 mL/min
40 mL/min
45 mL/min
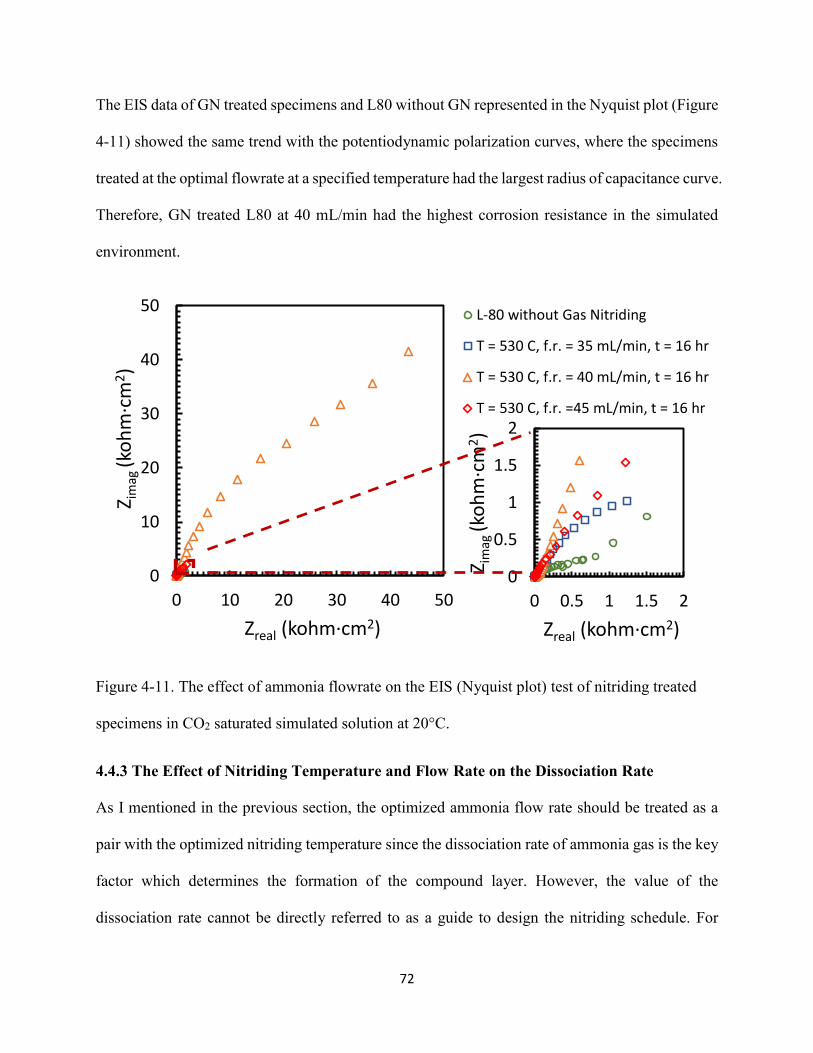
72
The EIS data of GN treated specimens and L80 without GN represented in the Nyquist plot (Figure
4-11) showed the same trend with the potentiodynamic polarization curves, where the specimens
treated at the optimal flowrate at a specified temperature had the largest radius of capacitance curve.
Therefore, GN treated L80 at 40 mL/min had the highest corrosion resistance in the simulated
environment.
Figure 4-11. The effect of ammonia flowrate on the EIS (Nyquist plot) test of nitriding treated
specimens in CO2 saturated simulated solution at 20°C.
4.4.3 The Effect of Nitriding Temperature and Flow Rate on the Dissociation Rate
As I mentioned in the previous section, the optimized ammonia flow rate should be treated as a
pair with the optimized nitriding temperature since the dissociation rate of ammonia gas is the key
factor which determines the formation of the compound layer. However, the value of the
dissociation rate cannot be directly referred to as a guide to design the nitriding schedule. For
0
10
20
30
40
50
0 10 20 30 40 50
Z im
ag (k
oh
m·c
m2)
Zreal (kohm·cm2)
L-80 without Gas Nitriding
T = 530 C, f.r. = 35 mL/min, t = 16 hr
T = 530 C, f.r. = 40 mL/min, t = 16 hr
T = 530 C, f.r. =45 mL/min, t = 16 hr
0
0.5
1
1.5
2
0 0.5 1 1.5 2
Z im
ag (k
oh
m·c
m2)
Zreal (kohm·cm2)
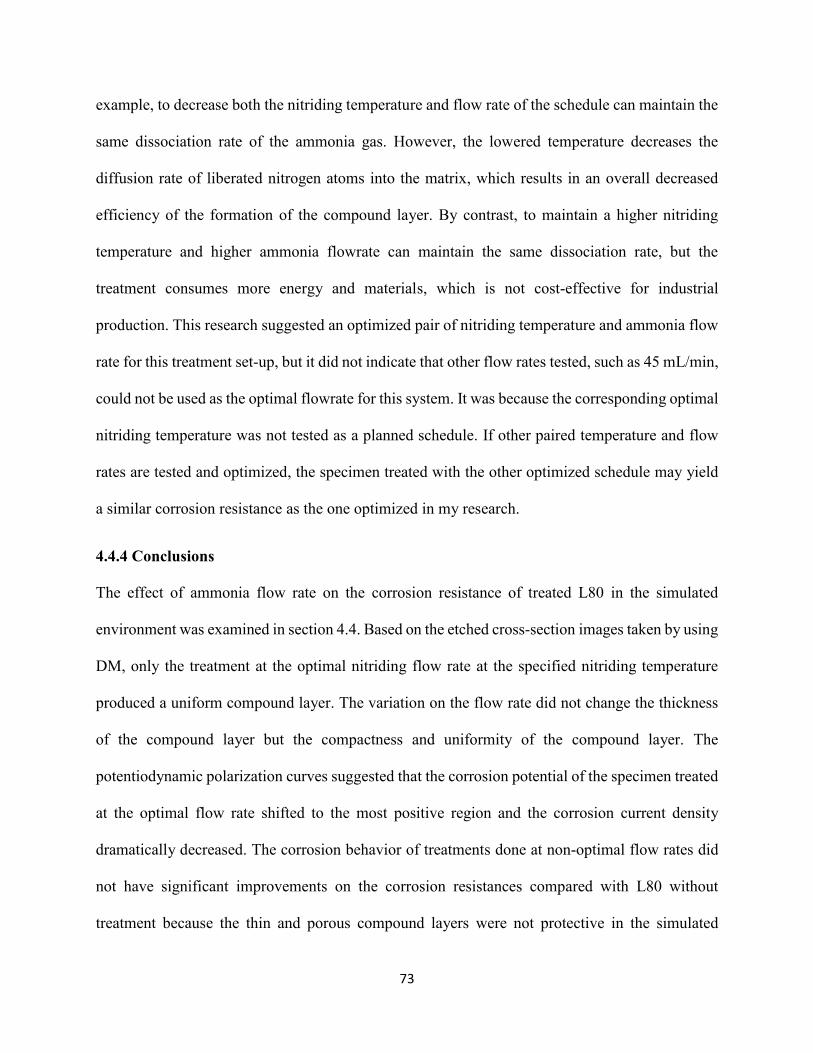
73
example, to decrease both the nitriding temperature and flow rate of the schedule can maintain the
same dissociation rate of the ammonia gas. However, the lowered temperature decreases the
diffusion rate of liberated nitrogen atoms into the matrix, which results in an overall decreased
efficiency of the formation of the compound layer. By contrast, to maintain a higher nitriding
temperature and higher ammonia flowrate can maintain the same dissociation rate, but the
treatment consumes more energy and materials, which is not cost-effective for industrial
production. This research suggested an optimized pair of nitriding temperature and ammonia flow
rate for this treatment set-up, but it did not indicate that other flow rates tested, such as 45 mL/min,
could not be used as the optimal flowrate for this system. It was because the corresponding optimal
nitriding temperature was not tested as a planned schedule. If other paired temperature and flow
rates are tested and optimized, the specimen treated with the other optimized schedule may yield
a similar corrosion resistance as the one optimized in my research.
4.4.4 Conclusions
The effect of ammonia flow rate on the corrosion resistance of treated L80 in the simulated
environment was examined in section 4.4. Based on the etched cross-section images taken by using
DM, only the treatment at the optimal nitriding flow rate at the specified nitriding temperature
produced a uniform compound layer. The variation on the flow rate did not change the thickness
of the compound layer but the compactness and uniformity of the compound layer. The
potentiodynamic polarization curves suggested that the corrosion potential of the specimen treated
at the optimal flow rate shifted to the most positive region and the corrosion current density
dramatically decreased. The corrosion behavior of treatments done at non-optimal flow rates did
not have significant improvements on the corrosion resistances compared with L80 without
treatment because the thin and porous compound layers were not protective in the simulated

74
environment. The EIS data also suggested that the specimen treated at the optimal flow rate showed
the best corrosion resistance because of the largest radius of capacitance curve obtained in this
measurement. The results of optimization of GN flow rate suggested that specimen treated with
40 mL/min of flowrate at 530°C had the best corrosion resistance in the simulated environment
than the specimens treated at 35 mL/min and 45 mL/min. The optimized flow rate should be paired
with the corresponding temperature. Specimens treated with other optimized flow rate and
temperature combinations might also yield similar corrosion resistances in the simulated
environment once the dissociation rate is maintained. However, the dissociation rate cannot be
directly referred to as a design parameter because of the non-optimal diffusion efficiency or cost-
effectiveness.
4.5 Conclusions of Chapter 4
The nitriding schedules for L80 carbon steel were optimized in this chapter in order to obtain a
GN treated L80 with the best corrosion resistance. Three parameters, nitriding duration,
temperature and ammonia flow rate were optimized to produce a highly corrosion resistant nitrides
layer on an L80 substrate. The optimization of nitriding duration suggested that a longer treatment
produced a compound layer with thicker and more compact structure, which generally had better
corrosion resistance. The nitriding temperature influenced the effectiveness of the growth of the
compound layer. The optimized temperature showed a narrow range for the lab-scale treatment,
but the optimization was valid with a wider range for industrial-scale production. The nitriding
flow rate did not affect the thickness but the compactness of the compound layer. The optimized
temperature and flow rate were treated as a pair for an optimized dissociation rate. However, the
dissociation rate cannot be directly referred to as a design parameter due to the effectiveness and
for economic reasons. GN treated L80 with either schedule showed improved corrosion resistance

75
by the presence of passivation zones in potentiodynamic polarization tests. The optimized schedule
was a treatment at 40 mL/min at 530°C for 16 h. The corrosion current density decreased to 1.96
µA/cm2 and the corrosion potential shifted to -0.38 mV v. Ag/AgCl. The corrosion rate of a
specimen treated with the optimized schedule decreased to 0.023 mm/year, which was about one
order of magnitude smaller than the corrosion rate of L80 in the same environment. Therefore, the
optimized nitriding schedule significantly increased the corrosion resistance of L80 in the
simulated environment.

76
Chapter 5. The Corrosion Behavior of Gas Nitriding Steel
In this chapter, the corrosion behavior of GN treated L80 is investigated by comparing with the
corrosion behavior of L80 without treatment and alloy 800, which is a nickel-based alloy used in
oil industrial for various purposes, such as the material for steam exchanger and casting liners and
tubing for HPHT well [71, 72]. Alloy 800 has outstanding corrosion resistance in various aqueous
media at high temperature due to the presence of chromium (19 - 23 wt%). The iron (39.5 min
wt%) provides high corrosion resistance to the internal oxidation and the nickel (30 - 35 wt%)
maintains the ductility and machinability of the structure [73]. Alloy 800, as a corrosion resistant
alloy (CRA), might be one of the most suitable candidates for the manufactures of slotted liners.
However, the high fabrication cost of this alloy limits its prevalence for large-scale application
[72]. Therefore, this chapter will compare the corrosion resistances and behaviors of L80, GN
treated L80 and Alloy 800 to discuss whether GN treated L80 is suitable as a corrosion resistant
material for the slotted liners in the simulated environment.
5.1 Experimental Procedure
The experiments conducted in these chapter followed the same experimental procedures
mentioned in Chapter 4. The sample treatment on alloy 800 was the same with that of L80 without
nitriding treatment. For the electrochemical tests, Alloy 800 and L80 were treated with an
additional process: after the specimen was placed in the deaerated simulated solution, a constant
cathodic potential, −1V vs. Ag/AgCl, was applied for 15 min to reduce the oxide film formed on
the specimen surface due to contact with humid air.

77
5.2 Electrochemical Tests
5.2.1 Potentiodynamic Polarization Curves
Figure 5-1 shows the potentiodynamic polarization curves tested for L80, GN treated L80 and
alloy 800. L80 tested in this simulated environment showed an active dissolution corrosion
behavior where the current density generated increased significantly with an increase of potential.
By contrast, both GN treated L80 and alloy 800 showed passivation effects in the same test
environment and the corrosion current densities generated by both materials were about one
magnitude smaller than that of L80 without treatment (Figure 5-1, Table 5-1). However, the
corrosion potential of alloy 800 was -0.60 V vs. Ag/AgCl, which was more negative than the
corrosion potential of GN treated L80, which was -0.38 V vs. Ag/AgCl. Moreover, the passivation
zone of alloy 800, from -0.45 V vs. Ag/AgCl to 0.74 V vs. Ag/AgCl was smaller and more negative
than the passivation zone of GN treated L80, which was from -0.28 V vs. Ag/AgCl to 1.22 V vs.
Ag/AgCl. Most importantly, alloy 800 showed a metastable pitting zone by fluctuating current
densities from 0.2 V vs. Ag/AgCl to 0.6 vs. Ag/AgCl. This zone suggested that alloy 800 was more
susceptible to attack by the aggressive species such as Cl- in the solution [74]. When the applied
potential was higher than 0.6 V vs. Ag/AgCl, the specimen subjected to rapid breakdown of passive
films and large current generation. By contrast, GN treated L80 had a stable passivation zone
without any sign of attack from corrosive species. Most importantly, the current density generated
at high potential of 1.22 V vs. Ag/AgCl was even smaller than the free corrosion current density
generated on L80 in the same environment. These tests suggested that GN treated L80 was more
suitable as the material than alloy 800 for slotted liners in the simulated environment due to the
more positive corrosion potential and the presence of a wider and more stable passivation zone.

78
Figure 5-1. The potentiodynamic polarization curves of GN treated L80, alloy 800 and L80 in
the same simulated solution with saturated CO2 at 20°C.
Table 5-1. The comparison of corrosion current density and corrosion rate of L80, GN treated
L80 and alloy 800 in the same simulated environment.
Icorr (µA/cm2)
Corrosion rate
(mm/year)
L80 19.2 0.222
GN treated L80 1.96 0.023
Alloy 800 1.68 0.019
-1.0
-0.8
-0.6
-0.4
-0.2
0.0
0.2
0.4
0.6
0.8
1.0
1.2
1.4
1.E-09 1.E-07 1.E-05 1.E-03 1.E-01
E vs
. Ag
/AgC
l (V
)
Current Density (A/cm2)
L80
GN L80
Alloy 800Alloy 800
GN L80
L80

79
5.2.2 EIS Tests
The Nyquist plot in Figure 5-2 showed that both GN treated L80 and alloy 800 had much larger
radiuses of capacitance curves than that of L80. The similar radiuses suggested that these two
materials had similar corrosion resistances in the same simulated environment, but the shapes
provided the clues for the equivalent circuit modeling. The shapes suggested double-layer
prototype for these two materials. The detailed analysis of corrosion behavior of these three
materials will be discussed in section 5.2.3. The other presentation of EIS data in a phase Bode
plot are shown in Figure 5-3. Both of the GN treated L80 and alloy 800 had larger phase angles,
which were closed to -75°, in the low frequency zone. Both of them were much larger than the
phase angle of L80, which was - 48°. The larger phase angles of GN treated L80 and alloy 800
indicated that both materials were good capacitors with high corrosion resistance.
Figure 5-2. The Nyquist plot of different materials tested in the same environment.
0
5
10
15
20
25
30
35
40
45
50
55
60
0 5 10 15 20 25 30 35 40 45 50 55 60
Z im
ag (k
oh
m·c
m2)
Zreal (kohm·cm2)
L80
GN L80
Alloy 800
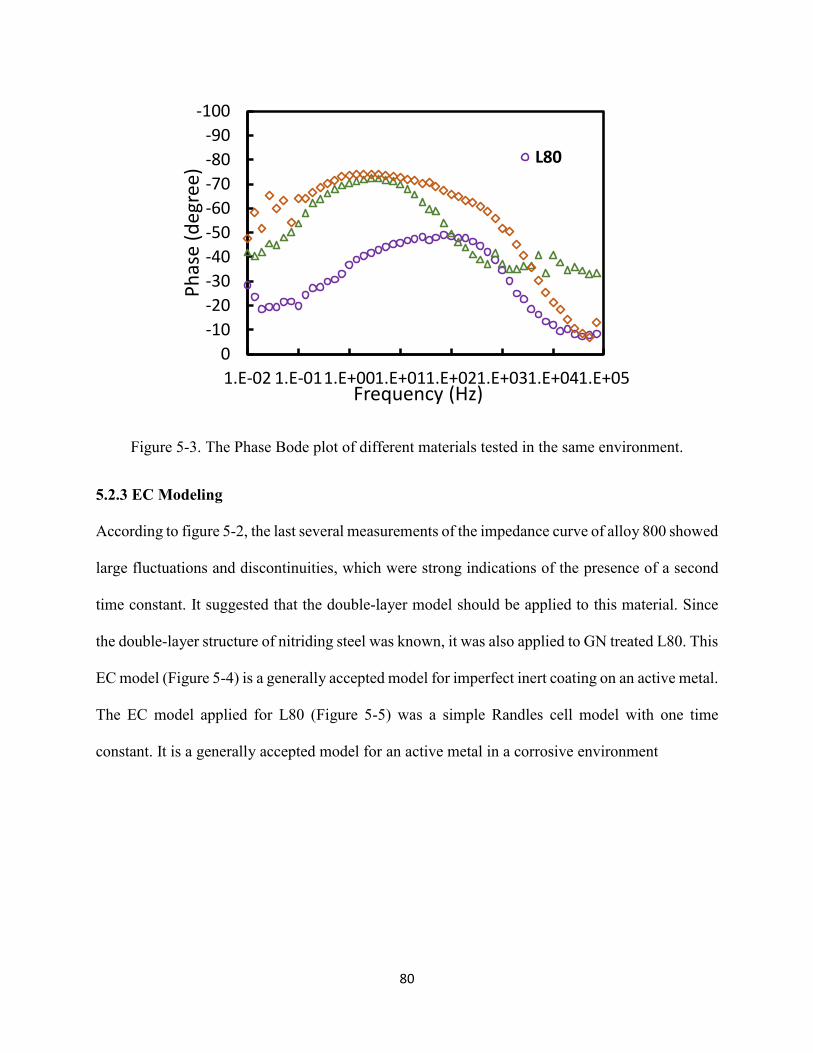
80
Figure 5-3. The Phase Bode plot of different materials tested in the same environment.
5.2.3 EC Modeling
According to figure 5-2, the last several measurements of the impedance curve of alloy 800 showed
large fluctuations and discontinuities, which were strong indications of the presence of a second
time constant. It suggested that the double-layer model should be applied to this material. Since
the double-layer structure of nitriding steel was known, it was also applied to GN treated L80. This
EC model (Figure 5-4) is a generally accepted model for imperfect inert coating on an active metal.
The EC model applied for L80 (Figure 5-5) was a simple Randles cell model with one time
constant. It is a generally accepted model for an active metal in a corrosive environment
-100
-90
-80
-70
-60
-50
-40
-30
-20
-10
0
1.E-02 1.E-011.E+001.E+011.E+021.E+031.E+041.E+05
Ph
ase
(deg
ree)
Frequency (Hz)
L80

81
Figure 5-4. The EC fitting for the EIS data of GN treated L80 and alloy 800 tested in the simulated
environment.
Figure 5-5. The EC fitting for the EIS data of L80 tested in the simulated environment.
Table 5-2 and 5-3 list the EC fitting results of GN treated L80, alloy 800 and L80 tested in the
same simulated environment with different models applied. Qc measures the degree of coating
degradation [75], where the larger the number, the more severe the coating degradation. The Qc of
the gas nitriding treated L80, 2.06×10⁻⁵ S-sn was slightly smaller but within the same magnitude
of the Qc of the alloy 800, 4.8×10⁻⁵ S-sn. Both Qc of these two materials were significantly smaller
than that of L80. These results suggested both materials had excellent resistance to the degradation
of surface structure.
Rpf is a corresponding resistance with increasing water absorption or permeability. The larger this
value, the higher the resistance of the coating to the ionic species [76]. Alloy 800 had much larger
Rpf, 5.02×10⁵ Ω·cm2, than that of GN treated L80, 2.12×10² Ω·cm2. These results suggested that
the coating to substrate interface of GN treated L80 was the weak part. If the aggressive species in
the solution broke through the coating via the cracks and voids, the corrosion was likely to occur
Rs
Qc
Rpf
Qdl
Rct
Rs
Qc
Rct

82
in the interface and directly attack the iron in diffusion layer [76]. Therefore, a highly compact
passivation layer was essential for the maintenance of corrosion resistance. However, the corrosion
occurring in the interface might not always be detrimental based on the different deposition manner
of corrosion products. If the deposition of corrosion products was compact, the corrosion reaction
might be inhibited instead.
Qdl is a strong indicator of the coating adhesion loss [75, 76]. The smaller this number, the better
the coating adhesion. GN treated L80 had much smaller Qdl, 9.93×10⁻⁶ S-sn, than that of alloy 800,
4.35×10⁻³ S-sn. These data were valid since the “coating” on alloy 800 was actually a passive film
formed in this solution. This film was always subjected to dynamic formation and breakdown due
to the preferential depletion of nickel and dehydration of the outer passive film by CO32- [77]. This
material is very sensitive to the disturbance due to turbulence in the real operation environment
since once the repassivation of the passive film is interrupted, the breakdown of the passive film
is rapid and irreversible.
Rct represents the resistance to the charge transfer between the coating and solution interface [75].
This parameter is inversely proportional to the corrosion rate. The Rct of alloy 800, 5.474 Ω·cm2
was much smaller than the Rct of GN treated L80, 3.96×10⁵ Ω·cm2. These results indicated that
the coating material itself had extremely high corrosion resistance because iron nitride was
chemically stable in this environment. Therefore, very limited corrosion occurred at this interface.
By contrast, alloy 800 did not have a stable passivation layer in this environment. The most
dynamic reactions occurred on the outer shell of the passive film [77]. Therefore, for GN treated
L80, the corrosion occurred between this interface dominated the corrosion rate calculated for the
whole specimen in the test environment.
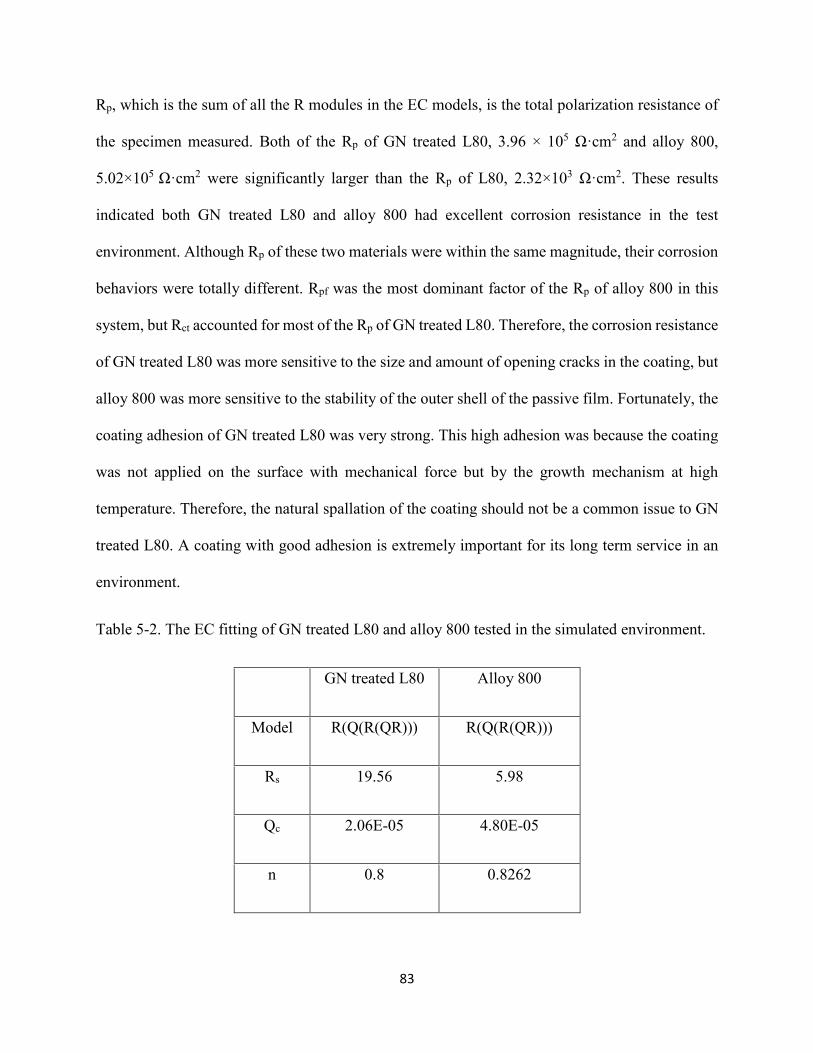
83
Rp, which is the sum of all the R modules in the EC models, is the total polarization resistance of
the specimen measured. Both of the Rp of GN treated L80, 3.96 × 10⁵ Ω·cm2 and alloy 800,
5.02×10⁵ Ω·cm2 were significantly larger than the Rp of L80, 2.32×10³ Ω·cm2. These results
indicated both GN treated L80 and alloy 800 had excellent corrosion resistance in the test
environment. Although Rp of these two materials were within the same magnitude, their corrosion
behaviors were totally different. Rpf was the most dominant factor of the Rp of alloy 800 in this
system, but Rct accounted for most of the Rp of GN treated L80. Therefore, the corrosion resistance
of GN treated L80 was more sensitive to the size and amount of opening cracks in the coating, but
alloy 800 was more sensitive to the stability of the outer shell of the passive film. Fortunately, the
coating adhesion of GN treated L80 was very strong. This high adhesion was because the coating
was not applied on the surface with mechanical force but by the growth mechanism at high
temperature. Therefore, the natural spallation of the coating should not be a common issue to GN
treated L80. A coating with good adhesion is extremely important for its long term service in an
environment.
Table 5-2. The EC fitting of GN treated L80 and alloy 800 tested in the simulated environment.
GN treated L80 Alloy 800
Model R(Q(R(QR))) R(Q(R(QR)))
Rs 19.56 5.98
Qc 2.06E-05 4.80E-05
n 0.8 0.8262
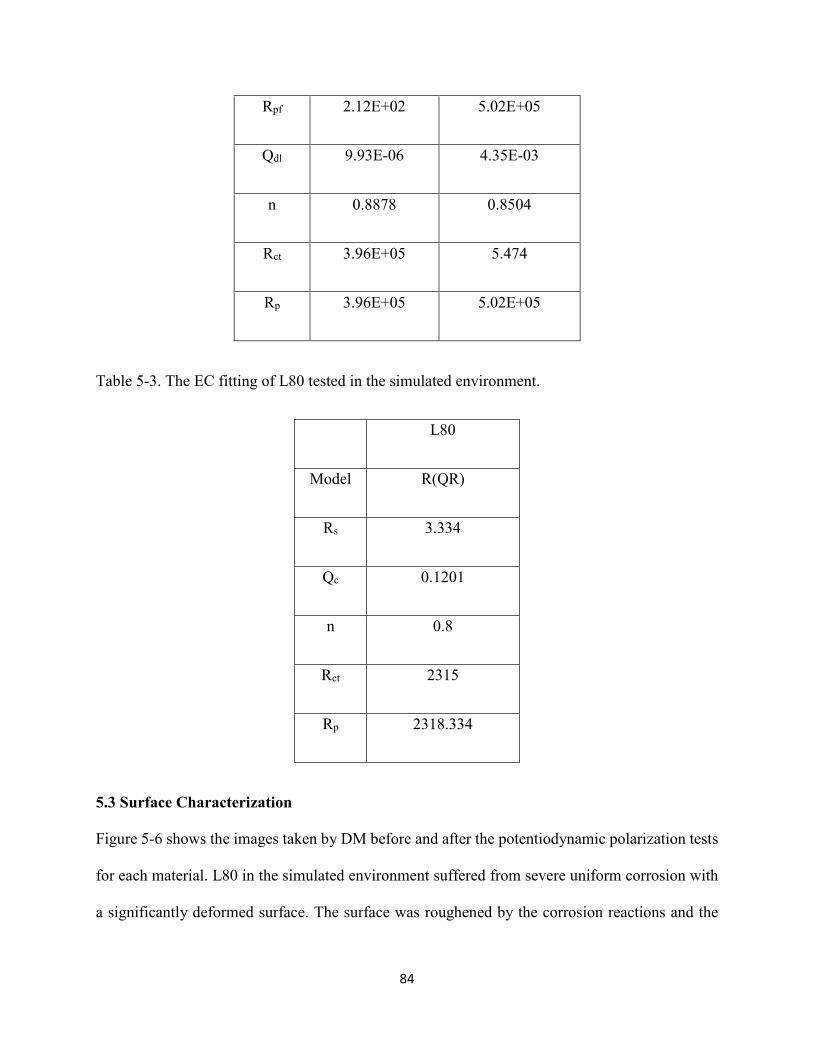
84
Rpf 2.12E+02 5.02E+05
Qdl 9.93E-06 4.35E-03
n 0.8878 0.8504
Rct 3.96E+05 5.474
Rp 3.96E+05 5.02E+05
Table 5-3. The EC fitting of L80 tested in the simulated environment.
L80
Model R(QR)
Rs 3.334
Qc 0.1201
n 0.8
Rct 2315
Rp 2318.334
5.3 Surface Characterization
Figure 5-6 shows the images taken by DM before and after the potentiodynamic polarization tests
for each material. L80 in the simulated environment suffered from severe uniform corrosion with
a significantly deformed surface. The surface was roughened by the corrosion reactions and the

85
flake-like corrosion products loosely deposited were removed easily from the substrate by rinsing
with deionized water. The roughened surface is favorable for the fouling deposition, which induces
the plugging problem of the slotted liners. By contrast, GN treated L80 did not show any sign of
corrosion reactions or changes of surface morphologies. It suggested that GN treated L80 was
dimensionally and chemically stable in the test environment. Alloy 800 after the test showed a
large amount of pits which were a sign that pitting corrosion had occurred around the inclusions
and grain boundaries [77]. Therefore, the corrosion rate of alloy 800 might greatly increase with
service time.

86
Figure 5-6. The DM images of suface morphologies of different materials before and after the
potentiodynamic polarization tests in the same simulated environment, images were all taken at
1000X. a) L 80 before test; b) L80 after test; c) GN treated L80 before test; d) GN treated L80
after test; e) alloy 800 before test; f) alloy 800 after test.
a) b)
c) d)
e) f)

87
5.4 Conclusions for Chapter 5
In this chapter, the corrosion behavior of L80, GN treated L80 and alloy 800 were compared by
using potentiodynamic polarization tests, EIS tests and DM. GN treated L80 tested showed a more
positive corrosion potential, -0.38 V vs. Ag/AgCl, and wider and more stable passivation zone,
which indicated that GN treated L80 was more suitable as a corrosion resistant material in the test
environment. Both GN treated L80 and alloy 800 showed large radiuses of capacitance curves and
high phase angles around -75 °, which indicated that these two materials had excellent corrosion
resistance in the test environment. The double-layer model was used for the EC fitting of EIS data
of GN treated L80 and alloy 800. Randles cell model was used for L80. The Rp value of GN treated
L80, 3.96 × 10⁵ Ω·cm2, was very close to the Rp value of alloy 800, 5.02×10⁵ Ω·cm2, and both
values were significantly larger than the Rp of L80, 2.32×10³ Ω·cm2. However, Rpf was the most
dominant factor of the Rp of alloy 800 in the test environment, but Rct accounted for the Rp of GN
treated L80. Therefore, GN treated L80 was more sensitive to cracks in the coating because
corrosion was more likely to occur between the interface of the coating and diffusion layer.
Fortunately, the coating adhesion of GN treated L80 was very strong indicated by an extremely
small Qdl, 9.93×10⁻⁶ S-sn, since the coating grew directly on the diffusion layer. Therefore, both
alloy 800 and GN treated L80 had great corrosion resistance in the test environment, but GN
treated L80 was more suitable for the application as slotted liners in the simulated environment.

88
Chapter 6. The Stability Tests
The corrosion rate measured and corrosion behavior examined for GN treated L80 in Chapter 5
cannot give us a full picture of the corrosion resistance of this material in the simulated
environment. The stability is another important property to predict the overall corrosion resistance
of a coating in an environment for a long term service. The stability tests involved the immersion
test with various compositional and dimensional characterizations, and electrochemical tests. Only
the coating satisfying all of these criteria could be considered for the long term service as corrosion
resistant materials.
6.1 Experimental Procedure
6.1.1 Immersion Tests
The immersion test was conducted in the same container as the electrochemical tests. N2 was
pumped into the container with 200 mL simulated solution at a flow rate of 500 mL/min with an
inlet pressure of 20 psi for 15 min. After deaeration, CO2 was pumped into the simulated solution
at 20 mL/min and 20 psi before the test for at least 30 min to ensure the saturation of CO2. A sealed
but not welded GN treated L80 specimen was placed into the solution with the exposed surface
facing up. The immersion test lasted for 24 h with a continuous injection of CO2 to maintain
saturation. The immersed specimens were cleaned with deionized water after immersion. They
were air dried after rinsing and stored in a dry plastic bag for compositional and morphological
tests. Immersion tests were repeated at least three times.
6.1.2 Surface Characterization
Zeiss Sigma 300 VP-FESEM located in the Department of Earth and Atmospheric Science was
the SEM used for the surface morphology examination. It was equipped with a secondary electron
detector and a Bruker EDX system with dual silicon drift detectors for the examination of
89
elemental distribution and compositional analysis. Each samples was loaded on the examination
disc on a conductive adhesive tape without metal or carbon spray. The software used for the
capture of SEM images was SmartSEM and the software used to process the EDX data was Esprit.
Rigaku XRD Ultimate IV located in the NanoFAB was the XRD used for the compositional
analysis of this research. Both bulk diffraction and thin-film diffraction modes were used for the
examinations. The 2θ was from 30° to 90° with 1° per min with copper as the target for all the
samples. Jade 9.0 was the software used to process the XRD data and its build-in database was
used for the compounds screening test.
6.1.3 Electrochemical Tests
Potentiostatic polarization test is used to measure the corrosion resistance of the GN treated L80.
N2 was pumped into the container with 200 mL simulated solution at a flow rate of 500 mL/min
with an inlet pressure of 20 psi for 15 min. After deaeration, CO2 was pumped into the simulated
solution at 20 mL/min and 20 psi pressure before the test for at least 30 min to ensure the saturation
of CO2. All three electrodes were connected to the electrochemical workstation Gamry reference
500TM potentiostat well. The sealed and welded specimen, rinsed by a standard rinsing procedure
and air dried right before each test, was immersed into the solution 30 min before the potentiostat
test for stabilization. A constant applied potential +0.2 V vs. Ag/AgCl which was 0.58 V larger
than the corrosion potential of the system was applied on GN treated L80 with an optimized
schedule. The current generated during the test was recorded per second for 72 h. The software
used for this test was Gamry Instruments Framework 5.58a. Potentiostatic polarization tests were
performed at least three times.
90
6.2 Compositional Stability
Figure 6-1 shows the XRD pattern of L80 and GN treated L80 before and after immersion. To
compare the patterns of L80 and GN treated L80 before the immersion test, the pattern of GN
treated L80 did not show the co-presence of iron or any impurities. These results indicated that the
purity of the nitrides formed was high and pure Fe3N (ε phase) with more than 8 wt% of N (Figure
2-6) was formed in the nitriding process. The XRD pattern of GN treated L80 after the immersion
test showed that the composition of the surface compound layer did not change compared with the
GN treated L80 before the immersion test. The XRD pattern of GN treated L80 after the immersion
test did not show any exposure of the iron substrate. It also proved that the adhesion of compound
layer to the diffusion layer was excellent. The comparison of XRD results before and after the
immersion test indicated that GN treated L80 had great compositional stability in the test
environment.

91
Figure 6-1. The XRD pattern of L80 and GN treated L80 specimens before and after the
immersion test in CO2 saturated simulated solution at 20 °C for 24 h.
The EDX spectrum (Figure 6-2) and EDX elemental analysis (Table 6-1) also revealed that the
composition of the compound layer before and after the immersion test did not have any significant
changes. The variation of compositions was sufficiently small to conclude that little reactions
occurred on the GN treated L80 surface during the immersion test. Therefore, the composition
stability of GN treated L80 was excellent in the test environment. The errors on the composition
differences might be contributed from the organic residuals from the rinsing process and the
detection limit of the equipment.
30 35 40 45 50 55 60 65 70 75 80 85 90
Inte
nsi
ty
2 Theta (°)
L-80 BeforeImmersion Test
Nitriding Treatedafter ImmersionTest
Nitriding Treatedbefore ImmersionTest
Fe3N (Iron Nitride)PDF: 01-072-2125
Fe
FeFe

92
Figure 6-2. The surface EDX spectrum of GN treated L80 specimens before and after the
immersion test, resolution 5 µm × 5 µm. a) before the immersion test; b) after the immersion test.
1 2 3 4 5 6 7 8 9 10keV
0
2
4
6
8
10
12
14
16
18
20
22
cps/eV
Fe Fe C Mn Mn
Si
O N
a) Before immersion test
1 2 3 4 5 6 7 8 9 10keV
0
2
4
6
8
10
12
14
16
18
20
cps/eV
Fe Fe C Mn Mn
Si
O N
b) After immersion test

93
Table 6-1. The composition of compound layer before and after the immersion test.
Element Weight percent (wt%) Atomic percent (at%)
before after before after
Fe 82.84 80.29 57.28 51.38
N 7.67 8.04 21.14 20.50
O 3.80 5.49 9.16 12.27
C 3.13 4.83 10.05 14.38
Mn 1.75 0.95 1.23 1.21
Si 0.82 0.40 1.13 0.26
Total 100.00 100.00 100.00 100.00
6.3 Dimensional Stability
The dimensional stability is another important factor to determine the stability of GN treated L80
in the simulated environment. It is especially important to slotted liners, which require precise
dimension controls since the size of slots was careful iterated to obtain the desired screening
efficiency of the bitumen. If the dimensional changes of the GN treated surface are significant
either by the growth of additional layers or the removal of a coating, the screening efficiency of
the slotted liners will decrease dramatically. Figure 6-3 a) shows the surface morphology of the
GN treated L80 without any pretreatment. The small particles attached on the surface naturally
formed on the compound layer were washed away by immersion of the specimen (Figure 6-3, b).
However, the morphology of the compound layer was still dense without partially spallation or pit
formation. The surface gaps were small and shallow compared with the depth of the compound
layer. The gaps did not initiate and propagate into deep through the entire layer. Therefore, the
compound layer had great resistance to the deformation or mass loss induced by the tests
environment.

94
Figure 6-3. The secondary electron SEM images of surface morphologies of GN treated L80
before, a), and after, b), the immersion test, taken at 20000X.
6.4 Corrosion Resistance
The potentiostatic polarization curve of GN treated L80 tested in the simulated environment
showed a small average current density, less than 10 µA/cm2, with a constant applied potential of
0.2 V vs. Ag/AgCl for 72 h. The peak current density generated within the first hour of the test
was due to the rapid formation of corrosion products in cracks and pits with fresh and active
surfaces. The current density soon dropped to a stable state and gradually decreased to smaller
values (log-log scale). The fluctuations of the current density were extremely small within ±1
µA/cm2 per hour after the first hour of the test. The current density dropped down to 1 µA/cm2
2µm
b) After immersion test
2µm
a) Before immersion test

95
after 10 h of test, which was even smaller than the free corrosion current density, 1.96 µA/cm2, for
GN treated L80 tested in the potentiodynamic polarization test. This fact suggested that the
corrosion rate of GN treated L80 in the simulated environment would be smaller than the average
value predicted by the potentiodynamic polarization test. The decrease of current density was
because the corrosion products formed in the cracks and pits were deposited in a compact and
protective manner, which prevented the occurrence of further corrosion [44]. Therefore, an overall
decreased corrosion current density was observed.
Figure 6-4. The potentiostatic polarization curve of the GN treated L80 tested in simulated
environment with a constant applied potential, 0.2 V vs. Ag/AgCl, for 72 h.
6.6 Conclusions of Chapter 6
In this chapter, the stability of GN treated L80 in the simulated environment was tested and
discussed. The XRD results suggested that the GN treated sample was capable of producing a
compact compound layer with pure ε phase iron nitride on L80. The composition of the compound
0
2
4
6
8
10
12
0 20 40 60
Cu
rren
t D
ensi
ty (
µA
/cm
2)
Time (h)
0
1
10
100
1 10Cu
rren
t D
ensi
ty (
µA
/cm
2)
Time (h)
Log-log scale

96
layer after the immersion test did not show any difference. Therefore, the compositional stability
of GN treated L80 was excellent in the simulated environment. The same conclusion was verified
by EDX test where the elementary compositions of the compound layer before and after the test
did not have significant differences. The SEM images also suggested the dimensional stability of
compound layer was outstanding since the changes of the compound layer morphologies were
small. The potentiostatic polarization test suggested that the GN treated L80 had excellent and
stable corrosion resistance in the simulated environment. The current density generated on GN
treated L80 at a constant 0.2 V Ag/AgCl potential decreased continuously with time. The corrosion
current tested after 10 h of immersion was even smaller than the free corrosion density tested for
GN treated L80, which indicates a smaller overall corrosion rate was expected than the one
predicted by the potentiodynamic polarization test. The fluctuation of current density was
sufficiently small to conclude that GN treated L80 had great electrochemical stability in the test
environment.

97
Chapter 7. Conclusions
In chapter 4, GN treatment was optimized based on nitriding duration, temperature and ammonia
flow rate to obtain the optimized corrosion resistance in the simulated environment of slotted liners.
Both nitriding duration and temperature affected the thickness of compound layer, but the
compactness of the compound layer was influenced by the duration and flow rate. GN treated L80
treated with either schedule showed improved corrosion resistance due to the presence of
passivation zones in potentiodynamic polarization tests. The optimized schedule was a treatment
at 40 mL/min of flowrate at 530°C for 16 h. The corrosion current density of optimized GN treated
L80 decreased to 1.96 µA/cm2; its corrosion potential shifted to -0.38 mV v. Ag/AgCl. Most
importantly, the corrosion rate of optimized GN treated L80 decreased to 0.023 mm/year, which
was about one order of magnitude smaller than the corrosion rate of L80 in the same environment.
Therefore, the optimized nitriding schedule significantly increased the corrosion resistance of L80
in the simulated environment.
Chapter 5 compared the corrosion behavior of L80, GN treated L80 and alloy 800 by using
potentiodynamic polarization tests, EIS tests and DM. Even though both alloy 800 and GN treated
L80 had small corrosion rates, large radiuses of capacitance curves, and high phase angles in the
simulated environment, GN L80 showed a more positive corrosion potential and a wider and more
stable passivation zone than alloy 800. The Rp value calculated by EC fitting of GN treated L80,
3.96 × 10⁵ Ω·cm2, was very close to the Rp value of alloy 800, 5.02×10⁵ Ω·cm2, and both values
were significantly larger than the Rp of L80, 2.32×10³ Ω·cm2. However, the corrosion behavior
suggested that GN treated L80 was more sensitive to the cracks in the coating. However, the
deposition of corrosion products on the surface cracks of GN treated L80 in this environment was
protective and natural coating spallation was difficult due to high coating adhesion. Therefore, GN

98
treated L80 was the candidate with most stable and inhibited corrosion behavior for the application
as slotted liners in the simulated environment.
Chapter 6 investigated the stability of GN treated L80 in the simulated environment. Both XRD
and EDX results suggested that GN treatment is capable of producing a compact compound layer
with pure ε phase iron nitride on L80. The small changes of composition of the compound layer
before and after the immersion test proved that GN treated L80 had superior compositional
stability in the simulated environment. The SEM images before and after the immersion tests
suggested that the dimensional stability of the compound layer was outstanding since the changes
of compound layer morphologies were limited. The potentiostatic polarization test indicated that
GN treated L80 had excellent corrosion resistance and stability in the simulated environment. The
current density generated on GN treated L80 at a constant 0.2 V Ag/AgCl potential decreased
continuously with time. The corrosion current density tested after 10 h of immersion was even
smaller than the free corrosion density tested for GN treated L80. Therefore, the overall corrosion
rate of GN treated L80 in the simulated environment could be smaller than the one predicted by
the potentiodynamic polarization test. The fluctuation of current density was sufficiently small to
conclude that GN treated L80 had great electrochemical stability in the test environment.
In conclusion, GN treated L80 had improved corrosion resistance and inhibited corrosion behavior
in the simulated environment. Most importantly, the superior stability also suggested that this
material was a competitive candidate for the application as slotted liners. However, the real
operation environment of slotted liners is more complex than the simulated environment.
Therefore, more experiments with complex variables should be conducted to further test the
applicability of GN treated L80 in the operation environment of slotted liners in future work.
99
Chapter 8. Future Work
8.1 Further Optimization
The optimization of GN schedule is an iteration process which should not cease even when the
required performance is achieved. The optimization of treatment only emphasized on nitriding
duration, temperature and ammonia flow rate in this research. However, the performance of final
products is influenced by many other factors such as pre-treatment, number of stages, cooling rates,
etc. For example, Chang et al. [78] investigated the effect of gas nitriding pressure on the formation
of AlN in Fe-9Al-28Mn-1.8C alloy; they found that both of the thickness of the nitride layer and
nitrogen concentration were increased with the increase of nitriding pressure. The corrosion
resistance of a nitrided specimen in 3.5 wt% NaCl was significantly increased only after 12 h of
treatment. Not only the optimization of nitriding parameters, but the schedule itself could be
heavily altered to achieve better properties. The modern GN technique gradually replaced the
hazardous ammonia gas by dissociating pure nitrogen gas at higher pressure (20 ksi) and higher
temperature (above 1000°C) for only 3 h to achieve a nitriding layer with higher thickness and
compactness [79]. Therefore, the optimization of nitriding treatment should not be limited in the
adjustment of nitriding parameters. The properties of nitriding steel can also be improved by
various methods.
8.2 Complex Simulated Solution
The chemistries in the simulated solution selected for this research was “sodium-chloride-
bicarbonate” type, which was dominated by NaCl. The reason to select such a simplified system
was to focus the research on the corrosion directly induced by dissolved CO2. However, the real
formation water is much more complex than this simulated solution. According to Abercrombie
[80], the formation water of the north Athabasca oil sand region may also contain tremendous

100
amounts of sulphate minerals such as thenardite (Na2SO4) and carbonate minerals such as calcite
(CaCO3). Most of these chemicals were proven to have detrimental effects on the breakdown of
the coating due to various mechanisms [81]. Therefore, a simulated solution with much more
complex chemistries should also be tested to understand their effects on the degradation rate of
GN treated L80. The real produced water separated from the bitumen from different reservoirs are
the most ideal test solutions for the electrochemical tests for GN treated L80.
8.3 Effect of H2S and Its Synergism with CO2
Hydrogen sulfide (H2S) is another common acidic gas released from the aquathermolysis process.
According to Garverick [82], this gas is extremely harmful because it acts as a catalyst to promote
the absorption of hydrogen formed by the cathodic reduction, which results in severe sulfide stress
cracking of tubing. Most importantly, the corrosion product iron sulfide (FeS) deposits rapidly on
the corroded surface in a porous manner, which results in severe plugging problems of the liners.
The corrosion induced by H2S (sour corrosion) may result in corrosion rates larger than hundreds
of mpy. Therefore, the effect of H2S on the GN treated L80 should also be investigated. Moreover,
since the H2S and CO2 are generally co-present in most reserves, their synergism is the most
common corrosion mechanism occurring on liners. Garverick [82] emphasizes that sour corrosion
usually dominates the corrosion reactions when the mass ratio of H2S/CO2 exceeds to 1/500. The
pitting corrosion induced by H2S may result in more detrimental effects on GN treated L80 if the
surface precipitation of FeS is not protective.
8.4 HPHT Environment with Water
Although GN treated steel has been widely applied in HPHT environment as hot forming tools and
highly stressed machine components, the corrosion resistance of GN treated steel is never
systematically conducted in HPHT environment in the presence of water [83]. In this research, the

101
temperature used for electrochemical tests was room temperature, 20°C and the pressure was about
1 atmosphere, 101.4 kPa. The temperature and pressure setting enabled the operation of in-situ
electrochemical tests to understand the effect of CO2 on the corrosion behavior of GN treated L80.
However, both the temperature and pressure tested were far below the real operation temperature,
250°C, and pressure, 1 MPa [84]. Although conventional electrochemical tests cannot be directly
conducted in this test environment, immersion tests and weight loss tests can still be carried to
understand the corrosion resistance of GN treated L80 in the HPHT environment. Although high
temperature decreases the solubility of CO2 in the water, the high pressure increases the solubility
of CO2 and significantly decreases the pH of the solution, which may result in a different
deposition mechanism of corrosion products [82]. Therefore, the HPHT tests on GN treated L80
in autoclave also should be done as planned for future work.
8.5 Erosion Resistance and Its Synergism with Corrosion
Numerous of tests of the wear resistance of GN treated steel have been conducted. GN treated steel
is successfully applied as a heavy duty material in many industrial fields [83]. However, the
erosion resistance and the synergism of corrosion and erosion on GN treated steel in humid
environment are seldom studied. The erosion of slotted liners is a mechanical wear process which
results in the mass loss of the material by particles such as silica (SiO2) sand and fluid flow.
Generally, the combined effects of erosion and corrosion are significantly higher than the sum of
the effects of individual processes [85]. GN treated L80 may have outstanding erosion resistance;
however, the segregation of corrosion products in the interface between coating and substrate may
result in significant loss of coating adhesion, which can be reflected as degraded erosion resistance
in the simulated environment. Therefore, the erosion and corrosion synergism of GN treated L80

102
in the simulated environment should be closely investigated before GN treated L80 is claimed to
be competent as the material for slotted liners.

103
Reference
[1] Alberta Government. "Oil Sands - The Resource (2013)". Retrieved from
http://oilsands.alberta.ca/FactSheets/Resource_FSht_Sep_2013_Online.pdf
[2] Alberta Government, "Talk about SAGD (2013)", retrieved from
http://www.energy.alberta.ca/OilSands/pdfs/FS_SAGD.pdf
[3] J. Been and B. Crozier. "Thermal Well Casing Corrosion Evaluation Using Hydrogen
Permeation in Mini-Pipe Specimen", Alberta Innovates Technology Features (2007).
[4] J. L. Luo, Y. S. Ma and H. Zeng, "RGL-UA CRD Application Proposal - Comprehensive
Design and Manufacturing Solutions for Sand Control and Tolling towards Enhanced Oil
Recovery", No. 327807 (2014): pp. 1–40.
[5] J. L. Luo, H. Zeng and Y. S. Ma, "Sub-Project 5: Corrosion Mechanism Interactions with
Product Design and Coating Treatment", Faculty of Engineering, University of Alberta (2014):
pp.1-5.
[6] M. Koteeswaran, "CO2 and H2S Corrosion in Oil Pipelines", Faculty of Mathematics and
Natural Science, University of Stavangers (2010).
[7] D. Pye, Chapter 1, “Practical Nitriding and Ferritic Nitrocarburizing”, ASM International
(2003).
[8] P. R. Kapadia, M. S. Kallos and I. D. Gates. “A New Reaction Model for Aquathermolysis of
Athabasca Bitumen”. The Canadian Journal of Chemical Engineering, 91, 3 (2012): pp. 475–
482.
[9] R. Case, S. Mahajanam, J. Dunn, M. Joosten, M. Achour, H. Marchebois, S. Mahajanama, J.
Dunn, and M. Bonis. “Evaluation of Corrosivity of Produced Fluids during SAGD Operations”.
Corrosion (2014), Paper no. 4273; pp 1-7.
[10] J. Whittaker and Q. Liu, “Corrosion Management and Mechanism Study on SAGD Brackish
Water System”. Corrosion (2014): Paper No. 3809; pp. 1-6.
[11] D. A. Katz, “The Athabasca Tar Sands Fort McMurray, Alberta, Canada”. Department of
Chemistry, Pima Community College – West Campus (2007): pp. 1-22.

104
[12] F. Y. Ma. “Corrosive Effects of Chlorides on Metals”, Pitting Corrosion (2012), ISBN: 978-
953-51-0275-5: pp.139-178.
[13] H. J. Abercrombie, “Evolution of Groundwater Hydrochemistry, North Athabasca Oil Sand
Region”, GeoConvention 2015: Geoscience New Horizons (2015): pp. 1-2.
[14] JEF Steel, “Corrosion Resistant High Cr Steel for Oil and Gas Wells”, New Products &
Technologies, 18 (2013): pp. 61-63.
[15] V. Palanisamy, J. K. Solberg, B. Salberg, and P. T. “Microstructure and Mechanical
Propertied of API 5CT L80 Casing Grade Steel Quenched from Different Temperatures. ASME
2012 31st International Conference on Ocean, Offshore and Arctic Engineering, 6 (2012): pp.
253–259.
[16] K. Videm and A.M. Koren, “Corrosion, Passivity, and Pitting of Carbon Steel in Aqueous
Solutions of HCO3-, CO2, and Cl-”, Corrosion, 49, 9 (1993): pp. 746–754.
[17] I. S. Cole, P. Corrigan, S. Sim, and N. Birbillis, “Corrosion of Pipelines Used for CO2
Transport in CCS: Is it a Real Problem?”, International Journal of Greenhouse Gas Control, 5, 4
(2011): pp. 749–756.
[18] Q. Wu, Z. Zhang, X. Dong, and J. Yang, “Corrosion Behavior of Low-Alloy Steel
Containing 1% Chromium in CO2 Environments”, Corrosion Science, 75 (2013): pp. 400–408.
[19] C. A. Palacious and J. R. Shaldey, “Characteristics of Corrosion Scales on Steel in a CO2-
Saturated NaCl Brine”, Corrosion, 47, 2 (1991): pp. 122–127.
[20] Q.Y. Liu, L. J. Mao, S. W. Zhou, “Effects of Chloride Content of CO2 Corrosion of Carbon
Steel in Simulated Oil and Gas Well Environments”, Corrosion Science, 84 (2014): pp. 165–171.
[21] D. H. Davies and G. T. Burstein. “The Effects of Bicarbonate on the Corrosion and
Passivation of Iron”. Corrosion, 36, 8 (1980): pp. 416-422.
[22] L. T. Popoola, A. S. Grema, G. K. Latiwo, B. Gutti, and A. S. Balogun. “Corrosion
Problems during Oil and Gas Production and Its Mitigation”, International Journal of Industrial
Chemistry, 4, 35 (2013).
105
[23] W. T. Scannell and A. Sohanghpurwala, “Cathodic Protection as a Corrosion Control
Alternative”, Concorr, Inc. (1993): pp. 1-5.
[24] SAE, Enviranode, “Well Casing Cathodic Protection System” (2010).
[25] P. Malekinejad and M. S. Alavi, “Cathodic Protection of Oil and Gas Well Casing”, 1st
National Iranian Drilling Industry Congress, 1 (2008): pp. 1-11.
[26] S. Oliphant, “Well Casing Corrosion and Cathodic Protection”, NACE Northern Area
Western Conference (2010): pp. 1-32.
[27] R. Norsworthy, “Fusion Bonded Epoxy – A Field Proven Fail Safe Coating System”,
Corrosion - NACE International Conference (2006), no. 06044: pp. 1-9.
[28] J. S. Park, J. M. Kim, H. Y. Kim, J. S. Lee, I. H. Oh, and C. S. Kang. “Surface Protection
Effect of Diffusion Pack Cementation Process by Al-Si Powders with Chloride Activator on
Magnesium and Its Alloys. Materials Transactions, 49, 5 (2008): pp. 1048-1051.
[29] T. Nagashima, E. Sakuma and K.Takano, “Member for Immersion in Hot Dip Galvanizing
Bath and Method for Producing the Same (2001)”. US6284062 B1.
[30] Jiangnan Fluoroplastic Co., Ltd., PTFE Line Pipes.
[31] E. D. Hollies, “Use of Coated Slots for Control of Sand or Other Solids in Wells Completed
for Production of Fluids (2009)”. US 20090014174 A1.
[32] M. Shi, F. Miyazawa, S. Tobe and T. A. Stolarski, “The Friction and Wear Properties of
PTFE Composite-Thermal Spray Metallic Binary Coatings”, Materials Transactions, 46, 1
(2005): pp. 84-87.
[33] EnTech Instruments Inc., “Ultra Inert Silonite Surface Coatings”, retrieved from
http://www.entechinst.com/about/entech-technology.
[34] J.N. Dobbes, A.C. Anderson, “The Thermal Expansion of Teflon at Temperature below
3K”, Journal of Non-Crystalline Solids, 69, 2-3 (1985): pp. 429-431.
[35] Q. Zhou, W. Lu, “A Method to Deposit Silica Coating by Electroplating on Steel (2015)”,
CN 102732936 B.
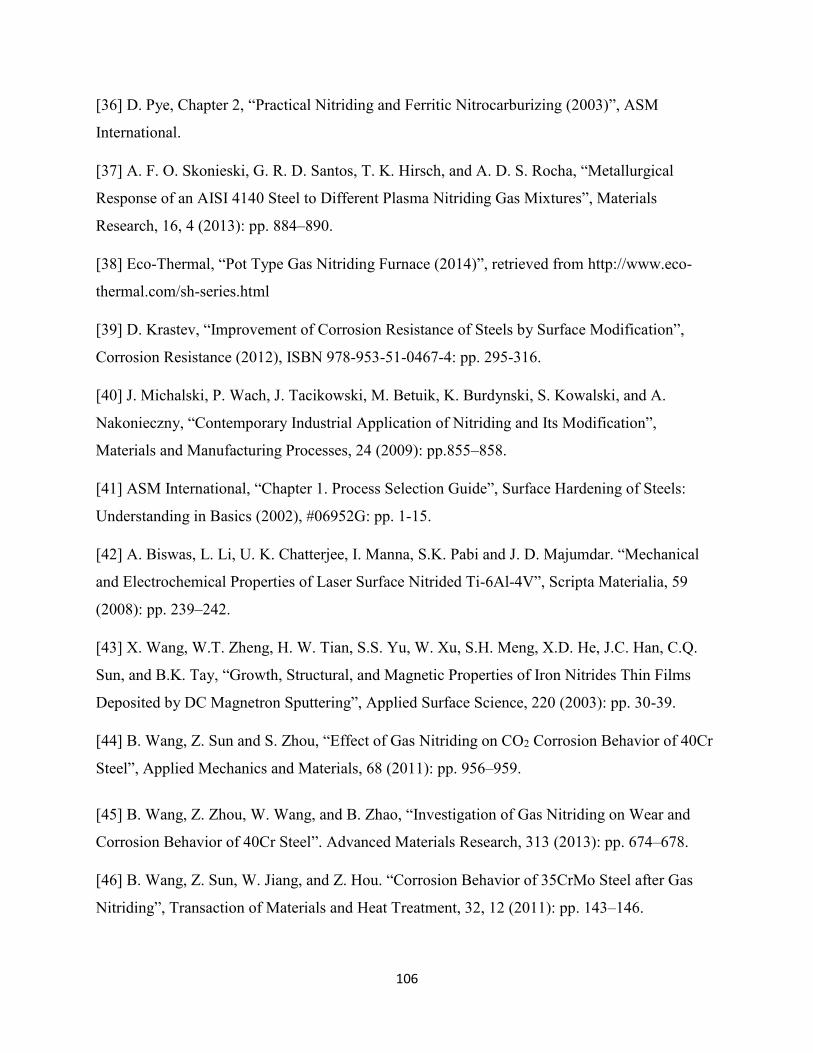
106
[36] D. Pye, Chapter 2, “Practical Nitriding and Ferritic Nitrocarburizing (2003)”, ASM
International.
[37] A. F. O. Skonieski, G. R. D. Santos, T. K. Hirsch, and A. D. S. Rocha, “Metallurgical
Response of an AISI 4140 Steel to Different Plasma Nitriding Gas Mixtures”, Materials
Research, 16, 4 (2013): pp. 884–890.
[38] Eco-Thermal, “Pot Type Gas Nitriding Furnace (2014)”, retrieved from http://www.eco-
thermal.com/sh-series.html
[39] D. Krastev, “Improvement of Corrosion Resistance of Steels by Surface Modification”,
Corrosion Resistance (2012), ISBN 978-953-51-0467-4: pp. 295-316.
[40] J. Michalski, P. Wach, J. Tacikowski, M. Betuik, K. Burdynski, S. Kowalski, and A.
Nakonieczny, “Contemporary Industrial Application of Nitriding and Its Modification”,
Materials and Manufacturing Processes, 24 (2009): pp.855–858.
[41] ASM International, “Chapter 1. Process Selection Guide”, Surface Hardening of Steels:
Understanding in Basics (2002), #06952G: pp. 1-15.
[42] A. Biswas, L. Li, U. K. Chatterjee, I. Manna, S.K. Pabi and J. D. Majumdar. “Mechanical
and Electrochemical Properties of Laser Surface Nitrided Ti-6Al-4V”, Scripta Materialia, 59
(2008): pp. 239–242.
[43] X. Wang, W.T. Zheng, H. W. Tian, S.S. Yu, W. Xu, S.H. Meng, X.D. He, J.C. Han, C.Q.
Sun, and B.K. Tay, “Growth, Structural, and Magnetic Properties of Iron Nitrides Thin Films
Deposited by DC Magnetron Sputtering”, Applied Surface Science, 220 (2003): pp. 30-39.
[44] B. Wang, Z. Sun and S. Zhou, “Effect of Gas Nitriding on CO2 Corrosion Behavior of 40Cr
Steel”, Applied Mechanics and Materials, 68 (2011): pp. 956–959.
[45] B. Wang, Z. Zhou, W. Wang, and B. Zhao, “Investigation of Gas Nitriding on Wear and
Corrosion Behavior of 40Cr Steel”. Advanced Materials Research, 313 (2013): pp. 674–678.
[46] B. Wang, Z. Sun, W. Jiang, and Z. Hou. “Corrosion Behavior of 35CrMo Steel after Gas
Nitriding”, Transaction of Materials and Heat Treatment, 32, 12 (2011): pp. 143–146.

107
[47] Z. Liu, “Research on the Corrosion and Wear Performance of the Nitriding and Sherardizing
Complex Treatment in Oil Output Liquid”, China Academy of Machinery Science and
Technology (2011): pp. 36-48.
[48] Y. Chen, C. Lin, C. Chao, and T. Liu, “Excellent Enhancement of Corrosion Properties of
Fe-9Al-30Mn–1.8C Alloy in 3.5% NaCl and 10% HCl Aqueous Solutions Using Gas Nitriding
Treatment”. Journal of Alloys and Compounds, 633 (2015): pp. 137–144.
[49] S. Yeh, L. Chiu, and H. Chang. “Effects on Gas Nitriding on the Mechanical and Corrosion
Properties of SACM 645 Steel”, Engineering, 3 (2011): pp.942-948.
[50] R. L. O. Baaso, R. J. Candal, C. A. Figueroa, D. Wisnivesky, and F. Alverz, “Influence of
Microstructure on the Corrosion Behavior of Nitro carburized AISI H13 Tool Steel Obtained by
Pulsed DC Plasma”. Surface and Coating Technology, 203, 10 (2009): pp. 1293–1297.
[51] S. Niu, S. Yang, Y. Li, “Improvement in Corrosion Resistance of Anchor Steel by Low
Temperature Plasma Nitriding”. Journal of Wuhan University of Technology-Material, Science
Edition. 29, 3 (2011): pp. 590–593.
[52] L.N. Tang and M.F. Yan. “Influence of Plasma Nitriding on the Microstructure, Wear, and
Corrosion Properties of Quenched 30CrMnSiA Steel”. Journal of Materials Engineering and
Performance, 22, 7 (2013): pp.2121 – 2129
[53] E. Almeida, J. Milan, C. Costa, “Acquired Properties Comparison of Solid Nitriding, Gas
Nitriding and Plasma Nitriding in Tool Steels”, Materials Research, 18, 1 (2015): pp. 7–35.
[54] T. Weber, L. Wit, F. W. Saris, A. Koniger, B. Rauschenbach, G. K. Wolf, S. Krauss.
“Hardness and Corrosion Resistance of Single-phase Nitride and Carbide on Iron”, Material
Science and Engineering, A199 (1995): pp. 205 -210.
[55] J. Prasek, L. Trankova, I. Gablech, P. Businova, J. Drbohlavova, J. Chomoucka, V. Adam,
R. Kizek, J. Hubalec, “Optimization of Planar Three-Electrode Systems for Redox System
Detection”, International Journal of Electrochemical Science, 7 (2012): pp. 1785-1801.
[56] K. K. Kasmen and S. Jones, “Platinum as Reference Electrode in Electrochemical
Measurements”, Platinum Metals Review, 52, 2 (2008); pp. 100-106.

108
[57] A. Lasia, “Electrochemical Impedance Spectroscopy and Its Application”, Modern Aspects
of Electrochemistry, 32 (1999), pp. 143-248.
[58] Gamry Instruments, “Introduction to Electrochemical Impedance Spectroscopy”, retrieved
from: https://www.gamry.com/assets/Uploads/Basics-of-Electrochemical-Impedance-
Spectroscopy.pdf
[59] Gamry Instruments, “Basics of Electrochemical Impedance Spectroscopy (updated on
2015)”, retrieved from: https://www.gamry.com/application-notes/EIS/basics-of-
electrochemical-impedance-spectroscopy/.
[60] W. Pinc, D. Heller, W. Fahrenholtz, M. O’Keefe, “Electrochemical and Structural Changes
in Cerium Based Conversion Coatings during Exposure to Salt Spray”, Electrochemical Society
Transactions, 25, 29 (2010): pp. 3-17.
[61] I. Dehri, “Impedance Measurements of Polyester-Coated Galvanized Mild Steel in 10x Acid
Rainwater after an Accelerated Wet-Dry Test”, Turkey Journal of Chemistry, 24 (2000): pp.239-
245.
[62] Gasem, Z. M., “Chapter 3: Electrochemical Kinetics of Corrosion (Polarization)”, ME 472:
Corrosion Engineering I, KFUPM, 2013.
[63] Princeton Applied Research, “Application Note Corr-1. Subject: Basic of corrosion
Measurements”, 2012.
[64] Zang, L., Lecture 3 Brief Overview of Traditional Microscopes, Department of Materials
Science and Engineering, University of Utah.
[65] H. Inada, D. Su, R.F. Egerton, M. Konno, L. Wu, J. Ciston, J. Wall and Y. Zhu, “Atomic
Imaging Using Secondary Electrons in a Scanning Transmission Electron Microscope:
Experimental Observations and Possible Mechanisms”, Ultramicoscopy (2010); pp. 1-20.
[66] U. Scheithauer, “Application of the Analytical Methods REM/EDX, AES and SNMS to a
Chloride Induced Aluminum Corrosion”, Fresenius’ Journal of Analytical Chemistry, 341
(1991): pp. 445-448.

109
[67] C. G. Pope, “X-ray Diffraction and the Bragg Equation”, Journal of Chemical Education,
74, 1 (1997): pp.129-131.
[68] Continental Alloys and Service, L80, Materials, retrieved from
http://www.contalloy.com/products/grade/l80.
[69] Barnstead Thermolyne Corporation, “Types F79300 & F79400 Tube Furnaces – Operation
Manual and Parts List (2004)”, retrieved from:
http://www.masterflex.com/assets/Manual_pdfs/00124VO%20manual.pdf.
[70] V. Fajardo, B. Brown, D. Young, S. Nesic, “Study of the Solubility of Iron Carbonate in the
Prescience of Acetic Acid Using an EQCM”, NACE International Corrosion 2013 Conference
and Expo, Paper No. 2452 (2013); pp. 1-20.
[71] Special Metals Corporation, “High-Performance Alloys for Resistance to Aqueous
Corrosion”, SMC-026 (2000): pp.1-7.
[72] Craig, B., “Materials for Deep Oil and Gas Well Construction, Advanced Materials and
Process”, ASM international, AMP16605P033 (2008): pp.33 -35.
[73] Special Metals Corporation, “Incoloy alloy 800”, SMC-046 (2004): pp.1–12.
[74] R. C. Newman, H. S., Isaacs and B. Alman , “Effects of Sulfur Compounds on the Pitting
Behavior of Type 304 Stainless Steel in Near-Neutral Chloride Solutions”, Corrosion, 28, 5
(1982): pp. 261–265.
[75] W.M. Bos, “Chapter 4 - Outdoor Exposure of Coating Systems Monitored with EIS”,
Prediction of Coating Durability Early Detection Using Electrochemical Methods (2008), ISBN
978-90-9022815-0: pp. 67–73.
[76] A. Tiwari, J. Rawlins, L. H. Hihara, “6.2.2.2 Characterization of Paint Coating and Low
Carbon Steel Substrates” Intelligent Coating for Corrosion Control (2015), ISBN 978-0-12-
411467-8: pp. 203-204.
[77] J. Banas, B. Mazurkiewiez, U. Lelek-Borkowska, H. Krawiec, W. Solarski, K. Kowalski,
“The Effect of CO2 and H2S on the Passivation of Chromium and Stainless Steels in Aqueous
Solutions at Elevated Temperature and under High Pressure”, Passivation of Metals and

110
Semiconductors, and Properties of thin Oxide Layer: A Selection of Papers from the 9th
International Symposium, Paris, France (2005): pp.417–423.
[78] K.M. Chang, C.C. Kuo, Y.W. Chang, C.G. Chao, T.F. Liu, “Effects of Gas Nitriding
Pressure on the Formation of Nanocrystalline AlN in Plasma Nitrided Fe-9Al-28Mn-1.8C
Alloy”, Surface and Coating Technology, 254 (2014): pp. 313-318.
[79] S. A. Gerasimov, V. A. Golikov, M. A. Gress, G. G. Mukhin, and V. I. Snop, “High-
Pressure Gas Nitriding of Steels”, Metal Science and Heat Treatment, 46, 5-6 (2004): pp. 227 -
232.
[80] H. J. Abercrombie, “Evolution of Groundwater Hydrochemistry, North Athabasca Oil Sand
Region”, GeoConvention 2015: Geoscience New Horizons (2015): pp. 1-2.
[81] R. Case, S. Mahajanam, J. Dunn, M. Joosten, M. Achour, H. Marchebois, S. Mahajanama, J.
Dunn, and M. Bonis. “Evaluation of Corrosivity of Produced Fluids during SAGD Operations”.
Corrosion (2014), Paper no. 4273: pp. 1-6.
[82] L. Garverick, “Corrosion in Petroleum Production Operations”, Corrosion in the
Petrochemical Industry (1994), ASM International, ISBN-10 0871705052: pp. 259-260.
[83] J. Michalski, P. Wach, J. Tacikowski, M. Betuik, K. Burdynski, S. Kowalski, and A.
Nakonieczny, “Contemporary Industrial Application of Nitriding and Its Modification”,
Materials and Manufacturing Processes, 24 (2009): pp.855–858.
[84] C. Palmgren, I. Walker, M. Carlson, M. Uwiera, M. Torlak, “Reservoir Design of a Shallow
LP-SAGD Project for in-Situ Extraction of Athabasca Bitumen”, World Heavy Oil Congress
(2011), WHOC11-520: pp. 1-8.
[85] R. Malka, S. Nesic, and D. A. Guilino, “Erosion Corrosion and Synergistic Effects in
Disturbed Liquid-Particle Flow”, Corrosion NACE XPO 2006), Paper No. 06594: pp. 1-22.

111
Appendices
Reproducibility
Figure A-1. The Phase Bode Plot L-80 Treated with the Same Nitriding Parameters in Simulated
Environment (sample).
Figure A-2. The Impendence Bode Plot of L-80 Treated with Same Nitriding Parameters in
Simulated Environment (sample).
-90
-80
-70
-60
-50
-40
-30
-20
-10
0
1.E-02 1.E-01 1.E+00 1.E+01 1.E+02 1.E+03 1.E+04 1.E+05
Ph
ase
(deg
ree)
Frequency (Hz)
T = 530 C, f.r. = 40mL/min, t = 12 hr - 1
T = 530 C, f.r. = 40mL/min, t = 12 hr - 2
T = 530 C, f.r. = 40mL/min, t = 12 hr - 3
0.001
0.01
0.1
1
10
1.E-02 1.E-01 1.E+00 1.E+01 1.E+02 1.E+03 1.E+04 1.E+05
Z mo
d (k
oh
m·c
m2)
Frequency (Hz)
T = 530 C, f.r. = 40 mL/min, t = 12 hr - 1
T = 530 C, f.r. = 40 mL/min, t = 12 hr - 2
T = 530 C, f.r. = 40 mL/min, t = 12 hr - 3

112
Figure A-3. The L-80 Nitriding Treated with Same Parameters in the Same Simulated
Environment (sample).
-0.9
-0.8
-0.7
-0.6
-0.5
-0.4
-0.3
-0.2
-0.1
0.0
0.1
0.2
1.E-08 1.E-06 1.E-04 1.E-02
V v
s. A
g/A
gCl (
V)
Current Density (A/cm2)
T = 520 C, f.r. = 40mL/min, t = 16 hr - 1
T = 520 C, f.r. = 40mL/min, t = 16 hr - 2
T = 520 C, f.r. = 40mL/min, t = 16 hr - 3
113
Electrochemistry Tests Data
Figure A-4. Sample data for the EIS test.
area 0.9 cm
Zreal Zimag abs Zimag Zreal Zimag Zmod Zmod Phase Frequency
ohm ohm ohm ohm*cm^2ohm*cm^2 ohm kohm.cm^2 degree Hz
6.928785 -1.02216 1.022158 0.006236 0.00092 7.003776 0.006303 -8.39194 100078.1
6.673168 -1.0782 1.078203 0.006006 0.00097 6.759711 0.006084 -9.17813 72046.88
5.728737 -1.1837 1.183695 0.005156 0.001065 5.849749 0.005265 -11.6744 51796.87
6.804047 -0.45395 0.453952 0.006124 0.000409 6.819174 0.006137 -3.817 37359.37
6.929843 -0.51232 0.512321 0.006237 0.000461 6.948755 0.006254 -4.22817 26859.38
6.921384 -0.50763 0.507635 0.006229 0.000457 6.939975 0.006246 -4.19473 19359.38
6.822134 -0.45209 0.452093 0.00614 0.000407 6.837098 0.006153 -3.79137 13921.87
6.728172 -0.48395 0.483948 0.006055 0.000436 6.745554 0.006071 -4.11412 10078.13
6.275129 -0.47504 0.475039 0.005648 0.000428 6.293084 0.005664 -4.32914 7265.625
7.217964 -0.58371 0.583708 0.006496 0.000525 7.241527 0.006517 -4.62338 5203.125
7.390254 -0.7151 0.715096 0.006651 0.000644 7.42477 0.006682 -5.52685 3722.427
7.7707 -0.74495 0.744953 0.006994 0.00067 7.806327 0.007026 -5.47604 2659.255
7.230588 -0.67569 0.675687 0.006508 0.000608 7.262091 0.006536 -5.3387 1938.101
7.730915 -0.97981 0.97981 0.006958 0.000882 7.792758 0.007013 -7.22311 1397.236
7.996369 -1.09303 1.093028 0.007197 0.000984 8.070727 0.007264 -7.78356 998.264
8.018698 -1.08883 1.088833 0.007217 0.00098 8.092284 0.007283 -7.73272 724.4318
8.329007 -1.37899 1.378988 0.007496 0.001241 8.442391 0.007598 -9.40087 516.4195
8.507513 -1.77574 1.77574 0.007657 0.001598 8.690859 0.007822 -11.7899 370.0658
8.705528 -2.08518 2.085184 0.007835 0.001877 8.951772 0.008057 -13.47 268.9549
8.998635 -2.59978 2.599783 0.008099 0.00234 9.366659 0.00843 -16.1145 192.1107
9.336598 -3.05864 3.058638 0.008403 0.002753 9.82483 0.008842 -18.1386 137.8676
9.78171 -4.05559 4.055589 0.008804 0.00365 10.58913 0.00953 -22.5194 100.4464
10.01468 -5.23595 5.235946 0.009013 0.004712 11.30084 0.010171 -27.6018 71.74745
10.57831 -6.34126 6.341258 0.00952 0.005707 12.33338 0.0111 -30.9409 49.86702
10.86533 -8.02729 8.027286 0.009779 0.007225 13.50899 0.012158 -36.4569 37.20238
12.14579 -10.0063 10.00628 0.010931 0.009006 15.73677 0.014163 -39.4833 27.25291
13.19787 -13.461 13.46095 0.011878 0.012115 18.85155 0.016966 -45.5654 19.21107
14.02707 -17.289 17.28896 0.012624 0.01556 22.26358 0.020037 -50.9465 13.95089
15.31248 -22.7462 22.7462 0.013781 0.020472 27.42009 0.024678 -56.052 9.93114
16.9723 -29.7309 29.73088 0.015275 0.026758 34.23425 0.030811 -60.2795 7.233796
18.94289 -39.2043 39.2043 0.017049 0.035284 43.5409 0.039187 -64.2109 5.208333
21.5248 -52.0147 52.01469 0.019372 0.046813 56.2925 0.050663 -67.5192 3.75601
24.98598 -68.9444 68.94441 0.022487 0.06205 73.33234 0.065999 -70.0791 2.703287
30.27687 -93.4711 93.47105 0.027249 0.084124 98.2524 0.088427 -72.052 1.914828
36.77496 -123.656 123.6563 0.033097 0.111291 129.0088 0.116108 -73.4377 1.392602
45.85852 -165.442 165.4422 0.041273 0.148898 171.6803 0.154512 -74.5073 0.999041
58.37354 -219.875 219.8745 0.052536 0.197887 227.4912 0.204742 -75.1318 0.721154
75.76643 -292.079 292.0794 0.06819 0.262871 301.7465 0.271572 -75.4578 0.520833
100.5582 -388.555 388.5552 0.090502 0.3497 401.3565 0.361221 -75.4902 0.375
135.9879 -517.212 517.2122 0.122389 0.465491 534.7907 0.481312 -75.2689 0.269397
187.2055 -686.257 686.2574 0.168485 0.617632 711.3333 0.6402 -74.7414 0.193698
261.565 -909.291 909.2905 0.235409 0.818361 946.1635 0.851547 -73.9517 0.139095
365.0083 -1200.45 1200.446 0.328507 1.080401 1254.712 1.129241 -73.0876 0.10016
520.6399 -1584.17 1584.167 0.468576 1.42575 1667.529 1.500776 -71.8068 0.072005
740.5846 -2070.95 2070.948 0.666526 1.863853 2199.384 1.979446 -70.3226 0.051796
1060.707 -2692.92 2692.916 0.954636 2.423624 2894.286 2.604857 -68.5011 0.037291
1507.428 -3470.16 3470.158 1.356685 3.123142 3783.43 3.405087 -66.52 0.026832
2156.554 -4401.56 4401.563 1.940899 3.961407 4901.478 4.41133 -63.8974 0.019314
2970.146 -5535.44 5535.439 2.673131 4.981895 6281.946 5.653751 -61.7834 0.013897
4039.16 -6886.98 6886.979 3.635244 6.198281 7984.065 7.185659 -59.6087 0.010001
530, 40, 12, 20, S6, CO2 - 2
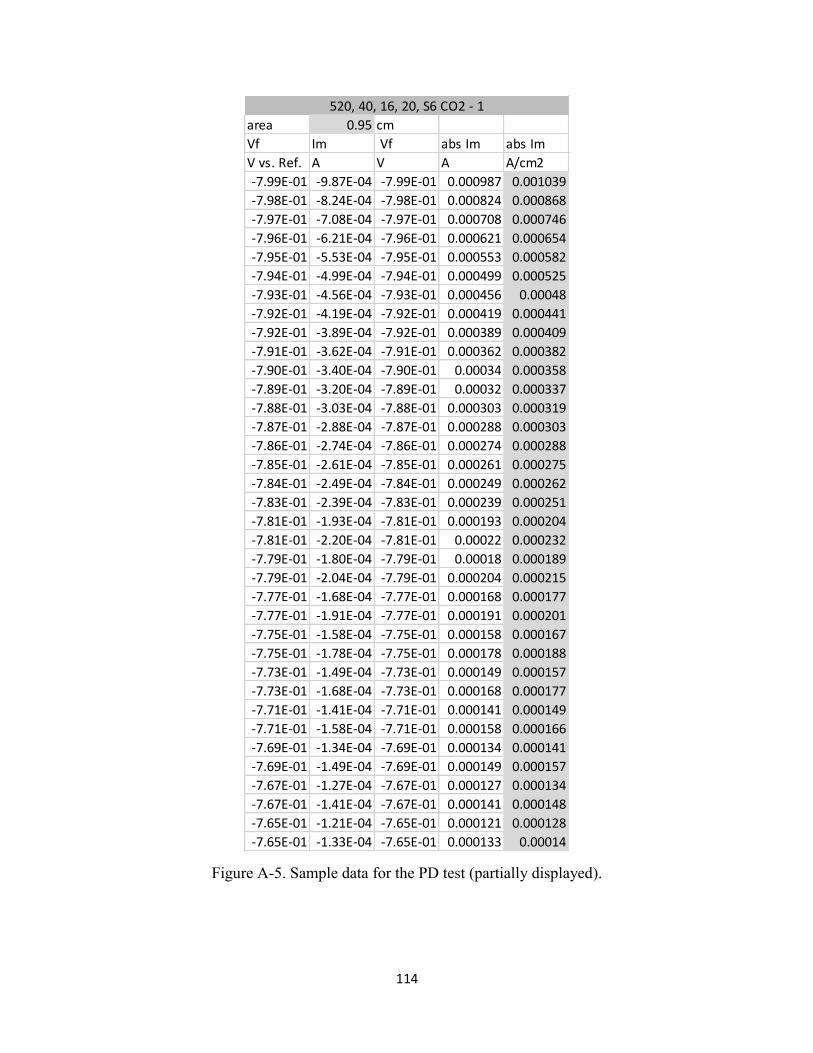
114
Figure A-5. Sample data for the PD test (partially displayed).
area 0.95 cm
Vf Im Vf abs Im abs Im
V vs. Ref. A V A A/cm2
-7.99E-01 -9.87E-04 -7.99E-01 0.000987 0.001039
-7.98E-01 -8.24E-04 -7.98E-01 0.000824 0.000868
-7.97E-01 -7.08E-04 -7.97E-01 0.000708 0.000746
-7.96E-01 -6.21E-04 -7.96E-01 0.000621 0.000654
-7.95E-01 -5.53E-04 -7.95E-01 0.000553 0.000582
-7.94E-01 -4.99E-04 -7.94E-01 0.000499 0.000525
-7.93E-01 -4.56E-04 -7.93E-01 0.000456 0.00048
-7.92E-01 -4.19E-04 -7.92E-01 0.000419 0.000441
-7.92E-01 -3.89E-04 -7.92E-01 0.000389 0.000409
-7.91E-01 -3.62E-04 -7.91E-01 0.000362 0.000382
-7.90E-01 -3.40E-04 -7.90E-01 0.00034 0.000358
-7.89E-01 -3.20E-04 -7.89E-01 0.00032 0.000337
-7.88E-01 -3.03E-04 -7.88E-01 0.000303 0.000319
-7.87E-01 -2.88E-04 -7.87E-01 0.000288 0.000303
-7.86E-01 -2.74E-04 -7.86E-01 0.000274 0.000288
-7.85E-01 -2.61E-04 -7.85E-01 0.000261 0.000275
-7.84E-01 -2.49E-04 -7.84E-01 0.000249 0.000262
-7.83E-01 -2.39E-04 -7.83E-01 0.000239 0.000251
-7.81E-01 -1.93E-04 -7.81E-01 0.000193 0.000204
-7.81E-01 -2.20E-04 -7.81E-01 0.00022 0.000232
-7.79E-01 -1.80E-04 -7.79E-01 0.00018 0.000189
-7.79E-01 -2.04E-04 -7.79E-01 0.000204 0.000215
-7.77E-01 -1.68E-04 -7.77E-01 0.000168 0.000177
-7.77E-01 -1.91E-04 -7.77E-01 0.000191 0.000201
-7.75E-01 -1.58E-04 -7.75E-01 0.000158 0.000167
-7.75E-01 -1.78E-04 -7.75E-01 0.000178 0.000188
-7.73E-01 -1.49E-04 -7.73E-01 0.000149 0.000157
-7.73E-01 -1.68E-04 -7.73E-01 0.000168 0.000177
-7.71E-01 -1.41E-04 -7.71E-01 0.000141 0.000149
-7.71E-01 -1.58E-04 -7.71E-01 0.000158 0.000166
-7.69E-01 -1.34E-04 -7.69E-01 0.000134 0.000141
-7.69E-01 -1.49E-04 -7.69E-01 0.000149 0.000157
-7.67E-01 -1.27E-04 -7.67E-01 0.000127 0.000134
-7.67E-01 -1.41E-04 -7.67E-01 0.000141 0.000148
-7.65E-01 -1.21E-04 -7.65E-01 0.000121 0.000128
-7.65E-01 -1.33E-04 -7.65E-01 0.000133 0.00014
520, 40, 16, 20, S6 CO2 - 1

115
Figure A-6. Sample data for XRD test (partially displayed).
2Theta (°) Intensity (%)
30 0
30.05 0
30.1 0
30.15 1.76678445
30.2 6.36042403
30.25 9.89399293
30.3 1.06007067
30.35 1.41342756
30.4 4.24028269
30.45 2.82685512
30.5 2.12014134
30.55 3.5335689
30.6 0.35335689
30.65 1.41342756
30.7 0.70671378
30.75 0.70671378
30.8 1.76678445
30.85 0.35335689
30.9 0
30.95 0
31 0.70671378
31.05 0
31.1 2.47349823
31.15 4.24028269
31.2 4.59363958
31.25 0
31.3 0.70671378
31.35 0
31.4 3.8869258
31.45 1.76678445
31.5 0
31.55 1.06007067
31.6 1.76678445
GN Before Test