the study on supporting system for local …open_jicareport.jica.go.jp/pdf/11897709_01.pdf3.3...
TRANSCRIPT

JAPAN INTERNATIONAL COOPERATION AGENCY (JICA)
MINISTRY OF NATURAL RESOURCES AND ENVIRONMENT
KINGDOM OF THAILAND
THE STUDY ON SUPPORTING SYSTEM FOR LOCAL ADMINISTRATIONS ON NATURAL RESOURCES AND
ENVIRONMENTAL MANAGEMENT IN THE KINGDOM OF THAILAND
Supporting Report Final Report
August 2008
Kokusai Kogyo Co., Ltd. EX Corporation
No.
GEJR
08-065

THE STUDY ON SUPPORTING SYSTEM FOR LOCAL ADMINISTRATIONS ON
NATURAL RESOURCES AND ENVIRONMENTAL MANAGEMENT
IN THE KINGDOM OF THAILAND
List of Volumes
Volume I Summary Volume II Main Report Volume III Supporting Report Volume IV Data Book
This is the Supporting Report.
Exchange Rate Used in the Report US$ 1.0 =33.8Baht、1 Yen =0.312 Baht

i
Contents
Page: Contents ....................................................................................................................... i Abbreviations.............................................................................................................. iv
Manual 1: Suggestion for Improvement of PEQMP-KPI
1 Introduction...................................................................1-1
1.1 Background of the Action Plan for Natural Resources and Environmental Management at Provincial Level (PEQMP-KPI) ......................................... 1-1
1.2 Principle and Importance of the Action Plan for Natural Resources and Environmental Management at the Provincial Level (PEQMP-KPI) ........ 1-1
1.3 Development Process of the Action Plan for Natural Resources and Environmental Management at the Provincial Level (PEQMP-KPI) ........ 1-2
1.3.1 Procedure of Formulating the PEQMP-KPI...................................................... 1-2 1.3.2 Sections of the PEQMP-KPI ............................................................................. 1-4 1.3.3 Details of Each Section of the PEQMP-KPI ..................................................... 1-4
2 Format of Action Plan for Natural Resources and Environmental Management at the Provincial Level (PEQMP-KPI) .............................................................1-14
2.1 Part 1 Introduction........................................................................................ 1-14 2.2 Part 2 Situation and Issues of the Province................................................. 1-20 2.3 Part 3 Detail of Action Plan for Natural Resources and Environment
Management in Provincial Level ................................................................. 1-38 2.4 Part 4 Annex .................................................................................................. 1-42
3 References .................................................................1-55
3.1 Reference 1: Vision, Goals, Issues and Direction of Measures for NREM in AYP................................................................................................................. 1-55
3.2 Reference 2: PDM for Program for Conservation and Rehabilitation of Aquatic Resources in SKP PDM .................................................................................. 1-57
3.3 Reference 3: Future Population Forecast for AYP by NESDB....................... 1-58 3.4 Reference 4: Forecast of GPP for AYP........................................................... 1-59 3.5 Reference 5: Future Generation of Municipal Waste in AYP......................... 1-60 3.6 Reference 6: Forecast of Future Medical Waste Generation in AYP.............. 1-61
3.7 Reference 7: Forecast of Future Industrial Waste(IW)Generation in AYP 1-61
3.8 Reference 8: Master Plans for NREM in State Level...................................... 1-63 3.9 Reference 9: Trend of Land Use Change in SKP............................................ 1-64 3.10 Reference 10: Change of Mangrove Forest Area ............................................ 1-65 3.11 Reference 11: Relation of Water Quality, Water Pollution Sources and Water
Utilization Facilities in AYP ........................................................................... 1-66

ii
3.12 Reference 12: Generation Amount of Hazardous Wastes in AYP ..................1-69 3.13 Reference13: Priority Setting of Issues in AYP ..............................................1-76 3.14 Reference 14: Selection of Priority Programs for AYP...................................1-80 3.15 Reference 15: Details of Priority Projects in SKP ...........................................1-81
Manual 2: Suggestions for Utilization of GIS Database on Natural Resources and Environmental Management (NREM)
1 GIS databases in the Ministry of Natural Resources and Environment (MNRE)....................................................2-1
1.1 Overall status of GIS databases......................................................................2-1 1.1.1 Management and use status of the NREM GIS database...................................2-4 1.1.2 Improvement of the NREM GIS database .........................................................2-4 1.1.3 Check the existing NREM GIS database ...........................................................2-5
2 Utilization of GIS DB for NREM ..................................2-10
2.1 Advantages and Disadvantages of using GIS data base for NREM..........2-11 2.2 Recommendations..........................................................................................2-11
3 Combination of Layers for presenting current situation of NREM .........................................................................2-12
3.1 Natural Resources..........................................................................................2-12 3.2 Environment...................................................................................................2-14
4 Training for NREM GIS data base ..............................2-19
4.1 Objective:........................................................................................................2-19 4.2 Results .............................................................................................................2-20
5 Programming manual .................................................2-21
5.1 GIS Database Application Manual for Ayutthaya Province (for GIS Database Manager)........................................................................................2-21
5.2 ArcReader Manual for Ayutthaya Province (for GIS Database User).....2-77 5.3 GIS Database Application Manual for Samut Songkhram Province (for GIS
Database Manager)........................................................................................2-93 5.4 ArcReader Manual for Samut Songkhram Province (for GIS Database
User) ..............................................................................................................2-151
Manual 3: Suggestion for Selecting Suitable Public Participation Methods for NREM
1 Introduction ...................................................................3-1
1.1 Public Participation in Plan Formulation......................................................3-1 1.2 Public Participation in Plan Implementation................................................3-1 1.3 Necessary Pre-Conditions for Public Participation ......................................3-1

iii
2 Methods of Public Participation ....................................3-2
2.1 Steps of Public Participation .......................................................................... 3-2 2.2 Methods of Public Participation..................................................................... 3-4 2.2.1 Participation in the PEQMP Formulation Committee....................................... 3-4 2.2.2 Participation through Stakeholder Surveys for Information and Opinions ....... 3-4 2.2.3 Participation in Formulation Committee Brainstorming Sessions .................... 3-7 2.2.4 Participation in the Revision Process of PEQMP.............................................. 3-7 2.2.5 Participation in Seminars................................................................................... 3-7 2.2.6 Participation in the Monitoring of Plan Implementation................................... 3-8 2.3 Reflecting Stakeholder Opinion onto PEQMP: An Example from AYP in
Deciding Priority Projects for NREM Administrative Capacity Improvement.................................................................................................... 3-8
2.4 Questionnaire Forms for Environmental Awareness Survey.................... 3-16 Sample Form 1 : Questionnaire for local residents and business establishments ........ S1-1 Sample Form 2 : Questionnaire for local administartions ........................................... S2-1 Sample Form 3 : Questionnaire for NGOs .................................................................. S3-1 Sample Form 4 : Question, opinion, and recommendation form for seminars ............ S4-1
iv
Abbreviations
AMP Administrative Management Plan (4 Year Plan) Amphoe District AP Action Plan AYP Phra Nakhon Si Ayutthaya Province BE Business Establishment CA Central Administration CD Capacity Development Changwat Province Chum chon Community CITC Center for Information Technology and
Communication CPEQMPF Committee for Provincial EQMP Formulation C/P Counterpart DBIS Database & Information System Section, ONEP DDPM Department of Disaster Prevention and Mitigation DEQP Department of Environmental Quality Promotion,
MNRE DF/R Draft Final Report DGR Department of Groundwater Resources, MNRE DIW Department of Industrial Works, MOIND DLA Department of Local Administration, MOI DMCR Department of Marine and Coastal Resources,
MNRE DMR Department of Mineral Resources, MNRE DNP Department of National Park, Wildlife and Plant
Conservation, MNRE DOPA Department of Provincial Administration, MOI DWR Department of Water Resources, MNRE EQM Environmental Quality Management EQMP Environmental Quality Management Plan GIS Geographical Information System GOJ Government of Japan GOT Government of Thailand IC/R Inception Report IPO Irrigation Project Office IT/R Interim Report JICA Japan International Cooperation Agency KPI Key Performance Indicator LA Local Administration MNRE Ministry of Natural Resources and Environment MOAC Ministry of Agriculture and Cooperatives MOC Ministry of Culture MOCm Ministry of Commerce MOD Ministry of Defense MOE Ministry of Education MOF Ministry of Finance MOPH Ministry of Public Health MOIND Ministry of Industry

v
MOI Ministry of Interior MOIT Ministry of Information Technology and
Communication MOJ Ministry of Justice MOLS Ministry of Labor and Social Securities MOSD Ministry of Social Development and Human
Settlement MOSTE Ministry of Science, Technology and Environment MOT Ministry of Transport MOTS Ministry of Tourism and Sports Mooban Village MS Meteorological Station National EQMP Environmental Quality Management Plan NESDB National Economic and Social Development
Board, Prime Minister’s Office NGO Non-Governmental Organization NREM Natural Resources and Environmental
Management NREM GIS Database
Natural Resources and Environmental Management GIS Database
ODP Local Administration Development Plan (Orborjor Development Plan)
ODPM Office of Disaster Prevention and Mitigation OJT On the Job Training ONEB Office of National Environment Board, ONEP ONEP Office of Natural Resources and Environmental
Policy and Planning, MNRE OP-BE-AYP (SKP)
Opinion Survey to Business Establishments in Ayutthaya Province (Samut Songkhram Province)
OP-LA-AYP (SKP)
Opinion Survey to Local Administration in Ayutthaya Province (Samut Songkhram Province)
OP-LP-AYP (SKP)
Opinion Survey to Local People in Ayutthaya Province (Samut Songkhram Province)
OP-NGO-AYP (SKP)
Opinion Survey to NGO in Ayutthaya Province (Samut Songkhram Province)
OPDC Office of Public Sector Development Commission, Prime Minister’s Office
OPS Office of Permanent Secretary, MNRE Orborjor PAO (Provincial Administrative Organization) Orbortor TAO (Tambon Administrative Organization) PA (Changwat) Provincial Administration PAO Provincial Administrative Organization PAgO Provincial Agricultural Office PA + LA Provincial Administration and Local Administration PCD Pollution Control Department, MNRE PDP Provincial Development Plan PEO Provincial Environmental Office PEQMP Provincial Environmental Quality Management
Plan PEQMP-KPI (Provincial APNREM)
Provincial Environmental Quality Management Plan for Key Performance Indicator

vi
PFO Provincial Fishery Office PHO Provincial Public Health Office PLO Provincial Livestock Office PMO Prime Minister’s Office P/R Progress Report Provincial APEQM
Provincial Action Plan for Environmental Quality Management
PWA Provincial Water Authority PWO Public Works and City Planning Office REO Regional Environmental Office Regional EQMP Regional Environmental Quality Management
Plan RFD Royal Forest Department, MNRE RID Royal Irrigation Department, MOAC St/C Steering Committee SKP Samut Songkhram Province SPDP Strategic Provincial Development Plan
(Governor's Budget) Tambon Sub-district TAO Tambon Administrative Organization Tessaban (Municipality)
There are three type of Tessaban as follows Tessaban Nakorn (City Municipality) Tessaban Mueang (Town Municipality) Tessaban Tambon (Sub-district Municipality)
Tessaban Nakorn City municipality Tessaban Mueang
Town Municipality
Tessaban Tambon
Sub-district Municipality
TOR Terms of Reference TWC Technical Working Committee WBS Well Being Strategy

Manual 1
Suggestions for Improvement of PEQMP-KPI Manual
Important Notice
The Action Plan Handbook for Natural Resources and Environmental Management at the Provincial Level (hereinafter called as PEQMP-KPI Manual) has been published by ONEP/MNRE in order to facilitate the formulation of the Provincial Environmental Quality Management Plan (PEQMP) for KPI in 2007 by each province. Based on the PEQMP-KPI Manual, all provinces in Thailand formulated their PEQMP-KPI and submitted them to the MNRE by December 2007. The PEQMP-KPI Evaluation Committee in MNRE evaluated these PEQMP-KPI and made comments for their improvement, including AYP and SKP. The JICA Study Team collaborated with the counterparts (C/P) of the study -- ONEP and PEO staff from AYP and SKP -- on the revision of submitted PEQMP-KPI.
While the PEQMP-KPI Manual has been prepared very well, the Study Team still found some room for improvement in the PEQMP-KPI Manual during the process of revision with their C/P. This Annex presents such suggestions for improvement of the PEQMP-KPI Manual, in order of the contents of the original version.

The Study on Supporting System for Administrations on JICA Natural Resources and Environmental Management Kokusai Kogyo Co., Ltd. in the Kingdom of Thailand Ex Corporation
1-1
1 Introduction
1.1 Background of the Action Plan for Natural Resources and Environmental Management at Provincial Level (PEQMP-KPI)
The central and local administrations are required by the Act of Administration Policy, Issue 5 (2002), Strategic Plan of Thai Administration Development (2003) and Royal Decree on Good Governance in 2004 to assess yearly activities by using the Key Performance Indicator (KPI) to measure the efficiency of their actions taken.
The Office of the Public Sector Development Commission (OPDC) has shown improvement in the indicator of natural resources and environmental management since fiscal year 2006 to 2007. In the same way as the Ministry of Natural Resources and Environment (MNRE) has done to support the plan, in order to emphasize the importance of natural resources and environmental management, and as a factor in possessing an adequate philosophy for long term development, the development of an action plan for Provincial natural resources and environmental management (PEQMP-KPI) has been assigned as one of the indicators of the fiscal year 2007 of each province.
To ensure efficiency in PEQMP-KPI formulation, MNRE has assigned the Office of Natural Resources and Environmental Policy and Planning (ONEP) to produce a PEQMP-KPI Manual. This Manual will be given to the government sectors in all of the provinces: i.e. Office of the Governor and environmental offices of each province. This manual will be used for the formulation of PEQMP-KPI by each province and utilized as part of the strategy of provincial development.
1.2 Principle and Importance of the Action Plan for Natural Resources and Environmental Management at the Provincial Level (PEQMP-KPI)
The PEQMP-KPI is a master plan for natural resources and environmental management (NREM) in the province. It will be used as a tool to preserve and rehabilitate the natural resources and environment of the province in a proper way, and while taking into account the current conditions. It will stand as the model plan for provincial NREM for a 4 year period (2008-2011).
The main considerations in developing the PEQMP-KPI are the Area-Based Approach and the unification and sharing of environmental information for the prosperity of all, with the aim to satisfy the demands expressed by the people and direction of economic and social developments. The 4-year budget plan should be made concurrently with the PEQMP-KPI. The target of the PEQMP-KPI will be its successful implementation, with the central administration, provincial administration, local administration and residents each satisfying their duties and responsibilities.
The PEQMP-KPI is connected with other plans at various levels, including those plans of agencies related to natural resources and environment in all levels as shown in Figure 1 as follows:

The Study on Supporting System for Administrations on JICA Natural Resources and Environmental Management Kokusai Kogyo Co., Ltd. in the Kingdom of Thailand Ex Corporation
1-2
National Level /Central Administration
Regional Revel
Provincial Level
Local Level
The Enhancement and Conservation of National Environment Quality Act
(1992)
Policy and National Plan for Environmental Quality Promotion and
ConservationYear 1997 - 2011
Environmental Quality PlanYear 2007 - 2011
National Strategy
Government’s Policy
National Economic and Development Plan No. 10
Year 2007 - 2011
Public Administration Plan
Implementation Plan of Agencies
MNRE
Other related agencies such as MOI, MOIND, MOAC, MOPH, etc.
Regional Environmental Quality Management Plan (REO)
Regional Administrative Action Plan
(Regional Government Agencies))
Provincial Action Plan for Environmental Quality Management (Article 37)
Action Plan for Natural Resources and Environmental Management in Provincial Level (Indicator of KPI (PEO))
Strategy for Provincial Development / Provincial Cluster (Provincial Office for Strategy of Provincial
Development)
Local Development Plan (Orborjor, Tessaban, Orbortor)
Figure 1: Inter-relationship of All Plans and Related Agencies for Natural Resources and
Environment at All Levels
1.3 Development Process of the Action Plan for Natural Resources and Environmental Management at the Provincial Level (PEQMP-KPI)
1.3.1 Procedure of Formulating the PEQMP-KPI
The procedure to develop the PEQMP-KPI consists of the following 7 steps as shown on the figure below:

The Study on Supporting System for Administrations on JICA Natural Resources and Environmental Management Kokusai Kogyo Co., Ltd. in the Kingdom of Thailand Ex Corporation
1-3
1. Setting up the working group to formulate the action plan
2. Accumulating the information
3. Making the priority of the problem
4. Potential Province Analysis by SWOT Analysis
5. Making the action plan for natural resources and environmental management in provincial level
6. Presenting the action plan to the governor for acknowledgement
7. Sending the action plan to Permanent Secretary Office of the MNRE
Figure 2: Procedure to develop the PEQMP-KPI
The procedure to develop the PEQMP-KPI is described as follows:
1) Setting up the Working Committee to make the PEQMP-KPI
In order to effectively formulate the PEQMP-KPI, a working committee should be specially appointed to formulate the plan. The working committee should be comprised of representatives from all related agencies in suitable numbers. The working committee may entrust the governor to be the chairman and members can come from related agencies such as REO, Provincial Agricultural Office, Provincial Public Health Office, Provincial Industrial Office, and Provincial Local Administration Office, and can include representatives from local administrations, educational institutes and other agencies as needed. The PEO can be appointed as a member and secretary of the committee.
2) Accumulating the Data
The two important types of data which are to be accumulated and studied are 1) basic data of the province and 2) natural resources and environment (NRE) data. These data will be used to analyze the issues and impacts from socio-economic development.
3) Prioritizing the Issues
Issues related to NRE need to be prioritized for issue prevention, or urgent solution of the issue if need be. Criteria used to consider the importance of the issue will also be used to set

The Study on Supporting System for Administrations on JICA Natural Resources and Environmental Management Kokusai Kogyo Co., Ltd. in the Kingdom of Thailand Ex Corporation
1-4
priority. Then, each item will be given an appropriate score, weighted in order to find the total score, and then the priorities shall be set.
4) Province Potential Analysis by SWOT Analysis
The SWOT analysis shows the potential of a province. It is comprised of analysis in four fields: Strengths, Weaknesses, Opportunities and Threats. Not only will internal factors in a province be considered, but also external factors outside the province related to the formulation of PEQMP-KPI shall be considered.
Internal factors in the province are provincial administration structure, regulation, law, staff, budget, database, coordination, cooperation, equipment and tools, etc.
External factors out of province are economic, social, and political factors, government policy, law and technology, etc.
5) Making the PEQMP-KPI
After grasping the issues, the PEQMP-KPI can be formulated. It should contain as its contents the objective, target, strategy, plan/project/activity, budget and budgetary source, responsible person(s) and/or resource in each project or activity, output of each project or activity, evaluation indicator of each project or activity, and supporting tool to proceed to plan implementation and monitoring and evaluation.
6) Presenting the PEQMP-KPI to the Governor for Acknowledgement
According to KPI regulations, the PEQMP-KPI must be submitted to the governor for acknowledgement after completion, before it is sent to the Permanent Secretary of MNRE.
7) Sending the PEQMP-KPI to Permanent Secretary Office of MNRE
After receiving acknowledgement of the governor, four sets of the PEQMP-KPI should be submitted to the Permanent Secretary of MNRE for collection and consideration.
1.3.2 Sections of the PEQMP-KPI
The PEQMP-KPI is compromised of four important parts:
Part 1 Introduction
Part 2 Situation and Issues of NREM
Part 3 Details of the Provincial NREM Plan
Part 4 Annex
1.3.3 Details of Each Section of the PEQMP-KPI
The details for each section of the PEQMP-KPI are as follows:
Part 1 Introduction This is the first part of the PEQMP-KPI which contains an introduction signed by the governor and a list of the working committee members for formulation of the PEQMP-KPI.
Part 2 Situation and Issues of NREM

The Study on Supporting System for Administrations on JICA Natural Resources and Environmental Management Kokusai Kogyo Co., Ltd. in the Kingdom of Thailand Ex Corporation
1-5
1) Basic Data of the Province
Include points of information that involve the province, i.e. basic information, demographic, economic, and social information, etc. Such information will be useful in order to analyze the importance and cause of the issues.
<Suggestion>
Since growth estimation of population and economy are fundamental indices for planning master plans such as the PEQMP-KPI, it should be included together with the issues on population and economy, based on past trends and future forecasts. The past trends and future forecasts should be used for the analysis of the impacts of socio-economic development.
2) Situation of Natural Resources and Environment in the Province
Analyze the current conditions of natural resources and environment (NRE) using the latest or current quantitative or qualitative information. The following information on NRE content should be covered.
2.1 Natural resources
- Soil and land resources
- Forest resources and wildlife
- Water resources
- Mineral resources
- Marine and coastal resources
- Biodiversity
2.2 Environment
- Water quality
- Air quality
- Noise and vibration
- Solid waste
- Hazardous waste and toxic substances
- Urban environment
- Natural and cultural assets
The following data should be included concerning NRE in the province:
- Include any obvious issues and their causes, e.g. issues of NRE or deterioration of certain types of resources, by explaining the issues together with statistics from at least the past five years.
- Include any past action by related organizations, e.g. government agencies, private organizations, provincial administrative organizations and others, and describe how they have dealt with issues and difficulties when performing the action.

The Study on Supporting System for Administrations on JICA Natural Resources and Environmental Management Kokusai Kogyo Co., Ltd. in the Kingdom of Thailand Ex Corporation
1-6
The following information will be used to conduct analysis:
- Situation (this may include information or data records)
- Issues
- Causes
- Impact
- Prevention measurement and solving past issues
<Suggestion>
Although the Manual in this section clearly instructs that the analysis of NRE must include the current situation, issues, causes, impact, prevention measures, and methods used to solve issues in the past, AYP and SKP submissions were limited to the simple presentation of current and past data (i.e. situations past and present). Their omission of the more analytic segments may have been caused by the instructions in Chapter 2: Format of PEQMP-KPI, which gives only some, and not all, of the formats necessary to answer the above requirements. In order to avoid such errors in the future, it is suggested that Chapter 2 of the Manual include reminders of analysis topics and methods in addition to formats, and that the title of this section be changed to ‘Situation and Issues of Natural Resources and Environment in the Province’.
It is also suggested that the analysis of NRE should be made sector by sector, with the narrative description presented together with spatial or Area-Based content (i.e. figures and tables) to deepen the readers’ understanding. And, most importantly, it is necessary to mention various ‘measures to be taken’ in this section, as these can only be understood together with a discussion of the current situation, and following the analytic arguments of this section (see also <Suggestions> in following section).
3) Analysis of Current Issues and Impact from Economic and Social Development
• Analyze and evaluate the issues of NRE
• Indicate the area of crisis or hazard, and the specific problem, such as the effect of the crisis/hazard on natural resources and environment
• Include future predictions of the effects of the issue, from the quantitative and qualitative information of the NRE
• Show the impact of the issue in areas such as natural resources, environment, economy, society or public health
<Suggestion>
The instructions in Chapter 2: Format of PEQMP-KPI first require the user to conduct ‘analyses of current issues and the impact from socio-economic development’, and then, following the analyses, the preparation of summary tables of these analyses grouped into two categories; ‘natural resources’ and ‘environment’. However, submissions by AYP and SKP were limited to summary tables.

The Study on Supporting System for Administrations on JICA Natural Resources and Environmental Management Kokusai Kogyo Co., Ltd. in the Kingdom of Thailand Ex Corporation
1-7
First of all, the ‘analyses of current issues and the impact from socio-economic development’ (as required in this section) should be re-styled as ‘measures to be taken’ and discussed as a narrative together with ‘current situation, cause, prevention measures and methods used to solve issues in the past’ (as required in the previous section), in the previous section itself (section 2: Situation and Issues of Natural Resources and Environment in the Province). As mentioned previously (see <Suggestions> in previous section), such analyses logically follow a description of the situation and issues, and must be presented together to increase the reader’s understanding.
It should be noted that the re-styling of the contents required in this section (‘analyses of current issues and the impact from socio-economic development’) to ‘measures to be taken’ will, in effect, be equivalent to discussing the contents of section 6 (Preventive Measures and Solutions for Problems) in this earlier section. This is a perfectly logical organizational improvement, as the discussion in section 6 should really be limited to priority sectors decided upon after sections 4 and 5, where priorities are set. The general discussion of all possible measures including those for non-priority NREM sectors belong in this earlier section (see also <Suggestions> to section 6 below).
Our second suggestion for this particular section is to keep it, as it was in AYP and SKP submissions, in simple table format. Each NREM sector should be presented within the two categories suggested in the Manual (‘natural resources’ and ‘environment’). In short, this section will provide a summing-up of the detailed information presented in the previous section (Situation and Issues of Natural Resources and Environment in the Province).
Thirdly, it must be noted that while the PEQMP target year is 2011, many ‘measures to be taken’ will require a longer time frame. The ideal state of NREM in the province, which is reached through the implementation of all the suggested ‘measures to be taken’, can be depicted through a presentation of abstracted ‘Vision, Goals, and Strategies’, and through this exercise, interrelationships between the various ‘measures to be taken’ will be clarified.
The opinion has been voiced that the setting of such Visions, Goals, etc. requires thorough debate by stakeholders and thus should not be required as part of the PEQMP-KPI. While this opinion is valid, we still suggest that it is desirable for the Manual to suggest that ‘Vision, Goals, and Strategies’ be presented as a single diagram, depicting the long-term plan of the province. The figure should be titled ‘Vision, Goals, Issues, and Direction of Measures for NREM in the Province’. See Reference 1: Vision, Goals, Issues and Direction of Measures for NREM in AYP
To clarify the suggestions discussed above:
• Use the table format required in the Manual, but add a ‘measures to be taken’ column to the table in the Manual, and summarize the narrative content of the previous section by this table.
• Then summarize the table itself with a figure called ‘Vision, Goals, Issues, and Direction of Measures for NREM in [province]’, using the contents of the ‘Issues’ and ‘Measures to be taken’ columns.
4) Prioritizing the Issues
• Consider the importance of an issue from the following standards:

The Study on Supporting System for Administrations on JICA Natural Resources and Environmental Management Kokusai Kogyo Co., Ltd. in the Kingdom of Thailand Ex Corporation
1-8
- The seriousness of the issue
- Difficulty/ease to solve the issue
- Accordance with policy or strategy
- Cooperation of people, etc.
• The issues are weighted from the standard by considering importance from all methods, such as:
(1) The seriousness of the issue weight = 4 (2) Difficulty/ease to solve the issue weight = 2 (3) Accordance with policy or strategy weight = 3 (4) Cooperation of people weight = 3
• Standardize the score from each standard by considering the importance and the instance to protect and solve the issue from the score, first to last such as:
Level 1 low seriousness = 1
Level 2 medium seriousness = 2
Level 3 high seriousness = 3
• Scoring each issue according to the standard
• Giving a score and multiplying by the weight number
• Summarize the score to set the importance of the issue from first to last
<Suggestion>
There are many issues that must be worked on to realize an ideal NREM of the province. This section should discuss priority among issues raised in the previous sections, especially priority issues that should be solved by the target year of PEQMP-KPI, year 2011.
It is recommended to conduct an opinion survey among all stakeholders, as follows the National EQMP directive, to reflect the opinions of as many stakeholders as possible. We suggest that priorities are set based on opinion surveys among stakeholders together with the analysis in this section.
5) Analyze the Potential of the Province by SWOT Analysis
There are a number of factors from both inside and outside the province that could impact provincial environmental management, and also impact the strategic plan and the measure of the PEQMP-KPI. For this reason, it is important to analyze the surrounding factors and the method of environmental management in the province and come to an understanding of the Strengths (S), Weaknesses (W) and Opportunities (O) and Threats (T) to summarize the analysis and find a method to solve the issues and make the PEQMP-KPI.
5.1) Analyze the Strengths; S
Consider the internal factors of the province by evaluating the advantages or strengths that can reinforce the action and lead to success.

The Study on Supporting System for Administrations on JICA Natural Resources and Environmental Management Kokusai Kogyo Co., Ltd. in the Kingdom of Thailand Ex Corporation
1-9
5.2) Analyze Weaknesses; W
Consider the internal factors of the province by evaluating the disadvantages or weaknesses that may pose difficulties or issues for the action to be successful.
5.3) Analyze the Opportunities; O
Analyze the external factors of the province by seeking the opportunities that might be useful to perform the action and lead to success.
5.4) Analyze the Threats; T
Analyze the external factors of the province by estimating any threats or conditions that might limit or block the work from being successful.
Sample of Province Potential Analysis is shown in Annex C.
Province Potential Analysis Method
1) Consider what factors are strengths, weaknesses, opportunities and threats which may impact NREM of the province.
2) Arrange all factors from No. 1 into a table and classify them into internal factors and external factors of the province.
3) Give a weighted score to each factor. There may be factors from various aspects, so that, for example, a provincial database could receive weight as a Strength and a Weakness at the same time. The weighted score should be divided into four levels. Each level should have a score, such as:
Weighted Strengths (S) If Many = 3, Medium = 2, Few = 1, None = 0 Weighted Weaknesses (W) If Many= -3, Medium= -2, Few = -1, None = 0 Weighted Opportunities (O) If Many = 3, Medium = 2, Few = 1, None = 0 Weighted Threats (T) If Many= -3, Medium= -2, Few = -1, None = 0
4) Sum the weighted score of each factor.
5) Calculate the average score of each factor by dividing the total score by the number of factors to be considered.
6) Add the average score of each factor to calculate an average score of the total number of internal and external factors. The average score will thus be compromised of two values.
7) Use the average score of No. 6 for internal factors to plot the X axis of a graph (WS), and the average score for external factors use to plot the Y axis of the graph (OT).
8) Draw a line from the X and the Y axis where they meet each other. It will show one point.
9) The point of No. 8 should be interpreted in accordance with the four parts of the graph. The potential of the province can be summarized as follows:
9.1 Upper right part shows “Opportunities” and “Strengths” (O, S), meaning the plan has a good future and should be supported and expanded more.

The Study on Supporting System for Administrations on JICA Natural Resources and Environmental Management Kokusai Kogyo Co., Ltd. in the Kingdom of Thailand Ex Corporation
1-10
9.2 Lower right part shows there are “Threats” but there are also “Strengths” (T, S), meaning the plan has potential. Here, the problem should be solved first and then later the plan can be expanded upon.
9.3 Lower Left part shows “Threats” and “Weaknesses (T, W), meaning the plan has potential but cannot be expanded more. It should be done only if necessary or operations should be halted and replaced with another activity which has a better future.
9.4 Upper Left part shows there are “Opportunities” but there are also “Weaknesses” (O, W) meaning there is ambiguity for what should be done as the next step. Therefore, the plan should be reviewed, solving weaknesses because there is still opportunity.
6) Prevention Measures and Solutions for Problems
Issues are summarized by creating steps according to the importance and then the efficiency of the province is analyzed. After that, current information is used to seek a way to protect and solve any problems. Then make the PEQMP-KPI in the next step according to the work plan/project/activities to solve the issue immediately.
<Suggestions>
Resources available in a province are limited, and time is limited as well by the PEQMP-KPI target year of 2011. Due to these limitations, issues which can be solved by the target year are also limited in number.
We suggest that this chapter should be limited to priority issues discussed in section 4 (Prioritizing the Issues) that must be implemented prior to 2011. Discussion of non-prioritized sectors should be put in section 3 (Analysis of Current Issues and Impact from Economic and Social Development) (as explained above, see <suggestions> in section 3).
In conclusion, it is suggested that the title of this section be changed to “Selection of Priority Programs”.
Part 3 Details of PEQMP-KPI To formulate the PEQMP-KPI, it must contain details of the plan from 10 aspects.
1) Objective of the Plan
Include the objective of the plan for management, reduction, protection and/or solution of the issue and impact to NRE. The objective should be congruent with other issues in the province and the Environmental Quality Management Plan of 2007-2011.
2) Target of the Plan
Include the target of the plan in terms of how it will be possible to protect, solve environmental problems, or reduce pollution to the standard level, not cause pollution problems to the community, etc. Also include the appropriate time that should be designated to perform the action.

The Study on Supporting System for Administrations on JICA Natural Resources and Environmental Management Kokusai Kogyo Co., Ltd. in the Kingdom of Thailand Ex Corporation
1-11
A well-phrased target should contain the following information:
1) Clarity – Should clearly indicate what results are desired after completing the action by showing quantitative and qualitative information
2) Time – Must include the period of time designated to reach the goal
3) Place – Must include the area where the action is to be performed
4) Possibilities – Should include the possible objective and be in congruence with the Environmental Quality Management Plan of 2007-2011
3) Strategic Plan to Solve the Problem
The strategy under the PEQMP-KPI must show the main strategic method chosen by the province. To determine what direction to take that would be suitable towards the problem, it should be congruent with the objective and target and reach the assigned visions. In any case, the strategy must consider unification of everyone in society because they act as efficient power to steer and support the strategy to success.
4) Work Plans/Projects/Activities
The plan under the PEQMP-KPI should contain work plans that are parallel to the objective and target. The plan can be assigned from the issue, such as a natural resources plan, environmental plan or making the monitoring and awareness plan, rehabilitation and renovation plan, etc.
In any case, the plan can be changed depending on local current conditions and circumstances of each province.
Overall look for the project/activities under the strategy to make the action possible.
• Project /activities should be analogous with the PEQMP-KPI from the steps of importance of the problems
• Project /activities should be analogous with the Environmental Quality Management Plan of 2007-2011
• Project /activities should have good and enthusiastic management
• Project/activities should not be duplicate or receive funding from elsewhere
5) Funding and Funding Source
Funding, the funding source and expenditure for plan/project items performed under the PEQMP-KPI should be summarized in every plan in fiscal year 2008-2011 in order to show the cost or money from each source, from the budget of the province and local administration, etc., including the annual budget from the government. The details must be written separately to show project preparations, options of the project and details of the basic information of the project, and include the budget and source from the province or other places.
6) The Organization in Charge and/or Resources in each Project or Activity
Include the organization that will be in charge so that the project or activities may be planned, and results of the plan may be easily updated. Only one organization may be included or more depending on the hazard of the issue or characteristics of project/activities, including the appropriateness of the area of each province. In any case, this section will include the resources that are needed to perform the project or activities.
The Study on Supporting System for Administrations on JICA Natural Resources and Environmental Management Kokusai Kogyo Co., Ltd. in the Kingdom of Thailand Ex Corporation
1-12
7) The Character of Each Project or Activity
Include the achievements that are expected to happen after the project or activity is performed in order to analyze the success of the project or activities. The output can possess many characteristics, such as:
1) Quantitative Output
2) Qualitative Output
or, both may be included.
8) Indicator of the Success of the Project/Activities
Include the indicator used to evaluate whether or not the action result can fulfill the objective or not. It can be any of the indicators or can be both such as:
1) Indicator of the result
2) Indicator of the process
9) The Device to Support the Plan Towards Action
Include the measure or method that will be used to adapt the plan into action, including the time period of the action. Also, this section must include the organization that will be responsible for adapting the plan. It may be proposed that the working committee that makes the plan takes responsibility or set up a new working committee.
10) Monitoring and Evaluation
This is to determine the apparatus or device of management used to measure the progress or success of the project, including checking the problems or difficulties during performance of the action.
• Include the method and boundaries of the evaluation
• Include the method and the period of the evaluation
In any case, the evaluation will mostly be done after completing the project or may be evaluated at any time during three periods:
1) Evaluation before starting the project
2) Evaluation while performing the action of the project
3) Evaluation standard after completion of the project
Include the people of will evaluate the PEQMP-KPI. It may be proposed that this will be the working committee which made the plan or set up a new working committee.
The summary of evaluation can be separated into 3 incidents as:
1) If the result is the same as the standard or the indicator surpasses the standard
2) If the result is different from the standard or indicator but tends to be close to the indicator, meaning it might pass the standard
3) If the result is different from the standard or indicator and not even close to the indicator, meaning it will not pass the standard
<Suggestions>

The Study on Supporting System for Administrations on JICA Natural Resources and Environmental Management Kokusai Kogyo Co., Ltd. in the Kingdom of Thailand Ex Corporation
1-13
It might be quite hard for a province to fulfill all the requirements stated above without a master plan for each sector of NREM in the province. Frankly, a detailed discussion of these required ten aspects is impossible without in-depth studies being conducted first in each sector. In the absence of detailed master plans, it is suggested that a PDM (Project Design Matrix) format be used. Incidentally, the AYP and SKP submissions used the table format suggested in the Manual but its contents were criticized as hard to understand, and this is another reason we suggest the use of PDM.
A PDM format will show the relationship of individual Priority Project plans (=Work Plan/Project/Activities) and how they may be grouped under a larger Priority Program (=Strategic Plan to Solve the Issues) in a sector. PDM formats also allow the other requirements (e.g. Funding and Funding Source, Organization in Charge, Indicator of the Success of the Project/Activities, and Device to Support the Plan Towards Action) to be shown in a single matrix/table. See Reference 2: PDM for Program for Conservation and Rehabilitation of Aquatic Resources in SKP PDM.
We also suggest that this section include an Implementation and Budget Plan for each Priority Project, as shown in Table 2-28: Summary of Plan/Project/Budget/Time Period and Responsible Agency.
.
Part 4 Annex For the completion and correction of the PEQMP-KPI, the province can put information and documentation from the development process of the PEQMP-KPI report in the addendum:
• Details of the project of the province such as title of the project, people in charge, principle and reason, objective, target, compatible policy/strategy activities and their relationship, the time period of the project and the method by which the action will be performed, the area where the action will be performed, budget, compensation of the project, management, the evaluation and estimated advantage
• Photographs of performing the project/activities
• Reports from the meeting/seminar
• Other papers from related performance
• Etc.

The Study on Supporting System for Administrations on JICA Natural Resources and Environmental Management Kokusai Kogyo Co., Ltd. in the Kingdom of Thailand Ex Corporation
1-14
2 Format of Action Plan for Natural Resources and Environmental Management at the Provincial Level (PEQMP-KPI) The format to be used for the Action Plan for Natural Resources and Environmental Management at the Provincial Level (PEQMP-KPI) is comprised of the following four parts:
Part 1 Introduction
Part 2 Situation and Issues of the Province
Part 3 Details of PEQMP-KPI
Part 4 Annex
Each part is comprised of the following details.
2.1 Part 1 Introduction
The first part of PEQMP-KPI is comprised of two categories as follows:
Category 1: Introduction signed by the Governor
Category 2: Appointment of Working Committee to formulate the PEQMP-KPI. Member and duties of the committee should be appropriate according to each province.
Data in each category can be done as shown in the following sample.

The Study on Supporting System for Administrations on JICA Natural Resources and Environmental Management Kokusai Kogyo Co., Ltd. in the Kingdom of Thailand Ex Corporation
1-15
Provincial Environmental Quality Management Plan
Year 2008-2011
Province…………………………
Year 2007

The Study on Supporting System for Administrations on JICA Natural Resources and Environmental Management Kokusai Kogyo Co., Ltd. in the Kingdom of Thailand Ex Corporation
1-16
Part 1 Introduction

The Study on Supporting System for Administrations on JICA Natural Resources and Environmental Management Kokusai Kogyo Co., Ltd. in the Kingdom of Thailand Ex Corporation
1-17
Introduction Signature………………………………… ( ) Governor…………………… Date……….Month………………..Year……

The Study on Supporting System for Administrations on JICA Natural Resources and Environmental Management Kokusai Kogyo Co., Ltd. in the Kingdom of Thailand Ex Corporation
1-18
(Sample)
Order………………………. No……………………
Subject: Appointment of Committee to Formulate Provincial Environment Quality Management Plan (PEQMP-KPI)
Member 1. Governor Chairman of Committee 2. Deputy Governor Sub-Chairman of Committee 3. Director of REO Member 4. Provincial Local Administration Member 5. Provincial Public Health Office Member 6. Provincial Industry Office Member 7. Provincial Agriculture Office Member 8. Mayor of Orborjor Member 9. Representative of Tessaban Member 10. Representative of Orbortor Member 11. Representative of Educational Institute Member 12. Representative of NGO Member 13. Representative of Private Development Member
Organization or the Public 14. Chief of Provincial Office Member 15. Chief of PEO Member and Secretary
Power and Duties
1) Formulate Action Plan for Natural Resources and Environment Management at the Provincial Level (PEQMP-KPI) in order to propose to the Governor within the fixed time.
2) Coordinate with related agencies both in government and private to collect data for formulation of PEQMP-KPI
3) Appoint Task Committee to support the formulation of the PEQMP-KPI as suitable.
Order on Date…………………………………… (Signature)……………………………. Governor
Remark: 1) Working Committee and Power and Duties can be changed or added/reduced in order as appropriate to each province.
2) Advisor can be appointed to give additional advice.

The Study on Supporting System for Administrations on JICA Natural Resources and Environmental Management Kokusai Kogyo Co., Ltd. in the Kingdom of Thailand Ex Corporation
1-19
Part 2 Situation and Issues of Province

The Study on Supporting System for Administrations on JICA Natural Resources and Environmental Management Kokusai Kogyo Co., Ltd. in the Kingdom of Thailand Ex Corporation
1-20
2.2 Part 2 Situation and Issues of the Province
The data related to the current conditions and issues of the province should include the following topics:
1) Basic Data of the Province
The basic data of the province should be included, such as physical condition data, population data, economic data, and social data. However, reference should be given to the source of the data.
a. Physical Condition
Location Latitude……………degree…………..Lipda
Longitude……………degree…………Lipda
Provincial Boundary
• Location
North to……………………..
South to……………………..
East to……………………..
West to……………………..
• Shown on a map, with scale and direction clearly visible. It must have provincial and district boundaries or clearly show symbols of important places and transportation routes.
Provincial Area
• Whole area of province……………sq. km. (…………..Rai)
Topography
• Topographic area (mountain/valley/highland/highland and upland /plain area /coast /sea /island)
• Slope (direction and distance)
• Above Mean Sea Level (meter)
Climate
• Temperature Annual lowest………………degrees Celsius
• Annual highest……………..degrees Celsius
• Annual average…………….degrees Celsius
• Annual average rainfall…………….mm/year
• Humidity Average…………….%
b. Population Data
The population data of the past 5 years should be recorded. It should have demographic data including the population number, classification by age, non-registered population and population density.
The Study on Supporting System for Administrations on JICA Natural Resources and Environmental Management Kokusai Kogyo Co., Ltd. in the Kingdom of Thailand Ex Corporation
1-21
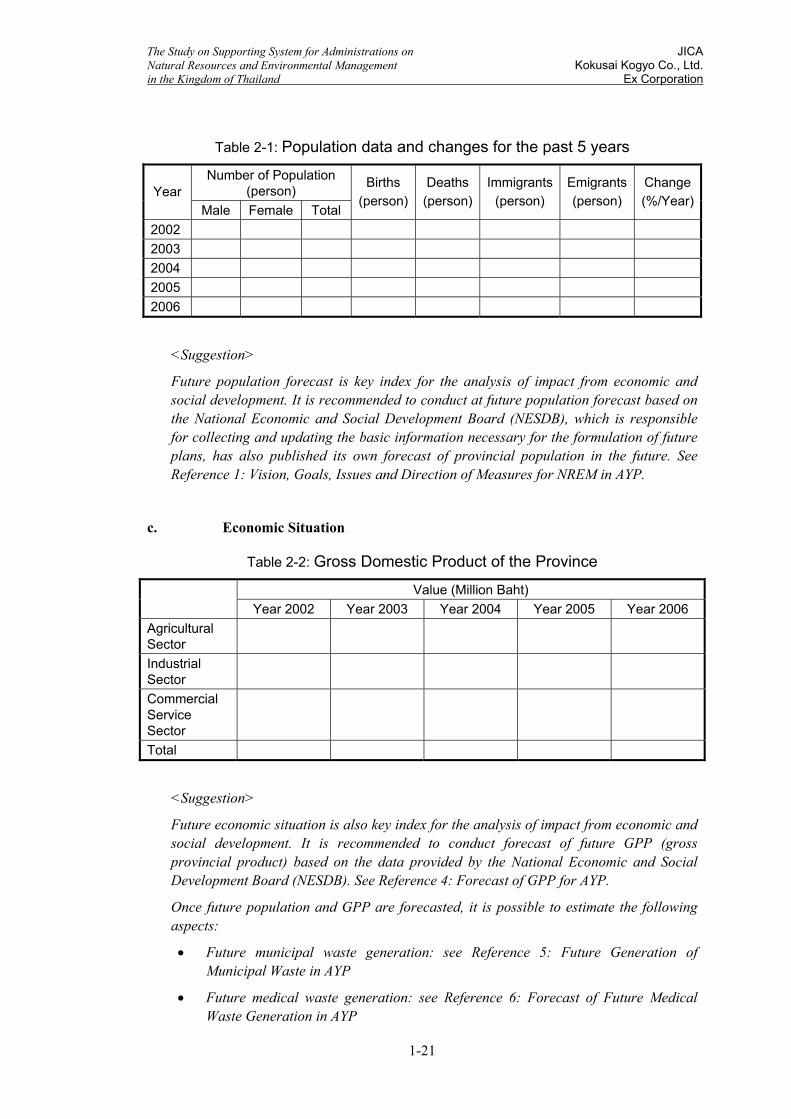
Table 2-1: Population data and changes for the past 5 years
Number of Population (person) Year
Male Female Total
Births (person)
Deaths(person)
Immigrants(person)
Emigrants (person)
Change(%/Year)
2002 2003 2004 2005 2006
<Suggestion>
Future population forecast is key index for the analysis of impact from economic and social development. It is recommended to conduct at future population forecast based on the National Economic and Social Development Board (NESDB), which is responsible for collecting and updating the basic information necessary for the formulation of future plans, has also published its own forecast of provincial population in the future. See Reference 1: Vision, Goals, Issues and Direction of Measures for NREM in AYP.
c. Economic Situation
Table 2-2: Gross Domestic Product of the Province
Value (Million Baht) Year 2002 Year 2003 Year 2004 Year 2005 Year 2006
Agricultural Sector
Industrial Sector
Commercial Service Sector
Total
<Suggestion>
Future economic situation is also key index for the analysis of impact from economic and social development. It is recommended to conduct forecast of future GPP (gross provincial product) based on the data provided by the National Economic and Social Development Board (NESDB). See Reference 4: Forecast of GPP for AYP.
Once future population and GPP are forecasted, it is possible to estimate the following aspects:
• Future municipal waste generation: see Reference 5: Future Generation of Municipal Waste in AYP
• Future medical waste generation: see Reference 6: Forecast of Future Medical Waste Generation in AYP

The Study on Supporting System for Administrations on JICA Natural Resources and Environmental Management Kokusai Kogyo Co., Ltd. in the Kingdom of Thailand Ex Corporation
1-22
• Future industrial waste generation: see Reference 7: Forecast of Future Industrial Waste(IW)Generation in AYP
d. Social Situation
d.1 Occupation
Table 2-3: Occupation Classified by Type (Include year of data collection)
Occupation Number (person) Percent (%) Agricultural Sector Industrial Sector Commercial Sector Transportation Sector Service Sector Other…………….. Total 100.0
d.2 Public Health
Table 2-4: Type of Public Health Facility and Staff
Year Type of Public Health/Staff Unit
2002 2003 2004 2005 2006 Place Public Hospital Bed
Place Private Hospital Bed Public Health Station
Place
Doctor Person Dentist Person Pharmacist Person Nurse Person Public Health Officer
Person
d.3 Public Utilities
Table 2-5: Percentage of Public Utilities Service (Include year of data collection)
Type of Public Utilities Percentage of Service (%) Water Supply Electricity Telephone
d.4 Labor (Include year of data collection)
• Total Number of Laborers...……………person (………...%)

The Study on Supporting System for Administrations on JICA Natural Resources and Environmental Management Kokusai Kogyo Co., Ltd. in the Kingdom of Thailand Ex Corporation
1-23
• Labor in Agricultural Sector……………person (….……..%)
• Labor out of Agricultural Sector………..person (….……..%)
• Jobless person (…………%)
• Ratio of Working Age Person to Jobless………..per…………
d.5 Local Administration
Table 2-6: Number and Percent of Local Administration (Include year of data collection)
Type of Local Administration Number (Place) Percent (%) PAO Town Municipality City Municipality Sub-district Municipality TAO Pattaya City Total 100.0
d.6 Group/Organization/Network
Table 2-7: Number and Percent of Public Groups/Organizations/Networks (Include year of data collection)
Type of Group/Organization/Network Number (Organization) Percent (%) Field of Occupation Field of Public Health Field of Education Field of Community’s Development Field of Natural Resources and Environment
Field of Disaster Other (please write………………..) Total 100.0
2) Situation and Issues of Natural Resources and Environment in the Province
<Suggestion>
This section of PEQMP requires the analysis of NRE which must include the current situation, issues, causes, impact, prevention measures, and methods used to solve issues in the past. It is, therefore, suggested that the title of this section be changed to ‘Situation and Issues of Natural Resources and Environment in the Province’.
It is also suggested that the analysis of NRE should be made sector by sector, with the narrative description presented together with spatial or Area-Based content (i.e. figures
The Study on Supporting System for Administrations on JICA Natural Resources and Environmental Management Kokusai Kogyo Co., Ltd. in the Kingdom of Thailand Ex Corporation
1-24
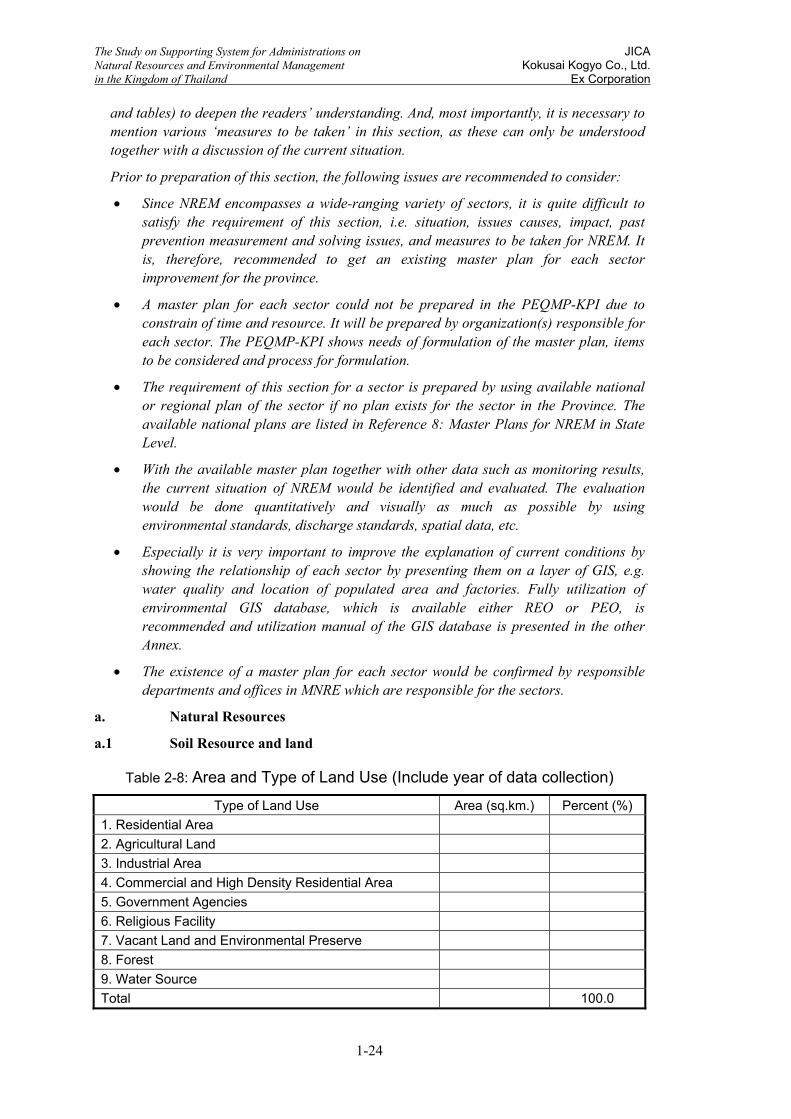
and tables) to deepen the readers’ understanding. And, most importantly, it is necessary to mention various ‘measures to be taken’ in this section, as these can only be understood together with a discussion of the current situation.
Prior to preparation of this section, the following issues are recommended to consider:
• Since NREM encompasses a wide-ranging variety of sectors, it is quite difficult to satisfy the requirement of this section, i.e. situation, issues causes, impact, past prevention measurement and solving issues, and measures to be taken for NREM. It is, therefore, recommended to get an existing master plan for each sector improvement for the province.
• A master plan for each sector could not be prepared in the PEQMP-KPI due to constrain of time and resource. It will be prepared by organization(s) responsible for each sector. The PEQMP-KPI shows needs of formulation of the master plan, items to be considered and process for formulation.
• The requirement of this section for a sector is prepared by using available national or regional plan of the sector if no plan exists for the sector in the Province. The available national plans are listed in Reference 8: Master Plans for NREM in State Level.
• With the available master plan together with other data such as monitoring results, the current situation of NREM would be identified and evaluated. The evaluation would be done quantitatively and visually as much as possible by using environmental standards, discharge standards, spatial data, etc.
• Especially it is very important to improve the explanation of current conditions by showing the relationship of each sector by presenting them on a layer of GIS, e.g. water quality and location of populated area and factories. Fully utilization of environmental GIS database, which is available either REO or PEO, is recommended and utilization manual of the GIS database is presented in the other Annex.
• The existence of a master plan for each sector would be confirmed by responsible departments and offices in MNRE which are responsible for the sectors.
a. Natural Resources
a.1 Soil Resource and land
Table 2-8: Area and Type of Land Use (Include year of data collection)
Type of Land Use Area (sq.km.) Percent (%) 1. Residential Area 2. Agricultural Land 3. Industrial Area 4. Commercial and High Density Residential Area 5. Government Agencies 6. Religious Facility 7. Vacant Land and Environmental Preserve 8. Forest 9. Water Source Total 100.0

The Study on Supporting System for Administrations on JICA Natural Resources and Environmental Management Kokusai Kogyo Co., Ltd. in the Kingdom of Thailand Ex Corporation
1-25
<Suggestion>
The trend of land use change is quite important indicator for the NREM It would provide a lot of useful information for the analysis of current situation and issues of NREM. It is, therefore, recommended to conduct an analysis of land use change by using satellite images though it requires an extra input. See Reference 9: Trend of Land Use Change in SKP and Reference 10: Change of Mangrove Forest Area.
a.2 Forest Resource and Wildlife
a.2.1. Forest Resource
Table 2-9: Forest Area
Year Area (sq. km.) Area (Rai) % of Provincial Area 2002 2003 2004 2005 2006
<Suggestion>
Forest resource is very important resource for NREM and decrease of it may affect another sector of NREM. It is suggested that such relation would be analyzed in this section as shown in Reference 10: Change of Mangrove Forest Area.
a.2.2. Wildlife Resource (Include year of data collection)
It should include type/classification/number of wildlife which is rare or nearly extinct including place found such as
1. Type/Classification…………………number found………….place found……….
2. Type/Classification…………………number found………….place found……….
3. Type/Classification…………………number found………….place found……….
4. Type/Classification…………………number found………….place found……….
a.3 Water Resource
Main River(s) 1) …………………………………………………………………….
2)………………… ………………………………………………….
3)………… ………..………………………………..……………….
Sub-main River(s) 1)…………………………………………………………………….
2)………………… ………………………………………………….
3)………… ………..………………………………..……………….
Ditch/Canal/Stream(s) 1)…………………………………………………………………….
2)………………… ………………………………………………….
3)………… ………..………………………………..……………….

The Study on Supporting System for Administrations on JICA Natural Resources and Environmental Management Kokusai Kogyo Co., Ltd. in the Kingdom of Thailand Ex Corporation
1-26
Lake/Reservoir/Pond(s) 1)……………………...Water storage volume………………cu.m.
2)………………………Water storage volume………………cu.m.
3)………………………Water storage volume………………cu.m.
a.4 Mineral Resource
The mineral resources in the province should be recorded such as place, area, type of mineral, usage of mineral and abundance of mineral resources, etc.
a.5 Marine and Coastal Resource
Table 2-10: Marine and Coastal Resources (Include year of data collection)
Type Place found Area (sq.km.) Area (Rai) Abundance Mangrove Sea grass Reef Other (please write……….)
a.6 Biodiversity
It should include biodiversity in province such as type/classification number, place, importance, etc.
b. Environment
b.1 Water Quality
Table 2-11: Results of Surface Water Quality Analysis (Include month/year of analysis)
Parameter Water Source/Monitoring Station (Main River/Branch/Canal) DO BOD TCB FCB
Level of Water
Quality* 1. 2. 3. 4. 5. Remark * Level of Surface Water Quality can be observed from the following table
Level of Water Quality Standardization* of Surface Water Quality
Unit 1 2 3 4 5
DO Mg./l. n < 6.0 < 4.0 < 2.0 - BOD Mg./l. n > 1.5 > 2.0 > 4.0 - Total Coliform Bacteria MPN/100ml n > 5,000 > 20,000 - - Fecal Coliform Bacteria MPN/100ml n > 1,000 > 4,000 - -
Remark < means not less than
> means not more than
n means natural without human disturbance

The Study on Supporting System for Administrations on JICA Natural Resources and Environmental Management Kokusai Kogyo Co., Ltd. in the Kingdom of Thailand Ex Corporation
1-27
- means not set value Source: *Modified from Announcement of National Environment Board No.8 (Year 1994) based on the Enhancement and Conservation of National Environment Quality Act (1992) on Standardization of Water Quality in Surface Water Source and notification published in the Government Gazette Volume 111, part 16 on 24 February 1994.
Table 2-12: Results of Coastal Water Quality Analysis (Include month/year of analysis)
Water Quality Analysis Water Source/Monitoring Station (Coastal) DO (mg./l.) TCB (MPN/100 ml.)
Level of Water Quality*
1. 2. 3. 4. Remark * Level of Coastal Water Quality can be observed from the following table
Level of Water Quality Standardization* of Coastal Water Quality
Unit 1 2 3 4 5
DO Mg./l. n < 4 < 4 < 4 n Total Coliform Bacteria MPN/100ml n - - > 1,000 > 1,000 Fecal Coliform Bacteria MPN/100ml n - - n -
Remark < means not less than
> means not more than
n means natural without human disturbance
- means not set value Source: *Modified from Announcement of National Environment Board No.7 (Year 1994) based on the Enhancement and Conservation of National Environment Quality Act (1992) on Standardization of Water Quality in Coastal Water and notification published in the Government Gazette Volume 111, part 16 on 24 February 1994.
<Suggestion>
It is recommended to show full “Environmental Standards for Water Quality of Surface Water”, “Class Definitions of Environmental Water Quality Standards”, “Environmental Standards for Water Quality of Costal Water” and “Environmental Standards for Water Quality of Costal Water” as shown below.
Environmental Standards for Water Quality of Surface Water Standard Value for Class Parameter1/ Units Statistics Class1 Class2 Class3 Class4 Class5 Methods for Examination
1. Color, Odor and Taste - - n n’ n’ n’ - -
2. Temperature C° - n n’ n’ n’ - Thermometer
3. pH - - n 5-9 5-9 5-9 - Electrometric pH Meter
4. Dissolved Oxygen (DO) mg/l P20 n >6.0 >4.0 >2.0 - Azide Modification
5. BOD (5 days, 20°C) mg/l P80 n <1.5 <2.0 <4.0 - Azide Modification at 20°C , 5 days
6. Total Coliform Bacteria MPN/100 ml P80 n <5,000 <20,000 - - Multiple Tube Fermentation Technique
7. Fecal Coliform Bacteria MPN/100 ml P80 n <1,000 <4,000 - - Multiple Tube Fermentation Technique
8. NO3 -N mg/l - n 5.0 - Cadmium Reduction
9. NH3 -N mg/l - n 0.5 - Distillation Nesslerization

The Study on Supporting System for Administrations on JICA Natural Resources and Environmental Management Kokusai Kogyo Co., Ltd. in the Kingdom of Thailand Ex Corporation
1-28
Standard Value for Class Parameter1/ Units Statistics Class1 Class2 Class3 Class4 Class5 Methods for Examination
10.Phenols mg/l - n 0.005 - Distillation,4-Amino antipyrene
11.Copper (Cu) mg/l - n 0.1 - Atomic Absorption -Direct Aspiration
12.Nickle (Ni ) mg/l - n 0.1 - Atomic Absorption -Direct Aspiration
13.Manganese (Mn) mg/l - n 1.0 - Atomic Absorption -Direct Aspiration
14.Zinc (Zn) mg/l - n 1.0 - Atomic Absorption -Direct Aspiration
15.Cadmium (Cd) mg/l - n 0.005* 0.05** - Atomic Absorption -Direct
Aspiration
16.Chromium Hexavalent mg/l - n 0.05 - Atomic Absorption -Direct Aspiration
17.Lead (Pb) mg/l - n 0.05 - Atomic Absorption -Direct Aspiration
18.Total Mercury (Total Hg) mg/l - n 0.002 - Atomic Absorption-Cold Vapour
Technique
19.Arsenic (As) mg/l - n 0.01 - Atomic Absorption -Direct Aspiration
20.Cyanide (Cyanide) mg/l - n 0.005 - Pyridine-Barbituric Acid
21.Radioactivity - Alpha - Beta
Becqurel/l - n 0.1 1.0 - Gas-Chromatography
22.Total Organochlorine Pesticides mg/l - n 0.05 - Gas-Chromatography
23.DDT µg/l - n 1.0 - Gas-Chromatography
24.Alpha-BHC µg/l - n 0.02 - Gas-Chromatography
25.Dieldrin µg/l - n 0.1 - Gas-Chromatography
26.Aldrin µg/l - n 0.1 - Gas-Chromatography
27.Heptachlor & Heptachlorepoxide µg/l - n 0.2 - Gas-Chromatography
28.Endrin µg/l - n None - Gas-Chromatography Remarks P: Percentile value, N: naturally, n': naturally but changing not more than 3°C, * : when water hardness not more than 100 mg/l as CaCO3, **: when water hardness more than 100 mg/l as CaCO3 Based on Standard Methods for the Examination of Water and Wastewater recommended by APHA : American Public Health Association, AWWA : American Water Works Association and WPCF : Water Pollution Control Federation Source: PCD Web page: http://www.pcd.go.th/info_serv/en_reg_std_water05.html#s3
Class Definitions of Environmental Water Quality Standards Classifications Objectives / Conditions and Beneficial Usage
Class 1 Extra clean fresh surface water resources used for: (1) conservation not necessary pass through water treatment process require only ordinary process for pathogenic destruction (2) ecosystem conservation where basic organisms can breed naturally
Class 2 Very clean fresh surface water resources used for: (1) consumption which requires ordinary water treatment process before use (2) aquatic organism of conservation (3) fisheries (4) recreation
Class 3 Medium clean fresh surface water resources used for: (1) consumption, but passing through an ordinary treatment process before using (2) agriculture
Class 4 Fairly clean fresh surface water resources used for: (1) consumption, but requires special water treatment process before using (2) industry
Class 5 The sources which are not classification in class 1-4 and used for navigation Source: PCD Web page: http://www.pcd.go.th/info_serv/en_reg_std_water05.html#s3
Environmental Standards for Water Quality of Costal Water Type of Usage Parameter Unit Methods for Examination
Class1 Class2 Class3 Class4 Class5 Class6 1.FloatableSolids - Visual Testing Not Objectionable 2.Color - Visual Testing compare to Forel-Ule color scale Not Objectionable 3.Odour - Smell with measurement members not less than 3 persons and collect
sample in glass bottle or TFE-line 2 bottles for 1 point. It should be measured immediately and comment of all member measurement must be unanimously
Not Objectionable
1) Thermometer 4.Temperature DegreeCelcius
2) Electrical Sensor Method
Change to increase not more than 1
Not change
Change to increase not more than 1
Change to increase not more than 2
5.pH - pH meter 7.0 - 8.5 6.Transparency - Secchi disc for sea water measurement Reduce from natural conditions not more than 10% from minimum point 7.Suspension - Gravimetric Method See Remark 1 8.Salinity 1) Argentometric Can be changed not more than 10% from minimum point

The Study on Supporting System for Administrations on JICA Natural Resources and Environmental Management Kokusai Kogyo Co., Ltd. in the Kingdom of Thailand Ex Corporation
1-29
2) Electrical Conductivity Method 3) Density 4) Refractometer
9.FloatableOil&Grease - Visual Testing Not Visible 10.PetroleumHydrocarbon
ug/l Fluorescence Spectrophotometry Not more than 0.5
Not more than 1
Not more than 5
1) Azide Modification Method 2) Membrane Electrode Method
11.DO mg/l
3) Wrinkler Method
Not less than 4
Not less than 6 Not less than 4
12TotalColiformBacteria
MPN/100ml Multiple Tube Fermentation Technique Not more than 1000
13.FecalColiformBacteria
CFU/100ml Membrane Filter Technique Not more than 70 Not more than 100
14.EnterococciBacteria CFU/100ml Membrane Filter Technique -
Not more than 35
-
Not more than 35
- -
15.NO3-N ug-N/l Cadmium Reduction Method to NO2- and follow by Colorimetric Method Not more than 20 Not more than 60
16.PO4-P ug-P/l
Colorimetric Method Not more than 15 Not more than 45
Not more than 15
Not more than 45
17.NH3-N ug-N/l Phenol-Hypochlorite Method Not more than 70 Not more than 100 Not more than 70
1) Cold-Vapor/Hydride Generation Atomic Absorption Spectrometric Method 2) Cold-Vapor/Hydride Generation-Atomic Fluorescence Spectrometric Method
18.TotalHg ug/l
3) Inductively Coupled Plasma
Not more than 0.1
19.Cadmium(Cd) ug/l 1) Electro thermal Atomic Absorption Spectrometric Method Not more than 5 20.Chromium(Cr) ug/l 2) Inductively Coupled Plasma Method Not more than 100 21.CromiumHexavalent 1) Pre-concentration follow by Electro thermal Atomic Absorption
Spectrometric Method (Cr-Hexavalent)
ug/l
2) Inductively Coupled Plasma Method Not more than 50
22.Lead(Pb) ug/l 1) Electro thermal Atomic Absorption Spectrometric Method Not more than 8.5 23.Copper(Cu) ug/l 2) Inductively Coupled Plasma Method Not more than 8 24.Manganese(Mn) ug/l 1) Pre-concentration follow by Flame Atomic Absorption Spectrometric
Method Not more than 100
25.Zinc(Zn) ug/l 2) Electro thermal Atomic Absorption Spectrometric Method Not more than 50 26.Iron(Fe) ug/l 3) Inductively Coupled Plasma Method Not more than 300 27.Fluoride(F) ug/l SPADNS Colorimetric Method Not more than 1 28.ResidualChlorine ug/l N,N-diethyl-p-phenylenediamine Method - - - - Not more
than 0.01 29.Phenols ug/l Distillation follow by 4-Aminoantipyrine Colorimetric Method Not more than 0.03 30.Sulfide ug/l Methylene Blue Colorimetric Method Not more than 10 31.Cyanide ug/l Pyridine-Barbituric Acid Colorimetric Method Not more than 7 32.PCB ug/l Gas Chromatography with Electron capture Detector Could not detect
1) Gas Chromatography with Mass Spectro photometry 33.TotalOrganochlorinePesticides
- 2) Highly Performance Liquid Chromatography (HPLC)
See Remark 2
1) Hydride Generation Atomic Absorption Spectrometric Method the sample must be crushed before measurement 2) Electro thermal Atomic Absorption Spectrometric Method
34.Arsenic ug/l
3) Inductively Coupled Plasma Method with free Chloride disturbance system
Not more than 10
35.Radioactivity(Becquerel/l) o-precipitation Not more than 0.1
-AlphaGross Evaporation Method Not more than 1.0 Method Gamma Spectrometry (USEPA) Method or calculate from
-BetaGross(naturalpotassium40notincluded)
ug/l
Salinity 1) Gas Chromatography with Flame Photometric Detector 2) Gas Chromatography with Mass Spectrophotometry
36.Tributyltin ng/l
3) Highly Performance Liquid Chromatography -ICPMS Not more than 10
1/ Standard value of suspension can be increased not more than sum of average value 1 day or 1 year plus standard deviation of the average value. For ex ample, average value of 1 day has to measure every hour or at least 5 times with the same time period, average value of 1 month has to measure every day or at least 4 times (at the same time period in 1 month), average value of 1 year has to measure every month on same day and same time. 2/ Hazardous Chemicals and Pesticides with Chlorine
- Standard value of Aldrin for all usages must not more than 1.3 microgram/l - Standard value of Chlordane for all usages must not more than 0.004 mg/l - Standard value of DDT for all usages must not more than 0.001 mg/l - Standard value of Dieldrin for all usages must not more than 0.0019 mg/l - Standard value of Aldrin for all usages must not more than 0.0023 mg/l - Standard value of Endosulfan for all usages must not more than 0.0087 mg/l - Standard value of Heptacror for all usages must not more than 0.0036 mg.l - Standard value of Lindane for all usages must not more than 0.16 mg/l - Standard value of Alachlor, Ametryn, Atrazine, Carbaryl, Carbendazim, Chlorpyrifos, Cypermethrin, 2,4-D, Diuron Glyphosate, Malathion,
Mancozeb, Methyl parathion, Parathion, and Propanil must not detect with assigned analysis method Source : Notification of the National Environmental Board No. 27 (Year 2006) on Coastal Water Quality Standard, published in the Royal Government Gazette Vol. 124, Part 11 ngor, dated February 1st, 2007
The definition of each class for the environmental water quality standards are given in the following Table.
Classification of Costal Water Class Description
1 Natural resources conservation 2 Coral conservation 3 Water for Coastal Farms 4 For recreation(water contact spot ,such as swimming) 5 Nearby industrial estate and/or port 6 Nearby populated area

The Study on Supporting System for Administrations on JICA Natural Resources and Environmental Management Kokusai Kogyo Co., Ltd. in the Kingdom of Thailand Ex Corporation
1-30
Table 2-13: Wastewater Treatment System
Place of Wastewater Treatment
Area (Rai) Wastewater Treatment
System
Amount of Wastewater
(m3/day)
Amount of Wastewater to the System (m3/day)
1. 2. 3. 4. 5. 6.
<Suggestion>
The relationship of water qualities, water pollution sources and water utilization facilities is major concern of NREM. It should be explained with spatial or Area Based content to deepen the stakeholders’ understandings. See Reference 11: Relation of Water Quality, Water Pollution Sources and Water Utilization Facilities in AYP.
b.2 Air Quality
Table 2-14: Results of Air Quality (Include month/year of analysis)
Pollutant Average of…….
Results of Air Quality Standard Value*
24 hrs. Not more than 0.12 mg/cu.m. Dust smaller than 10 micron 1 year Not more than 0.05 mg/cu.m. 24 hrs. Not more than 0.33 mg/cu.m. Dust smaller than 100 micron 1 year Not more than 0.10 mg/cu.m. 1 hr. Not more than 30 ppm. (34.2
mg/cu.m.) CO
8 hrs. Not more than 9 ppm. (10.26 mg/cu.m.)
1 year Not more than 0.04 ppm. (0.10 mg/cu.m.)
24 hrs. Not more than 0.12 ppm. (0.30 mg/cu.m.)
SO2
1 hr. Not more than 0.3 ppm (780 mcg./cu.m.)
NO2 1 hr. Not more than 0.17 ppm. (0.32 mg/cu.m.)
O3 1 hr. 0.10 ppm. (0.20 mg/cu.m.) Pb 1 month Not more than 1.5 mcg/cu.m.
Source: *Modified from Announcement of National Environment Board No.10 (Year 1995) on Standard of Air Quality in General Atmosphere based on the Enhancement and Conservation of National Environment Quality Act (1992) and notification published in the Government Gazette Volume 112, part 52 on 25 May 1995.
Announcement of National Environment Board No.24 (Year 2004) on Standard of Air Quality in General Atmosphere based on the Enhancement and Conservation of National Environment Quality Act (1992) and notification published in the Government Gazette Volume 121, special part 104 on 22 September 2004.

The Study on Supporting System for Administrations on JICA Natural Resources and Environmental Management Kokusai Kogyo Co., Ltd. in the Kingdom of Thailand Ex Corporation
1-31
b.3 Noise Quality
Table 2-15: Result of Noise Quality Analysis (Include month/year of analysis)
Monitoring Place Maximum Noise Level Average Noise Level 24 hrs. 1. 2. 3. Standard of Noise Level* Not more than 115 dB A Not more than 70 dB A
Source: *Modified from Announcement of National Environment Board No.15 (Year 1997) on Standard of Noise Quality based on the Enhancement and Conservation of National Environment Quality Act (1992) on 12 March 1997 and Announcement of Pollution Control Department on Calculation of Noise Level on 11 August 1997.
b.4 Solid Waste
Table 2-16: Waste Amount (Classified by Municipality/TAO) (Include year of data collection)
In Municipality Out of Municipality Total Data Amount
(Ton/day) Percent
(%) Amount
(Ton/day) Percent
(%) Amount
(Ton/day) Percent
(%) Total Waste Amount Waste Collection Amount
Waste Deposited Amount
Table 2-17: Waste Composition (Include year of data collection)
Waste Composition Percent by Weight Wet waste Paper Plastic Cloth Glass Metal Aluminum/Metal Leather/Rubber Other (please write…………………..) Total 100.0
Waste Disposal System
Table 2-18: Waste Disposal System (Include year of data collection)
Place of Disposal Area (Rai) Waste Disposal System 1.

The Study on Supporting System for Administrations on JICA Natural Resources and Environmental Management Kokusai Kogyo Co., Ltd. in the Kingdom of Thailand Ex Corporation
1-32
2. 3. 4. 5.
b.5 Hazardous Waste and Toxic Substances
Data of hazardous waste and toxic substances should be recorded such as problems, cause of problems, impact to human health and environment, etc.
<Suggestion>
In order to discuss about hazardous waste (HW) it is quite important to understand what kind and how many tons of HW is generated in the province. An example is provided in Reference 12: Generation Amount of Hazardous Wastes in AYP.
b.6 Urban Environment
The data related to urban environment should be recorded such as green area or public park or recreation area, number of areas, ratio of green area or public park per person (sq.m./head), usage of area, condition, cause and impact to any problem, etc.
b.7 Natural Environment and Culture
Data on natural environment and culture should be recorded or valuable conservation places in the province such as location, number of areas, abundance, problems, cause of problems, impact to any problem, etc.
Table 2-19: Statistic of Complaints
Number of Complaints Year Water Air Noise Odor Others
Total Number of Complaints
2002 2003 2004 2005 2006
3) Summary of Situation and Issues of NRE (The original title is “Analysis of Current Issues and Impacts from Socio-economic Development”)
Current issues and impact from socio-economic development can be analyzed from data on the situation and issues in the province to show the seriousness and trend of the issue. In this analysis, data collected from each of the categories can be compared with the standard value (if any). It should concentrate on issues which have a value below standard. Or considerations may be made from whether the comparison of old and present data shows a negative change or not and the extent of any change. The summary of problems, area that issues occur, cause, impact and past countermeasures for solving issues should be recorded in the following table.

The Study on Supporting System for Administrations on JICA Natural Resources and Environmental Management Kokusai Kogyo Co., Ltd. in the Kingdom of Thailand Ex Corporation
1-33
Table 2-20: Summary of Issues, Cause, Impact and Countermeasure for Solving Issue of Natural Resources
Natural Resources Summary of Issue
Area that Issue
Occurs
Cause Impact Countermeasure for solving Issue
1. Soil Resource and Land
2. Forest Resource and Wildlife
3.Water Resource 4.Mineral Resource 5. Marine and Coastal Resource
6. Biodiversity
<Suggestion>
It is suggested that the title of this section be changed to ‘Summary of Situation and Issues of NRE’.
The following suggestions are discussed in the Chapter 1:
• Use the table format required in the Manual, but add a ‘measures to be taken’ column to the table in the Manual, and summarize the narrative content of the previous section by this table.
• Then summarize the table itself with a figure called ‘Vision, Goals, Issues, and Direction of Measures for NREM in [province]’, using the contents of the ‘Issues’ and ‘Measures to be taken’ columns.
Table 2-21: Summary of Issues, Cause, Impact and Countermeasure for Solving Issue of Environment
Natural Resources Summary of
Issue Area that
Issue Occurs
Cause Impact Countermeasure for solving Issue
1.Water Quality 2.Air Quality 3.Noise Quality 4.Solid Waste 5.Hazardous waste and toxic substance
6.Urban Environment
7.Natural Environment and Culture

The Study on Supporting System for Administrations on JICA Natural Resources and Environmental Management Kokusai Kogyo Co., Ltd. in the Kingdom of Thailand Ex Corporation
1-34
4) Priority Setting of Problems
Table 2-22: Priority Setting of Issues of Natural Resources and Environment
Score of Criteria and Weight for Setting Priority
Criteria 1 Criteria 2 Criteria 3 Criteria 4Problem
Indicator to
evaluation importanc
e of problem
Weighted Score…
Weighted Score…
Weighted Score…
Weighted Score…
Total Scor
e
Priority of
Problems
1…………. 2…………. 3…………. 4…………. 5…………. 6…………. 7…………. 8…………. 9…………. 10………...
<Suggestion>
The following suggestion is discussed in the Chapter 1:
There are many issues that must be worked on to realize an ideal NREM of the province. This section should discuss priority among issues raised in the previous sections, especially priority issues that should be solved by the target year of PEQMP-KPI, year 2011.
It is recommended to conduct an opinion survey among all stakeholders, as follows the National EQMP directive, to reflect the opinions of as many stakeholders as possible. We suggest that priorities are set based on opinion surveys among stakeholders together with the analysis in this section.
An example of the report for this section is available in Reference13: Priority Setting of Issues in AYP.
5) Provincial Potential Analysis by SWOT Analysis Consideration of all factors Internal Factors in Province (Put in Table 23)
Strengths: S 1)………………………….... 2)…………………………… 3)…………………………… 4)…………………………… 5)……………………………
Weaknesses; W 1)………………………….... 2)…………………………… 3)…………………………… 4)…………………………… 5)……………………………
External Factors of Province (Put in Table 24)
Opportunities; O 1)………………………….... 2)…………………………… 3)…………………………… 4)…………………………… 5)……………………………
Threats; T 1)………………………….... 2)…………………………… 3)…………………………… 4)…………………………… 5)……………………………

The Study on Supporting System for Administrations on JICA Natural Resources and Environmental Management Kokusai Kogyo Co., Ltd. in the Kingdom of Thailand Ex Corporation
1-35
Table 2-23: Result of Internal Factors Analysis
Analysis Score Internal Factors Analysis Strengths (S)
� Weakness (W)
� Total Score
� + � Average Score
�/�=� 1. X Y X+Y (X+Y)/Z 2. 3. 4. 5. 6. � = Z = Number of Total Factors
Total Sum X + Y Sum ((X+Y)/Z)Remark: Giving score (X or Y) for internal factors
Score of Strength (S) If many = 3 medium = 2 few = 1 none = 0
Score of Weakness (W) If many = -3 medium = -2 few = -1 none = 0
Table 2-24: Result of External Factors Analysis
Analysis Score External Factors Analysis
Opportunities (O)�
Threats (T) �
Total Score � + �
Average Score�/�=�
1. X Y X+Y (X+Y)/Z 2. 3. 4. 5. 6. � = Z = Number of Total Factors
Total Sum X + Y Sum ((X+Y)/Z)
Remark: Giving score (X or Y) for external factors Score of Opportunities (O) If many = 3 medium = 2 few = 1 none = 0 Score of Threats (T) If many = -3 medium = -2 few = -1 none = 0

The Study on Supporting System for Administrations on JICA Natural Resources and Environmental Management Kokusai Kogyo Co., Ltd. in the Kingdom of Thailand Ex Corporation
1-36
Summary of Potential Province Analysis
6) Selection of Priority Programs (The original title is “Preventive Measures and Solution for Problems”)
Table 2-25: Summary of Priority of Problems
Item Problems in Accordance with Priority Setting (From Table 22)
Suggestion for Prevention Measures and Solving of Problems
1. 2. 3. 4. 5. 6. 7. 8. 9. 10.
<Suggestions>
In the Chapter 1 the following recommendation are discussed:
• Resources available in a province are limited, and time is limited as well by the PEQMP-KPI target year of 2011. Due to these limitations, issues which can be solved by the target year are also limited in number.
• This chapter should, therefore, be limited to priority issues discussed in section 2.4.4 (Prioritizing the Issues) that must be implemented prior to 2011.
In conclusion, it is suggested that the title of this section be changed to “Selection of Priority Programs”. An example of the report for this section is available in Reference 14: Selection of Priority Programs for AYP.
3
2
1
Opportunities (O)
-3
-2
-1
Threats (T)
0 1 2 3 -3 -2 -1
Weaknesses (W) (O) Strengths (S)

The Study on Supporting System for Administrations on JICA Natural Resources and Environmental Management Kokusai Kogyo Co., Ltd. in the Kingdom of Thailand Ex Corporation
1-37
Part 3 Detail of Action Plan for Natural Resources and
Environment Management at the Provincial Level

The Study on Supporting System for Administrations on JICA Natural Resources and Environmental Management Kokusai Kogyo Co., Ltd. in the Kingdom of Thailand Ex Corporation
1-38
2.3 Part 3 Detail of Action Plan for Natural Resources and Environment Management in Provincial Level
In order to formulate the Action Plan for Natural Resources and Environment Management at the Provincial Level to be in concurrence with the occurrence of the issue and according to the level of priority given to the issue, the action plan will be comprised of topic, objectives, target, strategy, plan/project/activity, budget and budget source, output of each project or activity, indicator of each project or activity, supporting tool to proceed from plan to implementation and monitoring and evaluation of the plan.
Table 2-26: Topic of Problem/Objective/Target/Strategy/Plan
Topic of Problem according to Priority (Table 25) Objective Target Strategy Plan
1. 2. 3. 4. 5.
Remark Content should be suited with suggestion for prevention measures and solving of problem (Table 25)
Table 2-27: Plan/Project/Fiscal Year/Activity/Production and Indicator
Plan (According
to Table 26)
Project Name
Year of Implementation
Budget(Baht)
Main Activity Production Indicator
1.1………. 1.2………. 1.3……….
1…………..
2.1………. 2.2………. 2.3……….
2………….
3.1………. 3.2………. 3.3……….
3…………..

The Study on Supporting System for Administrations on JICA Natural Resources and Environmental Management Kokusai Kogyo Co., Ltd. in the Kingdom of Thailand Ex Corporation
1-39
Table 2-28: Summary of Plan/Project/Budget/Time Period and Responsible Agency
Plan No. 1 …………………………………………………………..
Budget (Baht) Requested
Support From
Implementation Time (Fiscal Year)
Project (Table
27) Province Local
Other
Total Budget (Baht)
2008 2009 2010 2011
ResponsibleAgency
1……. 2……. 3……. Plan No. 2 …………………………………………………………..
Budget (Baht) Requested
Support From
Implementation Time (Fiscal Year)
Project (Table
27) Province Local
Other
Total Budget (Baht)
2008 2009 2010 2011
ResponsibleAgency
1……. 2……. 3……. Remark Table can be added in accordance with the number of plans.
Table 2-29: Summary of Plan/Project and Budget of Central Government to be implemented in Province
Implementation Time (Fiscal Year) Plan/Project Total Budget (Million Baht) 2008 2009 2010 2011
Responsible Agency
1.Plan………………. 1.1 Project………...
1.2 Project………...
1.3 Project………...
2.Plan………………. 2.1 Project………...
2.2 Project………...
2.3 Project………...
3.Plan………………. 3.1 Project………...
3.2 Project………...
3.3 Project………...

The Study on Supporting System for Administrations on JICA Natural Resources and Environmental Management Kokusai Kogyo Co., Ltd. in the Kingdom of Thailand Ex Corporation
1-40
a. Supporting Tool to proceed from plan to implementation
The supporting tool for proceed with the Action Plan for Natural Resources and Environmental Quality Management at the Provincial Level into implementation should be recorded such as
• Working Committee (It may be the same committee that formulates the Plan)
• Measurement or Method to implement the plan
• Responsible person for implementation of the plan, etc.
b. Monitoring and Evaluation of Action Plan for Natural Resources and Environmental Quality Management at the Provincial Level
The monitoring and evaluation of the Action Plan for Natural Resources and Environmental Quality Management at the Provincial Level should be clearly indicated such as
• Working Committee (It may be the same committee that formulates the Plan)
• Guideline and framework of monitoring and evaluation
• Method and Time for monitoring and evaluation
• Responsible person for monitoring and evaluation, etc.
<Suggestions>
In Chapter 1 we discussed as follows:
It might be quite hard for a province to fulfill all the requirements stated above without a master plan for each sector of NREM in the province. In the absence of detailed master plans, it is suggested that a PDM (Project Design Matrix) format be used.
A PDM format will show the relationship of individual Priority Project plans (=Work Plan/Project/Activities) and how they may be grouped under a larger Priority Program (=Strategic Plan to Solve the Problem) in a sector. PDM formats also allow the other requirements (e.g. Funding and Funding Source, Organization in Charge, Indicator of the Success of the Project/Activities, and Device to Support the Plan Towards Action) to be shown in a single matrix/table. See Reference 2: PDM for Program for Conservation and Rehabilitation of Aquatic Resources in SKP PDM..

The Study on Supporting System for Administrations on JICA Natural Resources and Environmental Management Kokusai Kogyo Co., Ltd. in the Kingdom of Thailand Ex Corporation
1-41
Part 4 Annex

The Study on Supporting System for Administrations on JICA Natural Resources and Environmental Management Kokusai Kogyo Co., Ltd. in the Kingdom of Thailand Ex Corporation
1-42
2.4 Part 4 Annex
The following can be added as data for the Action Plan for Natural Resources and Environmental Quality Management at the Provincial Level.
1) Details of Priority Projects (Original tile is “Detail of Important Projects of Province (Explain by priority of the project no. 1-5)”)
(Sample) Writing of Project of Natural Resources and Environment
1. Name of Project: …………………………………………………………………………
2. Responsible Person(s): - Main
Agency…………………………………………………………………………. - Coordinating
Agency………………………………………………………………… - Supporting
Agency……………………………………………………………………
3. Principle and Reason: Source of data should be clearly indicated. 3.1 Present Situation 3.2 Present Problem and Forecast of Tendency in Future 3.3 Solving Principle - Without solving the problem, what will likely occur? - In what way the Project contains the idea and principle to solve the problem.
4. Objective: (what outcomes are desired)
4.1 4.2 4.3
5. Target: - Area: - Quantity: - Quality/Effectiveness:
6. Relations with Policy or Strategy - The project supports government policy in terms
of………………………………….. - Strategy of National Economic and Social Development Plan No. 10 - Strategy/Measurement/Method of Environmental Quality Management Plan Year
2007-2011 - Strategy of Provincial Group/Province

The Study on Supporting System for Administrations on JICA Natural Resources and Environmental Management Kokusai Kogyo Co., Ltd. in the Kingdom of Thailand Ex Corporation
1-43
7. Activity
7.1 Plan …………………………………………………………………………………… - - -
7.2 Plan …………………………………………………………………………………… - - -
7.3 Plan …………………………………………………………………………………… - - -
8. Implementation Time: - Number of years for implementation……………………………….. - Start from fiscal year…………………….to fiscal year………………………….
9. Implementation Area:
- Area in Municipality/TAO/which area?
10. Budget: 10.1 Calculate from Activity 10.2 Source of Expenses
- Municipality - TAO - Department of Local Administration - Department of Environmental Quality Promotion - Pollution Control Department - Environmental Fund/Other Fund - NGOs/Domestic Organization/International
11. Benefit of Project: field that positive impact from project implementation will make, such as
- Forecast that what social expenses could be reduced - Income from organic fertilizer, recycle waste 12. Administration and Management: How to run the project? - Executive Committee - Working Committee/Coordination - Hiring Consultants

The Study on Supporting System for Administrations on JICA Natural Resources and Environmental Management Kokusai Kogyo Co., Ltd. in the Kingdom of Thailand Ex Corporation
1-44
13. Monitoring and Evaluation: In order to know whether implementation is
going according to the plan or not.
13.1 Who the responsible person is, appointment of a committee or hiring a third-party for monitoring 13.2 Success Indicator such as - 80% of Action Plan was implemented. - Satisfaction of people - Percent of people that cooperated
14. Benefit to be achieved - Number of Municipality/TAO - Number of Communities/Local People
<Suggestions>
Our suggestions on the Part 4 1) are as follows:
Describe each Priority Project listed within the Priority Programs in Part 3.
Details of the priority projects are explained according to the following format of the table.
Table 2-30: Format of the Detailed Information of the Priority Projects
1. Name of Program 2. Name of Project 3. Sector in NREM 4. Responsible
Agency
5. Supporting Agency 6. Monitoring and
Evaluation Agency
7. Background of the Project
(Note): Summary of issues, area that issue occurs, causes and impacts are to be described.
8. Justification of the Project
(Note): Relations with the national, regional and provincial policy and strategy shall be described
9. Objectives of the Project
(Note): Outcomes of the project implementation are to be described.
10. Objectively Verifiable Indicators
(Note): An indicator corresponds with an objective mentioned above.
11. Main Components of the Project
(Note): Scope of the work has to be described.
12. Implementation Schedule
(Note): Time frame of the project shall be described according to the main components of the project.
13. Budgetary Plan (Note): Budgetary plan shall be prepared according to the time frame mentioned above.
14. Benefit to be achieved
(Note): Benefits of the project shall be described.
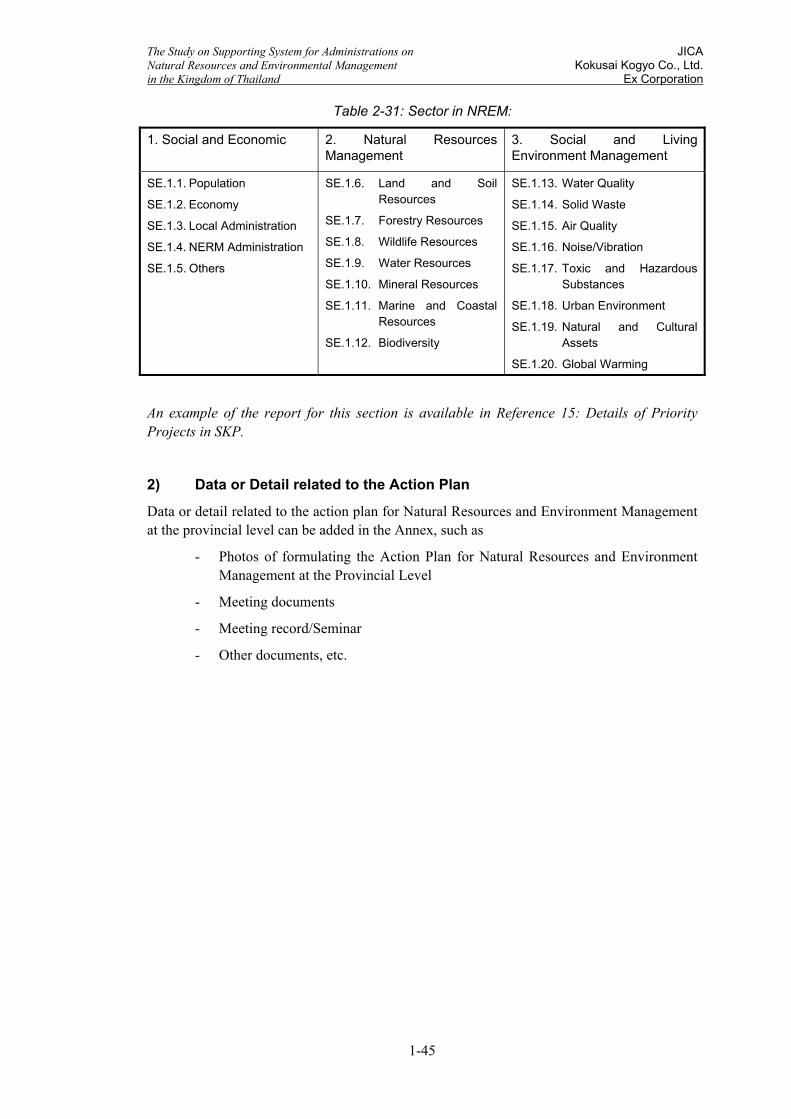
The Study on Supporting System for Administrations on JICA Natural Resources and Environmental Management Kokusai Kogyo Co., Ltd. in the Kingdom of Thailand Ex Corporation
1-45
Table 2-31: Sector in NREM:
1. Social and Economic
2. Natural Resources Management
3. Social and Living Environment Management
SE.1.1. Population
SE.1.2. Economy
SE.1.3. Local Administration
SE.1.4. NERM Administration
SE.1.5. Others
SE.1.6. Land and Soil Resources
SE.1.7. Forestry Resources
SE.1.8. Wildlife Resources
SE.1.9. Water Resources
SE.1.10. Mineral Resources
SE.1.11. Marine and Coastal Resources
SE.1.12. Biodiversity
SE.1.13. Water Quality
SE.1.14. Solid Waste
SE.1.15. Air Quality
SE.1.16. Noise/Vibration
SE.1.17. Toxic and Hazardous Substances
SE.1.18. Urban Environment
SE.1.19. Natural and Cultural Assets
SE.1.20. Global Warming
An example of the report for this section is available in Reference 15: Details of Priority Projects in SKP.
2) Data or Detail related to the Action Plan
Data or detail related to the action plan for Natural Resources and Environment Management at the provincial level can be added in the Annex, such as
- Photos of formulating the Action Plan for Natural Resources and Environment Management at the Provincial Level
- Meeting documents
- Meeting record/Seminar
- Other documents, etc.

The Study on Supporting System for Administrations on JICA Natural Resources and Environmental Management Kokusai Kogyo Co., Ltd. in the Kingdom of Thailand Ex Corporation
1-46
Annex Data for Formulation of Action Plan
for Natural Resources and Environmental Management
at the Provincial Level
Annex A Criteria to Give Score for Success in the Formulation of
Action Plan for Natural Resources and Environmental Management at the Provincial Level
Annex B Sample of Indicator on Natural Resources and Environment for
Formulation of Action Plan for Natural Resources and Environmental Management at the Provincial Level
Annex C Sample of Potential Provincial Analysis by SWOT Analysis

The Study on Supporting System for Administrations on JICA Natural Resources and Environmental Management Kokusai Kogyo Co., Ltd. in the Kingdom of Thailand Ex Corporation
1-47
Annex A Criteria to Give Score for Success in the Formulation of Action Plan
for Natural Resources and Environmental Management at the Provincial Level
Weight: 1 Percent
Explanation
Action Plan for Natural Resources and Environmental Management at the Provincial Level means the action plan is formulated appropriately for improvement, conservation, rehabilitation of natural resource and environment of the province and in accordance with environmental situation analysis.
Analysis of natural resources and environment of the province must have content covering both natural resources and environment in accordance with area conditions of the province such as
1) Natural Resources
1.1 Water Resources 1.2 Marine and Coastal Resources 1.3 Forest Resources 1.4 Wildlife 1.5 Biodiversity 1.6 Mineral Resources 1.7 Soil Resources and Land
2) Environment
2.1 Water Quality 2.2 Air Quality/Noise Level 2.3 Solid Waste/Hazardous Waste/Toxic Substance 2.4 Urban Environment 2.5 Natural Environment and Arts
MNRE has prepared this handbook and format for the formulation of the Action Plan for Natural Resources and Environmental Management at the Provincial Level in order to support provincial implementation.
Provinces can use the data from MNRE including data of province as basic data for the formulation of Action Plan for Natural Resources and Environmental Management at the Provincial Level.
Criteria for Scoring:
It is considered as a milestone. The criterion for scoring is divided into 5 levels. Consideration is based on the progress of the work procedure to the target in each level as follows.
Level of Milestone Score Step 1 Step 2 Step 3 Step 4 Step 5
1 i
2 i i
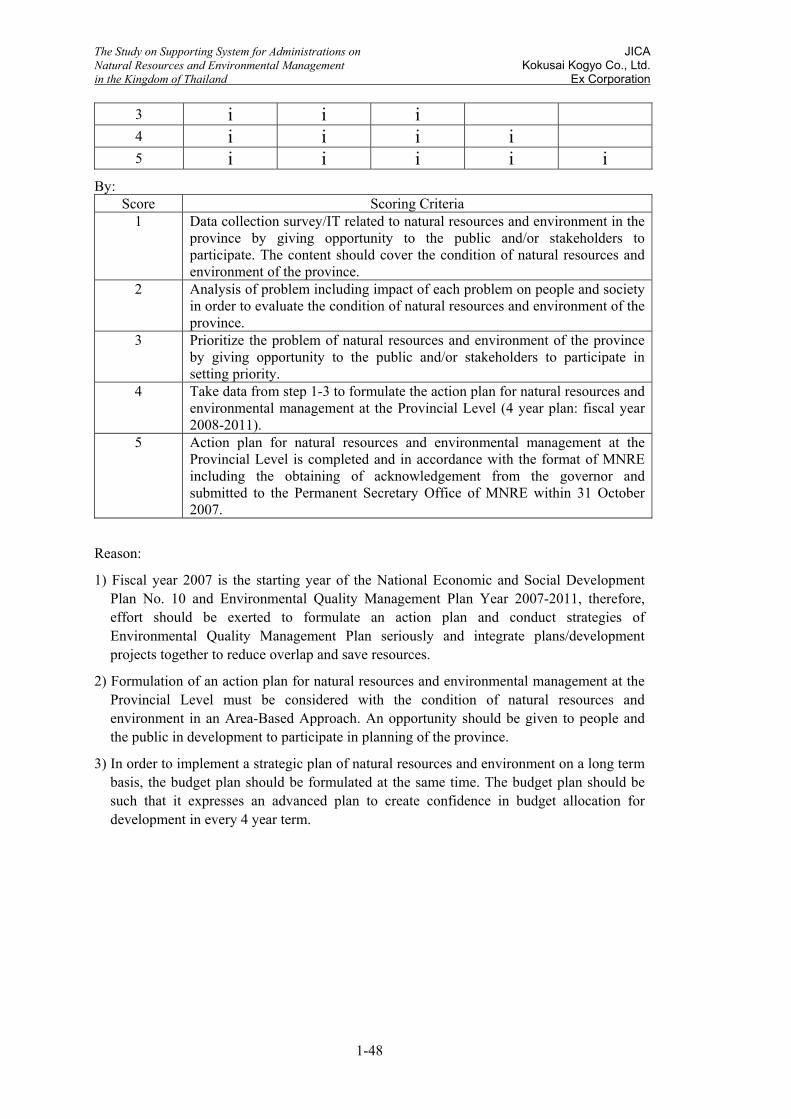
The Study on Supporting System for Administrations on JICA Natural Resources and Environmental Management Kokusai Kogyo Co., Ltd. in the Kingdom of Thailand Ex Corporation
1-48
3 i i i
4 i i i i
5 i i i i i By:
Score Scoring Criteria 1 Data collection survey/IT related to natural resources and environment in the
province by giving opportunity to the public and/or stakeholders to participate. The content should cover the condition of natural resources and environment of the province.
2 Analysis of problem including impact of each problem on people and society in order to evaluate the condition of natural resources and environment of the province.
3 Prioritize the problem of natural resources and environment of the province by giving opportunity to the public and/or stakeholders to participate in setting priority.
4 Take data from step 1-3 to formulate the action plan for natural resources and environmental management at the Provincial Level (4 year plan: fiscal year 2008-2011).
5 Action plan for natural resources and environmental management at the Provincial Level is completed and in accordance with the format of MNRE including the obtaining of acknowledgement from the governor and submitted to the Permanent Secretary Office of MNRE within 31 October 2007.
Reason:
1) Fiscal year 2007 is the starting year of the National Economic and Social Development Plan No. 10 and Environmental Quality Management Plan Year 2007-2011, therefore, effort should be exerted to formulate an action plan and conduct strategies of Environmental Quality Management Plan seriously and integrate plans/development projects together to reduce overlap and save resources.
2) Formulation of an action plan for natural resources and environmental management at the Provincial Level must be considered with the condition of natural resources and environment in an Area-Based Approach. An opportunity should be given to people and the public in development to participate in planning of the province.
3) In order to implement a strategic plan of natural resources and environment on a long term basis, the budget plan should be formulated at the same time. The budget plan should be such that it expresses an advanced plan to create confidence in budget allocation for development in every 4 year term.

The Study on Supporting System for Administrations on JICA Natural Resources and Environmental Management Kokusai Kogyo Co., Ltd. in the Kingdom of Thailand Ex Corporation
1-49
Evaluation: Score Criteria for Scoring Evaluation
1
Step 1 Data collection survey/IT related to natural resources and environment in province by giving opportunity to the public and/or stakeholders to participate. The content should cover the condition of natural resources and environment of the province.
1. Evaluate from data, document, evidences o Evidence, report or database shows data
collection/IT related to natural resources and environment, review of old study research
o Evidence shows that the province gives opportunity to the public and/or stakeholders to participate in data collection survey/IT related to natural resources and environment of province such as photos, list of participants joining activities, etc.
2
Step 2 Analysis of problems including impact of each problem to people and society in order to evaluate the condition of natural resources and environment of the province.
2.1 Evaluation from data, evidence o There is evidence that shows work operation
are the same as level 1. But it includes results of problem analysis in terms of natural resources and environment, impact from deteriorated environment that effects people and society (in economic/living)
2.2 Evaluate data obtained from interviews o Control indicator Person o Data collector
3
Step 3 Prioritizing problems of natural resources and environment of the province by giving opportunity to the public and/or stakeholders to participate in the setting of priority.
3.1 Evaluate from data, evidence o There is documentation showing work
operation the same as level 1 and 2 including documentation shows that the opportunity was given to the public and/or stakeholders to participate in giving certain priority to problems concerned with natural resources and environment and the impact such as seminars, public meetings, environmental camp, etc. The sample of data, evidence are as follows:
Photos of project, activities Video Seminar documents Meeting Report/Seminar Other documents
o Documentation to summarize priority of problems related to natural resources and environment
3.2 Evaluation from data obtained by interviews o Control indicator Person o Data collector o Participants of Activities/Project
4 Step 4 Take data from step 1-3 to formulate action plan for
4. Evaluation from data, evidences o Evidence shows work operations the same as

The Study on Supporting System for Administrations on JICA Natural Resources and Environmental Management Kokusai Kogyo Co., Ltd. in the Kingdom of Thailand Ex Corporation
1-50
natural resources and environmental management at the Provincial Level (4 year plan: fiscal year 2008-2011)
level 1, 2 and 3 including the action plan for natural resources and environmental management at the provincial level. The plan should be comprised of the following;
Summary of condition of natural resources and environment of the province including priority of problem related to natural resources and environment and impact
Objectives of the action plan (solving problem/rehabilitation/conservation, etc.)
Target of Action Plan Strategy Plan Project/Activity Budget and Budget Source Responsible person and/or resource in
each project/activity Output and Indicator
5
Step 5 Action plan for natural resources and environmental management at the provincial level is completed and in accordance with the format of MNRE including acknowledgement from the governor and submitted to Permanent Secretary Office of MNRE within 31 October 2007
5. Evaluation of data and evidence. o Evidence shows work operation the same as
level 1, 2, 3 and 4 including an action plan for natural resources and environmental management at the provincial level. The action plan should meet the MNRE standard. Results of analysis/environmental survey and problems should be clearly defined with solving measures in accordance with technology or techniques.
o Evidence shows acknowledgement from the Governor
Remark: For the Self Assessment Report, the province should summarize the work results and attach sample documents/evidence or summary documents/evidence of the indicator. Other related documents which are not submitted to K.P.I. should be kept at the provincial office in case the evaluator needs additional information or to check certain items.

The Study on Supporting System for Administrations on JICA Natural Resources and Environmental Management Kokusai Kogyo Co., Ltd. in the Kingdom of Thailand Ex Corporation
1-51
Annex B Sample of Indicator for Natural Resources and Environment
for Formulation of Natural Resource and Environmental Plan of the Province
Indicator Unit Required Data 1. Forest Area (Rai) • Total Forest Cover of province 2. Community Forest (Rai) • Total area of Community Forest of
province 3. Mangrove (Rai) • Total area of Mangrove of province 4. Ratio of Forest Conservation to total forest area
(Percent) • Area of Forest Conservation according to the law and cabinet (Rai)
5. Ratio of Villages with access to water supply
(Percent) • Number of villages that have tap water
• Total number of villages 6. Rehabilitated Area from soil erosion problem
(Rai)
7. Rehabilitated Area from deteriorated soil problem
(Rai)
8.Number of Mining concessions which are operating
(Rai)
9. Number of complaints of environmental impact
(complaint)
10. Waste generation/person/ day in urban area
(kg/person/day) • Amount of waste generated in municipality
• Population in municipality (person) 11. Percent of recycle waste (percent) • Amount of recycle waste (Ton/year)
• Amount of waste generated (Ton/year)
12. Amount of household hazardous waste
(Ton/year) • Data from sample survey or by questionnaire
13. Number of natural sites with conservation plan, protection or rehabilitation
(site)
14. Number of cultural sites with conservation plan, protection or rehabilitation
(site)
15. Quality in Water source • Surface water • Coastal
(Good, fine, deteriorated,
very deteriorated)
• Water source quality in accordance with standard of Pollution Control Department
16. Air quality in Industrial Community Area
• Standard of Pollution Control Department
17. Ratio of Public Park to Total area in municipality
(Average Percent)
• Area of public parks of each municipality (sq.km.)
• Area of each municipality (sq.km.) 18. Number of Wastewater treatment system that are
(site) • Service coverage area (sq.km.)

The Study on Supporting System for Administrations on JICA Natural Resources and Environmental Management Kokusai Kogyo Co., Ltd. in the Kingdom of Thailand Ex Corporation
1-52
rehabilitated and in operation 19. Ratio of provincial budget for natural resources and environment to total budget of province
(percent) • Budget for natural resources and environmental management
• Total budget of province
20. Number of Non-registered population, classification by sex and age
(person/year) • Number of tourists (person/year) • Number of alien labor immigrants in
province (person/year)

The Study on Supporting System for Administrations on JICA Natural Resources and Environmental Management Kokusai Kogyo Co., Ltd. in the Kingdom of Thailand Ex Corporation
1-53
Annex C Example of the potential analysis of the province
by SWOT Analysis Internal Factor Analysis
Score Internal Factor Analysis Strengths Weaknesses Total Average
1. Provincial administrative structure
3 -1 2 0.3
2. Law/regulations 2 -1 1 0.14 3. Crew staff 3 -1 2 0.3 4. Database System 1 -2 -1 -0.14 5. Coordination 3 0 3 0.43 6. Overall Cooperation 2 -1 1 0.14 7. Tools 2 -1 1 0.14
Total 9 1.3 External Factor Analysis
Score External Factor Analysis Opportunities Threats Total Average
1. Economic 2 -1 1 0.25 2. Social/culture 3 -1 2 0.50 3. Politics/Government
Policy/Law 3 0 3 0.75
4. Technology 1 -2 -1 -0.25 Total 5 1.25
Remark: Scoring the potential analysis of the province Strengths (S) maximum = 3 average = 2 minimum = 1 none = 0 Weaknesses (W) maximum = -3 average = -2 minimum = -1 none = 0
Opportunities (O) maximum = 3 average = 2 minimum = 1 none = 0 Threats (T) maximum = -3 average = -2 minimum = -1 none = 0
Pattern of the potential analysis of the province
1) Upper right part: there are “Opportunities” and “Strengths” (O,S) meaning good future, must support and be extended.
2) Lower right part: there are “Threats” but has “Strengths” (T, S) meaning the potential is alright, should solve the problem first then extend.
3) Lower left part: there are “Threats” and “Weaknesses” (T, W) meaning there is the potential of self protection, cannot extend. Should do if possible or stop the performance and start doing something else that seems to have a future.
4) Upper left part: there are “Opportunities” but has “Weakness” (O, W) meaning uncertain about how to manage, should consider to solve the weakness because there are still opportunities.

The Study on Supporting System for Administrations on JICA Natural Resources and Environmental Management Kokusai Kogyo Co., Ltd. in the Kingdom of Thailand Ex Corporation
1-54
1 2 3-1-2-3
-1
-2
-3
1
2
3
1.25
Opportunity (O)
Threat (T)
Strength (S)Weakness (W)
Analyze from the potential analysis of the province from internal and external factors; the internal factor is positive (+) = 1.3, so plot number 1.3 on the WS axis. The external factor is positive (+) = 1.25, so plot number 1.25 on the OT axis as above. The intersecting point of the two lines is at the upper right box, which means the province has Strengths and Opportunities, so there is good potential for a natural resources and environmental management plan to be effective and sustainable.

The Study on Supporting System for Administrations on JICA Natural Resources and Environmental Management Kokusai Kogyo Co., Ltd. in the Kingdom of Thailand Ex Corporation
1-55
3 References
3.1 Reference 1: Vision, Goals, Issues and Direction of Measures for NREM in AYP
All of the above suggestions are represented in the following figure, which depicts the ideal state of NREM that AYP should aspire to on the long term, current issues, and the direction of measures:

1-56
Fig
ure
3: V
isio
n, G
oals
, Iss
ues
and
Dire
ctio
n of
Mea
sure
s fo
r N
RE
M in
AY
P

The Study on Supporting System for Administrations on JICA Natural Resources and Environmental Management Kokusai Kogyo Co., Ltd. in the Kingdom of Thailand Ex Corporation
1-57
3.2 Reference 2: PDM for Program for Conservation and Rehabilitation of Aquatic Resources in SKP PDM
Program Name: Program for Conservation and Rehabilitation of Aquatic Resources in Samut
Songkhram Province (SKP)
Target Area: Coastal Areas in SKP and the Mae Klong River Basin
Target Group: Fishermen and residents in SKP who make a living off aquatic resources
Narrative Summary Objectively Verifiable Indicators Means of Verification Important
Assumptions Overall Goal Marine and coastal resources of coastal areas in SKP and the Mae Klong River Basin are conserved and rehabilitated.
Catch per Unit Effort will increase.
Interview Survey
Program Purpose Establish a sustainable form of aquatic resource usage in SKP
Awareness improves among residents who make a living off aquatic resources
Questionnaire
Registration of foreigners is actively promoted
Outputs 1. A conservation and rehabilitation
plan suited to SKP is formulated 2. A sustainable form of fishing is
established 3. Habitats for aquatic resources are
established through afforestation of mangrove forests
1.1 Fishery statistics by
species/type and location 1.2. Detailed plan for
conservation and rehabilitation 2.1. Number of warnings and
arrests over illegal fishing practices
2.2. Number of workshops and other educational events, number of participants of the same
3. Afforestation area statistics and total area statistics of mangrove forest
1.1. Study report 1.2. Conservation and
Rehabilitation of Aquatic Resources Master Plan
2.1. Interviews 2.2. Interviews 3. Survey and satellite
imagery analysis
Individual Priority Projects (Numbers correspond to Output numbers) Responsible Agency Supporting Agency Input (Baht)
1. Formulation of a conservation and rehabilitation plan
PFO, Orborjor PEO MFDS7 FFKU MSRDC
1,000,000
2. Control illegal fishing practice and dissemination of sustainable fishing practice
PFO, LA, PEO, DOLA of PA
1,000,000
3. Conservation of natural habitats for fish, i.e. coastal mangrove forests, and increase in safe habitats through afforestation
MFDS7 PEO
LA
PFO 1,000,000
PFO: Provincial Fishery Office,
PEO: Provincial Environment Office,
MFDS7: Mangrove Forest Development Station No7
PO: Provincial Office FFKU: Fishery Faculty, Kasetsart University
MSRDC: Marine Shrimp Research and Development Center of SKP
DOLA: Department of Local Administration of MOI

The Study on Supporting System for Administrations on JICA Natural Resources and Environmental Management Kokusai Kogyo Co., Ltd. in the Kingdom of Thailand Ex Corporation
1-58
3.3 Reference 3: Future Population Forecast for AYP by NESDB
National Economic and Social Development Board (NESDB), which is responsible for collecting and updating the basic information necessary for the formulation of future plans, has also published its own forecast of provincial population in the future. The forecast of future population is conducted based on actual population data up to 2000.
In PEQMP the Study team applies the future population which can be obtained when actual population in 2005 is connected linearly to the future population in 2015 published by NESDB. Further, NESDB will publish a new forecast population in November 2007.
The population which the Study team calculated is shown in Table 3-1 and in Figure 4.
Table 3-1: Future Population to be used for PEQMP
Year Actual Data Forecast Data 2001 741,774 2002 748,243 2003 751,259 2004 740,397 2005 746,919 2006 747,9692007 749,0192008 750,0692009 751,1192010 752,1692011 753,2192012 754,2692013 755,3192014 756,3692015 757,414
700,000
710,000
720,000
730,000
740,000
750,000
760,000
770,000
780,000
790,000
800,000
2001
2002
2003
2004
2005
2006
2007
2008
2009
2010
2011
2012
2013
2014
2015
Year
Pop
ulat
ion
(per
son)
Actual Estimated
Figure 4: Future Population of AYP to be used for PEQMP

The Study on Supporting System for Administrations on JICA Natural Resources and Environmental Management Kokusai Kogyo Co., Ltd. in the Kingdom of Thailand Ex Corporation
1-59
3.4 Reference 4: Forecast of GPP for AYP
Gross Provincial Product (GPP) was forecast in PEQMP as follows:
• Actual GPP per Capita is calculated by using GPP data published by NESDB and population data of the past 5 years (2001-2005). Based on the 5-year data, the future GPP per Capita is calculated using regression analysis (linear).
• Future GPP is calculated as the result of future population multiplied by GPP per Capita computed above. Future population, which is calculated above, is utilized.
GPP per Capita is computed as shown in Table 3-2.
Table 3-2: GPP, Population and GPP per Capita (2001-2005) in AYP
Item Unit Symbol 2001 2002 2003 2004 2005 GPP*1 Mil. Baht A 182,145 196,416 238,397 255,988 264,555Population*1 person B 741,774 748,243 751,259 740,397 746,919GPP per Capita*2 Baht A/B*106 245,553 262,503 317,330 345,744 354,195
Source
*1: NESDB *2: Calculation by the Study Team
Future GPP is computed as shown in Table 3-3 and in Figure 5. GPP in AYP will be 1.55 times in 2011 and 1.91 times in 2015 compared with GPP in 2005.
Table 3-3: Actual GPP and Future GPP (AYP)
GPP per Capita Population GPP Growth RateBaht Person Mil. Baht %
---
Year
A B AxB/106 ---
2001 245,553 741,774 182,145 --- 2002 262,503 748,243 196,416 7.8
Actual 2003 317,330 751,259 238,397 21.4 2004 345,744 740,397 255,988 7.4 2005 354,195 746,919 264,555 3.3
2006 395,223 747,969 295,615 --- 2007 425,275 749,019 318,539 7.8 2008 455,328 750,069 341,527 7.2 2009 485,380 751,119 364,578 6.7 Estimated 2010 515,433 752,169 387,693 6.3
2011 545,485 753,219 410,870 6.0 2012 575,538 754,269 434,110 5.7 2013 605,590 755,319 457,414 5.4 2014 635,643 756,369 480,781 5.1 2015 665,695 757,414 504,207 4.9

The Study on Supporting System for Administrations on JICA Natural Resources and Environmental Management Kokusai Kogyo Co., Ltd. in the Kingdom of Thailand Ex Corporation
1-60
0
100,000
200,000
300,000
400,000
500,000
600,000
2001
2002
2003
2004
2005
2006
2007
2008
2009
2010
2011
2012
2013
2014
2015
Year
GP
P (M
il. B
aht)
GPP Actual GPP Estimated
Figure 5: Actual GPP and Future GPP (AYP)
3.5 Reference 5: Future Generation of Municipal Waste in AYP
The rate of generation of municipal waste was forecast on the following conditions:
• The rate at which waste is generated does not increase. Therefore, the amount of generation is in proportion to the increase of population.
• The figures of 0.995kg/person/day for Tessaban and 0.602kg/person/day for Orbortor are used as the rate of generation.
• Proportion of population in Tessaban and Orbortor are 33.9% and 66.1% respectively and will not change from 2005 to 2011.
Table 3-4: Forecast of Generation Amount of Municipal Waste(AYP)
Population Generation Amount of Municipal Waste
Tessaban Orbortor Total year Tessaban Orbortor Total
ton/day ton/day ton/day 2005 253,316 493,603 746,919 252.0 297.0 549.0 2006 253,561 494,408 747,969 252.3 297.6 549.9 2007 253,917 495,102 749,019 252.6 298.1 550.7 2008 254,273 495,796 750,069 253.0 298.5 551.5 2009 254,629 496,490 751,119 253.4 298.9 552.3 2010 254,985 497,184 752,169 253.7 299.3 553.0 2011 255,341 497,878 753,219 254.1 299.7 553.8

The Study on Supporting System for Administrations on JICA Natural Resources and Environmental Management Kokusai Kogyo Co., Ltd. in the Kingdom of Thailand Ex Corporation
1-61
3.6 Reference 6: Forecast of Future Medical Waste Generation in AYP
Infectious/hazardous medical waste was forecast on the following conditions:
• The rate of generation in BMA is applied and 1.32 kg/bed/day in hospitals and 0.46 kg/place/day in health stations is adopted.
• The rate of generation does not change, but the number of beds and health stations increase in proportion to the population.
Table 3-5: Forecast of Generation Amount of Medical Waste(AYP)
Hospital Health Station
Bed Generation
rate Amount Station Generation
rate Amount Total
Year
kg/bed/day kg/day kg/station/day kg/day kg/day 2005 1,015 0.46 467 206 1.32 272 739 2006 1,016 0.46 467 206 1.32 272 739 2007 1,018 0.46 468 207 1.32 273 741 2008 1,019 0.46 469 207 1.32 273 742 2009 1,021 0.46 470 207 1.32 273 743 2010 1,022 0.46 470 207 1.32 273 743 2011 1,023 0.46 471 208 1.32 273 744
3.7 Reference 7: Forecast of Future Industrial Waste(IW)Generation in AYP
Generation amount of industrial waste (IW) was forecast on the following condition based on the study result of “The Study on Master Plan on Industrial Waste Management in the Bangkok Metropolitan Area and its Vicinity in the Kingdom of Thailand (JICA 2002)”.
• The Number of Factories: 1,4411
• Category of Factories: 33 categories
• Category of waste:
Non-HIW (Hazardous Industrial Waste) 14 categories, HIW: 12 categories
• Rate of Recycling: Non-HIW 86.5%, HIW 33.3%
• Generation Rate: Per employee of each category of factory
• The number of employee increases in proportion to economic growth, but the rate of generation will not change.
Table 3-6: Forecast of Non-HIW(AYP)
Amphoe Unit 2005 2006 2007 2008 2009 2010 20111 Phra Nakhon Si Ayutthaya ton/day 32.6 34.8 37.5 40.2 42.9 45.6 48.4
1 The number of factories in GIS database of DEQP/MNRE is less than this. These data are obtained from DIW in 2007 and excel data without information of factory location.

The Study on Supporting System for Administrations on JICA Natural Resources and Environmental Management Kokusai Kogyo Co., Ltd. in the Kingdom of Thailand Ex Corporation
1-62
2 Tha Ruea ton/day 13.6 15.1 16.3 17.5 18.7 19.9 21.13 Nakorn Luang ton/day 46.1 51.5 55.5 59.5 63.5 67.5 71.54 Bang Saai ton/day 21.9 24.4 26.3 28.2 30.2 32.0 34.05 Bang Sai ton/day 14.9 16.6 18.0 19.2 20.5 21.8 23.16 Bang Ban ton/day 12.2 13.6 14.7 15.7 16.8 17.8 18.97 Bangpahan ton/day 12.1 13.5 14.5 15.6 16.6 17.7 18.78 Bang Pa-in ton/day 140.8 157.3 169.5 181.8 194.0 206.3 218.79 Bang Phraek ton/day 0.1 0.1 0.1 0.1 0.1 0.1 0.1
10 Phak Hai ton/day 4.2 4.7 5.1 5.4 5.8 6.2 6.611 Phachi ton/day 2.1 2.3 2.5 2.7 2.8 3.0 3.212 Maha Rat ton/day 1.1 1.3 1.3 1.4 1.5 1.6 1.713 Lad Bua Luang ton/day 33.3 37.3 40.1 43.0 45.9 48.8 51.714 Wang Noi ton/day 49.9 55.8 60.1 64.5 68.8 73.1 77.515 Sena ton/day 32.2 36.0 38.7 41.6 44.4 47.2 50.016 Uthai ton/day 78.3 87.4 94.3 101.1 107.9 114.7 121.6
Generation Amount ton/day 495.4 551.7 594.5 637.5 680.4 723.3 766.8Rate of Recycling % 86.5 86.5 86.5 86.5 86.5 86.5 86.5Recycled Amount ton/day 428.5 477.2 514.2 551.4 588.5 625.7 663.3 Treated and Disposed Amount ton/day 66.9 74.5 80.3 86.1 91.9 97.6 103.5
Table 3-7: Forecast of HIW(AYP)
Amphoe unit 2005 2006 2007 2008 2009 2010 20111 Prha Nakhon Si Ayutthaya ton/day 2.4 2.7 2.9 3.1 3.3 3.5 3.82 Tha Ruea ton/day 1.1 1.2 1.3 1.4 1.5 1.6 1.73 Nakorn Luang ton/day 13.6 15.2 16.4 17.5 18.7 19.9 21.14 Bang Saai ton/day 1.6 1.8 2.0 2.1 2.2 2.4 2.55 Bang Sai ton/day 0.2 0.3 0.3 0.3 0.3 0.4 0.46 Bang Ban ton/day 3.3 3.7 4.0 4.2 4.5 4.8 5.17 Bangpahan ton/day 2.2 2.5 2.7 2.9 3.1 3.3 3.58 Bang Pa-in ton/day 92.2 103.0 111.1 119.1 127.1 135.1 143.29 Bang Phraek ton/day 0.0 0.0 0.0 0.0 0.0 0.0 0.0
10 Phak Hai ton/day 0.1 0.2 0.2 0.2 0.2 0.2 0.211 Phachi ton/day 0.1 0.1 0.1 0.1 0.1 0.2 0.212 Maha Rat ton/day 0.1 0.2 0.2 0.2 0.2 0.2 0.213 Lad Bua Luang ton/day 6.9 7.7 8.3 8.9 9.5 10.1 10.714 Wang Noi ton/day 15.5 17.3 18.7 20.0 21.4 22.7 24.115 Sena ton/day 1.9 2.1 2.3 2.5 2.6 2.8 3.016 Uthai ton/day 82.8 92.5 99.7 106.9 114.1 121.3 128.6
Generation Amount ton/day 224.0 250.5 270.2 289.4 308.8 328.5 348.3Rate of Recycling % 33.3 33.3 33.3 33.3 33.3 33.3 33.3Recycled Amount ton/day 74.6 83.4 90.0 96.4 102.8 109.4 116.0 Treated and Disposed Amount ton/day 149.4 167.1 180.2 193 206 219.1 232.3

The Study on Supporting System for Administrations on JICA Natural Resources and Environmental Management Kokusai Kogyo Co., Ltd. in the Kingdom of Thailand Ex Corporation
1-63
3.8 Reference 8: Master Plans for NREM in State Level
Master Plan in State Level Responsible Organization Item
ONEP MNRE Master Plan
2. Natural Resources Management
2.1 Soil and Land Division of Land Administration
DMR Yes, Master Plan on Geological and Mineral Resources Management in 2004
2.2 Forest RFD None
2.3 Wildlife
DNP Yes, National Wildlife Management Master Plan 2004 to 2013 Yes, Master Plan on individual National Park
2.4 Water Resources DWR
DGR Yes, Master Plan on Water Management for 25 Water Shed
2.5 Mineral Resources
DMR Yes, Master Plan on Geological and Mineral Resources Management in 2004
2.6 Marine and Coastal Resources
DMCR Yes, Master Plan on Erosion Management Yes, Master Plan on Coral Reef and Seaweed Management (under study)
2.7 Biodiversity Office of Biodiversity
DNP Yes, National Strategies and Action Plan for 2003 to 2007
3. Social and Living Environment Management
3.1 Water Quality PCD Yes, Draft Domestic Wastewater Management Plan in 2003
3.2 Solid Waste PCD Yes, Draft National Solid Waste
Management Plan in 2003
3.3 Air Quality PCD Yes, Master Plan for Air Quality and Noise in year 2007 to 2016
3.4 Noise and Vibration
PCD Yes, Master Plan for Air Quality and Noise in year 2007 to 2016
3.5 Hazardous waste and Toxic Substances
PCD Yes, Included in Solid Waste Management Plan
3.6 Urban Environment(Amenity)
Division of Urban Environment Area Planning
None
3.7Natural Environment Culture
Division of Environmental Conservation of Natural and Cultural Heritage
Yes AYP, Master Plan of Historical City
3.8 Global Warming ONEB None: under study. (Data Source) WEB site of individual organizations and MNRE/ONEP (Abbreviation) DMR: Department of Mineral Resources
RFD: Royal Forest Department DNP: National Park, Wildlife and Plant Conservation Department DWR: Department of Water Resources

The Study on Supporting System for Administrations on JICA Natural Resources and Environmental Management Kokusai Kogyo Co., Ltd. in the Kingdom of Thailand Ex Corporation
1-64
DGR: Department of Groundwater Resources DMR: Department of Mineral Resources DMCR: Department of Marine and Coastal Resources PCD: Pollution Control Department
3.9 Reference 9: Trend of Land Use Change in SKP
The trend of land use change in Samut Songkhram province from 1988 to 2007 is shown in Table 3-8.
Table 3-8: Trend of Land Use Change in Samut Songkhram from 1988 to 2007
Area (km2.) Percent Land use
1988 1997 2007 1988 1997 2007
Urban and Built up Land 12.09 21.85 22.14 2.9% 5.3% 5.4%
Agricultural Land 235.08 220.48 223.98 57.0% 53.4% 54.3% Aquaculture Area 95.38 104.32 100.6 23.1% 25.3% 24.4% Mangrove Forest 34.2 23.15 26.97 8.3% 5.6% 6.5% Water body 9.84 9.87 12.64 2.4% 2.4% 3.1% Wetland 8.77 14.93 6.2 2.1% 3.6% 1.5% Salt flats 17.3 15.61 19.45 4.2% 3.8% 4.7%
Total 412.64 410.22 411.98 100% 99.4% 99.8%
1) Urban and Built up Land
There is a large increase from 1988 to 1997 and nearly 10 km2 of land was converted into urban and built up land. Since then, the area did not change significantly. Urban and built up land are mainly located along the Mae Klong river and main road.
2) Agricultural Land
More than half of the land is used for the agricultural land. There was a decreased in this percentage from 1988 to 1997, but it increased slightly from 1997 to 2007. Most of the land is used for planting coconut trees and some fruit trees.
3) Aquaculture Area
The land within about 3 km along the coast is used mainly for Aquaculture. The area slightly increased from 1988 to 1997 but it has been decreasing slightly from 1997 to 2007.
4) Mangrove Forest
Mangrove forest decreased from 1988 to 1997 mainly due to converting it into aquaculture. After 1997, the area has been increasing thanks to various campaigns and planting activities to protect Mangrove forest.
5) Water bodies and Wetland
Bodies of water increased from 1997 to 2007. Hence, the area of wetlands decreased significantly since 1997 to 2007. According to the land use map, it was obvious that the wetland located south west of Amphoe Ampawa had decreased.
6) Salt Flats

The Study on Supporting System for Administrations on JICA Natural Resources and Environmental Management Kokusai Kogyo Co., Ltd. in the Kingdom of Thailand Ex Corporation
1-65
The area of salt flats decreased from 1988 to 1997, and since then the area is increasing and expanding towards the sea coast.
7) Coastal Erosion
In terms of the total area of the province, there was a decrease from 1988 to 1997, but it then increased from 1997 to 2007. Therefore, it can be said from land use maps that coastal erosion is not a serious problem in this province.
3.10 Reference 10: Change of Mangrove Forest Area
The study for land use changes in Samut Songkhram province in ten and twenty years past were done by LANDSAT-5 satellite imagery interpretation. The land use changes were recorded on February 15, 2007, January 2, 1997 and March 30, 1988 and then they were interpreted by a computer program. Following table shows the change of land use and Mangrove forest area was 34.29km2 in 1988, then reduced to 23.15 km2 in 1997 and increased to 26.97 km2 in 2007. The area is increasing but still not reached to the area in 1988.
Table 3-9: Land use by LANDSAT-5 satellite imagery interpretation In Samut Songkhram province
March 30, 1988 January 2, 1997 February 15, 2007
Land use Area Km2
% Area Km2
% Area Km2
%
Urban and built up land 12.09 2.93 21.85 5.33 22.14 5.37
Agricultural Land 235.08 56.97 220.48 53.75 223.98 54.37Aquaculture Area 95.38 23.11 104.32 25.43 100.6 24.42Mangrove Forest 34.20 8.29 23.15 5.64 26.97 6.55Water body 9.84 2.38 9.87 2.41 12.64 3.07Wetland 8.77 2.13 14.93 3.64 6.2 1.50Salt flats 17.30 4.19 15.61 3.81 19.45 4.72
Total 412.66 100 410.21 100.00 411.98 100
Following figure indicates the area where width of mangrove forest is enough to protect the sea shore and where the width is not enough and encountered the risk for erosion.
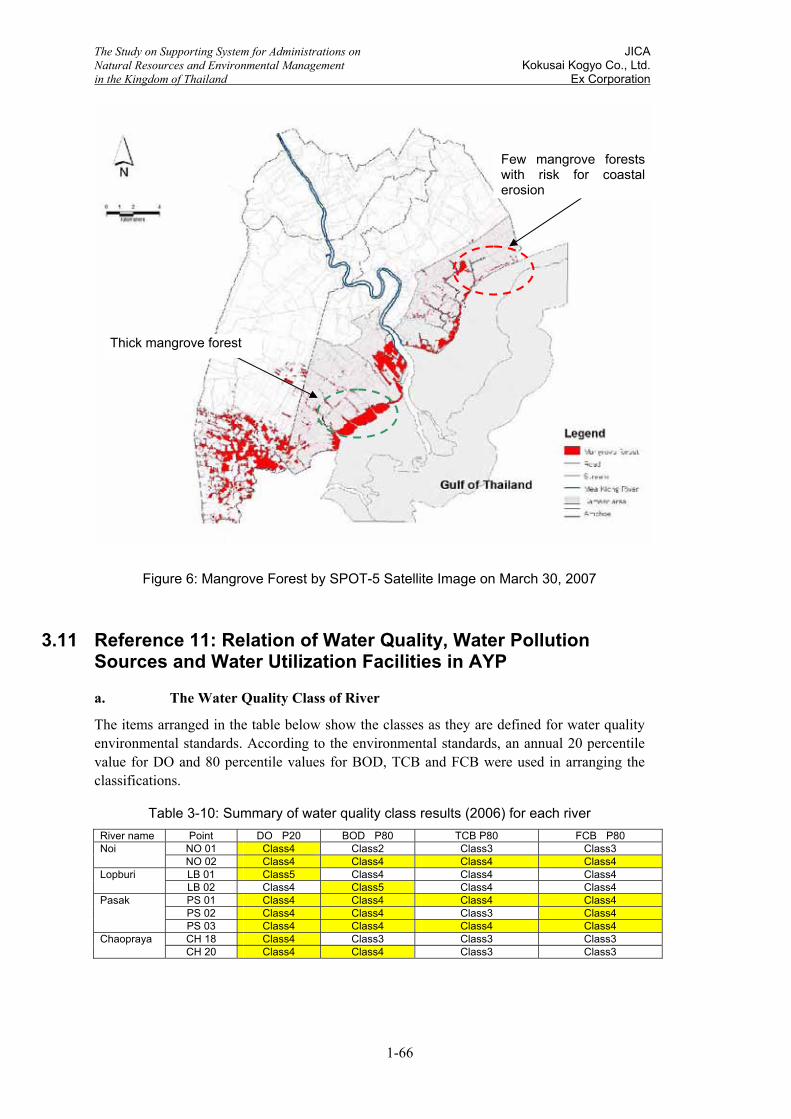
The Study on Supporting System for Administrations on JICA Natural Resources and Environmental Management Kokusai Kogyo Co., Ltd. in the Kingdom of Thailand Ex Corporation
1-66
Figure 6: Mangrove Forest by SPOT-5 Satellite Image on March 30, 2007
3.11 Reference 11: Relation of Water Quality, Water Pollution Sources and Water Utilization Facilities in AYP
a. The Water Quality Class of River
The items arranged in the table below show the classes as they are defined for water quality environmental standards. According to the environmental standards, an annual 20 percentile value for DO and 80 percentile values for BOD, TCB and FCB were used in arranging the classifications.
Table 3-10: Summary of water quality class results (2006) for each river River name Point DO P20 BOD P80 TCB P80 FCB P80
NO 01 Class4 Class2 Class3 Class3 Noi NO 02 Class4 Class4 Class4 Class4 LB 01 Class5 Class4 Class4 Class4 Lopburi LB 02 Class4 Class5 Class4 Class4 PS 01 Class4 Class4 Class4 Class4 PS 02 Class4 Class4 Class3 Class4
Pasak
PS 03 Class4 Class4 Class4 Class4 CH 18 Class4 Class3 Class3 Class3 Chaopraya CH 20 Class4 Class4 Class3 Class3
Few mangrove forests with risk for coastal erosion
Thick mangrove forest

The Study on Supporting System for Administrations on JICA Natural Resources and Environmental Management Kokusai Kogyo Co., Ltd. in the Kingdom of Thailand Ex Corporation
1-67
Figure 7: Summary of Monitoring Results (year 2006)
b. Water Pollution Sources
The large water pollution sources are considered as follows:
• As for domestic waste water, densely populated area like urban area
• Regarding industrial waste water which is high concentration, factories, slaughterhouses, livestock barns, etc.
• Leachate from final solid waste disposal sites
As for the problems on domestic waste water, it is very popular that a housing development project avoids waste water discharge standard by making number of houses developed less than 1002, of which project does not require a central domestic waste water treatment facility. Consequently housing development projects are large pollution sources on domestic waste water.
Since sewerage covering rate in AYP is only about 4%3, 96% of domestic waste water discharges into public water body without treatment although 25% of human feces and urine is treated by septic tank according to the opinion survey.
2 Housing Estate Standards, PCD, http://www.pcd.go.th/info_serv/en_reg_std_water04.html#s4 3 Opinion Survey to LA in AYP /JICA Study Team/2007

The Study on Supporting System for Administrations on JICA Natural Resources and Environmental Management Kokusai Kogyo Co., Ltd. in the Kingdom of Thailand Ex Corporation
1-68
Industrial waste water of an industrial estate in AYP is treated by a central waste water treatment facility of the estate to clear the “Industrial Effluent Standards”. It is observed according to the results of the Water Quality Analysis conducted by the JICA Study Team. It is, however, said that small and medium factories other than those in the industrial estates discharge their waste water into public water bodies without treatment.
There is no leachate (waste water from a final disposal site) treatment facility in AYP and it is discharged into public water body or infiltrated into underground water without treatment.
Main water pollution sources are shown in the Figure below.
Figure 8: Location Map of Water Pollution Sources in AYP
c. Water Utilization Facilities
River water and underground water are utilized as sources of potable, irrigation and industry water. The following figure shows interrelation between Water Pollution Sources above mentioned and Water Utilization Facilities.

The Study on Supporting System for Administrations on JICA Natural Resources and Environmental Management Kokusai Kogyo Co., Ltd. in the Kingdom of Thailand Ex Corporation
1-69
Figure 9: Location Map of Major Water Utilization Facilities in AYP
3.12 Reference 12: Generation Amount of Hazardous Wastes in AYP
a. Domestic Hazardous Waste (HW)
No reports were available regarding the amount and quality of domestic hazardous substances contained in the municipal wastes in AYP. Therefore, the ratio of domestic HW was adopted from the REO 8 study report, of which rate is 0 to 0.07 % of HW. Based on the study, batteries, light bulbs, and chemical containers were categorized as domestic HW.
• Generation amount of municipal solid waste: 549 ton/day4
• Ratio of Domestic HW: 0.00 – 0.07 %-municipal SW5
• Amount of Domestic HW: 0 – 0.38 ton/day
b. Medical Waste
There are 19 hospitals and 206 health stations in AYP, and the number of beds is 1,015 in total.6
4 Data source : REO6 Nonthaburi, 2006 5 Data source : PCD 2003, Muang District Municipality’s Waste Components 6 PEQMP for KPI by AYP

The Study on Supporting System for Administrations on JICA Natural Resources and Environmental Management Kokusai Kogyo Co., Ltd. in the Kingdom of Thailand Ex Corporation
1-70
The generation rate per bed or place for calculation of the amount of medical HW generation is used generation rate of medical waste in Bangkok. The amount of medical waste is calculated as follows.
Table 3-11: Amount of Medical Waste Generated (AYP)
Generation Source
Generation Rate bed/place Amount Generated
Hospital 0.46 kg/bed/day 1,015 bed 467 kg/day
Health Station 1.32 kg/place/day
206 place 272 kg/day
Total 739 /kg/day Note: Actual values for unit generated are for Bangkok
c. Hazardous Industrial Waste (HIW)
There are 1,441 factories located in the province according to information from DIW. The industrial wastes generated at factories differ according to the business code.
The amount of industrial waste (IW) generated is calculated based on the data obtained by “The Study on Master Plan on Industrial Waste Management in the Bangkok Metropolitan Area and its Vicinity in the Kingdom of Thailand (JICA 2002)”.
• Number of factories: 1,4417
• Number of employee: 156,177
• Category of factory: 33 categories
• Category of waste: 14 categories for Non-HIW(Hazardous Industrial Waste) 12 categories for HIW
• Rate of recycling : Non-HIW 86.5%, HIW 33.3%
• Generation rate: Per employee of each factory category
(1) Category of Factory
Business codes have been categorized into 33 codes simplified from 106 MOI codes8.
Table 3-12: Study Code and MOI Code of Factories
Study Code MOI Code Description of Industries
G01 001 – 002, 004 – 009
Food (agricultural product, non-aquatic animals, aquatic animals etc.)
G02 010 – 015 Food (flour, sugar, tea, ice, etc.)
G03 016 – 021 Drink, Beverage
G04 022 Textile, Thread, Fibre
G05 023 – 027 Textile product (Clothes, mats, etc.)
7 The number of factories in GIS database of DEQP/MNRE is less than this. These data are obtained from DIW in 2007 and excel data without information of factory location. 8 The amendment of a ministerial regulation (No.15 BE 2544, 2001) pursuant to the Factory Act was enacted in December 2001.

The Study on Supporting System for Administrations on JICA Natural Resources and Environmental Management Kokusai Kogyo Co., Ltd. in the Kingdom of Thailand Ex Corporation
1-71
G06 028 Apparel
G07 029 – 033 Hide, Fur, Footwear
G08 034 Woodwork (any or many items)
G09 035 – 036 Woodwork (bamboo, rattan, straw, cork, etc.)
G10 037 Furniture
G11 038 – 040 Paper, Cardboard
G12 041 Printed matter
G13 042 – 050 Chemical matter, Petroleum
G14 051 – 052 Rubber
G15 053 Plastic product
G16 054 – 058 Glassware, Ceramics, non-Metallic Matter
G17 059 – 060 Steel basic industries, non-ferrous metal basic industries
G18 061 – 062 Metal products (tools, appliances, household furniture, building interior, etc.)
G19 063 Metal product (construction, installation)
G20 064 Metal product (others)
G21 065 – 066 Machines (Engines, Turbines, Machinery)
G22 067 Machines (for producing metal or wood products)
G23 068 Machines (for paper, chemical, food, textile etc.)
G24 069 – 070 Machines (calculating machines, Accounting machines, Water pumps, air or gas compressors, etc.)
G25 071 – 073 Electric product (Machines or Product under No.70, Radio set, Electric instruments or appliances, etc.)
G26 074 Electric product (Electric Equipment)
G27 075 – 077 Transportation machines (Ships, Trains, Streetcars, Cars or Trailers)
G28 078 – 080 Transportation machines (Motorcycles, Tricycles, Bicycles, Aircraft, Wheeled vehicles, etc.)
G29 081 – 084 Precision machinery
G30 085 – 087 Others (Musical instruments, Sport, Toys, etc.)
G31 088 – 094 Others (Electric power, Gas, Packaging, Cold storage, etc.)
G32 095 Others (Engine-driven for vehicles or motorcycles, etc.)
G33 003, 096 – 106
Others (Stone, Watches or Clocks, Central waste treatment plant, Generating steam, salt, etc.)
(2) Classification of Industrial Waste (IW)
• Non Hazardous Industrial Waste (Non-HIW)
The code of non-HW is categorized as follows based on the Notification of Ministry of Industry No. 1 (B.E. 2541 or A.D. 1998)
Table 3-13: Classification of Non-HIW
Non-HIW Code for the Study
Descriptions
C01-01 Parts of plants such as roots, bark and leaves C01-02 Parts of animals such as bones, skins, hair and excreta
C02 Parts of wood C03 Paper waste C04 Plastics or synthetic rubbers C05 Cloth, thread and fabric

The Study on Supporting System for Administrations on JICA Natural Resources and Environmental Management Kokusai Kogyo Co., Ltd. in the Kingdom of Thailand Ex Corporation
1-72
C06 Animal fat and oil and vegetable oil C07 Natural rubbers C08 Metals and metal alloys (not in salt form)
C09-01 Ceramics C09-02 Glasses
C10 Stone, cement, sand or materials consisting of clay, sand or stone e.g. tile, brick gypsum and concrete
C11 Mixed waste C12 Others
• Hazardous Industrial Waste (HIW)
The code of HIW is categorized as follows based on the MOI Notification No. 6 B.E. 2540 (1997) issued pursuant to the Factory Act B.E. 2535 (1992)
Table 3-14: Classification of HIW
HIW Code for the Study Descriptions
W01 Acid W02 Alkalis W03 Heavy Metal Compounds W04 Liquid Inorganic Compounds W05 Solid Inorganic Compounds W06 Organic Compounds W07 Polymer Materials W08 Fuel, Oil and Grease W09 Fine Chemicals and Biocides W10 Pickling Waste W11 Filter Materials, Treatment Sludge W12 Other Toxic substance (besides W01-W11)
(3) IW Generation Rate
• Non-HIW
The rate of non-HIW generated per employee was calculated for each of the 33 categories and for each type of waste based on the results of the factory survey, as shown in the following table.
Table 3-15: Non-HIW Generation Rate (per employee)
Unit: kg/year/person Study Code Descriptions C01-01 C01-2 C02 C03 C04 C05 C07 C08 C09-01 C09-02 C10 C11 W12 Total
G01 Food (agricultural product, non-aquatic animals, aquatic animals etc.)
16.9 2,987.1 2.8 179.1 1.0 0.1 0.5 3,187.5
G02 Food (flour, sugar, tea, ice etc.) 1.6 13.9 18.6 5.1 50.8 12.2 285.0 387.2
G03 Drink, Beverage 1,294.3 0.9 3.4 18.9 4.1 1,212.8 171.2 2,705.6
G04 Textile, Thread, Fibre 8.3 30.6 327.4 62.0 7.0 13.5 448.8
G05 Textile product (Clothes, mats etc.)
577.3 16.4 16.4 259.1 40.8 0.0 0.0 910.0
G06 Wearing Apparel 7.8 0.4 222.3 0.2 58.0 288.7

The Study on Supporting System for Administrations on JICA Natural Resources and Environmental Management Kokusai Kogyo Co., Ltd. in the Kingdom of Thailand Ex Corporation
1-73
Study Code Descriptions C01-01 C01-2 C02 C03 C04 C05 C07 C08 C09-01 C09-02 C10 C11 W12 Total
G07 Hide, Fur, Footwear 443.7 3.4 55.0 134.9 8.9 1.8 8.9 1.1 657.7
G08 Woodwork (any or many items) 5,577.2 0.3 0.2 104.6 5,682.3
G09 Woodwork (bamboo, rattan, straw, cork etc.)
3,907.9 11.8 127.2 4,046.9
G10 Furniture 5,231.3 12.7 4.7 98.1 5,346.8G11 Paper, Cardboard 720.7 58.2 16.2 1,031.6 1,826.7G12 Printed matter 971.8 1.5 1.4 88.2 1.2 1,064.1G13 Chemical matter, Petroleum 11.0 27.2 12.4 14.6 21.9 87.1G14 Rubber 300.8 50.3 200.9 0.3 679.7 0.6 1.6 1,234.2G15 Plastic product 116.7 36.5 789.7 2.1 4.4 2.7 952.1
G16 Glassware, Ceramics, non-Metallic Matter
0.1 5.1 0.2 61.9 836.1 947.8 702.3 20.1 2,573.6
G17 Steel basic industries, non-ferrous metal basic industries
30.5 30.5 15,128.3 7,623.9 46.4 22,859.6
G18 Metal product (tools, appliances, household furniture, building interior etc.)
3.4 9.2 1.4 4,313.1 4,327.1
G19 Metal product (construction, installation)
54.5 5.5 2,501.8 2,561.8
G20 Metal product (others) 2.3 133.2 1.8 4.6 653.2 795.1
G21 Machines (Engines, Turbines, Machinery)
60.2 121.1 5.0 1,928.8 30.1 352.5 2,497.7
G22 Machines (for producing metal or wood products)
10.6 335.1 10.6 356.3
G23 Machines (for paper, chemical, food, textile etc.)
2.8 1.7 547.2 21.8 573.5
G24
Machines (calculating machines, Accounting machines, Water pumps, air or gas compressors etc.)
56.2 49.9 0.8 106.9
G25
Electric product (Machines or Product under No.70, Radio set, Electric instruments or appliances etc.)
2.4 22.4 55.0 229.2 128.0 170.7 607.7
G26 Electric product (Electric Equipment)
78.7 447.9 440.4 458.8 0.6 3.4 1,429.8
G27 Transportation machines (Ship, Trains, Streetcars, Cars or Trailers)
3.8 46.5 15.0 61.3 1.1 127.7
G28
Transportation machines (Motorcycles, Tricycles, Bicycles, Aircraft, Wheeled vehicles etc.)
0.8 1.9 441.7 23.5 627.0 4.7 47.0 0.8 1,147.4
G29 Precision machinery 3.4 0.7 13.8 6.6 24.5
G30 Others (Musical instruments, Sport, Toys etc.)
1.1 6.4 45.7 277.5 1.3 6.4 2.9 341.3
G31 Others (Electric power, Gas, Packaging, Cold storage etc.)
70.4 0.2 115.7 7.3 1,270.8 1,464.4
G32 Others (Engine-driven for vehicles or motorcycles etc.
4.7 7.8 27.2 39.7
G33
Others (Stone, Watches or Clocks, Central waste treatment plant, Generating steam, salt etc.)
2.5 11.9 2.1 16.5
All Category of Factories 86.5 205.1 351.2 56.4 70.9 50.5 17.8 296.2 6.3 75.7 209.4 29.5 47.5 1,503.0
• HIW
HIW generation rate per employee was calculated in each of the 33 categories and for each type of waste based on the result of the factory survey, as shown in the following table.
The following industrial categories may generate hazardous industrial wastes more than the others.
G03 Drink, Beverage
G13 Chemical matter, Petroleum
G17 Steel basic industries, non-ferrous metal basic industries
G20 Metal product (others)
G25 Electric product (Machines or Product under No.70, Radio set, Electric instruments or appliances, etc.)
G32 Others (Engine-driven for vehicles or motorcycles, etc.)

The Study on Supporting System for Administrations on JICA Natural Resources and Environmental Management Kokusai Kogyo Co., Ltd. in the Kingdom of Thailand Ex Corporation
1-74
Table 3-16: HW Generation Rate per Employee
Unit: kg/year/person Study Code Descriptions W01 W02 W03 W04 W05 W06 W07 W08 W09 W10 W11 W12 Total
G01 Food (agricultural product, non-aquatic animals, aquatic animals etc.)
0.1 0.1
G02 Food (flour, sugar, tea, ice etc.) 0.2 39.5 39.7
G03 Drink, Beverage 139.8 10.4 20.7 1,553.1 1,724.0 G04 Textile, Thread, Fibre 8.2 2.4 0.3 10.9
G05 Textile product (Clothes, mats etc.) 0.0 0.0 0.8 1.8 2.6
G06 Wearing Apparel 0.1 0.1 G07 Hide, Fur, Footwear 0.5 0.0 3.2 3.7
G08 Woodwork (any or many items) 4.9 0.1 80.1 4.4 89.5
G09 Woodwork (bamboo, rattan, straw, cork etc.)
2.4 0.7 3.1
G10 Furniture 11.0 1.8 35.7 146.9 195.4 G11 Paper, Cardboard 0.4 8.1 8.5 G12 Printed matter 80.5 188.4 268.9
G13 Chemical matter, Petroleum 29.3 62.2 21.9 27.7 36.6 0.3 286.8 309.3 774.1
G14 Rubber 0.3 37.0 0.6 37.9 G15 Plastic product 73.7 141.6 94.3 132.6 442.2
G16 Glassware, Ceramics, non-Metallic Matter 0.2 6.7 6.9
G17 Steel basic industries, non-ferrous metal basic industries
4,256.0 4,256.0
G18
Metal product (tools, appliances, household furniture, building interior etc.)
4.5 68.8 73.3
G19 Metal product (construction, installation) 85.1 14.7 99.8
G20 Metal product (others) 5.5 458.2 13.6 38.2 9.1 8.8 306.5 839.9
G21 Machines (Engines, Turbines, Machinery)
46.0 5.0 72.5 29.2 3.3 156.0
G22 Machines (for producing metal or wood products)
60.5 136.7 197.2
G23 Machines (for paper, chemical, food, textile etc.) 1.7 52.7 54.4
G24
Machines (calculating machines, Accounting machines, Water pumps, air or gas compressors etc.)
0.2 61.7 0.7 17.6 2.6 8.8 13.0 104.6
G25
Electric product (Machines or Product under No.70, Radio set, Electric instruments or appliances etc.)
1.7 12.1 0.6 1,121.6 96.2 1,232.2
G26 Electric product (Electric Equipment) 61.6 78.5 12.7 22.6 75.5 250.9
G27 Transportation machines (Ship, Trains, Streetcars, Cars or Trailers)
10.7 1.7 28.1 185.5 96.9 322.9
G28
Transportation machines (Motorcycles, Tricycles, Bicycles, Aircraft, Wheeled vehicles etc.)
11.1 0.2 104.8 28.2 4.7 20.4 54.2 223.6
G29 Precision machinery 4.3 17.0 20.2 8.1 0.0 49.6
G30 Others (Musical instruments, Sport, Toys etc.)
1.1 1.3 2.4
G31 Others (Electric power, Gas, Packaging, Cold storage etc.)
0.6 0.6
G32 Others (Engine-driven for vehicles or motorcycles etc. 43.6 324.0 373.8 4.7 746.1
G33
Others (Stone, Watches or Clocks, Central waste treatment plant, Generating steam, salt etc.)
5.0 1.0 46.6 50.1 102.7
All Category of Factories 1.6 7.0 2.9 19.6 0.6 4.8 5.0 56.4 0.0 0.8 125.3 121.7 345.7

The Study on Supporting System for Administrations on JICA Natural Resources and Environmental Management Kokusai Kogyo Co., Ltd. in the Kingdom of Thailand Ex Corporation
1-75
(4) Methodology of Estimating the Industrial Waste Generation
Industrial waste generation is shown in the equation given below:
∑∑= =
•=n
i
m
jGijMiIWG
1 1)(
where,
IWG : Industrial Waste Generation (tons/year) i : Industrial category (Study Code) j : Type of waste M : Number of employees (person) G : IW generation rate (tons/year/person) n : Number of industrial categories (33 categories) m : Number of waste categories
(5) Generation Amount
The amount of non-HIW and HIW is summarized in the following table. The results are 495.4 ton/day for non-HIW and 224.0 tons/day for HW.
The recycling rate for industrial wastes is generally high since the purity of these wastes is high compared with household wastes. The recycling rate was adopted as 86.5% for non-hazardous wastes and 33.3% for hazardous wastes9.
Table 3-17: Generation Amount of IW (AYP)
Amphoe No of
Factories No of
EmployeesNon-HIW HIW Total
(ton/day) (ton/day) (ton/day)
1 Phra Nakhon Si Ayutthaya
125 3,678 32.6 2.4 35.0
2 Tha Ruer 50 3,540 13.6 1.1 14.7 3 Nakorn Luang 132 13,141 46.1 13.6 59.7 4 Bang Tsai 55 3,513 21.9 1.6 23.5 5 Bang Sai 19 1,228 14.9 0.2 15.1 6 Bang Ban 59 1,560 12.2 3.3 15.5 7 Bang Pahan 90 1,855 12.1 2.2 14.3 8 Bang Pa-in 315 54,087 140.8 92.2 233.0 9 Bang Phreak 2 7 0.1 0.0 0.1
10 Pak Hai 34 612 4.2 0.1 4.3 11 Pa Chi 12 331 2.1 0.1 2.2 12 Maharaj 14 186 1.1 0.1 1.2 13 Lad Bua Luang 56 2,401 33.3 6.9 40.2 14 Wang Noi 166 14,386 49.9 15.5 65.4 15 Sena 95 13,232 32.2 1.9 34.1 16 Uthai 217 42,420 78.3 82.8 161.1
Total Generation Amount 1,441 156,177 495.4 224.0 719.4 Recycling Rate 86.5 33.3 - Recycle Amount 428.5 74.6 503.1 Treated & Disposal Amount 66.9 149.4 216.3
9 The study on industrial wastes in Bangkok and its vicinity carried out by the JICA in 2002

The Study on Supporting System for Administrations on JICA Natural Resources and Environmental Management Kokusai Kogyo Co., Ltd. in the Kingdom of Thailand Ex Corporation
1-76
3.13 Reference13: Priority Setting of Issues in AYP
As mentioned above, there are many issues to be resolved in NREM in AYP. However, there are limited financial and human resources available. In this section, we examine the priority issues to be resolved by the target year 2011 in PEQMP (2008-2011) for AYP.
a. Opinion survey of Stakeholders
a.1 Target groups
An opinion survey was conducted among the following four stakeholder groups. Their answers were collected, added and analyzed according to target group.
Table 3-18: Target Group for Opinion Survey
Target Group Abbreviation Number Local Administration OP-LA-AYP 54 LA Resident OP-RE-AYP 226 Business Establishment
OP-BE-AYP 97
NGO OP-NGO-AYP 5 NGO
a.2 Problems within Local Administration (LA)
The most serious problems within LAs were indicated as follows:
Table 3-19: Problem in LA
Target Group Most Serious Problem Reply Rate (%)
Second Most Serious Problem
Reply Rate (%)
LA Deterioration of NRE 41.1 Insufficient administrative capacity of LA
29.6
Resident Deterioration of NRE 44.7 Stagnation of Economy 31.4 Business Establishment
Stagnation of Economy 45.4 Deterioration of NRE 39.2
NGO Deterioration of NRE 40.0 Insufficient administrative capacity of LA
20.0
a.3 Problems of NREM
Serious problems of NREM according to each target group are listed in the following table. The percentage value shown in the table is the ratio of respondents who selected “4 Very Serious” among six possible choices (1 Not serious at all, 2 Not very serious, 3 Somewhat serious, 4 Very serious, 5 Can’t choose, 6 No response).

The Study on Supporting System for Administrations on JICA Natural Resources and Environmental Management Kokusai Kogyo Co., Ltd. in the Kingdom of Thailand Ex Corporation
1-77
Table 3-20: Problem of NREM
Target Group Most Serious Problem
Reply Rate (%)
Second Most Serious Problem
Reply Rate (%)
LA Water Resources Management
53.7 Solid Waste Management 42.6
Resident Water Resources Management
38.5 Global Warming/Climate Change
19.5*1
Business Establishment
Water Resources Management
35.1 Global Warming/Climate Change
15.5*1
NGO Solid Waste Management
60.0*2 Water Resources Management
60.0*2
*1: A slightly larger number of interviewees actually chose “4 Very serious” for Water Quality than Global Warming. However, those who said Global Warming was “3 Somewhat serious” clearly outnumbered those who considered Water Quality as “3 Somewhat serious”, so Global Warming is shown here as the overall second most important problem.
*2: While the reply rates for the most/second important problem are the same in the “4 Very serious” category, Solid Waste Management is shown here as the overall most important problem, as more interviewees ranked it as “3 Somewhat serious”.
The respondents indicated the following reason for their choice of which item was the most serious problem, as follows:
Table 3-21: Reason for Selecting Most Serious Problem
Most Serious Problem
Specific issue Reason for choice
Water Resources Management
• Flood • Loss of agricultural land and property • Isolation of transportation
Solid Waste Management
• Non-sanitary landfill • Occurrence of environmental and sanitary problems
The respondents indicated the following reason for their choice of which item was the second most serious problem, as follows:
Table 3-22: The Reason for Selecting the Second Most Serious Problem
Second Serious Problem
Specific issue Reason for choice
Solid Waste Management
• Improper disposal of huge amounts of waste
• Difficulty of acquisition of disposal site
• Occurrence of serious environmental problems
Global Warming • Rise in temperature • Health problems • Increase of power fees
Water Resources Management
• Flood • Loss of agricultural land and properties
• Loss of fertile land
a.4 Resident requests to LA
There are 42 LAs to which residents require improvement of the local area (78% of all LAs). The request for “Construction of infrastructure like roads and bridges” is the most common

The Study on Supporting System for Administrations on JICA Natural Resources and Environmental Management Kokusai Kogyo Co., Ltd. in the Kingdom of Thailand Ex Corporation
1-78
request (requested in 69.0% of LAs) and “Lighting of public areas” is the second one (38.1% of all LAs), with “Socioeconomic development” as the third (31.0% of all LAs).
b. Priority examined in SWOT Analysis
The PEQMP-KPI Formulation Committee was held at the AYP Conference Room on 27th June 2007 chaired by the Vice Governor, and a SWOT Analysis was conducted with 20 relevant participants directed by a moderator from AY University. SWOT Analysis analyzes the Strengths (S), Weaknesses (W), Opportunities (O) and Threats (T) of AYP to resolve the problem of NREM.
In addition to SWOT Analysis, the priority among issues to be resolved for NREM was examined in the PEQMP-KPI Formulation Committee.
The results of the latter discussion are as shown below:
Table 3-23: Priority Issues on NREM in AYP Discussed in SWOT Analysis Meeting
Priority NREM Problems Suggestion for Preventive Measures and/or Solution 1. Solid Waste
Management (SWM) 1. Promote LAs to have integrated SWM system 2. Support LAs to gain knowledge and guidelines for
appropriate SWM 3. Study form and method of SWM appropriate for LAs 4. Support establishment of a waste disposal center 5. Create public awareness for residents to reduce,
separate and recycle waste 6. Support LAs to make a cluster to construct waste
disposal system and support recycling activities 2. Surface Water
Resources and Flood Control
1. Support residents to use septic tanks for primary treatment of wastewater
2. Support LAs to have wastewater treatment system in their communities
3. LA should exert control over building construction in accordance with Building Control Act regarding wastewater treatment from buildings
4. Exert control over business enterprises so that they will not discharge wastewater to public water bodies without treatment
5. Establish volunteer network to monitor environmental quality
6. Rehabilitate and improve canals and natural water courses in order to receive water and drain water effectively
7. Support activities to remove weeds in canals in order to reduce pollutants from water sources
8. Formulate flood prevention and disaster mitigation plan 3. Tourism Places for
Art, Culture and History
1. Follow master plan of historical city 2. Campaign for tourists to keep tourist sites clean 3. Systematic cooperation and coordination between LAs
and related agencies 4. Build up capacities of LA staff to conserve and protect
art, cultural and historical places 4. Air Pollution and
Noise 1. Promote agricultural technology without open burning 2. Increase efficiency in control burning of vacant lots in

The Study on Supporting System for Administrations on JICA Natural Resources and Environmental Management Kokusai Kogyo Co., Ltd. in the Kingdom of Thailand Ex Corporation
1-79
urban areas in order to reduce impact to air quality 3. Control activities or enterprises that cause air pollution
problems, noise and vibration in community areas 5. Biodiversity 1. Support residents who participate in conservation and
rehabilitation of biodiversity in important areas 2. Support knowledge exchange among community
network in the field of biodiversity 6. Groundwater
Resources 1. Prepare guidelines to prevent groundwater
contamination 2. Improve quality of contaminated groundwater to a level
suitable for drinking and domestic use 3. Rehabilitate water sources which were damaged due to
flood 7. Soil Resources and
Land Use 1. Educate local residents in land use benefit, soil
conservation, and water quality management, and also develop volunteer network
8. Urban Environment 1. Develop community areas in accordance with comprehensive city plan
2. Increase green areas, vacant areas and public parks in urban areas and around government agencies, and also conduct scenery improvement in public recreational areas
3. Support residents in community environment management by development of public land
4. Create understanding and awareness among all stakeholders so that they take part in community environment management
Source: PEQMP-KPI (2008-2011), AYP
c. Examination of Priorities
Since NREM encompasses a wide-ranging variety of sectors, it is quite difficult to decide the priority ranking among projects from differing sectors. Additionally, individual NREM projects routinely require a huge sum of money to implement. Thus it becomes important to conduct sufficient survey, research, and planning activities and to exhaustively consider the feasibility of each project, in order to make each individual NREM project cost-effective. Specifically, priority among projects should be determined only after extensive comparative analyses between sector master plans. AYP lacks these basic master plans in various NREM sectors. Therefore, the Study Team suggests the following regarding priorities:
1. First of all, top priority should be given to the formulation of master plans for each NREM sector.
2. For solid waste management and conservation of cultural heritage, both opinion survey among stakeholders and priority issues discussion at the SWOT analysis meeting have confirmed their high priority status. In both sectors, master plans ‘Provincial Master Plan for Solid Waste Management’ and ‘Master Plan for Historical City’ have been formulated. We recommend that the priority projects in the solid waste management sector be implemented according to its master plan. For the cultural heritage sector, our recommendation is different. First of all, the ‘Master Plan for Historical City’ is still incomplete as a master plan, due to its lack of concrete implementation schedule and budget plan. Secondly, in Thailand, the

The Study on Supporting System for Administrations on JICA Natural Resources and Environmental Management Kokusai Kogyo Co., Ltd. in the Kingdom of Thailand Ex Corporation
1-80
Department of Fine Arts and Department of Historical Parks are responsible for the conservation of cultural heritage and have their own policies and methods. Thus, we recommend that the conservation of cultural heritage be left to these two organizations.
3. For master plan formulation, the priority among NREM sectors aside from solid waste management and cultural heritage can be ranked as follows, based on the result of the opinion survey among stakeholders and examination of priority issues conducted during SWOT analysis.
• Flood protection
• Preservation of water quality
• Tackling global warming
• Air pollution protection measures
• Preservation of biodiversity
• Conservation of water resources
• Conservation of soil and land resources
• Improvement of urban environment
4. This Study has confirmed that surface water quality is deteriorating, and thus water quality improvement measures and improvement of the water supply system, in areas where surface water is utilized as a water source for tap water, have top priority. It is recommended that the current situation be urgently examined and an improvement plan be formulated as a top priority issue.
5. Finally, strengthening the NREM administrative capacities of LAs has equal priority with any urgent individual issue, as they hold responsibility over NREM in their respective localities.
3.14 Reference 14: Selection of Priority Programs for AYP
This section corresponds to Part 2 Situation and Issues on NREM, 6) Selection of Priority Programs of the PEQMP.
a. Selection Procedure
Through the examination of priorities (see previous section), the Study Team and their counterparts (C/P) selected priority issues based on the following thought process:
• The priority issues for PEQMP (2008-2011) are issues in NREM on the provincial scale, and issues that should be dealt with by 2011.
• Since available finance for the investment on NREM by 2011 is limited, it is difficult to improve all NREM issues identified in the above section by the year.
• To solve the issues by 2011, several Priority Projects must be implemented. The Priority Projects with a common goal (i.e. solving the same priority issue) were combined as a Priority Program.
• Priority Programs can be divided into two major categories:

The Study on Supporting System for Administrations on JICA Natural Resources and Environmental Management Kokusai Kogyo Co., Ltd. in the Kingdom of Thailand Ex Corporation
1-81
1. Improvement in individual NREM sectors
2. Strengthening of NREM administrative capacities in AYP
b. Selection of Priority Programs
Through the selection procedure described above, and discussions with counterparts, the following Priority Programs were selected for implementation by 2011:
1. Improvement in individual NREM sectors
• Program for improvement of solid waste management
• Program for flood prevention and disaster mitigation
• Program for water quality preservation in public water bodies
• Program for safe and quality water supply
2. Strengthening of NREM administrative capacities in AYP
• Program to strengthen linkage between Central, Provincial, and Local Administrations
• Program to strengthen NREM capacities of LAs
3.15 Reference 15: Details of Priority Projects in SKP
a. Program for Conservation and Rehabilitation of Aquatic Resources in SKP
The term ‘resources’ usually means ‘raw or processed materials for industrial purposes’. Major examples are bio resources, aquatic resources, and mineral resources.
Mineral resources including minerals and petroleum are non-renewable resources, which will eventually disappear due to consumption. The important management issue for non-renewable resources is resource use management. The management of the processes after its extraction (such as developing methods to use smaller amounts, to recycle more efficiently, and to develop alternative resources) is important, as it is impossible to increase the amount of the resource itself. Eventually, the resource will be completely used up.
On the other hand are renewable resources, such as aquatic resources. ‘Aquatic resource’ is a collective term for fish and other aquatic animals and plants, which will keep growing, laying eggs etc., and increase in number within the aquatic environment. Theoretically, we can continue fishing forever without using up the resource, i.e. finding no fish in the seas and rivers. Resource extraction management becomes important for renewable resources.
Renewable resources are characterized by the ability for the resource to increase through reproduction. Aquatic resources can be efficiently extracted forever, if one takes care to control excessive exploitation, the exploitation of the young of each species, and by maintaining a suitable catch amount.

The Study on Supporting System for Administrations on JICA Natural Resources and Environmental Management Kokusai Kogyo Co., Ltd. in the Kingdom of Thailand Ex Corporation
1-82
Investigation for Current Condition of Aquatic Resources
Conservation and Rehabilitation of Aquatic Resources in SKP
Improvement of habitats
Setting Control Targets
Fishing area
Size of fish
Size of catch net
Investigation for Past Catch of Aquatic Resources
Estimation of Current Volume of Aquatic Resources
Calculation of Proportion of Catch
Assessment of Aquatic Resources
Increase Aquatic Resources
Fishing methods
Fishing period
Afforestation of Mangrove
Improvement of Surrounding Environment
Preparation of Egg Laying Place
Development of Fish Farm
Release Fry
Healthy Condition
Unhealthy Condition
Control Fishery Operation
Catch volume
Figure 3-10: Relation between Each Project and Process of Conservation and Rehabilitation of Aquatic Resources
a.1 Project 1: Formulation of a conservation and rehabilitation plan
1. Name of Program Conservation and Rehabilitation of Aquatic Resources in SKP
2. Name of Project Formulation of a conservation and rehabilitation plan
3. Sector in NREM Marine and Coastal Resources
4. Responsible Agency
Provincial Fishery Office (PFO)、Orbortor
5. Supporting Agency Provincial Environment Office (PEO), Mangrove Forest Development Station No 7 (MFDS7), Fishery Faculty, Kasetsart University (FFKU), Marine Shrimp Research and Development Center of SKP (MSRDC)
6 Monitoring and PEO with all the stakeholders

The Study on Supporting System for Administrations on JICA Natural Resources and Environmental Management Kokusai Kogyo Co., Ltd. in the Kingdom of Thailand Ex Corporation
1-83
Evaluation Agency 7. Background of the
Project Although the GPP for the whole province is on the increase, the GPP for the fishery sector in 2005 (356 million baht) has decreased to half of the 2001 figures (658 million baht). All of four opinion survey target groups pointed out that the most serious problem of NREM in SKP is “Marine and Coastal Resources”. Therefore the investigation for current conditions of marine and coastal resources and formulate the comprehensive master plan in order to conserve and rehabilitate aquatic resources is urgently required.
8. Justification of the Project
Relation with Upper Plans: To be confirmed
9. Objectives of the Project
Formulation of master plan for conservation and rehabilitation of aquatic resources in SKP
10. Objectively Verifiable Indicators
Contents of master plan for conservation and rehabilitation of aquatic resources in SKP
11. Main Components of the Project
• Investigation for current condition of aquatic resources • Investigation for past catch of aquatic resources • Assessment of current condition of aquatic resources and set
control targets • Formulation of comprehensive master plan for conservation
and rehabilitation of aquatic resources. 12. Implementation
Schedule
Component Implementation Investigation for current condition and past catch of aquatic animals
2008
Formulation of master plan 2008-2009 13. Budgetary Plan
Component Budget Source Investigation for current condition and past catch of aquatic animals
500,000 Province
Formulation of master plan 500,000 Province 14 Benefit of the
Project Beneficiary: Population earning living from aquatic resources
a.2 Project2: Control Illegal Fishing Practice and Dissemination of Sustainable Fishing Practice
1. Name of Program Conservation and Rehabilitation of Aquatic Resources in SKP 2. Name of Project Control Illegal Fishing and Dissemination of Sustainable Fishing
Practice 3. Sector in NREM Marine and Coastal Resources 4. Responsible
Agency Provincial Fishery Office (PFO), LA
5. Supporting Agency Provincial Environment Office (PEO), Provincial Administration under Ministry of Interior (MOI)
6 Monitoring and Evaluation Agency
PEO with all the stakeholders
7. Background of the Project
Although the GPP for the whole province is on the increase, the GPP for the fishery sector in 2005 (356 million baht) has decreased
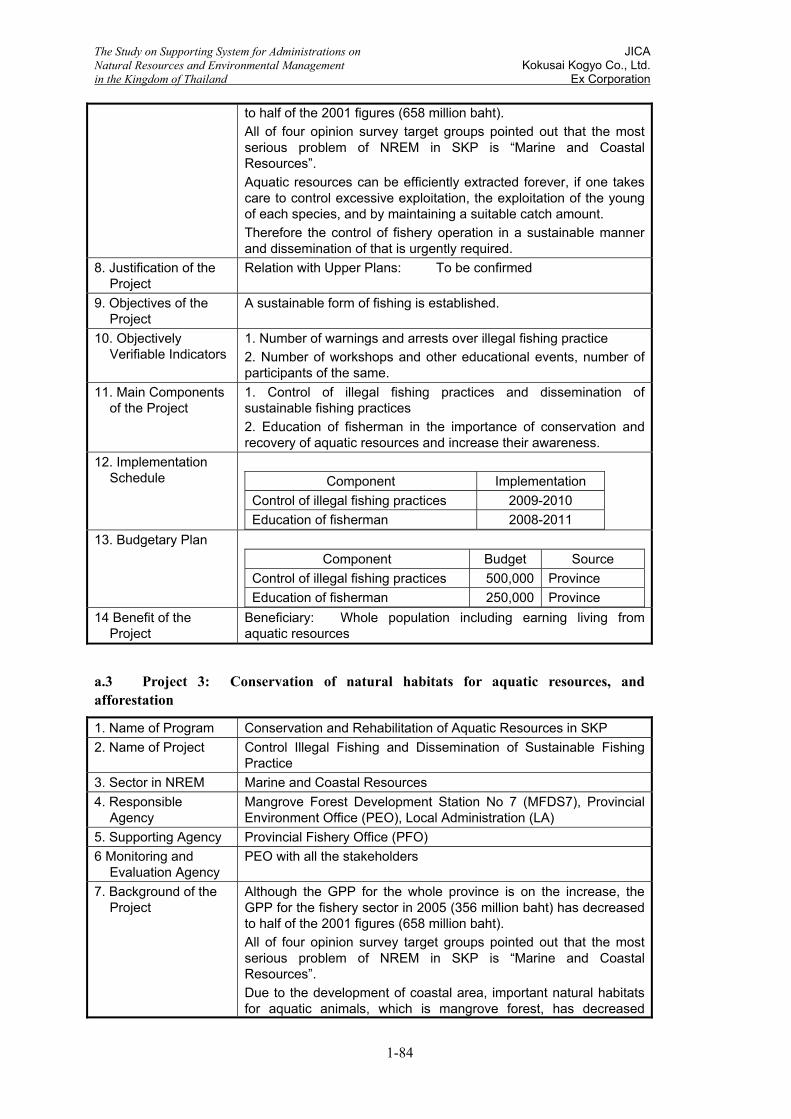
The Study on Supporting System for Administrations on JICA Natural Resources and Environmental Management Kokusai Kogyo Co., Ltd. in the Kingdom of Thailand Ex Corporation
1-84
to half of the 2001 figures (658 million baht). All of four opinion survey target groups pointed out that the most serious problem of NREM in SKP is “Marine and Coastal Resources”. Aquatic resources can be efficiently extracted forever, if one takes care to control excessive exploitation, the exploitation of the young of each species, and by maintaining a suitable catch amount. Therefore the control of fishery operation in a sustainable manner and dissemination of that is urgently required.
8. Justification of the Project
Relation with Upper Plans: To be confirmed
9. Objectives of the Project
A sustainable form of fishing is established.
10. Objectively Verifiable Indicators
1. Number of warnings and arrests over illegal fishing practice 2. Number of workshops and other educational events, number of participants of the same.
11. Main Components of the Project
1. Control of illegal fishing practices and dissemination of sustainable fishing practices 2. Education of fisherman in the importance of conservation and recovery of aquatic resources and increase their awareness.
12. Implementation Schedule
Component Implementation
Control of illegal fishing practices 2009-2010 Education of fisherman 2008-2011
13. Budgetary Plan Component Budget Source
Control of illegal fishing practices 500,000 Province Education of fisherman 250,000 Province
14 Benefit of the Project
Beneficiary: Whole population including earning living from aquatic resources
a.3 Project 3: Conservation of natural habitats for aquatic resources, and afforestation
1. Name of Program Conservation and Rehabilitation of Aquatic Resources in SKP 2. Name of Project Control Illegal Fishing and Dissemination of Sustainable Fishing
Practice 3. Sector in NREM Marine and Coastal Resources 4. Responsible
Agency Mangrove Forest Development Station No 7 (MFDS7), Provincial Environment Office (PEO), Local Administration (LA)
5. Supporting Agency Provincial Fishery Office (PFO) 6 Monitoring and
Evaluation Agency PEO with all the stakeholders
7. Background of the Project
Although the GPP for the whole province is on the increase, the GPP for the fishery sector in 2005 (356 million baht) has decreased to half of the 2001 figures (658 million baht). All of four opinion survey target groups pointed out that the most serious problem of NREM in SKP is “Marine and Coastal Resources”. Due to the development of coastal area, important natural habitats for aquatic animals, which is mangrove forest, has decreased

The Study on Supporting System for Administrations on JICA Natural Resources and Environmental Management Kokusai Kogyo Co., Ltd. in the Kingdom of Thailand Ex Corporation
1-85
significantly in last decades. Investigation revealed that there is moderate amount of erosion, at a rate of 1 to 5 meters per year, at the northeast coast of the Gulf of Thailand. Therefore the conservation and rehabilitation of mangrove forest is urgently required both for coastal erosion protection and conservation of natural habitat of the aquatic resources.
8. Justification of the Project
Relation with Upper Plans: To be confirmed
9. Objectives of the Project
Habitats of aquatic resources are established and risk of coastal erosion will be decreased through afforestation of mangrove forest.
10. Objectively Verifiable Indicators
Afforestation area statistics and total area statistics of mangrove forest.
11. Main Components of the Project
Conservation of natural habitats for aquatic resources, i.e. coastal mangrove forests, and increase in safe habitats through afforestation.
12. Implementation Schedule
Component Implementation
Afforestation of mangrove 2008-2011 13. Budgetary Plan
Component Budget Source Afforestation of mangrove 1,000,000 Province
14 Benefit of the Project
Beneficiary: Whole population including earning living from aquatic resources

Manual 2
Suggestions for Utilization of GIS Database on Natural Resource and Environmental Management (NREM)

The Study on Supporting System for Administrations on JICA Natural Resources and Environmental Management Kokusai Kogyo Co., Ltd. in the Kingdom of Thailand Ex Corporation
2-1
1 GIS databases in the Ministry of Natural Resources and Environment (MNRE)
1.1 Overall status of GIS databases
NREM deals with an extremely wide range of fields related to people’s lives, from natural environment, to living environment, to social environment. The collection, verification, and sorting of environmental data, as reliable as possible, as much as possible, and in as many fields as possible, is necessary for the formulation of a NREM plan.
Due to their wide-ranging topics, environmental data is scattered among many environment-related agencies and the collection, verification, and sorting takes an extremely large amount of time and labor. Additionally, surveys to obtain new environmental quality data (e.g. water and air quality, waste volume and quality, faunal and floral ecology) also often requires a large amount of time and labor. Due to such high labor and time costs, the latter should, in principle, be separately conducted from the formulation of NREM plans.
There is also the necessity to update environmental information and to revise NREM plans, in response to changes in environmental quality. To deal with these tasks and to improve ease of access to environmental information during the process of NREM plan formation, it is necessary to take steps to unify environmental information, to share it, and to make it open to the public. These are the reasons why the NREM GIS database will be constructed.
This Study is a very short study, a little over one year, and the most important factor for its smooth operation and success is the collection of reliable environmental information, as fast as and as mach as possible. Luckily, MNRE already had GIS database constructed and in use in its various departments. The Study Team decided to use this existing NREM GIS database as much as possible to obtain and sort out environmental information about the two model provinces.
Environmental information for the two model provinces exist in the following NREM GIS databases in MNRE:

Th
e St
udy
on S
uppo
rtin
g Sy
stem
for A
dmin
istr
atio
ns o
n J
ICA
N
atur
al R
esou
rces
and
Env
iron
men
tal M
anag
emen
t K
okus
ai K
ogyo
Co.
, Ltd
. in
the
Kin
gdom
of T
haila
nd
Ex C
orpo
ratio
n
2-2
Tabl
e 1:
GIS
Dat
abas
es C
onta
inin
g E
nviro
nmen
tal I
nfor
mat
ion
of th
e Tw
o M
odel
Pro
vinc
es
Org
aniz
atio
n Es
tabl
ishe
d or
M
odifi
ed Y
ear
Con
sulta
nt
Num
ber o
f Lay
ers
Issu
es
1. C
ITC
/OPS
20
05
Non
e Ab
out 1
0 •
No
cons
ulta
nt w
as e
mpl
oyed
for t
he c
onst
ruct
ion
of G
IS d
atab
ase.
•
CIT
C c
ould
not
col
lect
dat
a by
them
selv
es.
• It
has
sate
llite
data
from
199
9 to
200
6.
2. D
EQ
P
• D
ata
base
20
02
TEI
37 L
ayer
s •
TEI (
Thai
Env
ironm
enta
l Ins
titut
e) e
ntru
sted
des
ign
wor
ks o
f the
dat
abas
e st
ruct
ure
to E
SR
I/US
A.
• Th
e st
ruct
ure
and
inst
ruct
ion
book
s w
ere
prov
ided
by
the
ES
RI.
• U
pdat
e 20
05
NA
•
RE
O &
PE
O u
pdat
es d
atab
ase
whe
n bu
dget
is a
lloca
ted.
•
GIS
Dat
a ch
ecke
d by
JIC
A S
tudy
Te
am
2005
-
37 L
ayer
s bu
t 25
for
Ayu
tthay
a an
d 21
S
amut
Son
gkhr
am
JIC
A P
repa
rato
ry T
eam
rece
ived
a G
IS d
ata
of D
EQ
P th
roug
h O
NE
P a
nd th
e S
tudy
Te
am e
xam
ined
the
data
and
foun
d as
follo
ws:
•
The
data
base
is w
ell s
truct
ured
acc
ordi
ng to
the
stru
ctur
e bo
ok b
ut s
ome
data
in
the
data
base
do
not f
ollo
w th
e in
stru
ctio
n bo
ok.
• S
ome
data
wer
e ol
d an
d it
does
not
hav
e so
me
impo
rtant
dat
a lik
e A
ir qu
ality
, N
oise
mon
itorin
g, e
tc.
3. O
NE
B/O
NE
P
2005
TE
SC
O
37 L
ayer
s ot
her
than
DE
QP
S
tudy
Tea
m is
exa
min
ing
the
data
and
foun
d as
follo
ws:
•
Dat
abas
e st
ruct
ure
diffe
rs fr
om it
of D
EQ
P.
• It
does
not
hav
e so
me
impo
rtant
dat
a lik
e po
pula
tion,
etc
. 4.
PE
O in
Ayu
tthay
a 20
07
Raj
abat
h
Uni
vers
ity
One
new
laye
r is
adde
d to
DE
QP
da
taba
se
• P
EO
/AY
P e
ntru
sted
the
wor
k to
the
Raj
abat
h U
nive
rsity
incl
udin
g da
ta c
olle
ctio
n an
d th
e U
nive
rsity
pre
pare
d so
me
laye
rs
• N
ew la
yer o
n so
me
pollu
tion
sour
ces
like
hosp
ital,
apar
tmen
t, et
c. w
as p
repa
red.
•
Add
ition
al d
ata
on fa
ctor
ies
wer
e co
llect
ed.
5. R
EO
8
2002
N
A
Sam
e as
DE
QP
•
Upd
ate
will
be c
ondu
cted
in 2
008.

The Study on Supporting System for Administrations on JICA Natural Resources and Environmental Management Kokusai Kogyo Co., Ltd. in the Kingdom of Thailand Ex Corporation
2-3
A detailed examination of the background and current situation of GIS DB development by the Study Team led to the following observations.
• An NREM GIS database has been worked upon since 1992 by the organization which is now Environmental Information Center (EIC) within the Department of Environmental Promotion (DEQP). Its GIS database formulation was contracted to TEI (Thai Environmental Institute) with aid of ESRI of USA. 1/50,000 topographic maps were used as a base map for this GIS database and the NREM GIS database took recognizable from around 2002.
• The NREM GIS database is basically the basis of all MNRE internal GIS databases, although each department within MNRE has been updating or adding layers according to their needs. The NREM GIS Database built upon 1/50,000 base maps has been managed by EIC/DEQP until 2002.
• MNRE was formed when the environmental administration function was separated out from Ministry of Science, Technology, and Environment (MOSTE) and combined with environmental-related agencies from many other ministries. At the same time, the NREM GIS database was deemed to be principally a policy formulation tool and the Center for Information Technology and Communication (CITC) under the Office of Permanent Secretary (OPC) was put in charge of its updating and management. The EIC/DEQP at the same time began promoting community- and LA-based environmental improvement using spatial information including aerial photographs with a much better resolution than 1/50,000.
• While MNRE has officially decided to place the management responsibilities for NREM GIS database under CITC, practical steps toward unification of NREM GIS information within the ministry have not been taken. According to CITC, the NREM GIS database in their possession only consists of basic spatial layers and lacks additional environmental information. Currently the main function of CITC is to provide information technology services within the OPS, and to manage the network system. Additionally, for the whole ministry, the CITC gives PC use suggestions to staff and provides training opportunities.
• There are 10 departments in MNRE, and each department has a section that is in charge of databases and IT. In ONEP, this is the Database & Information System Section within the Monitoring and Evaluation Division. This IT section has 9 staff members and their main functions can be described as: 1) infrastructure development for IT within ONEP, 2) development of application programs, for example for meeting room reservations, and 3) server management of various databases related to the responsibilities of ONEP, such as EIA project management databases and biodiversity management databases. Other IT sections within other departments are conjectured to have similar functions.
• According to the Database & Information System Section, there is no exchange of information between itself and other divisions and departments within MNRE, including CITC; there is also no exchange between IT sections of REO and PEO. In other words, the responsibilities of IT sections in each department is limited to IT within its department, and ministry-wide IT tasks fall to the CITC, but the CITC is currently not fulfilling such functions.
• Each department and each REO has made parts of their environmental information available to the public through their website. Through meticulous gathering of
The Study on Supporting System for Administrations on JICA Natural Resources and Environmental Management Kokusai Kogyo Co., Ltd. in the Kingdom of Thailand Ex Corporation
2-4
such published information, it is physically possible to achieve a certain level of environmental information unity and sharing. However, such an approach will require a vast amount of time and labor. It is clear that the unification and sharing of environmental information under the NREM GIS database has occurred to a sufficient level even within MNRE. It is assumed that the unification and sharing of information between ministries is probably nonexistent at this point.
• The DEQP-developed part of the NREM GIS database is set up in the 16 REO and several PEO. REO and PEO updates its GIS databases using their own funds and subsidies from DEQP, but funds are extremely limited and updating has not progressed much. The NREM GIS database for the two model provinces has not changed much since its 2002 development by DEQP.
1.1.1 Management and use status of the NREM GIS database
As stated in the previous section, responsibility for the management of the NREM GIS database has fallen on the CITC. But practically, the IT sections in each department and each REO has been maintaining their own GIS databases which are all based upon the NREM GIS database developed by DEQP in 2002, by updating information and adding layers according to their needs and whenever they obtain additional information. Each department and each REO publishes information from its database on their websites, but the departments and REO rarely communicate with each other.
The use of NREM GIS databases is, like its management, left up to each department and each REO; each uses their GIS databases according to their needs, each with their own limitations, and each with their own ingenious methods.
1.1.2 Improvement of the NREM GIS database
Currently the NREM GIS database contains an insufficient amount of basic data and layers for the two model provinces to formulate an executable PEQMP. There is an additional problem with the current NREM GIS database, as mentioned in previous sections, specifically the lack of unification of environmental information even within MNRE.
Therefore, the Study Team will unify environmental information within the two model provinces, collect information still lacking but necessary for the formulation of PEQMP from various agencies, and thus improve the current NREM GIS database. The improvement will follow steps listed below:
1. Check the existing NREM GIS database: confirm and verify the information already in the NREM GIS database, and understand what additional information and layers are necessary for the formulation of PEQMP.
2. Obtain and enter additional information: the first step is to collect data scattered within various departments of MNRE and regional/provincial agencies. Then, for data held by other ministries and agencies, open information from websites etc. shall be checked first. If the information is unavailable through public channels, it will be requested through MNRE. Basically, there will be no additional field studies to obtain new data.
3. Consider the forms of use for the NREM GIS database: the most useful function of the NREM GIS database is that it allows the user to simultaneously, spatially grasp multiple forms of environmental information. The various kinds of environmental information can be displayed together as overlapping layers of information, and information can be compared to each other on the same screen. But to do this, it is necessary to first find

The Study on Supporting System for Administrations on JICA Natural Resources and Environmental Management Kokusai Kogyo Co., Ltd. in the Kingdom of Thailand Ex Corporation
2-5
the necessary information or layers and display it on the screen. One of the problems in the current form of use of the NREM GIS database is the insufficient use of this most useful comparative function for plan formulation. This Study will consider what forms of use of the NREM GIS database might be necessary for plan formulation.
1.1.3 Check the existing NREM GIS database
The Study Team has checked the NREM GIS databases in two model provinces, which are based on the DEQP-made NREM GIS database except for certain parts developed by TESCO for ONEP in 2005(please refer to Table 1). The contents of the DEQP and ONEP-directed parts are described in the following sections.
a. DEQP GIS database
As mentioned earlier, the DEQP GIS database was developed over 10 years, and is separately structured for the 75 out of 76 provinces, excluding Bangkok.
This GIS database has been developed using the Arc GIS software range from ESRI. The structure, condition of data, and the year of late update is shown in the table below.
Table 2: Data Structure etc. of the DEQP GIS Database Ayutthaya Samut Songkhram
Item Spatial data Data
Updated year of present
data Remarks Spatial
data DB Link Updated year of
present data Remarks
1 Air Quality N N
2 Amphoes Y Name, ID, Area, Location
2002 Y Name, ID, Area, Location 2001
3 Aquifers Y Area, Location 2003 Y Area, Location 2001
4 Aspect N N
5 Basins Y Name, Area, Location 2003 Y Name, Area,
Location 2001
6 Contours Y Elevation point data 2002 Y Elevation point
data 2001
7 EIA Projects N N 8 Elevation N N
9 Factories Y Name, location, Fact ID, Reg. No.
2004 Y Name, location, Fact ID, Reg. No.
2001
10 Forest Y Area, Location 2002 Y Area, Location 2001
11 Forest Conservation N N
12 Forest Use N N
13 Geologic Structures N N
14 Geology Y Area, Location, Symbol
2002 Y Area, Location, Symbol
2001
15 Hospital/Sanitary Landfill Y Location,
Name, Size 2004 Only hospital Y 2001 Only hospital
16 Irrigation Project Y Name, Area 2003 N Name, Area
17 Land Use Y Area, Land use, ID
2003 (base data 2001&1993)
Year 2536 & 2544 Y Area, Land
use, ID 2001 (base data 1988) Year 2531
18 Mining Permits N N
19 Municipalities and Sanitary Districts
Y Area, Name, Code, Location
2002 Y Area, Name, Code, Location
2001
20 NGO Projects N N
21 Noise Monitoring N N
22 Places and Public Facilities
Y Name, Location 2004 N
23 Political Boundaries Y Amphoe,
Tambon 2003 Y Amphoe, Tambon 2001
24 School Y Location, Name 2004 Y Location,
Name 2001
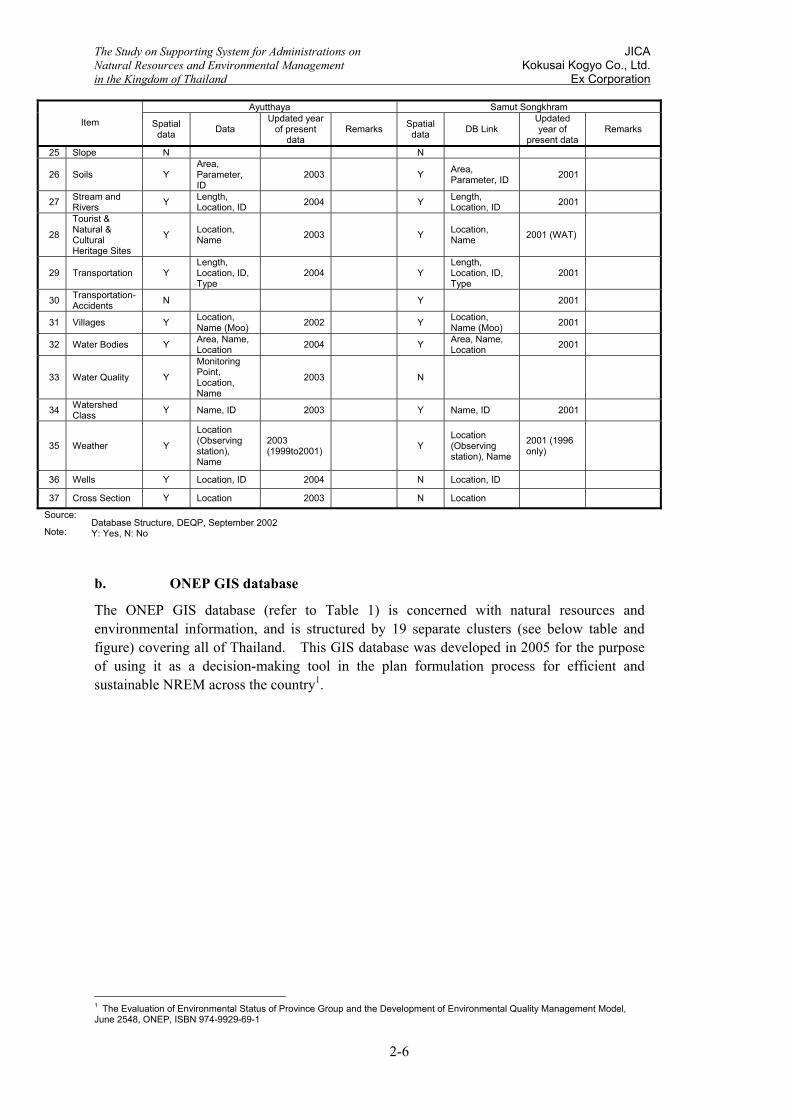
The Study on Supporting System for Administrations on JICA Natural Resources and Environmental Management Kokusai Kogyo Co., Ltd. in the Kingdom of Thailand Ex Corporation
2-6
Ayutthaya Samut Songkhram Item Spatial
data Data Updated year
of present data
Remarks Spatial data DB Link
Updated year of
present data Remarks
25 Slope N N
26 Soils Y Area, Parameter, ID
2003 Y Area, Parameter, ID 2001
27 Stream and Rivers Y Length,
Location, ID 2004 Y Length, Location, ID 2001
28
Tourist & Natural & Cultural Heritage Sites
Y Location, Name 2003 Y Location,
Name 2001 (WAT)
29 Transportation Y Length, Location, ID, Type
2004 Y Length, Location, ID, Type
2001
30 Transportation-Accidents N Y 2001
31 Villages Y Location, Name (Moo) 2002 Y Location,
Name (Moo) 2001
32 Water Bodies Y Area, Name, Location 2004 Y Area, Name,
Location 2001
33 Water Quality Y
Monitoring Point, Location, Name
2003 N
34 Watershed Class Y Name, ID 2003 Y Name, ID 2001
35 Weather Y
Location (Observing station), Name
2003 (1999to2001) Y
Location (Observing station), Name
2001 (1996 only)
36 Wells Y Location, ID 2004 N Location, ID
37 Cross Section Y Location 2003 N Location
Source:
Note: Database Structure, DEQP, September 2002 Y: Yes, N: No
b. ONEP GIS database
The ONEP GIS database (refer to Table 1) is concerned with natural resources and environmental information, and is structured by 19 separate clusters (see below table and figure) covering all of Thailand. This GIS database was developed in 2005 for the purpose of using it as a decision-making tool in the plan formulation process for efficient and sustainable NREM across the country1.
1 The Evaluation of Environmental Status of Province Group and the Development of Environmental Quality Management Model, June 2548, ONEP, ISBN 974-9929-69-1

The Study on Supporting System for Administrations on JICA Natural Resources and Environmental Management Kokusai Kogyo Co., Ltd. in the Kingdom of Thailand Ex Corporation
2-7
Figure 1: Clusters used by ONEP
Table 3: Details of each Cluster Name Area(Km2) Provinces 1 Upper North (Lanna) 88,235.89 Chiang Mai, Lamphun, Lampang, Mae Hong Son, Chiang Rai, Phayao Phrae, Nan2 Lower North (cluster 1) 54,693.55 Phitsanulok, Tak, Phetchabun, Sukhothai, Uttaradit 3 Lower North (cluster 2( 29,105.82 Nakhon Sawan, Uthai Thani, Kamphaeng Phet, Phichit 4 Upper Northeast (cluster 1) 33,069.86 Udon Thani, Nongbualumphu, Nong Khai, Loei 5 Upper Northeast (cluster 2) 26,216.16 Mukdahan, Sakon Nakhon, Nakhon Phanom, Kalasin 6 Central Northeast 24,110.20 Khon Kaen, Maha Sarakham, Roi Et 7 Lower Northeast (cluster 1) 52,386.69 Nakhon Ratchasima, Chaiyaphum, Buri Ram, Surin 8 Lower Northeast (cluster 2) 31,983.13 Ubon Ratchathani, Amnatjarean, Si Sa Ket, Yasothon 9 Upper Central (cluster 1) 5,646.00 Nonthaburi ,Phra Nakhon Si Ayutthaya, Pathum Thani ,Ang Thong
10 Upper Central (cluster 2) 13,124.60 Saraburi, Lop Buri, Sing Buri, Chai Nat 11 Lower Central (cluster 1) 32,144.12 Ratchaburi ,Suphan Buri ,Nakhon Pathom ,Kanchanaburi 12 Lower Central (cluster 2) 13,853.64 Phetchaburi, Prachuap Khiri Khan, Samut Songkhram, Samut Sakhon 13 Lower Central (cluster 3) 20,245.22 Chacheangsao, Samut Prakan ,Nakhon Nayok, Sakaew, Prachin Buri 14 Central (East) 17,386.95 Chon Buri ,Rayong, Chanthaburi,Trat 15 Upper South 22,303.11 Surat Thani ,Chumphon ,Ranong 16 Middle South (cluster 1) 18,087.91 Nakhonsitammarat, Trang, Phatthalung 17 Middle South (cluster 2) 9,316.95 Phuket ,Phangnga, Krabi 18 Border South (cluster 1) 10,930.84 Pattani ,Yala ,Narathiwat 19 Border South (cluster 2) 10,971.46 Songkhla, Satun
Total 513,812.55 75 provinces Data Source: The Secretariat of the Prime Minister, government, 1 December, 2546

The Study on Supporting System for Administrations on JICA Natural Resources and Environmental Management Kokusai Kogyo Co., Ltd. in the Kingdom of Thailand Ex Corporation
2-8
This GIS database has been developed using the Arc GIS software range from ESRI. The structure and data sources are shown in the following table:
Table 4: Data structure and data sources in ONEP GIS Database
No Theme ONEP Layer Scale Data Source Cluster No.09 AYP
Cluster No.12SKP
P-011 (1.1) Province Group 1:50,000 Polygon Office of the National Economic and Social Development Board x x
P-012 (1.2) Province 1:50,000 Polygon Royal Survey Department x x P-013 (1,3) District 1:50,000 Polygon Royal Survey Department x x
01
Administration
P-014 (1,4) Tambon 1:50,000 Polygon Department of Local Administration (2546) x x
02 Community P-020 (2.1) Village 1:50:000 Point Royal Survey Department, Rural Development Information Center (2546)
x x
P-031 (3.1) National Park 1:50,000 Polygon National Park, Wildlife and Plant Conservation Department --- x
03
Conservation Area
P-032 (3.2) Wildlife Sanctuary 1:50,000 Polygon National Park, Wildlife and Plant
Conservation Department --- x
P-041 (4.1) National Forest 1:50,000 Polygon Royal Forest Department --- x
P-042 (4.2) Forest land Use Area (CEA) 1:50,000 Polygon National Park, Wildlife and Plant
Conservation Department --- x 04
Forest
P-043 (4.3) Present Forest Area 1:50,000 Polygon Land Development Department
(2546)
P-051 (5.1) Ramsar Site 1:50,000 Polygon OEPP x x 05 Wetland
P-052 (5.2) Main Thai Wetland 1:50,000 Polygon OEPP --- x
06 P-060 Watershed Class (1A-5) 1:50,000 Polygon OEPP x x
07 P-070 Land Use 1:50,000 Polygon Land Development Department (2546) x x
P-081 (8.1) Soil Series 1:50,000 Polygon Land Development Department x x P-082 (8.2) Soil Groups 1:50,000 Polygon Land Development Department x x
08
Soil Resources
P-083 (8.3) Crop Suitability 1:50,000 Polygon Analyzed by Consultant
09 P-090 Geology 1:250,000 Polygon Department of Mineral Resources x x
P-101 (10.1) Underground Water Layer 1:100,000 Polygon Department of Groundwater
Resources x x
P-102 (10.2) Potential of Water Wells 1:100,000 Polygon Department of Groundwater
Resources x x 10
Geohydrology
P-103 (10.3) wells (2546) 1:50,000 Point Department of Groundwater Resources x x
P-111 (11.1) Watershed 1:50,000 Polygon Department of Water Resources, 2546 x x 11
Basin Area P-112 (11.2) Sub
Watershed 1:50,000 Polygon Department of Water Resources, 2546 x x
(From Research)
P-121 (12.1) Coral 1:50,000 Line Department Marine and Coastal resources, UNEP (-) (-)
P-122 (12.2) Sea Grass 1:50,000 Line Department Marine and Coastal resources, UNEP (-) x
12
Marine and Coastal resources
P-123 (12.3) Mangrove 1:50,000 Polygon Department Marine and Coastal resources (-) x
P-131 (13.1) Potential Mineral Sources 1:50,000 Polygon Department of Mineral
Resources x x 13
Mineral Resources
P-132 (13.2) License 1:50,000 Polygon Department of Primary Industries and Mines, 2546 x x
P-141 (14.1) Industrial 1:50,000 Point The Industrial Estate Authority of Thailand, 2546 x x 14
Industrial Estate and factory P-142 (14.2) Industrial
Works 1:50,000 Point Department of Industrial Works, 2546 x x

The Study on Supporting System for Administrations on JICA Natural Resources and Environmental Management Kokusai Kogyo Co., Ltd. in the Kingdom of Thailand Ex Corporation
2-9
No Theme ONEP Layer Scale Data Source Cluster No.09 AYP
Cluster No.12SKP
15 P-150 Road 1:50,000 Line Royal Survey Department, Land Development Department x x
16 P-160 Water way 1:50,000 Line Royal Survey Department, Land Development Department x x
P-171 (17.1) Water Area 1:50,000 Polygon Land Development Department, 2546 --- x
17
Water Resources P-172
(17.2) Amount of Water in Main Reservoirs
1:50,000 Polygon Royal Irrigation Department, 2546 --- x
18 P-180 Tourism sites 1:50,000 Point Department of Environmental Quality Promotion and distributed Documents
x x
19 P-190 Culture Polygon,Link
The Tourism Authority of Thailand and Documents x x
P-201 Population Polygon,Link
Office of the National Economic and Social Development Board
P-202 -Statistic(2536-2546)
20
P-203 - Forecast
21 P-210
Development Strategies of Province / province Group
Polygon,Link
Department of Skill development, Office of the national Economic and Social Development Board
x x
P-221 - Drought 1:50,000 Polygon Land Development Department x x 22
Potential Disaster areas P-222 - Flood 1:50,000 Polygon Land Development Department x x
23 P-230
Environment protection and Pollution Control Zones
1:50,000 Polygon OEPP and Pollution Control Department
24 P-240 City Plan 1:50,000 Point, Link
Department of Public Works and Town & Country Planning x x
25 P-250 Responsible Areas Under Regional Environment Office
1:50,000 Polygon OEPP x x
26 P-260 Arts Areas 1:50,000 Point The Fine Arts Department x x 27 P-270 Conservation Nature 1:50,000 Point OEPP --- x
28 P-280 Conservation Geology 1:50,000 Point Department of Mineral
Resources (-) (-)
29 P-290 Community Waste Water Treatment Project
1:50,000 Point OEPP
30 P-300 Community Solid Waste Project 1:50,000 Point OEPP
31 P-310 Composition of Waste 1:80,000 Polygon,
Link Pollution Control Department
32 P-320 Forest Areas Change 1:50,000 Polygon By Consultant
33 P-330 Agriculture on Upland 1:50,000 Polygon By Consultant --- x
34 P-340 Agriculture in Conservation Forest 1:50,000 Polygon By Consultant --- x
35 P-350 Agriculture in Upper Watershed (Class 1A)
1:50,000 Polygon By Consultant --- x
36 P-360 Village and Disaster Areas 1:50,000 Polygon,
Point By Consultant
37 P-370 land Use Changes 1:50,000 Polygon Land Development Department --- x Source: The Evaluation of Environmental Status of Province Group and the Development of Environmental Quality Management Model, June 2548, ONEP, ISBN 974-9929-69-1
Note: X: exist ---: none, (-): partially exist

The Study on Supporting System for Administrations on JICA Natural Resources and Environmental Management Kokusai Kogyo Co., Ltd. in the Kingdom of Thailand Ex Corporation
2-10
2 Utilization of GIS DB for NREM What kind of works in local administration does GIS data base can be utilised. In general, the work which deal with map is suitable for utilize GIS data base such as;
• Road management
• Water works and waste water management
• Fixed assets management
• Forest management
GIS data base has been utilized for the above works since they need to deal with a lot of partial data and drawings. Furthermore, following maps are developed using GIS software recently in developed countries.
• Disaster Prevention Map: Maps indicating the evacuation route, places and risk of disaster such as flood.
• Education Map: Maps indicating the place of educational organizations and contents of education in the organizations.
• Barrier Free Map: Maps showing the public facilities with barrier free concept.
MNRE has commenced development of NREM GIS data base since 1992 and completed in 2002. All the REO and the most part of PEO have been provided with NREM GIS data base. In spite of investing a lot of money and considerable budget was allocated for maintenance of NREM GIS data base, NREM GIS data base has not been fully utilized for Provincial NREM.
Current situation and change of NREM in model provinces has been presented in area bases using NREM GIS data base in JICA Study. But there are certain conditions when GIS data base will be used for NREM. Especially, as for the collection of data, updating data, utilization for daily activities, it must be careful for promoting GIS database with full understanding of the conditions and limitations which GIS database has.

The Study on Supporting System for Administrations on JICA Natural Resources and Environmental Management Kokusai Kogyo Co., Ltd. in the Kingdom of Thailand Ex Corporation
2-11
2.1 Advantages and Disadvantages of using GIS data base for NREM
Followings are the advantages and disadvantages of using GIS data base for NREM.
Table 5: Advantages and Disadvantages of using GIS database
Usage Advantages Disadvantages Formulation of Provincial EQMP
• GIS data base provides basic information to show current and past NRE in whole Province
• GIS data base provides basic information of NRE such as Environmental Hot Spot for the formulation/modification of a land use plan and control land use.
• Since planning by using PC screen is difficult, it needs to print out a large scale map for planning. Large scale map printing needs a considerable time, experience and cost.
• Since current GIS data base was constructed based on 1/50,000 topographic map, it requires a large scale map like a 1/5,000 for sector planning. In addition current data base can not provide sufficient information for it. It requires a considerable investment to improve the GIS data base for sector planning purpose.
NRE Information Management
• GIS data base can integrate basic NRE information and provide them to the public easily.
• It requires experts for data input and output of necessary information, and money for data collection and output of information.
Daily NREM Activities
• GIS data base is very useful tools to provide area based NREM information for public relations and educations.
• It can not be used frequently for daily NREM activities because of difficulty of data input and output.
2.2 Recommendations
• Since experts are necessary for data input / output by a large plotter and budget for data collection / output, it might be difficult for a PEO to have such experts and budget allocation for operation and maintenance (O&M). As REO has GIS experts, it is suitable office to take responsibility of O&M of regional / provincial GIS database as a regional information center. GIS database of PEO shall have a function as only user of it.
• For use of area based information (output) such as sector planning and land use planning / control, it requires hard copies of area based information as output of GIS database information such as Hot Spots, preferably a large scale hard copy by a plotter.
• Area based information on aerial photograph is very useful for NREM because of easy understanding situation.

The Study on Supporting System for Administrations on JICA Natural Resources and Environmental Management Kokusai Kogyo Co., Ltd. in the Kingdom of Thailand Ex Corporation
2-12
3 Combination of Layers for presenting current situation of NREM In order to formulate PEQMP, there are necessary categories of information (hereinafter called layers in GIS) to be considered for presenting current situations and issues effectively.
These layers are divided into two categories; one is the layers which must need to be considered. And the other is the layers which better to be considered.
Furthermore, overlaying of those necessary layers does not present the issues clearly which residents considered it is a big issue on environmental point of view. Therefore, supplement investigation such as opinion survey or SWOT analysis shall be implemented in order to collect more information on the issue.
3.1 Natural Resources
a. Land and Soil Resources
EQMP on land and soil resources require location of pollution sources, geology including underground water, geography and so on. Improvement plan on current situations and precaution measures will be formulated referring to GIS database. Administrative boundary shall be included as a layer in order to indicate the area clearly.
Table 6: Combination of Layers for Land and Soil Resources
Description Layers Remarks Need to be considered Aquifers, Geologic Structure, Geology,
Soil, Wells,
Better to be considered Amphoes, Aspect, Contours, Factories, Mining Permits, Boundaries(Province, District and Tambon), Slope,
b. Forest Resources
EQMP on forest resources require the transition of forest area from past to now. Following layers will be required for future preservation plan and utilization plan. Future land use or location of illegal dumping might affect on formulation of EQMP on forest resources
Table 7: Combination of Layers for Forest Resource
Description Layers Remarks Need to be considered Forest, Forest Conservation, Forest
Use, Conservation area(Ramsar area), Land use
Change of forest cover area shall be examined
Better to be considered Amphoes, Aquifers, Land Use, Boundaries(Province, District and Tambon), Water Bodies, Weather, Illegal Dump Site
Illegal dump on forest area shall be examined

The Study on Supporting System for Administrations on JICA Natural Resources and Environmental Management Kokusai Kogyo Co., Ltd. in the Kingdom of Thailand Ex Corporation
2-13
c. Wild Life Resources
EQMP on wild life resources is highly related with forest resources and coastal resources. Weather and provincial development plan, land use also affect on EQMP on wild life resources
Table 8: Combination of Layers for Wild Life Resources
Description Layers Remarks Need to be considered Forest, Forest Conservation, Land use,
Forest Use, Conservation area (Ramsar area),
Better to be considered Amphoes, Aquifers, Irrigation Project Areas, Boundaries(Province, District and Tambon), Water Bodies, Weather, Illegal Dump Site, Provincial Development Plan
Habitat of wildlife is not exactly fixed. Rough zone will be presented in GIS map.
d. Water Resources
EQMP on water resources is related with utilization of surface water and underground water. Condition of water intake and waste water discharge may affect planning stage. Following layer shall be included.
Table 9: Combination of Layers for Water Resources
Description Layers Remarks Need to be considered Aquifers, Drainage Basins, irrigation
Project Areas, Water Bodies, Wells, Waste water treatment Project, Water Supply facilities,
Better to be considered Amphoes, Contours, Boundaries(Province, District and Tambon), Soil, Streams and Rivers, Watershed Classification, Conservation area(Ramsar area), Illegal Dump Site, Hydrological data, Slaughter house,
e. Mineral Resources
EQMP on mining resources is related to geological structure, geology. And mining permit which indicate the current mining operation can be presented.
Table 10: Combination of Layers for Mineral Resources
Description Layers Remarks Need to be considered Geologic Structure, Geology, Better to be considered Amphoes, mining Permits,
Boundaries(Province, District and Tambon), Soil, Gravel and sand pits,

The Study on Supporting System for Administrations on JICA Natural Resources and Environmental Management Kokusai Kogyo Co., Ltd. in the Kingdom of Thailand Ex Corporation
2-14
f. Coastal Resources
EQMP on coastal resources is related with land use, conservation area such as Ramsar convention area. Coastal soil erosion can be presented based on the change of land use from analysis of satellite images.
Table 11: Combination of Layers for Mineral Resources
Description Layers Remarks Need to be considered Land Use, Conservation area(Ramsar
area),
Better to be considered Amphoes, Boundaries(Province, District and Tambon),
g. Biodiversity
EQMP on biodiversity aims to protect biodiversity in order to maintain a balance of food chain and save other life affected by the human beings activities. Therefore the analysis of how the human being activities affect to other lives is important and overlaying function can be utilized for the this purpose.
Table 12: Combination of Layers for Biodiversity
Description Layers Remarks Need to be considered Forest, Forest Conservation, Forest
Use, Land use, Conservation area(Ramsar area),
Better to be considered Air quality, Amphoes, Aquifers, irrigation Project Areas, Boundaries(Province, District and Tambon), Weather, Water quality, Provincial Development Plan,
Location of pollution source might be considered.
3.2 Environment
a. Water Quality
EQMP on water quality needs to clarify the water supply quality and water quality in the public water body. Following layers will be referred to analyze the effects on them.
Table 13: Combination of Layers for Water Quality
Description Layers Remarks Need to be considered Aquifers, Drainage Basins, Factories,
irrigation Project Areas, Streams and Rivers, Water Bodies, Water Quality Monitoring Station, Wells, Waste Water treatment Project, Water Supply facilities, Slaughter house,
Better to be considered Amphoes, EIA Project Areas, Boundaries(Province, District and Tambon), Illegal Dump Site, Hydrological data,

The Study on Supporting System for Administrations on JICA Natural Resources and Environmental Management Kokusai Kogyo Co., Ltd. in the Kingdom of Thailand Ex Corporation
2-15
b. Solid Waste
EQMP on solid waste needs to clarify generation sources of domestic, industrial, medical wastes from following layers and utilized for collection and transportation planning, facility construction planning.
Table 14: Combination of Layers for Solid Waste
Description Layers Remarks Need to be considered Hospital, Community Solid Waste
Project, MSW intermediate treatment facilities, Sanitary landfill, Illegal Dump Site, Population, Land use
Better to be considered Amphoes, Factories, Boundaries (Province, District and Tambon), Transportation
Location of airport might affect to site selection of landfill site
c. Air Quality
EQMP on air quality needs to clarify pollution source and affect on living environment. Pollution source consists of point source such as factories, river port, etc. and movable source such as vehicles on the road.
Table 15: Combination of Layers for Air Quality
Description Layers Remarks Need to be considered Air Quality, Factories, Transportation,
EIA Project
Better to be considered Amphoes, Boundaries (Province, District and Tambon), Transportation-Accident Location,
d. Noise and Vibration
EQMP on noise and vibration needs to clarify generation sources of noise and vibration such as factories, river port, transport and construction site and so on. Inputting construction site on GIS is not a easy task since the data needs to be updated very frequently. So another way of monitoring will be required.
Table 16: Combination of Layers for Noise and Vibrations
Description Layers Remarks Need to be considered Factories, Noise Monitoring Sites,
River Port, Mining permit
Better to be considered Amphoes, EIA Project Area, Boundaries(Province, District and Tambon), Transportation, Transportation-Accident Location,
e. Toxic and Hazardous Substances
EQMP on toxic and hazardous wastes need to clarify the generation source of toxic and hazardous wastes such as factories, hospitals and some landfill sites.

The Study on Supporting System for Administrations on JICA Natural Resources and Environmental Management Kokusai Kogyo Co., Ltd. in the Kingdom of Thailand Ex Corporation
2-16
Table 17: Combination of Layers for Toxic and Hazardous Wastes
Description Layers Remarks Need to be considered Factories, Hospital, Landfill site, EIA
Project Area Landfill sites which do not have leachate treatment.
Better to be considered Amphoes, Mining Permits, Boundaries(Province, District and Tambon),
f. Urban Environment
EQMP on urban environment needs to clarify various urban facilities, natural environment and so on. Combination of following layers will be required.
Table 18: Combination of Layers for Urban Environment
Description Layers Remarks Need to be considered Land use, Hospital, School, Population, Better to be considered Amphoes, Aspect, Contours, Factories,
Irrigation Project Area, Municipalities and Sanitary Districts, NGO Project Area, Places/Public Facilities, Boundaries(Province, District and Tambon), Tourist and Natural and Cultural Heritage Sites, Transportation, Transportation-Accident Location, Villages, Community Solid Waste Project, MSW intermediate treatment Facilities, Sanitary Landfill, Illegal Dump Site, Economic Index, Provincial Development Plan, Slaughter house,
g. Natural and Cultural Heritage
EQMO on natural and cultural heritage needs to clarify the geological and social condition of location and make linkage with other development plan.
Table 19: Combination of Layers for Urban Environment
Description Layers Remarks Need to be considered Forest, Forest Conservation, Forest
Use, Tourist and Natural and Cultural Heritage Sites, Conservation area
Better to be considered Amphoes, Boundaries(Province, District and Tambon)
h. Global Warming
The issue of global warming is related with many aspects of Natural Resources and Environment. So it is quite difficult to indicate the current situation and cause of global warming by GIS layers. This issue must be treated in a comprehensive manner.

The Study on Supporting System for Administrations on JICA Natural Resources and Environmental Management Kokusai Kogyo Co., Ltd. in the Kingdom of Thailand Ex Corporation
2-17
Table 20: Summary of Necessary Layers for Each Natural Resources and Environment Management
DEQP 1 Natural Resources 2 Social and Living Environment Data base Code
Layer Land and Soil
Use
Forest Resource
Wild Life Resource
Water Resource
Mineral Resource
Coastal Resource
Bio diversity
Water Quality
Solid Waste
Air Quality
Noise and
Vibration
Toxic and Hazardous Substances
Urban Environ
ment
Natural and
Cultural Heritage
Global Warming
D-01 Air Quality ◎
D-02 Amphoes ○ ○ ○ ○ ○ ○ ○ ○ ○ ○ ○ ○ ○ ○ D-03 Aquifers ◎ ○ ○ ◎ ○ ◎
D-04 Aspect ○
D-05 Drainage Basins ◎ ◎
D-06 Contours ○ ○
D-07 EIA Project Area ○ ◎ ○ ◎
D-08 Elevation Zones
D-09 Factories ○ ◎ ○ ◎ ◎ ◎ ○
D-10 Forest ◎ ◎ ◎ ◎ D-11 Forest Conservation ◎ ◎ ◎ ◎ D-12 Forest Use ◎ ◎ ◎ ◎ D-13 Geologic Structure ◎ ◎
D-14 Geology ◎ ◎
D-15 Hospital ◎ ◎ ◎ ○
D-16 Irrigation Project Areas ○ ◎ ○ ◎ ○ ○
D-17-1 Land Use ◎ ◎ ◎ ◎ ◎ ◎
D-17-2 Land Use (Optional Design Using Regions)
○ ○ ○
D-18 Mining Permits ○ ○ ◎ ○
D-19 Municipalities and Sanitary Districts ○
D-20 NGO Project Areas ○
D-21 Noise Monitoring Sites ◎
D-22 Places/Public Facilities ○
D-23-1 Province, District and Tambon Boundaries ○ ○ ○ ○ ○ ○ ○ ○ ○ ○ ○ ○ ○ ○ ○
D-23-2
Province, District and Tambon Boundaries (Optional Design Using Regions
○ ○ ○ ○ ○ ○ ○ ○ ○ ○ ○ ○ ○ ○ ○
D-24 School ◎ ○
D-25 Slope ○
D-26 Soil ◎ ○ ○
D-27 Streams and Rivers ○ ◎
D-28 Tourist and Natural and Cultural Heritage Sites
○ ◎
D-29-1 Transportation ◎ ○ ○
D-29-2 Transportation (Optional Design using Routes)
○ ○ ○
D-30 Transportation – Accident Location ○ ○ ○
D-31 Villages ○
D-32 Water Bodies ○ ○ ◎ ◎
D-33 Water Quality Monitoring Stations ◎
D-34 Watershed Classification ○
D-35 Weather ○ ○ ○
D-36 Wells ◎ ◎ ◎
Exi
stin
g la
yer
D-37 Cross Section
N-01 Conservation area (Ramsar area) ◎ ◎ ○ ◎ ◎
N-02 Waste water treatment Project (Sewage Treatment facilities)
◎ ◎
N-03 Community Solid Waste Project ◎ ○
MSW intermediate treatment facilities ◎ ◎ ○
SWM Sanitary landfill ◎ ○
Illegal Dump Site ○ ○ ○ ○ ◎ ◎ ○
N-04 Water Supply facilities ◎ ◎
N-05 Hydrological data ○ ○ ○
N-06 Population ◎ ◎
N-07 Economic index ○
N-08 Provincial Development Plan ○ ○ ○
N-09 Slaughter house ○ ◎ ○
New
laye
r
N-10 Gravel and sand pits ○ ○
Note: ;◎: need to be considered、○: better to be considered

The Study on Supporting System for Administrations on JICA Natural Resources and Environmental Management Kokusai Kogyo Co., Ltd. in the Kingdom of Thailand Ex Corporation
2-19
4 Training for NREM GIS data base
4.1 Objective:
The objective of the Seminar is to provide training so the two target groups (listed below) can fulfill their tasks (also listed below): Target groups:
• GIS database manager: e.g. staff in IT section of REO who operate GIS software
• GIS database user: e.g. ONEP, REO, PEO, LA staff who use GIS output
Tasks of the two target groups:
Target Target Organization Tasks
GIS database manager IT section of REO • GIS managers should have basic knowledge of GIS software as they are operating GIS software in their work.
• GIS managers should maintain and update their GIS database, and distribute necessary information in hard copies or files to the GIS users upon request.
• GIS managers should be able to create necessary maps indicating the current situation, relevant issues, all the while considering local conditions.
GIS database user ONEP, PEO, LAs • GIS users do not need to know the details of GIS software but should be able to utilize the out put (both in hard copy and file) of GIS database in their work.
• GIS users should know how to use simple software such as Arc Reader or Acrobat Reader to efficiently present the current situation and relevant issues on NRE, in their local area.
• GIS users should know what kind of data is in the GIS database, and how they can utilize them.

The Study on Supporting System for Administrations on JICA Natural Resources and Environmental Management Kokusai Kogyo Co., Ltd. in the Kingdom of Thailand Ex Corporation
2-20
4.2 Results
Day 1: Participants on the first day seemed to be proficient in computer use, and/or knew GIS already. Some were bored by the introductory materials in the morning, but most seemed to enjoy the workshops, where they certainly learned new skills. The lecturers provided by the local consultant were generally skilled in time management, and had easy-to-understand slides and handouts. They were well prepared and had training data ready on the participants’ computers. The last few workshops were delayed because the lecturers had too much material to cover and had to improvise a bit, but it seemed to be the participants’ consensus that they would like to stay late and finish. Some of the participants said that they would like improvements to the GIS database, but they unfortunately did not mention the specifics in their questionnaire. Day 2: Participants on the second day were also mixed in computer skill level. The lecturers prepared a well-toned-down version (compared to the contents of the first day) in the morning talks, to cater to a more general audience. Their used, for example, Google Earth and Map to illustrate the uses of GIS, and caught the interest of the audience. The workshop material on the second day was very appropriate, as it was focused on the presentation and output of data. Some of the participants said that the GIS database was very useful, and asked whether they could take the GIS database and other data with them. The local consultant and ONEP staff declined, saying that they must first finalize the database. However, ONEP staff noted that eventually the database will be installed at PEO and all interested organizations will be able to cooperatively use the database with or at the PEO in the future. Most participants pointed that the training course was too short since there were many useful functions in the program to be learned. An additional extensive GIS course should be considered in the future.