the study on the sustainable groundwater resources …
TRANSCRIPT

Chapter 2-1
- 14 -
THE STUDY ON THE SUSTAINABLE GROUNDWATER RESOURCES AND ENVIRONMENTAL
MANAGEMENT FOR THE LANGAT BASIN IN MALAYSIA
Myo Thant
Pasco Corporation.
1-1-2 Higashiyama, Meguro-ku, Tokyo 153-0043, Japan
ABSTRACT
The Study started in March 2000 and will be completed in the Fiscal Year 2001. One of the main objectives of the Study is establishment
of Geographic Information System (GIS) for efficient and effective support to the groundwater resources and environmental management
plan of the Langat Basin, and for future introduction of the system for the other river basins in Malaysia.
The final product by this Study will be the Management Plan, which includes human resources and institutional development plan for
implementation based on a monitoring network and management information system, using GIS.
1. Background
JICA dispatched a Study Team to Malaysia in March 2000 for the
purpose to establish a balanced, multi-sectoral and integrated
groundwater resources and environmental management plan. The
objectives of the Study include (i) formulation of a sustainable
groundwater resources and environmental management plan for
the Langat Basin; (ii) establishment of a monitoring system and
Geographic Information System (GIS) to support the
Management Plan; and (iii) formulation of human resources and
institutional development plan for the implementation of the
Management Plan, and to be able to utilize the Management Plan
for other basins.
“Malaysia: the Way Forward (Vision 2020)” was presented by the
Prime Minister in 1991 with an objective to get Malaysia a fully
developed country by the year 2020. The Study Area (Langat
River Basin) is located in Selangor State, which has set the target
(Vision 2005) to achieve the status of a developed state 15 years
earlier than the country’s target of Vision 2020. Information
Technology (IT) is emphasized at Ministerial, Departmental, and
States levels. A series of GIS application study projects have been
carrying out. Internet and Intranet infrastructure are in place in
many organizations. Through the National Infrastructure for Land
Information System (NaLIS), data standardization and exchange
of land information among the Agencies is practiced.
GIS is utilized in this Study in input and managing basic
topographic maps, land use maps and the other relevant data,
such as wetland, mining, forest reserves, and so on. Further,
Theme Maps presenting the location of wells, monitoring results
of groundwater level, groundwater quality, etc., as well as the
Evaluation Maps presenting evaluation results referring to
Groundwater Modeling are produced by using ArcView GIS
software. In compliance with the existing systems in Malaysia,
and also IT Strategy of the Counterpart Agency JMG (Jabatan
Mineral dan Geosains), the Study Team proposes Management
Information System as a tool for execution of the Management
Plan. ArcIMS (Internet Map Server) is used for dissemination of
information through the Internet.
2. Input and Managing Data
Topographic Maps at a scale of 1:50,000 published by the
Department of Survey and Mapping Malaysia (DSMM) is used
as the Base Map. This map series has been specified by NaLIS as
the National standard for mapping land information. The standard
map projection currently is the Rectified Skewed Orthomorphic
(RSO).
Geology Map of scale 1:50,000 is provided by JMG in
ARC/INFO format. Land Use maps published in 1995 at a scale
of 1:50,000 are collected from the Department of Agriculture,
and they are digitized in ARC/INFO (GIS Software) format. The
Land Use data are then updated by using Landsat TM image of
1998.

Chapter 2-1
- 15 -
Figure 1: Land Use in Langat Basin
The digital topographic maps provided by JMG in DXF,
AutoCAD interchange format are converted into ARC/INFO to
prepare other relevant data such as, contour, roads, rivers, and so
on. These data are also used to geo-reference Landsat TM image.
Interpretation of Land Cover from TM image is further
supplemented by the aerial photos. Figure 1 shows the resulting
Land Use Maps of 1995 and 1998 covering the whole Study
Area.
The other available relevant data such as, Paya Indah Wetland,
Reserved Forest areas, Tin Mines, etc. are in different map scales.
Those maps are digitized and stored in the common coordinate
systems. Location of the existing wells utilized in the Study and
the newly created wells are geographically referenced to the same
common coordinate system, which is the RSO. All wells and
attribute data are managed by Oracle DBMS (Database
Management System).
3. Theme Maps and Evaluation Maps
Theme maps are produced by superimposing Theme Layer(s),
such as Distribution of Aquifer, Distribution of Surface Water,
Location of Monitoring Wells for Groundwater Level and Water
Quality, Location of Land Subsidence Measurement etc. on top
of the basic map. The basic map features include Major Roads,
Highways, Railways, Rivers, Forest, Urban Areas, Basin
Boundary, as shown in Figure 2.
Figure 2: Basic Map Features
Both Theme Maps and Evaluation Maps are printed in A3-size.
The basic map features can selectively used in the background in
preparing different kinds of Maps in the Study.
Evaluation Maps are graphical presentation of the evaluation
results based on 3-D groundwater modeling (MODFLOW
concept of USGS). Since all the GIS data in this Study are
geo-referenced in a common coordinate system, it facilitates
incorporation of topographical data such as, contours and land
use data in modeling, as well as graphical presentation of the
model results. Data transfer between MODFLOW and GIS is in
dxf, txt, and MS-Excel formats. The evaluation results are
transferred to GIS and Evaluation Maps such as; Equipotential
Map, Map of Predicted Zone of Seawater Intrusion, Map of
Predicted Land Subsidence, Pollution Dispersion Map, etc. are
produced. Figure 3 shows one example of Equipotential Map.

Chapter 2-1
- 16 -
Figure3 Equipotential Map
4. Management Information System
The proposed Management Information System includes four
major functions; (i) Data Input and Maintenance, (ii) Monitoring,
(iii) Evaluation, and (iv) Dissemination of Information to the
public. A web application is developed by using ArcIMS.
Groundwater level, water quality, land subsidence and the
lowering of water level in reserve areas are the items to be
monitored. Measurements are done by both automatic data-logger,
as well as manual procedures. The web application will allow
authorized web-users to query and display these data. Further, the
geological profiles, groundwater model simulation results can
also be visualized on the web for authorized users. General
Internet users will be able to access the Annual Report. The web
page will become accessible in the first quarter of next year, 2002.
An example of Annual Report page is shown in Figure 4.
Figure 4: A sample page of the Annual Report
The web application is developed in Three Tier architecture;
Client Front-End (User Interface),
ArcIMS Middle Tier (Process Management), and Database
Back-End (Database Management), as shown in Figure 5.
Figure 5: Three Tiers System Architecture
Client
Application Server
Application Server
Client
Client
Data Server
Database
Data Server
Database
Application Server
User Interface Process Management Database Management
Three Tiers

Chapter 2-1
- 17 -
A client will send request to the server, and receive the reply from
the server through a given Internet connection by a web browser.
It is term as Client Front-End Tier. The system utilizes a thin
client design, existing Internet connection at the Counterpart
Agency, and Internet Explorer version 4 and higher. The middle
tier of the system has Process Management component, which
will control the information flow. ArcIMS version 3 is used.
Database Back-End is managed by Oracle DBMS, and it is
accessed by ArcIMS through the Database Gateway ArcSDE
(Spatial Database Engine). The system is developed on Windows
2000 Servers.

Chapter 2-1
- 18 -
The Development Study on Integrated Watershed Management In the Western Hills of Nepal
Masami Sugita Kokusai Kogyo Co., Ltd.
5, San Bancho, Chiyoda-ku Tokyo 102-0075
Summary
This study, “ THE DEVELOPMENT STUDY ON INTEGRATED WATERSHED MANAGEMENT IN THE WESTERN HILLS OF NEPAL ” was implemented by Japan International Cooperation Agency (JICA) by the request from Nepal government. The study team, which was formed by Japan Forest Technical Association (JAFTA) and Kokusai Kogyo Co., Ltd., was dispatched to Nepal from November 1995 to January 1998. GIS technology was applied to produce a master plan for the Study for Integrated Watershed Management Plan, hazard maps and land use improvement plans. Furthermore, GIS database was developed as a way of effective use of the socioeconomic baseline survey results.
1. Objectives
The objectives of the Study were to prepare the Integrated Watershed Management Program (draft) for the conservation of forest and the environment on watersheds through the residents’ participation based on reduction of mountainous disasters, maintenance of land productivity and effective use of forest resources and for a common use of forests and agricultural lands on the basis of improvement of residents’ livelihood to establish its guidelines (draft).
2. Implementing period: 1995 – 1997
3. Study areas
This Study covered a region of approximately 120,000 ha., including the southern part of Kaski District located in the west of Nepal and Parbat District. For this Study, the southern part of Kaski District was divided into three areas and the Parbat District, into 2 areas, for a total of 5 areas.
4. Integrated Watershed Management Program and the GIS
Several kinds of maps were produced and a survey using a questionnaire on the socio-economic conditions was prepared. The scale of the produced maps was 1/25,000. The main maps obtained were as follows:
1) Topographic maps 2) Soil maps 3) Geological maps 4) Land use maps 5) Socio-economic baseline data
Based on the information of these maps, the hazard maps and the land use improvement plan database as well as socio-economic information could be produced using the GIS. These maps and data were converted into digital data for the application of the GIS, which was then used as thematic map data.
5. Production of Hazard Maps
Nine types of thematic maps necessary for the hazard maps were produced from the topographic maps obtained in the Study. For the production of thematic maps, (1) all thematic maps were in the raster form of 25m per cell; (2) the categories and ratings were standardized in each thematic map; and (3) the coordinate system of the raster data was in accordance with the coordinate
system of the topographic maps. For the analysis, the locations of large-scale soil erosions and land collapses generated within the study areas were plotted as the location maps of hazardous areas through the field surveys and aerial photographs.
For the production of the location maps, one of the four study areas was adopted as a trial which was repeated through data corrections until the hazardous areas as defined from the analysis of thematic maps could correspond with those evidenced by the field surveys. The data corrections could be made through the analysis results and tendencies in correcting the rating values of thematic maps, adding some items and updating the data ranges.
Once the first area was completed, the hazard maps for the other five areas were produced using the same rating values and items. The five study areas were verified, the parameters were modified, and the results were analyzed repeatedly until the hazardous locations shown in the hazardous area location maps fully corresponded with those on the hazard maps.
When all the study areas were fully verified, the hazard maps were completed (Fig. 1).
The nine thematic maps used to produce the hazard maps are as follows:
1) Rock type 2) Weak zone 3) Consolidation of overburden 4) Thickness of overburden 5) Dip slope 6) Erosion front 7) Land use 8) Slope 9) Hydrology

Chapter 2-1
- 19 -
Rating setting by thematic map
category
Land use category map by rock type
Land use categories Land use map
Topographic map
Analysis (Hazard Map) Display of results on monitor
Erosion and collapse location plotting
map based on field survey
Verification OK?
Review and correction of ratings and category ranges
Verification OK?
Production of hazard maps for 4 other areas
Slope type
Steps under repeated trials
Programming
Geological map
land use category map
Fig. 1 Method for Hazard Map Production

Chapter 2-1
- 20 -
Fig. 2 Hazard Maps for Study Areas
6. Production of Land Use Improvement Plan
In the existing form of land use, the land use improvement plan (draft) was drawn up in order to formulate the Integrated Watershed Management Program (draft) for the conservation of forest and the environment on watersheds based on reduction of mountainous disasters, maintenance of land productivity and effective use of forest resources and for a common use of forests and agricultural lands on the basis of improvement of residents’ livelihood. The realization of the database as a basic tool for the land use improvement plan was required. The land use improvement matrix was set to improve the land use, for which a desirable plan is superimposed on the results of prediction of hazard districts and suitable land categories in the existing land use. Based on this concept, the matrix for the land use improvement plan was set using the GIS database of the soil category maps, hazard maps and slope category maps. (See Table 1. Land use improvement plan matrix.)
First, the suitable land category was defined by assessing lands that are appropriate for agriculture, stock raising, or sylviculture with respect to the relation that exists between slope category and soil category. The suitable land category map was produced using the slope and soil category maps. The land use improvement matrix was set based on the suitable land category map, hazard map, and land use category map, then the program was undertaken in accordance with this matrix. The database of the land use improvement plan (draft) was thus developed according the land use improvement matrix. The developed database could be verified through display and output function, and the total of areas and other required items were obtained. If the verification and area calculation are not satisfactory, the conditional formula was reviewed and the database was reproduced. Following the repetition of trials on all the study areas, until satisfactory results could be achieved, the final land use improvement plan (draft) was completed. (See Fig. 3 Land
use improvement maps.) The method to develop the database for the land use improvement plan is shown in Fig. 4.
Fig. 3 Land Use Improvement Maps
Table 1. Land Use Improvement Plan Matrix
Hazard LanduseForest Bush Grass Bari Khet
Suitable Forest1 Forest1 Grass3 Farm2 Farm3Interme Forest1 Forest1 Grass3 Farm2 Farm3Unsuit Forest1 Forest1 Grass3 Farm2 Farm3Suitable Forest2 Forest2 Grass1 Farm1 Farm3Interme Forest1 Forest1 Grass2 Farm2 Farm3Unsuit Forest1 Forest1 Grass2 Farm2 Farm3Suitable Forest2 Forest2 Grass1 Farm1 Farm3Interme Forest2 Forest2 Grass1 Farm1 Farm3Unsuit Forest1 Forest1 Grass2 Farm2 Farm3
High
Medium
Low
site Class
Note: Interme: Intermediate Unsuit: Unsuitable
7. Development of Socio-economic Baseline Database
A socio-economic survey of the villages located in the study areas was carried out. From the results that have been obtained, a socio-economic baseline database could be developed for a common use. The socio-economic baseline database was realized for display and output through the GIS. The administrative boundary data were also collected from the topographic maps. The socio-economic data category map was produced using the administrative boundary data.

Chapter 2-1
- 21 -
8. Conclusion
For the works related to the GIS in this Study, it was necessary to procure equipment and materials, produce various thematic maps, and develop several types of database. The full-scale database was developed in 1996, but the software and hardware environment at that time had limitations. The increasing use of personal computers allowed large volumes of data to be processed and operated simply. Further, the related types of database were developed along with the spread of the GIS in many countries. As the GIS-related environment will improve in future, the GIS will be used more widely.
Programming (Conditional Formula)
Land Use ImprovementMatrix
OK?Resetting ofConditional Formula
SlopeSoilHazard
Fig. 4 Method for Developing the Database for LandUse Improvement Plan

Chapter 2-1
- 22 -
An Example of Application of the GIS Database in Swaziland - Wildfire Hazard Map and Suitable Place for Road Construction -
Daisaku Kiyota Overseas Operations Department, Kokusai Kogyo Co., Ltd.
5, San Bancho, Chiyoda-ku Tokyo 102-0075
Summary
In the “Study of Digital Mapping Project for the Smooth Implementation of the Development Plan in Swaziland”, the JICA study team and its counterpart SGD produced digital orthophoto maps and the GIS database using orthophoto maps. The database is essential and it can be used in many ways in the future. At the final stage of the Project, we held a seminar to introduce the applications of the database. I could show an example for creating a hazard map of wildfire and for finding the suitable location for the road construction. The data concerning land-use and dummy wind were created for the said seminar, and the slope aspect and angle were calculated using the DEM data obtained during this project.
1. Background
This example of application constitutes a case of realization for “the Study of Digital Mapping Project for the Smooth Implementation of the Development Plan in Swaziland” (that was implemented for the period from July 1999 to July 2001).
The orthophoto maps were used widely in Swaziland instead of the conventional topographic maps. The GIS was introduced as a new land management technique, but the existing data were based on the orthophoto maps executed in the 1970’s. Thus, the realization of orthophoto maps showing the present conditions and the introduction of the GIS based on the new orthophoto maps were imperative.
At the request of the Government of Swaziland, a technical cooperation was carried out for producing the 1/10,000-scale digital orthophoto maps, and building the GIS database based on the existing cadastral data and orthophoto map.
2. Definition of Wildfire Hazard Areas
The urban development in Swaziland is still on the way because of its historical background and national economy. In the capital city of Mbabane, the residential areas are adjacent to the natural areas. Since unnatural outbreaks of fire occur frequently, it is important to define the fire-spread hazard areas. A wildfire hazard level was thus determined as an example of applications of the GIS database.
The level of wildfire hazard could not be defined by estimating the probability of fire occurrences, but by taking notice of the easiness of fire spread. When determining a wildfire hazard level, the parameters for the prediction formula for fire spread, namely the distribution of combustibles (land-use status), slope angle and aspect, wind velocity and wind direction, which represent the standard parameters in Japan, were adopted. The prediction of fire spread is given by the following formula:
Ve = {AU1 cos ( 1 – 3) + B} S A = 2.00 tan 2 + 2.16 tan 2 + 1.24 B = 7.12 tan 2 + 1.44 tan 2 + 0.25, where Ve : Velocity of fire spread
1 : Maximum slope aspect 2 : Slope’s angle of inclination 3 : Wind direction
U1 : Wind velocity S : Combustible’s ratio of velocity of fire spread
Note 1) The wind direction and velocity are not predicted, but the wind direction remains constant.
Note 2) In this prediction formula for fire spread,
· the (upward) velocity of fire spread will increase with the slope angle.
· the velocity of fire spread will increase with the approximation of the wind direction to the slope aspect (fair wind).
Along with the calculation based on the prediction formula, the following data could be obtained: ① Data of land use (combustible distribution) (through orthophoto interpretation); ② Slope data (processed from the existing data); ③ Slope aspect data (processed from the existing data); and ④ Wind direction and velocity data (dummy).
The data ① were obtained through the interpretation of orthophoto maps and the transformation of the polygon data into the raster mode. For the data ② and ③, the existing DEM was processed. The dummy data were obtained for the wind direction and velocity data. ArcView 3.2 was applied for all the jobs related to this case.
Fig.1 ①Land use status data (combustible distribution) (Orthophoto interpretation)
Fig.2 ②Slope angle data (calculated from the existing DEM)

Chapter 2-1
- 23 -
The method for determining the hazard level is as follows:
1) To calculate the difference between the slope aspect and the wind direction in order to categorize a hazard level. (The smaller the difference, the higher the hazard level.)
2) To categorize the slope angle as a hazard level. (The higher the slope angle, the higher the hazard level.)
3) To calculate the product of the map data of the above two layers and to categorize it as a hazard level.
The above method was adopted to define an area with a value larger than the given reference value as a wildfire hazard area and the map as shown below could be obtained.
Fig.5 Wildlife Hazard Map
3. Selection of a Suitable Place for Road Construction
The development for road construction in Swaziland could not be fully achieved due to the conditions as mentioned previously. To this end, a simple method for selecting a suitable location in the establishment of a road construction plan was
adopted and the selection of road locations could be made from the economic point of view, allowing the choice of the most economical route.
Based on the results of the selection of road routes, costs were added to the land use map as made up in Section 2 above. The costs would include the factors affecting the land acquisition and construction works, and individual costs for woodlands, grasslands, rivers, existing roads, and residential districts were broken down and added to the total cost. Note 1) The present conditions were not fully monitored. Note 2) The difficulty in land acquisition and construction work resulted in higher
costs.
The start point of a road line was defined in the cost map and the cost distance map was obtained using the Cost Surface function.
Note: The cost distance map is the raster data representing the cost for the distance from the road start point to an arbitrary point.
Moreover, the data defined as the end point of the road line was superimposed on the Cost Distance Map to define the road line using the Cost Path function.
4. Conclusion
When selecting the example of application, an emphasis was placed on data that the counterpart could collect, process, and arrange independently. The newly added land use data in this example (information on combustible distribution and cost of road construction) could be obtained in a simple manner, but did not reflect clearly the existing conditions.
The data obtained through this technical cooperation project
Cost Map (land use map on which the cost information is added.)
Cost Distance Map
Fig.3 ③Slope aspect data (calculated from the existing DEM) Aspect of the Slope
Fig.4 ④Wind direction and velocity data (dummy)
Fig.6 Cost Surface of the sample area
Fig.7 Cost Distance Map

Chapter 2-1
- 24 -
was essential, but the counterpart, SGD, and other administrative agencies may use them by processing them or by adding other information, such as land use data, in a variety of applications. This database will be a very important as a source of information and as a tool.
Fig. 8 Road Line Route at Least Cost
Chapter 2-1
- 25 -
Selecting the appropriate sites for wind power generation systems -The simulation of wind conditions by use of GIS data-
Dr. Kenji Takagi
Kajima Technical Research Institute
19-1, Tobitakyu 2-Chome, Chofu-shi, Tokyo
182-0036, Japan
Abstract
The wind power generation systems spread worldwide in these days as an infrastructure for renewable energy. Predicting wind
conditions is important to select the appropriate sites for wind power generation systems in planning them. This paper shows the
simulation model of wind conditions by use of GIS data, which is suitable for the islands’ complex topography and the sea. This model
calculates movement of atmosphere in the 3-dimensional virtual space inside the computer based on the GIS data. This simulation
needs only the GIS data and the upper air atmospheric pressure distribution so that it can simulate every wind conditions all over the
world. The accuracy of this simulation is 1m/s of the monthly average wind speed. We have calculated many wind power generation
system sites in Japan, but none in abroad. Therefore we shall apply this model to wind conditions in foreign countries.
1. Background
In order to diminish green house gas such as carbon dioxide,
an effective use of natural energy, a kind of clean energy, is
important as well as promoting energy conservation. And this
has become a globally urgent issue. In this effort, an active
introduction of wind power generation has been encouraged in
various countries as an infrastructure using natural energy.
In planning and designing wind power generation systems, it is
regarded to be most important to select a site, the wind of which
has high yearly average speed and stable directions. However,
in an island country like Japan and lands which have complex
topography, it is considered to be difficult to select an appropriate
site for wind power generation systems compared with countries
in Europe and America because of the complex wind conditions
and unstable wind conditions influenced by the sea.
In designing wind power generation systems, at least one year
of actual observation at the proposed site is essential to obtain
data needed for the calculation of generating capacity.
Understanding the wind conditions is also crucial to select
observation points of the proposed site..
As a result, it is hoped to develop a computerized simulation to
predict wind conditions suitable for the natural features of the
island countries. At our institute, we have developed a
simulation method to predict wind conditions by using prediction
technique that we have been conducting for the predictions of
heat island phenomenon of urban area and wind tunnel. As this
simulation can accurately reproduce influence of the sea such as
land and sea breeze, it is suited for selecting an appropriate site
for wind power generation systems in an area near to the sea and
with complex topography.
2. Simulation of wind condition prediction
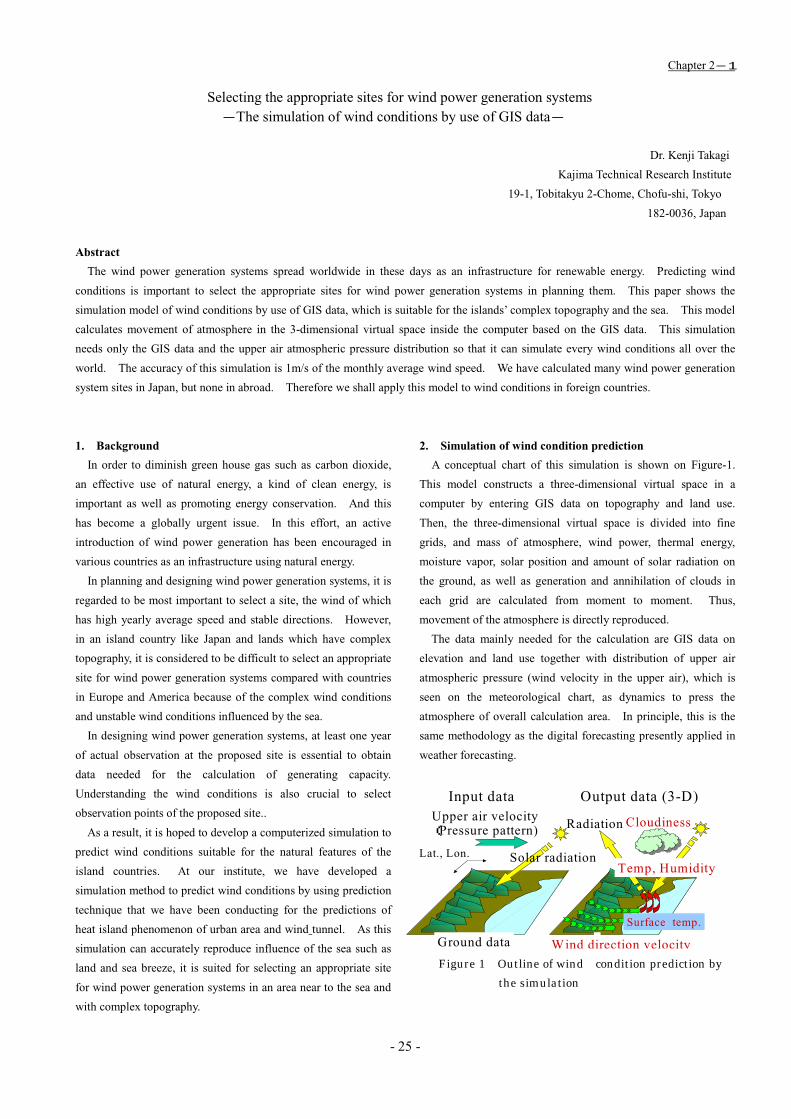
A conceptual chart of this simulation is shown on Figure-1.
This model constructs a three-dimensional virtual space in a
computer by entering GIS data on topography and land use.
Then, the three-dimensional virtual space is divided into fine
grids, and mass of atmosphere, wind power, thermal energy,
moisture vapor, solar position and amount of solar radiation on
the ground, as well as generation and annihilation of clouds in
each grid are calculated from moment to moment. Thus,
movement of the atmosphere is directly reproduced.
The data mainly needed for the calculation are GIS data on
elevation and land use together with distribution of upper air
atmospheric pressure (wind velocity in the upper air), which is
seen on the meteorological chart, as dynamics to press the
atmosphere of overall calculation area. In principle, this is the
same methodology as the digital forecasting presently applied in
weather forecasting.
Input Data
Lat., Lon. Solar radiation
Cloudiness
Surface temp.
Temp, Humidity
Ground data
Input data Output data (3-D)
Fig.1 Outline of wind condition prediction simulation
Upper air velocity(Pressure pattern) Radiation
Wind direction velocity
Figure 1 Outline of wind condition prediction by the simulation

Chapter 2-1
- 26 -
On Figure-2, a methodology called “Nesting” is applied. The
Nesting is the method to sequentially narrow down the
calculation field starting from a large area. Using this method,
area ranges from several hundred kilometers’ square to several
kilometers’ square can be calculated in 500m grid at the smallest.
Thus, three-dimensional distribution of wind and temperature at the given point and the given time can be calculated if only data on land and atmospheric pressure are available. As shown on Figure-3, the comparison between the calculated values and the observed values at several points in Japan shows that accuracy of the calculation is within ±1m/s in the monthly average wind speed.
3. Example of simulation
In Japan, predictions have been conducted to understand the outline of wind conditions for the entire country and the individual and detailed wind conditions at dozens of places.
Figure-4 is the countrywide wind condition summary map (average in winter). This figure roughly reproduces the state of local winds, such as “Dashi” and “Oroshi” (down slope winds called in different names in different places) observed in various places in Japan.
Figure 5 shows the wind conditions in Aomori Prefecture. The first wind farm in Japan called “Tappi Wind Park” is located in this area and the wind farm has a good power generation performance. The model shows that the point has good wind conditions.
4. Expansion to foreign and developing countries As mentioned before, the data needed for this
simulation model are GIS on elevation and land use
図-2 ネスティングイメージ
8kmメッシュ
500mメッシュ
Figure 2 Image concept of Nesting
500m Grid
8km Grid
図-5 青森県風況マップ;冬季(赤から黄緑の部分が風速の強い地域,矢印は風向)
竜飛
Figure 5. Wind Condition Map (in winter); Aomori Pre.
(Red to verdant green: area with strong wind, Arrow shows wind direction)
Tappi
Fig.-3 Comparison with observed value (Nadachi Town)
Average velocity 20m above ground(m/s)
Month Observed value Calculated value
Dec. 8.0 8.6 Jan. 9.3 9.0 Feb. 8.1 8.2
Figure 3. Comparison with observed values ( Nadachi Town ) Average velocity 20 m above ground (m/s)
Fig.4 Wind condition map of the whole country: winter(White circles are the areas that have local winds.)

Chapter 2-1
- 27 -
together with upper air atmospheric pressure distributions.
For the upper air atmospheric pressure, global data have been
released by WMO based on international agreement, which are
accessible from anywhere in the world. Although various
countries have various GIS data, the environment for the
expansion has been becoming in good order due to the progress
of the data development not only in countries in America and
Europe but also in Asia. Further, high resolution satellite
imagery in about 1m resolution has been commercially used and
this makes it possible to make a calculation of all the areas by
preparing GIS data from the imagery.
5. Conclusion
Wind condition prediction, which directly simulate the
movement of atmosphere, has been most actively studied and
developed in Japan. However, the numbers of simulations are
limited and there are only several models in the world.
Opposing to many domestic actual proofs and applications of this
simulation, there are not yet any applications in foreign countries.
We intend active applications in foreign countries in the future
and to grasp the wind conditions in each country while promoting
accuracy validation on the calculation.