the study regions and their indigenous...
TRANSCRIPT
INDI
GEN
OU
S PE
OPL
ES &
LO
W-E
MIS
SIO
N R
URA
L DE
VELO
PMEN
T
INDI
GEN
OU
S PE
OPL
ES &
LO
W-E
MIS
SIO
N R
URA
L DE
VELO
PMEN
T
4 54 5
STUDY REGIONS
GCF MEMBERS
RIO BRANCODECLARATION SIGNATORIES
2%2%
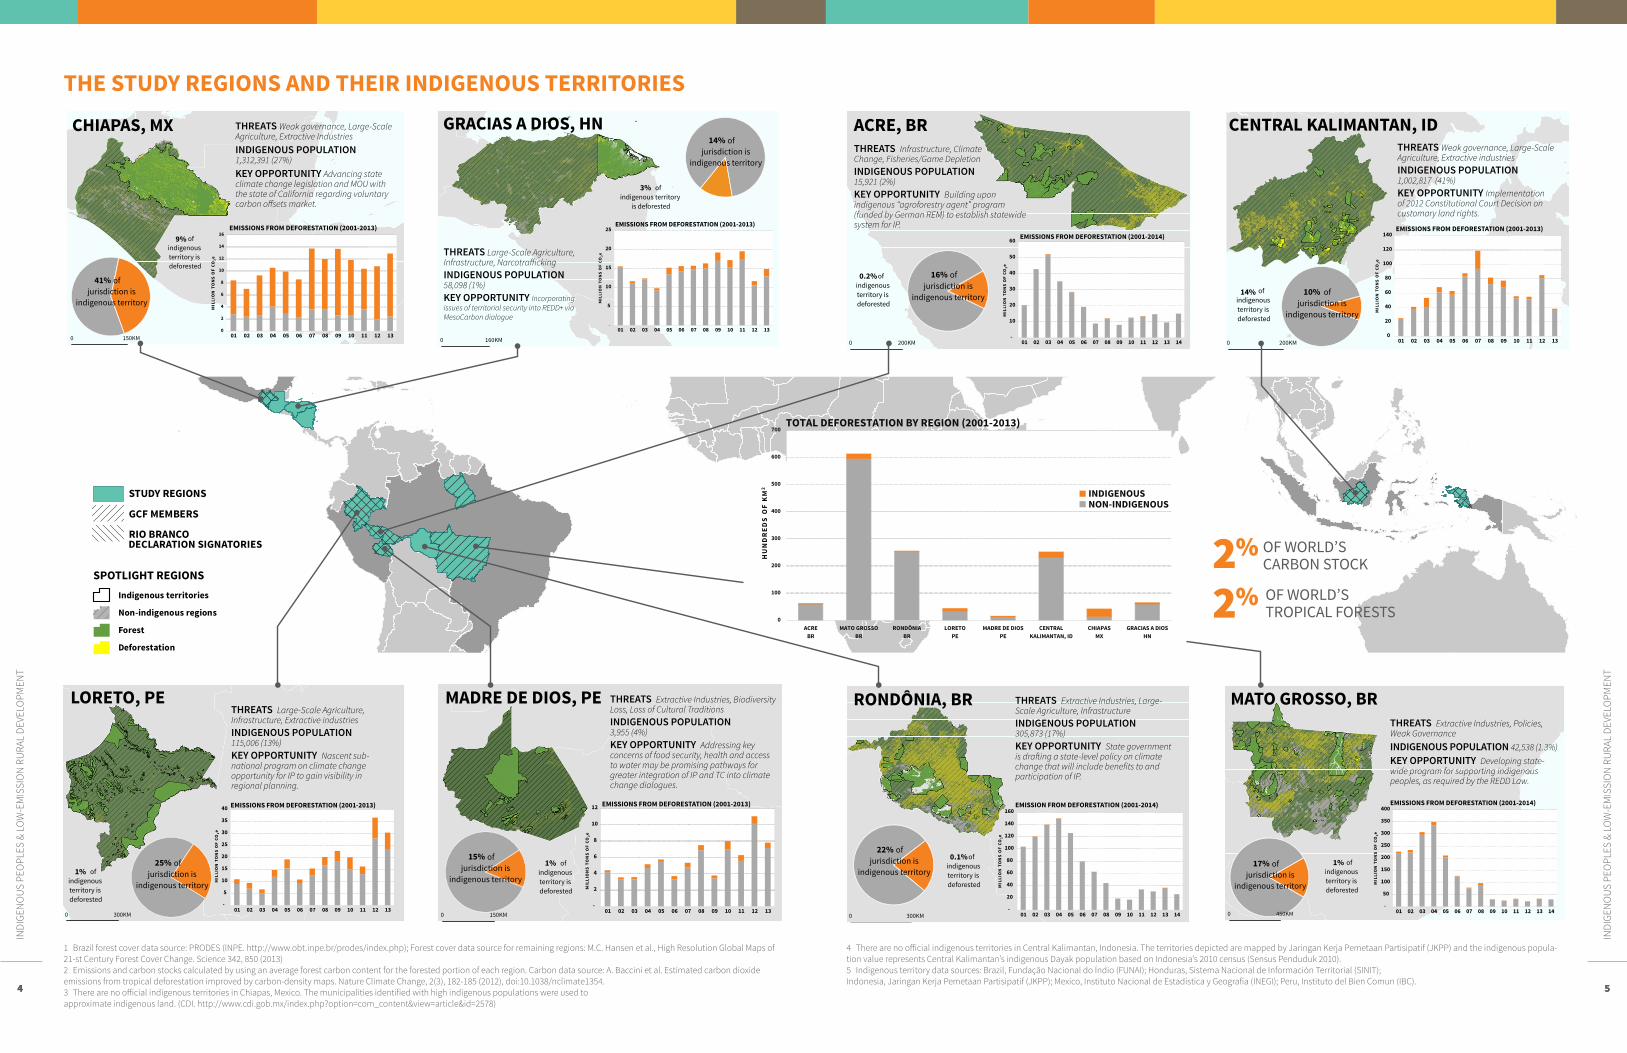
OF WORLD'S CARBON STOCK
OF WORLD'S TROPICAL FORESTS
0
100
200
300
400
500
600
700
ACREBR
MATO GROSSOBR
RONDÔNIABR
LORETOPE
MADRE DE DIOSPE
CENTRALKALIMANTAN, ID
CHIAPASMX
GRACIAS A DIOSHN
HU
ND
RED
S O
F K
M2
TOTAL DEFORESTATION BY REGION (2001-2013)
INDIGENOUS
NON-INDIGENOUS
1
2
3
4
5
There are no official indigenous territories in Chiapas, Mexico. The municipalities identified with high indigenous populations were used to approximate indigenous land. (CDI. http://www.cdi.gob.mx/index.php?option=com_content&view=article&id=2578) There are no official indigenous population data in Central Kalimantan, Indonesia. The indigenous population was approximated using the ratio of indigenous land to total area of Central Kalimantan and the province's total population. Indigenous territory data sources: Brazil, Fundação Nacional do Índio (FUNAI); Honduras, Sistema Nacional de Información Territorial (SINIT); Indonesia, Jaringan Kerja Pemetaan Partisipatif (JKPP); Mexico, Instituto Nacional de Estadística y Geografía (INEGI); Peru, Instituto del Bien Comun (IBC).
THE STUDY REGIONS AND THEIR INDIGENOUS TERRITORIES
Brazil forest cover data source: PRODES (INPE. http://www.obt.inpe.br/prodes/index.php); Forest cover data source for remaining regions: M.C. Hansen et al., High Resolution Global Maps of 21-st Century Forest Cover Change. Science 342, 850 (2013)Emissions and carbon stocks calculated by using an average forest carbon content for the forested portion of each region. Carbon data source: A. Baccini et al. Estimated carbon dioxide emissions from tropical deforestation improved by carbon-density maps. Nature Climate Change, 2(3), 182-185 (2012), doi:10.1038/nclimate1354.
Indigenous territories
Non-indigenous regions
Forest
Deforestation
SPOTLIGHT REGIONS
INDIGENOUSNON-INDIGENOUS
THE STUDY REGIONS AND THEIR INDIGENOUS TERRITORIES
1 Brazil forest cover data source: PRODES (INPE. http://www.obt.inpe.br/prodes/index.php); Forest cover data source for remaining regions: M.C. Hansen et al., High Resolution Global Maps of 21-st Century Forest Cover Change. Science 342, 850 (2013)2 Emissions and carbon stocks calculated by using an average forest carbon content for the forested portion of each region. Carbon data source: A. Baccini et al. Estimated carbon dioxide emissions from tropical deforestation improved by carbon-density maps. Nature Climate Change, 2(3), 182-185 (2012), doi:10.1038/nclimate1354.3 There are no official indigenous territories in Chiapas, Mexico. The municipalities identified with high indigenous populations were used to approximate indigenous land. (CDI. http://www.cdi.gob.mx/index.php?option=com_content&view=article&id=2578)
4 There are no official indigenous territories in Central Kalimantan, Indonesia. The territories depicted are mapped by Jaringan Kerja Pemetaan Partisipatif (JKPP) and the indigenous popula-tion value represents Central Kalimantan’s indigenous Dayak population based on Indonesia’s 2010 census (Sensus Penduduk 2010).5 Indigenous territory data sources: Brazil, Fundação Nacional do Índio (FUNAI); Honduras, Sistema Nacional de Información Territorial (SINIT); Indonesia, Jaringan Kerja Pemetaan Partisipatif (JKPP); Mexico, Instituto Nacional de Estadística y Geografía (INEGI); Peru, Instituto del Bien Comun (IBC).
ACRE, BR
0 200KM -
10
20
30
40
50
60
01 02 03 04 05 06 07 08 09 10 11 12 13 14
MIL
LIO
N T
ON
S O
F CO
2e
EMISSIONS FROM DEFORESTATION (2001-2014)
of jurisdiction is
indigenous territory
16% of indigenous territory is deforested
0.2%
THREATS Infrastructure, Climate Change, Fisheries/Game DepletionINDIGENOUS POPULATION 15,921 (2%)KEY OPPORTUNITY Building upon indigenous “agroforestry agent” program (funded by German REM) to establish statewide system for IP.
LORETO, PE
-
5
10
15
20
25
30
35
40
01 02 03 04 05 06 07 08 09 10 11 12 13
MIL
LIO
N T
ON
S O
F CO
2e
EMISSIONS FROM DEFORESTATION (2001-2013)
0 300KM
of jurisdiction is
indigenous territory
25% of
indigenous territory is deforested
1%
THREATS Large-Scale Agriculture, Infrastructure, Extractive industriesINDIGENOUS POPULATION 115,006 (13%)KEY OPPORTUNITY Nascent sub-national program on climate change opportunity for IP to gain visibility in regional planning.
MADRE DE DIOS, PE
-
2
4
6
8
10
12
01 02 03 04 05 06 07 08 09 10 11 12 13
MIL
LIO
NS
TON
S O
F CO
2e
EMISSIONS FROM DEFORESTATION (2001-2013)
of jurisdiction is
indigenous territory
15%
0 150KM
of indigenous territory is deforested
1%
THREATS Extractive Industries, Biodiversity Loss, Loss of Cultural TraditionsINDIGENOUS POPULATION 3,955 (4%) KEY OPPORTUNITY Addressing key concerns of food security, health and access to water may be promising pathways for greater integration of IP and TC into climate change dialogues.
MATO GROSSO, BR
-
50
100
150
200
250
300
350
400
01 02 03 04 05 06 07 08 09 10 11 12 13 14
MIL
LIO
N T
ON
S O
F CO
2e
EMISSIONS FROM DEFORESTATION (2001-2014)
0 450KM
of jurisdiction is
indigenous territory
17% of indigenous territory is deforested
1%
THREATS Extractive Industries, Policies, Weak GovernanceINDIGENOUS POPULATION 42,538 (1.3%) KEY OPPORTUNITY Developing state- wide program for supporting indigenous peoples, as required by the REDD Law.
RONDÔNIA, BR
-
20
40
60
80
100
120
140
160
01 02 03 04 05 06 07 08 09 10 11 12 13 14
MIL
LIO
N T
ON
S O
F CO
2e
EMISSION FROM DEFORESTATION (2001-2014)
0 300KM
of jurisdiction is
indigenous territory
22% of
indigenous territory is deforested
0.1%
THREATS Extractive Industries, Large-Scale Agriculture, InfrastructureINDIGENOUS POPULATION 305,873 (17%) KEY OPPORTUNITY State government is drafting a state-level policy on climate change that will include benefits to and participation of IP.
CENTRAL KALIMANTAN, ID
0
20
40
60
80
100
120
140
01 02 03 04 05 06 07 08 09 10 11 12 13
MIL
LIO
N T
ON
S O
F CO
2e
EMISSIONS FROM DEFORESTATION (2001-2013)
0 200KM
of jurisdiction is
indigenous territory
10% of indigenous territory is deforested
14%
THREATS Weak governance, Large-Scale Agriculture, Extractive industriesINDIGENOUS POPULATION 1,002,817 (41%)KEY OPPORTUNITY Implementation of 2012 Constitutional Court Decision on customary land rights.
CHIAPAS, MX
0 150KM0
2
4
6
8
10
12
14
16
01 02 03 04 05 06 07 08 09 10 11 12 13
MIL
LIO
N T
ON
S O
F CO
2e
EMISSIONS FROM DEFORESTATION (2001-2013)
of jurisdiction is
indigenous territory
41%
of indigenous territory is deforested
9%
THREATS Weak governance, Large-Scale Agriculture, Extractive Industries INDIGENOUS POPULATION 1,312,391 (27%)KEY OPPORTUNITY Advancing state climate change legislation and MOU with the state of California regarding voluntary carbon offsets market.
GRACIAS A DIOS, HN
0 160KM
-
5
10
15
20
25
01 02 03 04 05 06 07 08 09 10 11 12 13
MIL
LIO
N T
ON
S O
F CO
2e
EMISSIONS FROM DEFORESTATION (2001-2013)
of jurisdiction is
indigenous territory
14%
of indigenous territory
is deforested
3%
THREATS Large-Scale Agriculture, Infrastructure, Narcotrafficking INDIGENOUS POPULATION 58,098 (1%)KEY OPPORTUNITY Incorporating issues of territorial security into REDD+ via MesoCarbon dialogue
OF WORLD’S TROPICAL FORESTS2%
OF WORLD’S CARBON STOCK2%
STUDY REGIONS
GCF MEMBERS
RIO BRANCODECLARATION SIGNATORIES
2%2%
OF WORLD'S CARBON STOCK
OF WORLD'S TROPICAL FORESTS
0
100
200
300
400
500
600
700
ACREBR
MATO GROSSOBR
RONDÔNIABR
LORETOPE
MADRE DE DIOSPE
CENTRALKALIMANTAN, ID
CHIAPASMX
GRACIAS A DIOSHN
HU
ND
RED
S O
F K
M2
DESMATAMENTO TOTAL POR REGIÃO (2001-2013)
INDIGENOUS
NON-INDIGENOUS
1
2
3
4
5
There are no official indigenous territories in Chiapas, Mexico. The municipalities identified with high indigenous populations were used to approximate indigenous land. (CDI. http://www.cdi.gob.mx/index.php?option=com_content&view=article&id=2578) There are no official indigenous population data in Central Kalimantan, Indonesia. The indigenous population was approximated using the ratio of indigenous land to total area of Central Kalimantan and the province's total population. Indigenous territory data sources: Brazil, Fundação Nacional do Índio (FUNAI); Honduras, Sistema Nacional de Información Territorial (SINIT); Indonesia, Jaringan Kerja Pemetaan Partisipatif (JKPP); Mexico, Instituto Nacional de Estadística y Geografía (INEGI); Peru, Instituto del Bien Comun (IBC).
THE STUDY REGIONS AND THEIR INDIGENOUS TERRITORIES
Brazil forest cover data source: PRODES (INPE. http://www.obt.inpe.br/prodes/index.php); Forest cover data source for remaining regions: M.C. Hansen et al., High Resolution Global Maps of 21-st Century Forest Cover Change. Science 342, 850 (2013)Emissions and carbon stocks calculated by using an average forest carbon content for the forested portion of each region. Carbon data source: A. Baccini et al. Estimated carbon dioxide emissions from tropical deforestation improved by carbon-density maps. Nature Climate Change, 2(3), 182-185 (2012), doi:10.1038/nclimate1354.
Indigenous territories
Non-indigenous regions
Forest
Deforestation
SPOTLIGHT REGIONS
INDÍGENASNÃO-INDÍGENAS
SPOTLIGHT REGIONS
COMPARATIVE MAP
STUDY REGIONS
GCF MEMBERS
RIO BRANCODECLARATION SIGNATORIES
2%2%
OF WORLD'S CARBON STOCK
OF WORLD'S TROPICAL FORESTS
0
100
200
300
400
500
600
700
ACREBR
MATO GROSSOBR
RONDÔNIABR
LORETOPE
MADRE DE DIOSPE
CENTRALKALIMANTAN, ID
CHIAPASMX
GRACIAS A DIOSHN
HU
ND
RED
S O
F K
M2
DESMATAMENTO TOTAL POR REGIÃO (2001-2013)
INDIGENOUS
NON-INDIGENOUS
1
2
3
4
5
There are no official indigenous territories in Chiapas, Mexico. The municipalities identified with high indigenous populations were used to approximate indigenous land. (CDI. http://www.cdi.gob.mx/index.php?option=com_content&view=article&id=2578) There are no official indigenous population data in Central Kalimantan, Indonesia. The indigenous population was approximated using the ratio of indigenous land to total area of Central Kalimantan and the province's total population. Indigenous territory data sources: Brazil, Fundação Nacional do Índio (FUNAI); Honduras, Sistema Nacional de Información Territorial (SINIT); Indonesia, Jaringan Kerja Pemetaan Partisipatif (JKPP); Mexico, Instituto Nacional de Estadística y Geografía (INEGI); Peru, Instituto del Bien Comun (IBC).
THE STUDY REGIONS AND THEIR INDIGENOUS TERRITORIES
Brazil forest cover data source: PRODES (INPE. http://www.obt.inpe.br/prodes/index.php); Forest cover data source for remaining regions: M.C. Hansen et al., High Resolution Global Maps of 21-st Century Forest Cover Change. Science 342, 850 (2013)Emissions and carbon stocks calculated by using an average forest carbon content for the forested portion of each region. Carbon data source: A. Baccini et al. Estimated carbon dioxide emissions from tropical deforestation improved by carbon-density maps. Nature Climate Change, 2(3), 182-185 (2012), doi:10.1038/nclimate1354.
Indigenous territories
Non-indigenous regions
Forest
Deforestation
SPOTLIGHT REGIONS
INDÍGENASNÃO-INDÍGENAS