the subjective national identity and vote at the … · the subjective national identity and vote...
TRANSCRIPT

1
The subjective national identity and vote at the elections to the Parliament of Catalonia (1984-1999).
Jordi Argelaguet Departament de Ciència Política i Dret Públic Edifici B UNIVERSITAT AUTÒNOMA DE BARCELONA 08193 Bellaterra e-mail [email protected]
Paper to be presented at the ECPR Joint Sessions of Workshops. “ECPR workshop 26: National Identity in Europe” 6-11 April 2001, Grenoble
DRAFT. PLEASE DO NOT QUOTE
2
The subjective national identity and vote at the elections to the Parliament of Catalonia (1984-1999). 1. Introduction.
Nowadays, Catalonia is one of the seventeen Autonomous Communities of the Kingdom of Spain. The importance of Catalonia within the Spanish State is due to the amount of the Catalan population and the Catalan economic wealth (15% and 20% of Spain, respectively). However, it is mainly due to the political action of the Catalan parties. Almost all of them are more or less influenced by one of the streams of the Catalan nationalism, also labelled as catalanism (Termes 2001). The Catalanism, as a political expression of a feeling of a differentiated national identity from the Spanish national feeling, has been so strong during decades that it has even achieved the recognition of Catalonia as a “nationality” in the present Statute of Autonomy (1979), where the institutions of self-government within the Spanish state are settled (Albertí and others 1992). Despite the historical origins of Catalonia can be traced back into the Middle Ages, like other European contemporary nations (Llobera 1994), the modern political expression of the Catalan national identity has its roots in the first third of the 19th century, when the Spanish state-nation was built, and within the European movement of nationalities’ revival (Anguera 2000, Riquer 2000). By the end of the same century, the Catalan nationalist movement already had the ideological foundations, which allowed it to formulate a Catalan national identity based, specially, on the presence and use of the Catalan language. In this sense, for many people, the main condition to be Catalan is to know and use this language. From 1901 until today, while there has been an strong enough regime of civil liberties in Spain to allow free elections, the majority of votes of the Catalan population have gone to those parties which consider that Catalonia is a true nation within the Spanish state (Caminal 1998). Through the past decades, the Catalan population lived several historical circumstances, which influenced the conception of its national identity as a political community, and they influenced the self-perception of the national identity of each of the persons who compose the Catalan society. By this reason, it is basic and useful to point the main elements which has conditioned the Catalan people’s national identity: 1) There is the fact that Catalonia has only had a certain level of self-government
during very few years since 1812 (the year when the first Spanish constitution was passed)1: from 1931 to 1939 (included the years of the Spanish Civil War), and since 1979 onwards. The rest of the years, Catalonia has been directly ruled from Madrid and, very often, with a hard Spanish nationalist and centralist political will. As an example of this policy, one can remind that the official use of the Catalan language (including in the schools) was forbidden, while in other uses was merely tolerated, in the best situation. During the 19th century, the Catalan people were perceived as a distinct people within the kingdom of Spain2 by themselves and by foreigners. The Catalans were keeping a collective
1 Catalonia had lost its public institutions in 1714 (government, parliament and local government),
after the War of Succession to the Spanish Crown (Albareda 2000). The new dinasty, the Bourbons, had begun to implement a very high centralist policy against the will of the majority of the Catalan population, using all means, including an important repression. 2 In fact, the first king with the official title of “king of Spain” was Alfonso XII (1875-1885). The former
monarchs of Spain, since Felipe V (1700-1746), used the title of “king of Spains”, in plural.

3
conscience of being part of a defeat community, which lost its public institutions in 1714. Since then, they had been treated under the “right of conquest” by the Spanish kings. They kept a sense of “Catalanness” (alive and spread specially among popular sectors). This sense was rooted in the use of Catalan language and the maintenance of the Catalan private law. All these factors had a decisive contribution on the creation of a political feeling of being catalan, specially, when the “Catalanness” was begun to be politically used in order to mobilize catalan people to build an alternative Spanish state, opposed to present one, which was conservative and centralist. First, this movement was mainly federalist3 but, after the defeat of federalism in Spain (1873), the catalanism became mainly “regionalist”, i.e., it did not question the Spanish rule over Catalonia. When the Spanish Empire suffered an important setback by loosing the overseas colonies (Cuba, Puerto Rico and Philippines in 1898), the catalanist movement reacted. The majority of catalanist movement adopted a nationalist strategy (Termes and Colomines 1992), which can be summarised with this idea: “because Catalonia is the nation, and Spain is the state, we must transform the old Spanish institutions into modern ones which should to recognize the national plurality of the Kingdom of Spain”.
2) There are the consequences of the Franco’s dictatorship (1939-1975) (Molinero and Ysàs 1999). During almost 40 years, the Catalan identity was under serious threat. The post-war repression was very strong4: because of the war, the Catalan society lost about 135.000 persons (between death and exile), i.e., about 4,5% of its population. However, in the following years, the situation did not excessively improve. The living conditions were bad until the beginnings of sixties (Cabana 2000), meanwhile the use of catalan language was still forbidden in all official uses and it was only tolerated in certain cases under specific permission (Ferrer i Gironès 1985, Solé i Sabaté and Villarroya 1993, Benet 1995).
3) The changes in the social structure of the Catalan population have been very deep. In thirty years, from 1940 to 1970, the Catalan population increased more than twice, due to the arrival of hundreds of thousands persons coming from other parts of the Spanish state (Ajenjo and Blanes 1999). Therefore, most of them were Spanish speakers with its own national identity, different from the Catalan.
4) Since 1980, the restored Catalan institutions of self-government have worked, obviously, based on the democratic principles. The government has developed a strategy of recovering the components of the Catalan identity being conscious that almost the majority of the Catalan population has its family origins outside of Catalonia and, often, it has a national identity eventually different from the persons belonging to families, which have been living in Catalonia since a long time ago.
For all these reasons, the Catalan case is interesting and it can be useful to
compare with other similar cases (Keating 1996). Catalonia is a little community that it has achieved to keep its own language as useful for the entire modern uses
3 At this moment, it is not possible to talk strictly of “catalanism”. However, the federalist ideas in
Catalonia have to be considered the predecessor of it (Termes 1999). 4 Apart from the deaths in the war (about 65.000), there were almost 4000 executions (among of
them, the president of the autonomous catalan government), 60.000 exiled (most of them the cadres of the catalan society: political leaders, trade unionists, intellectuals, etc), 40.000 people were judged by war courts, there was a huge depuration of republicans and catalanists from public administration, etc (Risques 1999).
4
despite the intense changes occurred in the world5. Its population, internally plural, has different identities, composed by different proportions of “Catalanness” and “Spanishness” and there are different ideas about the consideration of Catalonia as a nation (Colomer 1984). But these identities are compatible with a civil and political agreement which is based on the consideration of the catalan language is the own language of Catalonia6, on the defence of Catalan as the prioritary language in Catalonia7 and, finally, that the future of the same community depends on the will of its population8. 2. The framework of analysis and its variables.
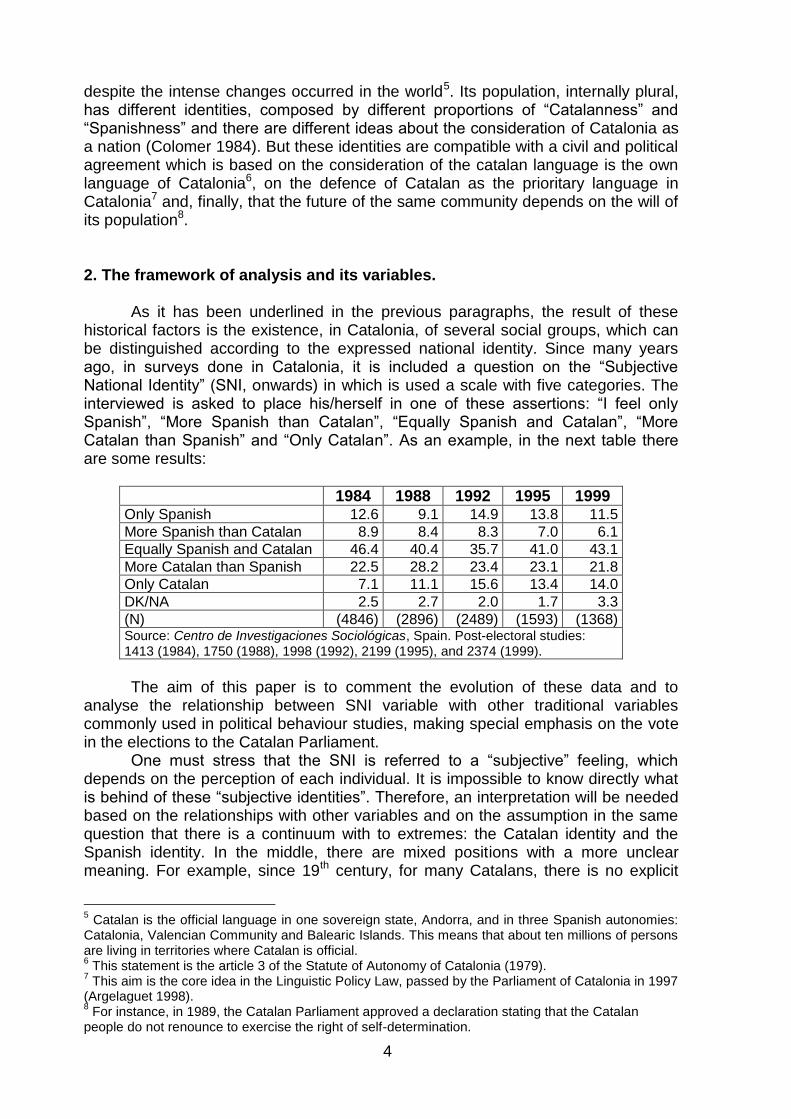
As it has been underlined in the previous paragraphs, the result of these historical factors is the existence, in Catalonia, of several social groups, which can be distinguished according to the expressed national identity. Since many years ago, in surveys done in Catalonia, it is included a question on the “Subjective National Identity” (SNI, onwards) in which is used a scale with five categories. The interviewed is asked to place his/herself in one of these assertions: “I feel only Spanish”, “More Spanish than Catalan”, “Equally Spanish and Catalan”, “More Catalan than Spanish” and “Only Catalan”. As an example, in the next table there are some results:
1984 1988 1992 1995 1999 Only Spanish 12.6 9.1 14.9 13.8 11.5
More Spanish than Catalan 8.9 8.4 8.3 7.0 6.1
Equally Spanish and Catalan 46.4 40.4 35.7 41.0 43.1
More Catalan than Spanish 22.5 28.2 23.4 23.1 21.8
Only Catalan 7.1 11.1 15.6 13.4 14.0
DK/NA 2.5 2.7 2.0 1.7 3.3
(N) (4846) (2896) (2489) (1593) (1368) Source: Centro de Investigaciones Sociológicas, Spain. Post-electoral studies: 1413 (1984), 1750 (1988), 1998 (1992), 2199 (1995), and 2374 (1999).
The aim of this paper is to comment the evolution of these data and to analyse the relationship between SNI variable with other traditional variables commonly used in political behaviour studies, making special emphasis on the vote in the elections to the Catalan Parliament. One must stress that the SNI is referred to a “subjective” feeling, which depends on the perception of each individual. It is impossible to know directly what is behind of these “subjective identities”. Therefore, an interpretation will be needed based on the relationships with other variables and on the assumption in the same question that there is a continuum with to extremes: the Catalan identity and the Spanish identity. In the middle, there are mixed positions with a more unclear meaning. For example, since 19th century, for many Catalans, there is no explicit
5 Catalan is the official language in one sovereign state, Andorra, and in three Spanish autonomies:
Catalonia, Valencian Community and Balearic Islands. This means that about ten millions of persons are living in territories where Catalan is official. 6 This statement is the article 3 of the Statute of Autonomy of Catalonia (1979).
7 This aim is the core idea in the Linguistic Policy Law, passed by the Parliament of Catalonia in 1997
(Argelaguet 1998). 8 For instance, in 1989, the Catalan Parliament approved a declaration stating that the Catalan
people do not renounce to exercise the right of self-determination.

5
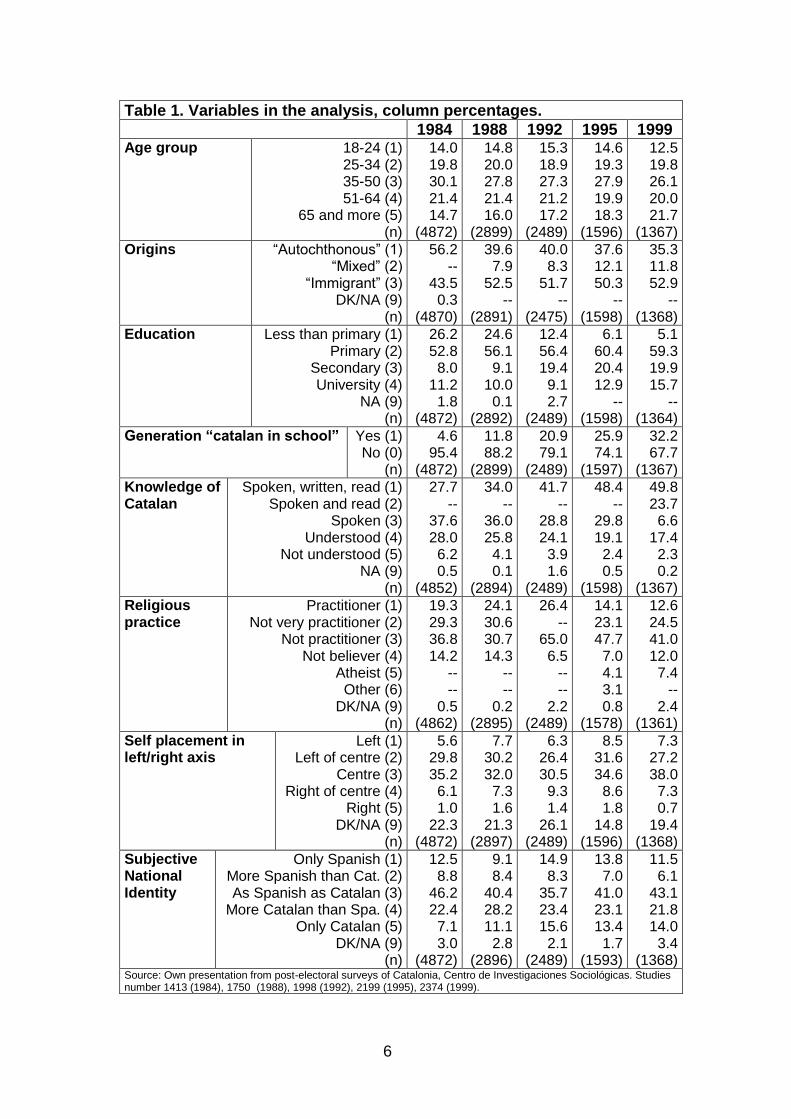
contradiction between being “catalan” and, at the same time, “Spanish” because the first one is an identity related to the nation and the second one is related to the State. Only when the Spanish identity built by the Spanish authorities has been perceived by the Catalans as too much “Castilian”, the reluctance to the idea of “Spanishness” has grown and, linked to it, the will of secession among catalanist parties has been important (but not hegemonic neither within the parties nor in the catalan society). This so-called “separatist temptation” has to be understood as a threat against how the modern Spanish state was being built (centralist, conservative, not democratic, unilingual in Spanish –or Castilian- and monarchical). It was also an strategy to be in a better position to negotiate another way to settle the Spanish institutions, based on federalism (or, at least, allowing the territorial decentralization of power), progressive ideology, democracy, multilingual and, finally, almost always, republicanism. The core of this analysis it to explore if between these variables there is any relationship and to determine to what extend the national identity is different according to several social variables. The analysis of changes between 1984 and 1999 will show the most relevant elements of change and continuity. In addition, the relationship between all these variables and political behaviour at the Catalan elections will be explored, for two reasons. The first one is to help to understand the characterization of the voters of each political party in Catalonia; and the second one is because the Parliament of Catalonia, which represents the Catalan people, elaborates laws which rule over a lot of aspects of the everyday life of the catalan people: education, health, public works, language policy, etc. Some of these laws have important consequences on some spheres related to the individuals’ process of socialization: education, language policy and mass media, mainly. The ruling political force, CiU, as a catalanist coalition, has the explicit will to reinforce the Catalan national identity among Catalan population. This last idea justifies the attempt to compare the results between 1984 and 1999, to know if there is any change with any connexion with the policies done in that sense. The paper has been divided the five parts. In the first part, I present the evolution of the variables of the analysis. In the second part, the relationship among these variables are analysed in order to find the underlie structure which connects them. In the third part, the focus of the analysis is the SNI between 1984 and 1999, and its relationships with socio-political variables. The fourth part is dedicated to the relationships between SNI and socio-political variables at 1999 elections, and some models of logistic regression are presented. Finally, the fifth part is devoted to the relationships between “political option” at 1999 elections and other variables, in order to find the differences and similitudes of the voters of the main political options. The data come from the studies done by the CIS9 after the elections at the Parliament of Catalonia in the years 1984, 1988, 1992, 1995 and 1999. These are all the elections done in Catalonia for its Parliament since the recovery of autonomy in 1979, except the first ones, held in 1980. The elections of this year have been omitted in the analysis because the unavailability of a comparable survey and because the Catalan party system was very different in relation to that existing after 1984 onwards. The distribution of frequencies of the several variables included in the analysis for all the years is shown in table 1. The data provided are commented in the next pages.
9 CIS (Centro de Investigaciones Sociológicas [Sociologial Research Centre]), depending on the
Spanish Government.
6
Table 1. Variables in the analysis, column percentages.
1984 1988 1992 1995 1999 Age group 18-24 (1)
25-34 (2) 35-50 (3) 51-64 (4)
65 and more (5) (n)
14.0 19.8 30.1 21.4 14.7
(4872)
14.8 20.0 27.8 21.4 16.0
(2899)
15.3 18.9 27.3 21.2 17.2
(2489)
14.6 19.3 27.9 19.9 18.3
(1596)
12.5 19.8 26.1 20.0 21.7
(1367)
Origins “Autochthonous” (1) “Mixed” (2)
“Immigrant” (3) DK/NA (9)
(n)
56.2 --
43.5 0.3
(4870)
39.6 7.9
52.5 --
(2891)
40.0 8.3
51.7 --
(2475)
37.6 12.1 50.3
-- (1598)
35.3 11.8 52.9
-- (1368)
Education Less than primary (1) Primary (2)
Secondary (3) University (4)
NA (9) (n)
26.2 52.8 8.0
11.2 1.8
(4872)
24.6 56.1 9.1
10.0 0.1
(2892)
12.4 56.4 19.4 9.1 2.7
(2489)
6.1 60.4 20.4 12.9
-- (1598)
5.1 59.3 19.9 15.7
-- (1364)
Generation “catalan in school” Yes (1) No (0)
(n)
4.6 95.4
(4872)
11.8 88.2
(2899)
20.9 79.1
(2489)
25.9 74.1
(1597)
32.2 67.7
(1367)
Knowledge of Catalan
Spoken, written, read (1) Spoken and read (2)
Spoken (3) Understood (4)
Not understood (5) NA (9)
(n)
27.7 --
37.6 28.0 6.2 0.5
(4852)
34.0 --
36.0 25.8 4.1 0.1
(2894)
41.7 --
28.8 24.1 3.9 1.6
(2489)
48.4 --
29.8 19.1 2.4 0.5
(1598)
49.8 23.7 6.6
17.4 2.3 0.2
(1367)
Religious practice
Practitioner (1) Not very practitioner (2)
Not practitioner (3) Not believer (4)
Atheist (5) Other (6)
DK/NA (9) (n)
19.3 29.3 36.8 14.2
-- --
0.5 (4862)
24.1 30.6 30.7 14.3
-- --
0.2 (2895)
26.4 --
65.0 6.5
-- --
2.2 (2489)
14.1 23.1 47.7 7.0 4.1 3.1 0.8
(1578)
12.6 24.5 41.0 12.0 7.4
-- 2.4
(1361)
Self placement in left/right axis
Left (1) Left of centre (2)
Centre (3) Right of centre (4)
Right (5) DK/NA (9)
(n)
5.6 29.8 35.2 6.1 1.0
22.3 (4872)
7.7 30.2 32.0 7.3 1.6
21.3 (2897)
6.3 26.4 30.5 9.3 1.4
26.1 (2489)
8.5 31.6 34.6 8.6 1.8
14.8 (1596)
7.3 27.2 38.0 7.3 0.7
19.4 (1368)
Subjective National Identity
Only Spanish (1) More Spanish than Cat. (2) As Spanish as Catalan (3)
More Catalan than Spa. (4) Only Catalan (5)
DK/NA (9) (n)
12.5 8.8
46.2 22.4 7.1 3.0
(4872)
9.1 8.4
40.4 28.2 11.1 2.8
(2896)
14.9 8.3
35.7 23.4 15.6 2.1
(2489)
13.8 7.0
41.0 23.1 13.4 1.7
(1593)
11.5 6.1
43.1 21.8 14.0 3.4
(1368) Source: Own presentation from post-electoral surveys of Catalonia, Centro de Investigaciones Sociológicas. Studies number 1413 (1984), 1750 (1988), 1998 (1992), 2199 (1995), 2374 (1999).
7
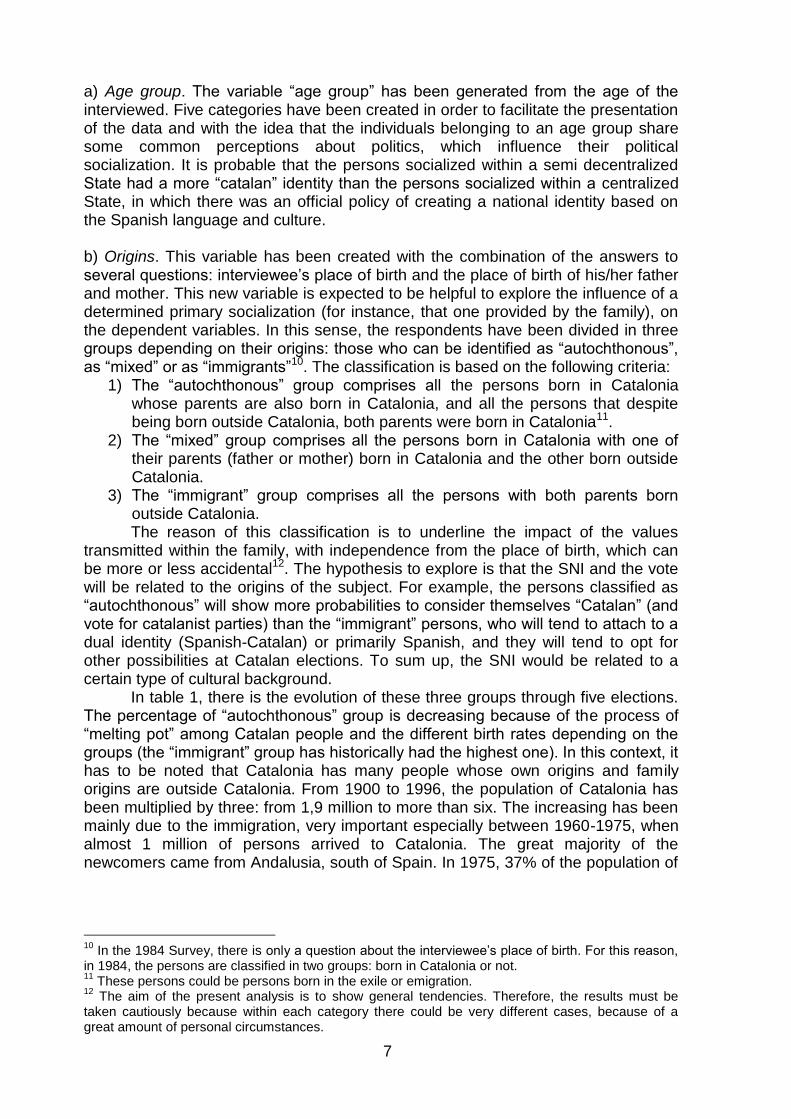
a) Age group. The variable “age group” has been generated from the age of the interviewed. Five categories have been created in order to facilitate the presentation of the data and with the idea that the individuals belonging to an age group share some common perceptions about politics, which influence their political socialization. It is probable that the persons socialized within a semi decentralized State had a more “catalan” identity than the persons socialized within a centralized State, in which there was an official policy of creating a national identity based on the Spanish language and culture.
b) Origins. This variable has been created with the combination of the answers to several questions: interviewee’s place of birth and the place of birth of his/her father and mother. This new variable is expected to be helpful to explore the influence of a determined primary socialization (for instance, that one provided by the family), on the dependent variables. In this sense, the respondents have been divided in three groups depending on their origins: those who can be identified as “autochthonous”, as “mixed” or as “immigrants”10. The classification is based on the following criteria:
1) The “autochthonous” group comprises all the persons born in Catalonia whose parents are also born in Catalonia, and all the persons that despite being born outside Catalonia, both parents were born in Catalonia11.
2) The “mixed” group comprises all the persons born in Catalonia with one of their parents (father or mother) born in Catalonia and the other born outside Catalonia.
3) The “immigrant” group comprises all the persons with both parents born outside Catalonia. The reason of this classification is to underline the impact of the values
transmitted within the family, with independence from the place of birth, which can be more or less accidental12. The hypothesis to explore is that the SNI and the vote will be related to the origins of the subject. For example, the persons classified as “autochthonous” will show more probabilities to consider themselves “Catalan” (and vote for catalanist parties) than the “immigrant” persons, who will tend to attach to a dual identity (Spanish-Catalan) or primarily Spanish, and they will tend to opt for other possibilities at Catalan elections. To sum up, the SNI would be related to a certain type of cultural background.
In table 1, there is the evolution of these three groups through five elections. The percentage of “autochthonous” group is decreasing because of the process of “melting pot” among Catalan people and the different birth rates depending on the groups (the “immigrant” group has historically had the highest one). In this context, it has to be noted that Catalonia has many people whose own origins and family origins are outside Catalonia. From 1900 to 1996, the population of Catalonia has been multiplied by three: from 1,9 million to more than six. The increasing has been mainly due to the immigration, very important especially between 1960-1975, when almost 1 million of persons arrived to Catalonia. The great majority of the newcomers came from Andalusia, south of Spain. In 1975, 37% of the population of
10
In the 1984 Survey, there is only a question about the interviewee’s place of birth. For this reason, in 1984, the persons are classified in two groups: born in Catalonia or not. 11
These persons could be persons born in the exile or emigration. 12
The aim of the present analysis is to show general tendencies. Therefore, the results must be taken cautiously because within each category there could be very different cases, because of a great amount of personal circumstances.
8
Catalonia was born outside the country13. Since 1975, the immigration to Catalonia almost stopped and, therefore, the percentage of people born in Catalonia is getting higher. Recently, the immigration is increasing again. Now, the immigrants come from countries outside Europe. In 1996 Census, 2,8% of Catalan population was born in a foreign country. It is out of doubt that these changes in the population will have some sort of impact in the conception of the Catalan national identity. c) Education. The level of the acquired formal education is a very useful variable to analyse electoral behaviour and political culture in general. The data are presented in four categories depending on the level of education received by the individuals. In this analysis, the inclusion of this variable is important because the level of knowledge of Catalan language depends on the education: more education, more knowledge of Catalan. In addition, it is important to note that the youngest interviewed tend to have reached a higher level of education and, maybe, this particular situation could be connected with their SNI and their behaviour at elections. d) Generation “catalan in school”. This is a variable computed from the “age” and it distinguishes the individuals into two groups according to one particular birth year: 1965. Those who were born before this year went to school when Catalan was forbidden. All their education was in Spanish and under a nationalistic Spanish approach in History and other Social Sciences. On the other hand, those who were born after 1965 had the Catalan language taught in school and some of them, indeed, were taught in Catalan, because of the introduction of the official use of Catalan in schools. Some persons of this last group have had the opportunity to receive their education with a more Catalan approach. This change in education is due to the recognition of the official use of Catalan in schools (from 1978, but specially from 1983), and the education policy done by the Catalan autonomous government14. The differences between these two groups would be related to a “generation effect”. Therefore, it could be a rough indicator of a different secondary socialization. On one hand, there are those who have entered in contact with Catalan language (and in extension, Catalan culture) in school. These persons, in contrast with other persons, will tend to have a more Catalan SNI, and they will tend to vote more for catalanist parties because they would have different attitudes and feelings. On the other hand, there are those persons who were in school when Catalan was forbidden, the Catalan identity was marginalized and all the education was in Spanish15. The access to the Catalan culture at school would have helped to reinforce the awakening of the Catalan identity. e) Knowledge of Catalan. There is a basic assumption in Catalonia, which has been taken almost as an axiom: the Catalan identity is much linked to the Catalan language (Woolard 1992). For instance, the defence and use of the Catalan language is one characteristic of the catalanism. Therefore, the use of the Catalan
13
This percentage was even higher in some parts of the territory. For instance, in the industrial area of Barcelona, it reached the 56% of the inhabitants. In addition, inside Barcelona, in some areas the 90% of inhabitants was born outside Catalonia. 14
This generation is the first generation in the History that it has had to show a certain level of knowledge of Catalan in order to get the education basic certificate, and it had to pass an exam of Catalan in the examinations to the access to the university. 15
As previous variables, it is intended to show some general trends. There is always a great deal of particular cases, with special circumstances.

9
language has been forbidden (or tolerated in the best political conditions) during many years by the Spanish authorities because the Catalan language has been always perceived as the basic feature of the Catalan identity since the Middle Ages16.
In almost all the surveys done in Catalonia, there is a question about the knowledge of Catalan. The data provided by these five surveys are congruent with similar data obtained in the population census17. The knowledge of Catalan language is increasing constantly through the years because of language policy done by the Catalan government and by local authorities. This policy puts special emphasis in the use of Catalan in the education system (nowadays, the almost all the schools Catalan is the language of instruction, but Spanish is also taught), in the administration and in the public media18. Of course, the language policy has not been exempt of controversy, mainly, in two senses. One is related to the present (and future) situation of the linguistic rights of the Spanish speakers in Catalonia; and the other is related to the actual situation of the use of Catalan among Catalan society and its perspectives (Webber and Strubell 1991). f) Religious practice. Catalonia is a society whose main religion is Catholic and other religious confessions are much less important. Nevertheless, because of modernisation, the extension of lay city is becoming very high, especially among people with more leftist ideologies, which, in historically terms, in Catalonia, have had strong “antichurch” feelings. In consequence, it is still possible to verify some relationships between vote and religious practice. Beyond this question, it is also a fact that there are no religious differences among Catalan population, i.e., as the “autochthonous”, the “immigrants” are Catholic, too. Therefore, it would seem difficult to find out some relationships between religiousness and SNI. g) Self placement in left/right axis. This variable comes from the question in which the interviewees are asked to place themselves in a continuum left right. In the original surveys, this continuum has 10 positions, plus “Don’t know” and “Don’t answer”, but in this analysis have been reduced to 5, in order to make easier the study, and a category for the “Don’t know” and “Don’t answer” together has been kept. From the data, it can be underline two aspects. One is that the mean of the Catalan population is, clearly, on the left of centre. The other is there are many people who cannot or does not want to answer this question. i) Subjective National Identity (SNI). On the contrary of the previous variable, in this case, the great majority of population has no problem to assert his/her SNI. From the data, it can be noted that the dual identity is the most chosen one, but the primarily Catalan categories are quite chosen, much more than the opposing ones are. The positions linked to a Spanish identity are minority, and quite polarised: the category “only Spanish” has always more support than the category “more Spanish
16
Since 1714 to 1978, the Catalan language has been prohibited in its official use in Catalonia, except during few years: 1914-1923 and 1931-39. Private uses of Catalan have been tolerated depending on the political situation, but during the Franco’s regime, the public use of Catalan was severely restricted everywhere. 17
Official data about the knowledge of Catalan can be found in web page of the Statistic Institute of Catalonia (ww w.idescat.es). For instance, in the last census, the figures show that Catalan is understood by 95% of population, and only 45,8% of population declares its capacity to write in Catalan. In 1986, the figures were 90% and 31,5%, respectively. Also, it is interesting the web page of the Department of Culture of the Catalan Government: http:// llengua.gencat.es 18
For a short analysis of the language policy in Catalonia, see Argelaguet (2001).

10
than Catalan”. On the other side of the distribution, this is not the case: there are always more people in “more Catalan category” than “only Catalan category”. Finally, the general evolution of the data has to be stressed: through the surveys, the “only catalan” category has tended to increase. Perhaps, it is an indicator of the recovery of the national Catalan identity as an indirect result of 20 years of a semiautonomous self-government. j) Political option in the elections at the Parliament of Catalonia. Finally, the last variable used in the analysis is the option in the elections at the Parliament of Catalonia. In table 2, there are the official results of the elections and the data of the respective post electoral survey. It has to be underlined that the percentages are calculated over all the electorate (not only the voters) because the non-voting option has been taken into account. It is not intended to present a complete analysis of the electoral behaviour in Catalonia because it would take a lot of time due to its complexity19. Nevertheless, it is worthwhile to quote some of its trends in order to facilitate its understanding and to give some clues of the Catalan party system20. The first one is that the Catalan electoral behaviour is characterized by its regular variation depending on the type of elections: Spanish, Catalan or local elections. This regular variation is the result of two political phenomena: the differential non-voting (some citizens, whose origins are in the immigration, do not systematically vote in Catalan elections because they are not interested in) and the dual vote (some citizens vote for one party in the Catalan elections and for another in the Spanish elections) (Riba 2000). The result is that in the Spanish elections, the winner is always the PSC (the Socialists’ Party of Catalonia); and at the Catalan elections, the winner has been always the moderate Catalan nationalist coalition CiU (Convergence and Union)21. The other parties also show different results depending on the type of the elections. The presentation of real results along with the survey data allows to compare and to bear in mind the differences between these two sets of data. The main differences are that CIE and ERC are overestimated in surveys, PSC and IC are underestimated and non-voting and PP is specially underestimated. These deviations will have to be taken into account in the analysis because they will be able to disguise some effects and relationships among variables.
19
It is worth to look at the publications of “Equip de Sociologia Electoral” [Electoral Sociology Team], Font and others (1998), Marcet and Argelaguet (1998). There are interesting working papers published by “Institut de Ciències Polítiques i Socials” (ww w.icps.es). 20
Fossas and Colomé (1993); Pallarés and Font (1994); Pallarés and others (1996); Caminal and Matas (1998). 21
In the last Catalan elections, PSC had more votes but, due to the electoral system, it got fewer seats than CiU. Since the first restored Catalan Parliament in 1980, the Catalan government has been in CiU’s hands.

11
Table 2. Results of the elections at the Parliament of Catalonia (1)
1980 1984 1988 1992 1995 1999
Elect. Elect
. Survey
Elect.
Survey Elect
. Survey
Elect.
Survey Elect
. Survey
Non voting (0) CiU (1)
PSC (2) AP/PP (3)
ERC (4) PSUC/IC (5) Other (6) (*)
DK/NA (9) (n)
38.6 17.0 13.7 1.4 5.4
11.5 12.4
35.8 29.9 19.2 4.9 2.8 3.6 3.8 ---
20.4 33.9 21.6 3.2 3.4 3.7 3.3
10.6 (4872)
40.6 27.0 17.6 3.1 2.4 4.6 4.6 ---
24.8 29.4 19.1 2.1 2.7 6.1 2.7
13.1 (2899)
45.1 25.2 15.0 3.3 4.3 3.6 3.4 ---
29.2 28.4 14.4 1.4 4.8 3.0 2.5
16.3 (2489)
36.0 26.1 15.8 8.3 6.1 6.2 1.4 ---
24.3 28.3 13.3 5.2 6.9 6.0 0.7
15.2 (1597)
40.8 22.3 22.4 5.6 5.1 1.5 2.4 ---
25.7 25.3 21.3 3.8 5.8 2.1 2.3
13.6 (1368)
electorate 4.436.459 4.501.851 4.564.389 4.824.252 5.029.727 5.293.657
CiU/ERC PSC/IC/ERC
22.4 30.6
32.7 25.6
37.3 28.7
29.4 24.6
32.1 27.9
29.5 22.9
32.7 22.2
32.2 28.1
35.2 26.2
27.4 29.0
31.1 29.2
(1) Actual results of the elections (% of the electorate) and data from the post-electoral surveys. (*) In “others”, the following options are included: in all the years, white and null votes and votes for “other parties”, some of them won some seats. For instance, in 1980, UCD received 6,5% of the electorate and PSA 1,6%; in 1988, CDS received 2.3% of the electorate. To know more about catalan political parties, see Molas (2000). Source: The aforementioned surveys from CIS. Electoral results: ESE (1984), ESE (1989), El País, ww w.gencat.es
3. The relationships among variables. After the presentation of the marginal frequencies of the variables included in the analysis, in order to find the structure of connections among the previous variables, an index of relationship has been calculated from the cross tabulations of all variables with the rest of them for each year. The chosen index is tau-c, because all the variables are ordinal after treating “Don’t know/Don’t answer” category as a “missing value”. For this analysis, two new dummy variables have been calculated. One is “vote for nationalist catalan parties”, whose label is “natcat”, and which divides the individuals in two groups: those who vote for CiU or ERC and the rest of the political options. The second one is “vote for leftist parties”, whose label is “left”, and which divides the individuals in two groups: those who vote for PSC, ERC or IC and the rest.
12
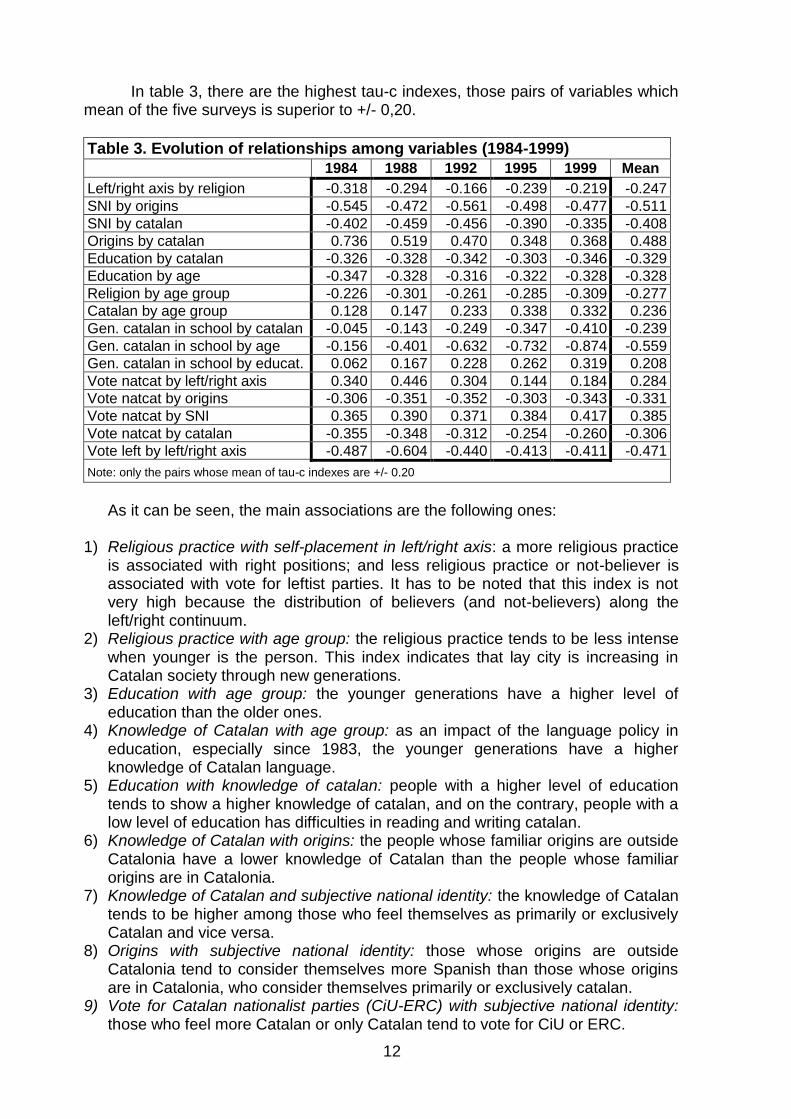
In table 3, there are the highest tau-c indexes, those pairs of variables which mean of the five surveys is superior to +/- 0,20.
Table 3. Evolution of relationships among variables (1984-1999)
1984 1988 1992 1995 1999 Mean
Left/right axis by religion -0.318 -0.294 -0.166 -0.239 -0.219 -0.247
SNI by origins -0.545 -0.472 -0.561 -0.498 -0.477 -0.511
SNI by catalan -0.402 -0.459 -0.456 -0.390 -0.335 -0.408
Origins by catalan 0.736 0.519 0.470 0.348 0.368 0.488
Education by catalan -0.326 -0.328 -0.342 -0.303 -0.346 -0.329
Education by age -0.347 -0.328 -0.316 -0.322 -0.328 -0.328
Religion by age group -0.226 -0.301 -0.261 -0.285 -0.309 -0.277
Catalan by age group 0.128 0.147 0.233 0.338 0.332 0.236
Gen. catalan in school by catalan -0.045 -0.143 -0.249 -0.347 -0.410 -0.239
Gen. catalan in school by age -0.156 -0.401 -0.632 -0.732 -0.874 -0.559
Gen. catalan in school by educat. 0.062 0.167 0.228 0.262 0.319 0.208
Vote natcat by left/right axis 0.340 0.446 0.304 0.144 0.184 0.284
Vote natcat by origins -0.306 -0.351 -0.352 -0.303 -0.343 -0.331
Vote natcat by SNI 0.365 0.390 0.371 0.384 0.417 0.385
Vote natcat by catalan -0.355 -0.348 -0.312 -0.254 -0.260 -0.306
Vote left by left/right axis -0.487 -0.604 -0.440 -0.413 -0.411 -0.471
Note: only the pairs whose mean of tau-c indexes are +/- 0.20
As it can be seen, the main associations are the following ones:
1) Religious practice with self-placement in left/right axis: a more religious practice
is associated with right positions; and less religious practice or not-believer is associated with vote for leftist parties. It has to be noted that this index is not very high because the distribution of believers (and not-believers) along the left/right continuum.
2) Religious practice with age group: the religious practice tends to be less intense when younger is the person. This index indicates that lay city is increasing in Catalan society through new generations.
3) Education with age group: the younger generations have a higher level of education than the older ones.
4) Knowledge of Catalan with age group: as an impact of the language policy in education, especially since 1983, the younger generations have a higher knowledge of Catalan language.
5) Education with knowledge of catalan: people with a higher level of education tends to show a higher knowledge of catalan, and on the contrary, people with a low level of education has difficulties in reading and writing catalan.
6) Knowledge of Catalan with origins: the people whose familiar origins are outside Catalonia have a lower knowledge of Catalan than the people whose familiar origins are in Catalonia.
7) Knowledge of Catalan and subjective national identity: the knowledge of Catalan tends to be higher among those who feel themselves as primarily or exclusively Catalan and vice versa.
8) Origins with subjective national identity: those whose origins are outside Catalonia tend to consider themselves more Spanish than those whose origins are in Catalonia, who consider themselves primarily or exclusively catalan.
9) Vote for Catalan nationalist parties (CiU-ERC) with subjective national identity: those who feel more Catalan or only Catalan tend to vote for CiU or ERC.
13
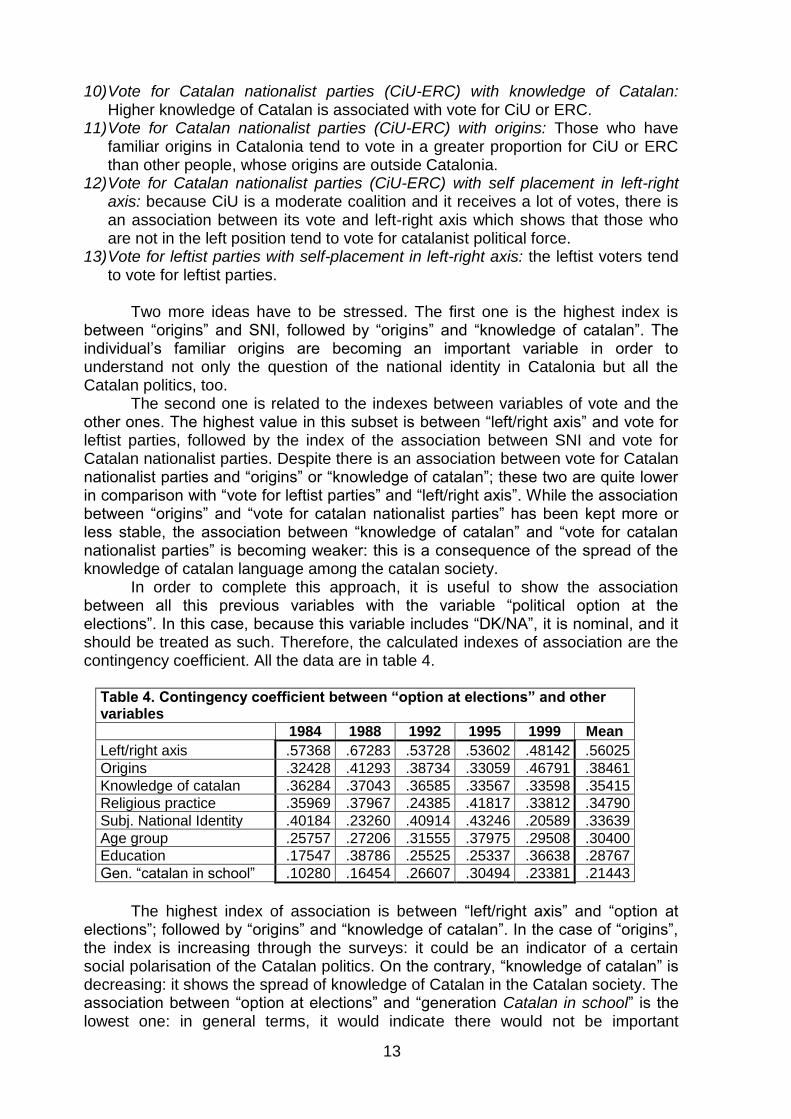
10) Vote for Catalan nationalist parties (CiU-ERC) with knowledge of Catalan: Higher knowledge of Catalan is associated with vote for CiU or ERC.
11) Vote for Catalan nationalist parties (CiU-ERC) with origins: Those who have familiar origins in Catalonia tend to vote in a greater proportion for CiU or ERC than other people, whose origins are outside Catalonia.
12) Vote for Catalan nationalist parties (CiU-ERC) with self placement in left-right axis: because CiU is a moderate coalition and it receives a lot of votes, there is an association between its vote and left-right axis which shows that those who are not in the left position tend to vote for catalanist political force.
13) Vote for leftist parties with self-placement in left-right axis: the leftist voters tend to vote for leftist parties.
Two more ideas have to be stressed. The first one is the highest index is
between “origins” and SNI, followed by “origins” and “knowledge of catalan”. The individual’s familiar origins are becoming an important variable in order to understand not only the question of the national identity in Catalonia but all the Catalan politics, too.
The second one is related to the indexes between variables of vote and the other ones. The highest value in this subset is between “left/right axis” and vote for leftist parties, followed by the index of the association between SNI and vote for Catalan nationalist parties. Despite there is an association between vote for Catalan nationalist parties and “origins” or “knowledge of catalan”; these two are quite lower in comparison with “vote for leftist parties” and “left/right axis”. While the association between “origins” and “vote for catalan nationalist parties” has been kept more or less stable, the association between “knowledge of catalan” and “vote for catalan nationalist parties” is becoming weaker: this is a consequence of the spread of the knowledge of catalan language among the catalan society.
In order to complete this approach, it is useful to show the association between all this previous variables with the variable “political option at the elections”. In this case, because this variable includes “DK/NA”, it is nominal, and it should be treated as such. Therefore, the calculated indexes of association are the contingency coefficient. All the data are in table 4.
Table 4. Contingency coefficient between “option at elections” and other variables
1984 1988 1992 1995 1999 Mean
Left/right axis .57368 .67283 .53728 .53602 .48142 .56025
Origins .32428 .41293 .38734 .33059 .46791 .38461
Knowledge of catalan .36284 .37043 .36585 .33567 .33598 .35415
Religious practice .35969 .37967 .24385 .41817 .33812 .34790
Subj. National Identity .40184 .23260 .40914 .43246 .20589 .33639
Age group .25757 .27206 .31555 .37975 .29508 .30400
Education .17547 .38786 .25525 .25337 .36638 .28767
Gen. “catalan in school” .10280 .16454 .26607 .30494 .23381 .21443
The highest index of association is between “left/right axis” and “option at elections”; followed by “origins” and “knowledge of catalan”. In the case of “origins”, the index is increasing through the surveys: it could be an indicator of a certain social polarisation of the Catalan politics. On the contrary, “knowledge of catalan” is decreasing: it shows the spread of knowledge of Catalan in the Catalan society. The association between “option at elections” and “generation Catalan in school” is the lowest one: in general terms, it would indicate there would not be important
14
relationship between being of a particular generation and political option at elections. 4. The subjective national identity: its evolution and its associations with other social and political variables (1984 and 1999). In the next pages, some comments about the SNI and its evolution and associations with other social and political variables will be done. Two particular surveys have been chosen to show how was the situation of the Catalan society at the beginnings of the semi-autonomy period (1984) and the registered changes in the present situation (1999). In table 5, there is the entire cross tabulations involved in this analysis. In the first row, there are the frequencies of the overall sample in the SNI, which facilitate the comparison with the rest of the variables and with the other year, and they allow establishing the changes and continuities between both surveys. The first idea to underline is that, as a theoretical mean, the SNI in Catalonia is mainly “dual”, but lightly oriented towards to a “catalan one”. The main change between 1984 and 1999 is the increasing of the percentage of persons who consider themselves “only Catalan” (i.e., denying to be nationally Spanish). This growth decisively contributes to the increasing of the “predominant catalan identity” side of the distribution: 15 years after the first survey, this percentage is 35,8%, 6,3 points higher than 1984 (29,5%). On the other side, the “primarily Spanish identities” have decreased. Beyond this first approach, in the following lines, all the cross tabulations will be commented to enrich the analysis which is being done.

15
Table 5. Subjective National Identity in Catalonia (1984 and 1999)
% Row 1984 1999
Spa +Spa Sp=C +Cat Cat NA Spa +Spa Sp=C +Cat Cat NA
Overall sample 12.5 8.8 46.2 22.4 7.1 3.0 11.5 6.1 43.1 21.8 14.0 3.4
Age group
18-24 25-34 35-50 51-64
65 and more
10.8 12.7 14.4 11.8 11.0
7.5 9.3
10.0 8.6 7.2
46.1 43.5 46.7 49.4 44.1
24.8 23.2 20.5 21.9 23.5
6.9 7.4 6.3 6.4 9.4
3.8 3.9 2.1 1.9 4.7
9.9 7.0
11.8 14.7 13.5
5.3 4.4 4.5 7.7 8.8
46.2 49.3 44.8 37.7 38.9
22.8 19.3 21.8 23.4 22.0
12.9 17.0 12.6 12.1 15.2
2.9 3.0 4.5 4.4 1.7
Born in Catalonia
Yes No
4.4
23.2
3.6
15.6
42.1 51.5
35.2
5.9
12.1
0.6
2.6 3.2
3.3
27.1
2.6
12.9
42.7 43.9
29.1
7.8
20.3
2.1
1.9 6.1
Origins
“Autochthonous” “Mixed”
“Immigrant”
-- -- --
-- -- --
-- -- --
-- -- --
-- -- --
-- -- --
0.4 0.6
21.4
1.0 3.1
10.2
31.1 49.4 49.8
37.3 29.0
9.8
28.4 16.0
4.0
1.9 1.9 4.7
Education
Less than primary Primary
Secondary University
DK/NA
15.8 12.6
7.4 8.8 8.5
10.5
9.0 7.2 5.2 9.9
47.8 47.6 38.8 42.0 39.4
17.5 21.1 36.8 28.0 30.8
5.5 7.1 6.9
11.4 6.1
2.9 2.7 2.9 4.6 5.4
30.0 14.0
3.7 6.5
--
11.4
7.5 3.3 2.8
--
35.7 44.5 46.9 36.0
--
7.1
18.7 28.8 29.0
--
11.4 13.5 14.0 16.8
--
4.3 1.9 3.3 8.9
--
Gen. “Catalan...”
No yes
12.6 10.3
8.6
12.8
46.6 37.0
21.9 31.0
7.2 4.6
3.0 4.4
8.2
13.2
4.8 6.8
48.1 40.8
20.6 22.4
15.4 13.3
2.9 3.6
Catalan...
Spoken and written Spoken and read
Spoken Understood
Not understood NA
2.3
-- 9.4
22.1 34.7
--
2.1
-- 5.5
16.5 24.1
--
39.0
-- 48.3 53.2 34.8 45.5
37.9
-- 27.3
5.1 0.8
20.2
15.3
-- 7.2 0.5 0.1 3.8
3.4
-- 2.4 2.6 5.6
19.1
3.5 8.0
14.4 32.9 51.6 33.3
2.2 4.6
13.3 15.6 16.1
--
41.6 48.1 45.6 42.2 25.8 33.3
30.1 22.5 11.1
3.8 -- --
20.4 11.7 12.2
1.3 -- --
2.1 4.9 3.3 4.2 6.5
33.3
Religious practice
Practitioner Not very practitioner
Not practitioner Not believer
Atheist DK/NA
11.8 14.6 11.4 12.2
-- 13.5
6.9 9.9
10.2 5.8
-- --
43.1 45.9 48.8 43.8
-- 49.7
26.8 21.2 20.8 23.0
-- 18.7
8.5 6.3 5.8 9.8
-- 13.5
2.9 2.0 2.9 5.4
-- 4.5
12.8 12.9 12.9
5.5 6.9
15.2
5.2 6.9 6.5 6.1 3.0 6.1
43.0 45.3 42.8 42.1 42.6 27.3
19.2 19.2 24.2 23.8 18.8 24.2
16.3 13.2 12.0 16.5 20.8 12.1
3.5 2.4 1.6 6.1 7.9
15.2
Left/right axis
Left Left of centre
Centre Right of centre
Right DK/NA
16.3 11.6
7.8 18.7 32.6 17.7
7.4 8.8 6.5
14.3 13.7 11.0
33.9 48.8 47.0 37.2 41.1 47.0
22.2 22.2 28.5 20.2
6.3 14.2
14.0
6.2 8.4 8.3 1.6 4.5
6.2 2.4 1.7 1.3 4.7 5.6
9.0 9.4
10.8 12.0 20.0 16.5
7.0 5.6 5.6 7.0
10.0 7.1
29.0 47.8 41.3 42.0 60.0 45.1
20.0 21.0 27.3 23.0
-- 13.2
26.0 13.4 12.7 15.0 10.0 12.8
9.0 2.7 2.3 1.0
-- 5.3
Electoral option
Non voting CiU
PSC PP
ERC IC
Other DK/NA
18.1
4.9 17.0 32.3
3.9 9.5 8.3
15.8
13.5
3.5 12.3 26.8
1.2 6.5 8.3 7.4
46.3 44.6 54.8 34.5 19.6 45.3 45.2 46.3
12.4 35.1 12.5
5.7 39.5 28.7 18.7 19.6
4.6
10.4 1.1 0.5
33.5 6.2
13.3 5.5
5.1 1.5 2.3 0.3 2.3 3.8 6.2 5.3
16.0
2.0 18.2 32.7
-- 6.9 6.3
11.3
5.7 2.0
12.0 21.2
-- 3.4
-- 5.4
51.0 35.8 50.7 38.5 10.0 51.7 46.9 43.5
13.1 40.5 11.6
1.9 37.5 17.2 15.6 19.9
9.1
19.1 5.1 1.9
51.3 13.8 18.8 14.5
5.1 0.6 2.4 3.8 1.3 6.9
12.5 5.4
Vote for CiU-ERC Vote for PSC-IC
4.8 15.9
3.3 11.5
42.3 53.4
35.5 14.8
12.5 1.9
1.5 2.5
1.6 17.1
1.6 11.2
31.0 50.8
39.9 12.1
25.1 5.9
0.7 2.8
1) Age group. Since 1984, the biggest change is in the category “only catalan”,
which has increased its percentage in all the groups, especially in 25-34 years group. Nevertheless, the general trend, for all the groups, is very similar: there is an increasing of “primarily catalan identities”, a decreasing of “primarily Spanish identity” and maintenance of “dual identities”.

16
2) Born in Catalonia. This variable distinguishes the individuals depending on
his/her place of birth (in Catalonia or not). The differences between both groups are important. In 1999, only 2,1% of those born outside Catalonia consider themselves "only catalan" (in fact, this is an increase since 1984, when this percentage was only 0,6%). On the other hand, only 3,3% of those born in Catalonia feel themselves as “only Spanish” and only 2,6% “more Spanish than Catalan”. Almost half of them feel or “more Catalan than Spanish “ (29,1%) or “only Catalan” (20,3%). In relation to 1984, the main change in this group is a certain polarisation of its identity. It is becoming clear the relevance of the variable “place of birth” in the configuration of the SNI in Catalonia.
3) Origins. In this variable, it is not possible to compare between surveys because
there is only data for 1999. One should remember that the 'origins' variable classifies the individuals depending on their parent’s place of birth; the differences among groups are higher. For instance, in the “autochthonous” group, the majority (37,3%) feels “more Catalan than Spanish) and another 28,3% feels “only catalan”. In total, almost 2/3 of this group claim for a primarily Catalan identity. On the contrary, only 1,5% of this group has an identity primarily Spanish. This distribution contrasts a lot with the “immigrants” distribution: half of them feel “as Spanish as Catalan”, but 21,4% feel only Spanish.
4) Education. In both years, it seems to be an association between level of formal
education and SNI. In the lower levels, more people feel "primarily Spanish"; and in the higher levels, there are more people who feel primarily Catalan. However, in fact, it is useful to take into account that “education” used to be a rather good indicator of social class.
5) Generation “catalan in school”. In 1984, the young generation (born in 1965 and
after) was less polarised than the other generation: its distribution was unimodal, slightly biased towards a more Catalan identity. In 1999, the distribution of both groups is more complex. In general, the “primarily catalan identity” has increased and the “predominant Spanish identity”, despite the decreasing of this value, is extreme. For the younger generation, the extreme positions are almost equal, and the modal position (dual identity) is much lower than in oldest generation (8 points more). It seems a certain level of polarization between exclusive identities.
6) Knowledge of Catalan. This variable shows a clear association with the SNI: the
group of the highest knowledge of Catalan is where there is a highest percentage of “primarily catalan identity” (more than 50% of the group feels “only catalan” or “more catalan”). On the other hand, 51,6% of those who do not understand Catalan feel themselves “only Spanish”. It is important to underline that 42,2% who are not able to speak Catalan feel “as Spanish as Catalan” and it is the case of 25,8% of those who do not understand Catalan. This phenomenon shows there are some differences about the interpretation of “feeling catalan”.
7) Religious practice. In this case, the religious practice is slightly associated to the
SNI. Only in the groups “not believer” and “atheist”, the percentages of persons
17
considering themselves more Catalan or only Catalan are higher than the overall sample.
8) Self-placement in left/right axis. In this case, the association exists: the leftist
people tend to feel more Catalan than the rightist people do. This distribution is linked with the historical construction of the Catalan national identity and, specially, the Spanish national identity. The values of Spanish nationalism, in Catalonia, have been associated to the conservative ideology.
9) Electoral option. This cross tabulation is very useful to compare the different
types of parties’ electorates and the rest of political options. In all the cases, the distribution of the subjective national identities is quite congruent. For instance, more than 50% of the ERC’s voters feel “only Catalan” and the two primarily Spanish categories are empty. On the contrary, the electorate of PP is the more “Spanish” of all. CiU’s voters are moderate also in this question, but primarily “more Catalan”. PSC, with a lot of voters belonging to the working class and, at the same time, with origins outside Catalonia, the main group is the “dual identity”, but the presence of “more Spanish identities is important. IC, the ecosocialist and catalanist force has a distribution, which is a mix between PSC and CiU. Comparing the changes between 1984 and 1999, there is a general swing to a more catalanist position in all the parties. If the distributions of CiU/ERC voters and PSC/IC voters are compared, it can be seen that in CiU/ERC case there is a clear change to “more Catalan identity”, while in the other group, the distribution remains almost the same.
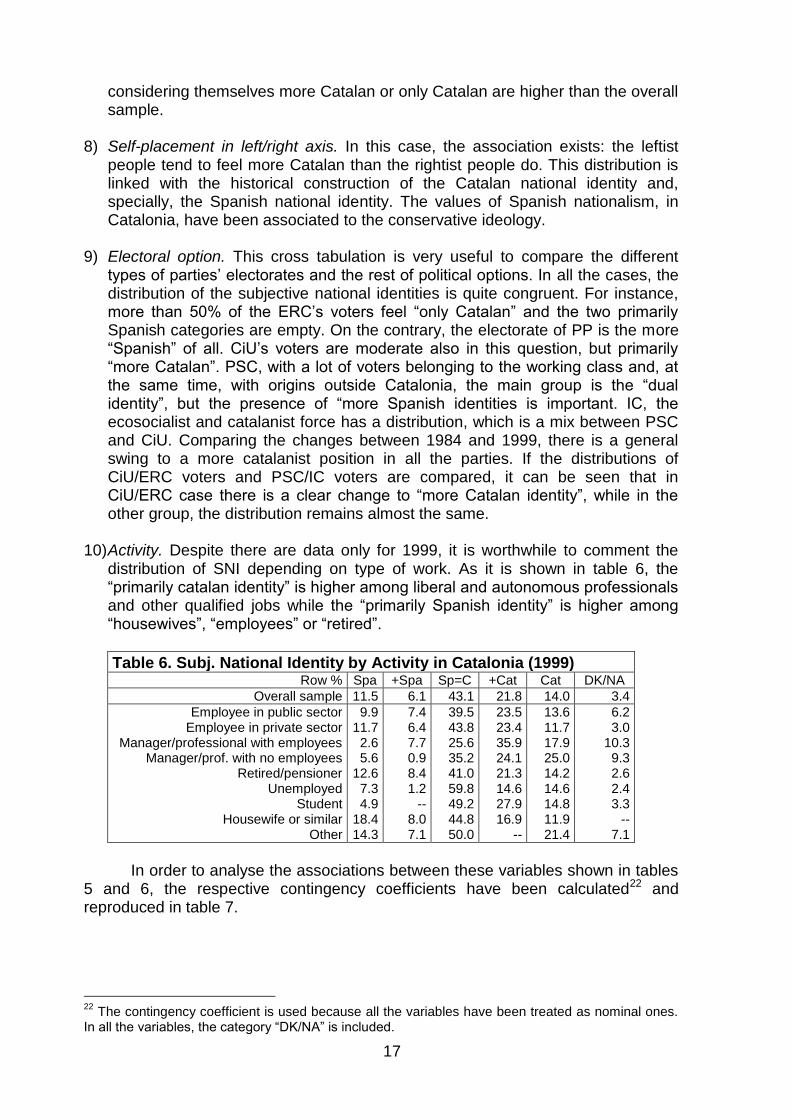
10) Activity. Despite there are data only for 1999, it is worthwhile to comment the
distribution of SNI depending on type of work. As it is shown in table 6, the “primarily catalan identity” is higher among liberal and autonomous professionals and other qualified jobs while the “primarily Spanish identity” is higher among “housewives”, “employees” or “retired”.
Table 6. Subj. National Identity by Activity in Catalonia (1999) Row % Spa +Spa Sp=C +Cat Cat DK/NA
Overall sample 11.5 6.1 43.1 21.8 14.0 3.4
Employee in public sector Employee in private sector
Manager/professional with employees Manager/prof. with no employees
Retired/pensioner Unemployed
Student Housewife or similar
Other
9.9 11.7 2.6 5.6
12.6 7.3 4.9
18.4 14.3
7.4 6.4 7.7 0.9 8.4 1.2
-- 8.0 7.1
39.5 43.8 25.6 35.2 41.0 59.8 49.2 44.8 50.0
23.5 23.4 35.9 24.1 21.3 14.6 27.9 16.9
--
13.6 11.7 17.9 25.0 14.2 14.6 14.8 11.9 21.4
6.2 3.0
10.3 9.3 2.6 2.4 3.3
-- 7.1
In order to analyse the associations between these variables shown in tables 5 and 6, the respective contingency coefficients have been calculated22 and reproduced in table 7.
22
The contingency coefficient is used because all the variables have been treated as nominal ones. In all the variables, the category “DK/NA” is included.

18
Table 7. Contingency coefficients between SNI and other variables
1984 1999
CC sig. CC sig.
Age group 0.101 0.000 0.150 0.048
Place of birth 0.471 0.000 0.456 0.000
Origins --- --- 0.491 0.000
Education 0.166 0.000 0.273 0.000
Gen. “catalan in school” 0.065 0.001 0.100 0.016
Knowledge of catalan 0.466 0.000 0.466 0.000
Religious practice 0.124 0.000 0.194 0.001
Left/right axis 0.232 0.000 0.213 0.000
Political option at elections 0.407 0.000 0.476 0.000
Vote for CiU/ERC (1) 0.333 0.000 0.476 0.000
Vote for PSC/IC/ERC (2) 0.094 0.000 0.104 0.011
Vote for PSC/IC (3) 0.175 0.000 0.224 0.000
Activity --- --- 0.258 0.000 (1)“dummy” variable: 1 (vote for CiU-ERC) 0 (else) (2)“dummy” variable: 1 (vote for PSC-IC-ERC) 0 (else) (3)“dummy” variable: 1 (vote for PSC-IC) 0 (else)
From this table, it can be confirmed that SNI is associated with “place of birth” (in 1984 survey), “origins” (in 1999 survey), “knowledge of Catalan”, “political option at the elections” and “vote for CiU/ERC”. 5. The relationships between “Subjective National Identity” and political and social variables at 1999 elections. The relationships between socio-political variables with SNI at 1999 elections can be examined by means of logistic regression models, which are summarised in table 8. First, to build the models, three new dependent variables from the SNI have been calculated. One is “Catalan SNI, which is based on the creation of two groups of individuals: those who feel “only catalan” or “primarily catalan” and the rest. The second one is “Spanish SNI, which is analogous to the previous one, but taking the primarily Spanish Identity. In addition, the third one is “Dual SNI, which is based on those who feel equally Catalan and Spanish and the others
The independent variables included in the analysis are the following ones: origins, knowledge of catalan, generation “catalan at school”, group age, religious practice, self placement in left/right axis, education, activity, political option in 1999 elections. Of all these variables, “religious practice” and “activity” are not included in any model. It seems there is no association between SNI with them. “Age group” is not included in the models of “Catalan SNI and “Dual SNI; “Generation Catalan at school” is not included in “Spanish SNI” and “Dual SNI”, and, finally, “Left/Right axis” is not included in “Spanish SNI”.

19
Table 8. Logistic Regression models of Subjective National Identity in Catalonia (1999).
Primarily CATALAN Vs. other
Primarily SPANISH Vs. other
DUAL Vs. other
B S.E. B S.E. B S.E.
Constant Origins (“Autochthonous”)
“Mixed” “Immigrant”
Political option (non voting) CiU
PSC PP
ERC IC
Other NA
Catalan (spoken and written) Spoken, read Only spoken
Only understood Not understood
Education (less than primary) Primary
Secondary University
Left/Right axis (left) Left of centre
Centre Right of centre
Right DK/DA
Gen. “Catalan at ...” (no)
Yes Age group (18-24 years)
25-34 years 35-50 years 51-64 years
More than 65 years
2.137** -0.794** -1.803** 1.056** -0.374 -1.703* 2.246** -0.251 0.177* 0.521 -0.581** -0.708* -1.796** -6.165 -1.129* -1.043** -0.886 -0.491 -0.584 -0.911* -2.207 -0.996** -0.438* -- -- -- --
0.557
0.209 0.172
0.201 0.238 0.772 0.403 0.493 0.462 0.242
0.188 0.323 0.374 6.366
0.433 0.465 0.474
0.298 0.301 0.385 1.229 0.330
0.182
-- -- -- --
-3.442** 0.776 2.358** -1.092** 0.204 1.609** -4.852 -0.495 -1.470 -0.515 0.625* 1.401** 1.791** 2.582** 0.329 -0.447 -0.040 -- -- -- -- -- -- -1.056** -0.959** -1.005** -0.797*
0.572
0.586 0.413
0.341 0.218 0.370 6.512 0.675 0.824 0.286
0.305 0.366 0.299 0.511
0.314 0.431 0.441
-- -- -- -- --
--
0.356 0.354 0.379 0.396
-1.362** 0.792** 0.911** -0.561** 0.047 -0.678* -2.028** 0.183 0.004 -0.211 0.038 -0.320 0.733** -1.497** 0.304 0.417 -0.111 0.788** 0.652* 0.893** 1.727* 0.735** -- -- -- -- --
0.409
0.197 0.150
0.171 0.173 0.332 0.403 0.413 0.400 0.190
0.154 0.252 0.197 0.449
0.284 0.318 0.330
0.262 0.264 0.334 0.720 0.281
--
-- -- -- --
N Model chi-squared
df -2 log likelihood
Overall correct % step 0 Overall correct % model
1348 553.317
22 1205.658
64.2 79.0
1348 415.437
20 844.334
82.3 84.9
1348 139.857
21 1703.121
56.9 63.2
Variables no included in the model
Religion, activity, age group
Religion, activity, Gen. “catalan”, Left/right axis
Religion, activity, Gen. “catalan”, Age group
*sig. at 5% ; **sig. at 1%
Beyond this first comment, it would be interesting to underline the main effects of the most important variables. The variable “Origins” has influences in all the models: those who are “immigrants” are less likely to feel “primarily catalan” than the “autochthonous” and, on the contrary, are more likely to feel “primarily Spanish”. The variable “knowledge of catalan” has influences in all three models,
20
too. A high level of knowledge of Catalan increases the relative propensity of the individual to feel “primarily catalan” and vice versa, a low level of knowledge of Catalan increases the relative propensity of feeling “primarily Spanish”.
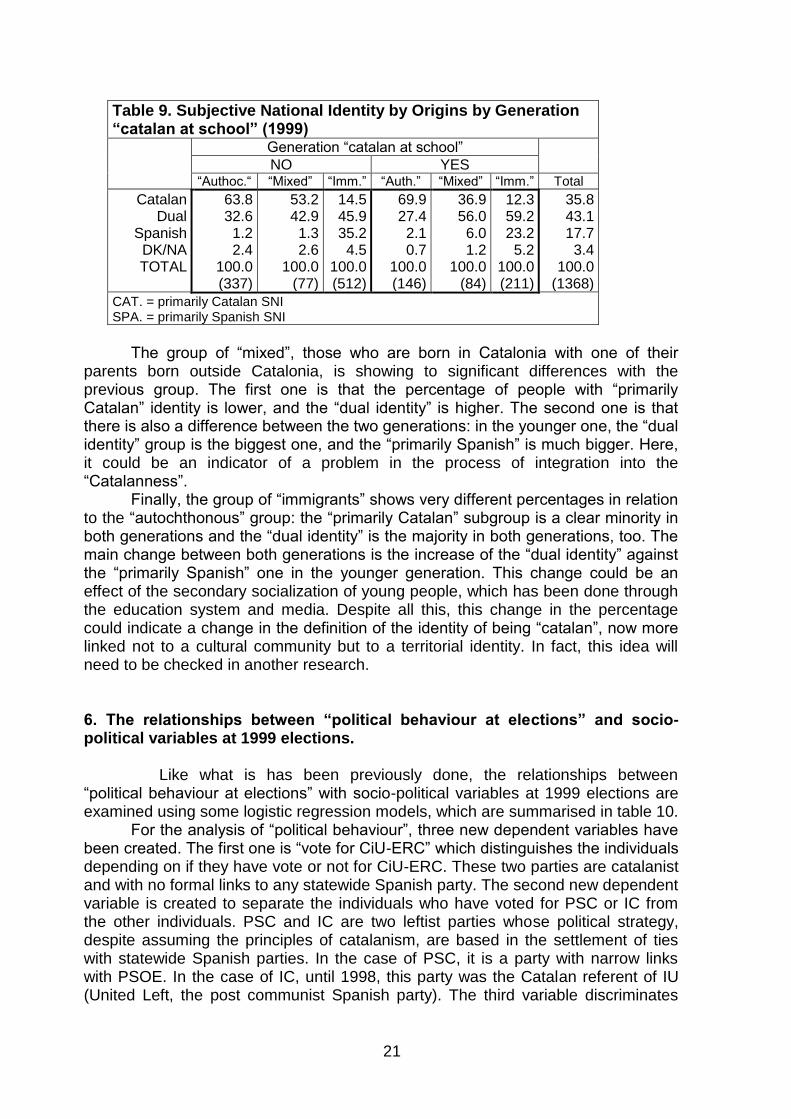
The variable “political option” needs to be considered in a more detailed way. CiU or ERC's voters tend to feel “primarily catalan”; and PP's voters tend to feel “primarily Spanish”. The other political options present values, which agree with previous ideas, but these indexes, are not statistically significant enough. For instance, it is the case of PSC’s voters, who are less like to feel “primarily catalan” and more like to feel “primarily Spanish”. Among other variables, it is interesting to comment the values shown by the variable “Generation Catalan at school”. Those who belong to this generation are less likely to feel “primarily Catalan” than those who do not belong to this generation are. The situation under this value is as follows: this generation is characterized by the relative high presence of “dual identity” and the relative high presence of “immigrants” (in this case they are, mainly, sons/daughters of people who arrived to Catalonia in the sixties and seventies). The peculiarities of this generation have one effect among this group there are a lot of “dual identities”. However, this situation should to be completed with the values of “age group related to primarily Spanish national identity”. As it can be seen in table 8, these values mean that the younger generations are less likely to feel “primarily Spanish” than the older ones. In fact, these feelings show a progressive increasing of “Catalanness” through “dualisation” among new generations, which origins are in the immigration to Catalonia. Despite with this analysis it is impossible to find definitive evidences, the obtained data tend to point that a new conception of the catalan identity could be building in the nineties, i.e., a lot of people whose origins are outside Catalonia begin to feel catalan without denying/avoiding to be qualified as “Spaniards”. The fact they are living, meanwhile, with other people who consider themselves primarily Catalans contributes to the global strength of the sense of “Catalanness” in Catalonia, in contrast to the “Spanishness”. Nevertheless, it is important to stress that there is a small group in the young generation, whose origins are in the immigration, which is composed by individuals who are feeling primarily Spanish. Meanwhile, the two opposite groups (“primarily catalan” and “primarily Spanish”) are separated by a big group of those who claim a “dual identity”. This last group is acting as a sort of a mattress, which is avoiding an open conflict among the other groups23. Its evolution in the future, it is still an open question. In table 9, there is the cross tabulation of three variables (SNI, “origins” and “generation”) with the purpose to show how different are the groups involved. The “autochthonous” group presents, in both generations, a higher percentage of people feeling “primarily Catalan” and there is a very little minority who feels “primarily Spanish”. Further, in the young generation, the subgroup “primarily Catalan” has risen to almost 70% of the “autochthonous” group.
23
Until nowadays, the conflict between people belonging to these two groups has been very low, almost anecdotic. Nevertheless, there are sometimes some minor confrontations in schools or caused by differences in football teams preferences (for instance, FC Barcelona vs. Real Madrid, the first one “representing” Catalonia, the second “representing” Spain).
21
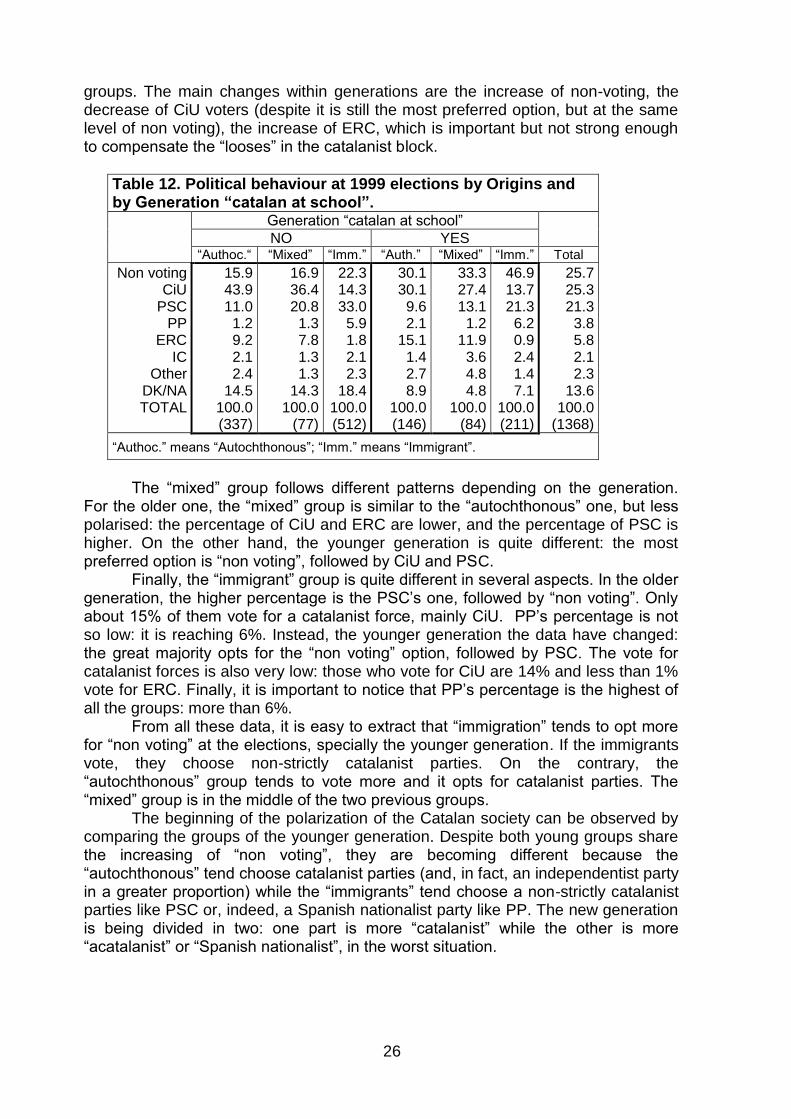
Table 9. Subjective National Identity by Origins by Generation “catalan at school” (1999)
Generation “catalan at school”
NO YES
“Authoc.“ “Mixed” “Imm.” “Auth.” “Mixed” “Imm.” Total
Catalan Dual
Spanish DK/NA TOTAL
63.8 32.6 1.2 2.4
100.0 (337)
53.2 42.9 1.3 2.6
100.0 (77)
14.5 45.9 35.2 4.5
100.0 (512)
69.9 27.4 2.1 0.7
100.0 (146)
36.9 56.0 6.0 1.2
100.0 (84)
12.3 59.2 23.2 5.2
100.0 (211)
35.8 43.1 17.7 3.4
100.0 (1368)
CAT. = primarily Catalan SNI SPA. = primarily Spanish SNI
The group of “mixed”, those who are born in Catalonia with one of their parents born outside Catalonia, is showing to significant differences with the previous group. The first one is that the percentage of people with “primarily Catalan” identity is lower, and the “dual identity” is higher. The second one is that there is also a difference between the two generations: in the younger one, the “dual identity” group is the biggest one, and the “primarily Spanish” is much bigger. Here, it could be an indicator of a problem in the process of integration into the “Catalanness”. Finally, the group of “immigrants” shows very different percentages in relation to the “autochthonous” group: the “primarily Catalan” subgroup is a clear minority in both generations and the “dual identity” is the majority in both generations, too. The main change between both generations is the increase of the “dual identity” against the “primarily Spanish” one in the younger generation. This change could be an effect of the secondary socialization of young people, which has been done through the education system and media. Despite all this, this change in the percentage could indicate a change in the definition of the identity of being “catalan”, now more linked not to a cultural community but to a territorial identity. In fact, this idea will need to be checked in another research. 6. The relationships between “political behaviour at elections” and socio-political variables at 1999 elections. Like what is has been previously done, the relationships between “political behaviour at elections” with socio-political variables at 1999 elections are examined using some logistic regression models, which are summarised in table 10.
For the analysis of “political behaviour”, three new dependent variables have been created. The first one is “vote for CiU-ERC” which distinguishes the individuals depending on if they have vote or not for CiU-ERC. These two parties are catalanist and with no formal links to any statewide Spanish party. The second new dependent variable is created to separate the individuals who have voted for PSC or IC from the other individuals. PSC and IC are two leftist parties whose political strategy, despite assuming the principles of catalanism, are based in the settlement of ties with statewide Spanish parties. In the case of PSC, it is a party with narrow links with PSOE. In the case of IC, until 1998, this party was the Catalan referent of IU (United Left, the post communist Spanish party). The third variable discriminates
22
two kinds of persons: those who vote against those who do not vote at these elections. The independent variables included in the analysis are the following ones: “origins”, “knowledge of catalan”, “generation Catalan at school, “group age”, “religious practice”, “self placement in left/right axis”, “education”, “activity” and, finally, SNI. After generating the three models, some comments can be done. The variables “generation Catalan at school” and “education” is not included in the model of “vote for CiU-ERC”. This is also the case for “activity” and “knowledge of catalan” for “PSC-IC”. In the model of “non-voting”, the variables “origins” and, again, “knowledge of catalan” are not included. On the contrary, there are only three variables which are in all the models: “self placement in left/right axis”, “religious practice” and SNI. The “left/right axis” variable shows relevant links with the two “vote” variables and in a way, which is not surprising. The people who place themselves in the right to centre have more propensities to vote for CiU than the leftist have. In addition, there are fewer propensities to vote for the socialist party or for the post communist party if the individual is in the right than in the left. Referring to the “religious practice”, the most significant associations are in the model of “vote for leftist parties”. The individuals who do not go church or, even, who do not believe have more propensities to vote for leftist parties than those individuals who are believers and go to church do. In the case of CiU-ERC, the tendency is the contrary of the leftist parties but it is not so clear, despite many voters of CiU are Catholics, because, in this analysis, these voters are grouped together with the voters of ERC, a leftist party with a lot of not believers and atheist among its voters. The conjunction of these two types of voters softens the indexes in this variable in relation to “vote (or not) for CiU-ERC”. The SNI shows the highest level of significance in all three models. Those individuals who feel “only Catalan” have more propensities to vote for CiU/ERC than the individuals who have an identity with more “presence of Spanishness”. On the contrary, the vote for PSC-IC is the reverse. Finally, the indexes for those who do not vote follow a similar pattern to the PSC-IC model.

23
Table 10. Logistic Regression models of political behaviour in Catalonia, 1999.
CiU-ERC Vs. other
PSC-IC Vs. other
Non voting vs. other
B S.E. B S.E. B S.E.
Constant Left/right axis (left)
Left of centre Centre
Right of centre Right
DK/NA Religious pract. (Practitioner)
Not very practitioner Not practitioner
Not believer Atheist
NA Subj. Nat. Id. (Only Spanish)
More Spanish than Catalan Equally Spanish as Catalan More Catalan than Spanish
Only Catalan DK/NA
Origins (“Autochthonous”) “Mixed”
“Immigrant” Activity (empl. in pub. sect.)
Employee in private sector Employer with employees
Employer with no employees Retired
Unemployed Student
House working Other
Catalan (spoken and written) Spoken, read Only spoken
Only understood Not understood
Education (less primary) Primary
Secondary University
Gen. “catalan at school” (no) Yes
-3.109** 0.128 0.838** 1.211** -0.544 -0.163 0.181 -0.224 -0.656* -0.823* 0.017 0.510 1.245** 2.491** 2.457** 0.408 0.103 -0.668** 0.810* 1.148* 0.713 1.364** 1.319** 0.845 0.792* 0.099 -0.410* 0.037 -1.324** -1.529 -- -- -- --
0.645
0.307 0.299 0.369 1.154 0.333
0.245 0.237 0.305 0.353 0.510
0.574 0.428 0.445 0.460 0.745
0.210 0.178
0.353 0.516 0.410 0.375 0.433 0.448 0.395 0.915
0.177 0.296 0.335 1.057
-- -- --
--
0.293 -0.800 -1.334** -2.815** -6.301 -2.097** 0.663* 0.778** 1.077** 0.598 0.250 0.344 -0.295 -1.266** -1.536** -1.119* 0.211 0.499* -- -- -- -- -- -- -- -- -- -- -- -- -0.843** -0.944** -0.521 -0.644
0.513
0.259 0.269 0.527 6.797 0.323
0.296 0.283 0.335 0.377 0.558
0.314 0.225 0.294 0.353 0.457
0.270 0.200
-- -- -- -- -- -- -- --
-- -- -- --
0.307 0.358 0.360
0.177
-1.553 -0.010 -0.049 0.013 -0.579 1.110** 0.130 0.599* 0.618* 1.146** 0.504 -0.548 -0.249 -0.902** -1.004** 0.320 -- -- 0.207 -0.736 0.125 -0.358 0.138 -0.148 0.535 0.953 -- -- -- -- -0.114 -0.574 -0.798* 1.075**
0.581
0.293 0.292 0.381 1.112 0.304
0.267 0.252 0.311 0.339 0.524
0.332 0.213 0.256 0.283 0.395
-- --
0.327 0.609 0.401 0.373 0.406 0.440 0.366 0.664
-- -- -- --
0.323 0.373 0.392
0.174
N Model chi-squared
df -2 log likelihood
Overall correct % step 0 Overall correct % model
1348 415.651
29 1255.233
68.9 78.0
1348 284.062
21 1191.146
76.3 79.4
1348 204.716
27 1326.527
74.5 76.2
Variables no included in the model
Gen. “catalan”, education
Knowledge of catalan, activity
Knowledge of catalan, origins
**sig. 0.01 *sig. 0.05
For the rest of variables, it can be underline the following ideas. The data of the variable “origins” confirm there is a link between the origins of the voters and

24
the preferred political option: “immigrants” would tend to vote less for CiU-ERC than the “autochthonous” and, in a lesser degree, “immigrants” would tend to vote more for PSC-IC, than “autochthonous”. The “knowledge of catalan” helps to explain the propensity of vote for CiU-ERC, but not for PSC-IC, or the “non-voting option”. Finally, it seems to be interesting to stress that if the individual belongs to the “Generation catalan at school” has a significant propensity to not vote at the elections. This fact is showing one of the important problems in Catalan politics: the high level of non-voting among the youth at Catalan elections, specially those whose origins are in the immigration. In order to complete to previous ideas, it would be interesting to take into account the data provided in table 11, which allow to realise how different the three groups are24, depending on several variables. With the only comparison between the distribution of the overall sample among the four columns and the distributions of each value of each variable, it is possible to find how is one option over or sub represented:
1) The “non voting” is the most preferred option among the youngest generations, specially the 18-24 group.
2) More than 50% of autochthonous declare that they voted for CiU or ERC at 1999 elections, while only 12,4% of them vote for PSC or IC. On the other hand, the majority of “immigrants” voted for PSC or IC (31,8%) or did not vote (29,5%). Only a minority opted for CiU or ERC (15,6%).
3) The data of “education” show that among those with more studies, the most preferred option is CiU-ERC, while PSC is the most preferred among those with a low level of education.
4) In the case of “generation catalan at school”, it is important to underline that the percentage of non voting is very high, while the vote for CiU-ERC is similar to the overall sample and the vote for PSC-IC is much lower. The political consequences of this situation are relevant: the catalanist parties have more support among voters but not among electorate. The differential of voting depending of age could be a problem. Nevertheless, it is still too early to know if there is a question of age or generation.
5) The relationship between “knowledge of catalan” and “political option” has the same structure like the “origins” variable: when the “knowledge of catalan” is higher, the vote for CiU-ERC is higher; and when the “knowledge of catalan” is lower, the vote for PSC-IC is higher.
6) In the case of “religious practice”, the association between its values and vote is quite clear, despite “religion” is not the question which divided the catalan society 50 years ago, when a lot of the leftist people not only were “not believers” but keep strong antichurch feelings, and when the conservative people were militant Catholics.
7) The distribution of the several groups within “left/right axis” is coherent with the ideology of political forces. Nevertheless, it must to be pointed out that the high percentage of leftists who vote for CiU-ERC are due to the presence of ERC in such category.
8) Finally, the distribution of the values of the variable “activity” among the four columns shows, once more, the parties have become a sort of catch-all parties which get votes from very different social classes, but, also, it shows the difficulties in using the statement of job/profession in a survey. Despite all, there are some trends, which can be underlined: the employees in public
24
In table 11, a forth column for the Popular Party has been added. The row percentages do not sum 100 because “other” has been excluded.
25
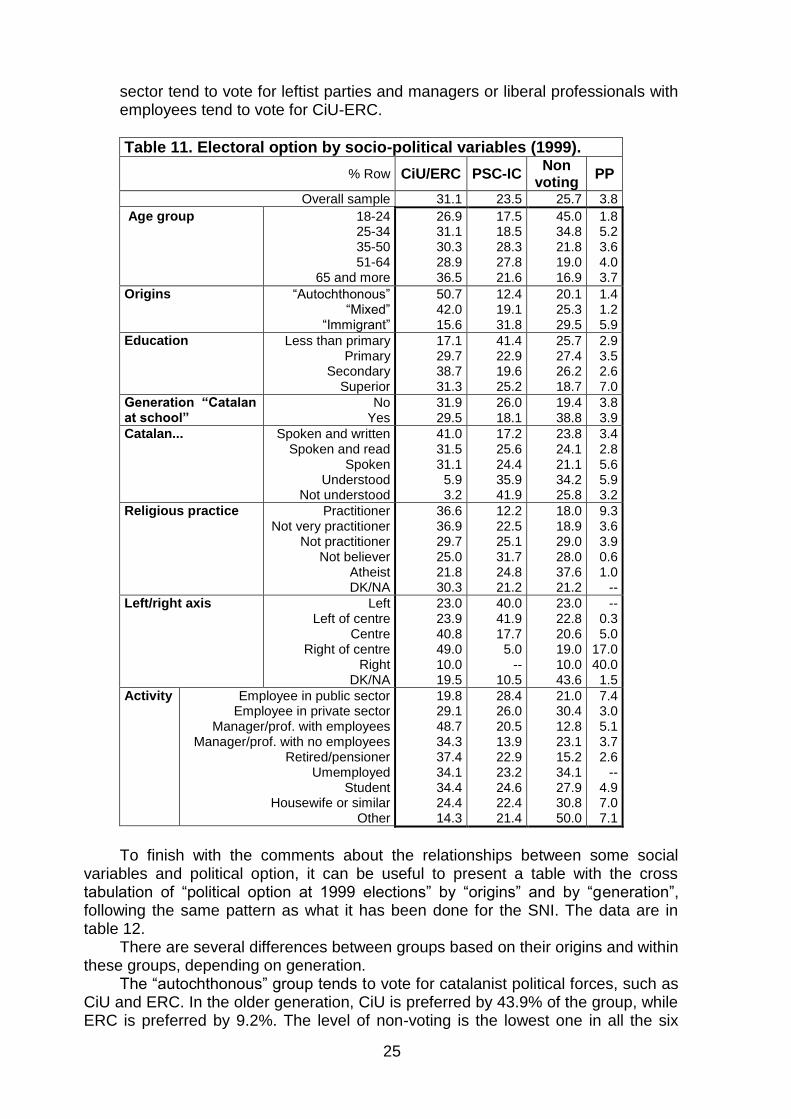
sector tend to vote for leftist parties and managers or liberal professionals with employees tend to vote for CiU-ERC.
Table 11. Electoral option by socio-political variables (1999).
% Row CiU/ERC PSC-IC Non
voting PP
Overall sample 31.1 23.5 25.7 3.8
Age group
18-24 25-34 35-50 51-64
65 and more
26.9 31.1 30.3 28.9 36.5
17.5 18.5 28.3 27.8 21.6
45.0 34.8 21.8 19.0 16.9
1.8 5.2 3.6 4.0 3.7
Origins
“Autochthonous” “Mixed”
“Immigrant”
50.7 42.0 15.6
12.4 19.1 31.8
20.1 25.3 29.5
1.4 1.2 5.9
Education
Less than primary Primary
Secondary Superior
17.1 29.7 38.7 31.3
41.4 22.9 19.6 25.2
25.7 27.4 26.2 18.7
2.9 3.5 2.6 7.0
Generation “Catalan at school”
No Yes
31.9 29.5
26.0 18.1
19.4 38.8
3.8 3.9
Catalan...
Spoken and written Spoken and read
Spoken Understood
Not understood
41.0 31.5 31.1 5.9 3.2
17.2 25.6 24.4 35.9 41.9
23.8 24.1 21.1 34.2 25.8
3.4 2.8 5.6 5.9 3.2
Religious practice
Practitioner Not very practitioner
Not practitioner Not believer
Atheist DK/NA
36.6 36.9 29.7 25.0 21.8 30.3
12.2 22.5 25.1 31.7 24.8 21.2
18.0 18.9 29.0 28.0 37.6 21.2
9.3 3.6 3.9 0.6 1.0
--
Left/right axis
Left Left of centre
Centre Right of centre
Right DK/NA
23.0 23.9 40.8 49.0 10.0 19.5
40.0 41.9 17.7 5.0
-- 10.5
23.0 22.8 20.6 19.0 10.0 43.6
-- 0.3 5.0
17.0 40.0 1.5
Activity
Employee in public sector Employee in private sector
Manager/prof. with employees Manager/prof. with no employees
Retired/pensioner Umemployed
Student Housewife or similar
Other
19.8 29.1 48.7 34.3 37.4 34.1 34.4 24.4 14.3
28.4 26.0 20.5 13.9 22.9 23.2 24.6 22.4 21.4
21.0 30.4 12.8 23.1 15.2 34.1 27.9 30.8 50.0
7.4 3.0 5.1 3.7 2.6
-- 4.9 7.0 7.1
To finish with the comments about the relationships between some social variables and political option, it can be useful to present a table with the cross tabulation of “political option at 1999 elections” by “origins” and by “generation”, following the same pattern as what it has been done for the SNI. The data are in table 12. There are several differences between groups based on their origins and within these groups, depending on generation. The “autochthonous” group tends to vote for catalanist political forces, such as CiU and ERC. In the older generation, CiU is preferred by 43.9% of the group, while ERC is preferred by 9.2%. The level of non-voting is the lowest one in all the six
26
groups. The main changes within generations are the increase of non-voting, the decrease of CiU voters (despite it is still the most preferred option, but at the same level of non voting), the increase of ERC, which is important but not strong enough to compensate the “looses” in the catalanist block.
Table 12. Political behaviour at 1999 elections by Origins and by Generation “catalan at school”.
Generation “catalan at school”
NO YES
“Authoc.“ “Mixed” “Imm.” “Auth.” “Mixed” “Imm.” Total
Non voting CiU
PSC PP
ERC IC
Other DK/NA TOTAL
15.9 43.9 11.0 1.2 9.2 2.1 2.4
14.5 100.0 (337)
16.9 36.4 20.8 1.3 7.8 1.3 1.3
14.3 100.0
(77)
22.3 14.3 33.0 5.9 1.8 2.1 2.3
18.4 100.0 (512)
30.1 30.1 9.6 2.1
15.1 1.4 2.7 8.9
100.0 (146)
33.3 27.4 13.1 1.2
11.9 3.6 4.8 4.8
100.0 (84)
46.9 13.7 21.3 6.2 0.9 2.4 1.4 7.1
100.0 (211)
25.7 25.3 21.3 3.8 5.8 2.1 2.3
13.6 100.0
(1368)
“Authoc.” means “Autochthonous”; “Imm.” means “Immigrant”.
The “mixed” group follows different patterns depending on the generation. For the older one, the “mixed” group is similar to the “autochthonous” one, but less polarised: the percentage of CiU and ERC are lower, and the percentage of PSC is higher. On the other hand, the younger generation is quite different: the most preferred option is “non voting”, followed by CiU and PSC. Finally, the “immigrant” group is quite different in several aspects. In the older generation, the higher percentage is the PSC’s one, followed by “non voting”. Only about 15% of them vote for a catalanist force, mainly CiU. PP’s percentage is not so low: it is reaching 6%. Instead, the younger generation the data have changed: the great majority opts for the “non voting” option, followed by PSC. The vote for catalanist forces is also very low: those who vote for CiU are 14% and less than 1% vote for ERC. Finally, it is important to notice that PP’s percentage is the highest of all the groups: more than 6%. From all these data, it is easy to extract that “immigration” tends to opt more for “non voting” at the elections, specially the younger generation. If the immigrants vote, they choose non-strictly catalanist parties. On the contrary, the “autochthonous” group tends to vote more and it opts for catalanist parties. The “mixed” group is in the middle of the two previous groups. The beginning of the polarization of the Catalan society can be observed by comparing the groups of the younger generation. Despite both young groups share the increasing of “non voting”, they are becoming different because the “autochthonous” tend choose catalanist parties (and, in fact, an independentist party in a greater proportion) while the “immigrants” tend choose a non-strictly catalanist parties like PSC or, indeed, a Spanish nationalist party like PP. The new generation is being divided in two: one part is more “catalanist” while the other is more “acatalanist” or “Spanish nationalist”, in the worst situation.

27
7. Conclusions. To present the conclusions of this case study, some ideas must be outlined. Despite the Catalans have not achieved to build its own independent state, and they have had to resist a lot of assimilation policies done by the Spanish governments, the feeling of catalan nationhood is quite spread among population. This feeling of being a differentiate people (based on language and the remembrance of the lost institutions) was used in politics for the mobilization the catalan population to face how the Spanish state was being built, since the beginnings of 19th. By the end of this century, the catalanism (or catalan nationalism) had its theoretical foundations and it was present in almost all the Catalan political forces. From 1901, all the parties, which have won the elections in Catalonia, participate in any kind of catalanism, sometimes more leftist, sometimes more conservative.
The mainstream of the catalanism has not been separatist, but it always had a project for all the Spanish state based on its transformation into a plurinational state, which would be truly respectful of the Catalan identity. For this reason and from the catalanist point of view, the Catalan identity and the Spanish identity have not always been incompatible: “catalan” was a way of being “Spanish”. In addition, the catalanism has had an integrative approach towards the immigration through the learning of Catalan language as the way to become “catalan”. As the result of the history, the Catalan population is mixed with different subjective national identities, combining different proportions of “Catalanness” or “Spanishness”.
The recovery of the autonomy has changed part of the environment which influences the individuals’ process of socialization (school, mass media, political institutions, etc), in a sense that there has been a global increasing of the Catalan identity. In the Catalan case, the subjective national identity is linked to the person’s origins and the knowledge of Catalan. The people whose origins are in Catalonia tends to feel more Catalan than Spanish does, and on the contrary, the people whose origins are outside Catalonia tends to feel less Catalan than the others. The knowledge of Catalan, also itself with strong relationships with the origins of each speaker, is in connexion with the subjective national identity. Because the relative success of the linguistic policy of recovering the public presence of catalan, the knowledge of catalan is improving among population (specially, among young generations) and this variable is loosing its utility as a predictor of national identity.
Further, the subjective national identity has an important influence on the political option at the elections. Those whose subjective national identity is primarily Catalan tend to vote more for catalanist parties; and those whose subjective national identity is primarily Spanish tend not to vote or to vote for statewide parties, such as PSC or PP.
Finally, it is easy to accept that the distribution of national identities in a political community like Catalonia is important to foresee how the results at the elections will be and, therefore, who will be in power. All the political actors are using their tools to modify this distribution: the catalanist are fostering the Catalan identity through the increasing of the use of the Catalan language everywhere, while the Spanish nationalists are opposing to such policies. In this framework, it is easier to understand why the catalanists and the Spanish nationalists are worried by the future use of the Catalan language in Catalonia. If the catalan speakers are more, there are more probabilities that the catalanists would be more, and the demands to change the Spanish institutions will be greater: more people will want to transform the kingdom of Spain in a real plurinational state. Nevertheless, if the number of
28
Catalan speakers decreases, and if there is no change in the foundations of the Catalan identity, the Spanish state will be closer to become a true nation-state, based on only one nation and one language. Bibliography. Ajenjo, M.; Blanes, A. (1999): ‘La població de Catalunya’, in J. Sànchez (coord.) Informe
per a la Catalunya del 2000. Fundació Jaume Bofill. Barcelona: Mediterrània. Albareda, J. (2000): La guerra de Successió i l’Onze de Setembre. Barcelona: Empúries. Albertí, E. and others (1992): Manual de Dret Públic de Catalunya. Institut d’Estudis
Autonòmics. Barcelona: Generalitat de Catalunya. Anguera, P. (2000): Els precedents del catalanisme. Catalanitat i anticentralisme: 1808-
1868. Barcelona: Empúries. Argelaguet, J. (1998): El procés d’elaboració de la Llei de Política Lingüística. Barcelona:
Mediterrània. Argelaguet, J. (2001): ‘La política lingüística de la Generalitat: l’acció pública per a
l’extensió del coneixement i l’ús del català’, in R. Gomà and J. Subirats (eds.) Govern i polítiques públiques a Catalunya (1980-2000). Autonomia i benestar. Barcelona: Universitat de Barcelona and Univesitat Autònoma de Barcelona.
Balcells, A. (1992): Història del nacionalisme català. Dels orígens al nostre temps.
Barcelona: Generalitat de Catalunya. Benet, J. (1995): L’intent franquista de genocidi cultural contra Catalunya. Montserrat:
Abadia de Montserrat. Cabana, F. (2000): 37 anys de franquisme. Una visió econòmica. Barcelona: Pòrtic. Caminal, M. (1998): Nacionalisme i partits nacionals a Catalunya. Barcelona: Empúries. Caminal, M.; Matas, J. (eds.) (1998): El sistema polític de Catalunya. Barcelona: Tecnos
and Universitat Autònoma de Barcelona. Colomer, J.M. (1984): Espanyolisme i catalanisme. La idea de nació en el pensament
polític català (1939-1979). Barcelona: L’Avenç. ESE (‘Equip de Sociologia Electoral’, UAB) (1981): Atlas electoral de Catalunya, 1976-
1980. Estudis Electorals 3, Barcelona: Fundació Bofill. ESE (‘Equip de Sociologia Electoral’, UAB) (1990): Atlas electoral de Catalunya, 1982-
1988. Estudis electorals 9, Barcelona: Fundació Bofill. Font, J. and others (1998): L’abstenció en les eleccions al Parlament de Catalunya.
Barcelona: Mediterrània. Fossas, E.; Colomé, G. (1993): Political parties and institutions in Catalonia. Barcelona:
Institut de Ciències Polítiques i Socials.
29
Keating, M. (1996): Naciones contra el Estado. El nacionalismo de Cataluña, Quebec y Escocia. Barcelona: Ariel.
Llobera, J.R. (1996): El dios de la modernidad. El desarrollo del nacionalismo en Europa
occidental. Barcelona: Anagrama. Marcet, J.; Argelaguet, J. (1998): ‘Nationalist parties in Catalonia’, in L. de Winter and H.
Türsan, Regionalist parties in Western Europe. London: Routledge. Molas, I. (dir.) (2000): Diccionari dels Partits Polítics de Catalunya. Segle XX. Barcelona:
Enciclopèdia Catalana. Molinero, C.; Ysàs, P. (1999): Catalunya durant el franquisme. Barcelona: Empúries. Pallarès, F.; Font, J. (1994): ‘Las elecciones autonómicas en Cataluña (1980-1992)’, in P.
del Castillo (ed.) Comportamiento político y electoral, Madrid: Centro de Investigaciones Sociológicas.
Pallarés, F.; Soler, J.; Font, J. (1996): ‘The autonomous elections of November 1995 in
Catalonia’, Regional and Federal Studies 6, 3: 74-80. Riba, C. (2000): ‘Voto dual y abstención electoral. Un estudio sobre el comportamiento
electoral en Cataluña’, Revista Española de Investigaciones Sociológicas, 91, 59-88. Riquer, B. (2000): Identitats contemporànies: Catalunya i Espanya. Barcelona: Eumo. Risques, M. (dir.): Història de la Catalunya contemporània. Barcelona: Pòrtic. Solé i Sabaté, J.M.; Villarroya, J. (1993): Cronologia de la repressió de la llengua i la cultura
catalanes. Barcelona: Curial. Termes, J. (1999): Les arrels populars del catalanisme. Barcelona: Empúries. Termes, J. (2000): Història del catalanisme fins al 1923. Barcelona: Pòrtic. Termes, J.; Colomines, A. (1992): Les bases de Manresa i els orígens del catalanisme.
Barcelona: Generalitat de Catalunya. Webber, J.; Strubell i Trueta, M. (1991): The catalan language. Progress towards
normalisation. Anglo-catalan Society. Sheffield: Sheffield Academic Press Ltd. Woolard, K. (1992): Identitat i contactes de llengües a Barcelona. Barcelona: La Magrana.