the success and failure of product development … · the success and failure of product...
TRANSCRIPT

THE SUCCESS AND FAILURE OF
PRODUCT DEVELOPMENT IN THE
DANISH FOOD SECTOR
Working paper no 48
December 1997
CENTER FOR MARKEDSOVERVÅGNING, -VURDERING OG -BEARBEJDNING TIL FØDEVARESEKTOREN * ÅRHUS
CENTRE FOR MARKET SURVEILLANCE, RESEARCH AND STRATEGY FOR THE FOOD SECTOR * AARHUS * DENMARK

THE SUCCESS AND FAILURE OF
PRODUCT DEVELOPMENT IN THE
DANISH FOOD SECTOR
Kai KristensenPeder Østergaard
Hans Jørn JuhlThe Aarhus School of Business


EXECUTIVE SUMMARY
1. Quality, as a strategic instrument in overall management of companies, is oneof the decisive elements in the competitiveness of companies, and methodologiesin the area of TQM are seen as leading means in helping business solve currentproblems, but even more important in anticipating future changes and need fornew products. A key factor in quality is customer information and ability to usesuch information.
2. Defining and doing quantitative survey of success in product development isa difficult task. It is generally agreed that the measurement of success in prod-uct development should include factors such as: market share, sales objectives,profit objectives, technical aspects, impact on the company and company repu-tation and timing of the product development process. The main aim of thesurvey is to analyse the relationship between success in product developmentand the ability to collect, process and translate customer information into theproduct development processes.
3. As a preliminary step the population was defined as Danish food processingcompanies with 20 or more employees (N=300). Next, qualitative surveys ineight companies were carried out in order to find the central issues and ques-tions to be investigated in a quantitative survey. 121 Danish food processingcompanies were contacted, and 55 companies agreed to participate. The personresponsible for the product or the marketing manager in the individual com-pany filled in a questionnaire during a meeting at the company. This procedurewas used to ensure a high validity of the answers given to the questions in thequestionnaire.
4.The main aim of this paper is to demonstrate mathematically, graphically andempirically how success rates of new products and launching rates of prototypesmay depend on learning. Learning is assumed to have a positive impact on thequality of prototypes being developed by the individual company, and themathematical derivations in this paper show that there is reason to believe thatthere is a linear relationship between the launching rate and the success rate.
5. The empirical results concerning applied success criteria of new products inDanish food processing companies show that increase in market share andincrease in earning capability are the most dominant criteria, and criteria suchas reputation and technological advantages have a much lower priority, but ingeneral the companies use several success criteria for new products. A prelimi-nary analysis of the relationship between success rate of new products andlaunching rates shows a significant linear dependency.
6. More detailed analyses of the success rate of new products are based on aregression model. In this model, the launching rate together with several otherthird variables, considered to be important in analysing the success rates, areused as explanatory variables. The final model shows a significant lineardependency between the success rate and the launching rate. The model alsoshows that eight other variables explain the success rate of a new product. Theeight other significant variables (third variables) are: company perception of theconcept: a new product, use of trade fairs in launching new products, production

methods sensitive to variation in the quality of raw materials, top-managementparticipation in the product development stage, use of customer complaints, useof qualitative market research, constant exchange of sales information fromcustomers in order to assess future demand, and finally the usage of buyingfrequency analyses in order to assess the likelihood of success of a new product.
Introduction 1
1. Aims of the study 1
2. Methodology and data collection 2
2.1 Qualitative study 2
2.2 The quantitative survey 3
2.3 Sampling frame, sample and response rate 4
3.Aim of the analysis 6
3.1 Theoretical and mathematical considerations on the relationship
between success rates of new products and the launching rate of prototypes 6
3.2 A graphic illustration of the effect of learning and the quality of
products launched 8
4. Empirical results 9
4.1 Analysis of success criteria 10
4.2 Launching rate and success 11
5. A model of new product success 11
Conclusion 14
References 15


INTRODUCTION
In February 1995 the European Commission, DGIII, Industry issued a workingdocument A European Quality Promotion Policy. In this document they launchthe following view on quality:
Quality, as a strategic instrument in the overall management of companies, is iden-tified today as one of the decisive elements in the competitiveness of companies.
The document continues by concluding that:
The use of the new methodologies of total quality management is for the leaders of theEuropean companies a leading means to help them in the current economic scenario,w h i ch involves not only dealing with ch a n g e s, but especially anticipating them.
This view on quality is very interesting and very important. According to theCommission, quality is a question of creating a system of early warning in thecompany. This means that building quality into the product and consequentlyqualified product development becomes one of the most important aspects ofmodern management if companies want to stay in business. The future successof companies will increasingly become a question of their ability to handle theprocess of product development. It therefore becomes more and more importantfor researchers to study the causes of success and failure of productdevelopment.
At the moment there is considerable pressure on Western companies from theEast. The average time that for instance Japanese companies have for market-ing is much shorter than Western companies have (Clark, 1989). A previousstudy by Kristensen, Dahlgaard and Kanji (1995) concludes that considerabledifferences can be observed between the East and the West when it comes to theorganization of product development:
1) Sophisticated techniques to analyse market data are used far more in theEast than in the West
2) Much more use of structured techniques like QFD in the East
3) Far more top management participation in the process in the East
The above study was not tailor-made neither for product development nor forthe food sector. We therefore decided to analyse in more detail the situation ofproduct development in food companies in order to uncover some of the causesof success or failure of product development within this particular sector.
1. AIMS OF THE STUDY
Defining success in product development is very difficult. M u ch literature, e gCooper (1994), Constantineau (1992) and Brown and Eisenhardt (1995),addresses the subject. It is generally argued that measurement of success inproduct development should include factors such as: market share, s a l e so b j e c t i v e s, profit objectives, t e chnical aspects, impact on the company, impact on
1

company reputation and timing of the processes from the initial stages ofdevelopment to launching of the new product on the market.
The main aim of this study is to analyse the relationship between success inproduct development and the abilities to collect,process and translate costumerinformation into the product development processes. However, it is important tocontrol the many factors that may influence the relationship such as:
• Market form (export/home markets, number of competitors)
• Marketing (activities and methods used to promote new products)
• Economic abilities (financial situation of the company, investment in R&D)
• General competence (logistics, quality management, partnership, educa-tional level in the company, production equipment)
• Internal organization of the stages in the product development processes(cross-functional involvement of departments and management andexternal involvement)
Apart from these factors, it is also important to include characteristics of theproducts being produced and sold by the companies, but in a study of foodproducing companies it is difficult and costly to include customer perceptions ofthe product characteristics because of the many different products and markets.
2. METHODOLOGY AND DATA COLLECTION
At an early stage it was decided that a survey should be carried out amongDanish food processing companies with 20 or more employees. Databaseresearch revealed that the target population included about 300 companies witha number of employees ranging from 20 to approximately 6000 employees.
2.1 Qualitative study
In order to prepare the design of a quantitative survey, qualitative interviewswere carried out in eight companies.
In the selection of the eight companies the intention was to find as high a degreeof heterogeneity as possible in terms of size of company, types of products beingproduced and types of markets etc. The underlying assumption was that a greatheterogeneity in the qualitative survey might reveal a variety of different waysof undertaking product development and launching products onto the market,which could give inspiration to the design of the quantitative survey.
The qualitative study was based on personal interviews with either personsresponsible for product development or the marketing manager, and the inter-views took place in the company.
The interviews revealed a number of different ways of doing product develop-ment,introducing and launching products onto the markets, definitions of what
2

the companies perceived as “a new product” and an insight into the successcriteria applied by the companies.
The more general conclusions reached from the qualitative study were:
• the collection of information from end-users of the product was limited
• the level of application of more advanced statistical techniques was generallyvery low
• the inspiration for developing new products or/and demand for new productsoften came from the purchasers in chain stores, with whom the companiesoften discussed new product proposals
• companies often found that in developing a new product, the new producthad to meet certain price/cost demands from purchasers
• some companies found no difficulty in developing new high quality products,but launching and marketing such products often were very difficult, be-cause of the required higher prices for such products
• smaller companies producing highly technological products often found itdifficult to start manufacturing new products because of the huge invest-ments in new production equipment required
• smaller companies generally tried to modify existing products, although theywere very vulnerable to competition from larger domestic or foreign companies.
Some of these findings were anticipated and in good accordance with resultsobtained by Harmsen (1996).
2.2 The quantitative survey
Based on the qualitative study and a review of the literature, a questionnaire wa sd e v e l o p e d , w h i ch ended up being of a length of 18 pages containing 38 questions.
The size of the questionnaire and the sensitivity of the issue gave no reason tobelieve that it would be possible to obtain a reasonably high response rate if apostal survey was carried out.
Therefore the survey was done in the following way.
A sample of 121 companies was drawn from a database of Danish companies.We ensured that the sample gave a picture of companies in the population interms of size of companies as valid as possible. We also tried to ensure that thesample was representative in terms of main production activities. However, theindustrial codes of the companies gave some problems, because many companieshad several codes referring to different parts and activities of the food manu-facturing industry, and some companies even had activities not directly relatedto the food industry. This made it difficult to obtain a full representation of mainactivities in the food processing companies.
3

The persons responsible for product development in the selected companieswere contacted by telephone and asked whether they and their companies werewilling to participate in the survey. If the company had no product developmentmanager, we contacted either the marketing manager or the managing director.If the key person agreed to participate, a meeting in the company was scheduledwith the purpose to fill in the questionnaire.
Questionnaires were filled in in the following way. During the meeting at thec o m p a n y, the respondent had a copy of the questionnaire in front of him so thathe could read the questions as we went along, and he was able to ask questionsregarding the content of the individual questions and make supplementary com-ments to the questions and answers given. The person responsible for the inter-view filled in the answers and comments on a similar questionnaire. This pro-cedure is expected to produce answers of high validity and few missing values.
2.3 Sampling frame, sample and response rate
55 of the selected 121 companies agreed to participate. Table 1 shows the basicstatistics for the sampling frame, the number of responses and response ratesas a function of the size of the company.
Note: response rate is calculated by comparing the number of employees mentionedduring the interviews with the figures from the sample drawn from the database.
Comparing the number of employees according to the database and the informa-tion on the number of employees found during the interviews, it was discoveredthat some differences existed between the actual number of employees in the com-panies and the figures in the database, especially among the smaller companies.
We found that according to the database a substantial number of the companiesparticipating were listed as having between 20 and 49 employees, but actuallyhad 50-99 employees, while a number of companies listed as having around 100employees had less than 100 employees. This is partly the explanation for thehigh response of companies in the group 50-99 employees. In the remaininggroups there was good correspondence between the database information andthe actual figures.
4
Table 1. Sampling statistics as a function of size of the company
Number of employees Sampling frame Selected Response
(response rate)
20-49 121 46 14 (30%)
50-99 54 22 16 (73%)
100-199 51 23 9 (38%)
200-499 31 16 8 (50%)
500-999 17 9 4 (44%)
1000+ 11 5 4 (80%)
Total 291 121 55 (45%)

Despite these inaccuracies, it is fair to conclude that the response rate is signi-ficantly lower in the group of companies with less than 50 employees. The majorreason for this low response rate is that many companies of that size during thetelephone prenotification indicated that they did not have any product develop-ment activities at all, and therefore did not have any reason to participate in aninterview concerning product development. Another reason mentioned by thecompanies was that product development took place in departments or compa-nies outside Denmark.
22 (33%) of the 66 not participating companies had no product developmentactivities at all, 19 (29%) claimed they did not have the time necessary to parti-cipate, 18 (27%) companies simply refused to participate and finally 7 (11%)companies had either been sold to other companies or had been closed.
Main production activity of the company has been another factor of special inter-est in the survey. Table 2 gives basic sampling statistics concerning this factor.
Note: response rate is calculated on the basis of information from the database.
*companies having grocery as main activity also have manufacturing activities withinthe foodstuff area.
There is reason to believe that the willingness to participate in the survey tosome extent depends on the main activity of the company, but the tendencies arenot that clear, especially when we consider the fact that there is a dependencybetween the main industrial activity and the number of employees. For instancecompanies in the fish industry are much smaller compared to meat manufact-uring companies.
Finally it should be emphasised that seven small companies participating in thesurvey had so few product development activities that part of the questionnairecould not be filled in by these companies.
5
Table 2. Sampling statistics, – main activity of company
Main industrial activity Sampling frame Selected Response
(response rate)
Manufacturing and processing of meat 44 18 10 (55%)
Manufacturer of dairy products 19 9 3 (33%)
Manufacturer of fish products 58 16 5 (31%)
Manufacturer of bread 13 7 6 (86%)
Manufacturer of cakes and biscuits 14 9 2 (22%)
Manufacturer of sugar and chocolate 19 7 2 (28%)
Manufacturer of beverages 19 10 3 (30%)
Manufacturer of other products 67 31 16 (52%)
*Grocery 38 14 8 (57%)
Total 291 121 55 (45%)

3. AIM OF THE ANALYSIS
This paper concentrates on formulating a model explaining the success ratedefined, as the proportion of successful launches of new products over the pastthree years. We concentrate especially on how the success rate depends onlearning abilities, measured by the proportion of prototypes being launched overthe past three years.
Because it is the company itself that evaluates the degree of success, it isobviously important first to analyse which success criteria the companies apply,when they evaluate the proportion of successful launches of new products.
S e c o n d l y, in order to isolate the effect of the learning abilities on the success rateof new products, the effects of third factors on the success rate are considered.
3.1 Theoretical and mathematical considerations on the relationshipbetween success rates of new products and the launching rate ofprototypes
The following theoretical and mathematical considerations are made:
Let: n0 = # successes
N0 = # launches
N = # prototypes
Assume that the profit can be described as:
(1)
Where ξ is the success rate, n0/N0, ϕ is the revenue function, and ψ is the costfunction.
The rationale behind ϕ is obvious and the only assumption is that revenue is anincreasing function of ξ N0.
The rationale behind the cost function is as follows:The first element states thatthere is a variable cost c in launching a product N0 and the second elementrepresents a cost that will be an increasing function of the number of proto-types, N. However, it is assumed that due to learning effects it will be a de-creasing function of the acceptance rate N0/N, since the larger the acceptancerate the smaller the waste. This means that the explanatory variable of thefunction will be:
(2)
For given N the optimum profit as a function of N0 will be given by the firstorder condition:
NN0 / N
=N2
N0
π = ϕ(ξN0) − ψ (cN0 + dN2
N0)
6

(3)
In order to obtain a simple expression let:
(4)
This means that (3) may be written as:
(5)
By a Taylor expansion around x=1 we get:
(6)
Which will provide us with a simpler representation.
To sum up, what we have found is that conditional on the description in (1) andconditional on N we expect to find the following relationship between successrate and acceptance rate:
(7)
Alternatively we may express the relationship through the first orderapproximation:
(8)
The more of the considered products a company launches, the more experiencedthe company becomes in designing products with the potential of becoming asuccess. Further empirical evidence on this relationship will be given in para-graph 4.2.
n0N0
= α0 + β0 (N0N
)
n0N0
= −β(1
N0 /N)2
ξ = f (x) = f (1) + f ' (1)(x − 1) + R= α − β + 2β(x − 1) + R
= α − 3β + 2βx + R
= α0 + β0N0N
ξ = α − β(1x
)2
ψ 'ϕ'
c = α
dψ'ϕ'
= β
N0N
= x
δπδN0
= ϕ'*ξ − ψ ' [c + d−N2
N02 ] = 0 ⇔
ϕ 'ξ = ψ 'c − ψ ' (1
N0 /N)2 ⇔
ξ = ψ'ϕ'
c − d ψ 'ϕ '
( 1N0 / N
)2
7

3.2 A graphic illustration of the effect of learning and the quality ofproducts launched
In order to give a visual insight into the relationship between success of newproducts and learning and launching rates, figure 1 provides insight:
It is assumed that the product development process in a company producesprototypes with quality attributes, which by nature are probabilistic, and forinstance may be described by a normal distribution. The quality level, Q, of anattribute of a prototype is evaluated against a minimum quality requirement, R,and in case the minimum requirement is met, the prototype is launched, other-wise the prototype is not launched.
Furthermore it is assumed that:
• Learning increases company ability to develop products with high quality:E(Q1) < E(Q2)
• V(Q1) ≈ V(Q2)
• Minimum quality requirement R = constant
• Increase in Q ⇒ Increase in success rate:
Under these assumptions, we investigate launching rates and quality levels oflaunched products.
We start by assuming that a company at a given time develops prototypes withquality level described by the stochastic variable Q1. Under this condition it ispossible to state the probability of launching as:
n0N0
8
Figure 1. Relationship between quality and learning
(9)
and it is possible to find the expected quality level of launched products as:
(10)
This expected quality level is the expected value in the tail of that part of thedistribution which is above the minimum requirement line, R, and in figure 1 itis denoted E(Q1 | LAUNCH)
Further we assume that the company learns more about how to development itsnew products, which means that the quality of the prototypes can be describedby the stochastic variable Q2. Under this new condition and assuming that R isconstant, it is possible to find the new probability of launching:
(11)
and the expected quality level of launched products becomes:
(12)
The implications of learning are:
• Higher launching rates: P(L1)<P(L2)
• Higher quality of launched products: E(Q1 | R) < E(Q2 | R)
Using the assumption that higher quality leads to higher rates of success, thefollowing conclusion can be found:
⇒ Higher rates of launching: ⇒ Higher rates of success:
Increases in the minimum quality requirement, R, and changes in the varianceof the quality of prototypes can undermine this conclusion.
4. EMPIRICAL RESULTS
We start by analyzing the success criteria that companies apply to their prod-ucts. Next,we estimate a model linking launching rates to success rates. Finally,we integrate this relationship into a more comprehensive model explaining thesuccess rate.
n0N0
N0N
E(Q2|R) =
Q2f (Q2)dQ2R
∞
∫P(L2)
P(L2) =N0,Q2
N= P(Q2 ≥ R) = f (Q2)dQ2
R
∞
∫
E(Q1|R) =
Q1f (Q1)dQ1R
∞
∫P(L1)
P(L1) =N0,Q1
N= P(Q1 ≥ R) = f (Q1)dQ1
R
∞
∫
9

4.1 Analysis of success criteria
Above it was argued that the success of product development can be measuredas n0/N0, but when asking the companies how large a proportion of the launchedproducts they considered a success, it is relevant first to investigate the import-ance of the different success criteria applied by the companies. In the question-naire, companies were asked to evaluate eight indicators of success of new prod-ucts on an importance scale ranging from 0 to 4, in which 4 is an indication ofgreat importance.
From table 3 it is clear that the two dominant success criteria relate to theeconomic performance of new products, while more soft aspects such as reputa-tion and strategic impact have less importance, which indicates that the theore-tical considerations regarding the number of successful launches and the num-ber of prototypes being launched could prove valuable in a model explaningsuccess rate by launching rates.
10
Table 3. Ranking of the importance of success criteria of new products beinglaunched
Rank Importance of success criteria Valid Mean Std.sample dev.
1 The new product can help increase the firm’s market share. ............................................. 48 3.58 0.77
2 The new product increases the firm's earning capability ................................................ 48 3.54 0.68
3 We think our customers will be pleased with the new product........................................... 48 2.75 1.16
4 The new product has lower costs than the existing products.................................................. 48 2.40 1.16
5 The new product is a success if the cost of development and the resultant investment in plants and promotion are recovered within two years................................................... 47 2.30 1.40
6 The new product can improve the firm's reputation in society ............................................ 48 1.94 1.37
7 The new product offers technological advantages............................................................ 48 1.94 1.23
8 The new product will shut up those customers who have been demanding innovation for a longtime....................................................................... 48 1.63 1.10
4.2 Launching rate and success
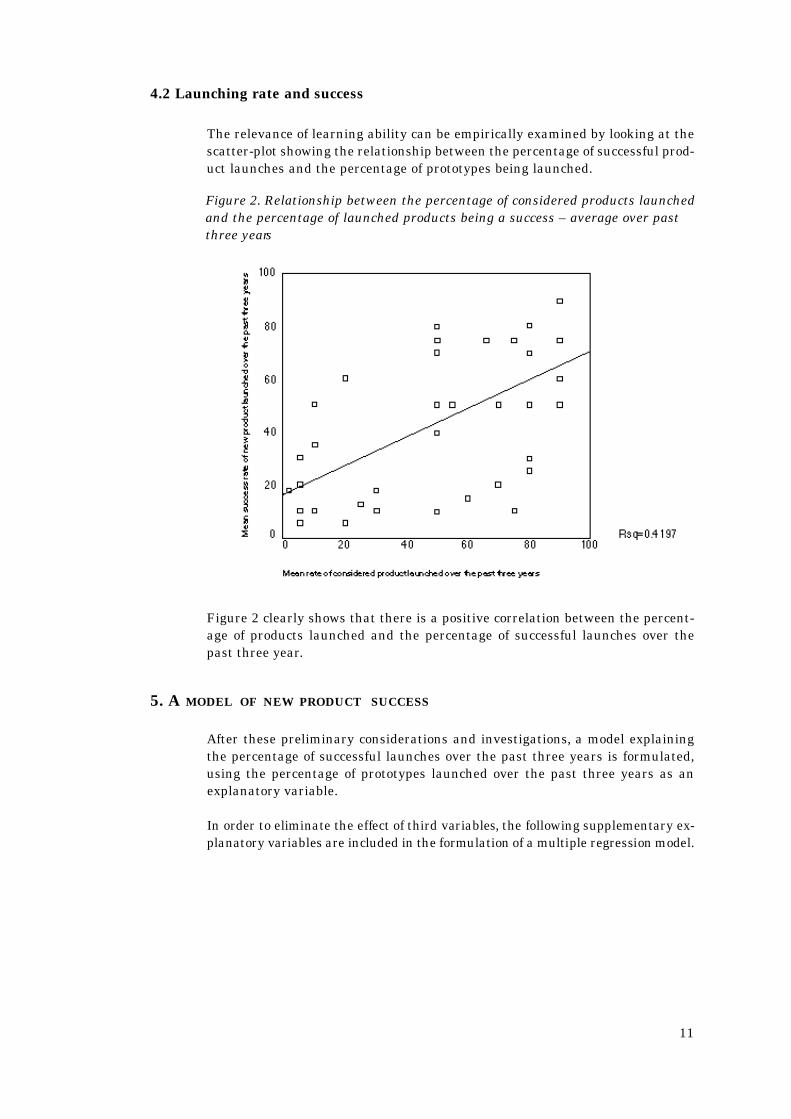
The relevance of learning ability can be empirically examined by looking at thescatter-plot showing the relationship between the percentage of successful prod-uct launches and the percentage of prototypes being launched.
Figure 2 clearly shows that there is a positive correlation between the percent-age of products launched and the percentage of successful launches over thepast three year.
5. A MODEL OF NEW PRODUCT SUCCESS
After these preliminary considerations and investigations, a model explainingthe percentage of successful launches over the past three years is formulated,using the percentage of prototypes launched over the past three years as anexplanatory variable.
In order to eliminate the effect of third variables, the following supplementary ex-planatory variables are included in the formulation of a multiple regression model.
11
Figure 2. Relationship between the percentage of considered products launchedand the percentage of launched products being a success – average over pastthree years

The dependent variable:
Y: Percentage of launched products being a success (n0/N0 *100)
Independent variables:
X1: Percentage of considered products being launched (N0/N *100)
X2: Agreement with statement: An adaption of an existing product is a newproduct(1=Fully disagree ... 5=Fully agree)
X3: Extent to which trade fairs and shows are applied to promote newproducts. (Timing of launching) (1=Never ... 4=Always)
X4: Agreement with statement: Production is very sensitive to variations inquality of primary products(1=Fully disagree ... 5= Fully agree)
X5: Top-management participation in product development at developmentstage(0=No, 1= Yes)
X6: Extent of usage of customer complaints(1=Never ... 4= At least once a month)
X7: Extent of usage of qualitative market research in product development(1=No, 2=Sometimes, 3=Yes, always)
X8: Agreement with statement: Company is constantly kept informed aboutsales by customers, and the company use this information for assessingfuture demand for company products. (1=Fully disagree ... 5=Fully agree)
X9: Extent to which analyses of buying frequency are made to access thelikelihood of success of new product. (1=Never ... 4=Always)
The estimation of the model gave the following results:
Table 4 shows that a substantial part (72,9%) of the variation in the dependentvariable has been explained.
12
Table 4. ANOVA
Model Sum of Squares df Mean Squares F Sig
Regression 23421.11 9 2602.35 10.18 0.00
Residual 8689.12 34 255.56
Total 32119.23 43
R2 = 0,729 Ra2 = 0,659

The estimation results for the model are shown in table 5.
Firstly, it is interesting to notice that the variance inflation factors (VIF) arevery close to 1, which indicates that the model is not influenced by multi-collinearity. Therefore it is possible to interpret the coefficients as individualcontributions to the success rate of new products launched, although the valueof the prediction has to be within the range of 0 to 100, which is not guaranteedby the chosen functional form. Secondly, the standardized coefficients are givenin table 5.It makes it possible to compare the relative importance of the explan-atory variables for the success rate. Thirdly, nearly all the estimated coefficientsin the final model have the expected signs. Compared to the grouping in Brownand Eisenhardt (1995), the final model includes effects of senior managementsupport and product effectiveness measured as a fit of market needs andcompany competencies.
If adaption of an existing product is an acceptable definition of a new product,it leads to a higher success rate for the company. This result is not surprising.Obviously it is easier to work in a known product group than in a completelynew area. The result shows that low-risk takers have higher successful launchrates than high-risk takers, and, together with the percentage launched, theresult reflects the importance of company experience with the different phasesof product development in order to achieve success. These two variables reflectaspects of product effectiveness in terms of fit with company competence. Thecharacter of the production equipment may also be seen as a more implicitaspect of firm competence. In our case the estimated coefficient is positive, anda possible explanation is that inflexible equipment fosters creativity.
Senior management support has been found to be a critical success factor inmany studies. The study of Gupta et al (1990) showed that managerial commit-ment in terms of personal and financial resources was the most important formof support in the new product development process and a major factor of nodelay in development. The optimal type of management involvement has beendiscussed in the literature (eg Cooper & Kleinschmidt, 1995) but it is never
13
Table 5. Estimation results
Model CoefficientStandard T-value p-value VIF
Coefficient
Constant......................................... -113.16 -4.57 0.00
X1 : % Launched ............................ 0.32 0.37 3.54 0.00 1.36
X2 : Adaption.................................. 5.25 0.24 2.32 0.03 1.37
X3 : Trade fairs............................... -8.04 -0.29 -3.09 0.00 1.08
X4 : Product sensitivity ................. 14.33 0.47 3.82 0.00 1.88
X5 : Management dev.................... 13.02 0.23 2.39 0.02 1.11
X6 : Customer complaints ............. 11.26 0.34 3.39 0.00 1.26
X7 : Qualitative M.R...................... 10.90 0.37 3.48 0.00 1.38
X8 : Information exchange ............ 3.72 0.20 2.19 0.04 1.08
X9 : Frequency analysis................. 7.22 0.31 2.90 0.01 1.39

questioned that active support from top management is needed to set theclimate for innovative new product development programs. Therfore it is notsurprising that the coefficient for management participation in product develop-ment is positive and significant although our data do not allow to judge thecharacter of management support.
The remaining variables in the model refer to the interaction between the cus-tomer and the company and hence product effectiveness in terms of fit withmarket needs. Variables like customer complaints, qualitative market researchand continous information exchange with customers reflect to what degreecustomer information is used as input to the product development process.Buying frequency analysis is customer information applied to decide whether tolaunch or not to launch, and the use of trade fairs is a possible customer inform-ation channel. Ranking the standardised coefficients of the four variables, thecoefficient for qualitative market research is the highest. Qualitative marketresearch is an obvious tool to apply in the conceptual stage, and if the productdevelopment process is not market driven from this early stage, the risk offailure will be high. Qualitative market research is also an obvious condition foreffective quantitative market research. According to table 3, the degree ofmarket orientation in the product development process is by far the mostimportant factor for product development success.
CONCLUSION
Three main conclusions may be drawn from this paper. Firstly, the quality con-cept combined with the concept of learning establishes a good theoretical frame-work for analysing and explaining the relationship between launching ratesand success rates of new products. The second conclusion is that empiricalresearch among companies in the Danish food industry shows that profit andmarket shares are the dominant success criteria. Finally, a regression modelwith success rate as dependent variable and launching rate and a number ofcontrolling variables suspected to influence the launching and success ratesproved that there is a significant dependency between the success rate andlaunching rate in the Danish food industry. The implication of the findings isthat higher launching rates due to learning increase success rates andultimately profit.
14

REFERENCES
Brown, S. L. & Eisenhardt, K. M. (1995). Product development: past research, resentfindings and future directions. Academy of Management Review, 20(2), 343-376.
Clark, K. B. (1989). Project scope and project performance: The effect of parts strategyand supplier involvement on product development. Management Science, 35(10), 1247-1263.
Constantineau, L. A. (1992). The twenty toughest questions for new product proposals.The Journal of Consumer Marketing, 9(2), 51-53.
Cooper. R. G. (1994). New products:The factors that drive success. International Market -ing Review, 11(1), 60-76.
Cooper, R. G. & Kleinschmidt, E. J. (1995). Benchmarking the firm’s critical successfactors in new product development. Journal of Production Innovation Management, 11,374-391.
Gupta,A. K. & Wilemon, D. J. (1990). Accelerating the development of technology-basednew products. California Management Review, Winter, 24-44.
Harmsen, H. (1996). Succesfaktorer i produktudvikling og deres implementering imellemstore fødevarevirksomheder. Phd-dissertation. The Aarhus School of Business,Department of Marketing/MAPP.
Kristensen,K., Dahlgaard, J. J. & Kanji, G. K. (1995) A comparison of TQM-performancein the Nordic and East Asian countries. In: G. K.Kanji (Ed.), Total Quality Management,pp. 39-49, London: Chapman & Hall.
Østergaard, P. (1993). An analysis of the application of management science techniques inthe larger Danish companies. PhD dissertation. The Aarhus School of Business,Department of Information Science.
15