the sugar “maize” - college of family and consumer ... · across the persian gulf to arab...
TRANSCRIPT

The Sugar “Maize”:Sugar, High Fructose Corn Syrup,
Obesity and Metabolic Risk: From Genes to Policy
Professor of Preventive Medicine; Physiology & Biophysics; and Pediatrics
Director, Childhood Obesity Research CenterCo-Director, Diabetes & Obesity Research Institute
Keck School of Medicine, USC
Michael I Goran, PhD
www.GoranLab.com
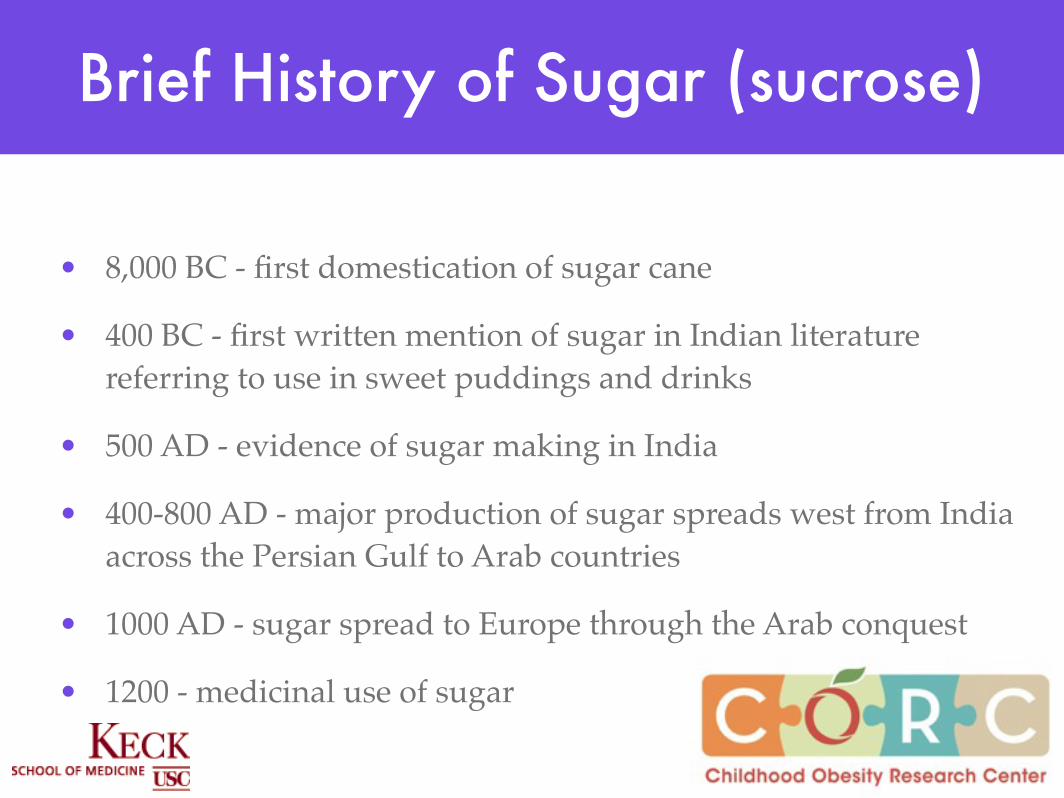
Brief History of Sugar (sucrose)
• 8,000 BC - first domestication of sugar cane
• 400 BC - first written mention of sugar in Indian literature referring to use in sweet puddings and drinks
• 500 AD - evidence of sugar making in India
• 400-800 AD - major production of sugar spreads west from India across the Persian Gulf to Arab countries
• 1000 AD - sugar spread to Europe through the Arab conquest
• 1200 - medicinal use of sugar

Brief History of Sugar (sucrose)• 16th century - production centered in the Mediterranean and
Atlantic Islands
• 1650 - Major sugar consumption among English nobility and wealthy
• 1800 - sugar has become a necessity of the diet
• 1900 - sugar supplies 20% of calories in the English diet
• 1957 - development of high fructose corn syrup
• 1970 onwards - proliferation of HFCS and sugar in the diet correlated with increases in obesity

$10 BILLION IS SPENT ANNUALLY ADVERTISING FOOD AND BEVERAGES TO CHILDREN; $500
MILLION ON SUGARY BEVERAGESIOM, 2005
FTC, 2008

17 teaspoonsAmount of sugar in a 20-oz
serving
41 percentKids age 2-11 that drink at
least 1 soda per day
62 percentKids aged 12-17 who drink
at least 1 soda per day
39 poundsAmount of sugar consumed in 1 year from 1 soda per
day
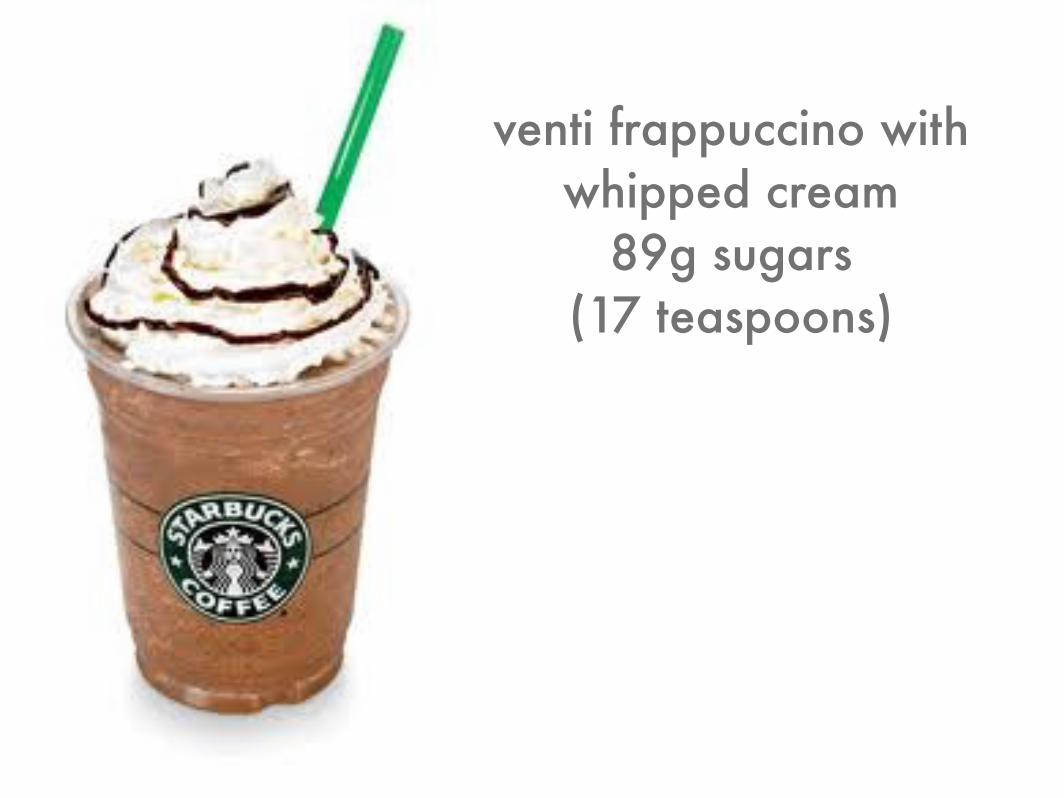
venti frappuccino with whipped cream
89g sugars(17 teaspoons)
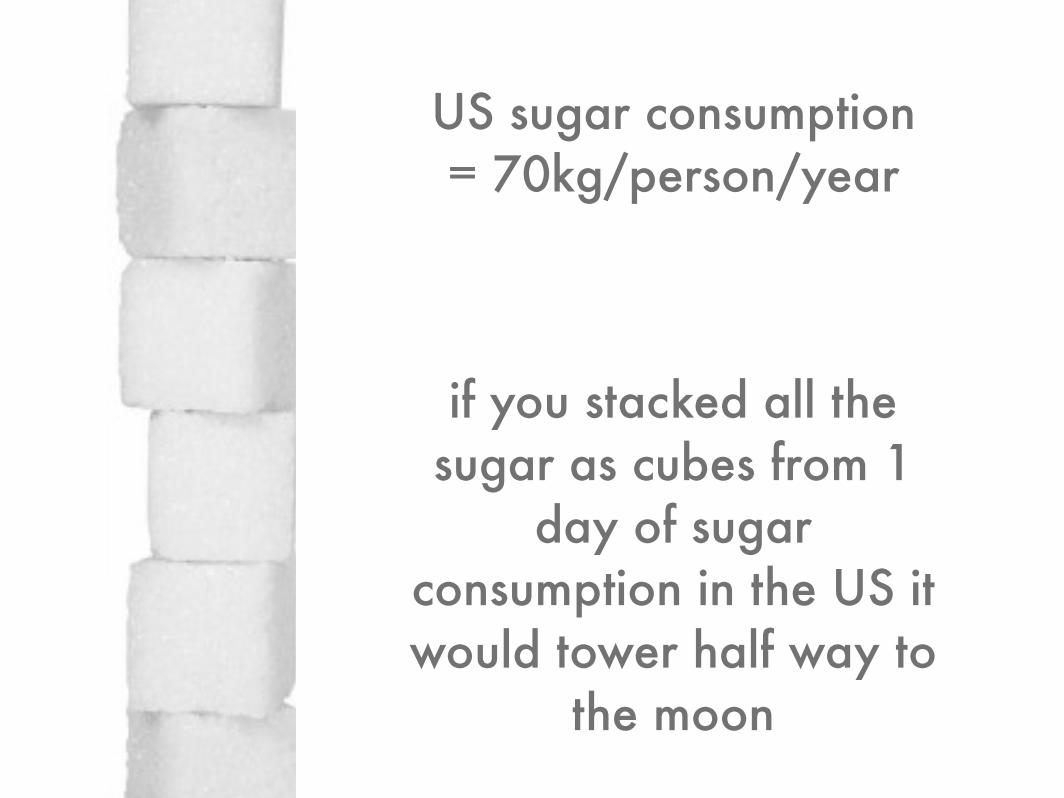
if you stacked all the sugar as cubes from 1
day of sugar consumption in the US it would tower half way to
the moon
US sugar consumption = 70kg/person/year

Legislation - Soda Tax?10/21/09 3:20 PMNEJM -- Ounces of Prevention -- The Public Policy Case for Taxes on Sugared Beverages
Page 1 of 2http://content.nejm.org/cgi/content/short/360/18/1805
Full Text
PDA Full Text
Add to Personal Archive
Add to Citation Manager
Notify a Friend
E-mail When Cited
E-mail When Letters Appear
PubMed Citation
HOME | SUBSCRIBE | CURRENT ISSUE | PAST ISSUES | COLLECTIONS | Keyword, citation, or author SEARCH Advanced Search
Sign in | Get NEJM's E-Mail Table of Contents — Free | Subscribe
Volume 360:1805-1808 April 30, 2009 Number 18 Next
Ounces of Prevention — The Public Policy Case for Taxeson Sugared Beverages
Kelly D. Brownell, Ph.D., and Thomas R. Frieden, M.D., M.P.H.
Since this article has no abstract, we have provided an extractof the first 100 words of the full text and any section headings.
Sugar, rum, and tobacco are commodities which are nowhere
necessaries of life, which are become objects of almost universal
consumption, and which are therefore extremely proper subjects oftaxation.
— Adam Smith, The Wealth of Nations, 1776
The obesity epidemic has inspired calls for public health measures to prevent
diet-related diseases. One controversial idea is now the subject of publicdebate: food taxes.
Forty states already have small taxes on sugared beverages and snack foods,
but in the past year, Maine and New York have proposed large taxes on
sugared beverages, and similar discussions have begun in other states. The. . . [Full Text of this Article]
Source Information
Dr. Brownell is a professor and director of the Rudd Center for Food Policy and Obesity, Yale University, New Haven, CT. Dr.
Frieden is the health commissioner for the City of New York.
This article (10.1056/NEJMp0902392) was published at NEJM.org on April 8, 2009.
This article has been cited by other articles:
Brownell, K. D., Farley, T., Willett, W. C., Popkin, B. M., Chaloupka, F. J., Thompson, J. W.,Ludwig, D. S. (2009). The Public Health and Economic Benefits of Taxing Sugar-SweetenedBeverages. NEJM 361: 1599-1605 [Full Text] Halpern, S. D., Madison, K. M., Volpp, K. G. (2009). Patients as Mercenaries?: The Ethics of UsingFinancial Incentives in the War on Unhealthy Behaviors. Circ Cardiovasc Qual Outcomes 2: 514-516[Full Text] Lock, K., Stuckler, D., Charlesworth, K., McKee, M. (2009). Potential causes and health effects ofrising global food prices. BMJ 339: b2403-b2403 [Full Text]
FREE NEJM E-TOC
A couple of local ballot measures in the US have failedThe beverage industry has lobbied hard against them
One study has projected that even a 20% tax on sodas would only lead to a long-term weight loss of 3 pounds
mechanisms
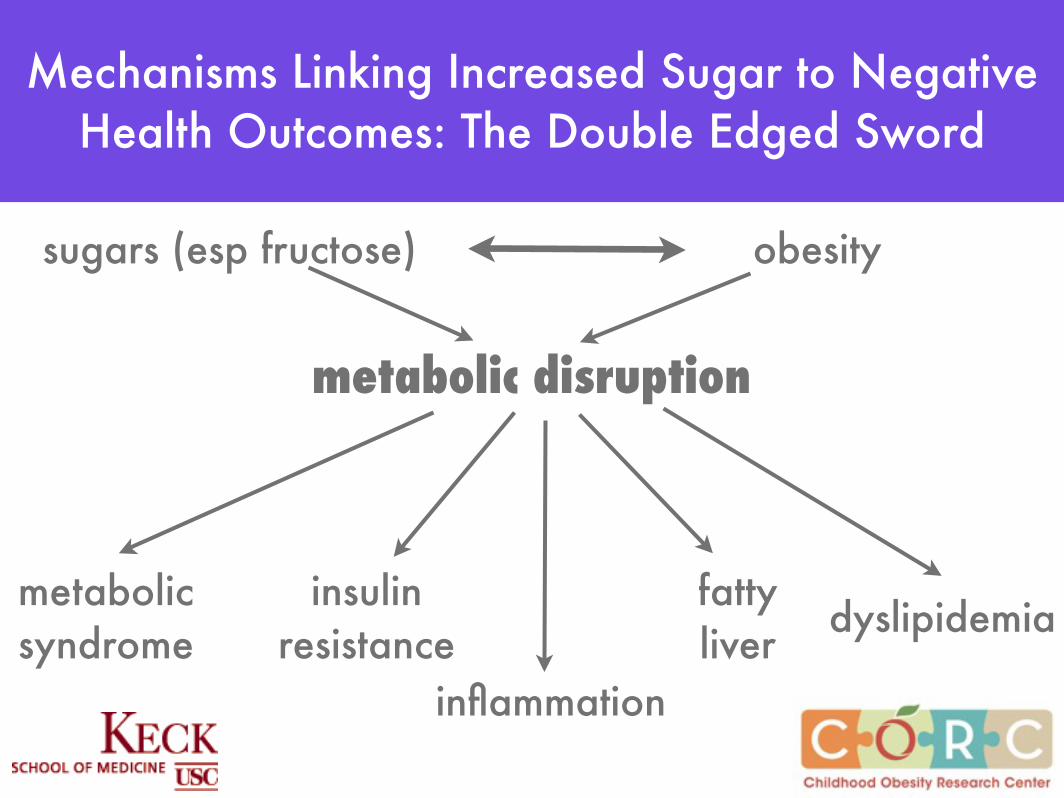
sugars (esp fructose)
metabolicsyndrome
insulinresistance
fattyliver dyslipidemia
inflammation
obesity
metabolic disruption
Mechanisms Linking Increased Sugar to Negative Health Outcomes: The Double Edged Sword

why has high sugar become such an important issue in terms of obesity and metabolic
outcomes?1. trends in food and beverage consumption; related to
economics2. advent and proliferation of high fructose corn syrup
3. exacerbation of effects of sugars on metabolism in the obese state
4. earlier introduction of fructose in the diet from sugar (glucose + fructose) relative to breastfeeding (lactose =
glucose+galactose)
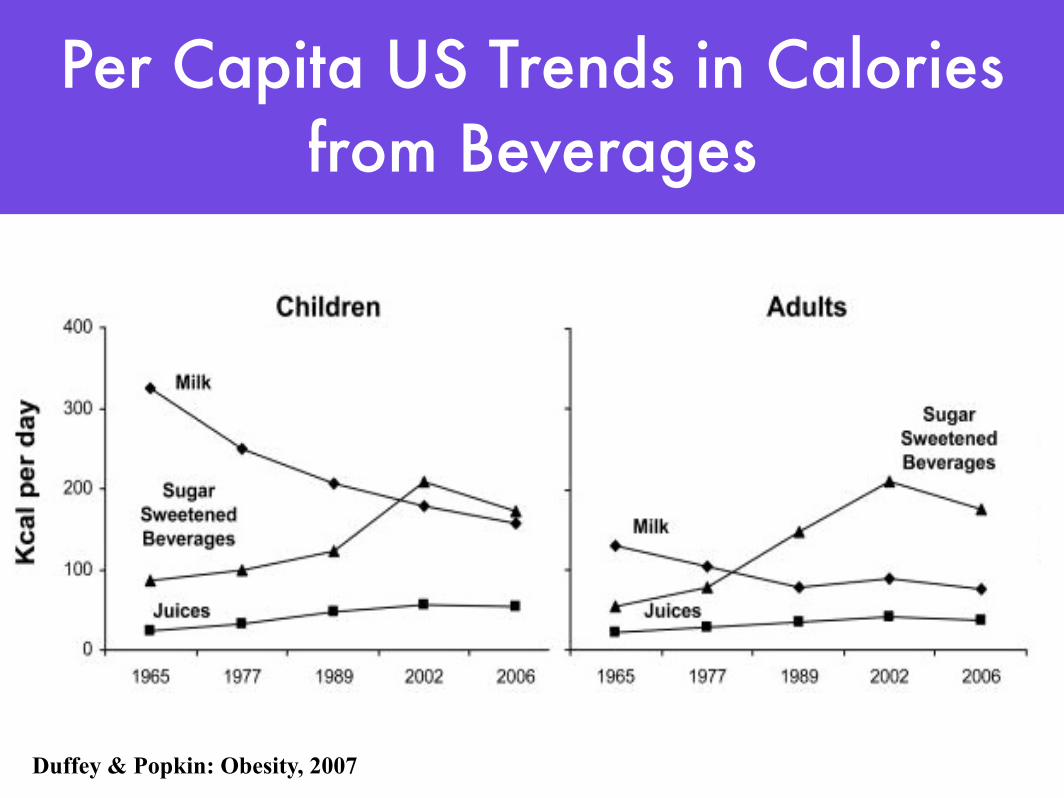
Duffey & Popkin: Obesity, 2007
Per Capita US Trends in Calories from Beverages
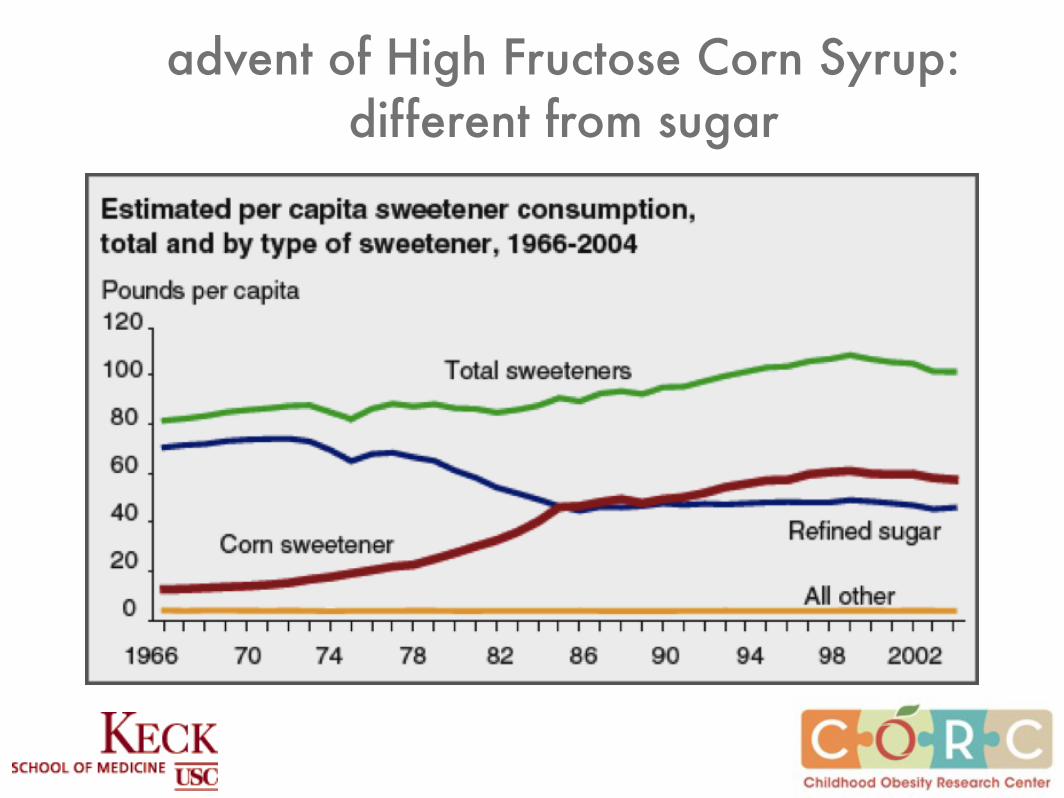
advent of High Fructose Corn Syrup: different from sugar
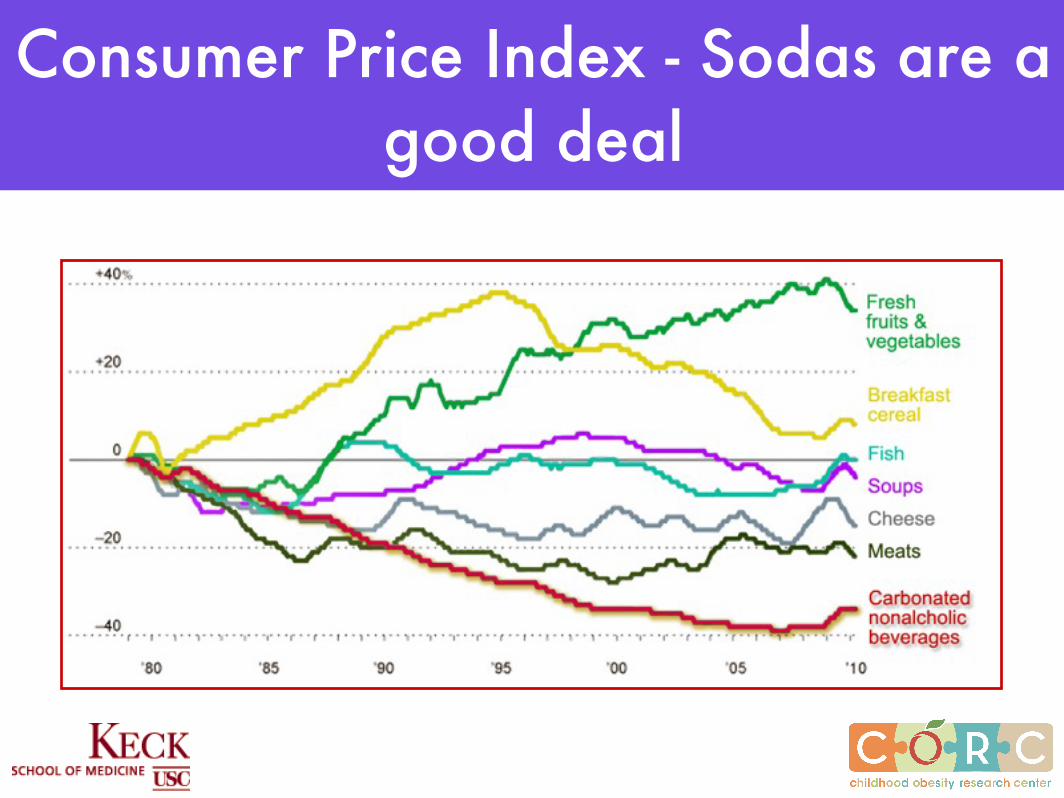
Consumer Price Index - Sodas are a good deal

6.5 oz (1920s)
12 oz(1960s)
20 oz (1990s)
33 oz (1L) Today
10 teaspoonssugar
27 teaspoonssugar

Obesity/Economic Status in 128 LA Cities & Communities
0 20 40 60 80 100MEAN
0
10
20
30
40
50
Hermosa Beach
Manhatten Beach
Hidden Hills
MalibuPalos Verdes Estates
Sierra Madre
Redondo Beach
Calabasas
Rolling Hills Estate
Agoura Hills
LancasterLong Beach
Irwindale
Rosemead
West Compton
South San Jose Hills
South El Monte
Walnut Park
East LA
Westmont
LynwoodLA Dis 1MaywoodHuntington Park
Bell GardensLA Dis 9Florence-Graham
Economic Hardship of City
Obesity P
revale
nce (
%)
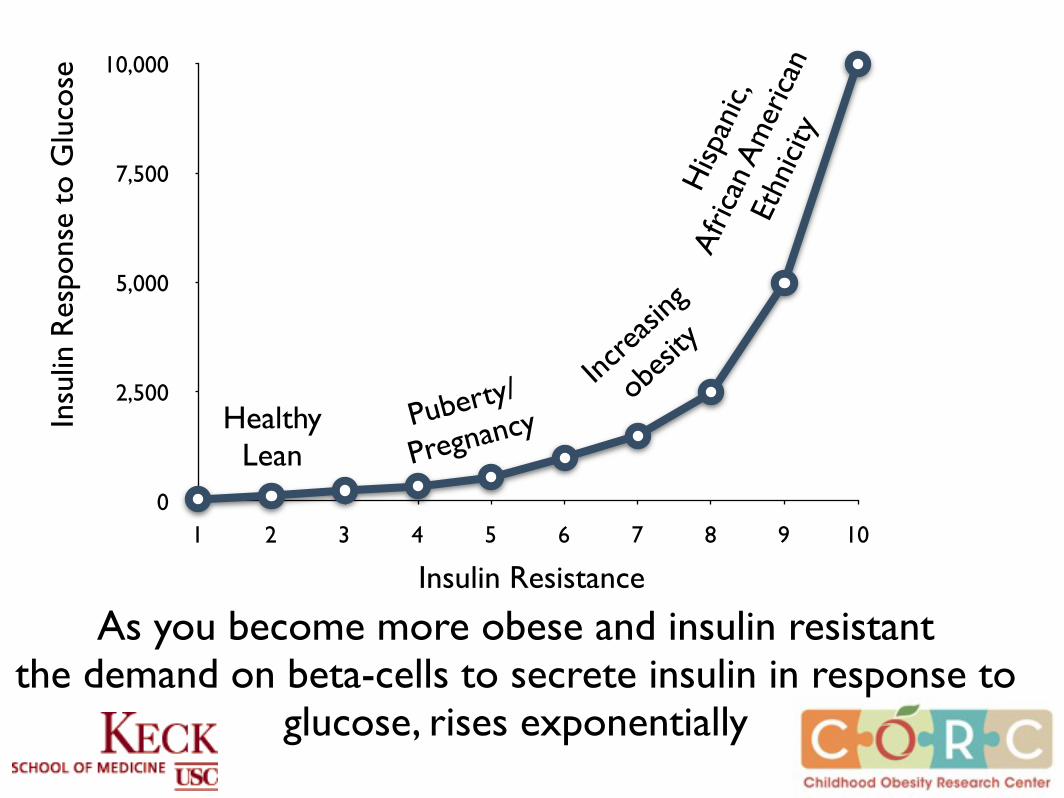
0
2,500
5,000
7,500
10,000
1 2 3 4 5 6 7 8 9 10
Insulin Resistance
Insu
lin R
espo
nse
to G
luco
se
HealthyLean
Incre
asing
obes
ity
Puberty/
Pregnancy
Hisp
anic
,A
fric
an A
mer
ican
Ethn
icity
As you become more obese and insulin resistantthe demand on beta-cells to secrete insulin in response to
glucose, rises exponentially
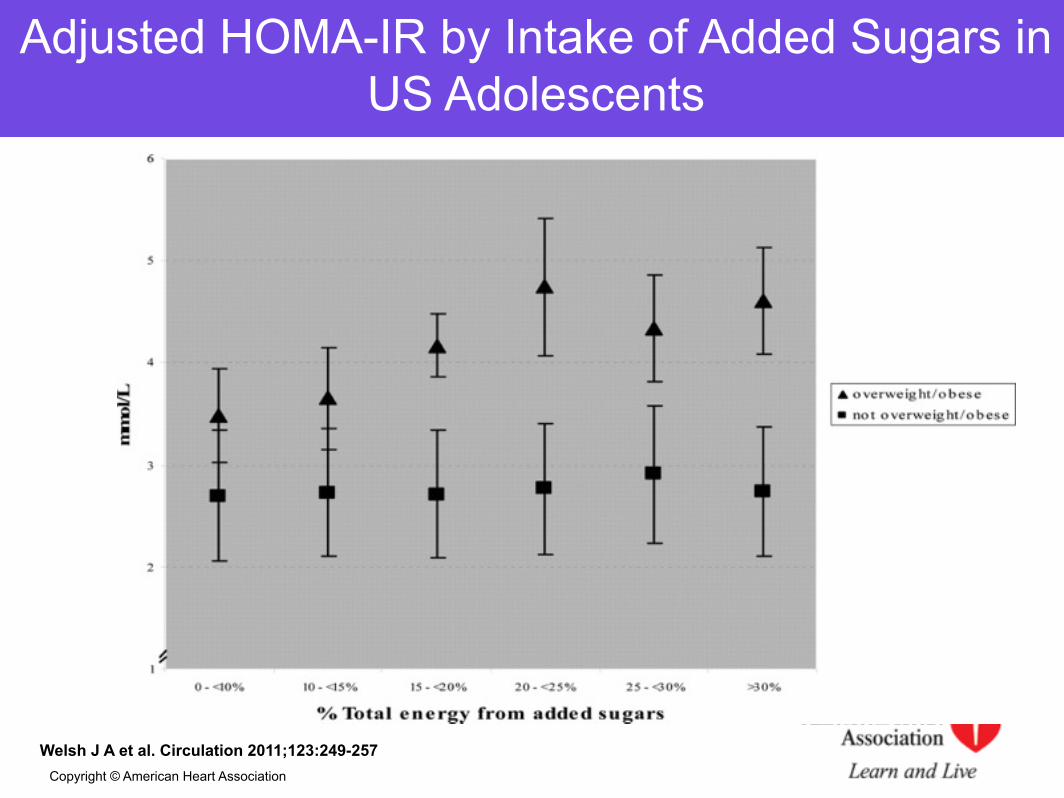
Welsh J A et al. Circulation 2011;123:249-257Copyright © American Heart Association
Adjusted HOMA-IR by Intake of Added Sugars in US Adolescents

Sugar and obesity: the evidence

• Ludwig et al Lancet 2001, 357:505-8– 19 month study of 548 middle school students– Every additional serving of per day increased risk of
obesity by 60%• Walsh et al. Pediatrics 2005, 115:223
– 1 year study of 10,904 children ages 2 to 3 years– Children were 2-times more likely to become or remain
overweight if they drank sugar-sweetened beverages
Sugar Sweetened Beverages and Obesity in Children:
Key Prospective Studies
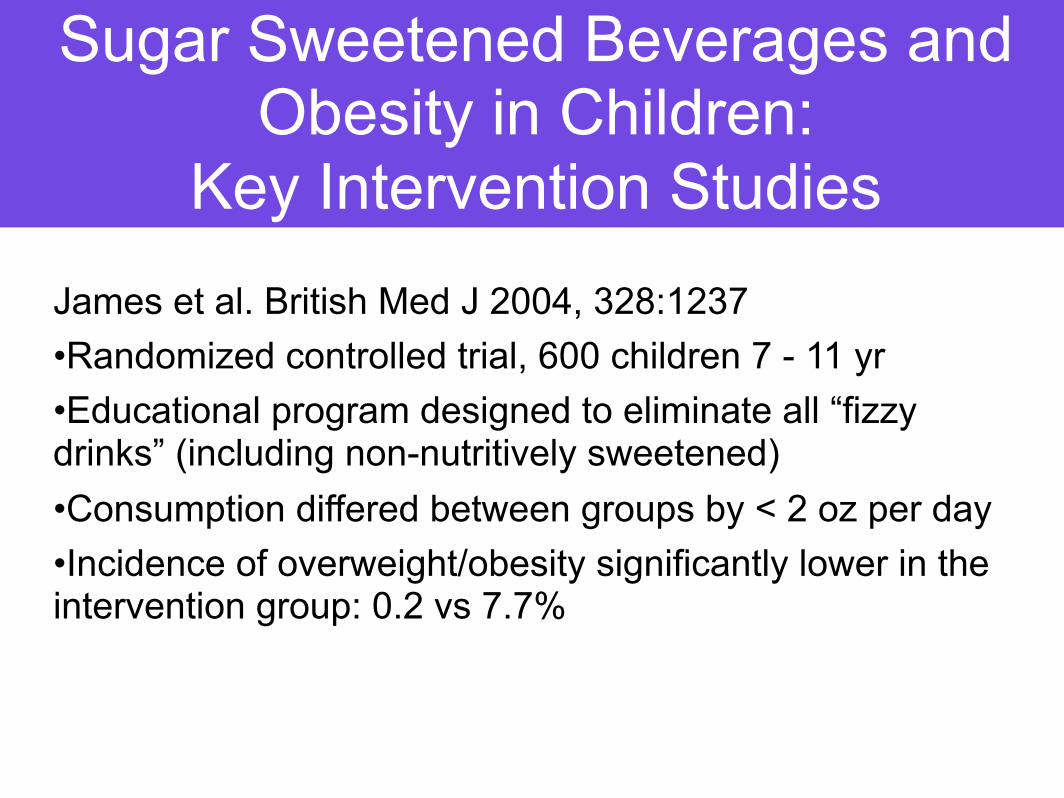
James et al. British Med J 2004, 328:1237•Randomized controlled trial, 600 children 7 - 11 yr•Educational program designed to eliminate all “fizzy drinks” (including non-nutritively sweetened)•Consumption differed between groups by < 2 oz per day•Incidence of overweight/obesity significantly lower in the intervention group: 0.2 vs 7.7%
Sugar Sweetened Beverages and Obesity in Children:
Key Intervention Studies
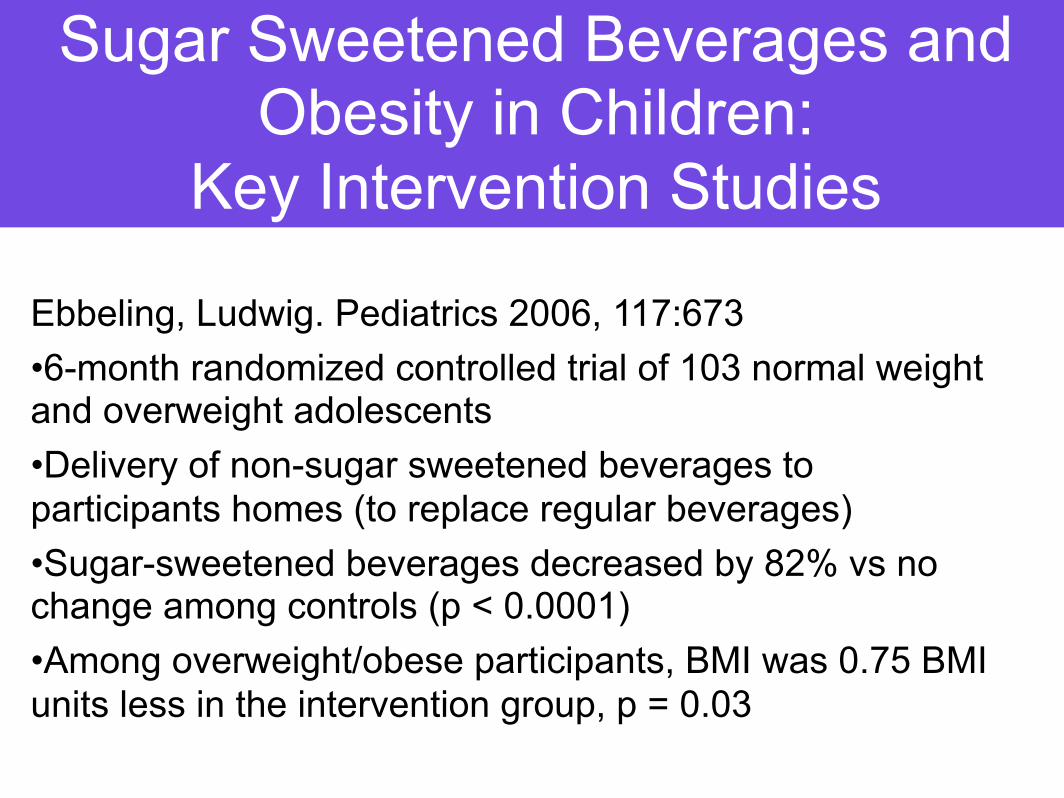
Ebbeling, Ludwig. Pediatrics 2006, 117:673•6-month randomized controlled trial of 103 normal weight and overweight adolescents•Delivery of non-sugar sweetened beverages to participants homes (to replace regular beverages)•Sugar-sweetened beverages decreased by 82% vs no change among controls (p < 0.0001)•Among overweight/obese participants, BMI was 0.75 BMI units less in the intervention group, p = 0.03
Sugar Sweetened Beverages and Obesity in Children:
Key Intervention Studies
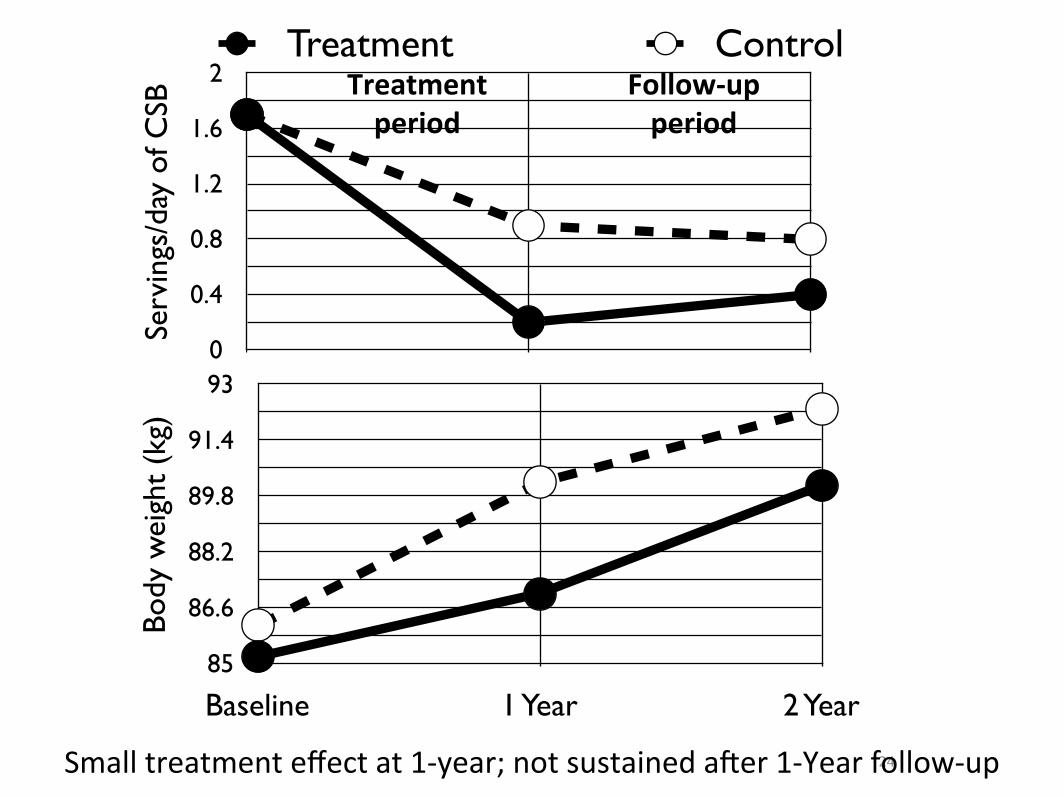
Ebbeling et al; NEJM 2012
• 224 overweight & obese adolescents (mean age ~15 years)
• 1-year intervention to reduce caloric-sweetened beverages followed by 1-year follow-up
• Main outcome body weight and BMI
24
0
0.4
0.8
1.2
1.6
2
Serv
ings
/day
of C
SB
Treatment ControlTreatment period
Follow-‐upperiod
85
86.6
88.2
89.8
91.4
93
Baseline 1 Year 2 Year
Body
wei
ght
(kg)
Small treatment effect at 1-‐year; not sustained a7er 1-‐Year follow-‐up
25
80
82
84
86
88
90
92
94
96
98
100
Baseline 1 Year 2 Year
Body
Wei
ght
(kg)
Hispanic Treatment Hispanic ControlNon-Hispanic Treatment Non-Hispanic Control
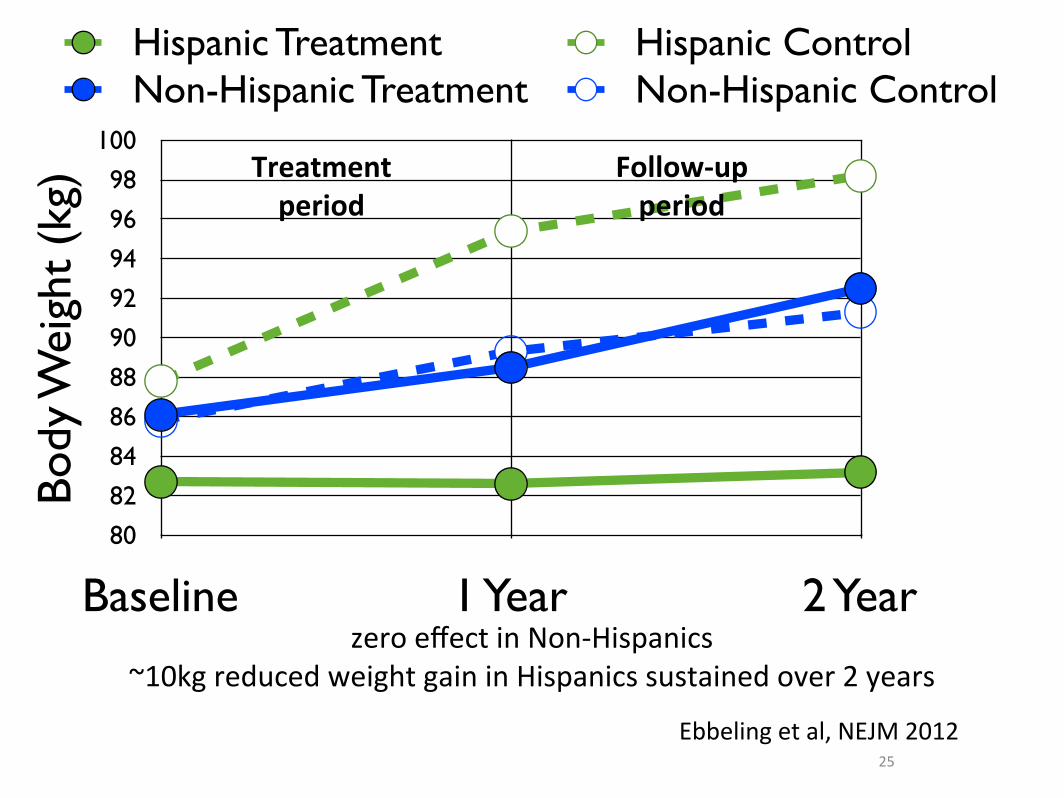
zero effect in Non-‐Hispanics~10kg reduced weight gain in Hispanics sustained over 2 years
Treatment period
Follow-‐upperiod
Ebbeling et al, NEJM 2012

sugar and fatty liver disease

Spectrum of NAFLD
Diet, genes, cellular factors and food policy

NAFLD in Children
• Autopsy study of 742 children aged 2-19 years by Schwimmer et al 2006
• Fatty liver defined by liver fat >5%• Overall prevalence = 13%• African American (1.5%); Whites (8.6%); Asian
(10.2%); Hispanic (11.8%)• Prevalence in obese children = 38%
Genetics of Fatty Liver
• A recent GWAS in adults from the Dallas Heart Study at UT Southwestern identified an amino-acid substitution (C to G) in the PNPLA3 gene associated with 2-fold higher liver fat
• Effect strongest in Hispanics in whom the frequency of the variant was much higher (49%) than African Americans (10%)
• Aim was to examine if the effect of this gene was manifested in a pediatric population

0
2
4
6
8
10
12
African American Hispanic
-ve for gene -/+ for gene +ve for gene
n=61 n=11 n=45 n=90 n=53
Liver Fat Fraction by Ethnicity & Genotype
n=0
Live
r Fa
t Fra
ctio
n (%
)
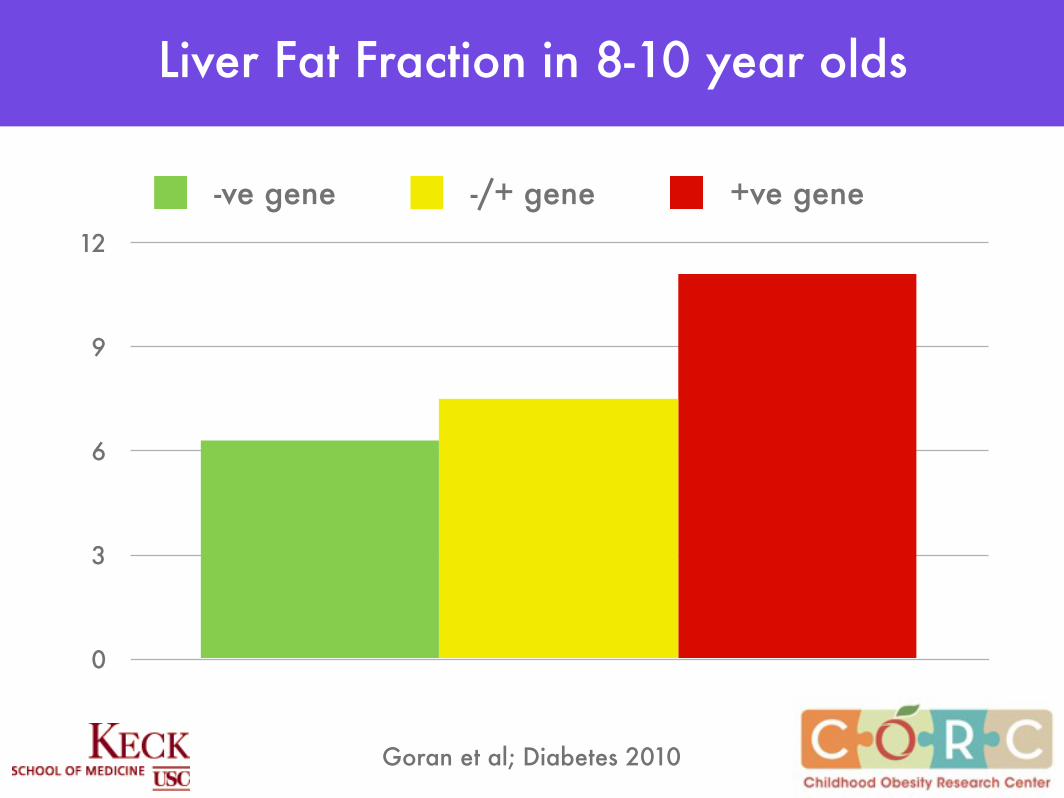
0
3
6
9
12
Liver Fat Fraction in 8-10 year olds
-ve gene -/+ gene +ve gene
Goran et al; Diabetes 2010
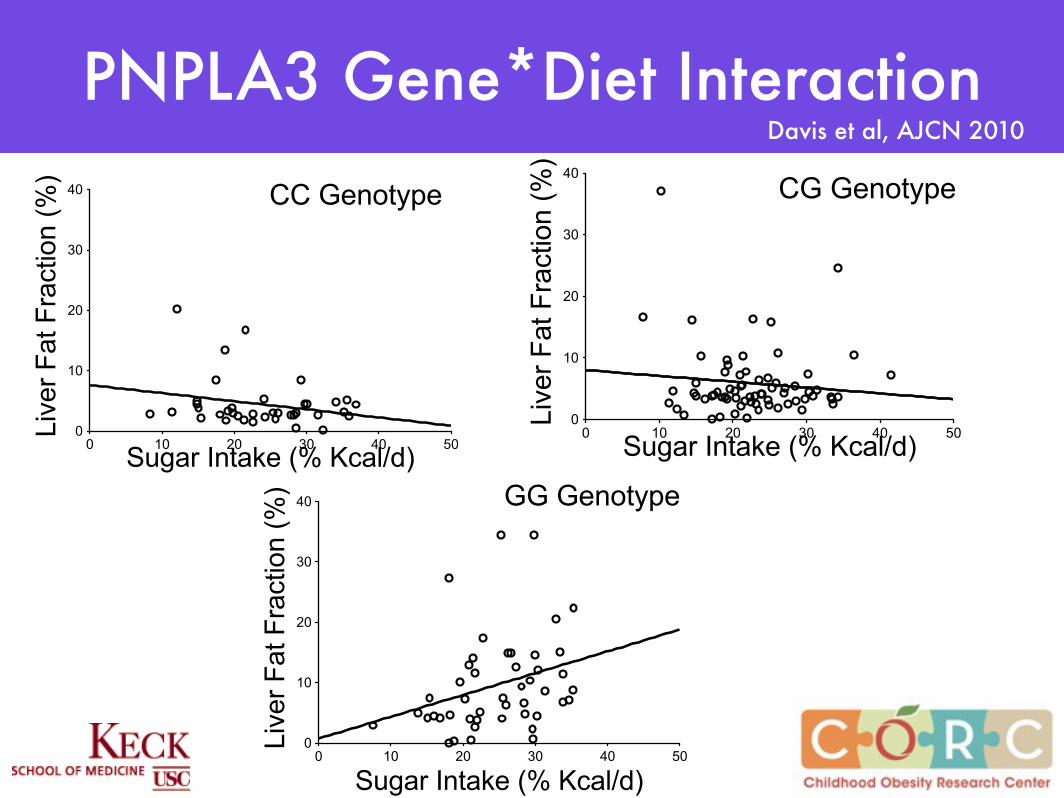
0 10 20 30 40 500
10
20
30
40 GG Genotype
Sugar Intake (% Kcal/d)
Liv
er
Fat F
raction (
%)
0 10 20 30 40 500
10
20
30
40
CG Genotype
Sugar Intake (% Kcal/d)
Liv
er
Fat F
raction (
%)
0 10 20 30 40 500
10
20
30
40 CC Genotype
Sugar Intake (% Kcal/d)
Liv
er
Fat F
raction (
%)
PNPLA3 Gene*Diet InteractionDavis et al, AJCN 2010
sugar in early life

• 1483 Latino children (2 to 4 yrs) from WIC LA County
• Completed early life nutrition measures on breastfeeding and SSB intake - 2008
• height/weight/BMI data
• Multinominal regressions – differences in prevalence of ow/ob in children between BF and SSB categories
Combined Effects of Low Breastfeeding and High Sugar Consumption

Davis et al in review at Peds
Combined Effects of Low Breastfeeding and High Sugar Consumption
Davis et al; AJCN 20012

Other Animal Studies
• Sugars and especially fructose programs for obesity and metabolic risk starting with exposure in utero and during breastfeeding
• Fructose affects fat cell and hypothalamic development in ways that favor obesity

high fructose corn syrup (HFCS)
HFCS magnifies many of the worst aspects of table sugar
(sugar on steroids)
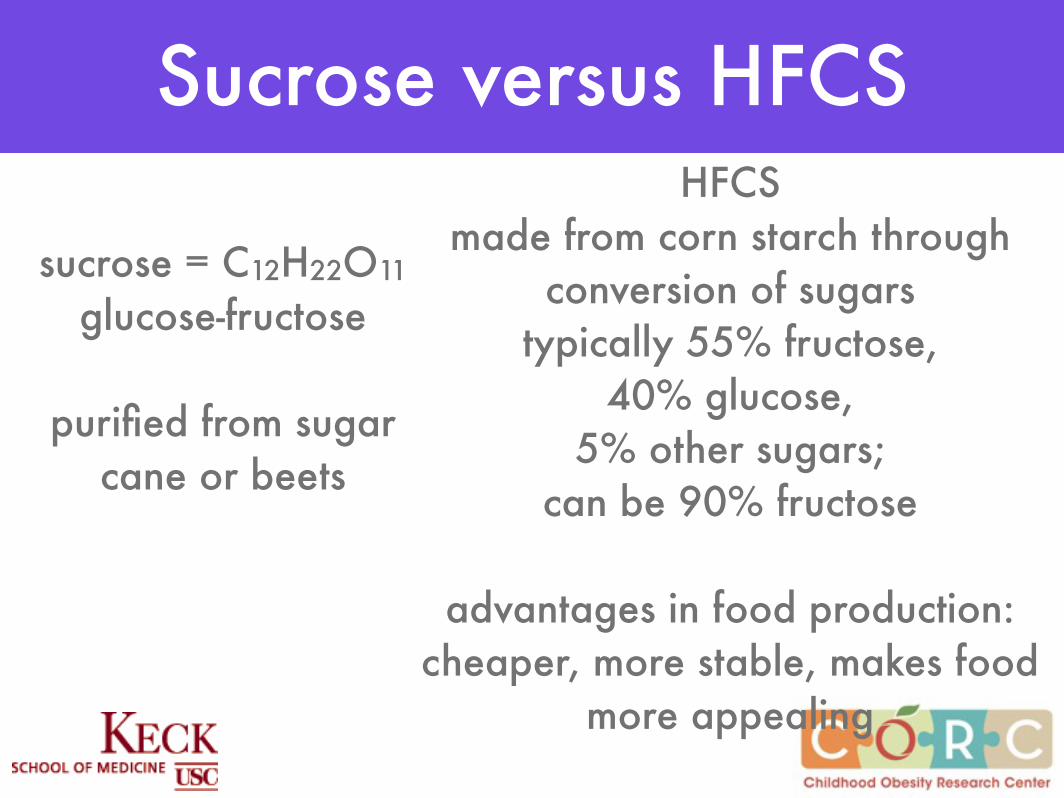
sucrose = C12H22O11
glucose-fructose
purified from sugar cane or beets
HFCSmade from corn starch through
conversion of sugarstypically 55% fructose,
40% glucose, 5% other sugars;
can be 90% fructose
advantages in food production: cheaper, more stable, makes food
more appealing
Sucrose versus HFCS

Glucose versus Fructose
• Glucose and fructose are structurally very similar but functionally very different sugars
• Fructose is much sweeter
• has a specific absorption in the gut; in high doses can get fructose malabsorption with GI symptoms
• it is metabolized almost entirely in the liver where it can be a substrate for new fat synthesis in the liver
• does not stimulate insulin release therefore less well regulated
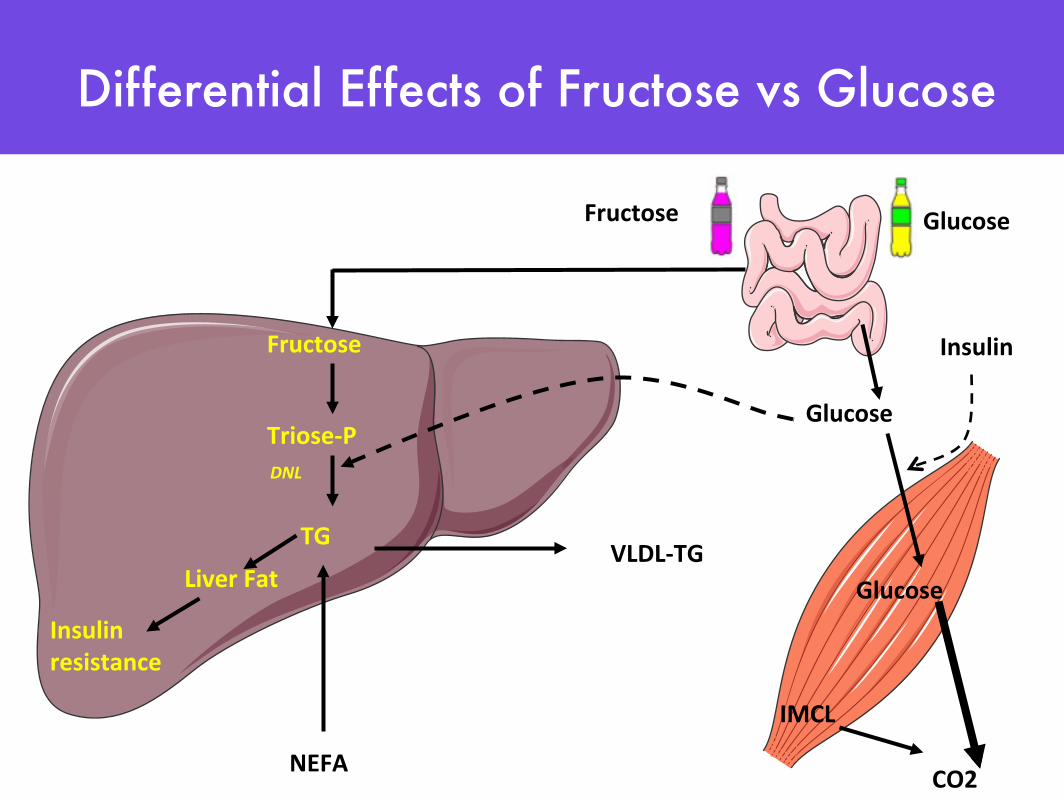
Fructose
Triose-‐P
TG
Liver FatVLDL-‐TG
Glucose
Glucose
Insulin
NEFA
IMCL
CO2
Fructose Glucose
DNL
Insulin resistance
Differential Effects of Fructose vs Glucose
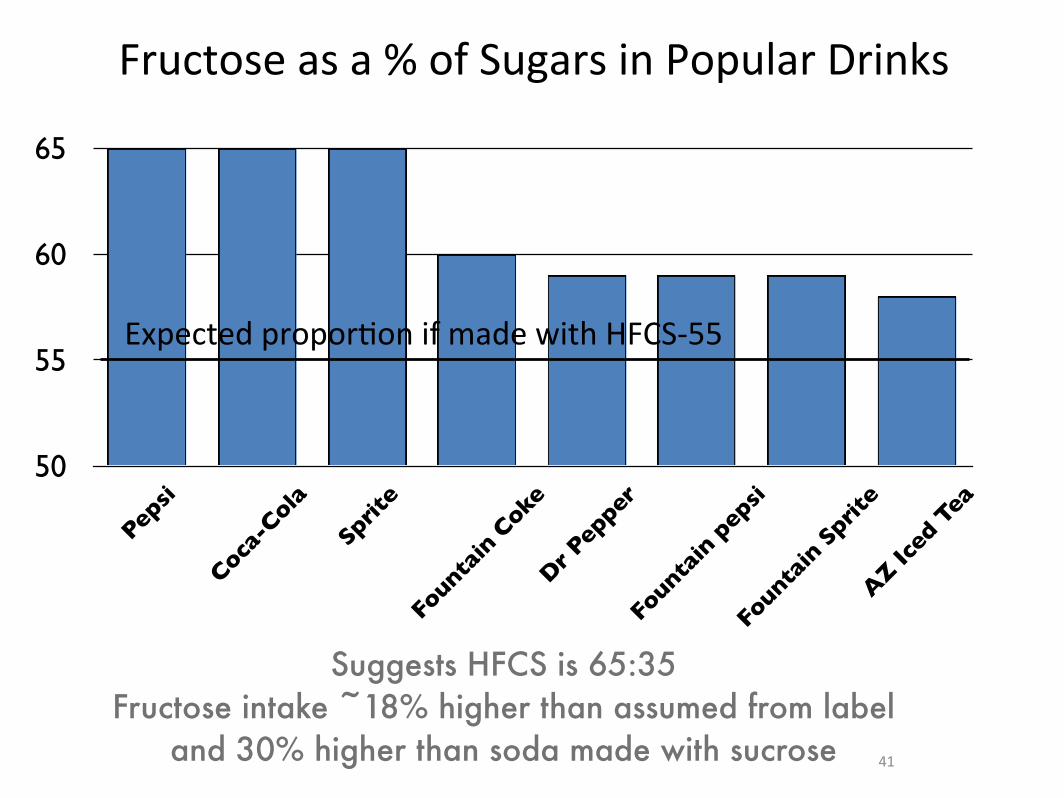
Fructose as a % of Sugars in Popular Drinks
50
55
60
65
Pepsi
Coca-C
ola
Sprit
e
Founta
in C
oke
Dr P
epper
Founta
in p
epsi
Founta
in S
prite
AZ Ic
ed T
ea
41
Expected proporPon if made with HFCS-‐55
Suggests HFCS is 65:35Fructose intake ~18% higher than assumed from label
and 30% higher than soda made with sucrose

Other Sugars
• Agave - mostly all fructose
• Fructose itself being used as a sweetener now in many yoghurts
• “Fruit sugar” on a label probably means fructose
• Juices from fruit probably very high in fructose and likely to have a higher fructose load than a soda made with HFCS

Fructose versus Glucose in Foods
50g sugar25g fructose/25g glucose (sucrose)
28g fructose/22g glucose (HFCS 55)33g fructose/17g glucose (HFCS 65)
15g Fructose+
other dietary benefitsfiber, antioxidants
Implication:fructose consumption might be higher than we think and
contributing to obesity and obesity complications like NAFLD
Policy Implication:Need better label information on fructose content of
foods and bevrages

Global Influence of Dietary Sugar & HFCS on Obesity &
DiabetesGoran et al
Global Public Health, 2012

Global Implications:Data from 170 Countries
Goran et al; in preparation
Mean + SD Range
Diabetes Prevalence (%)
6.8 + 3.0 1.6 - 18.7
BMI (kg/m2) 24.9 + 2.3 20.1 - 31.1
Total Intake (kcal/day per capita)
2711 + 510 1559 - 3781
Total Sugar (kg/day per capita)
29.8 + 16.0 2.2 - 68.6
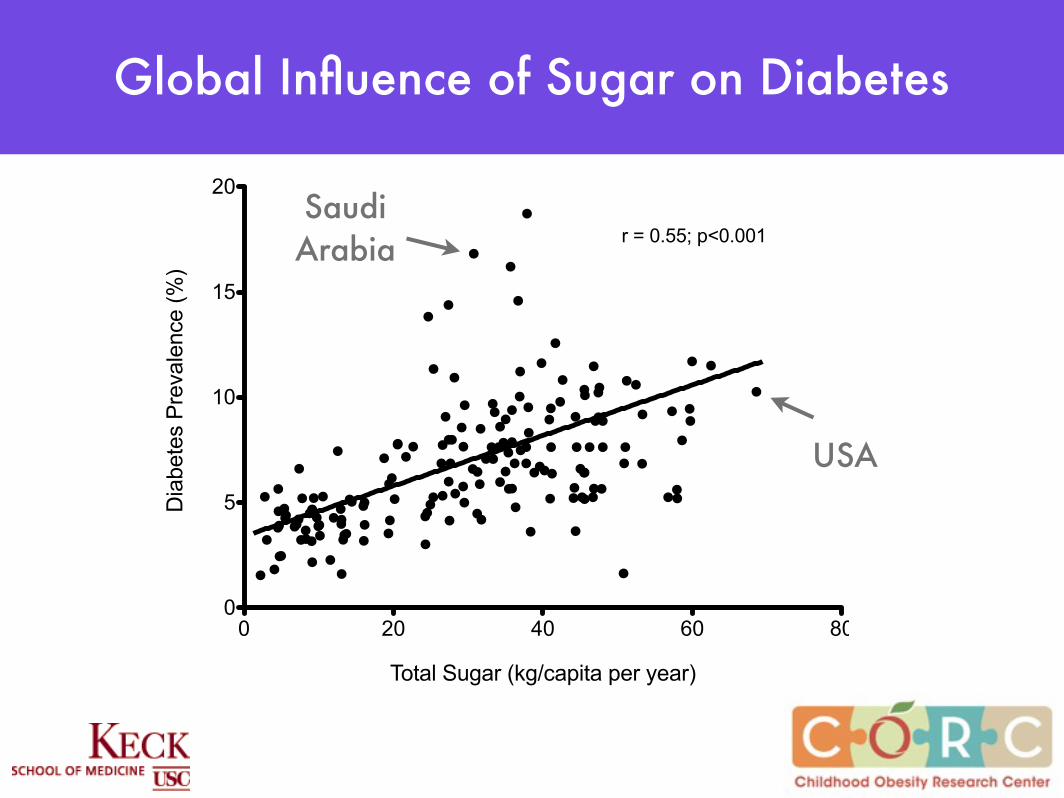
Global Influence of Sugar on Diabetes
0 20 40 60 800
5
10
15
20
Total Sugar (kg/capita per year)
Dia
bete
s P
reva
lenc
e (%
)
r = 0.55; p<0.001
0 5 10 15 20 250
5
10
15
20 r = 0.55; p<0.001
Sugar (% of total calories)
Dia
bete
s P
reva
lenc
e (%
)
Saudi Arabia
USA
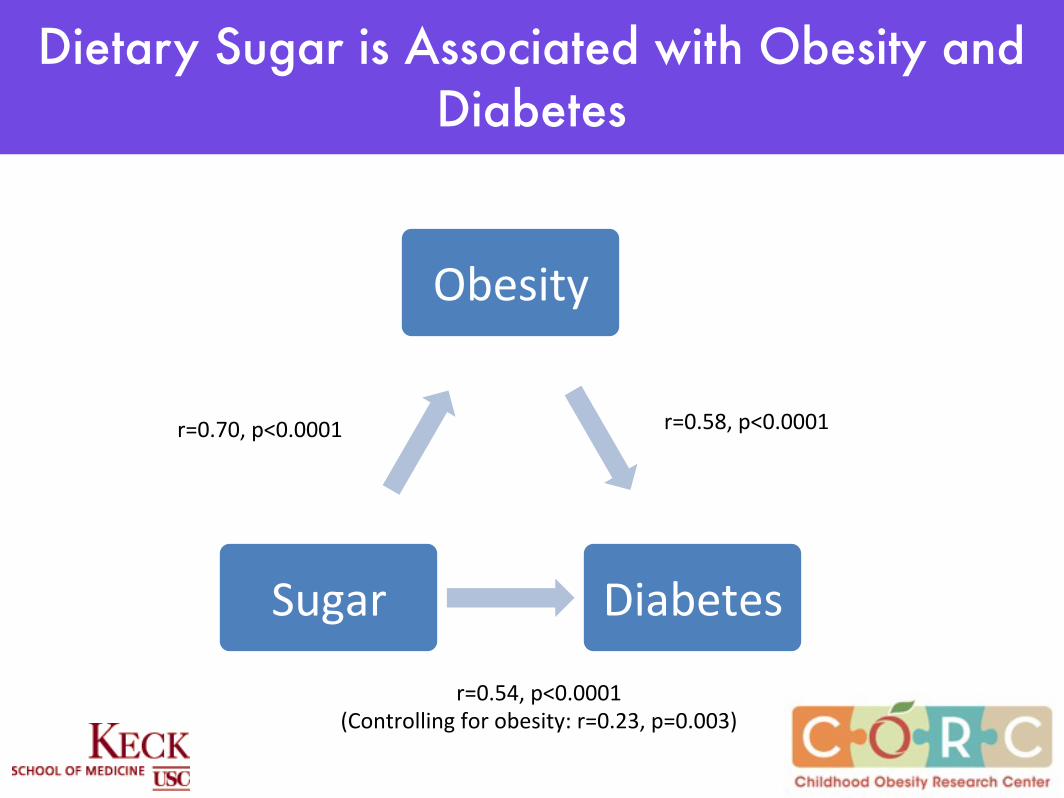
Dietary Sugar is Associated with Obesity and Diabetes
Obesity(
Diabetes(Sugar(
r=0.70,(p<0.0001( r=0.58,(p<0.0001(
r=0.54,(p<0.0001((Controlling(for(obesity:(r=0.23,(p=0.003)(
German
y
Poland
Thaila
nd
Greece
Portug
al
Malays
iaEgy
ptSpa
in
Finlan
dSerb
ia
Turke
y
Mexico
Taiw
anaJa
panKore
a
Argenti
na
Belgium
Bulgari
a
Canad
a
Slovak
ia
Hunga
ryUSA
0
5
10
15
20
25
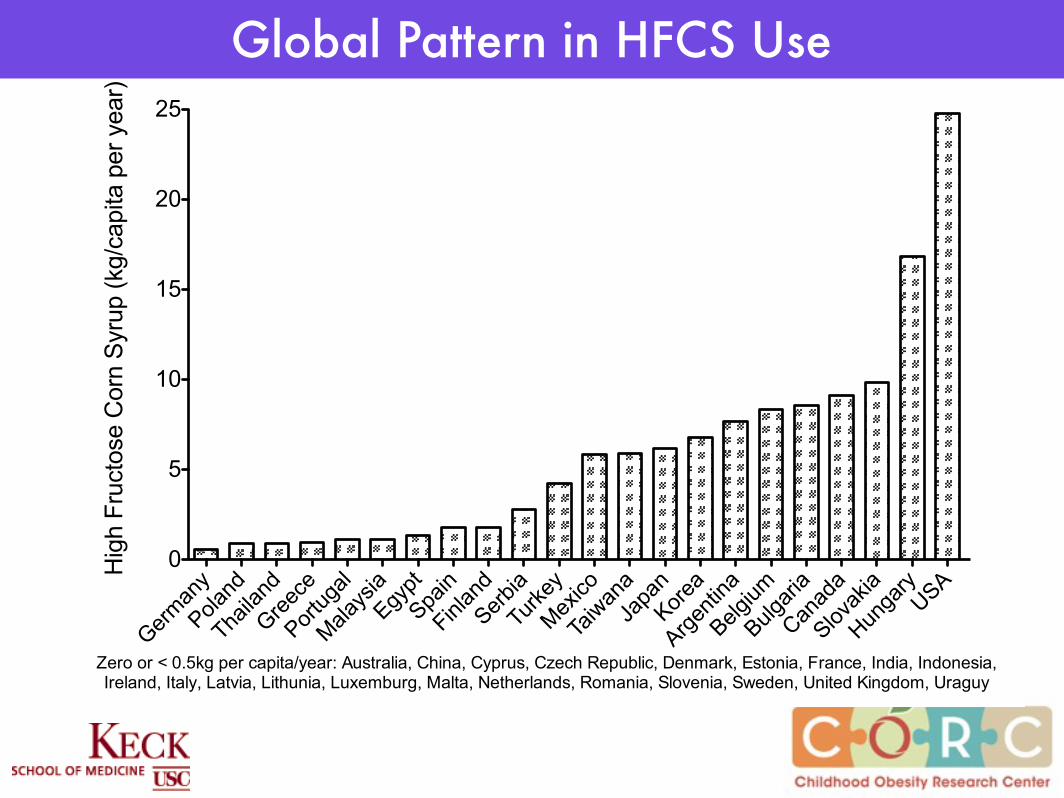
Zero or < 0.5kg per capita/year: Australia, China, Cyprus, Czech Republic, Denmark, Estonia, France, India, Indonesia, Ireland, Italy, Latvia, Lithunia, Luxemburg, Malta, Netherlands, Romania, Slovenia, Sweden, United Kingdom, Uraguy
Hig
h Fr
ucto
se C
orn
Syru
p (k
g/ca
pita
per
yea
r)
Global Pattern in HFCS Use

Countries not Using HFCS
(n=22)
Countries Using HFCS (n=21)
BMI (kg/m2) 25.5 + 1.6 25.9 + 1.4
Total Intake (kcal/day per capita)
3230 + 377 3221 + 365
Total Sugar (kg/day per capita)
38.2 + 12.8 39.9 + 11.3
HFCS (kg/day per capita) 0.1 + 0.2 5.8 + 6.1
Diabetes Prevalence (%) 6.7 + 1.3 7.9 + 1.8
Fasting Glucose (mmol/L) 5.23 + 0.17 5.33 + 0.17
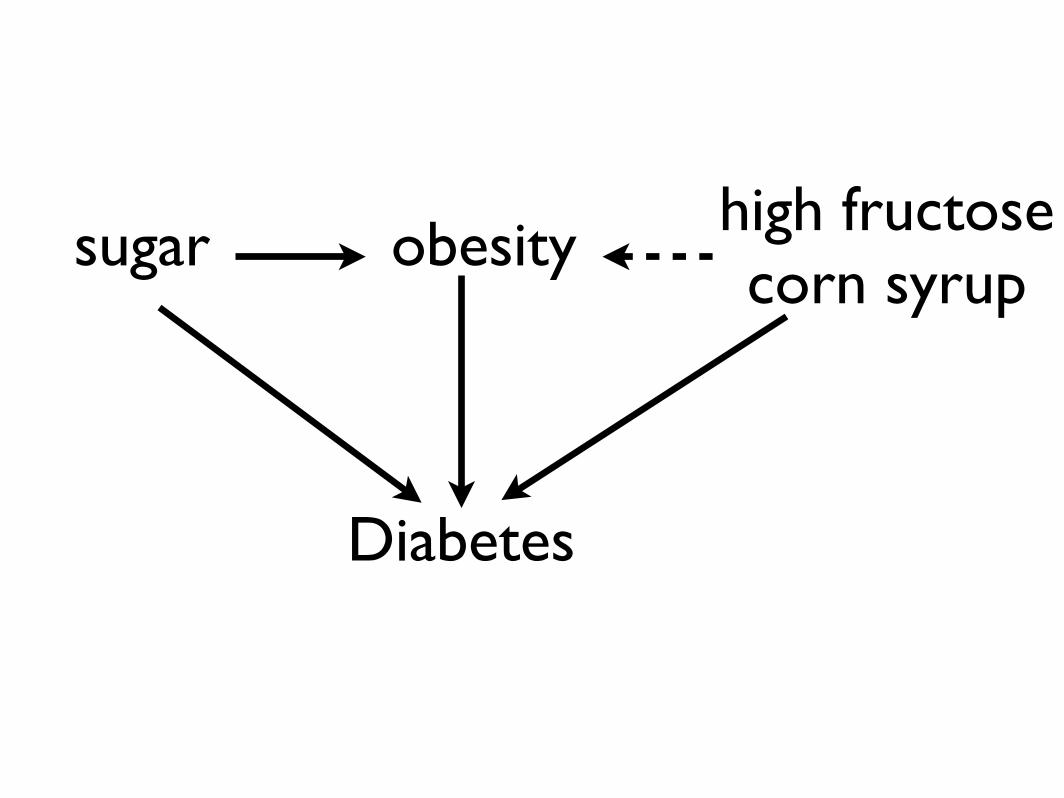
Diabetes
obesitysugar high fructosecorn syrup
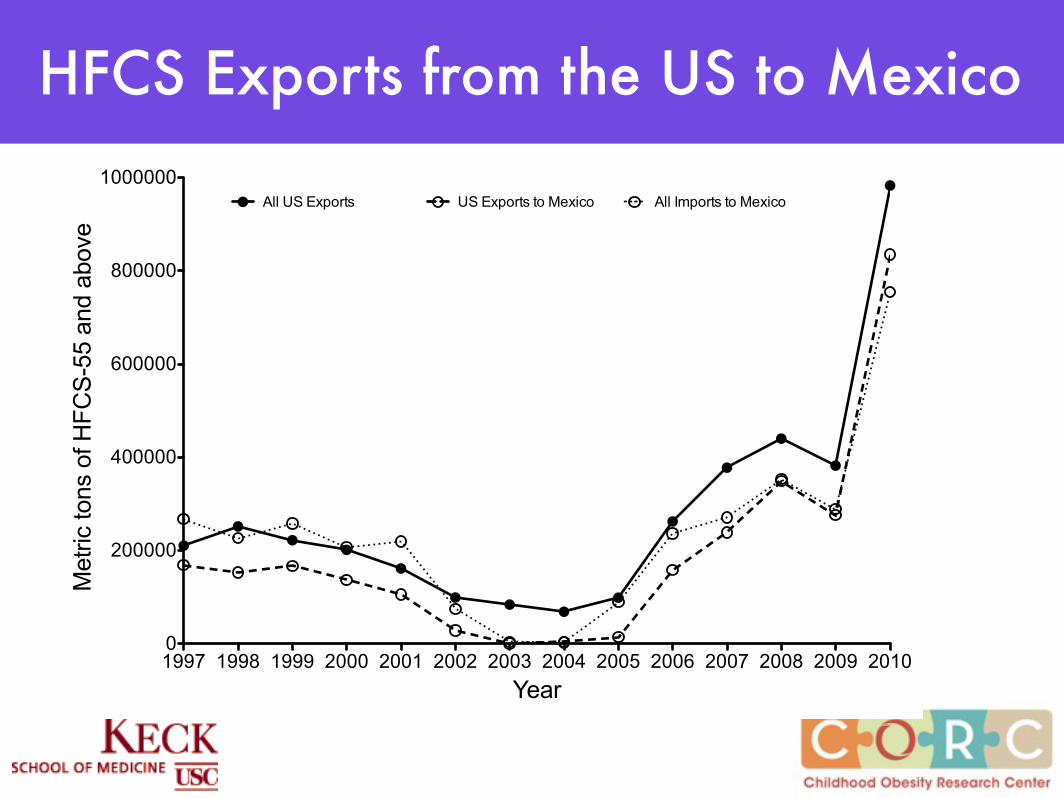
HFCS Exports from the US to Mexico
1997 1998 1999 2000 2001 2002 2003 2004 2005 2006 2007 2008 2009 20100
200000
400000
600000
800000
1000000All US Exports US Exports to Mexico All Imports to Mexico
Year
Met
ric to
ns o
f HFC
S-55
and
abo
ve

Policy Implications:EU policy on HFCS quotas and their trading between
countries may be a factor influencing that countries public health
Trade policy between countries in sugar and HFCS may be a factor driving public health
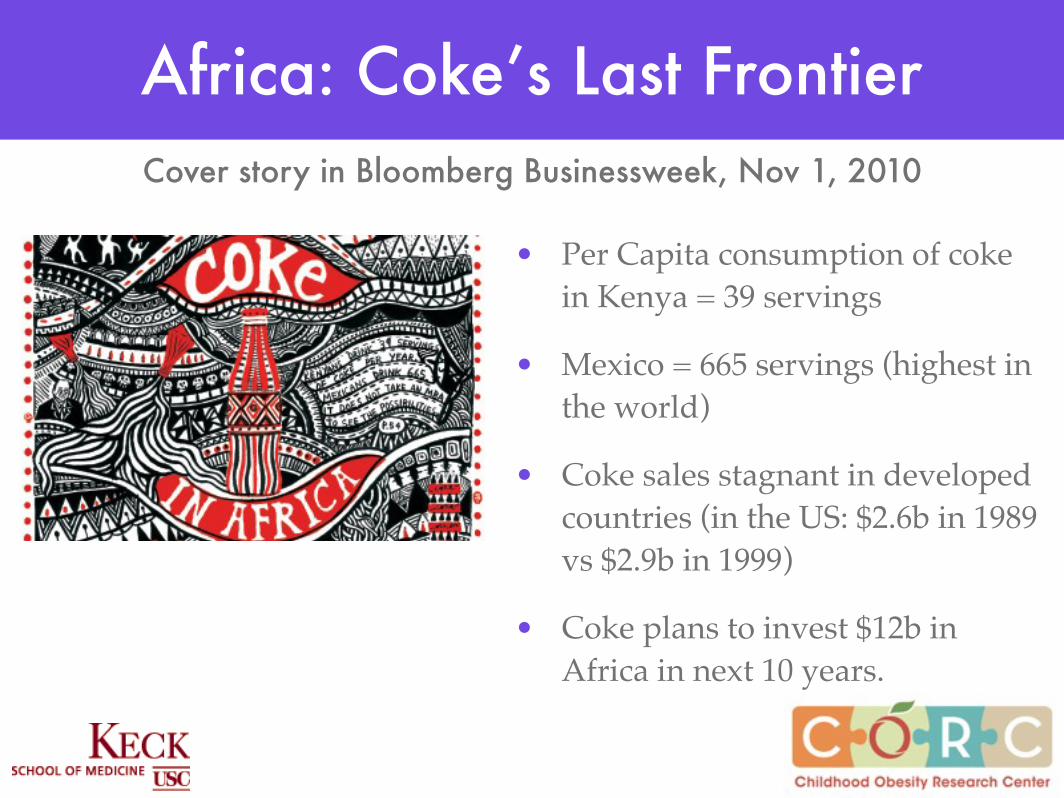
Africa: Coke’s Last Frontier
• Per Capita consumption of coke in Kenya = 39 servings
• Mexico = 665 servings (highest in the world)
• Coke sales stagnant in developed countries (in the US: $2.6b in 1989 vs $2.9b in 1999)
• Coke plans to invest $12b in Africa in next 10 years.
Cover story in Bloomberg Businessweek, Nov 1, 2010
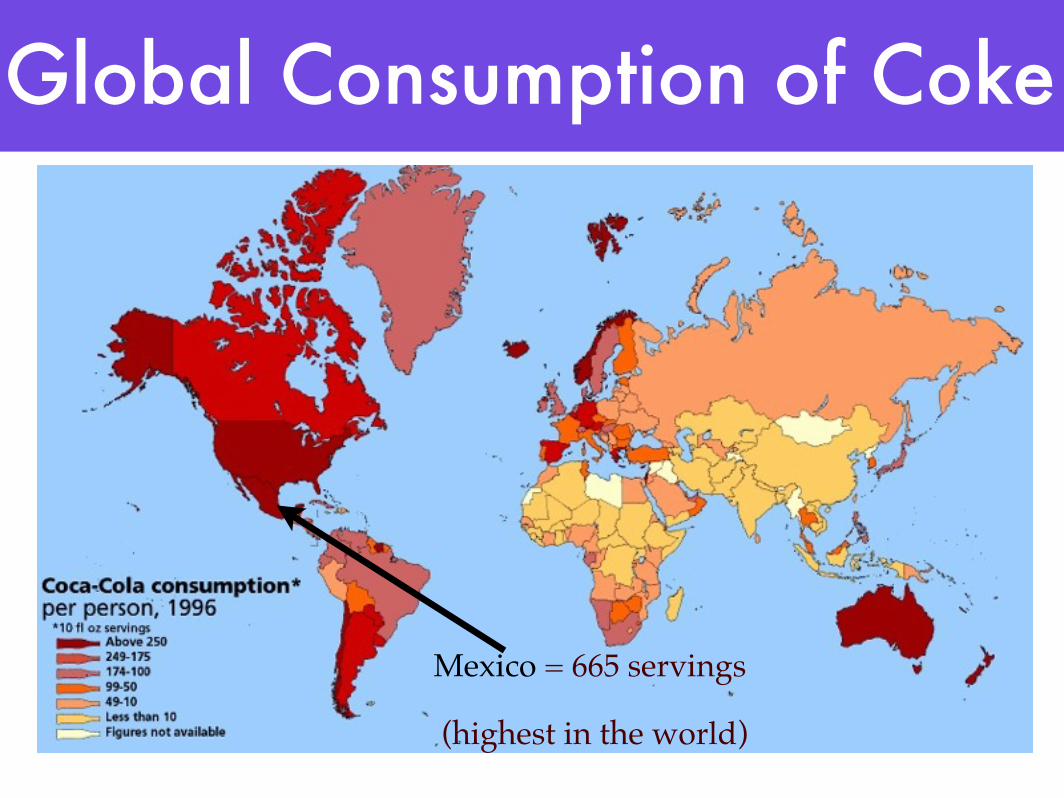
Global Consumption of Coke
Mexico = 665 servings
(highest in the world)

Hispanics:A “perfect storm” for Fatty Liver
1997 1998 1999 2000 2001 2002 2003 2004 2005 2006 2007 2008 2009 20100
200000
400000
600000
800000
1000000All US Exports US Exports to Mexico All Imports to Mexico
Year
Met
ric to
ns o
f HFC
S-55
and
abo
ve
high prevalence of GG Genotype
in PNPLA3
PNPLA3*sugar interaction
exponential increase in
HFCS export to Mexico
high sugar consumption:
Mexico has highest consumption of coca-
cola in the world
obesity
liver diseaseliver cancer
insulin resistancetype 2 diabetes

Simple Tips
• Avoid products with high fructose corn syrup• Replace sugary drinks with water or dilute juice with water (50:50)
• Avoid foods with >10g sugar per serving• Avoid flavored milk• Watch for “hidden” sugar which can be high in surprising products (eg yogurts, breads)
57

Summary• Sugar is a contributing factor to obesity and related outcomes
• Double-edged sword: effects of sugar on obesity and separate effects on metabolic outcomes like diabetes
• Not all sugars are equal in their health effects - fructose is more damaging because of the way it is metabolized
• Dietary fructose is increasing because of HFCS - fructose content of foods made with HFCS is higher than we think
• The more we tip the balance towards increasing fructose, the greater the metabolic problems (diabetes, gout, hypertension)

Hooman Allayee, USC
Krishna Nayak, PhD
Jaimie DavisAsst Prof USC
Marc WeigensbergAssoc Prof, USC
Ryan WalkerPhD Student
Tanya AlderetePhD Student
Acknowledgments

Funding:
NICHD (RO1 33064)NIDDK (RO1 59211)NCI (U54 116848)
NCMHD (P60 002564)ADA
Thrasher FoundationAtkins Foundation
www.GoranLab.com