the supernova remnant w49b as seen with h.e.s.s. and fermi
TRANSCRIPT

Astronomy & Astrophysics manuscript no. w49_hess_fermi_2016 c©ESO 2016September 5, 2016
The supernova remnant W49B as seen with H.E.S.S. and Fermi-LATH.E.S.S. Collaboration, H. Abdalla1, A. Abramowski2, F. Aharonian3, 4, 5, F. Ait Benkhali3, A.G. Akhperjanian†6, 5, T. Andersson10, E.O. Angüner7, M. Arrieta15,
P. Aubert24, M. Backes8, A. Balzer9, M. Barnard1, Y. Becherini10, J. Becker Tjus11, D. Berge12, S. Bernhard13, K. Bernlöhr3, R. Blackwell14, M. Böttcher1,C. Boisson15, J. Bolmont16, P. Bordas3, J. Bregeon17, F. Brun∗26, P. Brun18, M. Bryan9, T. Bulik19, M. Capasso29, J. Carr20, S. Casanova21, 3, M. Cerruti16,
N. Chakraborty3, R. Chalme-Calvet16, R.C.G. Chaves17, 22, A. Chen23, J. Chevalier24, M. Chrétien16, S. Colafrancesco23, G. Cologna25, B. Condon26,J. Conrad27, 28, Y. Cui29, I.D. Davids1, 8, J. Decock18, B. Degrange30, C. Deil3, J. Devin17, P. deWilt14, L. Dirson2, A. Djannati-Ataï31, W. Domainko3, A. Donath3,
L.O’C. Drury4, G. Dubus32, K. Dutson33, J. Dyks34, T. Edwards3, K. Egberts35, P. Eger3, J.-P. Ernenwein20, S. Eschbach36, C. Farnier27, 10, S. Fegan30,M.V. Fernandes2, A. Fiasson24, G. Fontaine30, A. Förster3, S. Funk36, M. Füßling37, S. Gabici31, M. Gajdus7, Y.A. Gallant17, T. Garrigoux1, G. Giavitto37,
B. Giebels30, J.F. Glicenstein18, D. Gottschall29, A. Goyal38, M.-H. Grondin26, D. Hadasch13, J. Hahn3, M. Haupt37, J. Hawkes14, G. Heinzelmann2, G. Henri32,G. Hermann3, O. Hervet15, 46, J.A. Hinton3, W. Hofmann3, C. Hoischen35, M. Holler30, D. Horns2, A. Ivascenko1, A. Jacholkowska16, M. Jamrozy38, M. Janiak34,
D. Jankowsky36, F. Jankowsky25, M. Jingo23, T. Jogler∗36, 43, L. Jouvin31, I. Jung-Richardt36, M.A. Kastendieck2, K. Katarzynski39, U. Katz36, D. Kerszberg16,B. Khélifi31, M. Kieffer16, J. King3, S. Klepser37, D. Klochkov29, W. Kluzniak34, D. Kolitzus13, Nu. Komin23, K. Kosack18, S. Krakau11, M. Kraus36, F. Krayzel24,P.P. Krüger1, H. Laffon26, G. Lamanna24, J. Lau14, J.-P. Lees24, J. Lefaucheur15, V. Lefranc18, A. Lemière31, M. Lemoine-Goumard∗26, J.-P. Lenain16, E. Leser35,T. Lohse7, M. Lorentz18, R. Liu3, R. López-Coto3, I. Lypova37, V. Marandon∗3, A. Marcowith17, C. Mariaud30, R. Marx3, G. Maurin24, N. Maxted14, M. Mayer7,
P.J. Meintjes40, M. Meyer27, A.M.W. Mitchell3, R. Moderski34, M. Mohamed25, L. Mohrmann36, K. Morå27, E. Moulin18, T. Murach7, M. de Naurois30,F. Niederwanger13, J. Niemiec21, L. Oakes7, P. O’Brien33, H. Odaka3, S. Öttl13, S. Ohm37, M. Ostrowski38, I. Oya37, M. Padovani17, M. Panter3, R.D. Parsons3,
N.W. Pekeur1, G. Pelletier32, C. Perennes16, P.-O. Petrucci32, B. Peyaud18, Q. Piel24, S. Pita31, H. Poon3, D. Prokhorov10, H. Prokoph10, G. Pühlhofer29,M. Punch31, 10, A. Quirrenbach25, S. Raab36, A. Reimer13, O. Reimer13, M. Renaud17, R. de los Reyes3, F. Rieger3, 41, C. Romoli4, S. Rosier-Lees24, G. Rowell14,
B. Rudak34, C.B. Rulten15, V. Sahakian6, 5, D. Salek42, D.A. Sanchez24, A. Santangelo29, M. Sasaki29, R. Schlickeiser11, F. Schüssler18, A. Schulz37,U. Schwanke7, S. Schwemmer25, M. Settimo16, A.S. Seyffert1, N. Shafi23, I. Shilon36, R. Simoni9, H. Sol15, F. Spanier1, G. Spengler27, F. Spies2, Ł. Stawarz38,R. Steenkamp8, C. Stegmann35, 37, F. Stinzing†36, K. Stycz37, I. Sushch1, J.-P. Tavernet16, T. Tavernier31, A.M. Taylor4, R. Terrier31, L. Tibaldo3, D. Tiziani36,
M. Tluczykont2, C. Trichard20, R. Tuffs3, Y. Uchiyama44, D.J. van der Walt1, C. van Eldik36, C. van Rensburg1, B. van Soelen40, G. Vasileiadis17, J. Veh36,C. Venter1, A. Viana3, P. Vincent16, J. Vink9, F. Voisin14, H.J. Völk3, T. Vuillaume24, Z. Wadiasingh1, S.J. Wagner25, P. Wagner7, R.M. Wagner27, R. White3,
A. Wierzcholska21, P. Willmann36, A. Wörnlein36, D. Wouters18, R. Yang3, V. Zabalza33, D. Zaborov30, M. Zacharias25, A.A. Zdziarski34, A. Zech15, F. Zefi30,A. Ziegler36, and N. Zywucka38
From Fermi-LAT Collaboration, J. Katsuta∗45
(Affiliations can be found after the references)
ABSTRACT
The supernova remnant (SNR) W49B originated from a core-collapse supernova that occurred between one and four thousand yearsago, and subsequently evolved into a mixed-morphology remnant, which is interacting with molecular clouds (MC). γ-ray observa-tions of SNR/MC associations are a powerful tool to constrain the origin of Galactic cosmic-rays, as they can probe the accelerationof hadrons through their interaction with the surrounding medium and subsequent emission of non-thermal photons. The detection ofa γ-ray source coincident with W49B at very high energies (VHE; E > 100 GeV) with the H.E.S.S. Cherenkov telescopes is reportedtogether with a study of the source with 5 years of Fermi-LAT high energy γ-ray (0.06 – 300 GeV) data. The smoothly-connectedcombined source spectrum, measured from 60 MeV to multi-TeV energies, shows two significant spectral breaks at 304 ± 20 MeVand 8.4+2.2
−2.5 GeV, the latter being constrained by the joint fit from the two instruments. The detected spectral features are similar tothose observed in several other SNR/MC associations and are found to be indicative of γ-ray emission produced through neutral-piondecay.
Key words. γ-rays: general – ISM: supernova remnants – ISM: clouds
1. Introduction
The strong shocks associated with supernova remnants (SNRs)are very good candidates for accelerating hadronic Galactic cos-mic rays to at least 1015 eV through the diffusive shock acceler-ation mechanism (e.g. Drury 1983). The detection of very-highenergy γ-rays above 20 TeV in objects such as RX J1713.7-3946(Aharonian et al. 2006b) or RCW 86 (Aharonian et al. 2009)shows that these objects can accelerate particles up to at least100 TeV. However, whether the bulk of accelerated particles thatradiate in the high energy (HE; 0.1 < E < 100 GeV) and very-high energy (VHE; E > 100 GeV) γ-ray range is of leptonic orhadronic nature is still under debate (Blasi 2013).
Send offprint requests to: H.E.S.S. collaboration,e-mail: [email protected];∗ Corresponding authors† Deceased
A growing number of SNRs interacting with molecularclouds (SNR/MC) are being revealed in the GeV and TeV γ-raydomain. This includes W44 (Abdo et al. 2010b), W28 (Aharo-nian et al. 2008b; Abdo et al. 2010a), CTB 37A (Aharonian et al.2008a; Castro & Slane 2010) and IC 443 (Albert et al. 2007; Ac-ciari et al. 2009; Abdo et al. 2010c). Even though isolated SNRsare obviously cleaner laboratories to study cosmic-ray acceler-ation processes, SNR/MC associations are good candidates totest the presence of hadronic acceleration in SNRs, partly be-cause the HE and VHE γ-ray emissions from the decay of π0
mesons are expected to be strongly enhanced. The neutral pi-ons, produced when high energy protons (or nuclei) collide withinterstellar material, each decay into two γ rays with equal en-ergies in the pion’s rest-frame. This translates into a steep risebelow ∼200 MeV in the γ-ray spectral energy distribution (oftenreferred to as the “pion-decay bump”). This characteristic spec-tral feature has been recently detected at high energies for three
Article number, page 1 of 10
arX
iv:1
609.
0060
0v1
[as
tro-
ph.H
E]
2 S
ep 2
016
A&A proofs: manuscript no. w49_hess_fermi_2016
interacting SNRs: IC 443, W44 (Ackermann et al. 2013) andW51C (Jogler & Funk 2016). However, whether this feature isthe signature of the acceleration of freshly injected protons maybe questioned as re-acceleration of diffuse cosmic rays for a lim-ited time period is also possible (Uchiyama et al. 2010; Cardilloet al. 2016).
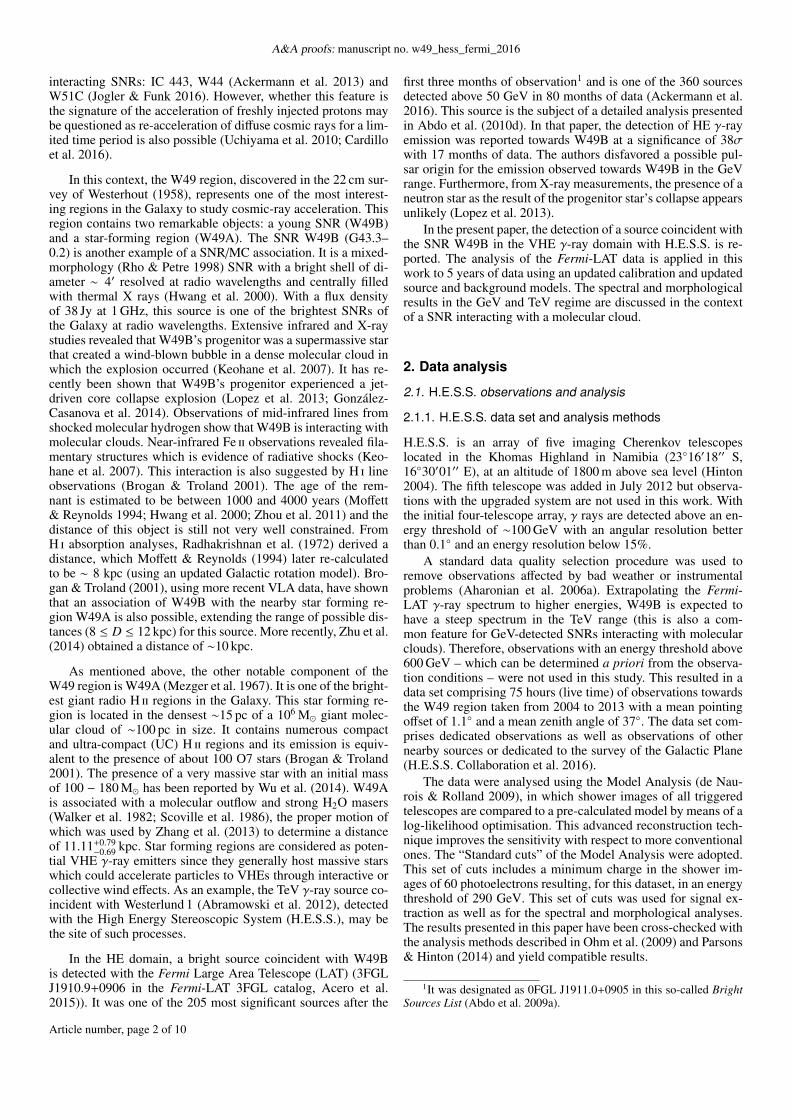
In this context, the W49 region, discovered in the 22 cm sur-vey of Westerhout (1958), represents one of the most interest-ing regions in the Galaxy to study cosmic-ray acceleration. Thisregion contains two remarkable objects: a young SNR (W49B)and a star-forming region (W49A). The SNR W49B (G43.3–0.2) is another example of a SNR/MC association. It is a mixed-morphology (Rho & Petre 1998) SNR with a bright shell of di-ameter ∼ 4′ resolved at radio wavelengths and centrally filledwith thermal X rays (Hwang et al. 2000). With a flux densityof 38 Jy at 1 GHz, this source is one of the brightest SNRs ofthe Galaxy at radio wavelengths. Extensive infrared and X-raystudies revealed that W49B’s progenitor was a supermassive starthat created a wind-blown bubble in a dense molecular cloud inwhich the explosion occurred (Keohane et al. 2007). It has re-cently been shown that W49B’s progenitor experienced a jet-driven core collapse explosion (Lopez et al. 2013; González-Casanova et al. 2014). Observations of mid-infrared lines fromshocked molecular hydrogen show that W49B is interacting withmolecular clouds. Near-infrared Fe ii observations revealed fila-mentary structures which is evidence of radiative shocks (Keo-hane et al. 2007). This interaction is also suggested by H i lineobservations (Brogan & Troland 2001). The age of the rem-nant is estimated to be between 1000 and 4000 years (Moffett& Reynolds 1994; Hwang et al. 2000; Zhou et al. 2011) and thedistance of this object is still not very well constrained. FromH i absorption analyses, Radhakrishnan et al. (1972) derived adistance, which Moffett & Reynolds (1994) later re-calculatedto be ∼ 8 kpc (using an updated Galactic rotation model). Bro-gan & Troland (2001), using more recent VLA data, have shownthat an association of W49B with the nearby star forming re-gion W49A is also possible, extending the range of possible dis-tances (8 ≤ D ≤ 12 kpc) for this source. More recently, Zhu et al.(2014) obtained a distance of ∼10 kpc.
As mentioned above, the other notable component of theW49 region is W49A (Mezger et al. 1967). It is one of the bright-est giant radio H ii regions in the Galaxy. This star forming re-gion is located in the densest ∼15 pc of a 106 M� giant molec-ular cloud of ∼100 pc in size. It contains numerous compactand ultra-compact (UC) H ii regions and its emission is equiv-alent to the presence of about 100 O7 stars (Brogan & Troland2001). The presence of a very massive star with an initial massof 100 − 180 M� has been reported by Wu et al. (2014). W49Ais associated with a molecular outflow and strong H2O masers(Walker et al. 1982; Scoville et al. 1986), the proper motion ofwhich was used by Zhang et al. (2013) to determine a distanceof 11.11+0.79
−0.69 kpc. Star forming regions are considered as poten-tial VHE γ-ray emitters since they generally host massive starswhich could accelerate particles to VHEs through interactive orcollective wind effects. As an example, the TeV γ-ray source co-incident with Westerlund 1 (Abramowski et al. 2012), detectedwith the High Energy Stereoscopic System (H.E.S.S.), may bethe site of such processes.
In the HE domain, a bright source coincident with W49Bis detected with the Fermi Large Area Telescope (LAT) (3FGLJ1910.9+0906 in the Fermi-LAT 3FGL catalog, Acero et al.2015)). It was one of the 205 most significant sources after the
first three months of observation1 and is one of the 360 sourcesdetected above 50 GeV in 80 months of data (Ackermann et al.2016). This source is the subject of a detailed analysis presentedin Abdo et al. (2010d). In that paper, the detection of HE γ-rayemission was reported towards W49B at a significance of 38σwith 17 months of data. The authors disfavored a possible pul-sar origin for the emission observed towards W49B in the GeVrange. Furthermore, from X-ray measurements, the presence of aneutron star as the result of the progenitor star’s collapse appearsunlikely (Lopez et al. 2013).
In the present paper, the detection of a source coincident withthe SNR W49B in the VHE γ-ray domain with H.E.S.S. is re-ported. The analysis of the Fermi-LAT data is applied in thiswork to 5 years of data using an updated calibration and updatedsource and background models. The spectral and morphologicalresults in the GeV and TeV regime are discussed in the contextof a SNR interacting with a molecular cloud.
2. Data analysis
2.1. H.E.S.S. observations and analysis
2.1.1. H.E.S.S. data set and analysis methods
H.E.S.S. is an array of five imaging Cherenkov telescopeslocated in the Khomas Highland in Namibia (23◦16′18′′ S,16◦30′01′′ E), at an altitude of 1800 m above sea level (Hinton2004). The fifth telescope was added in July 2012 but observa-tions with the upgraded system are not used in this work. Withthe initial four-telescope array, γ rays are detected above an en-ergy threshold of ∼100 GeV with an angular resolution betterthan 0.1◦ and an energy resolution below 15%.
A standard data quality selection procedure was used toremove observations affected by bad weather or instrumentalproblems (Aharonian et al. 2006a). Extrapolating the Fermi-LAT γ-ray spectrum to higher energies, W49B is expected tohave a steep spectrum in the TeV range (this is also a com-mon feature for GeV-detected SNRs interacting with molecularclouds). Therefore, observations with an energy threshold above600 GeV – which can be determined a priori from the observa-tion conditions – were not used in this study. This resulted in adata set comprising 75 hours (live time) of observations towardsthe W49 region taken from 2004 to 2013 with a mean pointingoffset of 1.1◦ and a mean zenith angle of 37◦. The data set com-prises dedicated observations as well as observations of othernearby sources or dedicated to the survey of the Galactic Plane(H.E.S.S. Collaboration et al. 2016).
The data were analysed using the Model Analysis (de Nau-rois & Rolland 2009), in which shower images of all triggeredtelescopes are compared to a pre-calculated model by means of alog-likelihood optimisation. This advanced reconstruction tech-nique improves the sensitivity with respect to more conventionalones. The “Standard cuts” of the Model Analysis were adopted.This set of cuts includes a minimum charge in the shower im-ages of 60 photoelectrons resulting, for this dataset, in an energythreshold of 290 GeV. This set of cuts was used for signal ex-traction as well as for the spectral and morphological analyses.The results presented in this paper have been cross-checked withthe analysis methods described in Ohm et al. (2009) and Parsons& Hinton (2014) and yield compatible results.
1It was designated as 0FGL J1911.0+0905 in this so-called BrightSources List (Abdo et al. 2009a).
Article number, page 2 of 10

The H.E.S.S. and Fermi-LAT Collaborations: W49B with H.E.S.S. and Fermi-LAT
2.1.2. H.E.S.S. analysis results
The signal was extracted from a circular region with a radius of0.1◦ around the position of W49B, taken inside the radio shell(at the position of the maximum of the emission in X-rays de-termined by Hwang et al. (2000)) : (` = 43.275◦, b = −0.190◦).From the correlated excess map, computed using the ring back-ground subtraction method (Berge et al. 2007) and displayed inFig. 1, a significant excess of VHE γ-rays is detected at the posi-tion of W49B, with a peak significance of 12.9σ (Eq. 17 of Li &Ma 1983). VHE γ-ray emission is observed towards W49A withthe primary analysis but it could not be confirmed (above 5σ)with the cross-check analysis. Therefore, only the VHE emis-sion coincident with W49B is discussed in the following.
In order to derive the source position at VHE andtherefore the best-suited spectral extraction region, the ex-cess map of VHE γ-rays towards the W49 region was fit-ted with a two-source model2. The VHE γ-ray emission to-wards W49B is found to be point-like with a best-fit positionof
(` = 43.260◦ ± 0.005◦stat, b = −0.190◦ ± 0.005◦stat
)with a sys-
tematic error of ±0.006◦ on each axis. As can be seen in Fig. 2,the obtained position is compatible with the center of the SNRobserved in radio and X-rays (e.g. Pye et al. 1984). This posi-tion corresponds to α2000 = 19h11m7.3s, δ2000 = 09◦05′37.0′′and the detected source is therefore given the identifier HESSJ1911+090.
Fig. 1. γ-ray excess map of the W49 region obtained with H.E.S.S. Themap is smoothed with a Gaussian of width 0.06◦, corresponding to the68% radius containment of the H.E.S.S. point spread function (PSF,shown in the inset). The black triangle denotes the position of the su-pernova remnant W49B (Green 2014). The white triangle denotes theposition of W49A (Lockman 1989).
The reflected background subtraction method (Berge et al.2007) was used at the best fit position to derive the spectrum of
2This is done in order to model the region in the best possible way,given the possible excess towards W49A which is ∼ 0.2◦ away fromW49B (a model with only one source for the fit leads to compatibleresults). The model is convolved with the H.E.S.S. point spread functionbefore being fit to the measured excess counts.
Fig. 2. Zoomed-in version of Fig. 1. The crosses show the best fit po-sitions of the source with H.E.S.S. (black) and Fermi-LAT (blue). Thesize of the crosses represents the size of the 95% Confidence Level (CL)contours on the best-fit positions, including systematic uncertainties.The white contours show the radio intensity obtained at a wavelengthof 20 cm with MAGPIS (Helfand et al. 2006).
the VHE emission coincident with W49B. From a region of ra-dius 0.1◦ around this position, the total number of counts is 1141,while 16017 events are used to estimate the background with anaverage normalisation factor α = 0.047. This corresponds to anexcess of 392.3 events detected with a significance of 13.0σ.The differential energy spectrum is derived above 290 GeV us-ing a forward folding method described in Piron et al. (2001).The data are well described (χ2/ndf = 60.6/61) by a power-law model dN/dE = Φ0 (E/1 TeV)−Γ with a flux normalisa-tion Φ0 =
(3.15 ± 0.46stat ± 0.63sys
)× 10−13 cm−2 s−1 TeV−1
and a spectral index of Γ = 3.14 ± 0.24stat ± 0.10sys (seeFig. 3). The integrated flux above 1 TeV is F(E > 1 TeV) =(1.47 ± 0.38stat ± 0.29sys
)× 10−13 cm−2 s−1, corresponding to
0.65% of the Crab Nebula flux above the same energy (Aha-ronian et al. 2006a). Two other spectral shapes were tested (logparabolic power-law and power-law with exponential cutoff) butthey do not fit the data significantly better.
2.2. Fermi-LAT analysis
2.2.1. Fermi-LAT observations and data reduction
The LAT detects γ-ray photons by conversion into electron-positron pairs in the energy range between 20 MeV to higherthan 300 GeV, as described by Atwood et al. (2009). It con-tains a high-resolution converter/tracker (for direction measure-ment of the incident γ rays), a CsI(Tl) crystal calorimeter (forenergy measurement), and an anti-coincidence detector to iden-tify the background of charged particles. The following analy-sis was performed using 5 years of Fermi-LAT data collectedprimarily in survey mode (2008 August 04 – 2013 August 04).This new dataset consists of Pass 7 LAT data that have been re-processed using updated calibration constants for the detectorsystems (Bregeon et al. 2013). The primary differences with re-
Article number, page 3 of 10

A&A proofs: manuscript no. w49_hess_fermi_2016
spect to the Pass7_V6 instrument response functions (IRFs) arethe correction of a slight (1% per year) expected degradation inthe calorimeter light yield and significant improvement of theposition from the calorimeter reconstruction, which in turn sig-nificantly improves the LAT point-spread function above 5 GeV.Only γ rays in the Source class events were selected, excludingthose coming from a zenith angle larger than 100◦ to the detectoraxis to reduce γ-ray contamination from protons interacting withthe Earth’s atmosphere. The 15th version of the reprocessed Pass7 IRFs for this class of events (P7REP_SOURCE_V15, Bregeonet al. 2013) were adopted.
Two different tools were used to perform the spatial andspectral analysis: gtlike and pointlike. gtlike is a binnedmaximum-likelihood method (Mattox et al. 1996) implementedin the Science Tools distributed by the Fermi Science Sup-port Center (FSSC)3. pointlike is an alternate binned like-lihood technique, optimized for characterizing the extensionof a source, something that is not implemented in gtlike.pointlike was extensively tested against gtlike (Lande et al.2012). These tools fit a source model to the data along withmodels for isotropic γ-ray emission that also accounts for theresidual charged particles and a diffuse γ-ray emission model.The obtained log likelihood is then compared between differ-ent source model assumptions to find an optimal description ofthe region. For quantitative evaluation between models, the test-statistic value (TS ) was defined as 2 log(L1/L0), where L1/0corresponds to the likelihood value for the source/no-source hy-pothesis (Mattox et al. 1996). The TS value is a measure of thedetection significance or description improvement.
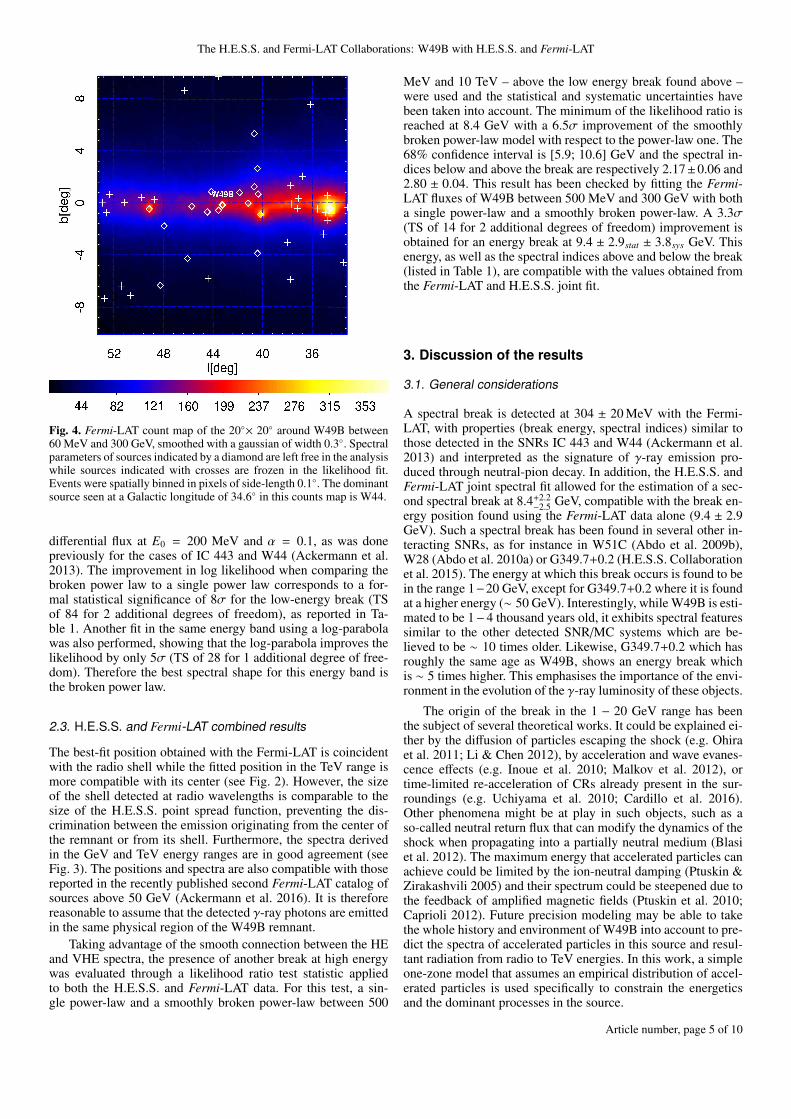
For this work, the Galactic diffuse emission modelgll_iem_v05_rev1.fits and isotropic diffuse modeliso_source_v05.txt provided by the Fermi-LAT collabora-tion were used4. A 20◦× 20◦ region of interest binned in 0.1◦bins and centered on the position of W49B, was defined. Sourceswithin 25◦ of W49B were extracted from the Fermi-LAT 3FGLcatalog (Acero et al. 2015) and included in the likelihood fit.The spectral parameters of sources closer than 5◦ to W49Bor with a TS larger than 400 were left free and shown withdiamonds in Fig. 4, while the parameters of all other sourceswere fixed at the values from the 3FGL catalog.
Two main systematic errors have been taken into account:imperfect modeling of the Galactic diffuse emission and uncer-tainties in the effective area calibration. The first was estimatedby comparing the results obtained using the standard Galacticdiffuse model with the results based on eight alternative inter-stellar emission models (IEMs) as performed in de Palma et al.(2013). We note that the alternative IEMs do not necessarilybracket the standard IEM but provide a good insight into de-viations from fit results obtained by the standard IEM expecteddue to variations in the IEM. Comparing results between anal-yses performed using the standard and alternative IEMs is cur-rently the best method to estimate systematic uncertainties re-lated to the IEM modeling. The second major systematic uncer-tainty was estimated by using modified IRFs whose effective ar-eas bracket the nominal ones. These bracketing IRFs are definedby envelopes above and below the nominal energy dependenceof the effective area by linearly connecting differences of (10%,5%, 5%, 15%) at log10(E/MeV) of (2, 2.5, 4, 6), respectively5.
3More information about the performance of the LAT can be foundat the FSSC (http : //fermi.gsfc.nasa.gov/ssc).
4These models are available at:http://fermi.gsfc.nasa.gov/ssc/data/access/lat/BackgroundModels.html
5http://fermi.gsfc.nasa.gov/ssc/data/analysis/LAT_caveats.html
Energy (GeV) 1
10 1 102
103
104
10
]1
s2
.F [
erg
cm
2E
1410
1310
1210
1110
1010
Fig. 3. Fermi-LAT and H.E.S.S. spectrum of W49B. The red line showsthe best fit of a smoothly broken power-law derived between 60 MeVand 4 GeV and the blue data points indicate the fluxes measured ineach energy bin with the Fermi-LAT. The statistical errors are shownin blue, while the red lines take into account both the statistical andsystematic errors as discussed in Sect. 2.2.2. The gray band shows the68% confidence level (CL) uncertainty of the best-fit power-law modelwith H.E.S.S. The open black circles are the spectral points computedfrom the forward-folding fit with their statistical errors shown in black.For both instruments, a 95% CL upper limit is computed when the sta-tistical significance is lower than 2σ. The dotted green line shows thebest smoothly broken power-law model obtained from the joint fit ofthe Fermi-LAT and H.E.S.S. data between 500 MeV and 10 TeV, asdescribed in Sect. 2.3.
2.2.2. Fermi-LAT analysis results
The spatial analysis was performed using all events above 1 GeV,thus providing a good compromise between statistics and angu-lar resolution. The source position, determined by pointlikeis (` = 43.251◦, b = −0.157◦) with a statistical uncertainty of0.015◦ (95% CL), compatible with the radio shell of W49B (seeFig. 2). At this position, the TS value above 1 GeV is 1504. Nosignificant extension was found with pointlike.
The spectral analysis was then performed with gtlike in-cluding all events between 0.06 and 300 GeV. Here the best fitpoint-source position for W49B obtained by pointlike wasused in the log likelihood fit. Figure 3 shows the spectral energydistribution obtained for W49B through the maximum likelihoodestimation. To derive the flux points, the 0.06 – 300 GeV rangewas divided into 20 logarithmically-spaced energy bins and amaximum likelihood spectral analysis was performed in each in-terval, assuming a power-law shape with a fixed spectral index ofΓ = 2 for W49B. The normalizations of the diffuse Galactic andisotropic emission were left free in each energy bin as well asthose of sources located within 5◦ from W49B. A 95% CL up-per limit is computed when the statistical significance is lowerthan 2σ. At the highest energies, bins containing no significantsignal were combined to compute a meaningful upper limit. Theerrors on the spectral points represent the statistical and system-atic uncertainties added in quadrature.
The spectrum below 300 MeV is steeply rising, clearly ex-hibiting a break at around 300 MeV. To quantify the signifi-cance of this spectral break, a log likelihood fit of W49B be-tween 60 MeV and 4 GeV was performed – below the high-energy break previously found in the 1-year spectra (Abdo et al.2010d) – with both a single power law of the form F(E) =Φ0(E/E0)−Γ1 and a smoothly broken power law of the formF(E) = Φ0(E/E0)−Γ1 (1 + (E/Ebr)(Γ2−Γ1)/α)−α where Φ0 is the
Article number, page 4 of 10
The H.E.S.S. and Fermi-LAT Collaborations: W49B with H.E.S.S. and Fermi-LAT
Fig. 4. Fermi-LAT count map of the 20◦× 20◦ around W49B between60 MeV and 300 GeV, smoothed with a gaussian of width 0.3◦. Spectralparameters of sources indicated by a diamond are left free in the analysiswhile sources indicated with crosses are frozen in the likelihood fit.Events were spatially binned in pixels of side-length 0.1◦. The dominantsource seen at a Galactic longitude of 34.6◦ in this counts map is W44.
differential flux at E0 = 200 MeV and α = 0.1, as was donepreviously for the cases of IC 443 and W44 (Ackermann et al.2013). The improvement in log likelihood when comparing thebroken power law to a single power law corresponds to a for-mal statistical significance of 8σ for the low-energy break (TSof 84 for 2 additional degrees of freedom), as reported in Ta-ble 1. Another fit in the same energy band using a log-parabolawas also performed, showing that the log-parabola improves thelikelihood by only 5σ (TS of 28 for 1 additional degree of free-dom). Therefore the best spectral shape for this energy band isthe broken power law.
2.3. H.E.S.S. and Fermi-LAT combined results
The best-fit position obtained with the Fermi-LAT is coincidentwith the radio shell while the fitted position in the TeV range ismore compatible with its center (see Fig. 2). However, the sizeof the shell detected at radio wavelengths is comparable to thesize of the H.E.S.S. point spread function, preventing the dis-crimination between the emission originating from the center ofthe remnant or from its shell. Furthermore, the spectra derivedin the GeV and TeV energy ranges are in good agreement (seeFig. 3). The positions and spectra are also compatible with thosereported in the recently published second Fermi-LAT catalog ofsources above 50 GeV (Ackermann et al. 2016). It is thereforereasonable to assume that the detected γ-ray photons are emittedin the same physical region of the W49B remnant.
Taking advantage of the smooth connection between the HEand VHE spectra, the presence of another break at high energywas evaluated through a likelihood ratio test statistic appliedto both the H.E.S.S. and Fermi-LAT data. For this test, a sin-gle power-law and a smoothly broken power-law between 500
MeV and 10 TeV – above the low energy break found above –were used and the statistical and systematic uncertainties havebeen taken into account. The minimum of the likelihood ratio isreached at 8.4 GeV with a 6.5σ improvement of the smoothlybroken power-law model with respect to the power-law one. The68% confidence interval is [5.9; 10.6] GeV and the spectral in-dices below and above the break are respectively 2.17±0.06 and2.80 ± 0.04. This result has been checked by fitting the Fermi-LAT fluxes of W49B between 500 MeV and 300 GeV with botha single power-law and a smoothly broken power-law. A 3.3σ(TS of 14 for 2 additional degrees of freedom) improvement isobtained for an energy break at 9.4 ± 2.9stat ± 3.8sys GeV. Thisenergy, as well as the spectral indices above and below the break(listed in Table 1), are compatible with the values obtained fromthe Fermi-LAT and H.E.S.S. joint fit.
3. Discussion of the results
3.1. General considerations
A spectral break is detected at 304 ± 20 MeV with the Fermi-LAT, with properties (break energy, spectral indices) similar tothose detected in the SNRs IC 443 and W44 (Ackermann et al.2013) and interpreted as the signature of γ-ray emission pro-duced through neutral-pion decay. In addition, the H.E.S.S. andFermi-LAT joint spectral fit allowed for the estimation of a sec-ond spectral break at 8.4+2.2
−2.5 GeV, compatible with the break en-ergy position found using the Fermi-LAT data alone (9.4 ± 2.9GeV). Such a spectral break has been found in several other in-teracting SNRs, as for instance in W51C (Abdo et al. 2009b),W28 (Abdo et al. 2010a) or G349.7+0.2 (H.E.S.S. Collaborationet al. 2015). The energy at which this break occurs is found to bein the range 1−20 GeV, except for G349.7+0.2 where it is foundat a higher energy (∼ 50 GeV). Interestingly, while W49B is esti-mated to be 1−4 thousand years old, it exhibits spectral featuressimilar to the other detected SNR/MC systems which are be-lieved to be ∼ 10 times older. Likewise, G349.7+0.2 which hasroughly the same age as W49B, shows an energy break whichis ∼ 5 times higher. This emphasises the importance of the envi-ronment in the evolution of the γ-ray luminosity of these objects.
The origin of the break in the 1 − 20 GeV range has beenthe subject of several theoretical works. It could be explained ei-ther by the diffusion of particles escaping the shock (e.g. Ohiraet al. 2011; Li & Chen 2012), by acceleration and wave evanes-cence effects (e.g. Inoue et al. 2010; Malkov et al. 2012), ortime-limited re-acceleration of CRs already present in the sur-roundings (e.g. Uchiyama et al. 2010; Cardillo et al. 2016).Other phenomena might be at play in such objects, such as aso-called neutral return flux that can modify the dynamics of theshock when propagating into a partially neutral medium (Blasiet al. 2012). The maximum energy that accelerated particles canachieve could be limited by the ion-neutral damping (Ptuskin &Zirakashvili 2005) and their spectrum could be steepened due tothe feedback of amplified magnetic fields (Ptuskin et al. 2010;Caprioli 2012). Future precision modeling may be able to takethe whole history and environment of W49B into account to pre-dict the spectra of accelerated particles in this source and resul-tant radiation from radio to TeV energies. In this work, a simpleone-zone model that assumes an empirical distribution of accel-erated particles is used specifically to constrain the energeticsand the dominant processes in the source.
Article number, page 5 of 10

A&A proofs: manuscript no. w49_hess_fermi_2016
Table 1. Spectral parameters in the energy ranges of 60 MeV – 4 GeV and 500 MeV – 300 GeV for power-law (PL) and smoothly broken power-law (SBPL) models, using Fermi-LAT data and 290 GeV – 10 TeV with H.E.S.S. Systematic errors are provided in parentheses. The referenceenergy for which the Φ0 is given is 1 TeV for H.E.S.S. and 200 MeV for Fermi-LAT and the combined spectrum results. The last column indicatesthe source TS as described in section 2.2.
Model Φ0 Γ1 Γ2 Ebr Source TS
Fermi-LAT:60 MeV – 4 GeV: (10−10cm−2 s−1 MeV−1) (MeV)PL 6.2 ± 0.3 2.07 ± 0.04 · · · · · · 906SBPL 3.3 ± 0.5 (±0.6) 0.10 ± 0.30 (±0.28) 2.21 ± 0.05 (±0.06) 304 ± 20 (±10) 990
500 MeV – 300 GeV: (10−10cm−2 s−1 MeV−1) (GeV)PL 10.4 ± 0.8 2.32 ± 0.03 · · · · · · 1570SBPL 8.2 ± 1.2 (±2.3) 2.20 ± 0.06 (±0.16) 2.89 ± 0.23 (±0.15) 9.4 ± 2.9 (±3.8) 1584
H.E.S.S.:>290 GeV: (10−13cm−2 s−1 TeV−1)PL 3.15 ± 0.46 (±0.63) 3.14 ± 0.24 (±0.10) · · · · · ·
Fermi-LAT & H.E.S.S.:500 MeV – 10 TeV: (10−10cm−2 s−1 MeV−1) (GeV)SBPL 7.5 ± 1.2 2.17 ± 0.06 2.80 ± 0.04 8.4+2.2
−2.5
3.2. Molecular gas density estimates
In order to use appropriate values for the modeling, the mass anddensity of the molecular gas inside a spherical volume of radius0.025◦, consistent with that of the radio SNR radius, were esti-mated using the Galactic Ring Survey 13CO data (Jackson et al.2006). For the three velocity ranges (1-15, 38-47 and 57-67 km/sat their kinematic distances of 11, 9.3 and 5 kpc respectively)examined by Zhu et al. (2014) (see also Chen et al. (2014)), andusing the 13CO “X-factor” of 4.92×10²⁰ (K km/s)−1 from Simonet al. (2001), masses of 5 × 10³ to 17 × 103 M� with densities of400 to 4 000 cm−3 were obtained. Allowing for a larger radiusto the outer edge of the radio SNR features (0.05◦) reduces themolecular gas densities by a factor ∼ 2 to 3.
One can note that Chen et al. (2014) and Zhu et al. (2014)have argued that the CO bubble in the 38-47 km/s range wasblown out by the W49B progenitor star, suggesting a distanceof about 10 kpc for the SNR. Additionally for this, and the 57-67 km/s ranges, the H2 column densities (about 5 × 1022 cm−2)inferred in this work are consistent with that derived from theX-ray spectral studies of Keohane et al. (2007).
3.3. High-Energy Particles in W49B
The observed γ-ray emission is most likely to originate fromSNR W49B, as discussed in Abdo et al. (2010d). In this sec-tion, the properties of the relativistic particles that radiate at γ-ray energies are investigated. Given the smooth connection ofthe observed Fermi-LAT and H.E.S.S. spectra (see Fig. 3), itis assumed that the γ-ray photons are emitted in the same re-gion. In addition, the observed radio emission (e.g. Moffett &Reynolds 1994) is assumed to come from the same shell re-gion where a constant hydrogen density nH and magnetic fieldstrength B are considered. Given the evidences that W49B inter-acts with the surrounding molecular clouds (e.g., Keohane et al.
2007; Zhu et al. 2014), we consider a scenario where the γ-rayemission comes from the shocked molecular clouds in the SNRshell. Note that the emitting region may originate from swept-upstellar wind and/or interstellar gas as discussed in Abdo et al.(2010d). However, adopting such a scenario would not signifi-cantly change the spectra calculated in this section.
The γ-ray emission is reproduced using the (relatively) sim-ple model described in Abdo et al. (2009b). Empirical injectiondistributions of protons and electrons are assumed:
Qe,p(p) = ae,p
(pp0
)−s 1 +
(p
pbr
)2−∆s/2
, (1)
where p0 = 1 GeV c−1, pbr is the break momentum, s is thespectral index below pbr and ∆s is the difference between thespectral indices values below and above pbr. The kinetic equationfor the momentum distribution of high-energy particles in theshell can be written as:
∂Ne,p
∂t=
∂
∂p(be,pNe,p) + Qe,p, (2)
where be,p = −dp/dt is the momentum loss rate (only the radia-tive losses – synchrotron, inverse-Compton, bremsstrahlung andneutral pion decay – were considered), and Qe,p(p) (assumed tobe time-independent) is the particle injection rate. To obtain theradiation spectrum from the remnant, Ne,p(p,T0) is numericallycalculated for T0 = 2000 yr.
The γ-ray emission mechanisms include the π0-decay γrays due to high-energy protons, bremsstrahlung and inverse-Compton scattering processes by high-energy electrons. The ra-dio emission is calculated by considering the synchrotron radi-ation from the population of high-energy electrons. To repro-duce the multi-wavelength spectra, two cases for the relativistic
Article number, page 6 of 10

The H.E.S.S. and Fermi-LAT Collaborations: W49B with H.E.S.S. and Fermi-LAT
electrons to protons number ratio (Kep ≡ ae/ap) were consid-ered, Kep = 0.01 and Kep = 1. The value of 0.01 is similar towhat is locally observed for cosmic rays at GeV energies (e.g.,Beischer et al. 2009) whereas Kep = 1 corresponds to an up-per limit of the ratio that is most likely too high for realisticapplications due to the faster cooling of the electrons comparedto protons. In the calculation, the same indices and break mo-menta for both the electrons and the protons were chosen. Giventhat the radio synchrotron index α = 0.48 (Moffett & Reynolds1994) corresponds to s ∼ 2, three values for s were consid-ered: 1.8, 2.0, and 2.2. The observed γ-ray spectra are calcu-lated by adjusting spectral parameters of the relativistic particles:the normalization, the break momentum pbr, and ∆s. The mag-netic field B is then determined to explain the observed radiodata. Only thermal X-rays, which are not useful in constrainingthe non-thermal electron population energy distribution, are ob-served from the SNR (Hwang et al. 2000). In the energy range1–10 keV, our model synchrotron X-ray predictions would beat least one order of magnitude below the measured thermal X-ray values; thus no constraining limits exist in this part of thespectrum. Two conservative cases of 100 cm−3 and 1000 cm−3
for the ambient medium density nH were considered (see Sec.3.2). The seed photons for inverse-Compton scattering processesinclude infrared (kTIR = 3 × 10⁻³ eV, UIR = 0.7 eV cm−3), opti-cal (kTopt = 0.3 eV, Uopt = 0.8 eV cm−3), and the CMB. Thesevalues were taken to match the axisymmetric estimates of theGALPROP code at the assumed distance of W49B (Porter et al.2008, and references therein). For a more precise modeling, ded-icated analysis of the infrared and optical emission around thesource should be performed. The derived parameters and spectraare shown in Tables 2 and 3, and Figs. 5 and 6.
Table 2. Parameters for the hadronic scenario
Model nH s ∆s pbr B Wp(cm−3) (GeV c−1) (µG) (1049 erg)
(a1) 100 1.8 1.0 15 100 12(a2) 100 2.0 0.8 30 100 11(a3) 100 2.2 0.7 100 90 12(a4) 1000 1.8 1.0 15 500 1.1(a5) 1000 2.0 0.8 30 500 1.1(a6) 1000 2.2 0.7 100 400 1.1
Notes. Kep is set to 0.01. The total kinetic energies (Ekin) of the radi-ating particles (We,p) are calculated for Ekin > 100 MeV at an assumeddistance of 10 kpc.
In the case of Kep = 0.01 (the hadronic scenario), the ob-tained γ-ray spectrum is dominated by the π0-decay emissiondue to the relativistic protons as shown in Fig. 5. The observedspectra can be formally explained in all the cases except for thecase (a4) where the reproduced synchrotron spectrum seems alittle harder than the observed radio data. The rather high valuesderived for the magnetic field of models (a4–6) are needed toexplain the radio data. This is due to the fact that Kep is fixed to0.01, allowing for higher values of Kep would imply higher totalkinetic energies for the electrons and lower magnetic field valueswould be needed to explain the radio data.
Note that the reproduced spectral shape is independent ofthe value of nH, as long as the range is set to reasonable values(nH ∼ 100–1000 cm−3).
In the case of Kep = 1 (the leptonic scenario), the obtainedγ rays are dominated by the bremsstrahlung emission due to therelativistic electrons as shown in Fig. 6. The figure shows that
Table 3. Parameters for the leptonic scenario
Model nH s ∆s pbr B We(cm−3) (GeV c−1) (µG) (1049 erg)
(b1) 100 1.8 1.1 7 22 1.6(b2) 100 2.0 0.9 10 25 1.6(b3) 100 2.2 0.8 30 22 2.0(b4) 1000 1.8 0.9 7 100 0.16(b5) 1000 2.0 0.7 10 100 0.16(b6) 1000 2.2 0.5 15 90 0.19
Notes. Same as Table 2 except for Kep, which is set to 1.
s . 1.8 is required to explain the LAT data below ∼ 300 MeV.The synchrotron radiation loss modifies the reproduced spectraat the & TeV range; its break momentum of the electrons are16 TeV c−1 and 0.6 TeV c−1 for B of 20 µG (corresponding to thecases (b1–3)) and 100 µG (corresponding to the cases (b4–6))respectively. On the other hand, the spectral shape does not sig-nificantly change in the energy band below the break.
As discussed in Sect. 2.2, the LAT data show a clear spec-tral break at 304 ± 20 MeV. Given the systematic errors of thedata, both the hadronic and the leptonic scenarios can explainthis spectral shape. In the leptonic scenario, however, a limitto the spectral index of s . 1.8 must be set to reproduce sucha sharp break. On the other hand, the hadronic scenario cannaturally explain the break by the π0-decay bump irrespectiveof the spectral index. The obtained B-field values in Table 2and 3 are significantly larger than typical interstellar values. Tosome extent, these values correspond to those expected in a MC(Crutcher et al. 2010). They are also consistent with predictionsof magnetic field amplification from cosmic-ray-excited turbu-lence (Bell 2004; Zirakashvili et al. 2008). The values adopted inthis modeling are set to reasonable values and different assump-tions for the parameters (age, distance, nH, Kep) would slightlychange the quantitative results of the modeling (derived mag-netic field or energy values) but would not change these conclu-sions.
4. Conclusions
A source of very-high energy γ rays is detected towards the su-pernova remnant W49B with H.E.S.S. and a joint study is con-ducted together with the analysis of 5 years of Fermi-LAT datatowards the source. The point spread functions of these instru-ments are comparable to the physical size of the SNR and donot allow for detailed morphology studies. However, the signif-icantly increased data set compared to previous publications al-lowed for the derivation of the γ-ray spectrum of the source be-tween 60 MeV and a few TeV. Two spectral breaks could beidentified in the γ-ray spectrum: one at 304 MeV and the otherat 8.4 GeV. The latter, constrained from a joint fit of the Fermi-LAT and H.E.S.S. data, is similar to the spectral breaks observedin other supernova remnants interacting with molecular cloudsand further supports the evidence of interaction observed in otherwavelengths for this object. The broad band spectrum of W49Bcould be explained either by leptonic or hadronic models. How-ever, the sharp break detected with the Fermi-LAT data at 304MeV seems to favor a hadronic origin of the γ-ray emission sincethe leptonic models would require an even harder spectrum forthe electron population than the ones tested in this work whichwould fail to explain the radio observations.
Article number, page 7 of 10

A&A proofs: manuscript no. w49_hess_fermi_2016
In the near future, W49B as well as the nearby star formingregion W49A will be of particular interest to study at VHE withimproved analysis methods and with the next generation of in-struments such as the Cherenkov Telescope Array. Observationsor analyses of the W49 region with improved angular resolutionand higher sensitivity would help to constrain the morphologyand the origin of the emission towards W49B and possibly con-firm the hint of emission towards W49A. Furthermore, if oneassumes that the distances to W49A and W49B are comparable,then the observed difference between the γ-ray luminosities ofthe two sources would become especially interesting. It wouldimply that in the absence of recognizable supernova remnants –as in W49A – the other possible energetic particle sources likethe shocks expected from interacting or collective stellar windsappear not very effective for HE and VHE γ-ray emission in thiscase. Therefore, a truly reliable distance determination for thesesources (see Sect. 1) would be of great astrophysical importance.Acknowledgements. The support of the Namibian authorities and of the Uni-versity of Namibia in facilitating the construction and operation of H.E.S.S. isgratefully acknowledged, as is the support by the German Ministry for Edu-cation and Research (BMBF), the Max Planck Society, the German ResearchFoundation (DFG), the French Ministry for Research, the CNRS-IN2P3 and theAstroparticle Interdisciplinary Programme of the CNRS, the U.K. Science andTechnology Facilities Council (STFC), the IPNP of the Charles University, theCzech Science Foundation, the Polish Ministry of Science and Higher Educa-tion, the South African Department of Science and Technology and NationalResearch Foundation, the University of Namibia, the Innsbruck University, theAustrian Science Fund (FWF), and the Autrian Federal Ministry for Science,Research and Economy, and by the University of Adelaide and the AustralianResearch Council. We appreciate the excellent work of the technical supportstaff in Berlin, Durham, Hamburg, Heidelberg, Palaiseau, Paris, Saclay, and inNamibia in the construction and operation of the equipment. This work bene-fited from services provided by the H.E.S.S. Virtual Organisation, supported bythe national resource providers of the EGI Federation.
The Fermi LAT Collaboration acknowledges generous ongoing supportfrom a number of agencies and institutes that have supported both the devel-opment and the operation of the LAT as well as scientific data analysis. Theseinclude the National Aeronautics and Space Administration and the Departmentof Energy in the United States, the Commissariat à l’Energie Atomique and theCentre National de la Recherche Scientifique / Institut National de Physique Nu-cléaire et de Physique des Particules in France, the Agenzia Spaziale Italianaand the Istituto Nazionale di Fisica Nucleare in Italy, the Ministry of Education,Culture, Sports, Science and Technology (MEXT), High Energy Accelerator Re-search Organization (KEK) and Japan Aerospace Exploration Agency (JAXA) inJapan, and the K. A. Wallenberg Foundation, the Swedish Research Council andthe Swedish National Space Board in Sweden.Additional support for science analysis during the operations phase is gratefullyacknowledged from the Istituto Nazionale di Astrofisica in Italy and the CentreNational d’Études Spatiales in France.
This publication makes use of molecular line data from the BostonUniversity-FCRAO Galactic Ring Survey (GRS). The GRS is a joint projectof Boston University and Five College Radio Astronomy Observatory, fundedby the National Science Foundation under grants AST-9800334, AST-0098562,AST-0100793, AST-0228993 & AST-0507657.
ReferencesAbdo, A. A., Ackermann, M., Ajello, M., et al. 2010a, ApJ, 718, 348Abdo, A. A., Ackermann, M., Ajello, M., et al. 2009a, ApJS, 183, 46Abdo, A. A., Ackermann, M., Ajello, M., et al. 2009b, ApJ, 706, L1Abdo, A. A., Ackermann, M., Ajello, M., et al. 2010b, Science, 327, 1103Abdo, A. A., Ackermann, M., Ajello, M., et al. 2010c, ApJ, 712, 459Abdo, A. A., Ackermann, M., Ajello, M., et al. 2010d, ApJ, 722, 1303Abramowski, A., Acero, F., Aharonian, F., et al. 2012, A&A, 537, A114Acciari, V. A., Aliu, E., Arlen, T., et al. 2009, ApJ, 698, L133Acero, F., Ackermann, M., Ajello, M., et al. 2015, ApJS, 218, 23Ackermann, M., Ajello, M., Allafort, A., et al. 2013, Science, 339, 807Ackermann, M., Ajello, M., Atwood, W. B., et al. 2016, ApJS, 222, 5Aharonian, F., Akhperjanian, A. G., Barres de Almeida, U., et al. 2008a, A&A,
490, 685Aharonian, F., Akhperjanian, A. G., Bazer-Bachi, A. R., et al. 2008b, A&A, 481,
401
Aharonian, F., Akhperjanian, A. G., Bazer-Bachi, A. R., et al. 2006a, A&A, 457,899
Aharonian, F., Akhperjanian, A. G., Bazer-Bachi, A. R., et al. 2006b, A&A, 449,223
Aharonian, F., Akhperjanian, A. G., de Almeida, U. B., et al. 2009, ApJ, 692,1500
Albert, J., Aliu, E., Anderhub, H., et al. 2007, ApJ, 664, L87Atwood, W. B., Abdo, A. A., Ackermann, M., et al. 2009, ApJ, 697, 1071Beischer, B. et al. 2009, New J. Phys., 11, 105021Bell, A. R. 2004, MNRAS, 353, 550Berge, D., Funk, S., & Hinton, J. 2007, A&A, 466, 1219Blasi, P. 2013, A&A Rev., 21, 70Blasi, P., Morlino, G., Bandiera, R., Amato, E., & Caprioli, D. 2012, ApJ, 755,
121Bregeon, J., Charles, E., & M. Wood for the Fermi-LAT Collaboration. 2013,
2012 Fermi Symposium Proceedings [arXiv:1304.5456]Brogan, C. L. & Troland, T. H. 2001, ApJ, 550, 799Caprioli, D. 2012, J. Cosmology Astropart. Phys., 7, 038Cardillo, M., Amato, E., & Blasi, P. 2016, ArXiv e-prints [arXiv:1604.02321]Castro, D. & Slane, P. 2010, ApJ, 717, 372Chen, Y., Jiang, B., Zhou, P., et al. 2014, in IAU Symposium, Vol. 296, IAU
Symposium, ed. A. Ray & R. A. McCray, 170–177Crutcher, R. M., Wandelt, B., Heiles, C., Falgarone, E., & Troland, T. H. 2010,
ApJ, 725, 466de Naurois, M. & Rolland, L. 2009, Astroparticle Physics, 32, 231de Palma, F., Brandt, T. J., Johannesson, G., Tibaldo, L., & for the
Fermi-LAT Collaboration. 2013, 2012 Fermi Symposium Proceedings[arXiv:1304.1395]
Drury, L. O. 1983, Reports on Progress in Physics, 46, 973González-Casanova, D. F., De Colle, F., Ramirez-Ruiz, E., & Lopez, L. A. 2014,
ApJ, 781, L26Green, D. A. 2014, Bulletin of the Astronomical Society of India, 42, 47Helfand, D. J., Becker, R. H., White, R. L., Fallon, A., & Tuttle, S. 2006, AJ,
131, 2525H.E.S.S. Collaboration, Abdalla, H., Abramowski, A., et al. 2016, A&A, forth-
comingH.E.S.S. Collaboration, Abramowski, A., Aharonian, F., et al. 2015, A&A, 574,
A100Hinton, J. A. 2004, New A Rev., 48, 331Hwang, U., Petre, R., & Hughes, J. P. 2000, ApJ, 532, 970Inoue, T., Yamazaki, R., & Inutsuka, S.-i. 2010, ApJ, 723, L108Jackson, J. M., Rathborne, J. M., Shah, R. Y., et al. 2006, ApJS, 163, 145Jogler, T. & Funk, S. 2016, ApJ, 816, 100Keohane, J. W., Reach, W. T., Rho, J., & Jarrett, T. H. 2007, ApJ, 654, 938Lande, J., Ackermann, M., Allafort, A., et al. 2012, ApJ, 756, 5Li, H. & Chen, Y. 2012, MNRAS, 421, 935Li, T.-P. & Ma, Y.-Q. 1983, ApJ, 272, 317Lockman, F. J. 1989, ApJS, 71, 469Lopez, L. A., Ramirez-Ruiz, E., Castro, D., & Pearson, S. 2013, ApJ, 764, 50Malkov, M. A., Diamond, P. H., & Sagdeev, R. Z. 2012, Physics of Plasmas, 19,
082901Mattox, J. R., Bertsch, D. L., Chiang, J., et al. 1996, ApJ, 461, 396Mezger, P. G., Schraml, J., & Terzian, Y. 1967, ApJ, 150, 807Moffett, D. A. & Reynolds, S. P. 1994, ApJ, 437, 705Ohira, Y., Murase, K., & Yamazaki, R. 2011, MNRAS, 410, 1577Ohm, S., van Eldik, C., & Egberts, K. 2009, Astroparticle Physics, 31, 383Parsons, R. D. & Hinton, J. A. 2014, Astroparticle Physics, 56, 26Piron, F., Djannati-Atai, A., Punch, M., et al. 2001, A&A, 374, 895Porter, T. A., Moskalenko, I. V., Strong, A. W., Orlando, E., & Bouchet, L. 2008,
ApJ, 682, 400Ptuskin, V., Zirakashvili, V., & Seo, E.-S. 2010, ApJ, 718, 31Ptuskin, V. S. & Zirakashvili, V. N. 2005, A&A, 429, 755Pye, J. P., Becker, R. H., Seward, F. D., & Thomas, N. 1984, MNRAS, 207, 649Radhakrishnan, V., Goss, W. M., Murray, J. D., & Brooks, J. W. 1972, ApJS, 24,
49Rho, J. & Petre, R. 1998, ApJ, 503, L167+Scoville, N. Z., Sargent, A. I., Sanders, D. B., et al. 1986, ApJ, 303, 416Simon, R., Jackson, J. M., Clemens, D. P., Bania, T. M., & Heyer, M. H. 2001,
ApJ, 551, 747Uchiyama, Y., Blandford, R. D., Funk, S., Tajima, H., & Tanaka, T. 2010, ApJ,
723, L122Walker, R. C., Matsakis, D. N., & Garcia-Barreto, J. A. 1982, ApJ, 255, 128Westerhout, G. 1958, Bull. Astron. Inst. Netherlands, 14, 215Wu, S.-W., Bik, A., Henning, T., et al. 2014, A&A, 568, L13Zhang, B., Reid, M. J., Menten, K. M., et al. 2013, ApJ, 775, 79Zhou, X., Miceli, M., Bocchino, F., Orlando, S., & Chen, Y. 2011, MNRAS, 415,
244Zhu, H., Tian, W. W., & Zuo, P. 2014, ApJ, 793, 95Zirakashvili, V. N., Ptuskin, V. S., & Völk, H. J. 2008, ApJ, 678, 255
Article number, page 8 of 10

The H.E.S.S. and Fermi-LAT Collaborations: W49B with H.E.S.S. and Fermi-LAT
1 Centre for Space Research, North-West University, Potchefstroom2520, South Africa
2 Universität Hamburg, Institut für Experimentalphysik, LuruperChaussee 149, D 22761 Hamburg, Germany
3 Max-Planck-Institut für Kernphysik, P.O. Box 103980, D 69029Heidelberg, Germany
4 Dublin Institute for Advanced Studies, 31 Fitzwilliam Place, Dublin2, Ireland
5 National Academy of Sciences of the Republic of Armenia, Mar-shall Baghramian Avenue, 24, 0019 Yerevan, Republic of Armenia
6 Yerevan Physics Institute, 2 Alikhanian Brothers St., 375036 Yere-van, Armenia
7 Institut für Physik, Humboldt-Universität zu Berlin, Newtonstr. 15,D 12489 Berlin, Germany
8 University of Namibia, Department of Physics, Private Bag 13301,Windhoek, Namibia
9 GRAPPA, Anton Pannekoek Institute for Astronomy, University ofAmsterdam, Science Park 904, 1098 XH Amsterdam, The Nether-lands
10 Department of Physics and Electrical Engineering, Linnaeus Uni-versity, 351 95 Växjö, Sweden
11 Institut für Theoretische Physik, Lehrstuhl IV: Weltraum und Astro-physik, Ruhr-Universität Bochum, D 44780 Bochum, Germany
12 GRAPPA, Anton Pannekoek Institute for Astronomy and Institute ofHigh-Energy Physics, University of Amsterdam, Science Park 904,1098 XH Amsterdam, The Netherlands
13 Institut für Astro- und Teilchenphysik, Leopold-Franzens-Universität Innsbruck, A-6020 Innsbruck, Austria
14 School of Physical Sciences, University of Adelaide, Adelaide 5005,Australia
15 LUTH, Observatoire de Paris, PSL Research University, CNRS,Université Paris Diderot, 5 Place Jules Janssen, 92190 Meudon,France
16 Sorbonne Universités, UPMC Université Paris 06, Université ParisDiderot, Sorbonne Paris Cité, CNRS, Laboratoire de Physique Nu-cléaire et de Hautes Energies (LPNHE), 4 place Jussieu, F-75252,Paris Cedex 5, France
17 Laboratoire Univers et Particules de Montpellier, Université Mont-pellier, CNRS/IN2P3, CC 72, Place Eugène Bataillon, F-34095Montpellier Cedex 5, France
18 DSM/Irfu, CEA Saclay, F-91191 Gif-Sur-Yvette Cedex, France19 Astronomical Observatory, The University of Warsaw, Al. Ujaz-
dowskie 4, 00-478 Warsaw, Poland20 Aix Marseille Université, CNRS/IN2P3, CPPM UMR 7346, 13288
Marseille, France21 Instytut Fizyki Jadrowej PAN, ul. Radzikowskiego 152, 31-342
Kraków, Poland22 Funded by EU FP7 Marie Curie, grant agreement No. PIEF-GA-
2012-332350,23 School of Physics, University of the Witwatersrand, 1 Jan Smuts
Avenue, Braamfontein, Johannesburg, 2050 South Africa24 Laboratoire d’Annecy-le-Vieux de Physique des Particules, Univer-
sité Savoie Mont-Blanc, CNRS/IN2P3, F-74941 Annecy-le-Vieux,France
25 Landessternwarte, Universität Heidelberg, Königstuhl, D 69117Heidelberg, Germany
26 Université Bordeaux, CNRS/IN2P3, Centre d’Études Nucléaires deBordeaux Gradignan, 33175 Gradignan, France
27 Oskar Klein Centre, Department of Physics, Stockholm University,Albanova University Center, SE-10691 Stockholm, Sweden
28 Wallenberg Academy Fellow,29 Institut für Astronomie und Astrophysik, Universität Tübingen,
Sand 1, D 72076 Tübingen, Germany30 Laboratoire Leprince-Ringuet, Ecole Polytechnique, CNRS/IN2P3,
F-91128 Palaiseau, France31 APC, AstroParticule et Cosmologie, Université Paris Diderot,
CNRS/IN2P3, CEA/Irfu, Observatoire de Paris, Sorbonne Paris
Cité, 10, rue Alice Domon et Léonie Duquet, 75205 Paris Cedex13, France
32 Univ. Grenoble Alpes, IPAG, F-38000 Grenoble, FranceCNRS, IPAG, F-38000 Grenoble, France
33 Department of Physics and Astronomy, The University of Leicester,University Road, Leicester, LE1 7RH, United Kingdom
34 Nicolaus Copernicus Astronomical Center, ul. Bartycka 18, 00-716Warsaw, Poland
35 Institut für Physik und Astronomie, Universität Potsdam, Karl-Liebknecht-Strasse 24/25, D 14476 Potsdam, Germany
36 Friedrich-Alexander-Universität Erlangen-Nürnberg, Erlangen Cen-tre for Astroparticle Physics, Erwin-Rommel-Str. 1, D 91058 Erlan-gen, Germany
37 DESY, D-15738 Zeuthen, Germany38 Obserwatorium Astronomiczne, Uniwersytet Jagiellonski, ul. Orla
171, 30-244 Kraków, Poland39 Centre for Astronomy, Faculty of Physics, Astronomy and Informat-
ics, Nicolaus Copernicus University, Grudziadzka 5, 87-100 Torun,Poland
40 Department of Physics, University of the Free State, PO Box 339,Bloemfontein 9300, South Africa
41 Heisenberg Fellow (DFG), ITA Universität Heidelberg, Germany42 GRAPPA, Institute of High-Energy Physics, University of Amster-
dam, Science Park 904, 1098 XH Amsterdam, The Netherlands43 W. W. Hansen Experimental Physics Laboratory, Kavli Institute for
Particle Astrophysics and Cosmology, Department of Physics andSLAC National Accelerator Laboratory, Stanford University, Stan-ford, CA 94305, USA
44 Department of Physics, Rikkyo University, 3-34-1 Nishi-Ikebukuro,Toshima-ku, Tokyo 171-8501, Japan
45 Department of Physical Sciences, Hiroshima University, Higashi-Hiroshima, Hiroshima 739-8526, Japan
46 Now at Santa Cruz Institute for Particle Physics and Departmentof Physics, University of California at Santa Cruz, Santa Cruz, CA95064, USA
Article number, page 9 of 10

A&A proofs: manuscript no. w49_hess_fermi_2016
10-14
10-13
10-12
10-11
10-10
nH = 100 cm � 3
10-7
10-5
10-3
10-1
101
103
105
107
109
1011
1013
E [eV]
10-14
10-13
10-12
10-11
10-10
nH = 1000 cm � 3
E2
dN
/dE
[e
rg c
m
�
2s
�
1]
Fig. 5. SEDs of W49B with model curves for the hadronic-dominant scenario. The upper and the lower panels show (a1–3) and (a4–6) respectively(see Table 2). The red diamonds, red circles, and magenta squares represent observed data in the radio (Moffett & Reynolds 1994), LAT, andH.E.S.S. bands respectively. The radio emission is explained by the synchrotron radiation from the relativistic electrons. The γ-ray emission canbe decomposed into π0-decay (dotted line), bremsstrahlung (dashed line), and IC scattering (dot-dashed line). The solid line represents the totalflux of the components. The cases (a1)/(a4), (a2)/(a5), and (a3)/(a6) are represented by cyan, blue, and green lines respectively in the upper/lowerpanel. The decomposed emissions are shown for the cases (a2) and (a5) in the upper and the lower panels respectively.
10-14
10-13
10-12
10-11
10-10
nH = 100 cm � 3
10-7
10-5
10-3
10-1
101
103
105
107
109
1011
1013
E [eV]
10-14
10-13
10-12
10-11
10-10
nH = 1000 cm � 3
E2
dN
/dE
[e
rg c
m
�
2s
�
1]
Fig. 6. Same as Fig. 5 but for the leptonic-dominant scenario. The upper and the lower panels show reproduced spectra of (b1–3) and (b4–6) respectively (see Table 3). The cases (b1)/(b4), (b2)/(b5), and (b3)/(b6) are represented by cyan, blue, and green lines respectively in theupper/lower panel. The decomposed emission is shown for the cases (b2) and (b5) in the upper and the lower panels respectively.
Article number, page 10 of 10