the supplemental nutrition assistance program (snap): an
TRANSCRIPT

The Supplemental Nutrition Assistance Program (SNAP): An analysis of changing
political climates, welfare policies, and their subsequent impacts on immigrants and
their families in San Diego, California
A Thesis Presented to The Faculty of Architecture and Planning COLUMBIA UNIVERSITY
In Partial Fulfillment of the Requirements for the Degree Master of Science in Urban Planning
By Cheryl Lim Jia Ru
May 2019
Advisor Moira O’Neill
Reader Andrea Rizvi
Abstract
This study examines the current political climate's effect on perceptions revolving around the
SNAP (Supplemental Nutrition Assistance Program), also known as CalFresh, among immigrant
groups located in San Diego County, California. Through a review of background information,
primary source analysis (qualitative semi-structured interviews with officials, non-profit
organization leaders and employees) and analysis of existing secondary research (nationwide and
California-specific SNAP enrollment numbers), this study examines how the hostility and
changing policies around welfare policy and SNAP impacts immigrant groups and their
willingness to enroll in the program. It also examines the historical circumstances that affect
perceptions towards the SNAP program today. This research provides planners with an
understanding of the additional difficulties that immigrant groups face that can help aid and
inform food policy and other related decisions with economic development, our built
environment and social equity.
Key words: food insecurity, immigrants, political climates, food policy, welfare
!1

“When people were hungry, Jesus didn’t say,“Now is that political, or social?”
He said, “I feed you.”
- Desmond Tutu
!2
Acknowledgements
At the start of the Trump administration in early 2017, I was an intern at Feeding America
in San Diego. During my time conducting CalFresh outreach, I witnessed first-hand the trauma
and fear that the current administration has on immigrants, both documented and undocumented.
I watched helplessly as families quite literally ran from me as I approached them and refuse their
rightful benefits because of the crippling fear that they could not stay in America, a place they
feel has so much promise and opportunity that they are willing to go hungry for it. What does it
say about America, when politicians and the individuals in places of power are not fighting for
people’s rights to access food but trying their hardest to take food away? The concept of
immigration will never cease to be a source of debate, but as a society and as individuals, we are
morally obligated to treat each other as humanely as possible.
I would like to thank my advisor, Moira O’Neill, for her guidance throughout this
process. I would also like to thank my reader, Andrea Rizvi for her support. I would like to thank
my interview participants who took an interest in my research and graciously shared their insight
and knowledge with me. I would also like to thank my undergraduate professor, Dr. Mirle
Rabinowitz-Bussell, for her advice and support throughout both my undergraduate and graduate
careers. I would also like to thank Professor Keith Pezzoli for his support connecting me to
various organizations.
To my classmates — you inspire me everyday. To my closest friends and Celine — thank
you for being my pillars of strength. Lastly, Mom & Dad — thank you for your unending support
and love, and for working hard to ensure that I have the opportunity to pursue my dreams.
!3
Table of Contents
1. Introduction 9
2. Background Areas 9
2.1 Background 10
2.2 SNAP Eligibility (Federal) 10
2.2.1 SNAP Eligibility (California) 11
2.3 A Brief History of Welfare in America 13
2.4 Immigrants, Food Access and Cultural Dimensions 16
2.4.1 Types of Immigrants 18
2.5 The Dehumanization of Immigrants and Its Effects 19
2.6 CalFresh in California 20
2.6.1 California SNAP Enrollment 21
2.6.2 San Diego SNAP Enrollment 23
2.6.3 The “Chilling Effect” Population in California 26
2.6.4 San Diego County Agency Hostility 28
2.6.5 Overview of Policies and Bills 30
3. Research Question 36
4. Hypothesis 36
5. Research Methodology 36
5.1 Overview of Methodology 36
5.2 Quantitative Research 37
5.3 Qualitative Research 37
6. Limitations 37
7. Implications to Planning 38
8. Existing Secondary Source Analysis 40
8.1 Annual SNAP Enrollment Nationwide 40
8.2 Immigrant Participants in the SNAP Program 43
9. Findings: Qualitative Data 44
9.1 Interviews 44
!4
9.2.1 Finding 1 45
9.2.2 Finding 2 47
9.2.3 Finding 3 48
9.2.4 Finding 4 49
9.2.5 Finding 5 50
9.2.6 Finding 6 50
9.2.7 Finding 7 51
9.2.8 Finding 8 52
9.2.9 Finding 9 52
9.3 Finding 10 53
9.3.1 Finding 11 54
10. Discussion 57
10.1 Deportability as a Crucial Condition 59
10.2 Immigrant Struggles and the Media 60
11. Conclusions 61
12. Appendices 66
12.1 Appendix A 66
12.2 Appendix B 67
12.3 Appendix C 69
13. References 70
!5
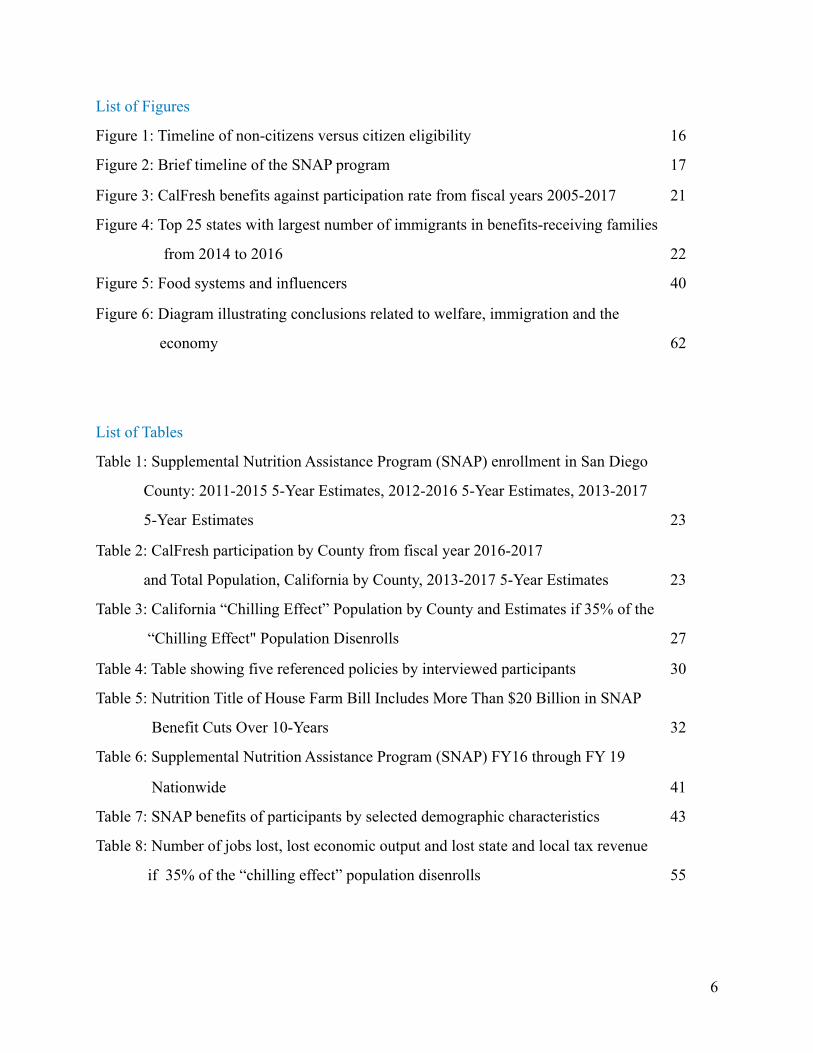
List of Figures
Figure 1: Timeline of non-citizens versus citizen eligibility 16
Figure 2: Brief timeline of the SNAP program 17
Figure 3: CalFresh benefits against participation rate from fiscal years 2005-2017 21
Figure 4: Top 25 states with largest number of immigrants in benefits-receiving families
from 2014 to 2016 22
Figure 5: Food systems and influencers 40
Figure 6: Diagram illustrating conclusions related to welfare, immigration and the
economy 62
List of Tables
Table 1: Supplemental Nutrition Assistance Program (SNAP) enrollment in San Diego
County: 2011-2015 5-Year Estimates, 2012-2016 5-Year Estimates, 2013-2017
5-Year Estimates 23
Table 2: CalFresh participation by County from fiscal year 2016-2017
and Total Population, California by County, 2013-2017 5-Year Estimates 23
Table 3: California “Chilling Effect” Population by County and Estimates if 35% of the
“Chilling Effect" Population Disenrolls 27
Table 4: Table showing five referenced policies by interviewed participants 30
Table 5: Nutrition Title of House Farm Bill Includes More Than $20 Billion in SNAP
Benefit Cuts Over 10-Years 32
Table 6: Supplemental Nutrition Assistance Program (SNAP) FY16 through FY 19
Nationwide 41
Table 7: SNAP benefits of participants by selected demographic characteristics 43
Table 8: Number of jobs lost, lost economic output and lost state and local tax revenue
if 35% of the “chilling effect” population disenrolls 55
!6

List of Abbreviations and Definitions
ABAWD: Able-Bodied Adults Without Dependents
ACLU: American Civil Liberties Union
ACS: American Community Survey
AFDC: Aid to Families with Dependent Children
APA: American Planning Association
CalFresh: Term for the Supplemental Nutrition Assistance Program in the State of California
CBP: Customs and Border Patrol
CHIS: California Health Interview Survey
CPS: Current Population Survey
DACA: Deferred Action for Childhood Arrivals
DHS: United States Department of Homeland Security
FNS: Food and Nutrition Service
HHSA: San Diego County’s Health and Human Services Agency
HR: House of Representatives Bill
PRWORA: Personal Responsibility and Work Opportunity Reconciliation Act
SB: Senate Bill
SNAP: Supplemental Nutrition Assistance Program
SPIN: Supportive Parents Information Network
SSI: Supplemental Security Income
TANF: Temporary Assistance for Needy Families
USCIS: United States Department of Citizenship and Immigration Services
USDA: United States Department of Agriculture
!7

A Note
During my interview with an interview participant, the participant made a request. The
participant wanted to ensure that the immigrants that I wrote about would not be portrayed as
victims. The participant focused this around the term “vulnerable population,” noting the
inherent bias and victim-placing that occurs when terms like this are used to describe the group
as a whole. In my thesis, I aim, to the best of my ability, to write in a manner that describes the
immigrant population in the most dignified way possible.
!8
1. Introduction
Immigrant populations have long struggled with food security. Their reliance on the
Supplemental Nutrition Assistance Program (SNAP) to supplement food supplies due to low-
income has given American governments significant leverage over them. This research study
provides an in-depth examination into the political factors that affect perceptions in the
immigrant community in San Diego around the SNAP program and enrollment numbers.
2. Background Areas
This background research encompasses the history of welfare policy and SNAP policy.
This historical research provides context that will inform analysis.
The following relevant bills, presentations and reports conducted by external organizations were
also used to inform this study and are outlined in this section:
1. Senate Bill 285 (SB-285), Senator Scott Wiener, CA-D
2. House of Representatives Bill 1368 (H.R. 1368), Senator Alma Adams, NC-D
3. Hunger & The Safety Net in San Diego County: A Participatory Action Research Report
conducted by Supportive Parents Information Network (SPIN), January 2010
4. How Proposed Changes to the “Public Charge Rule Will Affect Health, Hunger and the
Economy in California”, Presentation, UCLA Center for Health Policy Research, December
2018
5. Chilling Effects: The Expected Public Charge Rule and Its Impact on Legal Immigrant
Families’ Public Benefits Use Report, Migrant Policy Institute, June 2018
!9

2.1 Background
At the 1996 World Food Summit, food security was defined as being attained “when all
people, at all times, have physical and economic access to sufficient, safe and nutritious food to
meet their dietary needs and food preferences for an active and healthy life” (Moffat,
Mohammed and Newbold 15). According to the United States Department of Agriculture, 51%
of all households in the United States have experienced food insecurity at least once over a 5-
year period (USDA). People who are food insecure live below the poverty line and often rely on
food stamp benefits to supplement their incomes. The food stamp program was renamed the
Supplemental Nutritional Assistance Program (also known as SNAP throughout the United
States and CalFresh in California) in 2008 (East 203). Feeding America estimates that only 41%
of the households being served by their network benefit from SNAP benefits (Feeding America).
However, more than 88% of the network they serve are income eligible (Feeding America). This
presents a very clear gap — many of the families participating in their meal programs and food
bank services are eligible but yet do not participate in these programs (Feeding America).
2.2 SNAP Eligibility (Federal)
Although eligibility requirements vary by state, the basic federal requirement states that
the SNAP program is limited to people with gross incomes of up to 130% of the federal poverty
line (Feeding America). For the fiscal year 2018, the gross monthly income eligibility limits for
the 48 states not including Alaska and Hawaii was $1,307 monthly for a household size of 1,
$1,760 for a household size of 2 and $2,213 for a household size of 3 (USDA, Appendix B).
Some allowable deductions (which vary by state) include dependent care deductions, medical
!10

expenses for elderly or disabled members, legally owed child support payments and standard
shelter deductions for homeless households (USDA). After these deductions, net monthly income
eligibility limits for the fiscal year 2018 for the 48 states not including Alaska and Hawaii was
$1,005 monthly for a household size of 1, $1,354 for a household size of 2 and $1,702 for a
household size of 3 (USDA, Appendix B). For the fiscal year 2019, the gross monthly income
eligibility standards did not vary much. For the 48 states not including Alaska and Hawaii, the
income limit is $1,316 for a household of 1, $1,784 for a household of 2 and $2,252 for a
household of 3. The net monthly income limit is $1,012 for a household of 1, $1,372 for a
household of 2 and $1,732 for a household of 3 (USDA).
2.2.1 SNAP Eligibility (California)
California residents, in addition to being subject to the rules of the federal SNAP
program, qualify for the program based on the following CalFresh rules include 1. being a
resident of the county the applicant applies or benefits in 2. having a Social Security number 3.
income less than or equal to 200% of the federal poverty level and 4. work rules applying to
able-bodied adults without dependents (San Diego County Health & Human Services Agency).
California’s income limits differ from most federal income limits, with the requirement bing less
than or equal to 200% of the federal poverty level instead of 130%. For the fiscal year 2019, the
gross monthly income limit for CalFresh is $2,024 for a household of 1, $2,744 for a household
of 2 and $3,464 for a household of 3 (San Diego Health & Human Services Agency, Appendix
C).
!11

Nationwide, only United States citizens and lawfully present non-citizens can receive
benefits. Examples of non-citizens eligible for benefits with no waiting period include refugees,
victims of trafficking, asylees and lawful permanent residents with a military connection
(USDA). Non-citizen groups that qualify only after a waiting period include 1. a lawful
permanent resident (LPR) credited with 40 quarters of work or aliens that have been in the
following status for 5 years: 1. paroled for at least one year, 2. battered spouse, child or parent or
3. granted conditional entry (USDA).
Most lawful immigrants can only be considered for SNAP benefits after a period of
waiting. This waiting period itself already presents significant financial hurdles for immigrants
who have just entered the country — most of whom work low-wage, entry-level jobs. These
immigrant groups face many difficulties during the assimilation process. Issues include
difficulties “catching up” due to language and communication barriers, difficulties assimilating
to the school system, securing work and housing, cultural barriers and accessing services like
medical care and legal guidance (Waters and Jiménez 108). Many are also unwilling to seek
formal food assistance, and opt to participate in more informal food assistance programs like
food banks or meal programs, which are easier to obtain because they does not require extensive
documentation and administrative paperwork. In 1994, Proposition 187 was approved by
California voters and supported by then-governor Pete Wilson. This proposition would have
denied health care, education and welfare benefits to all illegal aliens, and was ruled as
unconstitutional by judge Mariana Pfaelzer in 1998 in response to the ACLU’s suit against the
proposition (ACLU). Although this proposition targeted removing benefits from illegal
!12
immigrants, it had rippling effects within the immigrant community, and the effects of it are still
being seen today.
Today, scores of immigrants are taking themselves and their families off benefit systems
despite having a right to obtain them, fearful that they will be considered a ‘public charge’ and be
denied legal permanent status (USDA 2015, USDA 2016, USDA 2017).
2.3 A Brief History of Welfare in America
Welfare programs in the United States emerged in the 1930s out of sheer necessity. The
Great Depression left millions out of work. Up until then, it was understood that if a man had a
solid work ethic, he would be able to provide for himself (Constitutional Rights Foundation).
President Roosevelt signed the Social Security Act, thus beginning a federal responsibility to
provide welfare for the American people (Edin and Shaefer 7). Since then, the welfare benefits
system has grown to include programs like Aid to Families with Dependent Children (AFDC),
Temporary Assistance for Needy Families (TANF), Aid to Dependent Children (ADC) and the
Supplemental Nutritional Assistance Program (SNAP) (Edin and Shaefer 7,11,15).
There is a broad history of welfare programs in the United States, but this research will
focus specifically on the Supplemental Nutritional Assistance Program. The idea for a food
stamp program began with the 11th Secretary of Agriculture, Henry Wallace, and the program’s
first administrator and economic expert, Milo Perkins (USDA). For the first four years of the
program, it reached 20 million people and cost the United States government a total of $262
million. The pilot program eventually ended in the spring of 1943 due to more favorable
economic conditions and the elimination of “widespread unemployment” (USDA). The program
!13
was halted for 21 years, until January of 1964 when President Johnson requested that Congress
approve legislation to “make the food stamp program permanent” (USDA). The food stamp
program was not nationally implemented for 10 years, until 1974. President Bill Clinton fulfilled
his campaign promise in 1996 to conduct welfare reform, and signed the Personal Responsibility
and Work Opportunity Reconciliation Act (PRWORA) — a comprehensive bipartisan welfare
reform plan - into law. This made immigrants entering the USA ineligible for federal welfare
funds for 5 years. This act downsized the welfare program in America from 13 million to 3
million, but the drastic reforms severely affected groups like immigrants and criminals, who
found it harder to re-enter society. A brief timeline of the history of the SNAP program is
illustrated in figure 2 on page 17.
Currently, American citizens, legally present immigrants and citizen children of non-
citizens are eligible for SNAP benefits (USDA). Eligibility requirements focus mainly around
household income. The program intends to allow households to maintain an “adequate level” of
nutrition. It assumes that each household will spend 30% of their total household income on food
(East 203). People who are not eligible for SNAP benefits in California include undocumented
immigrants and full-time students (although special circumstances apply). At the time of this
research study, Supplemental Security Income (SSI) participants were not eligible for SNAP
(San Diego Health and Human Services Agency). Select groups of SSI recipients will be able to
receive SNAP benefits beginning in the summer of 2019 (California Department of Social
Services).
Historically, Americans’ concern with welfare was not “about welfare” itself, “but rather
about the terms in which aid was given” (Edin and Shaefer 19). Americans believe in welfare,
!14

but also believe in working and the productive use of welfare by supplementing any income that
is earned. The American people were concerned that dependents on the program were too reliant
on it and used it as a means of survival rather than as a supplementation of their income. When
the Clinton administration took office, President Clinton addressed the issue in Congress,
explaining that he had plans to “offer the people on welfare...education, training, healthcare” that
was pertinent to them “getting back on their feet,” but provided a time limit of “2 years” (Edin
and Shaefer 20). His vision was to “end welfare as a way of life” and “make it a path to
independence and dignity” (Edin and Shaefer 21).
In 1996, welfare reform created the first eligibility differentiation between citizen groups
and non-citizen groups (East 205). The Personal Responsibility and Work Opportunity
Reconciliation Act (PRWORA), made documented non-citizens ineligible for the program for the
first 5 years after their arrival into the United States (East 205). However, states could choose to
use their own funding to provide benefits to these groups who were now excluded, and nine
states including California chose to do so. These were called “fill-in” states, and these states did
so until 2003 after the Farm Bill signed into law in 2002 restored eligibility to these immigrants
(H.R. 2646, 2001-2002 and East 206). This is illustrated in figure 1.
An example of negative attitudes towards welfare manifested during Mayor Giuliani’s
administration in New York City beginning in 1994. Towns were overtly given the task of
“preventing poor New Yorkers from obtaining food stamps” (Dickinson 270). Welfare workers
refused to give applicants application forms, “cut off…[benefits] to needy families who were still
eligible for them” and “sent hungry people to food pantries” instead of providing them with
resources to apply for SNAP benefits. In order to receive benefits, people were made to
!15

participate in workfare programs that punished the unemployed by making them work for the
benefits, often in humiliating social conditions (Dickinson 270). Beyond the meaning of country
citizenship, this regime “commodified labor,” “stratified the poor further,” and “redrew the terms
of economic citizenship” for the poor (Dickinson 270). Americans have, for many decades,
doubted welfare programs and their recipients due to the perception that receiving benefits
“discourages work” (Banerjee, Hanna, Kreindler & Olken 155).
2.4 Immigrants, Food Access and Cultural Dimensions
Eating and the availability of such food represents a unique identity for immigrants.
Immigrants who do not have access to benefits that will enable them to buy food to satisfy their
!16
Figure 1: Timeline of Non-Citizens versus Citizen Eligibility (East 205)

most basic necessities will less likely purchase culturally specific foods. Ethno-cultural identity
is tied to food and methods of eating (Moffat, Mohammed and Newbold 15). Beyond basic
sustenance, being able to consume culturally specific foods is a way of life. When familiar foods
are not accessible, ethnocultural identity can be destabilized. It is important for immigrant
communities to have the means to purchase culturally specific food items (Moffat, Mohammed
and Newbold 15).
Immigrants have also reported feeling a sense of food nostalgia, as memories of food
from the past represents a “previous cultural identity” that may now be lost (Moffat, Mohammed
and Newbold 15). This ties to the broader theme of immigrants and their difficulties assimilating
to their host countries. Many immigrant communities maintain a strong desire to maintain
familial and community networks, utilizing food as the main mechanism to do so (Moffat,
Mohammed and Newbold 15). Maintaining a strong cultural identity related to food “helps with
dietary habits” (Moffat, Mohammed and Newbold 16). Traditional foods can alleviate stress and
loneliness that immigrants may feel, especially during the adaptation period following a move to
a new country (Moffat, Mohammed and Newbold 24). Such foods can restore positive emotional
states and provide a source of comfort related to feeling at home. If they are unable to access
such food, it hinders their ability to assimilate comfortably to their host country.
!17
Figure 2: Brief Timeline of the SNAP Program (USDA)

Immigrants are presented with new issues as they navigate a new and unfamiliar food
system (Moffat, Mohammed and Newbold 16). Immigrants reported the top reasons affecting
food access included low income, difficulties shopping and understanding food labels (tied also
to language accessibility), high food prices and difficulties obtaining high-paying jobs.
Immigrants have knowledge of healthy food and how they want to prepare food, but “require
more financial assistance to access this food especially within the first five years of
arrival” (Moffat, Mohammed and Newbold 23, 24). Beneficiaries of programs like SNAP are
able to access food that will allow for a more comfortable transition to life outside of their home
countries and alleviate the stresses that they have to face related to food culture.
2.4.1 Types of Immigrants
In a study comparing the Latino immigrant community, Asian immigrant community, and
U.S. born Caucasian community residing in California, researchers found that food insecurity
differs between ethnic groups, and within ethnic groups by immigration status (Walsemann, Gee
and Ro 142). There are defined three types of immigrants: 1. naturalized citizens 2. legal
permanent residents and 3. non-legal permanent residents (students, temporary workers,
undocumented immigrants and refugees) (Walsemann, Gee and Ro 142). Differences in the
extent in food insecurity are not only seen between immigrant groups and non-immigrant groups
— complexities and differences also exist between the different types of groups. Immigrants
were found to be more food insecure than non-immigrants, and 1-in-4 Latino immigrants and 1-
in-5 Asian immigrants in California reported food insecurity. These results were gathered even
!18
after considering key factors like “program assistance, English language proficiency and duration
of residence” (Walsemann, Gee and Ro 147).
2.5 The Dehumanization of Immigrants and Its Effects
Politicians, through their use of language, rhetoric, tone and manipulation of the media,
have created a hospitable climate for the denigration of immigrants (Foreign Affairs). Politicians
have constantly employed the use of subtle language strategies to dehumanize immigrants. For
example, in 2017, in a tweet about Hillary Clinton, then-presidential candidate Donald Trump
tweeted about “crooked Hillary...who wanted to flood the United States with Syrian
immigrants” (Utych 440). In a meeting on sanctuary cities, President Trump said “You wouldn’t
believe how bad these people are. These aren’t people - these are animals” (The Atlantic, The
White House). Trump equates immigrants to natural disasters and animals in these instances,
removing any trace of humanism present (The White House). This dehumanization
“denies...immigrants the same human status as others” (Utych 440). Immigrants have also been
“frequently displayed as potential contaminants” and “diseased organisms” - politicians
capitalize on their ability to control the emotions of their supporters and the resultant fear of
immigrants (Utych 440, 442).
Words such as ‘vermin’, ‘disease’, ‘virus’ and ‘pollutants’ have been used to describe the
potential contamination that immigrant groups can bring into the country (Utych 441). Audiences
who have been exposed to dehumanization may not even be cognizant of the fact that they have
been manipulated through this subtle strategy (Utych 442). Immigration has been a long-debated
topic that many believe can be “combated”, therefore making it easier for them to perceive
!19

immigration as a crime (Utych 441). Dehumanization projects a “lower level of worth” onto the
immigrants therefore allowing individuals to “morally justify punishment” for these groups of
people (Utych 441). Tactics like dehumanization and debasement have been frequently used by
entities that have committed genocide (Utych 442). This is, by no means, a comparison to
genocide, but the findings of this study show a continued and renewed interest within the Trump
administration to strip immigrants of the tools needed for basic survival.
2.6 CalFresh in California
The CalFresh program helps more than 2 million households put food on the table daily,
and acts as the state’s “largest source of nutrition assistance” (California Food Policy Advocates).
Every dollar spent through CalFresh generates $1.79 in economic activity (California Food
Policy Advocates). San Diego ranks 45th out of the 58 counties in California on the CalFresh
Program Access Index, which is modeled on the state level Program Access Index (California
Food Policy Advocates). The Program Access Index estimates enrollment among participants
against individuals who meet CalFresh eligibility criteria (California Food Policy Advocates).
If the program was utilized to its fullest potential, San Diego county residents would
receive $312 million in additional benefits, and these dollars would result in $558 million of
additional economic activity in the region (Call and Shimada 14). Statewide, Californians lose
$2.5 billion in CalFresh benefits annually, additionally losing the potential generation of $4.5
billion in economic activity (Call and Shimada 5).
!20
2.6.1 California SNAP enrollment
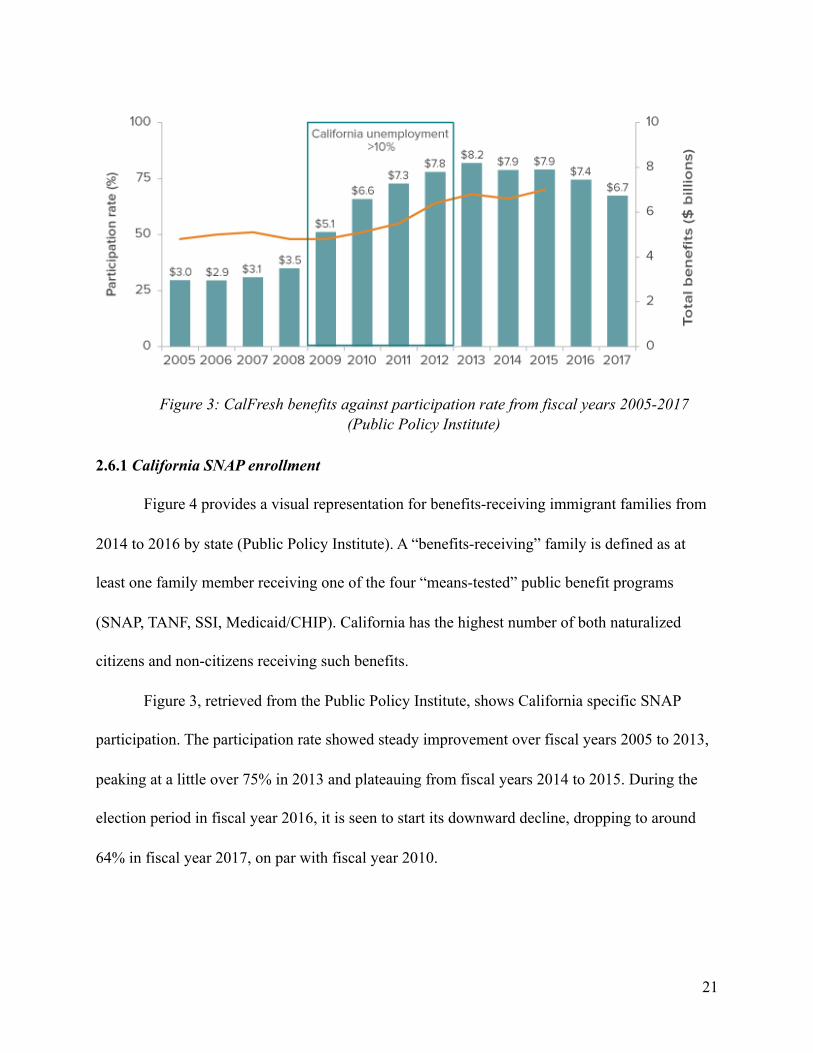
Figure 4 provides a visual representation for benefits-receiving immigrant families from
2014 to 2016 by state (Public Policy Institute). A “benefits-receiving” family is defined as at
least one family member receiving one of the four “means-tested” public benefit programs
(SNAP, TANF, SSI, Medicaid/CHIP). California has the highest number of both naturalized
citizens and non-citizens receiving such benefits.
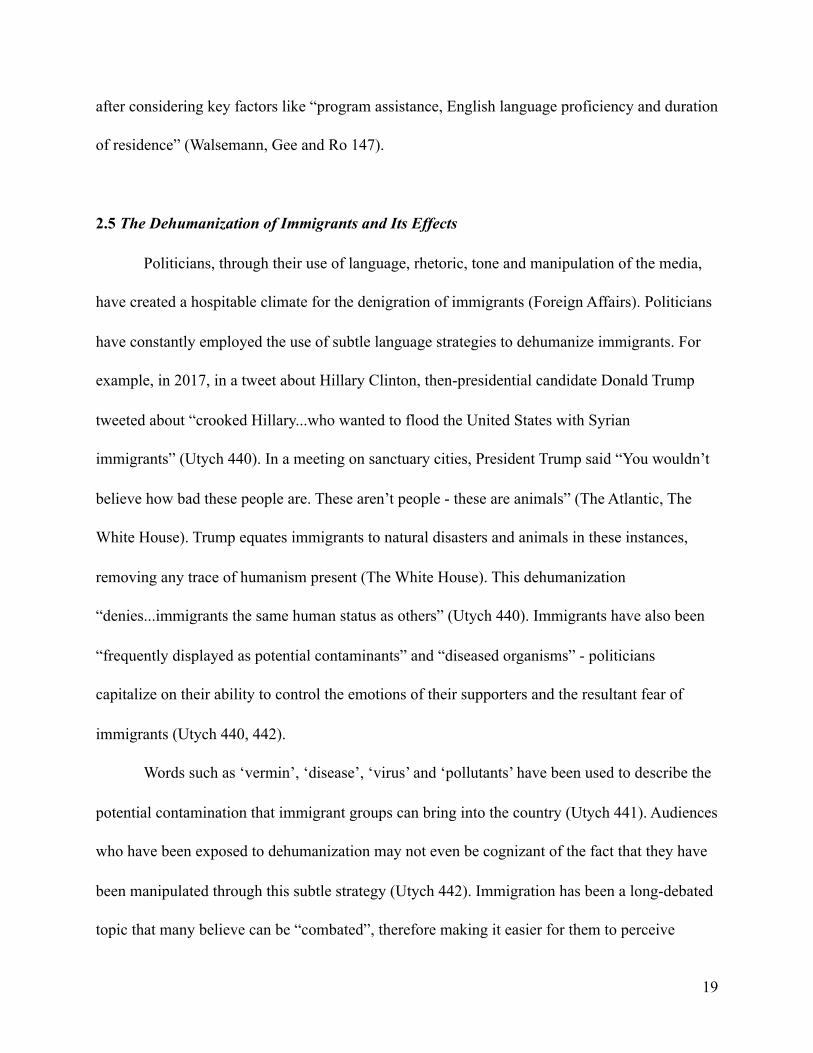
Figure 3, retrieved from the Public Policy Institute, shows California specific SNAP
participation. The participation rate showed steady improvement over fiscal years 2005 to 2013,
peaking at a little over 75% in 2013 and plateauing from fiscal years 2014 to 2015. During the
election period in fiscal year 2016, it is seen to start its downward decline, dropping to around
64% in fiscal year 2017, on par with fiscal year 2010.
!21
Figure 3: CalFresh benefits against participation rate from fiscal years 2005-2017 (Public Policy Institute)
!22
Figure 4: Top 25 States with Largest Number of Immigrants in Benefits-Receiving Families 2014-2016 (Public Policy Institute)
2.6.2 San Diego SNAP Enrollment
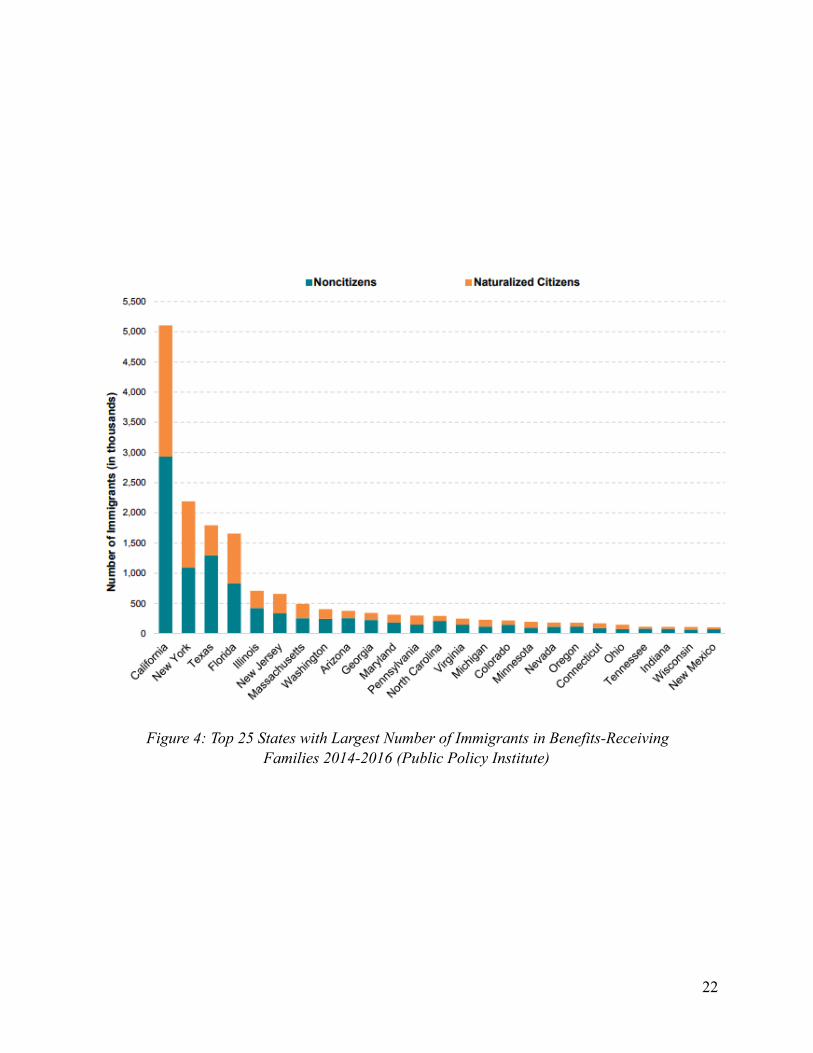
Table 1: Supplemental Nutrition Assistance Program (SNAP) enrollment in San Diego County:
2011-2015 5-Year Estimates, 2012-2016 5-Year Estimates, 2013-2017 5-Year Estimates
(American Community Survey - multiple 5-Year estimates)
American Community Survey’s 2011-2015 5- Year Estimates, 2012-2016 5-Year
Estimates and 2013-2017 5-Year Estimates show that between 2015 to 2017, the number of
households receiving SNAP increased.
Total; Estimate;
Households in San Diego County
Households receiving SNAP;
Estimate; Households
Percent households receiving SNAP;
Estimate; Households (%)
Households not receiving SNAP;
Estimate; Households
Percent households not
receiving SNAP;
Estimate; Households (%)
2017 1,111,739 79,634 7.2 1,032,105 92.8
2016 1,103,128 77,444 7 1,025,684 93
2015 1,094,157 73,202 6.7 1,020,955 93.3
Estimated Average Monthly
Number of CalFresh
Participants, 2016-17*
Total Population (County)
CalFresh Participants as a Percentage of the
Population
Rank (Highest to Lowest
Percentage)
California 4,251,900 38,982,847 10.8% N/A
Alameda 112,300 1,629,615 6.9% 47
Alpine 100 1,203 12.8% 23
Amador 3,300 37,306 8.8% 39
Butte 31,900 225,207 14.2% 17
Calaveras 5,200 45,057 11.6% 26
Colusa 1,400 21,479 6.4% 49
!23

Contra Costa 65,900 1,123,678 5.8% 51
Del Norte 5,300 27,442 19.5% 5
El Dorado 12,700 185,015 6.9% 46
Fresno 215,600 971,616 21.8% 3
Glenn 3,600 27,935 12.4% 24
Humboldt 21,100 135,490 15.5% 13
Imperial 42,500 179,957 22.7% 2
Inyo 2,000 18,195 10.8% 29
Kern 162,700 878,744 18.3% 8
Kings 24,200 150,183 16.2% 11
Lake 12,300 64,095 18.9% 6
Lassen 3,100 31,470 10.2% 33
Los Angeles 1,093,600 10,105,722 10.7% 30
Madera 28,700 154,440 18.5% 7
Marin 9,800 260,814 3.7% 57
Mariposa 2,000 17,658 10.9% 28
Mendocino 12,600 87,497 14.2% 18
Merced 55,800 267,390 20.5% 4
Modoc 1,100 9,017 11.5% 27
Mono 800 14,058 5.8% 53
Monterey 46,000 433,168 10.4% 32
Napa 7,100 141,005 5.0% 55
Nevada 7,600 98,838 7.7% 45
Orange 247,600 3,155,816 7.8% 44
Placer 17,400 374,985 4.6% 56
Plumas 2,000 18,724 10.5% 31
Riverside 286,200 2,355,002 12.1% 25
Sacramento 209,300 1,495,400 13.9% 19
!24
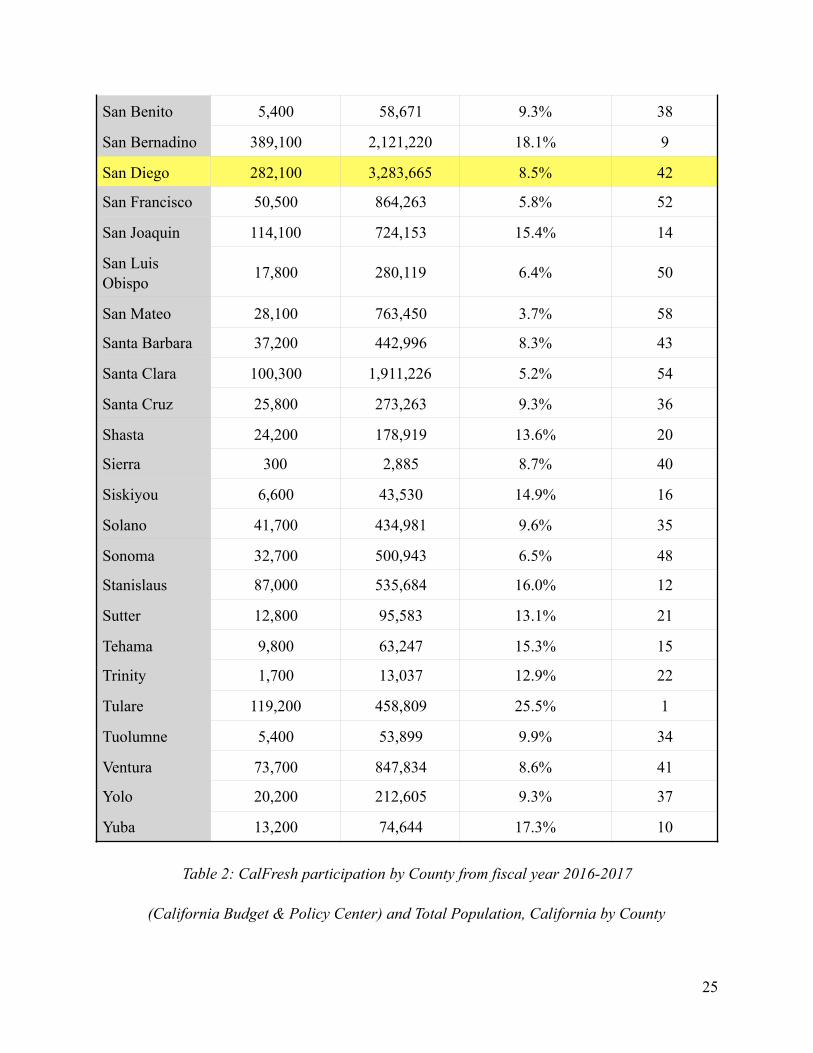
Table 2: CalFresh participation by County from fiscal year 2016-2017
(California Budget & Policy Center) and Total Population, California by County
San Benito 5,400 58,671 9.3% 38
San Bernadino 389,100 2,121,220 18.1% 9
San Diego 282,100 3,283,665 8.5% 42
San Francisco 50,500 864,263 5.8% 52
San Joaquin 114,100 724,153 15.4% 14
San Luis Obispo
17,800 280,119 6.4% 50
San Mateo 28,100 763,450 3.7% 58
Santa Barbara 37,200 442,996 8.3% 43
Santa Clara 100,300 1,911,226 5.2% 54
Santa Cruz 25,800 273,263 9.3% 36
Shasta 24,200 178,919 13.6% 20
Sierra 300 2,885 8.7% 40
Siskiyou 6,600 43,530 14.9% 16
Solano 41,700 434,981 9.6% 35
Sonoma 32,700 500,943 6.5% 48
Stanislaus 87,000 535,684 16.0% 12
Sutter 12,800 95,583 13.1% 21
Tehama 9,800 63,247 15.3% 15
Trinity 1,700 13,037 12.9% 22
Tulare 119,200 458,809 25.5% 1
Tuolumne 5,400 53,899 9.9% 34
Ventura 73,700 847,834 8.6% 41
Yolo 20,200 212,605 9.3% 37
Yuba 13,200 74,644 17.3% 10
!25
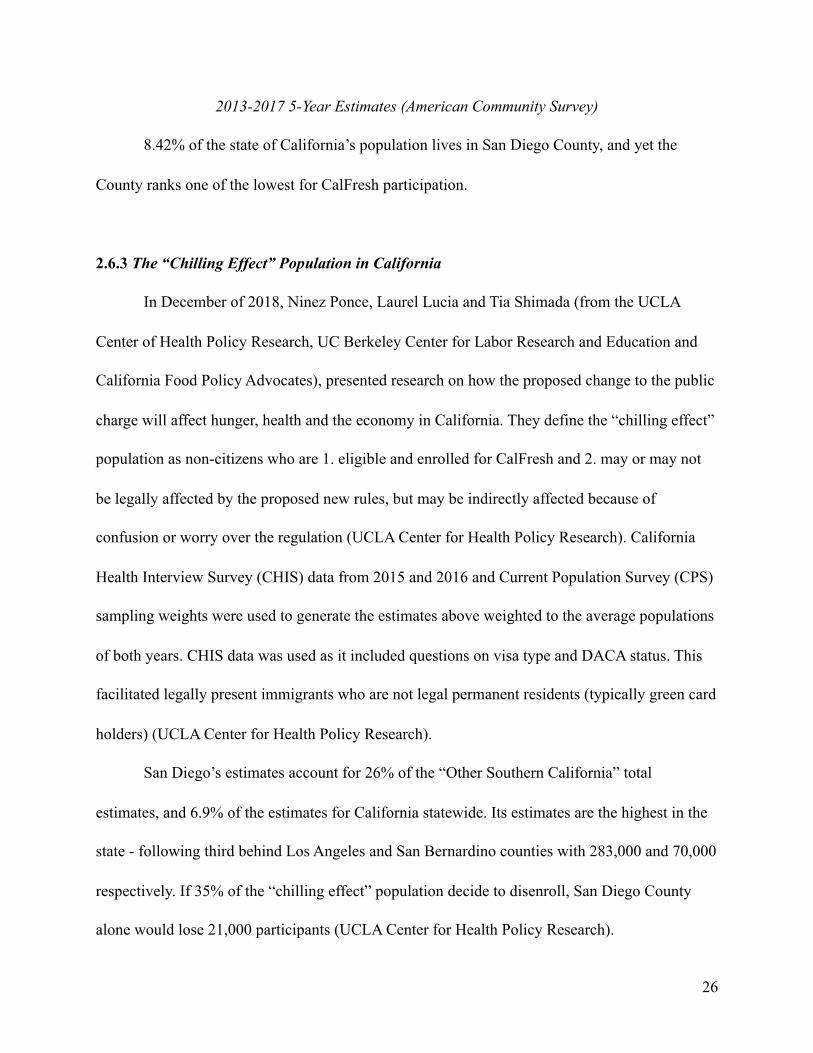
2013-2017 5-Year Estimates (American Community Survey)
8.42% of the state of California’s population lives in San Diego County, and yet the
County ranks one of the lowest for CalFresh participation.
2.6.3 The “Chilling Effect” Population in California
In December of 2018, Ninez Ponce, Laurel Lucia and Tia Shimada (from the UCLA
Center of Health Policy Research, UC Berkeley Center for Labor Research and Education and
California Food Policy Advocates), presented research on how the proposed change to the public
charge will affect hunger, health and the economy in California. They define the “chilling effect”
population as non-citizens who are 1. eligible and enrolled for CalFresh and 2. may or may not
be legally affected by the proposed new rules, but may be indirectly affected because of
confusion or worry over the regulation (UCLA Center for Health Policy Research). California
Health Interview Survey (CHIS) data from 2015 and 2016 and Current Population Survey (CPS)
sampling weights were used to generate the estimates above weighted to the average populations
of both years. CHIS data was used as it included questions on visa type and DACA status. This
facilitated legally present immigrants who are not legal permanent residents (typically green card
holders) (UCLA Center for Health Policy Research).
San Diego’s estimates account for 26% of the “Other Southern California” total
estimates, and 6.9% of the estimates for California statewide. Its estimates are the highest in the
state - following third behind Los Angeles and San Bernardino counties with 283,000 and 70,000
respectively. If 35% of the “chilling effect” population decide to disenroll, San Diego County
alone would lose 21,000 participants (UCLA Center for Health Policy Research).
!26

Location CalFresh “Chilling Effect” Population
Changes in CalFresh enrollment if 35% of the
“Chilling Effect” Population disenrolls from CalFresh
California Statewide 860,000 -301,000
Sacramento region 14,000 -5,000
Sacramento County 11,000 -4,000
El Dorado, Placer and Yolo counties (grouped)
3,000 -1,000
Bay Area region 131,000 -46,000
Alameda County 25,000 -9,000
San Francisco County 35,000 -12,000
San Mateo County 17,000 -6,000
Santa Clara County 28,000 -10,000
Solano County 5,000 -2,000
Sonoma County 12,000 -4,000
Contra Costa, Marin and Napa counties
9,000 -3,000
Central Coast region 42,000 -15,000
Monterey County 11,000 -4,000
Ventura County 22,000 -8,000
San Benito, San Luis Obispo, Santa Barbara and Santa Cruz counties (grouped)
9,000 -3,000
San Joaquin region 152,000 -53,000
Fresno County 55,000 -19,000
Kern County 17,000 -6,000
Kings County 6,000 -2,000
Madera County 13,000 -4,000
Merced County 8,000 -3,000
!27

Table 3: California “Chilling Effect” Population by County and Estimates if 35% of the
“Chilling Effect" Population Disenrolls
(UCLA Center for Health Policy Research)
2.6.4 San Diego County Agency Hostility
An interview participant recommended looking into a participation action research study
conducted in 2009 by the Supportive Parents Information Network (SPIN) surveying
respondents who had previously gone to the San Diego County’s Health and Human Services
Agency (HHSA) for SNAP assistance. The study showed that the agency had cultivated a
negative and hostile culture towards SNAP applicants who visited the agency for assistance
(SPIN). Although the findings might be outdated and the culture at the County offices may have
improved, they are explained to provide a historical perspective on the types of hostility that
applicants have had to face at a County level. For example, individuals who come of age in 2019
San Joaquin County 8,000 -3,000
Stanislaus County 10,000 -4,000
Tulare County 35,000 -12,000
Los Angeles County 283,000 -99,000
Other Southern California region
227,000 -80,000
Imperial County 6,000 -2,000
Orange County 44,000 -15,000
Riverside County 48,000 -17,000
San Bernardino County 70,000 -25,000
San Diego County 59,000 -21,000
!28
may feel deterred to approach the County for assistance because they had heard of these negative
experiences that other family members or friends might have encountered in the past.
The study surveyed 187 respondents, mostly with parents of young children living in
deep poverty. The relevant findings of this study are as follows: 1. Individuals that had come to
the HHSA for assistance already felt “embarrassed, shameful and fearful” (Supportive Parents
Information Network 8). When asked, 58% of respondents denied needing food although they
were hungry, and 48.6% of the 58% reported shame as the main reason. 39% of respondents
reported experiencing fear, and it was found that these individuals felt these emotions because
they had “internalized the general population’s derogatory image of people living in
poverty” (Supportive Parents Information Network 8). These individuals feel judged by their
communities, and shame because they feel like they could have done more. 2. Respondents had
felt “enveloped” within degradation when they did visit the HHSA’s family resource centers, and
interactions with staff exacerbated feelings of shame as they “felt even worse, very ugly…”
during their hostile experiences in a negative environment.
The center had bulletproof glass and unsanitary conditions, and the overwhelming feeling
felt by respondents was “demoralization” because the people they had encountered had “not one
ounce of care” (Supportive Parents Information Network 8). It was also found that the HHSA
was highly inefficient in processing, leading to a 3. decreased quality of life for these
respondents as food resources declined. These respondents reported the following negative
outcomes of having decreased food supplies: increased fighting, loss of concentration,
deterioration of school performance, increased fatigue, increased depression, increased worry
and more stress.
!29

2.6.5 Overview of Policies and Bills
The following policies and bills are outlined for informational purposes. These are bills
and policies that were referenced by interview participants in their interviews, which will be
described in the qualitative findings section. All policies and bills referenced have some form of
connection to immigrant groups and populations and their influence on the groups’ ability to
receive food benefits.
Table 4: Table showing five referenced policies by interviewed participants
Policy Affected/Proposed Change
Administrative Level
Affected Population
Agency/Individual Responsible
1 Agriculture Improvement Act
(Farm Bill)
Federal All President/House of Representatives/Senate
2 Public Charge Federal Immigrants US Department of Homeland Security, US Citizenship and
Immigration Services
3 Proposed Rule (ABAWD Work Requirements)
Federal All Food and Nutrition Service (FNS) and United States
Department of Agriculture (USDA)
4 SB 285 State All Senator Scott Wiener (CA-D)
5 HR 1368 State All Representative Alma Adams (NC-D)
!30
Agriculture Improvement Act (also known as the “Farm Bill”)
Congress passes legislation setting 1. National agriculture 2. Nutrition 3. Conservation
4. Forestry policy under the “Farm Bill” every five years. The last Farm Bill expired in
September of 2018, and in December 2018 President Trump resigned the deal approved by the
House and Senate. The most controversial element of the Republicans’ Farm Bill was the
proposed imposition of work requirements for food benefits on individuals 18 through 59 (non-
disabled and not raising a child under 6) and changes that would have caused more than 1
million low-income households (especially families with children) to lose their benefits or face
reductions. Individuals would have had to prove that they work at least 20 hours a week or
participate at least 20 hours in a work program. Non-compliance meant a loss of the individual’s
share of the benefit for 12 months. Subsequent infractions would “lock individuals out of the
program” for a total of 36 months (Center on Budget and Policy Priorities).
The work requirements would have caused “substantially more harm than good” and
would have forced the development of bureaucracies in order to enforce the rules and actually do
little to increase employment (Center on Budget and Policy Priorities). If the bill passed, it would
have also left high numbers of low-income individuals facing external barriers to employment
like limited skills or mental health issues to go without earnings and food assistance (Center on
Budget and Policy Priorities). Ultimately, a bipartisan compromise was reached and maintained
the current regulations (Stein, 2018). In the table below, the yellow box denotes $24.6 billion in
lost SNAP benefits in contrast to the $5.8 billion in benefits improvements that the House
Republican Bill proposed.
!31

Table 5: Nutrition Title of House Farm Bill Includes More Than $20 Billion in SNAP Benefit
Cuts Over 10-Years
Proposed Rule Change to Public Charge in Federal Register
On October 10, 2018, the Department of Homeland Security published a proposed rule
change in the Federal Register related to public charge. The timeframe for public comment lasted
between October 10, 2018 and December 10, 2018. More than 210,000 comments were
submitted. The proposed rule change is not current law and changes will require an extensive
comment period. The government is required to respond to every comment submitted. The
proposed rule change is stated as follows in the Federal Register:
The U.S. Department of Homeland Security (DHS) proposes to prescribe how it
determines whether an alien is inadmissible to the United States under section 212(a)
(4) of the Immigration and Nationality Act (INA) because he or she is likely at any
Nutrition Title of House Farm Bill Includes More Than $20 Billion in SNAP Benefit Cuts Over 10 Years (Center on Budget and Policy Priorities)
CBO 10-Year Cost Estimate
SNAP Benefit Cuts -$24.6 billion
SNAP Benefit Improvements $5.8 billion
New Administrative Costs and Work Programs $14.6 billion
SNAP Benefit Delivery and Other Program Changes -$0.7 Billion
Non-SNAP Grants $2.8 Billion
Total Nutrition Title -$1.9 Billion
!32

time to become a public charge. Aliens who seek adjustment of status or a visa, or who
are applicants for admission, must establish that they are not likely at any time to
become a public charge, unless Congress has expressly exempted them from this
ground of inadmissibility or has otherwise permitted them to seek a waiver of
inadmissibility. Moreover, DHS propose to require all aliens seeking an extension of
stay or change of status to demonstrate that they have not received, are not currently
receiving, nor are likely to receive, public benefits as defined in the proposed rule.
(Federal Register/Vol. 83, No. 196)
The current public charge law allows immigration officers to decide public charge by
evaluating whether an applicant for a green card or individual seeking to enter the United States
under a certain is to become primarily dependent on the government for support (Immigrant
Legal Resource Center). They must rely on specific factors in the Immigration and Nationality
Act (INA). The proposed rule change seeks to define a public charge as an individual who
simply uses government programs such as the Supplemental Nutrition Assistance Program
(SNAP/food stamps), Section 8 housing assistance and other non-cash benefits. The proposed
rule will not be retroactive if it is finalized and will not punish any past use. Families will also
have a 60-day period after the final rule is published to dis-enroll from the program if they
believe that it is necessary (Immigrant Legal Resource Center).
According to the Federal Register, the DHS is seeking to “better ensure that aliens
subject to the public charge inadmissibility ground are self-sufficient” (Federal Register/Vol. 83,
No. 196). These grounds of inadmissibility only apply to immigrants seeking to enter the United
States or adjust status to lawful permanent residence. This rule does not affect current legal
!33
permanent residents applying for naturalization. It is also important to note that there is no public
charge test for groups of non-citizens like refugees, asylees and survivors of trafficking. Benefits
of this new proposed rule change outlined by the DHS include the following 1. Reduce the
likelihood that an alien will receive a public benefit at any time in the future 2. Better ensure that
aliens admitted to the United States for adjustment of status are self-sufficient through an
improved review process of the mandatory statutory factors 3. Better ensure aliens who...apply
for extension of stay or change of status continue to be self-sufficient during the duration of their
temporary stay 4. Potential to improve the efficiency for USCIS in the review process for public
charge inadmissibility (Federal Register/Vol. 83, No. 196).
Proposed New Rule with Work Requirements
On February 1, 2019, the Food and Nutrition Service and USDA published a proposed
rule in the Federal Register to amend the “regulatory standards by which the Department
evaluates State SNAP agency requests to waive the time limit and end the unlimited carryover of
able-bodied adults without dependents (ABAWD) percentage exemptions” (Federal Register/Vol.
84, No. 22). The comment period was between February 1, 2019 and April 2, 2019. The
Department proposes this new rule with confidence that this change will encourage individuals
within this category to engage in work and work activities in order to continue receiving SNAP
benefits (Federal Register/Vol. 83, No. 22). This rule relates to able-bodied adults without
dependents between the ages of 18 and 49 and eliminates the flexibility states have to waive time
limits on SNAP in areas with insufficient jobs for low-income workers. The implementation of
this rule would mean that individuals falling under this criteria must find and maintain
!34

employment at 20 hours per week or be eligible for only three months of SNAP benefits over
three years.
Senate Bill No. 285 (SB-285)
On February 13, 2019, Senator Scott Wiener (CA-D) introduced SB-285, a bill that set
goals and accountability metrics for CalFresh enrollment. The bill would require the California
State Department of Social Services to take specified actions to “ensure counties are providing
the desired access to CalFresh and in meeting the specified participation performance
outcomes” (S.B. 285, 2019). This plan seeks to achieve the following outcomes 1. ensure
equitable access to CalFresh by setting achievable and measurable goals 2. require the State to
provide counties with simplified applications for seniors and disabled applicants and
appropriately translated applications and materials 3. plan to implement a user-friendly, universal
application to California programs: Medi-Cal, CalFresh, CalWORKS and WIC in 2023
(California Food Policy Advocates).
House of Representatives Bill No. 1368 (H.R. 1368)
H.R. 1368 was introduced on February 26, 2019 by Representative Alma Adams (NC-D).
This Bill seeks to “amend the Food and Nutrition Act of 2008 to require that SNAP benefits are
to be calculated with reference to the cost of the low-cost food plan determined by the Secretary
of Agriculture” (H.R. 1368, 2019).
!35
3. Research Question
How does the current political climate affect perceptions and enrollment around the
Supplemental Nutrition Assistance Program (SNAP), or otherwise known as CalFresh in San
Diego, California among immigrant populations?
4. Hypothesis
The current political climate has most likely caused a drop in enrollment numbers
especially in border communities like San Diego, although there might be a significant impact
overall throughout the United States.
5. Research Methodology
5.1 Overview of Methodology
This thesis utilizes a mixed-methods research design that analyzes qualitative and
quantitative data in order to build a comprehensive argument and narrative. A mixed-methods
design allows for the triangulation of data, which “neutralizes” any inherent bias in data sources,
investigator and methods when used in conjunction with other data sources, investigators and
methods (Creswell 174). There are five ultimate key purposes for a combined methods study, but
for the purposes of my research I hope to achieve three, as follows (Creswell 175):
1. Triangulation: to seek convergence of results
2. Initiation: Allow for any contradictions or fresh perspectives to emerge
3. Expansion: Mixed-methods will add scope and breadth to a study
!36

5.2 Quantitative Research
An analysis of existing quantitative research was conducted to provide quantifiable
information documenting trends and patterns happening nationally and statewide in California
pertaining to SNAP enrollment. Nationwide SNAP enrollment statistics pertaining to immigrant
groups were also retrieved and analyzed to understand enrollment on a broader scale.
5.3 Qualitative Research
Semi-structured phone interviews were conducted with the approval of Columbia
University’s Institutional Review Board (IRB-AAAS1955) between February 1, 2019 and March
15, 2019. These interviews were conducted to gain a better subjective understanding of the
impacts that policies and political administrations have had on the perceptions around the SNAP
program within immigrant populations in order to ground truth in existing quantitative research.
6. Limitations
1. Qualitative interviews are recognized as subjective perceptions that ground truth as related to
literature and quantitative data.
2. SNAP-receiving immigrants living in San Diego were not interviewed, but participants who
were interviewed work closely with this population. Therefore, participants’ statements reflect an
acute understanding and second-hand perspective of the immigrant groups’ lived experiences.
1. The SPIN report on the study of San Diego County’s Health and Human Services Agency’s
assistance was published in 2010. Findings from this study are highlighted to illustrate historical
circumstances, and are not a reflection of the current practices at the agency today.
!37
7. Implications to Planning
The planning profession prides itself on its comprehensiveness. Topics in planning cover
anything from infrastructure, economic development, transportation, urban design and
architecture to financing and law. The omission of food systems research and implementation
into planning policies and practice is a puzzling one. Planners that have been surveyed report
reasons like 1. food systems planning belonging to the health or private sector 2. limited
opportunities for planners to influence such systems and 3. a lack of understanding of these
issues (American Planning Association). The APA’s (American Planning Association) Policy
Guide on Community and Regional Food Planning highlights a key reason - that the food system
only has an “indirect” connection to the built environment, which is the “principal focus of
planners’ interests” (APA 1). There is also a perception that the food system is not related to
public goods, services and facilities. The policy guide highlights the relevant goals that planners
should strive towards: 1. build stronger, sustainable and self-reliant systems and 2. enhance
economic vitality, economic sustainability and social equity (APA 2). Planners can, through their
actions, enact change within food systems - including but not limited to:
1. Assisting non-profits by sharing data meant for planning and implementing programs to
support health and nutritional practices (APA 8)
2. Assist in the development of plans meant to increase access to affordable and culturally
appropriate foods (APA 12)
3. Support equitable food systems through land use tools that can enhance spatial access for
impoverished communities (APA 15)
4. Develop urban agriculture proposals and projects for food insecure areas (APA 16)
!38
5. Support feasibility studies of brownfields in low-income areas for food production (APA
16)
6. Support assessments and initiatives meant for the preservation of traditional, native and
ethnic food cultures (APA 17)
7. Promote and advocate for food benefits programs in political spheres and private sector
economies to gather support and financial resources (APA 19)
Immigrants are farmers, food processors and food service workers (New Food Economy). Most
importantly, they are consumers. Immigrants are one of the main contributors to the food sector
economy, yet continue to remain one of the most food insecure groups (Bread for the World
Institute 3). The current food system in the United States has also caused the “loss” and
“erosion” of diverse culinary traditions important to immigrants (APA 3). Food systems operate
at the intersection between law and policy, planning and public health (Figure 5). Planners
should be encouraged to shape and cultivate food environments that encourage healthy eating
through the study of current and past policy. At a time when the political system is fraught with
change, it is important to understand immigrants’ perspective. Food systems research and
implementation are typically omitted from planning policies and practice. This research creates
the link between food security and food systems with planning. I chose San Diego, California for
its position as a border community. I also chose it because of the county’s extensive history and
deep-rooted relationship with its immigrant population.
!39
8. Existing Secondary Source Analysis
8.1 Annual SNAP enrollment nationwide
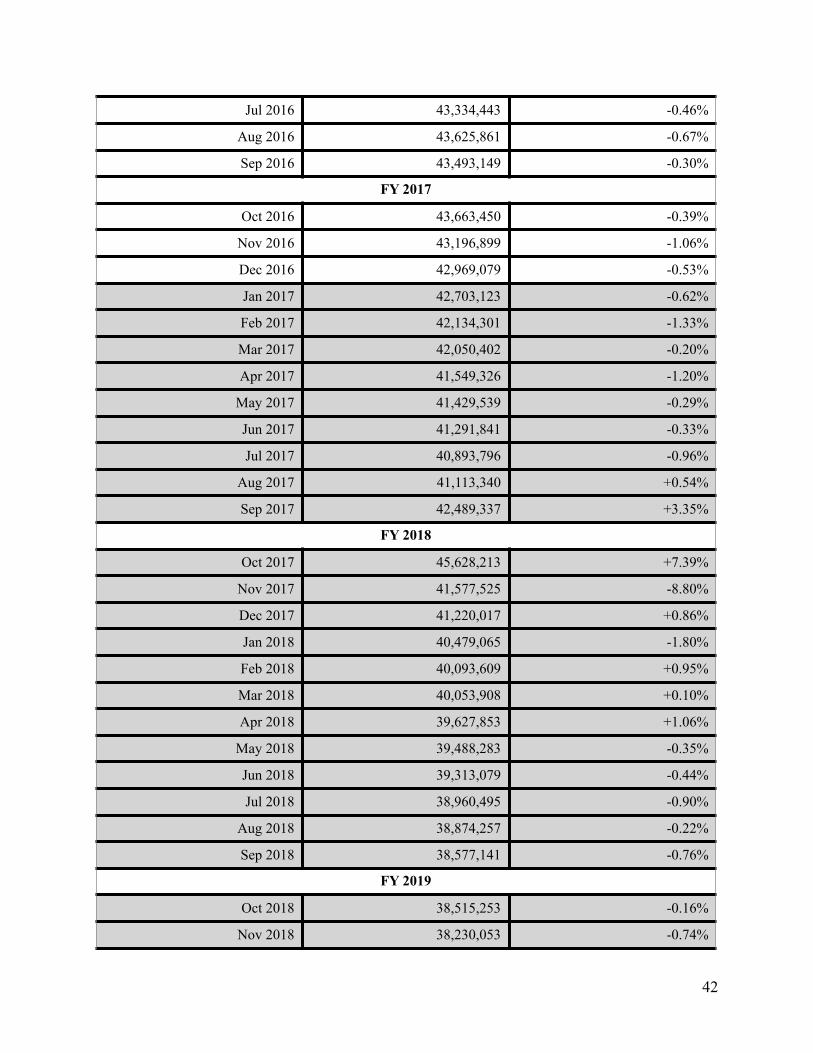
Table 1 provides an annual overview of SNAP enrollment nationwide from fiscal years
2016 to 2019 and month-to-month enrollment from October of 2015 to December of 2018.
Information retrieved from the USDA includes the fiscal year and participation (in persons)
(USDA). The percent change column was independently calculated. I used the following
example formula to calculate the percent change:
The information highlighted in grey in table 6 indicates the data collected during the period of
the current presidential administration, commencing in January of 2017. The largest fluctuations
seen in enrollment were seen from September to October of 2017, where there was an increase of
!40
Planning
Public HealthLaw/
Policy
Food Systems
Figure 5: Food systems influences and influencers

7.39% in enrollment. However, the following month, from October to November of 2017, this
significantly decreased by 8.8%. The annual summary shows that SNAP enrollment is decreasing
at an average rate of 4.83%. From fiscal year 2018 to 2019 specifically, there was a large
decrease of 5.5% (2,105,475 persons). Overall, from fiscal year 2016 to 2019, enrollment
numbers dropped by a total of 6,000,384 persons. From the beginning of the Trump
administration starting in January 2017 to the end of 2018 (December), enrollment numbers
nationwide dropped by a total of 4,791,492.
Supplemental Nutrition Assistance Program
(Data as of March 08, 2019)
Fiscal Participation
Year Persons Percent Change
Annual Summary
FY 2016 44,219,363 -
FY 2017 42,123,703 -4.7%
FY 2018 40,324,454 -4.3%
FY 2019 38,218,979 -5.5%
Monthly Data
FY 2016
Oct 2015 45,368,265 -
Nov 2015 45,453,871 -0.18%
Dec 2015 45,188,751 -0.58%
Jan 2016 44,852,347 -0.75%
Feb 2016 44,382,926 -1.04%
Mar 2016 44,344,774 -0.09%
Apr 2016 43,570,377 -1.74%
May 2016 43,481,269 -0.24%
Jun 2016 43,536,321 -0.13%
!41
Jul 2016 43,334,443 -0.46%
Aug 2016 43,625,861 -0.67%
Sep 2016 43,493,149 -0.30%
FY 2017
Oct 2016 43,663,450 -0.39%
Nov 2016 43,196,899 -1.06%
Dec 2016 42,969,079 -0.53%
Jan 2017 42,703,123 -0.62%
Feb 2017 42,134,301 -1.33%
Mar 2017 42,050,402 -0.20%
Apr 2017 41,549,326 -1.20%
May 2017 41,429,539 -0.29%
Jun 2017 41,291,841 -0.33%
Jul 2017 40,893,796 -0.96%
Aug 2017 41,113,340 +0.54%
Sep 2017 42,489,337 +3.35%
FY 2018
Oct 2017 45,628,213 +7.39%
Nov 2017 41,577,525 -8.80%
Dec 2017 41,220,017 +0.86%
Jan 2018 40,479,065 -1.80%
Feb 2018 40,093,609 +0.95%
Mar 2018 40,053,908 +0.10%
Apr 2018 39,627,853 +1.06%
May 2018 39,488,283 -0.35%
Jun 2018 39,313,079 -0.44%
Jul 2018 38,960,495 -0.90%
Aug 2018 38,874,257 -0.22%
Sep 2018 38,577,141 -0.76%
FY 2019
Oct 2018 38,515,253 -0.16%
Nov 2018 38,230,053 -0.74%
!42

Table 6: Supplemental Nutrition Assistance Program (SNAP) FY16 through FY19 Nationwide
(US Department of Agriculture)
8.2 Immigrant Participants in the SNAP Program
In table 7 below, the total number of participants for “naturalized citizens” and “other
noncitizens” from the years 2007 to 2017 is provided (USDA). Other citizenship data provided
by the USDA’s report on U.S.-born citizens and refugees are not relevant to my study and thus
not included. Naturalized citizen participation in the SNAP program showed a steady increase
from years 2007 (753,000 participants) to 2016 (1,806,000 participants). This category only
decreased in number in 2017, when the number of participants dropped from 1,806,000 to
1,779,000. This is a drop of 27,000 naturalized citizen participants, for the first time in a decade.
The “other noncitizen” category showed a steady increase from 2007 (761,000 participants) to
2011 (1,412,000 participants). The participant count drops slightly from 2011 (1,412,000
participants) to 2012 (1,400,000 participants) but resumes a steady increase from 2013
(1,475,000 participants) to 2016 (1,484,000 participants). From 2016 to 2017, the participation
for “other noncitizens” decreased again from 1,484,000 participants to 1,411,000 participants.
Dec 2018 37,911,631 -0.83%
FY 2019 data are preliminary; all data are subject to revision
Fiscal Year Participant Characteristic Total Participants
Number (000) Percent (%)
2007 Naturalized citizen 753 2.9
!43

Table 7: SNAP Benefits of Participants by Selected Demographic Characteristics (US
Department of Agriculture)
Other noncitizen 761 2.9
2008 Naturalized citizen 827 3.0
Other noncitizen 765 2.8
2009 Naturalized citizen 1,021 3.1
Other noncitizen 994 3.0
2010 Naturalized citizen 1,177 3.0
Other noncitizen 1,232 3.1
2011 Naturalized citizen 1,379 3.1
Other noncitizen 1,412 3.2
2012 Naturalized citizen 1,587 3.4
Other noncitizen 1,400 3.0
2013 Naturalized citizen 1,594 3.4
Other noncitizen 1,475 3.1
2014 Naturalized citizen 1,715 3.7
Other noncitizen 1,545 3.4
2015 Naturalized citizen 1,786 4.0
Other noncitizen 1,495 3.3
2016 Naturalized citizen 1,806 4.1
Other noncitizen 1,484 3.4
2017 Naturalized citizen 1,779 4.3
Other noncitizen 1,411 3.4
!44
9. Findings: Qualitative Data
9.1 Interviews
From February to March 2019, interviews were conducted with the following individuals
listed below (listed in order of interview date). The IRB approved interview guiding questions
are attached in Appendix A. Of the 13 organizations and agencies contacted, 8 individuals from 8
agencies granted interviews. In addition, efforts were made to contact the San Diego County’s
Health and Human Services Agency in order to gain government perspective. The agency had
representatives that initially responded but the agency ultimately did not grant an interview.
1. Participant 1, San Diego Non-Profit Organization Coordinator
2. Participant 2, San Diego Non-Profit Organization Advocate
3. Participant 3, San Diego Research Center Researcher
4. Participant 4, San Diego Medical Center Director
5. Participant 5, San Diego Community Organization Manager
6. Participant 6, San Diego Medical Center Senior Director
7. Participant 7, Non-Profit California Statewide Organization Policy Advocate
8. Participant 8, San Diego Medical Center Medical Professional and Director
9.2.1 Finding 1: Participants believe that eligibility workers have had to waste their time and
efforts on informal immigration counseling rather than assisting with CalFresh applications
Participants have expressed that there has been too much time, money and effort wasted
on “counseling” and “reassuring” individuals of their immigration right and benefits (Participant
!45
2, 2019). San Diego County’s eligibility workers throughout the non-profit organizations have
become involuntary informal immigration advisors as immigrant groups continue to express
curiosity and fear about how the receipt of those benefits will affect their abilities to naturalize
(Participant 2, 2019). Participants lamented about how, instead of providing individuals with the
services they need to successfully apply for and obtain their rightful benefits, eligibility workers
have had to understand immigration requirements related to eligibility and the potential impacts
that this might have on the populations they advise. Participants explained that navigating the
system of food benefits in general is difficult enough for applicants. To exacerbate the problem,
participants also reported that workers are not trained to accurately answer immigration
questions (Participant 1, 2019). This could lead to miscommunication, inefficiencies and
misunderstandings which can spread easily through word-of-mouth within immigrant
communities. A participant also reported that eligibility workers end up having to make a
decision on advising whether applying for the benefits is the right course of action if the
applicant expresses fear or deep hesitation in doing so (Participant 2, 2019).
Participants also reported that trusted Spanish-speaking outreach workers and promotoras
(trusted lay community health workers who are deeply embedded within the communities) have
also encountered difficulties conducting outreach as they also cannot confidently advise on
whether applying for such benefits will affect their legal status (Participant 6, 2019).
“They trust her, they know her and if this trusted person in the community cannot say
to you with confidence that the benefits are not going to get you deported...if that
person lacks confidence in it, you are going to lack confidence in it…We cannot give a
confident answer...” - Participant 1, 2019
!46

9.2.2 Finding 2: Participants reported that programs that depend on SNAP enrollment have
also been impacted by the climate of fear that has been cultivated by the current
administration
Participants reported that the “ever-increasing climate of fear” is not only detrimental to
SNAP enrollment and perceptions about the program, but also directly impacts enrollments
around programs that depend on the individual’s enrollment in SNAP (Participant 6 and 8, 2019).
Participant 6 described an example of such a program - the ¡Más Fresco! More Fresh Program (a
joint partnership between the University of California at San Diego’s Center for Community
Health, the United States Department of Agriculture (USDA) and Northgate Gonzalez Market)
that provides up to a maximum of $40 in extra benefits for participants when they purchase fresh
fruits and vegetables in select markets located across Los Angeles County, Orange County and
San Diego County. However, the requirement is that program participants must be enrolled in
CalFresh. Their enrollment in SNAP gives them the potential to earn a dollar for every CalFresh
benefit dollar they spend on fresh fruits and vegetables.
Participant 6 described this program as a program that helps to increase purchase power
while simultaneously providing an incentive to consume more fresh produce among SNAP
participants (Participant 6, 2019). Participant 6 described that a family receiving $312 worth of
benefits on average will see an increase in 10% of SNAP benefits that solely goes into the
purchasing of fruits and vegetables with this program (Participant 6, 2019). Participant 6 also
explained that the promotoras working in the various immigrant communities have relayed
information that the situation is worsening throughout the community as community members
continue to de-enroll themselves and their children from SNAP, SNAP-dependent programs like
!47

¡Más Fresco! and school meal programs in an effort to ensure that no electronic or paper trails
lead back to them.
“We are hoping that everything is going to be okay, but the reality is, you hear stories,
we hear stories, and they hear stories [about the fears related to immigration].” -
Participant 6, 2019
9.2.3 Finding 3: Participants perceive that the proposed rule exacerbates existing abuse of
power
Participants reported that the new proposed public charge rule not only impacts
undocumented immigrants and their ability to pursue a pathway to citizenship, but has also been
shown to impact legal permanent residents (LPRs). Participants described how there is an
existing culture of abuse of perceived power within the immigration context (Participant 2,
2019). For example, participants reported awareness of legal residents crossing across the border
from Mexico being denied admission because of a border patrol agent’s misunderstanding of his/
her legal authority; the American Civil Liberties Union confirms this (ACLU). Participants
explained that the new proposed public charge rule will present yet another pathway for abuse of
power, specifically preventing people from applying for public benefits, especially when there
have been cases that have inappropriately taken into consideration receipt of public assistance
(Participant 2, 2019). Because the rules are written in language that is very grey, it creates the
opportunities for individual discretion, and can thus be used to discriminate against a large group
of people (Participant 2, 2019). Although these situations do not always happen, when they do
happen, it creates enough fear preventing people from applying.
!48

9.2.4 Finding 4: Low-income immigrants that qualify for food services are physically avoiding
essential services
Outreach officials described having seen a decrease in access to nutrition and food
services in all forms. Participants shared that they are hearing reports from the populations that
they serve that immigrants and undocumented immigrants are reluctant to leave their homes to
access services like food pantries, immigration and legal services. They reported perceptions that
there is a huge fear that all programs are all interrelated and affected by the proposed new
changes in the rules. They reported that some immigrants believe that being physically outside
has now turned into risky behavior that even legal permanent residents are unwilling to take,
which demonstrates the extent of the impact that the climate of fear has brought upon within the
community. Participants said that this extended to food distributions that require registration
(Participant 1 and 2, 2019). Although they do not collect detailed data on attendance, participants
reported their own observations of notable and substantial decreased use among populations that
they typically observe:
“One of our partner organizations working out of Encinitas - ...at one point, close to
90% of people that came to use their services were Spanish-speakers. When the
proposed rule about the public charge came out, it went down to as low as 10%. What
happens to those individuals?” - Participant 1, 2019
!49
9.2.5 Finding 5: The inability of families to rely on government food assistance programs
requires that they turn to charitable programs for food supplies, which in turn increases their
vulnerability and makes it difficult for these families to overcome poverty
CalFresh/SNAP is the largest food assistance program available in the United States.
Participants that directly work with low-income populations in need of food assistance described
that when a program as large as this is not available to them, they have to rely on assistance
through the charity system, which can be unreliable and only acts as a temporary “band
aid” (Participant 2, 2019). Participants defined detrimental impacts to include include 1. negative
health outcomes 2. affected ability to focus in the classroom thus leading to 3. Impacted
academic achievement 4. job readiness and productivity as a result of negative academic
consequences and ultimately leading to “generational inequities” that continue the cycle of
poverty within immigrant communities as they struggle to lift their families out of poverty for
generations due to such intentional, systemic barriers not within their control (Participant 2,
2019). Ultimately, these barriers are “huge assaults” on immigrant communities that affect their
livelihood (Participant 2, 2019).
9.2.6 Finding 6: Federal policy appears to be attaching public benefits across multiple areas of
law
The expiration of the Agriculture Improvement Act constantly brings heated debate as
Republicans and Democrats battle amongst themselves (Participant 1). On December 20, 2018,
President Trump signed a $867 billion farm bill that aids United States farmers (H.R. 2, 2018).
Prior to this, politicians, advocates and key stakeholders who supported maintaining SNAP rules
!50
and funding had to fight fiercely to maintain its integrity (Participant 1, 2019). However, on that
same day, the USDA and Food and Nutrition Service (FNS) announced a new proposed rule to
prevent states from being able to waive work provisions for able-bodied adults without
dependents (ABAWDs) (USDA). Multiple interview participants expressed observations that by
proposing this new rule within the farm bill, the federal government was using a different
strategy and “loophole” to scale back the program because of their determination to reduce
funding to welfare programs (Participant 1, 2019).
9.2.7 Finding 7: The proposed public charge rule appears to intentionally create a climate of
fear rather than as a mechanism to reduce costs
Proposed changes to the rules, in reality, will affect only a “very small subset of the
immigrant SNAP population” (Participant 1, 2019). The individuals who would be affected by
the proposed rule changes are the individuals using Medicaid. Interview participants believe that
this proposed rule change is a direct and intentional attack on immigrants and their families.
Participants explained that the federal administration might not have even expected that the rule
would pass, but that it is not actually the aim of the proposed rule:
“I think that it is very possible that the administration didn’t expect the rule to go
through and they didn’t need it to. They just needed it to create additional fear and we
are seeing that lasting effect...” - Participant 1, 2019
!51

9.2.8 Finding 8: The proposed public charge rule appears to have had a “chilling effect”
throughout immigrant communities
While it is difficult to test the perceptions that the proposed rule was proffered to create a
climate of fear, other data appears to suggest that the proposed public charge rule has created a
“chilling effect” throughout the State of California within immigrant communities. UCLA’s
Center for Health Policy Research has defined the term “chilling effect” to mean “the
disenrollment [of immigrant families that would otherwise qualify for benefits] that might occur
due to the change in public charge rule…largely driven by disenrollment due to fear and
confusion” (UCLA Center for Health Policy Research, 2018). Participants used this term when
describing what they perceive to be occurring among immigrant populations that they serve:
“The vast majority of the negative impacts in terms of people disenrolling or not
applying would be not be not due to a direct impact in that their status would be
impacted, but, it was all a chilling effect - people who would be faced with a
complicated scenario and who would have to make a choice with imperfect
information...but in reality the regulation if enacted as proposed would not actually
affect their immigration status, but the fear...would drive a number of people to
disenroll…” - Participant 7, 2019
9.2.9 Finding 9: State legislators strike back
A participant who works closely with policymakers in California reported that California
legislators have attempted to mitigate the aftermath of the federal administration’s actions by
proposing bills like Senate Bill 285 (SB-285) and House of Representatives Bill 1368 (H.R.
!52
1368). SB-285 “takes a serious look at our persistent participation problem and...would create a
real state-county partnership” (Participant 7, 2019). H.R. 1368, also known as Closing the Meal
Gap Act of 2019, is not expected to pass, but was proposed by Senator Adams of North Carolina,
“...as more of a message bill and trying to get sponsors to show the broad and wide support for
improving benefit adequacy and improving eligibility rules” (Participant 7, 2019).
Senate Bill 623 (SB-623), was passed in June 2017 and allocated $5 million from the
state budget to provide funding for emergency drinking water funds. These funds support safe
drinking water in areas that were affected by the California droughts and during time periods
when people had to use their CalFresh benefits to buy bottled mineral water because tap water
was unsafe (Participant 7, 2019). Bonus bucks and dollar-for-dollar fresh fruits and vegetables
programs like ¡Más Fresco! have also received more funding and support.
9.3 Finding 10: The San Diego County Agency’s past reputation of hostility towards its
applicants may be a contributor to the decline in enrollment numbers
A participant reported that as far back in 2009, the San Diego County’s Health and
Human Services Agency (HHSA) had a negative reputation (Participant 3, 2019). It is clear from
the findings of the study (explained in the background section) and from this interview that San
Diego’s local health services agency was creating an inhospitable environment for applicants that
needed SNAP assistance.
“The outcome of that study was...the county created a culture of fear and
degradation...and what we found was that people had to be really really desperate [to
go to the county for application assistance]” - Participant 3, 2019
!53
9.3.1 Finding 11: The CalFresh program/SNAP program is an economic stimulus in San
Diego/nationwide and needs to be promoted and understood universally as such
Participants reported that the Supplemental Nutrition Assistance Program (SNAP)
represents one of the most successful economic stimulus programs in the history of the United
States, and has provided 80 billion dollars in nutrition assistance to over 50 million Americans
(Participants 4 and 6, 2019). Participant 6 added that this 80 billion dollars has successfully
turned into over 140 billion dollars in economic stimulation throughout the United States,
“providing thousands of jobs” and supporting “thousands of businesses” (Participant 6, 2019).
According to Peter Larkin, President and CEO of the National Grocers Association, the
SNAP program “represents the lifeblood of the retail grocery business” (Participant 4 and 6,
2019). It has also been reported that the SNAP program has generated bipartisan support because
of the boost that the program has proven to have given to the United States’ economy
(Participant 6, 2019). The program supports economies and continues to lift millions out of
poverty. It allows for 1. Increased health equity 2. Increased health outcomes 3. Increased food
security and reduced hunger and 4. Increased social and food justice among other positive
outcomes (Participant 6, 2019). Participant 6 reported that the SNAP-Ed program, an evidence-
based program teaching people how to shop for, cook healthy meals and stretch their meals
further, provides 480 million dollars in USDA funding as well (USDA and Participant 6, 2019).
The program also has health benefits, and supports diabetes and obesity prevention.
“When people talk about SNAP, they need to talk about the economic stimulus that is
being provided to farmers, retailers, businesses, and the thousands of people that
!54
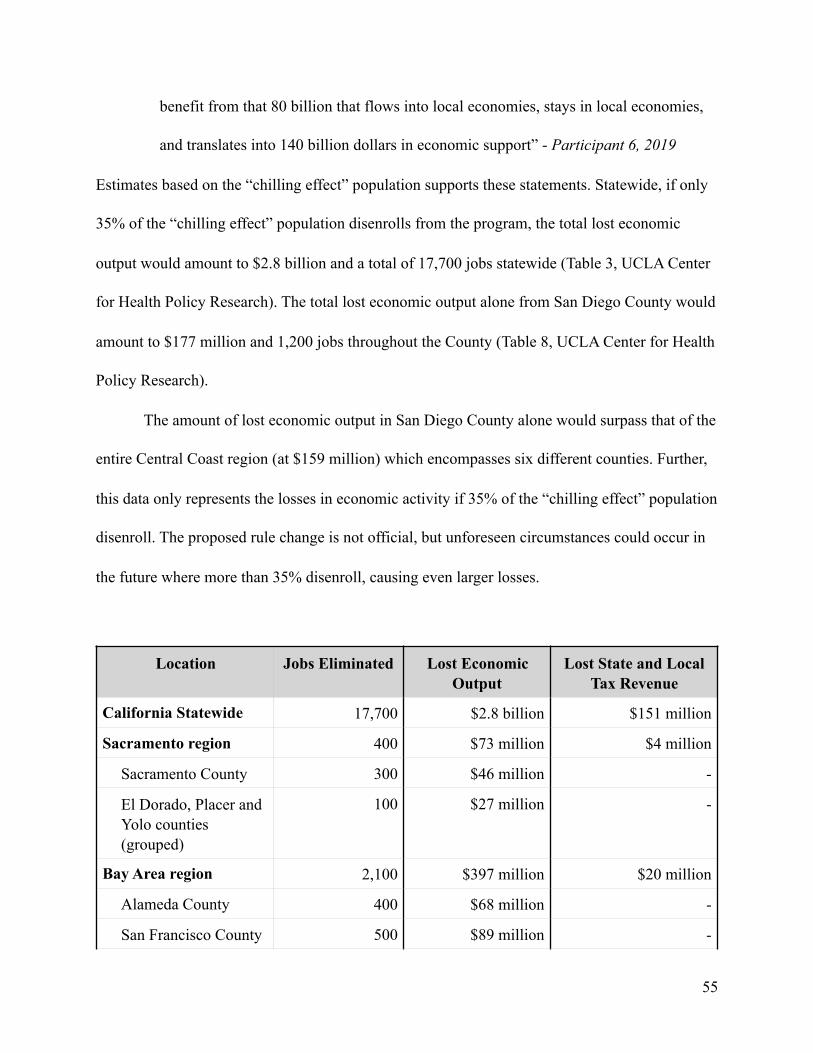
benefit from that 80 billion that flows into local economies, stays in local economies,
and translates into 140 billion dollars in economic support” - Participant 6, 2019
Estimates based on the “chilling effect” population supports these statements. Statewide, if only
35% of the “chilling effect” population disenrolls from the program, the total lost economic
output would amount to $2.8 billion and a total of 17,700 jobs statewide (Table 3, UCLA Center
for Health Policy Research). The total lost economic output alone from San Diego County would
amount to $177 million and 1,200 jobs throughout the County (Table 8, UCLA Center for Health
Policy Research).
The amount of lost economic output in San Diego County alone would surpass that of the
entire Central Coast region (at $159 million) which encompasses six different counties. Further,
this data only represents the losses in economic activity if 35% of the “chilling effect” population
disenroll. The proposed rule change is not official, but unforeseen circumstances could occur in
the future where more than 35% disenroll, causing even larger losses.
Location Jobs Eliminated Lost Economic Output
Lost State and Local Tax Revenue
California Statewide 17,700 $2.8 billion $151 million
Sacramento region 400 $73 million $4 million
Sacramento County 300 $46 million -
El Dorado, Placer and Yolo counties (grouped)
100 $27 million -
Bay Area region 2,100 $397 million $20 million
Alameda County 400 $68 million -
San Francisco County 500 $89 million -
!55
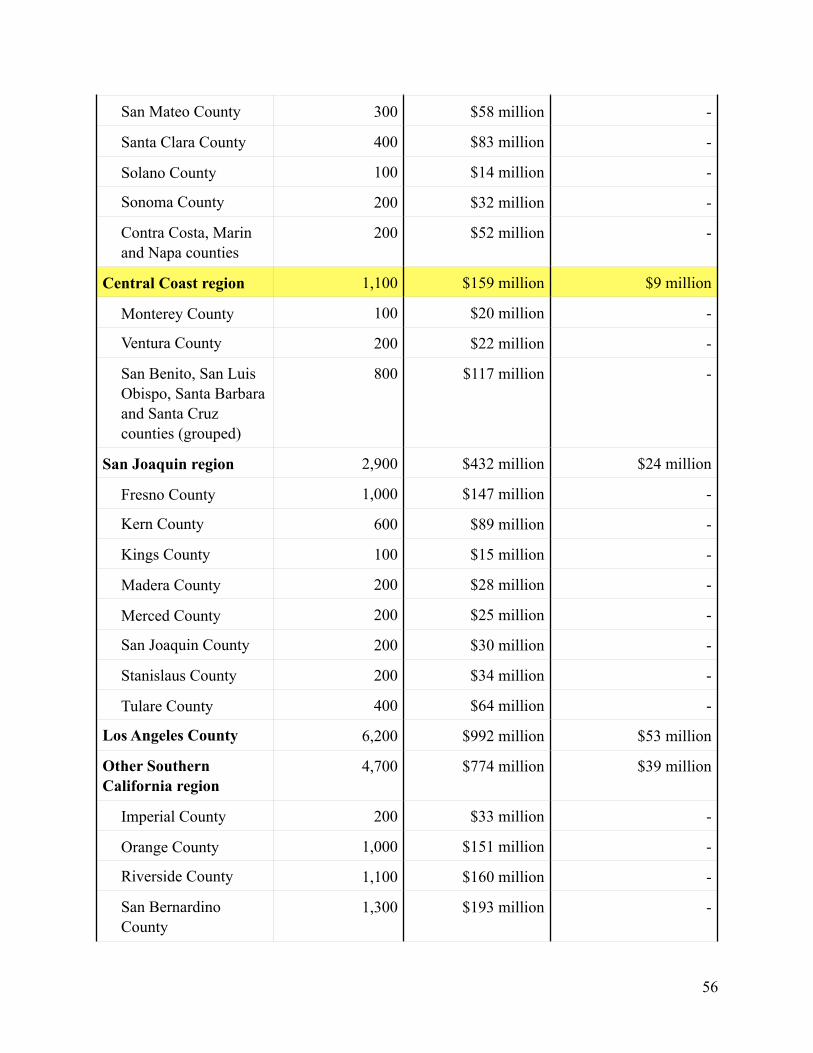
San Mateo County 300 $58 million -
Santa Clara County 400 $83 million -
Solano County 100 $14 million -
Sonoma County 200 $32 million -
Contra Costa, Marin and Napa counties
200 $52 million -
Central Coast region 1,100 $159 million $9 million
Monterey County 100 $20 million -
Ventura County 200 $22 million -
San Benito, San Luis Obispo, Santa Barbara and Santa Cruz counties (grouped)
800 $117 million -
San Joaquin region 2,900 $432 million $24 million
Fresno County 1,000 $147 million -
Kern County 600 $89 million -
Kings County 100 $15 million -
Madera County 200 $28 million -
Merced County 200 $25 million -
San Joaquin County 200 $30 million -
Stanislaus County 200 $34 million -
Tulare County 400 $64 million -
Los Angeles County 6,200 $992 million $53 million
Other Southern California region
4,700 $774 million $39 million
Imperial County 200 $33 million -
Orange County 1,000 $151 million -
Riverside County 1,100 $160 million -
San Bernardino County
1,300 $193 million -
!56

Table 8: Number of Jobs Lost, Lost Economic Output and Lost State and Local Tax Revenue if
35% of the “Chilling Effect” Population Disenrolls (UCLA Center for Health Policy Research)
10. Discussion
Immigrants have, and will continue to face struggles. This is an understood fact.
“For immigrants, the struggle begins only after getting here” - Participant 3, 2019
However, when politicians continue to frame individuals on welfare as lazy or unproductive
without taking into consideration other important factors like mental health and physical barriers
and create policies to intentionally disadvantage and prevent individuals from receiving food
assistance, this shows immigrants the lengths the administration will go to — even for its own
citizens. There is an added cultural barrier for immigrants in addition to already living in poverty.
I frame my argument through the strategies that the federal administration has undertaken to
debase the characters of individuals receiving public benefits and how they have created a
culture of fear around the SNAP program and how the state administrations (not limited to
California) have tried to mitigate the issues that this has caused.
The federal administration under President Trump actively seeks to reduce funding for
the SNAP program. Although this is not new strategy, the current administration has painted
welfare recipients in an extremely negative light. When proposed changes to federal bills were
not approved by Congress, the administration actively sought an alternative by proposing a new
San Diego County 1,200 $177 million -
!57

rule affecting able-bodied adults without dependents — “as one door closes [and] another opens”
(Participant 1, 2019).
“This rule would really take away this really important tool in the toolbox that states
would have to administer this very unfair and counterproductive...Similar things were
proposed in the Farm Bill and were rejected by Congress so there are some
congressional members who are concerned that the administration is side-stepping
congressional intent as expressed in the farm bill and get this done outside of the
normal statutory process” - Participant 7, 2019
This shows immigrants that this administration is determined. Their determination could
mean that they will explore every avenue possible in order to get their demands met, causing fear
and uncertainty. If the administration will try and do this to their own citizens, what would stop
them from doing so to people they consider to be liabilities? Immigrants have been compared to
animals and natural disasters, justified by the xenophobic beliefs that all immigrants are
dangerous criminals seeking to drain the United States and its taxpayers of its resources through
public benefits.
“The biggest enemy of people in poverty in the United States is the image of people in
poverty” - Participant 3, 2019
State administrations have actively been trying to mitigate the losses in enrollment by
proposing new bills like SB 285 and HR 1368 in an effort to ensure internal accountability and
provide benefits with reference to the costs of living in an individual’s state.
!58

10.1 Deportability as A Crucial Condition
Modifications to the farm bill and proposed public charge rule have not happened by
chance. Politicians have found new methods to specifically target migrant populations through
immigration law as a social intervention (De Genova, 2018). Immigration law categorizes
individuals into groups like “alien” or “illegal alien”, which then produces the conditions that
enable the production of new categories of people (De Genova, 2018). This condition of
illegality and being an outsider continues to be “refined” and “revised” to multiply the negative
ramifications of itself (De Genova, 2018). The Trump administration’s xenophobic strategies
target almost all immigrant populations, but focus specifically on the Latino/Latina and Muslim
populations. President Trump dehumanizes, criminalizes and then morally justifies the necessity
to create and enforce all possible new laws and restrictions against these groups by threatening
deportation.
These changes have caused cities and communities to become unsafe spaces for all
immigrants. Immigrants, who contribute labor, time and skills to the United States’ economy,
have simply become disposable. Deportability and disposability are inevitably intertwined (De
Genova, 2018). Expulsion ensuing from deportation is an “expulsion from every meaningful
aspect of life” within these individuals lives as their prospects for better futures within the
American dream are now threatened by the high risks of removal. (De Genova, 2018).
The implementation of these laws would extend the physical confines of the border
wall out into an “extended zone of enforcement” encompassing the spaces in which migrants live
and work (De Genova 2018). As a result, immigrants fear everyday activities like visiting the
food banks and visiting social services offices. People are not subject to “checkpoints” that
!59
hinder their lives and routines as border struggles turn into daily urban struggles (De Genova,
2018).
10.2 Immigrant Struggles and the Media
Immigrants in the United States face a multitude of challenges both in the long-term and
short-term. Immigrants often struggle to secure steady work because of either language or
cultural barriers, which lead them to other issues like difficulty securing affordable housing,
accessing services, or securing something even as basic as transportation.
Legal permanent residents also cannot secure work because of their citizenship status,
which some places require before the hiring process even begins. Immigrants struggled ten years
ago, and continue to struggle now. Immigrants were food-insecure then, and they are food-
insecure now. The only difference is that we now live in “anti-immigrant times” (Participant 1,
2019). The anti-immigrant rhetoric has carried over from previous administrations through
policies, speeches by Presidents, media sources shaming welfare and immigrant dependence on
benefits. This fear has accumulated layer by layer, speech by speech (Participant 1, 2019). The
language and sensationalization by the media made any new and unfamiliar rule changes like the
public charge rule even scarier, especially since media reporting is seldom in an immigrant’s
native language.
“I [myself] even...get flustered and [I know] the rules and guidelines so well. I have an
understanding of how it will and will not affect people and turning on the news stations
and hearing about broadcasters talk about it in a really intense way can be sometimes
!60

falsifying and exaggerated. I find myself sitting there going, ‘you’re making it too
dramatic’” - Participant 1 on the media’s sensationalization, 2019
11. Conclusions
The lack of support for the SNAP program overall predates this administration, but the
current administration’s anti-immigrant rhetoric is causing immigrant populations to disenroll
from the program. Nationwide, participants are disenrolling from the SNAP program and have
been doing so even prior to the Trump administration. Statewide in California, participants are
disenrolling from the program. The hostile political climate is changing the way immigrant
populations in San Diego view the program and their inclination to enroll in the program.
Immigrant populations nationwide are disenrolling from the program.
The rampant political anti-immigrant rhetoric from this current administration,
exacerbated by the historical lack of support from past administrations for welfare in general, has
created a feedback loop that causes losses for the economy, a loss of available jobs, and a toxic
social and economic environment for immigrant groups. A visual illustration of this cycle is
included below in figure 6. The political anti-immigrant rhetoric has created more difficulty for
immigrants looking for work. Immigrants who hear about the possibility of SNAP benefits
potentially being a factor in jeopardizing their immigration status are now unwilling to enroll in
them even if they need the benefits to supplement their incomes. If 35% of the “chilling effect”
population in California disenrolls from the program, there would be $2.8 billion of economic
output lost. Statewide, 17,700 jobs would be lost. In San Diego County alone, the loss in
economic output alone would be $177 million. Throughout San Diego County, 1,200 jobs would
!61
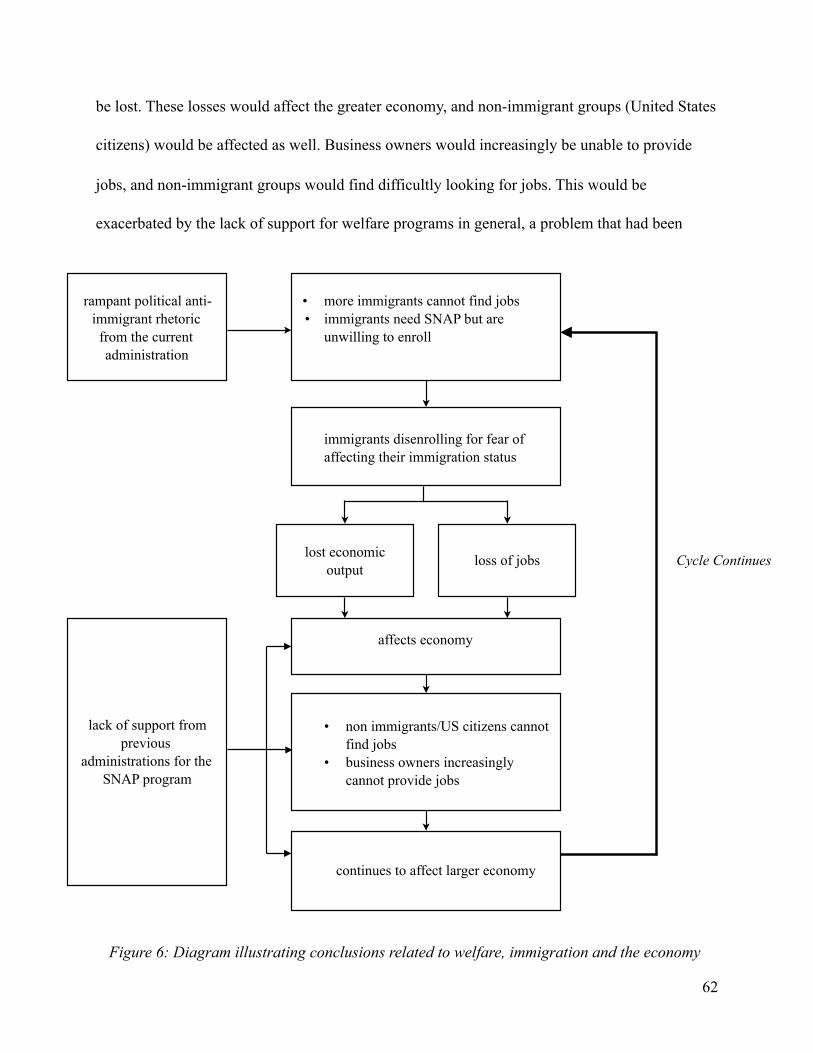
be lost. These losses would affect the greater economy, and non-immigrant groups (United States
citizens) would be affected as well. Business owners would increasingly be unable to provide
jobs, and non-immigrant groups would find difficultly looking for jobs. This would be
exacerbated by the lack of support for welfare programs in general, a problem that had been
!62
rampant political anti-immigrant rhetoric
from the current administration
• more immigrants cannot find jobs • immigrants need SNAP but are
unwilling to enroll
immigrants disenrolling for fear of affecting their immigration status
lost economic output
loss of jobs
affects economy
• non immigrants/US citizens cannot find jobs
• business owners increasingly cannot provide jobs
continues to affect larger economy
lack of support from previous
administrations for the SNAP program
Cycle Continues
Figure 6: Diagram illustrating conclusions related to welfare, immigration and the economy

building for many decades through different administrations. The loss of economic output from
this lack of support would contribute to the lack of jobs that would be otherwise available. The
vicious cycle would continue in an unsustainable manner.
Welfare continues to be debated in and outside of politics. Politicians use welfare reform
as a central aspect of their platforms in their bids to get elected, but more importantly, to get re-
elected. The American public questions the extent to which public benefits should be so readily
available. If the benefits are so easily obtainable, what is the incentive to get a proper job? If
food benefits are given in the form of non-cash, will recipients who have addictions use the cash
they do have on illegal substances? If policies change and food benefits do become less readily
available, are these benefits enough for survival? In the 1990’s, people were forced to work for
their benefits as recipients donned yellow and orange vests and picked up trash in public parks.
These workfare programs were part of the incentive to shape welfare recipients into productive
members of society, but in a demeaning manner. The proposed rule around able-bodied adults
attempts to do the same thing, but without the humiliating process. There seems to be a return
back in time to old processes, policies and mindsets that very clearly do not work. Welfare seems
to be a constant battle and evaluation of society’s moral compass.
A whole different challenge is posed when immigration is added to the already-complex
situation. The cultural barriers that immigrants face can take months, if not years, to overcome.
Some barriers can never be overcome. The current political climate has been described by
interview participants as hostile and unwelcoming, especially towards immigrants with legal
residency status and immigrants who are undocumented. Amid the Trump administration’s
hastily signed executive orders banning entry to immigrants from countries deemed a security
!63
risk and continued conversations about building a border wall lie a more discreet, covert and
slower process of removing immigrants from their country. If this cannot be done, the
administration is seeking to creating an atmosphere of fear will be enough to ensure that hardship
for immigrant groups. If the American public are uncertain of feeding even their own citizens,
why would they want the responsibility of providing for immigrants if there are no benefits to
themselves?
Food insecurity affects all aspects of a person’s life. Individuals who are food insecure
report worrying about their hunger because it weakens their concentrations. As a result of this,
they are unable to carry out their responsibilities, which see an impact on their jobs. They watch
their children struggle with their school work, and worry about how their inability to complete
schoolwork to the best of their ability affects their futures. Parents end up giving food to their
children, undermining their own bodies in the process to keep their children fed. This food
insecurity has to be juggled with other issues and bills. Overall, it impacts family dynamics and
health and brings out negative behaviors and increased emotional challenges (SPIN). Hunger lies
at the root of society’s problems and impacts the economy, school systems, healthcare and social
services.
There is an abundance of research in the fields of Social Work and Public Health related
to the topic of food insecurity, welfare and immigration. Although there is a lack of research in
the planning field, planners belong to a circle of professionals who have combined expertise in
many different areas of study and exert some form of control, however limited, over the built
environment. Planners have an obligation and responsibility to ensure that our economies are
able to grow in a sustainable fashion. Our efforts, ultimately, should be concentrated on
!64

supporting and advocating for the social equity of both immigrant and non-immigrant groups
through academic research, participatory processes with our local communities and influencing
policymakers.
!65
Appendix A
Interview Prompts for Staff/Personnel Introduction: Thank you for taking time out of your busy
schedule to participate in this interview. This will take no longer than 60 minutes of your time,
and prior to us getting started, I would like to review the consent form, get your signature on the
form should you decide you would like to stay and continue with participation.
Prompts:
1. Please tell me when you arrived at [this organization/public agency], about your position, and
how long you have been working in this capacity.
2. Please share with me what you know about the SNAP (Supplemental Nutrition Assistance
Program), also known as CalFresh.
3. Please share with me what you know about the current policies and changes that may be
taking place within the federal and state administrations today that will affect the SNAP
program.
4. Please share with me what you know about immigrants in San Diego and their dependence on
programs like CalFresh that help supplement their income and provide fresh food.
5. In your opinion, do you think that these changing policies and political climate directly impact
immigrants and their relationship with food? How have these challenges manifested?
6. How do you think these challenges and perceptions now affect the way the CalFresh program
operates and its effectiveness?
For organizations that conduct CalFresh outreach:
7. How have these changing perceptions affected your ability to conduct CalFresh outreach and
your success in signing immigrant clients up for the program?
!66

Appendix B
Appendix B provides tables from the United States Department of Agriculture (USDA) regarding
income eligibility standards from fiscal year 2018 and fiscal year 2019.
Supplemental Nutrition Assistance Program (SNAP) Fiscal Year (FY) 2019 Income Eligibility Standards: Gross Monthly Income Limit (130% of Federal Poverty Level)
Tables provide the monthly income eligibility standards for FY 2019 (effective October 1, 2018 through September 30, 2019)
Household Size 48 States, District of Columbia, Guam, Virgin Islands Alaska Hawaii
1 $1,316 $1,645 $1,513
2 $1,784 $2,230 $2,051
3 $2,252 $2,815 $2,590
4 $2,720 $3,400 $3,128
5 $3,188 $3,985 $3,666
6 $3,656 $4,570 $4,205
7 $4,124 $5,155 $4,743
8 $4,592 $5,740 $5,282
Each Additional Member
+$458 +$585 +$539
Supplemental Nutrition Assistance Program (SNAP) Fiscal Year (FY) 2019 Income Eligibility Standards: Net Monthly Income Limit (100% of Federal Poverty Level)
Tables provide the monthly income eligibility standards for FY 2019 (effective October 1, 2018 through September 30, 2019)
Household Size 48 States, District of Columbia, Guam, Virgin Islands Alaska Hawaii
1 $1,012 $1,265 $1,164
2 $1,372 $1,715 $1,578
3 $1,732 $2,165 $1,992
4 $2,092 $2,615 $2,405
!67
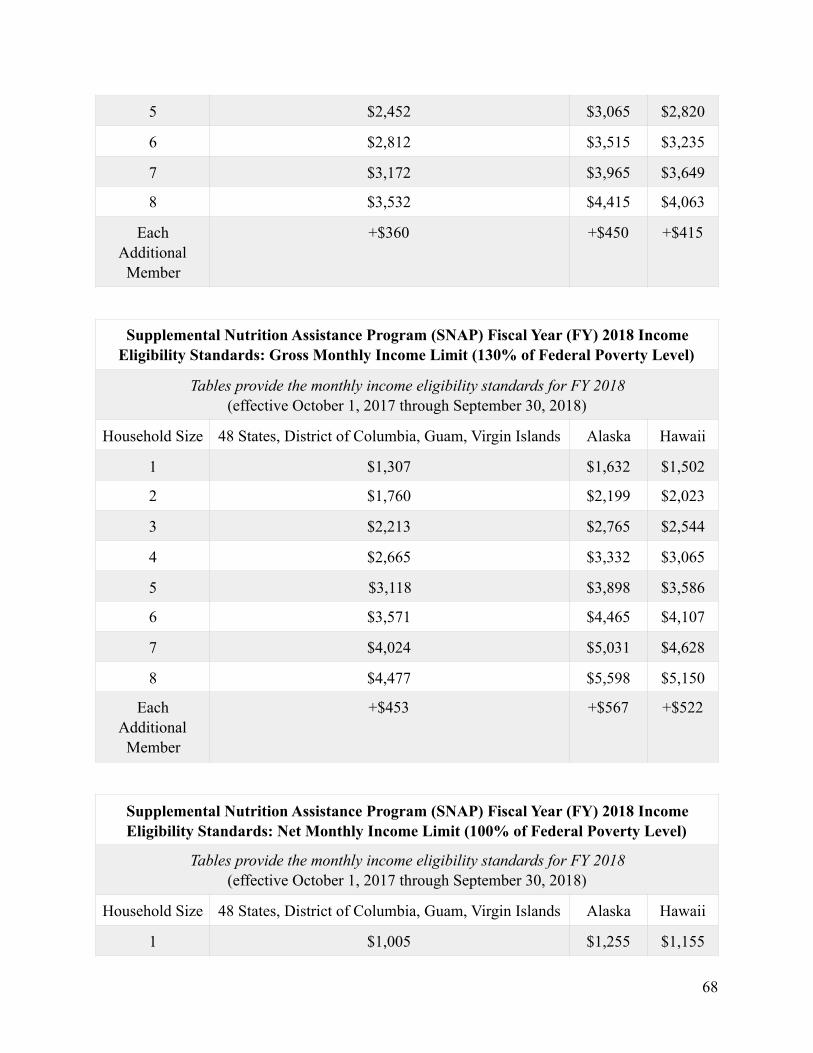
5 $2,452 $3,065 $2,820
6 $2,812 $3,515 $3,235
7 $3,172 $3,965 $3,649
8 $3,532 $4,415 $4,063
Each Additional Member
+$360 +$450 +$415
Supplemental Nutrition Assistance Program (SNAP) Fiscal Year (FY) 2018 Income Eligibility Standards: Gross Monthly Income Limit (130% of Federal Poverty Level)
Tables provide the monthly income eligibility standards for FY 2018 (effective October 1, 2017 through September 30, 2018)
Household Size 48 States, District of Columbia, Guam, Virgin Islands Alaska Hawaii
1 $1,307 $1,632 $1,502
2 $1,760 $2,199 $2,023
3 $2,213 $2,765 $2,544
4 $2,665 $3,332 $3,065
5 $3,118 $3,898 $3,586
6 $3,571 $4,465 $4,107
7 $4,024 $5,031 $4,628
8 $4,477 $5,598 $5,150
Each Additional Member
+$453 +$567 +$522
Supplemental Nutrition Assistance Program (SNAP) Fiscal Year (FY) 2018 Income Eligibility Standards: Net Monthly Income Limit (100% of Federal Poverty Level)
Tables provide the monthly income eligibility standards for FY 2018 (effective October 1, 2017 through September 30, 2018)
Household Size 48 States, District of Columbia, Guam, Virgin Islands Alaska Hawaii
1 $1,005 $1,255 $1,155
!68

Appendix C
2 $1,354 $1,691 $1,556
3 $1,702 $2,127 $1,957
4 $2,050 $2,563 $2,358
5 $2,399 $2,999 $2,759
6 $2,747 $3,435 $3,160
7 $3,095 $3,870 $3,560
8 $3,444 $4,306 $3,961
Each Additional Member
+$349 +$436 +$401
Supplemental Nutrition Assistance Program (SNAP) Fiscal Year (FY) 2019 Income Eligibility Standards: Gross Monthly Income Limit (200% of Federal Poverty Level)
Table provides the monthly income eligibility standards for FY 2019 (effective October 1, 2018 through September 30, 2019)
Household Size California
1 $2,024
2 $2,744
3 $3,464
4 $4,184
5 $4,904
6 $5,624
7 $6,344
!69

References
ACLU. (n.d.). Abuse of Immigration Detention. Retrieved January 15, 2019, from https://
www.aclu.org/issues/immigrants-rights/immigrants-rights-and-detention/abuse-
immigration-detention
ACLU. (Ed.). (n.d.). The Constitution in the 100-Mile Border Zone. Retrieved March 3, 2019,
from https://www.aclu.org/other/constitution-100-mile-border-zone
Agriculture Improvement Act of 2018. H.R. 2, 115th Cong. (2017-2018).
Am I Eligible for SNAP? (n.d.). Retrieved from https://www.fns.usda.gov/snap/recipient/
eligibility#What deductions are allowed in SNAP?
America Cannot Eat Without Immigrant Food Workers. Here Are Their Stories. Retrieved from
https://newfoodeconomy.org/hands-that-feed-us-immigrant-food-workers-in-their-own-
words/
APA Policy Guide on Community and Regional Food Planning. (2007, May 11). Retrieved from
https://www.planning.org/policy/guides/adopted/food.htm
Banerjee, A. V., Hanna, R., Kreindler, G., & Olken, B. A. (2017). Debunking the Stereotype of
the Lazy Welfare Recipient: Evidence from Cash Transfer Programs Worldwide. World
Bank Research Observer, 32(2), 155th ser., 155-184. doi:10.2139/ssrn.2703447
Batalova, J., Fix, M., & Greenberg, M. (2018, June). Chilling Effects: The Expected Public
Charge Rule and Its Impact on Legal Immigrant Families’ Public Benefits Use (Rep.).
Retrieved March 16, 2019, from Migration Policy Institute website: https://
www.migrationpolicy.org/research/chilling-effects-expected-public-charge-rule-impact-
legal-immigrant-families
CalFresh Reduces Hunger in Every County in California, but Changes at the Federal Level
Could Cut Benefits. (2017, January 19). Retrieved from https://calbudgetcenter.org/
resources/calfresh-reduces-hunger-every-county-california-changes-federal-level-cut-
benefits/
CalFresh FAQs. (n.d.). Retrieved from https://www.sandiegocounty.gov/hhsa/programs/ssp/
food_stamps/faqs.html
!70
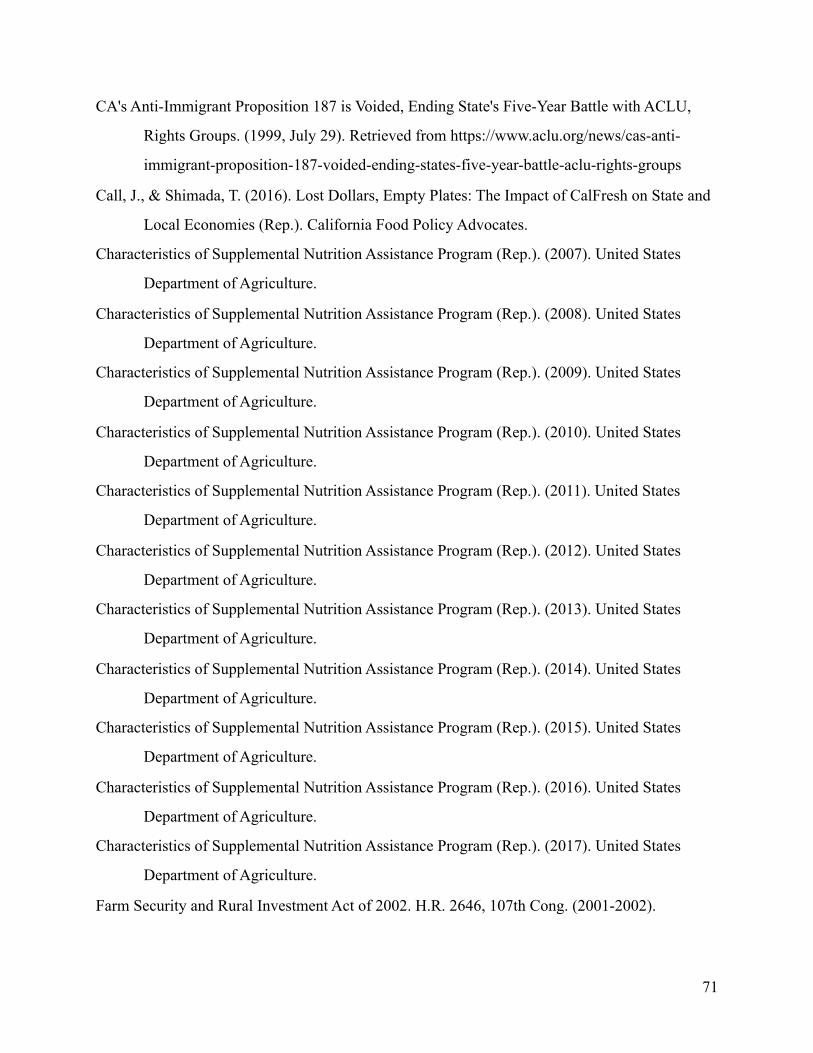
CA's Anti-Immigrant Proposition 187 is Voided, Ending State's Five-Year Battle with ACLU,
Rights Groups. (1999, July 29). Retrieved from https://www.aclu.org/news/cas-anti-
immigrant-proposition-187-voided-ending-states-five-year-battle-aclu-rights-groups
Call, J., & Shimada, T. (2016). Lost Dollars, Empty Plates: The Impact of CalFresh on State and
Local Economies (Rep.). California Food Policy Advocates.
Characteristics of Supplemental Nutrition Assistance Program (Rep.). (2007). United States
Department of Agriculture.
Characteristics of Supplemental Nutrition Assistance Program (Rep.). (2008). United States
Department of Agriculture.
Characteristics of Supplemental Nutrition Assistance Program (Rep.). (2009). United States
Department of Agriculture.
Characteristics of Supplemental Nutrition Assistance Program (Rep.). (2010). United States
Department of Agriculture.
Characteristics of Supplemental Nutrition Assistance Program (Rep.). (2011). United States
Department of Agriculture.
Characteristics of Supplemental Nutrition Assistance Program (Rep.). (2012). United States
Department of Agriculture.
Characteristics of Supplemental Nutrition Assistance Program (Rep.). (2013). United States
Department of Agriculture.
Characteristics of Supplemental Nutrition Assistance Program (Rep.). (2014). United States
Department of Agriculture.
Characteristics of Supplemental Nutrition Assistance Program (Rep.). (2015). United States
Department of Agriculture.
Characteristics of Supplemental Nutrition Assistance Program (Rep.). (2016). United States
Department of Agriculture.
Characteristics of Supplemental Nutrition Assistance Program (Rep.). (2017). United States
Department of Agriculture.
Farm Security and Rural Investment Act of 2002. H.R. 2646, 107th Cong. (2001-2002).
!71

Danielson, Caroline. (n.d). Public Policy Institute. Retrieved from https://www.ppic.org/
publication/the-calfresh-food-assistance-program/
De Genova, N. (2018, May 28). "New Poverty Politics for Changing Times: What Emerging
Nationalist Populisms Mean for Poverty and Inequality" A Project of the Relational
Poverty Network [Interview by A. Roy]. Retrieved January 22, 2019, from http://
depts.washington.edu/relpov/on-migration-borders-and-freedoms/
Dickinson, M. (2016). Working for food stamps: Economic citizenship and the post-Fordist
welfare state in New York City. American Ethnologist,43(2), 270-281. doi:10.1111/amet.12304
East, Chloe N., 2018. "Immigrants’ labor supply response to Food Stamp access," Labour
Economics, Elsevier, vol. 51(C), pages 202-226.
Edin, K., & Shaefer, H. L. (2016). $2.00 a day: Living on almost nothing in America. Boston:
Mariner Books.
Expanding CalFresh to SSI/SSP Recipients Beginning June 1, 2019. (n.d.). Retrieved from
https://www.cdss.ca.gov/inforesources/CalFresh/Supplemental-Security-Income
Greenhill, K. M. (2018, December 07). How Trump Manipulates the Migration Debate.
Retrieved from https://www.foreignaffairs.com/articles/united-states/2018-07-05/how-trump-
manipulates-migration-debate
House Farm Bill Would Increase Food Insecurity and Hardship. (2018, July 30). Retrieved
March 13, 2019, from https://www.cbpp.org/research/food-assistance/house-farm-bill-
would-increase-food-insecurity-and-hardship
Kaiserman, B. (2018, November 29). Farm Bill Deal Reached Without New SNAP
Requirements. Retrieved February 8, 2019, from https://www.forbes.com/sites/
bethkaiserman/2018/11/29/farm-bill-deal-reached-without-new-snap-requirements/
#5a8e5ace3e7f
Interview Participant 1. (2019, February 8). Thesis Information Interview [Telephone interview].
Interview Participant 2. (2019, February 14). Thesis Information Interview [Telephone
interview].
Interview Participant 3. (2019, February 18). Thesis Information Interview [Telephone
interview].
!72
Interview Participant 4. (2019, February 19). Thesis Information Interview [Telephone
interview].
Interview Participant 5. (2019, February 18). Thesis Information Interview [Telephone
interview].
Interview Participant 6. (2019, February 27). Thesis Information Interview [Telephone
interview].
Interview Participant 7. (2019, February 18). Thesis Information Interview [Telephone
interview].
Interview Participant 8. (2019, March 12). Thesis Information Interview [Telephone interview].
Moffat, T., Mohammed, C., & Newbold, K. B. (2017). Cultural Dimensions of Food Insecurity
among Immigrants and Refugees. Human Organization,76(1), 15-27.
Mosbergen, D. (2018, November 29). In First-Of-Its-Kind Lawsuit, Baltimore Sues Trump Over
Immigrants' Access To Benefits. Retrieved from https://www.huffingtonpost.com/entry/
baltimore-trump-lawsuit-immigrant-benefits-public-
charge_us_5bffa782e4b0864f4f6a2aaa
Ponce, N., Lucia, L., & Shimada, T. (2018, December). How Proposed Changes to the "Public
Charge" Rule Will Affect Health, Hunger and the Economy in California Data Tables
(Rep.). Retrieved http://healthpolicy.ucla.edu/publications/Documents/PDF/2018/
PublicChargeDataTables.pdf
Ponce, N., Lucia, L., & Shimada, T. (2018, December). How Proposed Changes to the "Public
Charge" Rule Will Affect Health, Hunger and the Economy in California Methods (Rep.).
Retrieved https://healthpolicy.ucla.edu/newsroom/Documents/2018/public-charge-
seminar-slides-nov2018.pdf
Ponce, N., Lucia, L., & Shimada, T. (2018, December). How Proposed Changes to the "Public
Charge" Rule Will Affect Health, Hunger and the Economy in California [Presentation
Slides]. Retrieved from https://healthpolicy.ucla.edu/newsroom/Documents/2018/public-
charge-seminar-slides-nov2018.pdf
!73
Patterson, T. (2019, February 21). Senator Wiener Introduces SB 285- CalFresh Connect!
Retrieved March 1, 2019, from https://cfpa.net/senator-wiener-introduces-sb-285-
calfresh-connect/#more-15102
Program Access Index (PAI) 2017. (n.d.). Retrieved from https://cfpa.net/program-access-index-
pai-2017/
Public Charge. Immigrant Legal Resource Center. (n.d.). Retrieved December 8, 2018, from
https://www.ilrc.org/public-charge
Public Charge. (n.d). Retrieved from https://www.nilc.org/issues/economic-support/pubcharge/
Remarks by President Trump at a California Sanctuary State Roundtable. (May 18, 2018).
Retrieved from https://www.whitehouse.gov/briefings-statements/remarks-president-
trump-california-sanctuary-state-roundtable/
Quinn, E. and Rodgers, M. (2018, November). Public Charge and Naturalization. Retrieved
March 11, 2019 from https://www.ilrc.org/sites/default/files/resources/
public_charge_naturalization-20181121.pdf.
S.B. 285, 2019 Senate, 2019 Reg. Sess. (Ca. 2019)
Sano, Y., Garasky, S., Greder, K. A., Cook, C. C., & Browder, D. E. (2010). Understanding Food
Insecurity Among Latino Immigrant Families in Rural America. Journal of Family and
Economic Issues,32(1), 111-123.
Slade, C., Baldwin, C., & Budge, T. (2016). Urban Planning Roles in Responding to Food
Security Needs. Journal of Agriculture, Food Systems, and Community Development,
7(1), 1-16. doi:10.5304/jafscd.2016.071.005
SNAP Policy on Non-Citizen Eligibility. (n.d.). Retrieved from https://www.fns.usda.gov/snap/
eligibility/citizen/non-citizen-policy
Supplemental Nutrition Assistance Program Education (SNAP-Ed). (n.d.). Retrieved November
12, 2018, from https://www.fns.usda.gov/snap/supplemental-nutrition-assistance-
program-education-snap-ed
Supplemental Nutrition Assistance Program (SNAP) FY 2018 Income Eligibility Standards.
(n.d.). Retrieved April 30, 2019 from https://fns-prod.azureedge.net/sites/default/files/
snap/FY18-Income-Eligibility-Standards.pdf
!74

Supplemental Nutrition Assistance Program (SNAP) FY 2019 Income Eligibility Standards.
(n.d.). Retrieved April 30, 2019 from https://fns-prod.azureedge.net/sites/default/files/
snap/FY19-Income-Eligibility-Standards.pdf
SNAP-Eligible Households. (n.d.). Retrieved from https://hungerandhealth.feedingamerica.org/
explore-our-work/programs-target-populations/snap-eligible-households/
Torbati, Y. (2018, February 09). Exclusive: Trump administration may target immigrants who use
food. Retrieved from https://www.reuters.com/article/us-usa-immigration-services-
exclusive/exclusive-trump-administration-may-target-immigrants-who-use-food-aid-
other-benefits-idUSKBN1FS2ZK
Understanding SNAP, the Supplemental Nutrition Assistance Program, formerly Food Stamps.
(n.d.). Retrieved from https://www.feedingamerica.org/take-action/advocate/federal-
hunger-relief-programs/snap
USDA to Restore Original Intent of SNAP: A Second Chance, Not A Way of Life. (n.d.).
Retrieved from https://www.usda.gov/media/press-releases/2018/12/20/usda-restore-
original-intent-snap-second-chance-not-way-life
U.S. Census Bureau (2017). Total Population. 2013-2017 American Community Survey 5-Year
Estimates. Retrieved from https://calbudgetcenter.org/resources/calfresh-reduces-hunger-
every-county-california-changes-federal-level-cut-benefits/
U.S. Census Bureau (2017). Food Stamps/Supplemental Nutrition Assistance Program (SNAP).
2013-2017 American Community Survey 5-Year Estimates. Retrieved from https://
factfinder.census.gov/faces/tableservices/jsf/pages/productview.xhtml?
pid=ACS_17_5YR_S2201&prodType=table
Utych, S. M. (2017). How Dehumanization Influences Attitudes toward Immigrants. Political
Research Quarterly,71(2), 440-452. doi:10.1177/1065912917744897
Walsemann, K. M., Ro, A., & Gee, G. C. (2017). Trends in food insecurity among California
residents from 2001 to 2011: Inequities at the intersection of immigration status and
ethnicity. Preventive Medicine,105, 142-148.
¡Más Fresco! More Fresh. (n.d.). Retrieved February 20, 2019, from https://
ucsdcommunityhealth.org/work/morefresh/
!75
New Food Economy. (2018, November 15). America cannot eat without immigrant food
workers. These are their stories. Retrieved from https://newfoodeconomy.org/hands-that-
feed-us-immigrant-food-workers-in-their-own-words/
Wainer, A. (2011). Farm Workers and Immigration Policy (Rep. No. 12). Bread for the World
Institute.
Waters, M. C., & Jiménez, T. R. (2005). Assessing Immigrant Assimilation: New Empirical and Theoretical Challenges. Annual Review of Sociology,31(1), 105-125. doi:10.1146/ annurev.soc.29.010202.100026
Additional News Articles
California budget takes steps to address state's drinking water crisis. (2017, June 16). Retrieved
March 15, 2019, from https://www.rcac.org/press-release/california-budget-takes-steps-
address-states-drinking-water-crisis/
Center on Budget and Policy Priorities. (2018, February 14). Policy Basics: The Supplemental
Nutrition Assistance Program (SNAP). Retrieved October 31, 2018, from https://
www.cbpp.org/research/policy-basics-the-supplemental-nutrition-assistance-program-
snap
Dewey, C. (2017, March 16). Immigrants are going hungry so Trump won't deport them.
Retrieved October 23, 2018, from https://www.washingtonpost.com/news/wonk/wp/
2017/03/16/immigrants-are-now-canceling-their-food-stamps-for-fear-that-trump-will-
deport-them/?noredirect=on&utm_term=.f3287b18d7f9
Global Citizen. (2014, December 12). The 7 biggest challenges facing refugees and immigrants
in the US. (n.d.). Retrieved from https://www.globalcitizen.org/en/content/the-7-biggest-
challenges-facing-refugees-and-immig/
II, V. R. (2018, June 19). The Real Risk of Trump's Dehumanization of Immigrants. Retrieved
December 3, 2018, from https://www.theatlantic.com/politics/archive/2018/05/the-real-
risk-of-trumps-dehumanization-of-immigrants/560762/
Stein, J. (2018, December 20). President Trump signs $867 billion farm bill into law. Retrieved
from https://www.washingtonpost.com/business/2018/12/20/president-trump-signs-
billion-farm-bill-into-law/?utm_term=.6573ec3997f9
!76