the surf report 1 - who · the content of the surf report is available on the ... publications of...
TRANSCRIPT

The SuRF Report 1
Surveillance of Risk Factors related to noncommunicable diseases:
Current status of global data
Noncommunicable Diseases and Mental Health
World Health Organization
20 Avenue Appia
1211 Geneva 27
Switzerland
World Health Organization

2
WHO Library Cataloguing-in-Publication Data
The SuRF report 1. Surveillance of risk factors related to noncommunicable diseases: current status of global data.
(SuRF reports)
1.Chronic disease – epidemiology 2.Risk factors 3.Epidemiologic surveillance 4.Databases,Factual 5.Data collection – methods I.WHO Global NCD InfoBase Team II.Title: Surveillance of riskfactors related to noncommunicable diseases: current status of global data.
ISBN 92 4 158030 5 (NLM Classification: WT 500)
Acknowledgements
The World Health Organization wishes to acknowledge the support from the Governments of Australia, Canada, the Netherlands, Sweden and the United Kingdom towards the development ofthe WHO Global NCD InfoBase. The World Heart Federation provided additional support.
Invaluable contributions towards the development of the InfoBase, from which country profiles for the Surveillance of Risk Factors (SuRF) report have been drawn, have also been received from many organizations, institutions and individuals that are listed in the Acknowledgements section of the accompanying CD-ROM. The authors would like to acknowledge Dr Andreas Wielgosz and Dr Hongbo Liang at the WHO Collaborating Centre at the University of Ottawa. Their initial work on the CVD InfoBase was a precursor for the WHOGlobal NCD InfoBase. Technical support on internal WHO data bases was provided by Dr Chizuru Nishida (BMI data base), Emmanuel Guindon and Omar Shafey (NATIONS data base),and Dr Nina Rehn (Alcohol data base). Dr Sylvia Robles and colleagues in PAHO kindly allowed the useof the acronym, SuRF.
Dr Kate Strong leads a team at HQ which has included the following: Ms Maria Filimonenko, DrHongbo Liang, Ms Jaclynn Lippe, Ms Carina Marquez, Mr Sean McGrath, Ms Angela Newill, Ms TomokoOno, Ms Rachel Pedersen and Ms Yin Mun Tham. Support and co ordination in the Regional Officeswas provided by Dr Krishnan Anand (SEAR), Dr Maximillian de Courten (WPRO), Dr Djohar Hannoun(AFRO), Mr John Jabbour (EMRO), Dr Paz Rodriguez (AMRO) and Dr Aushra Shatchkute (EURO).
Copies can be obtained from:Email: [email protected] – Fax: +41 22 791 4769, The content of the SuRF report is available on the Internet at:http://www.who.int/ncd/surveillance/surveillance_publications.htm
Suggested citation: Strong K, Bonita R. The SuRF Report 1. Surveillance of Risk Factors related toNoncommunicable Diseases: Current status of global data. Geneva, World Health Organization, 2003.
© World Health Organization 2003
All rights reserved. Publications of the World Health Organization can be obtained from Marketing andDissemination, World Health Organization, 20 Avenue Appia, 1211 Geneva 27, Switzerland (tel: +41 22 7912476; fax: +41 22 791 4857; email: [email protected]). Requests for permission to reproduce or translateWHO publications – whether for sale or for noncommercial distribution – should be addressed to Publications, atthe above address (fax: +41 22 791 4806; email: [email protected]).
The designations employed and the presentation of the material in this publication do not imply the expressionof any opinion whatsoever on the part of the World Health Organization concerning the legal status of any coun-try, territory, city or area or of its authorities, or concerning the delimitation of its frontiers or boundaries. Dottedlines on maps represent approximate border lines for which there may not yet be full agreement.
The mention of specific companies or of certain manufacturers’ products does not imply that they are endorsed orrecommended by the World Health Organization in preference to others of a similar nature that are not mentioned.Errors and omissions excepted, the names of proprietary products are distinguished by initial capital letters.

3
ContentsPreface . . . . . . . . . . . . . . . . . . . . . . . . . . . . . . . . . . . . . . . . . . . . . . . . . . . . . . . . . . . . . . . . . . 4Summary . . . . . . . . . . . . . . . . . . . . . . . . . . . . . . . . . . . . . . . . . . . . . . . . . . . . . . . . . . . . . . . . 5
Introduction . . . . . . . . . . . . . . . . . . . . . . . . . . . . . . . . . . . . . . . . . . . . . . . . . . . . . . . . . . . . . . . . . . 6
WHO Global NCD InfoBase . . . . . . . . . . . . . . . . . . . . . . . . . . . . . . . . . . . . . . . . . . . . . . . . . . . 7
Methods . . . . . . . . . . . . . . . . . . . . . . . . . . . . . . . . . . . . . . . . . . . . . . . . . . . . . . . . . . . . . . . . . . 9
Contents of the SuRF report . . . . . . . . . . . . . . . . . . . . . . . . . . . . . . . . . . . . . . . . . . . . . . . . . 9Population data and average life expectancyStatistical methodsRisk factorsWHO’s approach to risk
Risk Factor methodology . . . . . . . . . . . . . . . . . . . . . . . . . . . . . . . . . . . . . . . . . . . . . . . . . . . . 12Tobacco useAlcohol consumptionPhysical inactivityFruit and vegetable intakeObesity and overweightRaised blood pressureRaised blood lipidsDiabetes
Data Sources . . . . . . . . . . . . . . . . . . . . . . . . . . . . . . . . . . . . . . . . . . . . . . . . . . . . . . . . . . . . . . . . . . 19
Country-level sources . . . . . . . . . . . . . . . . . . . . . . . . . . . . . . . . . . . . . . . . . . . . . . . . . . . . . . 19European RegionRegion of the AmericasSouth-East Asia Region and Western Pacific RegionEastern Mediterranean RegionAfrican RegionAdditional survey instrumentsGaps and deficiencies in data
WHO’s response to addressing the gaps in risk factor data . . . . . . . . . . . . . . . . . . . . . . . . 22
The WHO Global NCD Infobase . . . . . . . . . . . . . . . . . . . . . . . . . . . . . . . . . . . . . . . . . . . . . . . . . . . . . 23
Structure of the InfoBase . . . . . . . . . . . . . . . . . . . . . . . . . . . . . . . . . . . . . . . . . . . . . . . . . . . 23SourceSurvey methodsData entrySelecting data for displayDisplaying data in SuRF report format
Using the country profiles on CD-ROM . . . . . . . . . . . . . . . . . . . . . . . . . . . . . . . . . . . . . . . . . 27Future additions . . . . . . . . . . . . . . . . . . . . . . . . . . . . . . . . . . . . . . . . . . . . . . . . . . . . . . . . . . . 28
Vision for the future . . . . . . . . . . . . . . . . . . . . . . . . . . . . . . . . . . . . . . . . . . . . . . . . . . . . . . . . . . . . . 30
References . . . . . . . . . . . . . . . . . . . . . . . . . . . . . . . . . . . . . . . . . . . . . . . . . . . . . . . . . . . . . . . . . . 31
Appendices . . . . . . . . . . . . . . . . . . . . . . . . . . . . . . . . . . . . . . . . . . . . . . . . . . . . . . . . . . . . . . . . . . 32
Appendix 1: Acronyms and abbreviations . . . . . . . . . . . . . . . . . . . . . . . . . . . . . . . . . . . . . . . 32Appendix 2: Glossary . . . . . . . . . . . . . . . . . . . . . . . . . . . . . . . . . . . . . . . . . . . . . . . . . . . . . . . 33Appendix 3: Six tables for Regional Offices . . . . . . . . . . . . . . . . . . . . . . . . . . . . . . . . . . . . . 35

4
PrefaceUntil recently, risk factors such as raised blood pressure, cholesterol, tobacco use, excessalcohol consumption, obesity, and the diseases linked to them, were more commonly asso-ciated with developed countries. However, the World Health Report 2002: reducing risks,promoting healthy life, indicates that they are now becoming more prevalent in developingnations. These countries are being affected by a double burden of disease, the combinationof long-established infectious diseases and the rapidly growing epidemic of chronic, non-communicable diseases (NCDs). WHO has responded by giving higher priority to NCD pre-vention, control and surveillance in its programme of work. Now more than ever, standardmethods and tools are needed to enable countries to build and strengthen their capacity toconduct surveillance of NCDs and their risk factors.
One such tool is the WHO STEPwise approach to Surveillance (STEPS) of risk factors relat-ed to NCDs. It is a simplified, stepwise approach providing standardized materials andmethods to help countries, especially those that lack resources, initiate NCD activities. Thegoal is to achieve data comparability between countries over time.
The SuRF Report 1 introduces another tool, the WHO Global NCD InfoBase, which assem-bles, for the first time in one place, NCD risk factor data collected from WHO MemberStates. Data from the InfoBase is presented in the country profiles of the SuRF report andits associated CD-ROM attachment. Displaying the currently available data is the first steptowards improving NCD risk factor data collections. This is an on-going process. In the nextstep (SuRF 2), the available country data will be used to produce comparable estimates forrisk factor prevalence in WHO Member States. This will result in an advocacy tool with thepower to transform health policy by highlighting the need for primary prevention and healthpromotion.
Ruth Bonita, Derek Yach, Director Surveillance Executive Director
Noncommunicable Diseases and Mental Health World Health Organization
SummaryHigh quality health statistics are essential for planning and implementing health policy inall country settings. In fact noncommunicable disease (NCD) risk factor data are crucial forpredicting the future burden of chronic disease in populations and also for identifyingpotential interventions to reduce the future burden. The Surveillance of Risk Factors report(SuRF) presents, for the first time, country-level NCD risk factor prevalence data from theWHO Member States.
– The focus of the report is on recent, nationally representative data. – The risk factors of choice are those that make the greatest contribution to mortality and
morbidity from chronic disease, can be changed through primary intervention and areeasily measured in populations.
– Eight risk factors that relate mainly to cardiovascular disease fit this criteria: tobaccoand alcohol use, patterns of physical inactivity, low fruit/vegetable intake, obesity (asmeasured by BMI), blood pressure, cholesterol and diabetes (measured by blood glu-cose).
– Of principal importance to the data collection is the need to display prevalence data and(where possible) mean values for these 8 risk factors by age group(s) and sex and withsome measure of the uncertainty of the estimates for each Member State.
NCD risk factor information included in the SuRF report comes from a variety of sources,ranging from peer-reviewed journal articles to reports and unpublished data from Ministriesof Health. All of this information is held in the WHO Global NCD InfoBase, designed as a“one stop” resource for data needs. The NCD InfoBase is a timely tool for collecting anddisplaying current country-level NCD risk factor data and was used to create the countryprofiles of risk factor data displayed on the CD-ROM attachment to this report.
Much of the data gathered for the country profiles has been provided by data focal pointsin WHO Regional Offices. Plans are in place to develop Regional NCD InfoBases to improvethe country coverage for data on NCDs and their risk factors.
The format of SuRF 1 consists of a report booklet and CD-ROM attachment. It is the firststep in a series of SuRF reports and presents current country data that are largely noncomparable. The second step will be to produce harmonized prevalence estimates from theexisting country data. These comparable estimates will become a powerful tool in advocat-ing for primary prevention and health promotion. SuRF 1 will be followed by an interactivewebsite in the autumn of 2003.
5

IntroductionThe report on the Surveillance of Risk Factors (SuRF) assembles, for the first time, existingdata on the prevalence of the major risk factors related to noncommunicable diseases(NCDs) for WHO Member States. It focuses on recent, nationally representative data andpresents the data as they are reported by survey sources. The risk factors included in thereport are those that:– contribute the most to mortality and morbidity from chronic diseases;– can be changed through primary intervention; and – can easily be measured in populations.
The eight risk factors that fit this criteria are tobacco and alcohol use, patterns of physicalinactivity, low fruit/vegetable intake, obesity, raised blood pressure, raised cholesterol anddiabetes. It is important for the data collection to display prevalence and/or mean valuesfor these eight risk factors by age and sex, and with some measure of the uncertainty foreach estimate.
Knowledge of noncommunicable disease (NCD) risk factors is important for predicting theburden of chronic disease in populations and for identifying potential interventions toreduce such burdens. The World Health Report 2002: Reducing risks, promoting healthylife highlights the importance of risk factors as indicators of future health status (WHO,2002). Even in the poorest countries, NCD risk factors such as raised blood pressure, cho-lesterol and tobacco use are responsible for increasing levels of chronic diseases and pre-mature deaths. In fact, the joint effects of these three risk factors account for 65% of allcardiovascular diseases in those above the age of 30 (WHO, 2002). Furthermore, five ofthe top 10 global risks to health are NCD risk factors (Table 1). These include raised bloodpressure, tobacco use, alcohol consumption, cholesterol and obesity/overweight.
6
Table 1 Leading 10 selected risk factors as selected causes of disease burden (World Health Report 2002).Indicates major NCD Risk Factors.
Developing Countries Developed Countries
H I G H M O R T A L I T Y L O W M O R T A L I T Y
1. Underweight Alcohol Tobacco use
2. Unsafe sex Blood pressure Blood pressure
3. Unsafe water Tobacco use Alcohol
4. Indoor Smoke Underweight Cholesterol
5. Zinc deficiency High body mass index High body mass index
6. Iron deficiency Cholesterol Low fruit and vegetable intake
7. Vitamin A deficiency Low fruit and vegetable intake Physical inactivity
8. Blood pressure Indoor smoke Illicit drugs
9. Tobacco use Iron deficiency Unsafe sex
10. Cholesterol Unsafe water Iron deficiency

7
The risk factor preva-
lence profiles help to
identify a country’s
strengths as well as
gaps and deficiencies
in its data.
Unfortunately, country-level data on common, measurable NCD risk factors are scarce. Fewcountries have the resources, infrastructure or political commitment to collect this type ofinformation in a sustainable manner. While some developed countries have regular nationalhealth surveys that include selected NCD risk factors, others gather their informationthrough small, costly ad hoc surveys. The objective of this report is to promote the sustain-able collection of high quality risk factor data and to advocate establishing surveillancesystems for noncommunicable diseases and their risk factors as an alternative to costly adhoc surveys.
The risk factor prevalence profiles help to identify a country’s strengths as well as gaps anddeficiencies in its data. Where possible mean values for systolic blood pressure, total cho-lesterol, blood glucose and body mass index have been included to describe the distribu-tion of the risk factors in specific populations. The World Health Report 2002 demon-strates that NCD risk factors contribute significantly to the burden of disease in bothdeveloped and developing countries. Now is the time to assess the quality of NCD risk fac-tor information at the country-level so that this information can be improved and/orexpanded to provide the impetus for better health policy.
Valid and reliable health statistics are essential for planning and implementing health poli-cy in all settings. The first step is to identify and assess the quality of NCD risk factor datacollected globally. The SuRF report takes this first step and attempts to identify the mostrecent prevalence estimates for risk factors related primarily to cardiovascular disease.Some important country data may be missing by the time this document is published butcountry data collection is ongoing and additional information will be reflected in futureSuRF reports.
A main objective of the NCD surveillance programme is to use the collected country datato produce best estimates of country-level risk factor prevalence and trends in standard agegroupings. The resulting comparable risk factor estimates will be published in the SuRFreport 2. To help make country data accessible and comparable, data is being collectedand stored in a data base, the WHO Global NCD InfoBase.
WHO Global NCD InfoBase
The risk factor data displayed by the SuRF report come from the WHO Global NCDInfoBase. The InfoBase collects all, current country-level data on important NCD risk fac-tors for all WHO Member States. There are many different survey instruments available forcollecting data on health behaviours and physical measurements of risk exposure. Eachinstrument has advantages and limitations. For example, some countries have nationallyrepresentative surveys with good sampling frames and well defined methodology. In thesecases, the most recent national survey represents the best estimate of risk factor preva-lence for that country.
In other countries, where there is little data, surveys may be non-representative of thenational population, include non-probability sampling frames or have other limitationsreflected in the survey methodology. However, such surveys can still be used, taking intoaccount their limitations, to help build a model to estimate risk factor prevalence for acountry. Understanding the strengths and deficiencies of the data allows users to maximizethe use of the existing information for health policy and research purposes.

8
The NCD InfoBase displays all the surveys that a country has with information about surveydesign and representativeness and gives users the opportunity to select the surveys thatthey wish to display. In addition, the InfoBase contains risk factor prevalence data fromother WHO in-house data bases, including the NATIONS tobacco database, the WHOGlobal BMI database and the WHO Global Alcohol database. The InfoBase has a flexibledata base structure to allow the inclusion of disease-specific modules in the future. Dataon stroke and respiratory diseases are currently being included, as are measures of oralhealth. Indicators of injury and violence will be included in the future. A detailed accountof the structure of the InfoBase is given in Section 4.
The NCD InfoBase will be available on the internet towards the end of 2003. This tool foridentifying country-level data and assessing its validity provides a starting point for makingNCD risk factor data comparable. Displaying the available data in one place is the firststep towards developing better quality NCD data collections.
The data presented in this report are by no means complete and require continuing contactwith Ministries of Health and study authors. The SuRF report and the NCD InfoBase will beup-dated and published regularly with assistance from data focal points in all six WHOregional offices.
Understanding the
strengths and defi-
ciencies of the data
allows users
to maximize the use
of the existing infor-
mation for health
policy and research
purposes.

MethodsThis section explains some of the concepts that inform the selection and presentation ofNCD risk factors in the SuRF report. The report is made up of a brief text section and aCD-ROM containing a copy of the text section and complete country profiles of NCD riskfactor data for WHO Member States.
In addition, a list of abbreviations used in the country profiles and throughout the text is pro-vided at the beginning of this report. A glossary is also included to explain frequently usedterms. The CD-ROM includes a complete bibliography of the SuRF report country profilesand an extensive acknowledgement section to thank all who helped to provide country data.
Contents of the SuRF report
The advantage of the SuRF report is that it displays country risk factor profiles on CD-ROMto make the data more accessible. The CD-ROM format enables direct access to the dataon a computer instead of a unwieldy paper copy. The format displays the following informa-tion for each Member State:– all recent risk factor data;– age-specific prevalence rates or mean values;– survey sample sizes;– 95% confidence intervals;– risk factor definitions; and – complete source information.
In many cases, study authors or Ministries of Health have been contacted for additional,unpublished information about their risk factor surveys. Notes attached to the source refer-ence indicate where additional information has been provided and identifies the provider.
The SuRF report is a product of the NCD surveillance activities which follow a STEPwiseapproach. The first step is an ongoing project to provide up-to-date country data on NCDrisk factors. The second step will use the acquired country data to produce comparablebest estimates of country risk factor prevalence in standard age groupings. The third step isto use these comparable estimates to advocate for an improved policy response to thegrowing global burden of chronic disease.
Population data and average life expectancy
Each country profile is identified by the official name of the Member State, the WHO region towhich it belongs and general information about its population size and average life expectancy(Figure 1). Estimates of 2002 population size and age structure are based on the 2000and 2001 demographic assessments prepared by the United Nations Population Division.
9
Male Females
2002 Total Population 4,498,305 5,259,387
2020 Projected Population 4,836,000 5,121,000
2001 Average Life Expectancy (years) 71.9 78.8
Figure 1

These estimates are for the de facto population (e.g. including guest workers and refugees)rather than de jure population (e.g. citizens and, in some Member States, permanent resi-dents). As a result, these estimates may differ from official country statistics. WHO uses astandard method to estimate and project life tables for all Member States (WHO, 2002).This may lead to minor differences when compared to official life tables prepared byMember States. A 95% uncertainty interval is included for the average life expectancy esti-mates. These intervals take into account the uncertainty in the estimates due to sampling.
Statistical methods
Age specific rates are used to display the data in the SuRF report. These were calculatedby dividing the number of people exhibiting the risk factor of interest in each specified agegroup by the corresponding survey sample in the same age group. This rate is multiplied by100 to give the per-cent prevalence for particular age and sex groupings.
The age-specific prevalence rates presented in this report also show 95 % confidence inter-vals. Some surveys and study authors provided the InfoBase team with these values fromtheir own calculations. Where this was not possible, the InfoBase team estimated the con-fidence intervals, assuming a binomial distribution for the risk factor of interest in thespecified age range. These estimations were only done for the total age range provided bythe study.
For some countries with national risk factor surveys, the age-specific prevalence rates fromthe survey are weighted to the estimates of the national population, either from a recentpopulation census or from demographic models. If the national survey used a samplingframe with no systematic biases and good population coverage, these weighted prevalencevalues provide a reasonable estimate of national risk factor prevalence. In these cases, theSuRF report provides the weighted national prevalence estimate along with the actual surveysample size in the country profiles. This presentation is noted in the accompanying text.
Risk Factors
Risk factors are displayed following the order as outlined in the STEPwise approach toSurveillance of NCD risk factors (STEPS; Bonita et al., 2001). STEPS is a sequential pro-gram that focuses on building and strengthening country capacity for middle and lowincome countries to collect, on a periodic basis, small amounts of high quality risk factordata (Bonita et al. 2001; Figure 2). Step 1 is the collection of self-reported informationabout health behaviours, including tobacco use, alcohol consumption (heavy drinkers andabstainers), diet and physical inactivity. Step 2 focuses on objective standardized physicalmeasurements to collect data on blood pressure, height and weight. Finally, Step 3 collectsblood samples to measure lipids (cholesterol) and glucose status (for diabetes).
The SuRF report presents risk factors in accordance with the STEPwise approach toSurveillance of NCD risk factors (STEPS) protocol (Bonita et al., 2001). Key health behav-iours collected in Step 1 are reported first, followed by obesity/BMI and raised blood pres-sure from Step 2, and finally, raised blood lipids and diabetes from Step 3. The order inspecific country profiles depends on data availability. Many countries have limited datawhich may not cover all of the NCD risk factors included in this report. As a result, theirrisk factor profiles may be incomplete. However, countries with incomplete data have theopportunity to begin collecting standardized data using STEPS.
10
Preventive strategies,
targeting the whole
population, aim to
encourage healthier
behaviour and thus
reduce exposure to
risk.

WHO’s approach to risk
Risk of disease generally increases along a continuum of risk factor exposures, resulting in acontinuous population distribution of risk (Rose, 1992). For convenience, clinicians often focuson interventions for those at the far end of the spectrum, i.e. those considered to be at “highrisk” of disease. This focus creates arbitrary, dichotomous categories for those considered to beat risk, for example, systolic blood pressures greater than 140 mm Hg or greater than 160 mmHg. However, many people with lower risk exposures will develop disease. Furthermore, thebulk of the disease burden occurs where the greatest proportion of the population is exposed torisk and this may occur below a particular “high risk” threshold. As a result, preventive strate-gies that focus on shifting the entire distribution of the risk factor will prevent more diseasethan would be the case if only high risk groups were targeted. Preventive strategies, targetingthe whole population, aim to encourage healthier behaviour and thus reduce exposure to risk.
WHO uses a population-based approach to risk and prevention (WHO, 2002). For this reason,the SuRF report includes, whenever possible, data on the mean values of risk factors that aredistributed in a continuous manner. These are systolic blood pressure, BMI, total blood cho-lesterol and blood glucose. The addition of these factors means that the profile for a countrywith good data collections can include up to 13 risk factor variables (see Figure 3 below).
The preferred definitions for these risk factors are outlined in the next section. 11
Health Behaviours
– Tobacco use
– Alcohol consumption (heavy)
– Alcohol abstainers
– Physical inactivity
– Fruit/vegetable intake
Physiological Factors
– Obesity/overweight (& mean BMI)
– Raised blood pressure (& mean systolicblood pressure)
– Raised lipids (& mean total cholesterol)
– Diabetes (& mean blood glucose)
Disease outcomes
– Heart disease
– Stroke
– Cancers
– Diabetes
Figure 3
The WHO STEPs approach to NCD surveillance
The conceptual framework offers a distinction between different levels of risk-factor assessment: Information by:
– questionnaire– physical measerements– blood samples;
and three modules offering different quantity of detail of each risk factor:
– core– expanded core, and– optional
Figure 2
Optional 3
Optional 2
Optional 1
Expanded
Core

12
Risk Factor methodology
Tobacco use
The dried leaf of the plant, Nicotiana tabacum, is used globally in many forms includingsmoking, chewing or snuff. The product is cultivated in many regions and can be legallypurchased around the world.
In many countries, cigarette smoking is only a small part of actual tobacco use. In fact, insome places, more people use huqqa, bedi, snuff or some form of chewing tobacco thanmanufactured cigarettes. For these situations, the SuRF profiles also include available dataon other forms of tobacco use. The current pattern of tobacco use predicts the future bur-den of lung cancer and other smoking related disease. Policy makers can use this informa-tion to implement prevention strategies to avoid this burden. From this perspective, pastsmoking patterns are less important because they relate directly to the current burden oftobacco use in a country, not the future, preventable burden. The focus is on current, dailytobacco users therefore data on occasional and former users is not reported here.
Although comparable data on tobacco use are not widely available, most countries reportsome population-level statistics on tobacco use. WHO headquarters and Regional Officesproduce regular country profiles for tobacco use and a wide range of other tobacco relatedstatistics. A joint venture by WHO, the Centres for Disease Control (CDC) and the AmericanCancer Society (ACS), known as the NATIONS Tobacco database stores not only tobaccoprevalence data from most countries but a variety of important information about tobaccocontrol policies and legislation in these countries. In addition to published reports and on-line databases, WHO has developed, in collaboration with the CDC, the Global YouthTobacco Survey (GYTS). The GYTS is now the largest global surveillance system for anymajor public health risk. It is operational in 150 countries and has completed question-naires on over one million young people between the ages of 13 and 15 years in randomlyselected schools. The SuRF report displays data from the published GYTS surveys.
The definitions for tobacco use supplied by the survey sources are used in the country pro-files. No attempt has been made to standardize these definitions. The most common desig-nations include:– Current daily smoker (including definitions of “at least one cigarette per day”);– Smoker;– Regular smoker; and– User of some form of tobacco (including multiple sources).
Most surveys specify the meaning of “smoker” and “regular smoker” but often this is notrecorded. Where additional information is included about a definition, it is recorded in theNCD InfoBase and it is displayed in the risk factor definition section of the country profile.Table 2 shows the variety of definitions used to collect tobacco use prevalence data. Forreasons mentioned above, the preferred definition is “current daily smoker”.
The current pattern of
tobacco use predicts
the future burden
of lung cancer and
other smoking related
disease.

Alcohol Consumption
Alcohol consumption has many health and social consequences resulting from intoxicationand dependence. Direct health consequences range from automobile accidents and domes-tic violence to chronic health and social problems (WHO, 1999). However, there are alsoreported beneficial relationships between low to moderate drinking in a non-binge patternand coronary heart disease, stroke and diabetes mellitus (Rehm et al., 2001).
The definitions used for population-based data on alcohol consumption vary widely fromcountry to country. Many countries do not collect this information at all because alcoholconsumption is not permitted in their societies for religious reasons. Other countries collectand report the information without a standard definition for heavy consumption. The coun-try profiles display the definitions used by the survey source with the aim of providing themost specific definition possible for high alcohol consumers. Table 3 provides examples ofthe variety of definitions for high alcohol consumption that are routinely reported. TheWHO STEPS survey instrument uses 7 day recall of number of standard drinks to quantifyproportion of adults engaged in “at risk levels” of drinking.
Similarly, definitions for alcohol abstainers differ from country to country. Many studiesconsider only those who report ‘never drink alcohol’, while others simply report ‘abstainers’.Often, there is no way to differentiate between those who have tried alcohol but choose notto drink and those who have never had a drink. However, this distinction is unlikely toaffect the overall risk profile at the population level.
Table 2 Selected examples of definitions used and age groups included in surveys to collect prevalence of tobacco use.
Definition Age groups (years) Country of origin of the Source
Current daily smoker various combinations various
Regular smoker various combinations various
smoker various combinations various
Smoker; cigarettes 13-15 GYTS for various countries
Uses some form of tobacco (includes 18+ Afghanistan multiple sources)
Current daily smoker: 20-89 Venezuela> 10 cigarettes per day
Chew paan masala or tobacco 15+ India
Smoker (includes daily smoker) once a week 25-69 Bangladeshat least and less than once a week
Regular current smoking 12-45 Paraguay
Smoker; 1 to more than 15 cigarettes per day or 18+ Haiti1 to more than 2 pipe fulls of tobacco per day
Smoking or chewing tobacco leaf with betel quid 18-75 Bangladesh
13

14
Physical inactivity
Regular physical activity has health benefits including regulation of body weight andstrengthening of the cardiovascular system (CDC, 1996). Measuring the levels of activity orinactivity in a population has proved difficult. There is no internationally agreed definitionor measure of physical activity. To add to the problem, physical activity exists in multipledomains of a person’s life, from main occupation (especially if the job involves physicallabour), to means of transport, domestic duties and leisure time.
The SuRF report focuses on lack of activity as a risk factor for poor health outcomes, includ-ing overweight/obesity and cardiovascular disease. Again, definitions of physical inactivityvary in different country settings. Often high and middle income countries report activity orinactivity in “leisure” time, a concept that may not exist in low income situations. Mostavailable data are for leisure-time activity while little data are available for activity relating towork, transport or domestic tasks.
The country profiles display the definition provided by the survey source. Sometimes, surveyschoose to provide information related to specific activity levels as well as inactivity. Preferencewas given to including data in the country profiles that relate to physical inactivity ratherthan physical activity. The most frequently used definitions for physical inactivity are“sedentary” or “no exercise” categories.
The WHO STEPS survey instrument measures physical activity/inactivity across three domainsof life: work, leisure time and transport. It uses an activity score based on intensity of activityand time spent in activity to calculate the proportion of inactive adults.
Fruit and Vegetable intake
Fruits and vegetables are important components of a healthy diet designed to regulateweight and provide appropriate nutrients for growth and development. Low fruit and veg-etable intake is causally linked to incidence of cancer and heart disease (Ness and Powles,1997; World Cancer Research Fund and American Institute for Cancer Research, 1997).
Table 3 Selected examples of definitions and age groups included in surveys to collect prevalence of high alcoholconsumption.
Definition Age groups Country of origin of the source
reported alcohol dependency various combinations Various
drink alcohol 15 + Cameroon and various
daily drinkers various combinations Various
the ingestion of 100 cc of absolute alcohol 12-45 Paraguayat one time (opportunity)
alcohol consumption at least one time per year 12-49 Mexico
20+ g of alcohol daily intake 20-49 Czech Republic
0ver 0.2 L of alcohol per day 26-62 Bosnia and Herzegovina
heavy alcohol consumption in the past year; 20+ USAmore than 14 drinks per week for men and more than 7 drinks per week for women
There is no interna-
tionally agreed defini-
tion or measure of
physical activity.

15
Health promotion programmes emphasize the importance of eating five or more servings offruit and vegetables combined a day. Some developed countries collect this information intheir national health surveys. Other surveys collect information on presumed average fruitand vegetable intake per capita. Still others find it easier to report ‘never eats fruit’ or‘never eats vegetable’ as categories. The country profiles in the SuRF report display thedefinitions given by the survey source.
Definitions that designate the part of the population that is not eating enough fruit andvegetable are preferred because they relate directly to the risk category of low fruit andvegetable intake. Such definitions include “less than or equal to five fruit and vegetableservings per day”, “never eats vegetables”, and “never eats fruit”.
The WHO STEPs survey instrument collects information on how many servings of fruit andvegetable are eaten on a typical day and uses this information to calculate the proportionof adults who are not eating 5 or more combined servings of fruit and vegetable.
Obesity and overweight
The prevalence of obesity and overweight is commonly assessed using body mass index(BMI, kg/m2). This formula has a strong correlation to body fat content. The WHO criteriadefine overweight as BMI greater than or equal to 25 kg/m2 and obesity as BMI greaterthan or equal to 30 kg/m2 (WHO, 2000). These criteria provide a benchmark for measuringoverweight and obesity but the risks of disease in a population increase progressively fromBMI levels of 20 to 22 kg/m2.
BMI generally increases with age, peaking in the middle-aged and elderly, who are at great-est risk of health complications. The increase corresponds to higher levels of free sugarsand saturated fats in the diet combined with reduced physical activity.
Many surveys report prevalence of obesity and overweight using the WHO criteria for meas-ured height and weight and this is the preferred definition. However, a variety of other defi-nitions are also displayed in the country profiles, reflecting what is being collected at thecountry-level. Table 4 displays examples of the variety of obesity definitions currently in use.
Often the BMI categories reflect self-reported height and weight and this is indicated inthe country profile definitions. Measured data is preferred because self-reported height andweight may differ significantly from measured height and weight and the deviations willresult in biased BMI estimates (Waters, 1993). Mean values for BMI in specific age group-ings are preferred in line with WHO’s population-based approach to distribution of riskexposures (WHO, 2002).
Table 4 Selected examples of definitions used and age groups included in surveys to report prevalence of obesity.
Definition Age groups Country of origin of the source
BMI>=25 (stated to define obese) various combinations various
BMI>=30 various combinations various
BMI greater than or equal to 27.8 for males 20-70 Argentinaand 27. 3 for females
BMI greater than 27 for males and greater 20+ Cook Islands; Kiribatithan 25 for females
Health promotion
programmes empha-
size the importance
of eating five or more
servings of fruit
and vegetables
combined a day.

16
Raised blood pressure
Blood pressure is a measure of the force that the circulating blood exerts on the walls of themain arteries. The highest (systolic) pressure is created by the heart contracting and the low-est (diastolic) pressure is measured as the heart fills. Raised blood pressure is almost alwayswithout symptoms but the result is structural damage to the arteries that supply blood tothe major organs of the body. This damage eventually results in stroke, ischaemic heart dis-ease, renal failure and other diseases. It is becoming increasingly clear that the risk of theseconditions is not limited to those with particularly high levels of blood pressure, but also forthose with average or even below average levels of blood pressure (Law and Wald, 2002;Eastern Stroke and Coronary Heart Disease Collaborative Group, 1998).
Studies that measure blood pressure are preferred to those that collect self-reported raisedblood pressure status. Still, many national health surveys lack the capacity to collect themeasured data for their large survey samples. In the SuRF report, country profile defini-tions include the status of the data as measured or self-reported. The most common desig-nation for the prevalence of raised blood pressure is ‘systolic blood pressure greater than orequal to 140 mm Hg and/or diastolic blood pressure greater than or equal to 90 mm Hg’.Often those on anti-hypertension medication are also included in the definition (Table 5).Some surveys prefer to use a higher definition for raised blood pressure and include onlythose with ‘systolic blood pressure greater than or equal to 160 mm Hg and/or diastolicblood pressure greater than or equal to 95 mm Hg. This definition may or may not includethose on anti-hypertension medication. It is clear that such a definition is inadequate forsurveillance purposes, especially for a population-based approach to preventing cardiovas-cular disease.
Recognizing the limitations of the above definitions, many surveys are also starting to reportmeasured mean systolic blood pressure as a preferred indicator of risk exposure. The countryprofiles display age-specific mean systolic blood pressure data as well as prevalence of hyper-tension where they exist for a country. This is in line with WHO’s preference for a population-based approach to risk factor exposure, moving away from a focus on “high risk” categoriesof exposure (WHO, 2002).
Raised blood lipids
The blood lipid reported in most surveys is raised total blood cholesterol. Cholesterol is afat-like substance found in the blood stream, nerve fibres and major body organs. High lev-els of cholesterol are associated with heredity, diabetes mellitus and a diet high in saturat-ed fats. Raised cholesterol is an important cause of artherosclerosis, the accumulation offatty deposits on the walls of the arteries. The result is an increased risk of stroke,ischaemic heart disease and other vascular diseases. As with raised blood pressure, therisks of cholesterol are continuous and extend across almost all levels seen in differentpopulations (Prospective Studies Collaboration, 1995). Ideally, for surveillance purposes,mean levels of total cholesterol in specified age and sex groups are recommended.
From the SuRF report, it can be seen that surveys describe the prevalence of raised lipids(cholesterol) using a variety of different definitions. The most common are total cholesterol:– greater than or equal to 6.5 mmol/l;– greater than or equal to 5.5 mmol/l; and– greater than or equal to 5.2 mmol/l.
Often cholesterol levels are reported in units of mg/dl. In these cases, 240mg/dl corre-sponds to 6.5 mmol/l.
Studies that measure
blood pressure are
preferred to those that
collect self-reported
raised blood pressure
status.

As for the other risk factors, the SuRF report country profiles display the definitions, asavailable, from the survey source. Mean total blood cholesterol by age group and sex issometimes reported by surveys. This is included in the country profiles, where available, in accordance with WHO’s population-based approach to risk exposure and recognized inthe WHO STEPwise approach to Surveillance of NCD risk factors (WHO, 2002).
Diabetes
Diabetes is a group of disorders resulting from insulin deficiency, impaired effectiveness ofinsulin action or both (IDF, 2000). Insulin impairment leads to high levels of glucose inthe blood as the body cannot break down this basic sugar. Diabetes mellitus is a seriouscondition in itself, but is also a risk factor for other conditions including blindness, renalfailure, macro-vascular diseases, such as stroke, and ischaemic heart disease. There arefour different types of diabetes based on aetiology and clinical presentation. These are type1 diabetes, type 2 diabetes, gestational diabetes and other specific types of diabetes. Dataon diabetes prevalence for the SuRF report focuses on type 2 diabetes, which is character-ized by insulin resistance and relative insulin deficiency (IDF, 2000). The onset of thisform of diabetes usually occurs after the age of 40 and is often associated with obesity.
Table 5 Selected examples of definitions used and age groups included in surveys to report prevalence of raisedblood pressure.
Definition
Self-report ever diagnosed
ever diagnosed by a medical practitioner
recent diagnosis of hypertension
on medication for hypertension
Measured blood pressure (mmHg) systolic blood pressure > 140
systolic blood pressure >= 140 and diastolic blood pressure >=90
systolic blood pressure >= 140 and/or diastolic blood pressure >=90
systolic blood pressure >= 140 or diastolic blood pressure >=90
systolic blood pressure >= 140 and/or diastolic blood pressure >=90 or being treated with anti-hypertension medication
systolic blood pressure > 160
systolic blood pressure >= 160 and diastolic blood pressure >=95
systolic blood pressure >= 160 and/or diastolic blood pressure >=95
systolic blood pressure >= 160 or diastolic blood pressure >=95
systolic blood pressure >= 160 and/or diastolic blood pressure >=95 or being treated with anti-hypertension medication
systolic blood pressure >=160 and/or diastolic blood pressure >=100
For surveillance
purposes, mean levels
of systolic blood
pressure in specified
age and sex groups are
recommended.
17

The SuRF report includes data on the prevalence of diabetes which is presented with well-defined detection methods and diagnostic criteria. Detection methods of choice are a fast-ing blood glucose measure and/or an oral glucose tolerance test (using a 75 gram glucoseload). The preferred diagnostic criteria are those of WHO from one of the following threetime periods, 1980, 1985 and 1999 (Table 6). Most good quality studies use the WHO cri-teria that correspond to the period in which the survey was performed.
The cut-off point for fasting blood glucose concentration has been lowered, meaning thatthe number of people considered to be diabetic now is different than in the past, based onthis screening test. For the oral glucose tolerance test (OGTT), the diagnostic blood glucoseconcentration has remained the same. The OGTT is the preferred measure of diabetes inthe population because it also detects impaired glucose tolerance and it provides a consis-tent measure of the prevalence of diabetes in populations over time. However, the OGTTrequires a level of resources which is beyond the capacity of most countries forSurveillance purposes and is not recommended in the WHO STEPwise approach toSurveillance of NCD risk factors.
Exact definitions, as reported by survey sources, have been provided in the country profiledefinitions. Where WHO criteria are used as definitions, this is recorded with the designa-tion “WHO, year”. Many national health surveys collect self-reported information on dia-betes status by using a questionnaire that asks whether or not the participants have beendiagnosed with diabetes by a medical professional. While measured, population-level dataare more accurate, self-reported information does provide base line data where none wouldotherwise be collected.
18
Diagnostic criteriafor diabetes mellituscompared
Glucose concentration mmol/litre (mg/dl)
W H O L E B L O O D P L A S M A
venous capillary venous capillary
Fasting value
1980 >=7.0 >=7.0 >=8.0 –
1985 >= 6.7 (>=120) >= 6.7 (>=120) >=7.8 (>=140) >=7.8 (>=140)
1999 >=6.1 (>=110) >=6.1 (>=110) >=7.0 (>=126) >=7.0 (>=126)
OGTT: 2 hours post glucose load of 75 grams
1980 >=10.0 >=11.0 >=11.0 –
1985 >=10.0 (>=180) >=11.1 (>=200) >=11.1 (>=200) >=12.2 (>=200)
1999 >=10.0 (>=180) >=11.1 (>=200) >=11.1 (>=200) >=12.2 (>=200)
Table 6 Diagnostic values for the oral glucose tolerance test for diabetes mellitus: WHO definitions for 1980, 1985 and 1999 compared.

Data sourcesConsiderable time and effort has gone into deciding the type of information most useful forsurveillance of NCD risk factors. The collection is limited to data that is strictly relevant toNCD outcomes; i.e. mortality and morbidity from NCDs. As previously mentioned, the riskfactors chosen are those that:– make the greatest contribution to mortality and morbidity from chronic disease;– can be changed through primary intervention; and– can be measured easily in populations.
The NCD InfoBase includes all NCD risk factor data, regardless of sampling frame and rep-resentativeness, but allows users to select the survey and data that suit their purposes. TheSuRF report focuses on most recent, most representative surveys for WHO Member States.
Reporting data without any information on source and survey methods limits its usefulnessfor policy decisions or further research. Information about measurement methods, defini-tions, and age groups is needed to determine if data are comparable to that of other sur-veys (both within and between countries) or representative of their respective populations.For these reasons, this report strives to present the data collection for each Member Statewith:– source population information;– risk factor definitions;– age group(s);– sex; and – some measure of the uncertainty of the estimate (i.e. confidence interval,
standard deviation).
Often this information is missing when data is presented in journal articles. In these cases,additional steps were taken to complete the information by following up with study authorsor those responsible for the study. These collaborators are acknowledged in the CD-ROMattachment of this report and on the country profiles displaying the data that they provided.
Country-level sources
The availability of risk factor data varies from country to country. For the NCD InfoBase,data have been obtained primarily from published sources. For some countries, availabledata are restricted to small, ad hoc surveys published in academic journals. WHO Regionsthat contain many developed countries have a wider variety of survey instruments availableto them. Examples of data sources for WHO regions are illustrated below.
European Region
Countries in the WHO European Region (EURO) have access to a number of health surveysand data collection resources. In 1997, the European Commission established a HealthMonitoring Programme (HMP) which has now been superseded by a New Public HealthProgramme sponsored by the European Parliament and Council. This programme will startin January 2003 and run until 2006. The European Health Monitoring Project and theEuropean Health Interview Surveys are two current projects of the HMP. There are also avariety of other instruments available that capture some NCD risk factor information includ-ing the Eurobarometer and the European Community household panel.
19
Reporting data without
any information on
source and survey
methods limits its
usefulness...

The Countrywide Integrated Noncommunicable Diseases Intervention Programme (CINDI)also collects risk factor information related to evaluation of country programmes. TheCINDI surveys have been implemented in 27 European countries. In addition, many EURcountries have national health surveys run by their own Ministries of Health. To date, EURrisk factor data have not been harmonized for use in country comparisons.
Region of the Americas
The WHO Region for the Americas (AMR), in contrast to EUR, has many national healthsurvey instruments but no co-operating programmes to try to harmonize data collections.However, the Conjuntos de Accionnes para la Reduccion Multifactorial de EnfermadadesNo transmisibles (CARMEN) network seeks to adopt standard data collection for non-com-municable disease risk factors.
Several long-term national efforts exist including the national health surveys from theInstituto Nacional De Salud Publica of Mexico, National Health and Nutrition ExaminationSurveys run by the Centers for Disease Control in the USA and the Canadian NationalPopulation Health Survey from Statistics Canada. Other countries rely on academicresearch studies to provide base-line data on NCD risk factors.
South-East Asia Region and Western Pacific Region
The South-East Asian Region (SEAR) and the Western Pacific Region (WPR) both containsome countries that routinely collect NCD risk factor data with national survey instruments.Other countries in these regions rely on research studies done by cardiovascular researchinstitutes/ foundations or universities. Both Regional Offices have set up networks to sup-port surveillance and interventions to prevent NCDs and their risk factors. For the WPR,the network is known as Mobilization of Allies in Noncommunicable Disease Action(MOANA). For SEAR, the network name is still under consideration.
Eastern Mediterranean Region
The countries in the Eastern Mediterranean Region (EMR) have some NCD risk factor infor-mation collected by Ministries of Health. Other studies are specific to institutes and aca-demic departments that focus on cardiovascular diseases (i.e. Tehran Lipid and GlucoseStudy from Tehran, Iran and the Dar Al Fatwa Community Household Survey of Beirut,Lebanon). The Eastern Mediterranean Approach to Non-Communicable Diseases network(EMAN) is working towards standard collection of NCD risk factor data.
African Region
The African Region (AFR) has the least number of national health surveys that report NCDrisk factors with only a few examples of national collection efforts (South Africa, Tanzania,Nigeria). Others have national-level surveys done by researchers from outside of the country(Mauritius). Several national statistical agencies collect health-related information, mainlyon number of providers, maternal and child health status and reportable communicablediseases. Preferential collection of such indicators reflect the health priorities of thesecountries. However, as the World Health Report 2002 warns, rising levels of NCD morbidityand mortality will occur in the near future in these countries, due to increasing levels oftobacco use, raised blood pressure and raised cholesterol levels (WHO, 2002). The AfricaNoncommunicable Diseases Intervention network (NANDI) is working to spread the messagethat NCD risk factors are a rising problem in the region.
20

21
Many of the problems
related to validity
of data can be solved
by agreeing to
standardized survey
instruments
Where countries have large, nationally representative surveys, the SuRF country profilesdisplay their weighted prevalence estimates along with the unweighted sample sizes usedin the survey. This display provides the level of information needed by policy makers to usethe data effectively. If the sampling frame is representative of the national population andis without systematic bias, the weighted estimates are considered to be the best risk factorprevalence estimates for that country.
Additional survey instruments
Data for a range of countries are provided by established networks, institutions or commer-cial companies that focus on collecting health information. One such data source is thepublished collections of the WHO Multinational Monitoring of Trends and Determinants in Cardiovascular Disease, otherwise known as the WHO MONICA project. The MONICAProject’s objective was to measure the trends and determinants in cardiovascular diseasemortality and morbidity in selected, well-defined populations and to relate these trends tochanges in known risk factors, daily living habits, health care, or major socio-economic fea-tures measured at the same time in different countries (Tolonen et al., 2002). Standardmethods for collecting risk factor data were developed and used by the 32 individual col-laborating centres that participated in the project (Tunstall-Pedoe, 1988). An emphasiswas placed on training interviewers to use the standard methodology (Tolonen et al.,2002). Published data are available, mainly for developed countries, by 10 year age andsex groups starting at age 25 and ending at age 64. The risk factors measured were tobac-co use (smoking), (measured) blood pressure, (measured) blood cholesterol, and obesity(measured height and weight).
Macro International Inc. provides survey and market research information to clients in busi-ness and government. They run demographic and health surveys for Ministries of Health inmany low and middle income countries. The surveys generally focus on the health of womenof child bearing age and children only and so have been of limited use for this report. Somesurveys collect data on tobacco use prevalence as well as measured height and weight (inwomen of reproductive age). Where relevant, this data is included in the NCD InfoBase.
Gaps and deficiencies in data
Valid, reliable and comparable data are all needed for research and health monitoring. At thepopulation-level, there is more concern with measurement accuracy (validity) rather thanreliability (i.e. how good the measure is in relation to the “true” population measure). Ifthe measurement and sampling is without systematic bias and is of adequate size, thereshould be an average estimate that approximates the true population estimate with a knownlevel of confidence. Appropriate health policy decisions can be made on the basis of thisknown level of confidence for a prevalence estimate.
Many of the problems related to validity of data can be solved by agreeing to standardizedsurvey instruments, including standard age categories. Many European countries are nowmoving towards a standard data collection format with the European Health InterviewSurvey (EUROHIS; Vermeire et al., 2001).
However, valid data need not be comparable data. The major limitation of the data present-ed in SuRF Report 1 is that it is not comparable between surveys. This is unquestionablytrue of survey data from different countries. Even within a country, when trend data areavailable, the data may not be comparable. Part of the problem is the use of different sur-vey instruments, different measurement methods and different criteria for a clinical out-come (i.e. diabetic or hypertensive). An additional problem occurs with risk factor variables

that change in a consistent way with age. For example, systolic blood pressure increaseswith age in most populations (WHR, 2002). As a result, prevalence values for raised bloodpressure can be over or under-reported, depending on the survey start and end ages.
WHO’s response to addressing the gaps in risk factor data
The need for comparable data is being addressed by WHO with four main survey instru-ments for NCD risk factors. These are the STEPwise approach to NCD risk factorSurveillance (STEPS), the Global Youth Tobacco Survey (GYTS), the Global School HealthSurvey (GSHS), and the World Health Survey (WHS). The World Health Survey risk factormodule and the STEPS survey instrument share a common set of indicators at Step 1(health behaviours) as well as standardized measurement methods for those indicators.Valid data are produced by using validated and standard measurements methods, the bestpossible sampling strategies and common training of field staff.
The use of these survey tools allows for surveillance in a larger number of countries over ashort period of time. Using the same definitions and standard age groups enhances compa-rability.
In summary, the NCD InfoBase collects sources and surveys of varying standards. It workson the premise that all data provide some level of information, provided that the limitationsof the data are understood and taken into account. However, the “best risk factor” selec-tion box in the NCD InfoBase tool has been used for the SuRF report to display preferen-tially the most recent data from those surveys that are nationally representative, with validsampling strategies and specified measurement criteria. Details on the NCD InfoBase toolare presented in the next section.
22
The use of these survey
tools allows for sur-
veillance in a large
number of countries
over a short period
of time. Using the
same definitions
and standard age
groups enhances
comparability.
The WHO Global NCD InfoBaseThe WHO Global NCD InfoBase has, for the first time, assembled in one place, countrylevel risk factor data stratified by age and sex, with complete source and survey informa-tion. The current version of the InfoBase contains over 45,000 data points from more than1,300 sources. The NCD InfoBase contains data for 166 out of 192 WHO Member States.A unique feature is that each record can be linked back to all its survey information,including the primary source. This is important when the collection of such data involvesso many different protocols and definitions.
Identifying country-level data and assessing its validity is the first step in developing betterquality NCD data collections. The second step is producing comparable country estimatesof risk factor prevalence from the country-level data held in the NCD InfoBase.
The NCD InfoBase will become a web-based tool for data users in late 2003. This briefsynopsis of InfoBase features is a preview to the on-line product that will be available tousers. It also describes the process that was involved for the InfoBase team to produce theCD-ROM containing the data for this report.
Structure of the NCD InfoBase
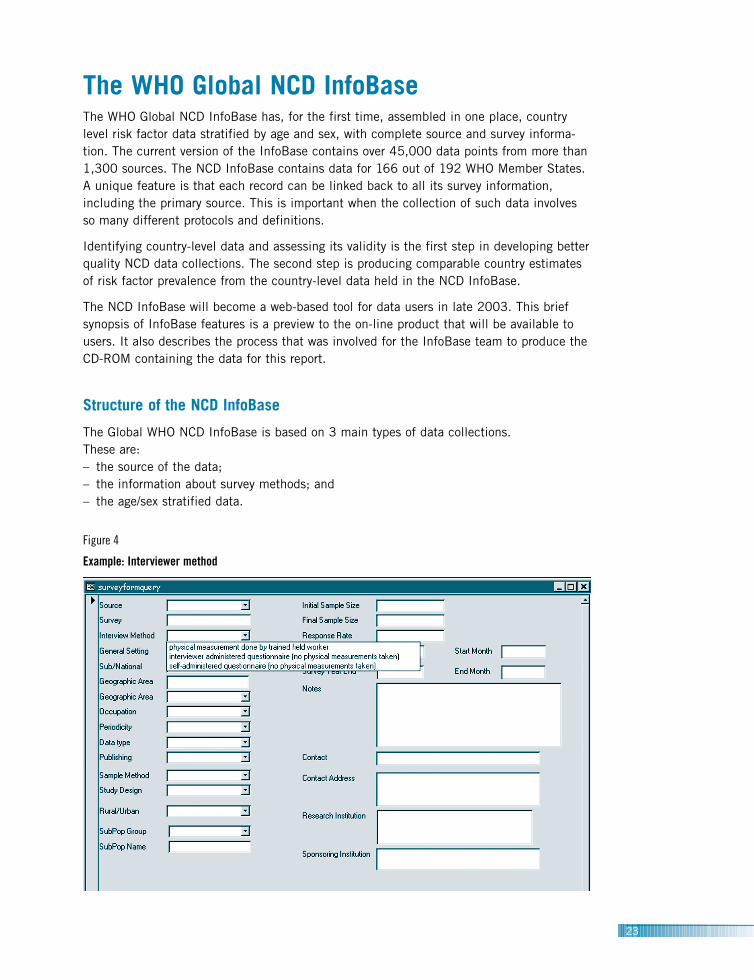
The Global WHO NCD InfoBase is based on 3 main types of data collections. These are:– the source of the data;– the information about survey methods; and – the age/sex stratified data.
23
Figure 4
Example: Interviewer method
Source
The source table displays the complete source of the data by country, including theauthors, dates and place of publication. Each source is given a unique reference numberthat remains with each piece of data collected from that source. Data cannot be enteredinto the InfoBase without an accompanying source.
Survey methods
The second table in the data base is the survey methods table. It contains important epi-demiological information about the data source. This information is entered into the surveyentry form (Figure 4) and shares the same unique reference identifier as the source infor-mation table. The survey entry form records information on:– the representativeness of the sample (national or sub-national);– the sampling frame;– the publication status (peer-reviewed journal, official government report, etc.; – the same information for surveys that include different population groups (ethnic, socio-
economic, education level or other demographic strata); – a contact person for the survey;– the name of the funding source;– the response rates for the survey; and– any additional notes on survey methodology and/or purpose.
Data cannot be entered into the InfoBase without having the above details entered in tothe survey entry form.
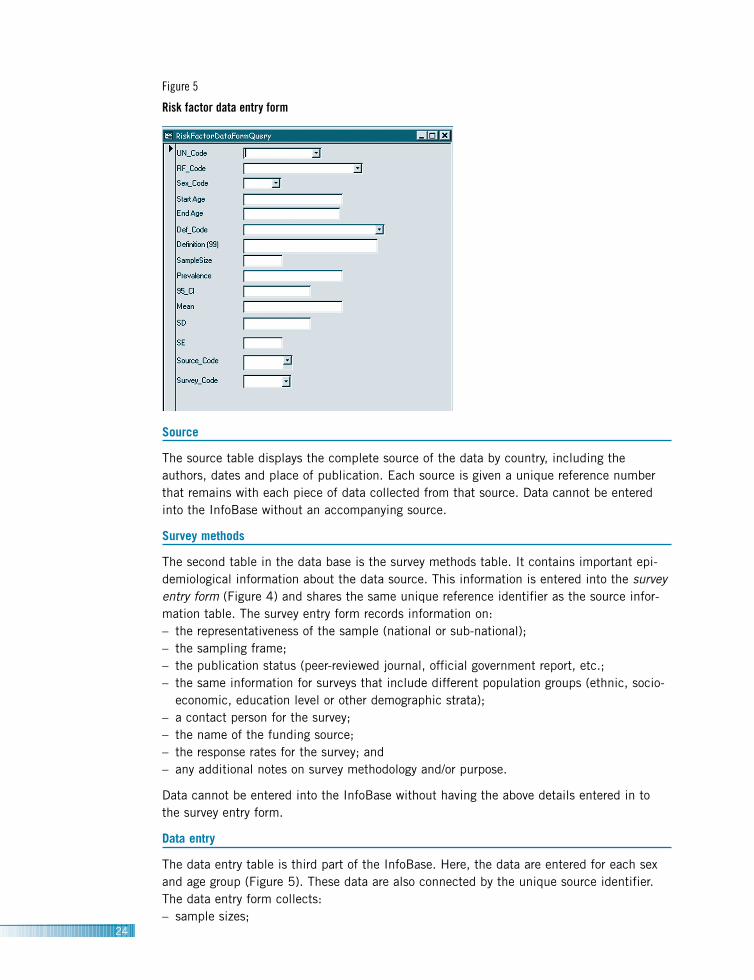
Data entry
The data entry table is third part of the InfoBase. Here, the data are entered for each sexand age group (Figure 5). These data are also connected by the unique source identifier.The data entry form collects:– sample sizes;
24
Figure 5
Risk factor data entry form

– definitions (which also includes a text box for any unique data definitions);– prevalence or mean values; and– confidence intervals or standard deviations (for mean values).
The data entry table for diabetes mellitus includes collection of detection method and criteriafor determining an individual’s diabetes status.
Often small surveys report only limited prevalence data, perhaps for one very broad age group(i.e. 18+ or 18–64), as publication space is limited or the aim of the study is more special-ized than surveillance. Nevertheless, this information can still be useful in surveillance withthe identification and correction of biases, and caveats. Step 2 of the NCD InfoBase projectis to use existing country data to help develop models to harmonize the data and providecomparable estimates in standard age groupings. These surveys, regardless of limitations, canhelp in the harmonization process if they advance our understanding of how risk exposuresare distributed in populations. Alternatively, they may form the basis of future work on riskfactors or trigger acknowledgement of the need for risk factor surveillance in a population.For these cases, authors and contact people were approached for more detailed age-break-downs, where possible, for their surveys and they are included in the NCD InfoBase.
The key feature of the NCD InfoBase is that all metadata are available without theresearcher having to refer to the original source publication. This is important because indi-viduals interested in the NCD risk factor data often lack access to necessary journalsand/or other data sources. Thus, the NCD InfoBase is designed to be a “one stop” resourcefor these data needs.
25
Figure 6
Identifying useful sources
Step 2 of the NCD
InfoBase project is to
use existing country
data to help develop
models to harmonize
the data and provide
comparable estimates
in standard age
groupings.

Selecting data for display
In addition to source, survey and data entry forms, the NCD InfoBase has a provision forselecting specific surveys/studies for display (Figure 6). This feature allows data browsersto view relevant features of the surveys entered for a country and then select records to dis-play and graph. Features of the survey on display include:– title;– start year;– sub-population;– urban/rural designation;– interview response method; and – sample method.
Data features displayed include risk factor name, data definition, sex, age groups and sam-ple size. Information about whether or not the survey information and risk factor data havebeen verified, provided by the “verified” check box, allow the user to have confidence inthe quality assurance practices for the displayed data. A survey’s results can be displayedby checking the “best survey” box or by checking individual “best records” boxes. Thereare also check boxes to display graphs of age-specific rates and/or trend data (where itexists) for a specific survey (Figure 7).
Displaying data in the SuRF report format
Individual country reports can be generated using the SuRF report selection box (Figure 8).This feature allows the selection of WHO region and country to generate automatic reportsfrom the data selected using the “best risk factor survey” box or the “best diabetes survey”box. The reports generated are the same as those that have been set up for this SuRF report.
26
Figure 7
Tobacco use
0
5
10
15
20
25
30
35
40
45
1974 1979 1983 1985 1990 1994 1995 1997 1999 2000
male
female
Perc
ent
Survey years
All metadata are avail-
able without the
researcher having to
refer to the original
source publication.

Using the country profiles on CD-ROM
The CD-ROM contains all of the information included in the written section of this reportas well as risk factor profiles for WHO Member States. It also includes complete referencesand an acknowledgement section for data contributors.
Figure 9 gives an example of the lay-out of a Member State risk factor profile as displayedon the CD-ROM. For each Member State, the report displays official country name, WHOregion, UN population data, including average life expectancy with uncertainty estimatesand the most recent, representative country data available for the risk factors of interest.Risk factor data are displayed with risk factor name and definition used in the survey atthe top and by:– age group;– sample size;– prevalence estimate (or mean value); and – 95% confidence interval (or standard deviation for mean values).
In some cases, the 95% confidence intervals are provided by survey authors for all age-groups. In other cases, they are only provided for the total age group for each sex. Surveyyear, survey population and a reference for each source are provided at the bottom of eachrisk factor data display. The addition of a “notes” section ensures that any additionalimportant information about a survey can be included. For some studies, where additionalinformation was provided by study authors, the reported data cannot be found in the citedsource. In these cases, the notation “additional data from personal communication”
27
Figure 8
Generating reports
Example

28
appears below the source reference.
Sub-national surveys are included with complete information about the populations thatthey represent. For national surveys, the weighted prevalence estimates are reported alongwith the specified population used to create the weights (i.e. 2000 population census).The actual sample sizes of the survey are also reported in these cases. The idea behindthis presentation of data is to ensure that data users have all the information that theyneed to evaluate the validity of the prevalence values.
Future additions
It is becoming increasingly apparent that the risks of chronic conditions are cumulativeexposures over a life span. Often the exposure occurs in childhood and adolescence. Theseexposures need to be documented using the STEPS framework and included in the NCDInfoBase. The inclusion of a major risk factor in youth is well advanced with the GlobalYouth Tobacco Survey (GYTS). The addition of other risk factors is being started with theGlobal School-based Student Health Survey (GSHS), which uses the STEPwise approach toSurveillance of NCDs as its framework.
While NCD risk factor information is needed to predict future trends in NCD burden, acountry-level source of chronic disease prevalence and incidence data is also needed.Much of the data collected for diseases are not population-based, but come from hospitalrecords or registries. Nevertheless, work is currently under way to add the relevant indica-tors for:– stroke;– heart disease;– oral health;– injury; and– respiratory diseases.
The addition of these disease domains will expose the need for population-based disease-specific collections. Such information will serve as a resource for Member States as theystrive to produce their own estimates of country-level burden of disease from availablecountry-level data.
The CD-ROM contains
all of the information
included in the written
section of this report
as well as risk factor
profiles for WHO
Member States.
The use of country
data sources to derive
the estimates is a
transparent process
because the data are
freely accessible in the
NCD InfoBase.
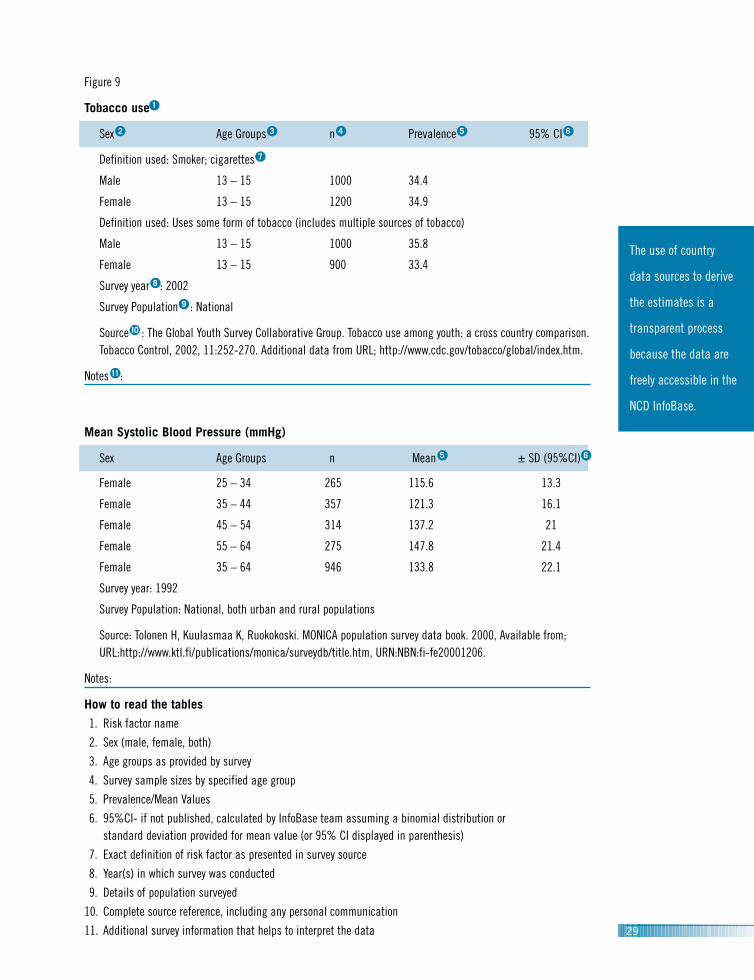
Figure 9
Tobacco use 1
Sex 2 Age Groups 3 n 4 Prevalence 5 95% CI 6
Definition used: Smoker; cigarettes 7
Male 13 – 15 1000 34.4
Female 13 – 15 1200 34.9
Definition used: Uses some form of tobacco (includes multiple sources of tobacco)
Male 13 – 15 1000 35.8
Female 13 – 15 900 33.4
Survey year 8 : 2002
Survey Population 9 : National
Source 10 : The Global Youth Survey Collaborative Group. Tobacco use among youth: a cross country comparison.Tobacco Control, 2002, 11:252-270. Additional data from URL; http://www.cdc.gov/tobacco/global/index.htm.
Notes 11 :
Mean Systolic Blood Pressure (mmHg)
Sex Age Groups n Mean 5 ± SD (95%CI) 6
Female 25 – 34 265 115.6 13.3
Female 35 – 44 357 121.3 16.1
Female 45 – 54 314 137.2 21
Female 55 – 64 275 147.8 21.4
Female 35 – 64 946 133.8 22.1
Survey year: 1992
Survey Population: National, both urban and rural populations
Source: Tolonen H, Kuulasmaa K, Ruokokoski. MONICA population survey data book. 2000, Available from; URL:http://www.ktl.fi/publications/monica/surveydb/title.htm, URN:NBN:fi-fe20001206.
Notes:
How to read the tables
1. Risk factor name
2. Sex (male, female, both)
3. Age groups as provided by survey
4. Survey sample sizes by specified age group
5. Prevalence/Mean Values
6. 95%CI- if not published, calculated by InfoBase team assuming a binomial distribution or standard deviation provided for mean value (or 95% CI displayed in parenthesis)
7. Exact definition of risk factor as presented in survey source
8. Year(s) in which survey was conducted
9. Details of population surveyed
10. Complete source reference, including any personal communication
11. Additional survey information that helps to interpret the data 29

30
Vision for the futureThe WHO Global NCD InfoBase, and the SuRF report that comes from it, represent the firststeps in building better quality NCD risk factor data by displaying the country-level datathat currently exists. The next step is to use this data to develop estimates of nationalprevalence for each risk factor and Member State. Member States with national health sta-tistics reporting systems (that include risk factor information) have already produced theseestimates for their countries. For other countries with sub-national surveys, and sometimesmore than one survey, a data harmonization process can be used.
For the data harmonization process, the age-specific rates obtained from country-level datasources will be used to develop models to relate risk factor levels to age and sex. Thesemodels can then be used to derive the best estimate of risk factor prevalence for eachcountry in standard age groupings. The use of country data sources to derive the estimatesis a transparent process because the data are freely accessible in the NCD InfoBase. Theestimated prevalence values will also be held in the NCD InfoBase, thereby maintainingthe structure of the InfoBase as a “one-stop” source for all data users. This is a majorimprovement over previous WHO estimates, which, in the absence of such a relational database, relied on studies selected by experts which may have excluded much of the availabledata sources and which lacked transparency.
The NCD InfoBase can be adapted to meet the NCD data needs of those in the WHORegional Offices. In regions lacking an NCD data management tool, individual NCDInfoBases that are compatible with the Global NCD InfoBase can be built. These InfoBaseswill improve the capacity of WHO Regional Offices to inform policy and advocate for effec-tive interventions to control the burden of NCDs in their regions. They will also improve thefunctioning of the Global NCD InfoBase by helping to ensure that no regional NCD risk fac-tor data are missing. The NCD InfoBase team is working with data focal points in theRegional Offices to facilitate the development of regional NCD InfoBases where they areneeded.
The collection of NCD risk factor data is continuing in many countries and the InfoBasewill need to reflect this new work as it becomes available. In fact, for those countries thathave embarked on a STEPS survey, a method for direct transfer of aggregate, core risk fac-tor data to the NCD InfoBase has been developed. The development of the NCD InfoBaseis meant to support the process of data collection and to hold the collection in a centralplace. At the same time, the current collections need to be used to transform the data intoa useful, comparative tool for advocacy, policy and research.
In summary, the NCD InfoBase and the resulting SuRF report are continuing projects,requiring on-going maintenance and input. The main difficulty with using existing data col-lections for advocacy, health policy or further research is that the data are not comparable,either between countries or within countries from different time periods. Future work toharmonize the current data to produce country-level estimates of risk factor prevalence willprovide the basis for comparisons of risk factor prevalence levels globally. The use of com-parable estimates of risk factor prevalence will take advocacy for public health and diseaseprevention directly to the policy makers, providing an impetus for early intervention to curbthe rising tide of preventable disease.
The NCD InfoBase
team is working with
data focal points in
the Regional Offices to
facilitate the develop-
ment of regional NCD
InfoBases where they
are needed.

ReferencesBonita R, de Courten M, Dwyer T, Jamrozik K, Winkelmann R. Surveillance of risk factors for noncommunicable dis-eases: The WHO STEPwise approach. Summary. Geneva, World Health Organization, 2001.
Centers for Disease Control. Physical activity and health: a report of the Surgeon General. Atlanta (GA): USDepartment of Health and Human Services, Centers for Disease Control and Prevention, 1996.
Eastern Stroke and Coronary Heart Disease Collaboration Group. Blood pressure, cholesterol and stroke in easternAsia. Lancet 1998, 352:1801-07.
International Diabetes Federation. Diabetes Atlas 2000. Brussels: International Diabetes Federation, 2000.
Law MR, Wald NJ. Risk factor thresholds: their existence under scrutiny. BMJ 2002, 324: 1570–6.
Ness AR, Powles JW. Fruit and vegetables and cardiovascular disease: a review. International Journal ofEpidemiology 1997, 26: 1–13.
Prospective Studies Collaboration. Cholesterol, diastolic blood pressure, and stroke: 13,000 strokes in 45,000 peo-ple in 45 prospective cohorts. Lancet. 1995, 346:1647–53.
Rehm J, Gutjahr E, Gmel G. Alcohol and all-cause mortality: a pooled analysis. Contemporary drug problems 2001,28:337–61.
Rose G. The strategy of preventive medicine. Oxford: Oxford University Press, 1992.
Tolonen H, Kuulasmaa K, Ruokokoski E, for the WHO MONICA Project. MONICA population survey data book.(October 2000). Available from URL:http://www.ktl.fi/publications/monica/surveydb/title.htm, URN:NBN:fi-fe20001206.
Tunstall-Pedoe H for WHO MONICA Project Principal Investigators. The World Health Organization MONICA Project(Monitoring Trends and Determinants in Cardiovascular Disease): a major international collaboration. Journal ofClinical Epidemiology. 1988, 41: 105–14.
United Nations, Population Division. World Population Prospects- the 2002 revision. New York, 2003.
Vermeire C, Tafforeau J, Hupkens C et al. Database on Health Surveys in EU/EFTA/EEA Member States: Methodologyand content. Annual European Public Health, Association’s meeting, 2001.
Waters, A M. Assessment of self-reported height and weight and their use in the determination of body massindex. Canberra: Australian Institute of Health and Welfare,1993.
World Cancer Research Fund and American Institute for Cancer Research. Food, nutrition and the prevention ofcancer: a global perspective. Washington (DC): American Institute for Cancer Research, 1997.
World Health Organization. Tobacco or health: a global status report. Geneva: World Health Organization,1997.
World Health Organization. Global Status Report on Alcohol. Geneva: World Health Organization, 1999.
World Health Organization. Obesity: preventing and managing the global epidemic. Geneva: World HealthOrganization, 2000. WHO Technical Report Series, No. 894.
World Health Organization. The world health report 2002- Reducing risks, promoting healthy life. Geneva: WorldHealth Organization, 2002.
31

32
AppendicesAppendix 1: Acronyms and abbreviations
ACS American Cancer Society
ADA American Diabetes Association
AFRO African Regional Office
AIHW Australian Institute of Health Welfare
BMI body mass index
CAGE questionnaire developed by Dr John Ewingfor detecting alcohol dependence
CARMEN Conjuntos de Accionnes para laReduccion Multifactorial deEnfermadades No transmisibles (Region of the Americas)
CI confidence interval
CINDI Countrywide Integrated NoncommunicableDiseases Intervention Programme(European Region)
CCS Cross Cluster Surveillance
CDC Centers for Disease Control andPrevention (USA)
CHD coronary heart disease
CVD cardiovascular disease
DBP diastolicblood pressure
DIS/DSM-III Diagnostic and statistical manual ofmental health disorders, third edition(DSM-III) American psychiatric Association
EBBA Encuesta breve del bebedor anormal
EFRICARD Estudio factores de riesgo cardiovascularen la Republica Dominicana
EMAN Eastern Mediterranean Approach to Non-Communicable Diseases
EMRO Eastern Mediterranean Regional Office
EURO European Regional Office
EUROHIS European Health Interview Survey
GSHS Global School Health Survey
GYTS Global Youth Tobacco Survey
HMP Health Monitoring Programme
ICD international classification of diseases
IDF International Diabetes Federation
IDI International Diabetes Institute
INCLEN International Clinical EpidemiologyNetwork
kCal Kilo-calories
MET metabolic equivalent
MOANA Mobilization of allies in noncommunicabledisease action
MOH Ministry of Health
MONICA WHO Multinational Monitoring of Trendsand Determinants in CardiovascularDisease project
mg/dl milligrams per deciliter
mmHg millimetres of mercury
mmol/l millimoles per liter
mM milli-molar
NANDI Africa Noncommunicable DiseasesIntervention
NCD noncommunicable disease
NIDDM non-insulin dependent diabetes mellitus
OECD Organization for Economic Cooperationand Development
OGTT oral glucose tolerance test
PAHO/AMRO Pan American HealthOrganization/Regional Office of theAmericas
SBP systolic blood pressure
SD standard deviation
SE standard error
SEARO South-East Asian Regional Office
STEPS Stepwise approach to Surveillance of NCDrisk factors
SuRF surveillance of risk factors
TFI Tobacco Free Initiative
WHO World Health Organization
WHR World Health Report
WHS World Health Survey
WPRO Western Pacific Regional Office

Appendix 2: Glossary
Age-specific rate: A rate for a specified age group. The numerator and denominator refer to the same age group.
Blood pressure: A measure of the force that circulating blood exerts on the walls of the arteries.
Body mass index (BMI): A measure of a person’s weight in relation to their height calculated as weight in kilo-grams divided by height in metres squared (synonym: Quetelet’s index).
Burden of disease: A systematic and comprehensive assessment of the health consequences of diseases andinjuries in a population using a single summary measure of population health for each cause.
Cholesterol: A fat-like substance found in the bloodstream, in various bodily organs and nerve fibres. Most cho-lesterol is made in the liver from a variety of foods but particularly from saturated fats. Cholesterol is a key com-ponent in the development of artherosclerosis, the accumulation of fatty deposits on the inner lining of the arter-ies, and as such is a determinant for increased risk of stroke and heart disease.
Confidence interval: The computed interval with a given probability, i.e., 95%, that the true value of a variablesuch as a mean, proportion or rate is contained within the interval.
Diabetes mellitus: A group of heterogenous disorders with the common elements of hyperglycaemia and glucoseintolerance, resulting from insulin deficiency, impaired effectiveness of insulin action or both.
Diastolic blood pressure: The blood pressure created when the heart fills with blood.
Health behaviour: The combination of knowledge, practices, and attitudes that together contribute to motivatethe actions that we take regarding health. These behaviours may promote good health or if harmful, be a determi-nant of disease.
INCLEN: Acronym for International Clinical Epidemiology Network, consisting of clinical epidemiology units inabout 30 countries, mostly developing countries.
Intervention: Any health action, either promotive, preventive, curative or rehabilitative, where the primary intentis to improve health.
Leisure-time physical activity: Sport and recreational physical activity, including a range of activities conductedspecifically for enjoyment, social, competitive or fitness purposes, and performed during leisure or discretionarytime.
Life Table: A summarizing technique used to describe the pattern of mortality and survival in populations.
Measurement validity: An expression of the degree to which a measurement measures what it purports to measure.
33

Obesity: A measure of how overweight an individual is defined using WHO criteria to be those individuals havinga BMI equal to or greater than 30.
Physical activity: Any bodily movement produced by skeletal muscles that results in energy expenditure.
Physical inactivity: No reported physical activity (in a health survey).
Prevalence: The number of events (disease or other condition), in a given population at a specific time.
Prevalence of risk: The proportion of a population who are exposed to a particular risk.
Prevention: Actions aimed at eradicating, eliminating or minimizing the impact of disease and disability.
Reliability: The degree of stability exhibited when a measurement is repeated under identical conditions.
Risk: A probability of an adverse outcome, or a factor that raises this probability.
Risk Factor: Any attribute, characteristic or exposure of an individual which increase the likelihood of developinga disease or injury.
Sedentary: People who report no physical activity in the context of a health survey. This usually refers to peoplewho report no participation in activities such as walking, moderate or vigorous intensity activity.
Standard deviation: A measure of dispersion or variation. The mean tells where the values for a group are centredand the standard deviation is a summary of how widely dispersed the values are around this center.
Standard error: The standard deviation of an estimate. It is used to calculate confidence intervals for the estimate.
Surveillance: Systematic, ongoing collection, collation, and analysis of data and the timely dissemination ofinformation to those who need to know so that action can be taken.
Survey: An investigation in which information is systematically collected not using experimental method but byusing a questionnaire or medical examination.
Systolic blood pressure: The blood pressure that is created by the heart contracting.
Weighted sample: A sample that is not strictly proportional to the distribution of classes in the total population. A weighted sample has been adjusted to include larger proportions of some other parts of the total population,because those parts accorded greater “weight” would otherwise not have the sufficient numbers in the sample to lead to generalizable conclusions.
34

35
Appendix 3: Six tables for Regional Offices
Quick Reference Check List of Selected Risk Factor Data
African Region
WHO Member State Tobacco Alcohol** Diet Physical Inactivity Obesity* Blood Pressure* Cholesterol* Diabetes*
Algeria ✓ ✓
Angola
Benin ✓
Botswana
Burkina Faso ✓
Burundi ✓
Cameroon ✓ ✓ ✓ ✓ ✓ ✓
Cape Verde
Central African Republic ✓
Chad ✓
Comoros
Congo ✓
Cote d’Ivoire ✓
Democratic Republic of the Congo
Equatorial Guinea
Eritrea
Ethiopia ✓ ✓ ✓ ✓ ✓
Gabon
Gambia ✓ ✓ ✓ ✓ ✓ ✓
Ghana ✓ ✓ ✓ ✓ ✓
Guinea ✓
Guinea-Bissau
Kenya ✓ ✓ ✓ ✓
Lesotho ✓ ✓
Liberia ✓
Madagascar

36
WHO Member State Tobacco Alcohol** Diet Physical Inactivity Obesity* Blood Pressure* Cholesterol* Diabetes*
Malawi ✓ ✓
Mali ✓ ✓ ✓
Mauritania ✓
Mauritius ✓ ✓ ✓ ✓ ✓ ✓ ✓
Mozambique
Namibia
Niger ✓
Nigeria ✓ ✓ ✓ ✓ ✓ ✓
Rwanda
Sao Tome and Principe ✓
Senegal ✓ ✓ ✓
Seychelles ✓ ✓ ✓ ✓ ✓ ✓ ✓
Sierra Leone ✓ ✓ ✓ ✓
South Africa ✓ ✓ ✓ ✓ ✓ ✓ ✓
Swaziland
Togo
Uganda ✓ ✓
United Republic of Tanzania ✓ ✓ ✓ ✓ ✓ ✓
Zambia ✓
Zimbabwe ✓ ✓ ✓ ✓
Note:As at 3 April 2003Empty box correspond to missing (or no available data)
* Prevalence and/or mean value** High Alcohol consumer and/or abstainer

Quick Reference Check List of Selected Risk Factor Data
Eastern Mediterranean Region
WHO Member State Tobacco Alcohol** Diet Physical Inactivity Obesity* Blood Pressure* Cholesterol* Diabetes*
Afghanistan ✓ ✓
Bahrain ✓ ✓ ✓ ✓ ✓ ✓
Cyprus ✓
Djibouti ✓
Egypt ✓ ✓ ✓ ✓ ✓ ✓
Iran (Islamic Republic of) ✓ ✓ ✓ ✓ ✓ ✓
Iraq ✓
Jordan ✓ ✓ ✓ ✓ ✓ ✓
Kuwait ✓ ✓ ✓ ✓ ✓
Lebanon ✓ ✓ ✓ ✓ ✓ ✓ ✓
Libyan Arab Jamahiriya ✓ ✓ ✓
Morocco ✓ ✓ ✓ ✓ ✓
Oman ✓ ✓ ✓ ✓ ✓
Pakistan ✓ ✓ ✓ ✓ ✓ ✓
Qatar ✓
Saudi Arabia ✓ ✓ ✓ ✓ ✓ ✓
Somalia
Sudan ✓ ✓
Syrian Arab Republic ✓
Tunisia ✓ ✓ ✓ ✓ ✓ ✓
United Arab Emirates ✓ ✓ ✓ ✓ ✓ ✓ ✓
Yemen ✓
Note:As at 3 April 2003Empty box correspond to missing (or no available data)
* Prevalence and/or mean value** High Alcohol consumer and/or abstainer
37

38
Quick Reference Check List of Selected Risk Factor Data
European Region
WHO Member State Tobacco Alcohol** Diet Physical Inactivity Obesity* Blood Pressure* Cholesterol* Diabetes*
Albania ✓ ✓ ✓ ✓ ✓
Andorra ✓
Armenia ✓
Austria ✓ ✓ ✓ ✓ ✓ ✓ ✓ ✓
Azerbaijan ✓
Belarus ✓
Belgium ✓ ✓ ✓ ✓ ✓ ✓ ✓ ✓
Bosnia and Herzegovina ✓ ✓ ✓ ✓ ✓
Bulgaria ✓ ✓ ✓ ✓
Croatia ✓ ✓ ✓ ✓ ✓
Czech Republic ✓ ✓ ✓ ✓ ✓
Denmark ✓ ✓ ✓ ✓ ✓ ✓ ✓
Estonia ✓ ✓ ✓ ✓ ✓ ✓ ✓ ✓
Finland ✓ ✓ ✓ ✓ ✓ ✓ ✓
France ✓ ✓ ✓ ✓ ✓ ✓ ✓ ✓
Georgia ✓ ✓ ✓ ✓ ✓ ✓
Germany ✓ ✓ ✓ ✓ ✓ ✓ ✓
Greece ✓ ✓ ✓ ✓ ✓ ✓ ✓
Hungary ✓ ✓ ✓ ✓ ✓ ✓
Iceland ✓ ✓ ✓ ✓ ✓ ✓
Ireland ✓ ✓ ✓ ✓ ✓
Israel ✓ ✓ ✓ ✓ ✓ ✓ ✓ ✓
Italy ✓ ✓ ✓ ✓ ✓ ✓
Kazakhstan ✓
Kyrgyzstan ✓ ✓ ✓ ✓ ✓
Latvia ✓ ✓ ✓ ✓ ✓
Lithuania ✓ ✓ ✓ ✓ ✓ ✓ ✓
Luxembourg
Malta ✓ ✓ ✓ ✓

WHO Member State Tobacco Alcohol** Diet Physical Inactivity Obesity* Blood Pressure* Cholesterol* Diabetes*
Monaco
Netherlands ✓ ✓ ✓ ✓ ✓ ✓ ✓
Norway ✓ ✓ ✓ ✓ ✓ ✓ ✓ ✓
Poland ✓ ✓ ✓ ✓ ✓ ✓
Portugal ✓ ✓ ✓
Republic of Moldova ✓
Romania ✓ ✓ ✓ ✓ ✓
Russian Federation ✓ ✓ ✓ ✓ ✓ ✓ ✓ ✓
San Marino
Serbia and Montenegro ✓ ✓ ✓ ✓
Slovakia ✓
Slovenia ✓
Spain ✓ ✓ ✓ ✓ ✓ ✓ ✓ ✓
Sweden ✓ ✓ ✓ ✓ ✓ ✓ ✓ ✓
Switzerland ✓ ✓ ✓ ✓ ✓ ✓ ✓
Tajikistan
The former Yugoslav Republic of Macedonia
Turkey ✓ ✓ ✓ ✓ ✓ ✓
Turkmenistan ✓
Ukraine ✓
United Kingdom ✓ ✓ ✓ ✓ ✓ ✓ ✓ ✓
Uzbekistan ✓ ✓ ✓ ✓
Note:As at 3 April 2003Empty box correspond to missing (or no available data)
* Prevalence and/or mean value** High Alcohol consumer and/or abstainer
39
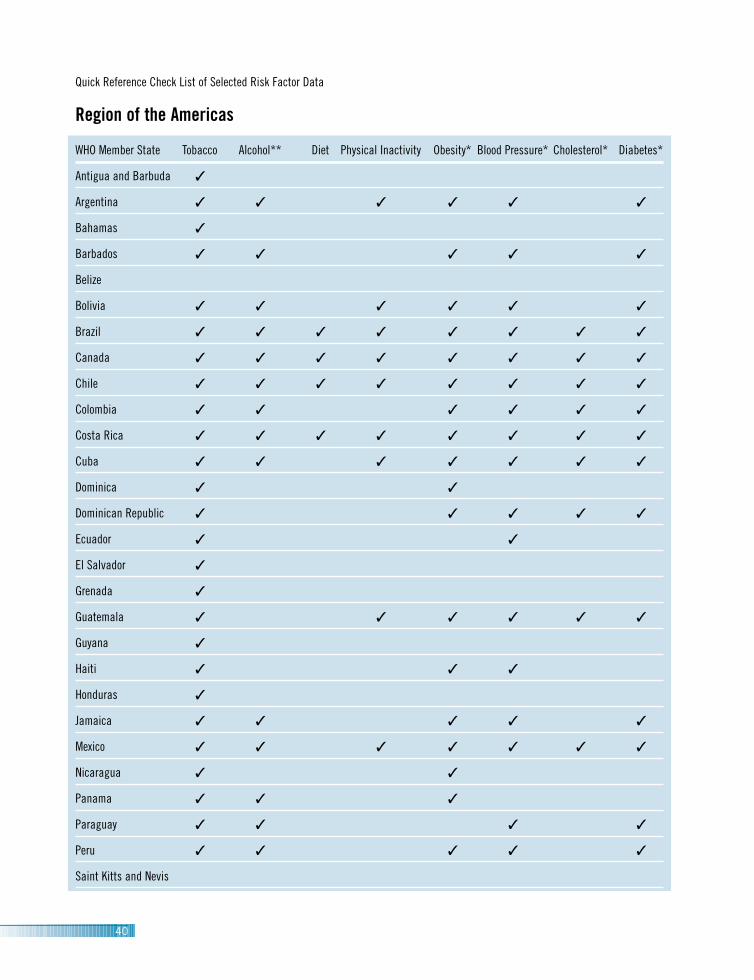
40
Quick Reference Check List of Selected Risk Factor Data
Region of the Americas
WHO Member State Tobacco Alcohol** Diet Physical Inactivity Obesity* Blood Pressure* Cholesterol* Diabetes*
Antigua and Barbuda ✓
Argentina ✓ ✓ ✓ ✓ ✓ ✓
Bahamas ✓
Barbados ✓ ✓ ✓ ✓ ✓
Belize
Bolivia ✓ ✓ ✓ ✓ ✓ ✓
Brazil ✓ ✓ ✓ ✓ ✓ ✓ ✓ ✓
Canada ✓ ✓ ✓ ✓ ✓ ✓ ✓ ✓
Chile ✓ ✓ ✓ ✓ ✓ ✓ ✓ ✓
Colombia ✓ ✓ ✓ ✓ ✓ ✓
Costa Rica ✓ ✓ ✓ ✓ ✓ ✓ ✓ ✓
Cuba ✓ ✓ ✓ ✓ ✓ ✓ ✓
Dominica ✓ ✓
Dominican Republic ✓ ✓ ✓ ✓ ✓
Ecuador ✓ ✓
El Salvador ✓
Grenada ✓
Guatemala ✓ ✓ ✓ ✓ ✓ ✓
Guyana ✓
Haiti ✓ ✓ ✓
Honduras ✓
Jamaica ✓ ✓ ✓ ✓ ✓
Mexico ✓ ✓ ✓ ✓ ✓ ✓ ✓
Nicaragua ✓ ✓
Panama ✓ ✓ ✓
Paraguay ✓ ✓ ✓ ✓
Peru ✓ ✓ ✓ ✓ ✓
Saint Kitts and Nevis

Quick Reference Check List of Selected Risk Factor Data
South-East Asia Region
WHO Member State Tobacco Alcohol** Diet Physical Inactivity Obesity* Blood Pressure* Cholesterol* Diabetes*
Bangladesh ✓ ✓ ✓ ✓ ✓ ✓
Bhutan
Democratic People’s Republic of Korea
Democratic Republic of Timor-Leste†
India ✓ ✓ ✓ ✓ ✓ ✓ ✓ ✓
Indonesia ✓ ✓ ✓ ✓ ✓ ✓ ✓
Maldives ✓
Myanmar ✓ ✓ ✓
Nepal ✓ ✓ ✓ ✓
Sri Lanka ✓ ✓ ✓ ✓
Thailand ✓ ✓ ✓ ✓ ✓ ✓
Note:As at 3 April 2003Empty box correspond to missing (or no available data)† Currently applying for membership with SEARO at the time of publication* Prevalence and/or mean value
** High Alcohol consumer and/or abstainer
Saint Lucia ✓ ✓ ✓ ✓
Saint Vincent and the Grenadines ✓
Suriname ✓
Trinidad and Tobago ✓ ✓ ✓ ✓ ✓ ✓ ✓
United States ✓ ✓ ✓ ✓ ✓ ✓ ✓ ✓
Uruguay ✓ ✓ ✓ ✓ ✓ ✓ ✓ ✓
Venezuela ✓ ✓ ✓ ✓ ✓ ✓ ✓
41

42
Quick Reference Check List of Selected Risk Factor Data
Western Pacific Region
WHO Member State Tobacco Alcohol** Diet Physical Inactivity Obesity* Blood Pressure* Cholesterol* Diabetes*
Australia ✓ ✓ ✓ ✓ ✓ ✓ ✓
Brunei Darussalam
Cambodia ✓ ✓
China ✓ ✓ ✓ ✓ ✓ ✓ ✓ ✓
Cook Islands ✓ ✓ ✓ ✓ ✓
Fiji ✓ ✓ ✓ ✓ ✓ ✓
Japan ✓ ✓ ✓ ✓ ✓ ✓ ✓ ✓
Kiribati ✓ ✓ ✓ ✓ ✓ ✓
Lao People’s Democratic Republic
Malaysia ✓ ✓ ✓ ✓ ✓
Marshall Islands
Micronesia, Federated States of ✓
Mongolia ✓ ✓ ✓ ✓ ✓
Nauru ✓ ✓ ✓ ✓ ✓ ✓ ✓
New Zealand ✓ ✓ ✓ ✓ ✓ ✓ ✓
Niue ✓ ✓
Palau ✓ ✓ ✓ ✓
Papua New Guinea ✓ ✓ ✓ ✓ ✓
Philippines ✓ ✓ ✓ ✓ ✓ ✓ ✓
Republic of Korea ✓ ✓ ✓ ✓ ✓
Samoa ✓ ✓ ✓ ✓ ✓
Singapore ✓ ✓ ✓ ✓ ✓ ✓ ✓ ✓
Solomon Islands ✓ ✓ ✓ ✓
Tokelau ✓ ✓
Tonga ✓
Tuvalu ✓ ✓
Vanuatu ✓ ✓ ✓ ✓ ✓
Viet Nam ✓ ✓ ✓ ✓ ✓

The Surveillance of risk factors report (SuRF 1) brings together country-level noncommuni-
cable disease (NCD) risk factor prevalence data from WHO's Member States for the first
time. The focus of the report is recent, nationally representative data. The focus is on eight
risk factors that relate mainly to cardiovascular disease. They are: tobacco and alcohol
use, patterns of physical inactivity, low fruit/vegetable intake, obesity (as measured by
BMI), blood pressure, cholesterol and diabetes (measured by blood glucose). All of this
information is held in the WHO Global NCD InfoBase, designed as a "one stop" resource
for data needs. The current version of the InfoBase contains data for 166 out of 192 WHO
Member States and over 45,000 data points from more than 1,300 sources.
The format of SuRF 1 consists of a report booklet and CD-ROM attachment. It is the first
step in a series of SuRF reports and presents current country data that are largely non
comparable. The second step will be to produce harmonized prevalence estimates from
the existing country data. SuRF 1 will be followed by an interactive website in 2003.
The InfoBase team is continuing to collect data from countries on these eight risk factors.
Contact us at [email protected] to contribute additional information.
The SuRF Report 1
World Health Organization
Noncommunicable Diseases and Mental Health
World Health Organization
20 Avenue Appia
CH-1211 Geneva 27, Switzerland
ISBN 92 4 158030 5